


Abstract
Seeds of Vitis vinifera L. exhibit a distinct bilateral symmetry, a geometric property widely used in biological systems to assess developmental stability and morphological organization. When properly oriented, seed outlines can be divided into two corresponding halves along their longitudinal axis, enabling quantitative assessment of symmetry. This characteristic offers a framework for the characterization and classification of grapevine cultivars and clones. In this study, we developed an automated computational workflow to quantify bilateral symmetry in grapevine seeds. Seed outlines were first modelled using Elliptic Fourier Analysis (EFA). Geometric symmetry was subsequently evaluated in R using Generalized Procrustes Analysis (GPA), yielding a scale-independent Symmetry Index (SI). The methodology was applied to a collection comprising 62 Vitis vinifera cultivars and three wild non-Vitis vinifera species. The Symmetry Index showed significant negative correlations with both seed area and mean contour curvature. Wild species (Group I) exhibited significantly higher symmetry values than domesticated groups. Among cultivated grapevines, the Muscat lineage (Group IV) displayed the lowest symmetry values and the greatest morphological dispersion. Differences in SI were detected not only among cultivars but also among clonal or regional expressions of the same variety cultivated under distinct geographical conditions. Symmetry analysis provides a robust, non-destructive, and high-resolution tool for the characterization of Vitis germplasm. By integrating geometric morphometrics and automated shape analysis, this approach offers new opportunities for cultivar discrimination, evolutionary studies, and the quantitative assessment of morphological diversity in grapevine seeds.
1. Introduction
The accurate identification, characterization, and discrimination of Vitis vinifera L. cultivars, together with their clonal lineages and localized biotypes, are essential for the conservation of grapevine genetic diversity and the optimization of clonal selection and breeding programs [1,2]. Traditionally, grapevine classification has relied primarily on leaf morphology, which forms the basis of classical ampelography and ampelometry [3,4]. However, vegetative organs exhibit considerable phenotypic plasticity in response to environmental conditions, vineyard management practices, and seasonal variation. In contrast, grapevine seeds (pips) constitute a comparatively stable morphological structure because their development is largely governed by highly conserved genetic pathways. Consequently, seed morphology is less affected by short-term environmental fluctuations than vegetative traits, making it particularly suitable for cultivar characterization [5,6,7,8,9].
The International Organisation of Vine and Wine (OIV) recognizes the taxonomic value of seed morphology through a series of standardized descriptors included in its official descriptor list [10]. These descriptors include seed length (OIV 242), seed weight (OIV 243), and the presence of transverse ridges on the dorsal chalaza (OIV 244). In addition, classical ampelographic studies have employed linear measurements such as seed width, aspect ratio, chalaza position, and beak length to discriminate cultivars and reconstruct grapevine domestication history [11,12,13]. Although these conventional descriptors effectively distinguish species and many cultivars, their discriminatory power decreases when closely related cultivars, clones, or geographically differentiated populations are compared.
Advances in computational morphometrics have considerably improved the quantitative analysis of biological shape. Among the available approaches, Elliptic Fourier Analysis (EFA) has become one of the most powerful methods for describing complex closed contours because it mathematically reconstructs the complete seed outline independently of size, orientation, and starting point [14,15,16,17]. Beyond providing highly accurate shape descriptions and dimensionality reduction for multivariate analyses, EFA also generates mathematical outlines that enable the quantitative investigation of additional geometric properties, including local curvature [5,6,7,8,9] and bilateral symmetry.
Bilateral (mirror) symmetry is a fundamental characteristic of many biological structures and reflects the coordinated regulation of organismal development. In plants, bilateral symmetry has been extensively investigated in vegetative organs, particularly leaves, where deviations from perfect symmetry have been associated with developmental instability and environmental stress [18,19]. Minor departures from symmetry, commonly referred to as fluctuating asymmetry, are widely regarded as indicators of developmental homeostasis, reflecting the capacity of a genotype to buffer its phenotype against genetic perturbations and environmental variation [20]. Despite the potential biological significance of this trait, bilateral symmetry has received comparatively little attention in grapevine seed morphology.
Previous studies have shown that the overall seed morphology of a given V. vinifera cultivar is generally conserved across different geographical origins, as demonstrated for cultivars such as Cabernet Sauvignon, Hebén, Alfrocheiro, and Savagnin Blanc (syn. Traminer) [5,6,7,8,9]. Furthermore, this shape conservation extends beyond individual varieties to pedigree-related groups, where shared morphological patterns are maintained among offspring and lineage lineages, such as in the progeny of Hebén, Savagnin Blanc, or within progenies of the Muscat haplotype. Nevertheless, subtle differences may arise in specific morphological features, particularly in aspect ratio [5], as well as in the relative position of the chalaza or the development of the ventral depressions. These localized shape variations are often too subtle to be fully characterized using conventional morphometric descriptors or standard geometric morphometric analyses.
To address this limitation, we developed an automated symmetry-analysis workflow based on Fourier-reconstructed seed outlines and Generalized Procrustes Analysis (GPA) [21]. Using a dense set of automatically generated landmark coordinates, the method quantifies bilateral symmetry through a scale-independent Symmetry Index (SI), providing a continuous measure of the geometric similarity between the two halves of each seed.
The objectives of this study were to (i) develop and validate an automated computational protocol for the quantitative analysis of bilateral symmetry in grapevine seeds; (ii) evaluate the extent of symmetry variation among cultivars, clonal lineages, and geographically distinct populations of Vitis vinifera; and (iii) determine the relationships between bilateral symmetry and conventional morphometric descriptors, including seed area, aspect ratio, solidity, and contour curvature. By introducing bilateral symmetry as a quantitative morphometric descriptor, this work provides an additional phenotypic dimension for computational ampelometry and contributes to the development of objective, reproducible methods for grapevine germplasm characterization.
2. Materials and Methods
2.1. Plant Material and Seed Sampling Strategy
A total of 110 distinct seed populations, corresponding to 64 Vitis genotypes—including Vitis vinifera L. cultivars and wild relative species (Vitis amurensis Rupr., V. arizonica Engelm. and V. mustangensis Buckley)—were evaluated in this study. To systematically assess both intra-varietal genetic stability and localized phenotypic plasticity, seed samples were harvested across multiple consecutive years and from distinct cultivation environments [5,6,7,8,9,22,23], hereafter referred to as “sites” (encompassing institutional germplasm banks, commercial vineyards, and regional wine estates).
The experimental sites include:
- Institutional germplasm collections: Instituto Madrileño de Investigación y Desarrollo Rural, Agrario y Alimentario (IMIDRA, Spain; sampled across 2020, 2024, and 2025); Instituto Nacional de Investigação Agrária e Veterinária (INIAV, Portugal).
- Commercial vineyards and wine estates in Spain: Abadía Retuerta, Valbusenda, Bodegas Ayuso, Divina Proporción, and Liberalia.
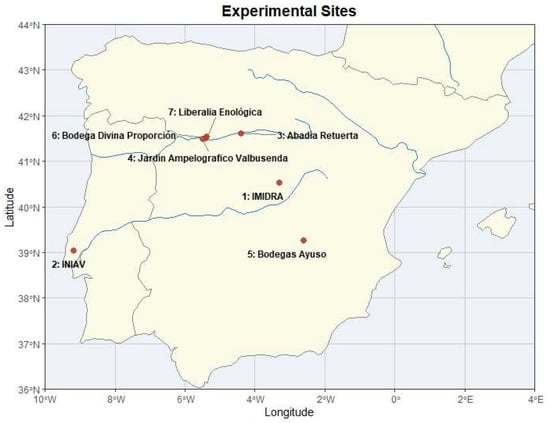
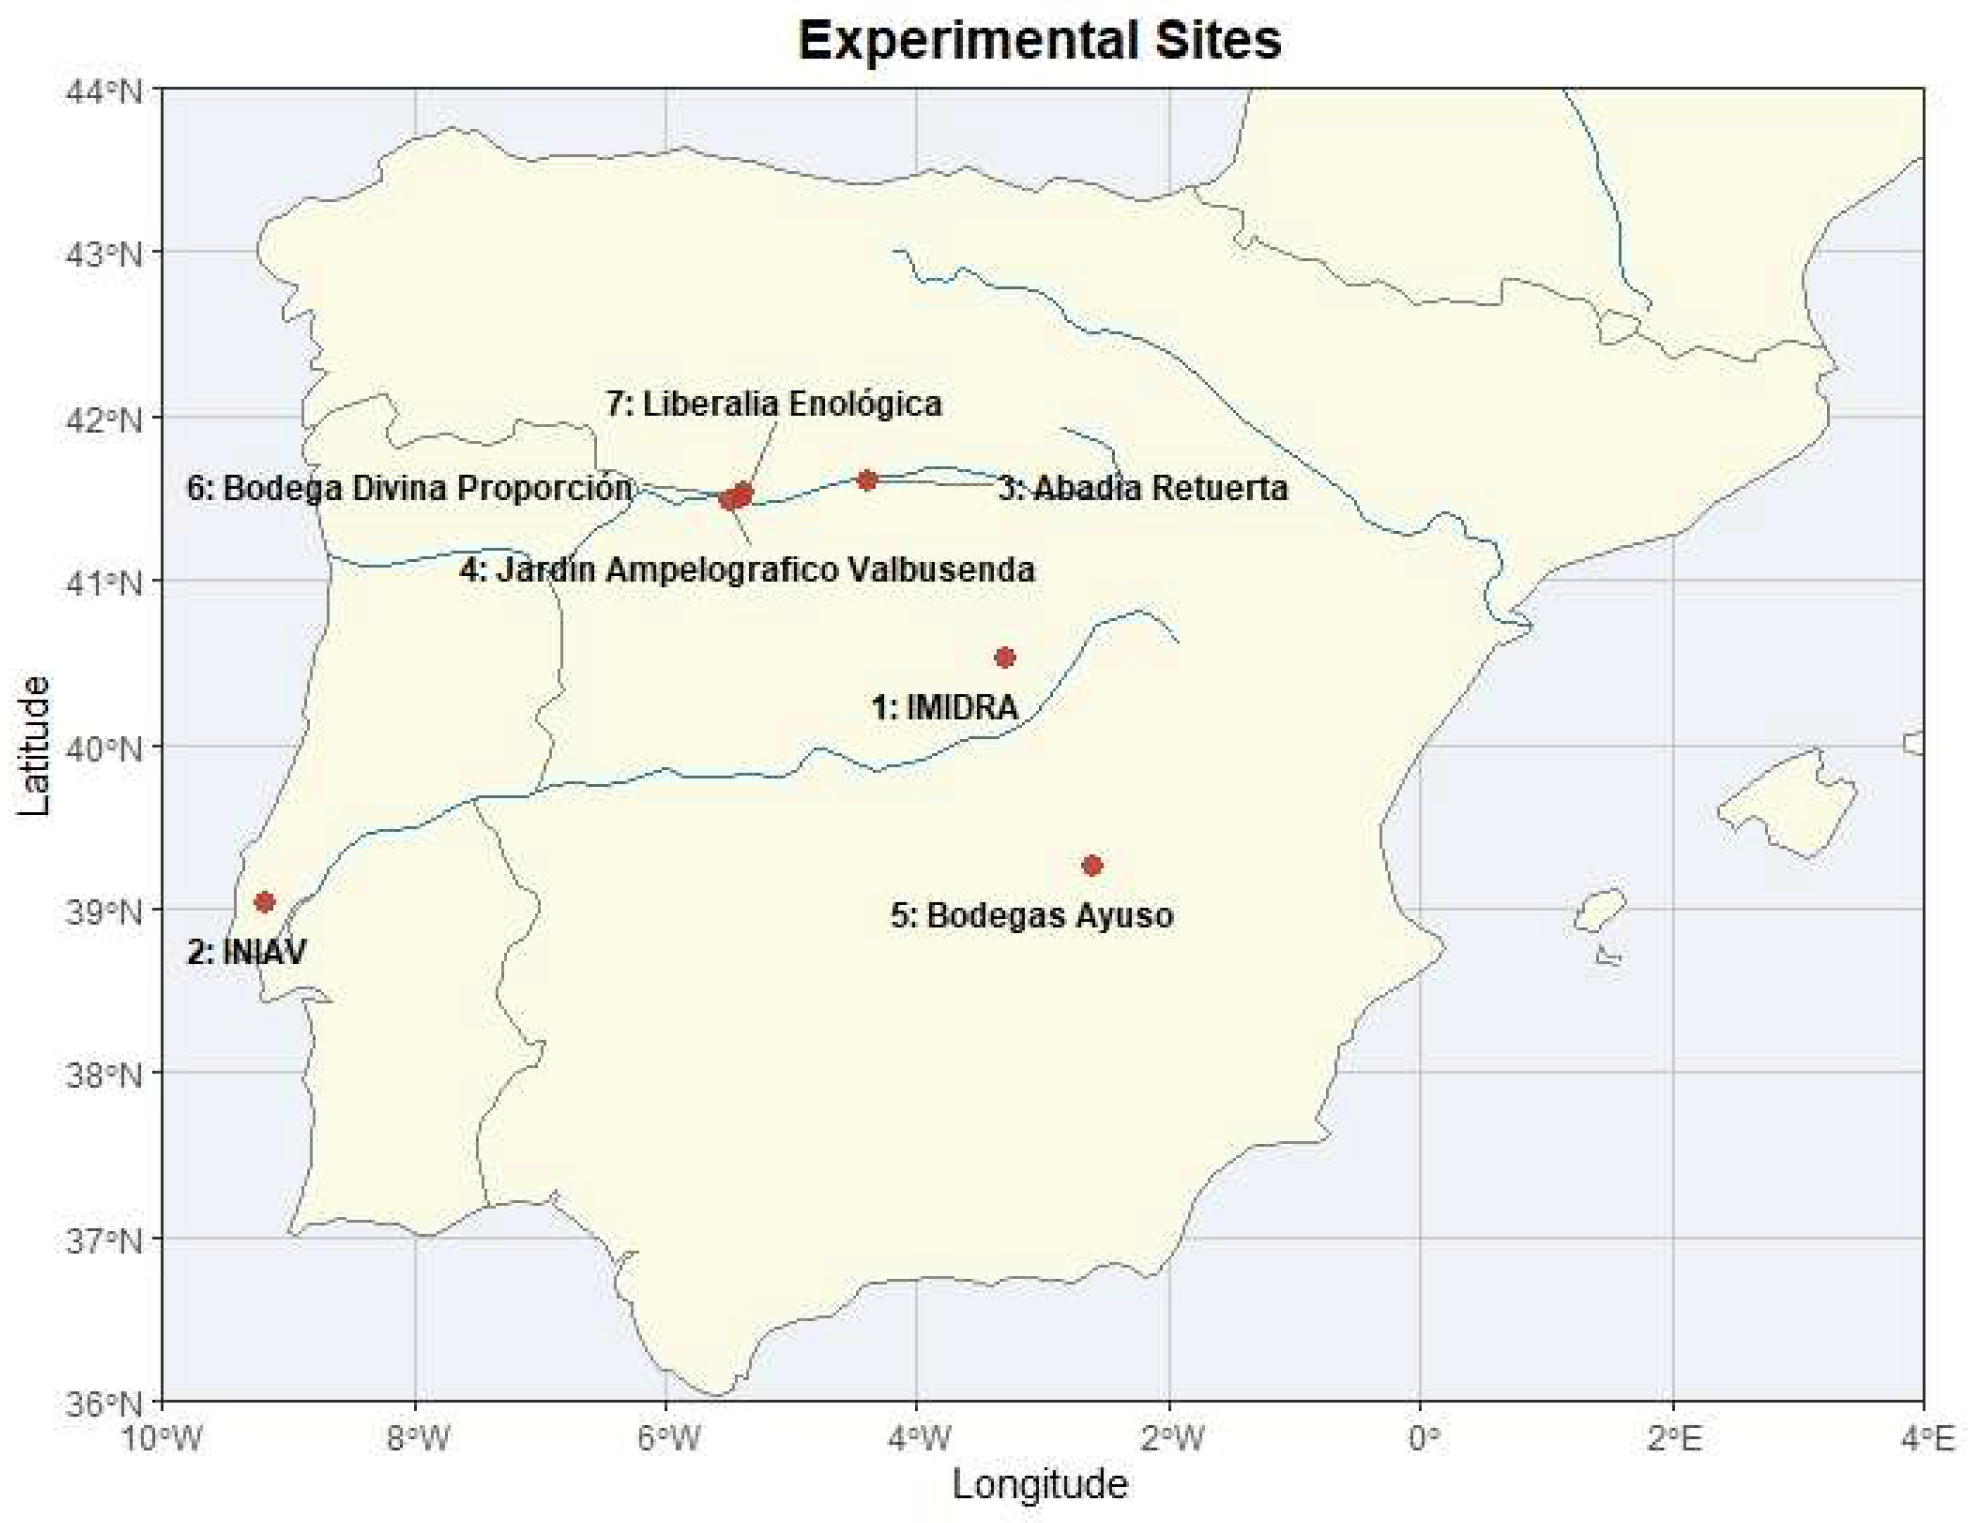
Their precise locations are indicated in Figure 1.
Figure 1.
Schematic representation of the Iberian Peninsula indicating locations of the experimental sites. Red points correspond to DMS coordinates: 1: IMIDRA 40°31′12.0″ N, 3°17′24.0″ W; 2: INIAV 39°02′24.0″ N, 9°10′48.0″ W; 3: Abadía Retuerta 41°36′36.0″ N, 4°24′00.0″ W; 4: Jardín Ampelográfico Valbusenda 41°28′48.0″ N, 5°29′24.0″ W; 5: Bodegas Ayuso 39°15′36.0″ N, 2°35′24.0″ W; 6: Bodega Divina Proporción 41°30′16.6″ N, 5°23′27.8″ W; 7: Liberalia Enológica 41°31′48.0″ N, 5°22′12.0″ W. In blue, three of the main rivers of the Iberian Peninsula. From North to South: Ebro, Duero and Tajo.
2.2. Phylogenetic and Haplotype Classification
To evaluate seed morphological patterns against an established evolutionary framework, all selected varieties were categorized into structural morphotypes. This classification was based on the genetic lineages and Single Nucleotide Polymorphism (SNP) haplotype groups established by Dong et al. [24], which were subsequently adapted for geometric seed outline analysis [6,7,8,9] as well as on consolidated pedigree data [25,26,27,28,29].
The germplasm repository was partitioned into five distinct eco-geographical and genetic groups:
Group I. Non-Vitis vinifera species: Comprising three wild species (serving as the ancestral outgroup for shape comparison) with a total of 60 seeds.
Group II. Traditional Iberian cultivars: Characterized by the landmark variety Hebén and its historical progeny corresponding to Haplotype 5 in [24]; this group includes 33 cultivars across 50 populations, totalling 996 seeds.
Group III. Central European cultivars: Epitomized by Savagnin Blanc and its associated genetic lineages, corresponding to Haplotype 6 in [24]; this group includes 12 cultivars across 23 populations, totalling 460 seeds.
Group IV. Muscat-type cultivars: Typified by Koenigin der Weingaerten and related cultivars, corresponding to Haplotype 3 in [24]; this group encompasses 13 cultivars across 23 populations, totalling 455 seeds.
Group V. Cultivars in the progeny of Garnacha: Consisting of 4 cultivars derived from the progeny of cv. Garnacha, across 9 populations, totalling 180 seeds.
A summary of the cultivars and populations is given in Table 1, and the complete germplasm repository, along with its specific geographical provenance, accession codes, and genetic classifications, is detailed in Supplementary Table S1 (see the Supplementary Materials Section).
Table 1.
A summary of the species, cultivars and populations in the present study. Between brackets, number of seeds in each population 1.
2.3. Seed Images
The seed images used in this work proceed from earlier published work in our laboratory [5,6,7,8,9,22,23] and are available through repositories (see the Supplementary Materials Section).
2.4. Elliptic Fourier Descriptors (EFDs)
The outlines of the seed images are treated as geometric curves. When the parametric components are piecewise linear functions these expansions are
where and represent the coordinates of the centroid of the outline, and each addend corresponds to an ellipse (the n-th harmonic) determined by the coefficients , which are calculated as
The coefficients of EFT equations can be extracted automatically with the software Momocs 1.5.0 [30]. The number N of harmonics determines the degree of precision in the adjustment of the closed curve to the image outline, and it may vary depending on the objectives of the study as well as on the characteristics of the image under analysis. While the low-order coefficients ) define the basic structure of the curves, the higher-order coefficients are responsible for surface details. In addition, b and c coefficients determine the symmetry of the curve. Curves with bilateral symmetry may have .
2.5. Curvature Analysis
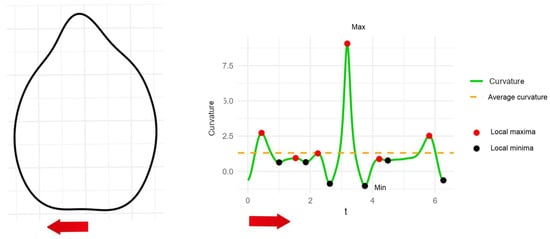
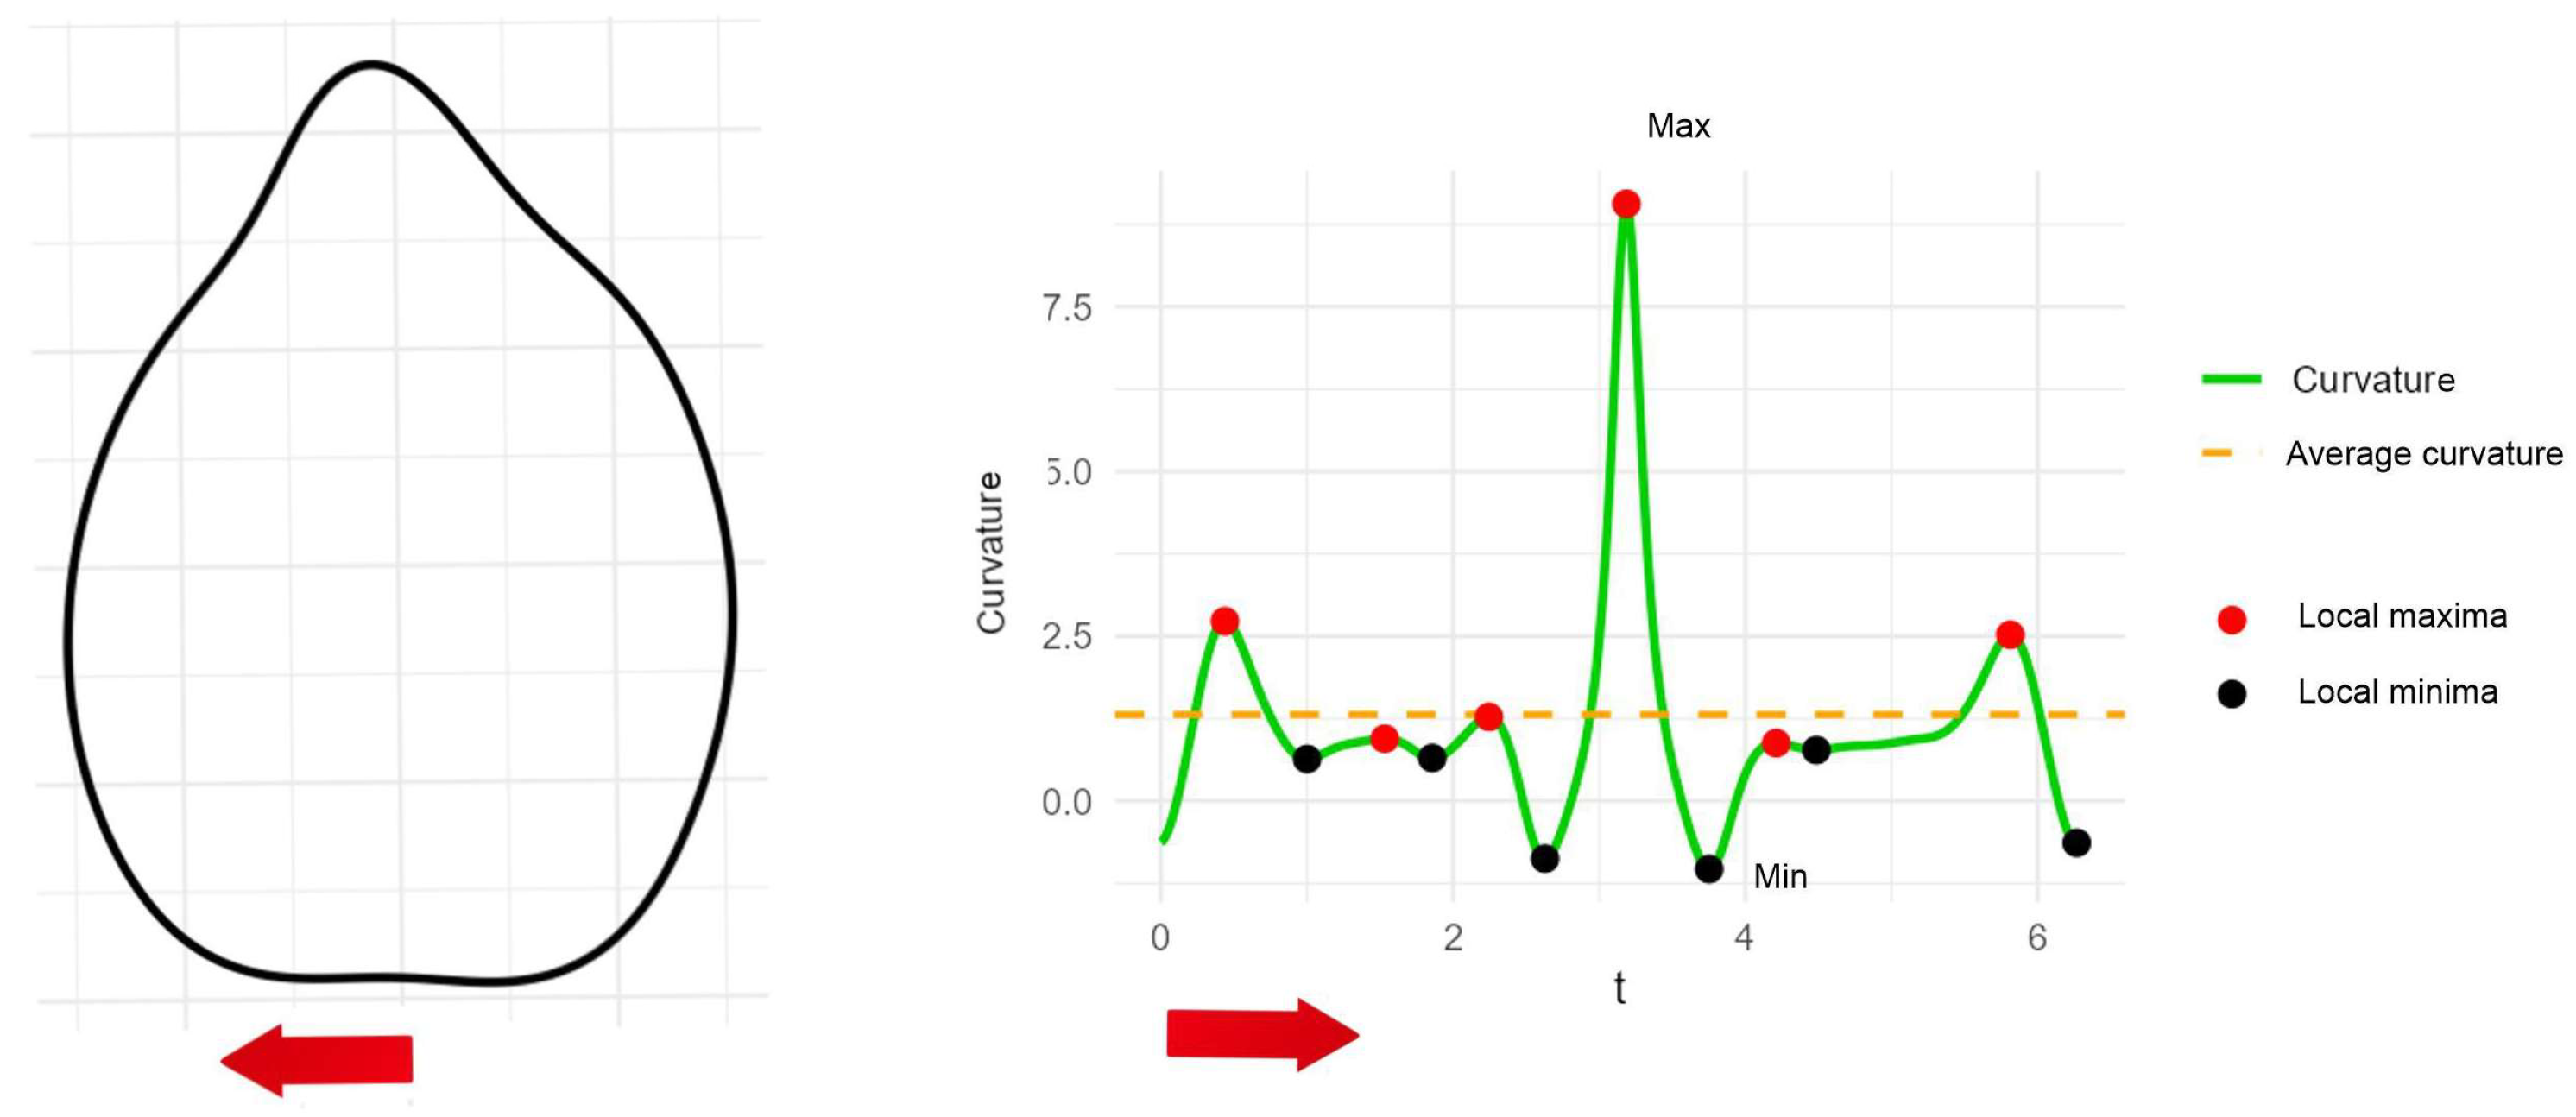
Maximum, minimum and average curvature values along the seed outlines were obtained from the Fourier coefficients of 1061 seeds (Table S1, Sheet2; see Figure 2 for an example). The automated protocol for curvature determination was developed for R [31] based on the code developed for Arabidopsis seedlings [32].
Figure 2.
(Left): The outline of a seed of Vitis mustangensis (Fourier equation with 8 harmonics). (Right): Curvature along with the outline indicating local maxima and minima of curvature. Maximum curvature corresponds to the seed apex. Minimum curvature corresponds to the negative values in the transition zone between the stalk and the chalaza. Average curvature is the value of the integral along the curve. In this example, Max = 9.06; Min = −1.03; Ave= 1.31. Red arrows indicate the origin and direction of curvature measurement.
2.6. Symmetry Analysis
Symmetry was measured in Mathematica by a Procrustes analysis based on a set of points obtained from the parametric approximation given by the elliptic Fourier descriptors.
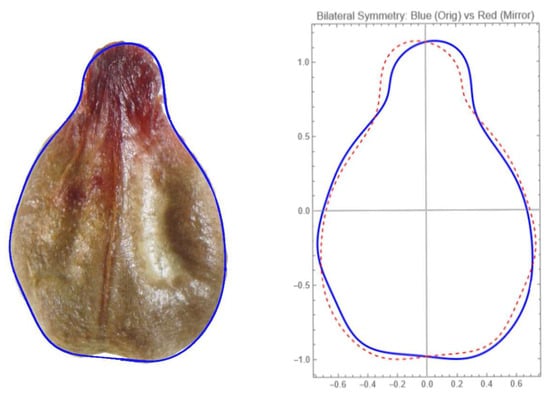
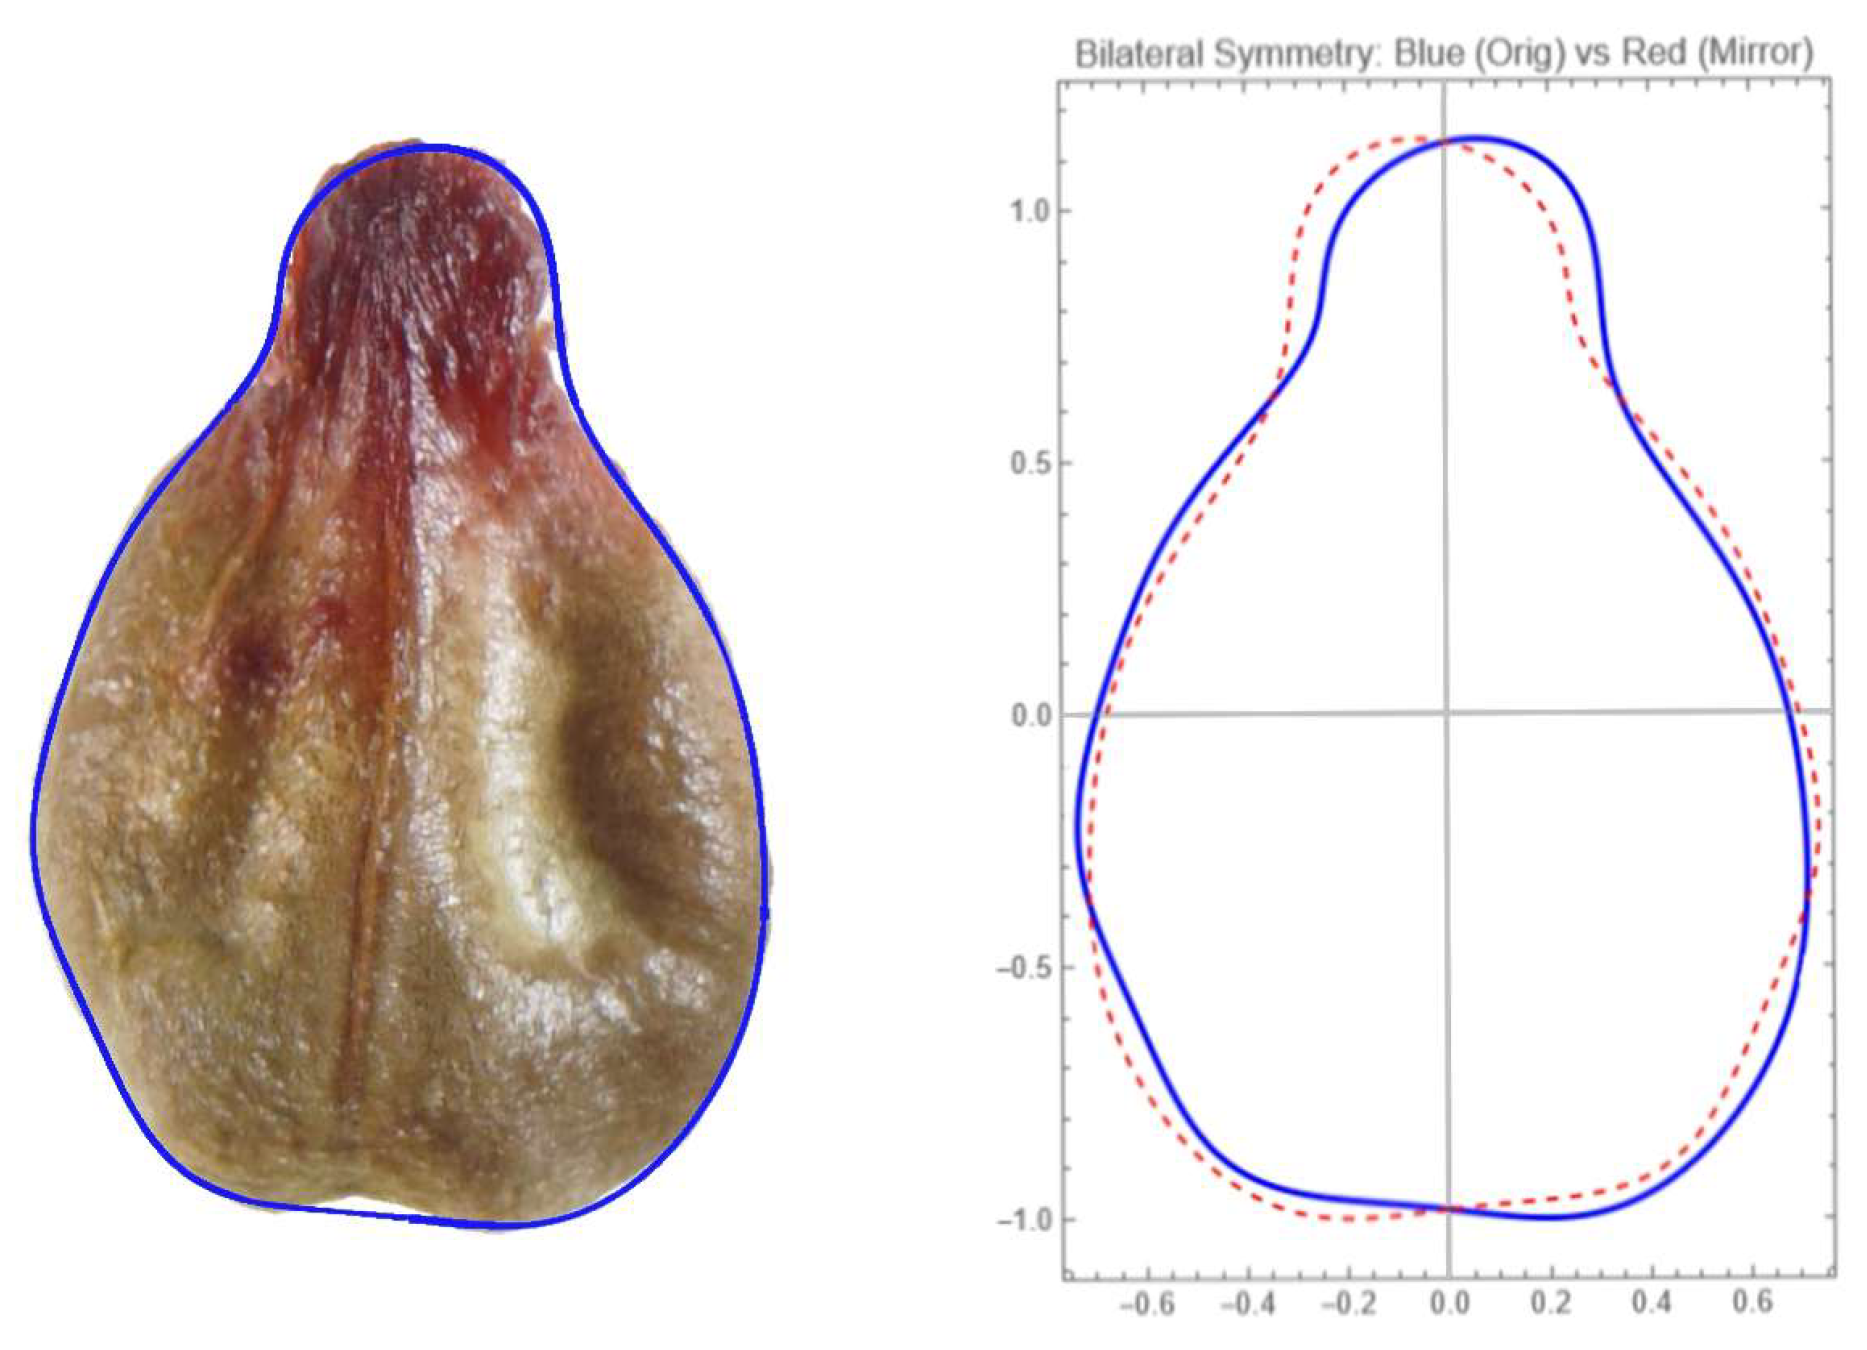
For each specimen, the shape was reconstructed using the first eight harmonics of the Fourier series. A set of n = 500 equidistant points with was sampled along the reconstructed outline. To eliminate the influence of spatial positioning, the centroid was calculated, and the translation that carries to the origin was applied: , . A mirrored version of the shape was then generated by reflecting the centered points across the y-axis, i.e., , . A graphic example of the application of the above procedure is given in Figure 3.
Figure 3.
(Left): A seed of Alphonse Lavallée with the corresponding Fourier outline superimposed in blue. (Right): Outline corresponding to the EFT representation of the seed with 8 harmonics (blue) and mirror image (red).
Since reflection inverts the geometric orientation (clockwise vs. counterclockwise), the order was inverted, obtaining the sequence with , . Next, the distances between the ordered set of points and the sets , are calculated by means of
where denotes the Euclidean norm. Finally, the Root Mean Square Deviation (RMSD)
is obtained, and the Symmetry Index is established as
where W stands for the width of the figure. An SI value of 1.0 indicates perfect bilateral symmetry, while lower values represent increasing degrees of morphological asymmetry. The Mathematica code was made to develop the method, with an extension for the automated application in R (see Supplementary Materials). The assistance of Gemini (Google) for the elaboration of R code was used in the calculation of the Symmetry Index (SI) from Fourier coefficients (see the Supplementary Materials Section).
2.7. Statistical Analysis
To analyse the multidimensional relationships between the Symmetry Index (SI) and traditional morphometric descriptors, a Principal Component Analysis (PCA) was performed on a representative subset of 21 genotypes, comprising the three wild Vitis species and 18 selected cultivars (representing 54 distinct populations). This multivariate analysis was executed within the R statistical environment, following the geometric morphometric frameworks described by Claude [31]. The corresponding dataset—detailed in Supplementary Table S1 (Sheet PCA)—comprises 1060 individual seeds and includes seven scalar phenotypic measurements (area, aspect ratio, solidity, maximum curvature, minimum curvature, average curvature, and SI), alongside the elliptic Fourier coefficients corresponding to the first 8 harmonics. The SI and curvature profiles were computed directly from the extracted Fourier coefficients using custom-developed R scripts.
Broad-scale evaluations of the SI were conducted across the entire germplasm collection, totalling 2120 seeds (Supplementary Table S1, Fourier Coefs). Prior to hypothesis testing, data distributions were evaluated for normality. Because the morphological measurements exhibited significant deviations from a Gaussian distribution, non-parametric analytical workflows were systematically applied.
Global differences in the Symmetry Index among genetic groups, cultivation sites, and specific cultivars were evaluated using the Kruskal–Wallis rank-sum test. Where global significance was detected, downstream intra-varietal and inter-group pairwise comparisons were conducted using post hoc Mann–Whitney U tests (equivalent to Wilcoxon rank-sum tests). To strictly control the family-wise error rate (FWER) and prevent Type I error inflation due to multiple simultaneous comparisons, all post hoc values were adjusted using the Holm–Bonferroni sequential step-down procedure.
3. Results
3.1. Relation of Symmetry Index to Fourier Coefficients and Shape Descriptors
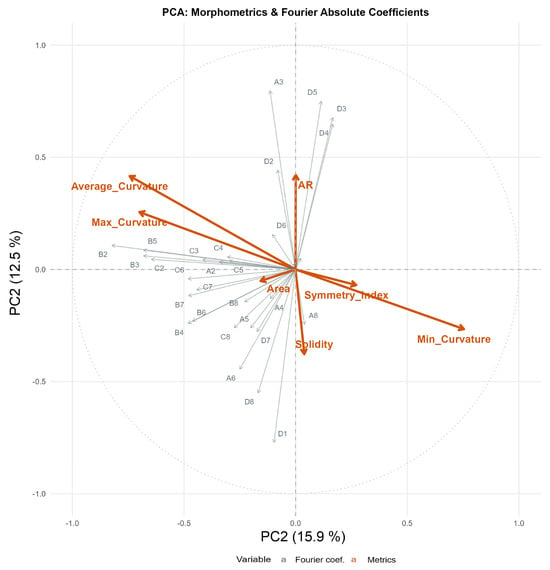
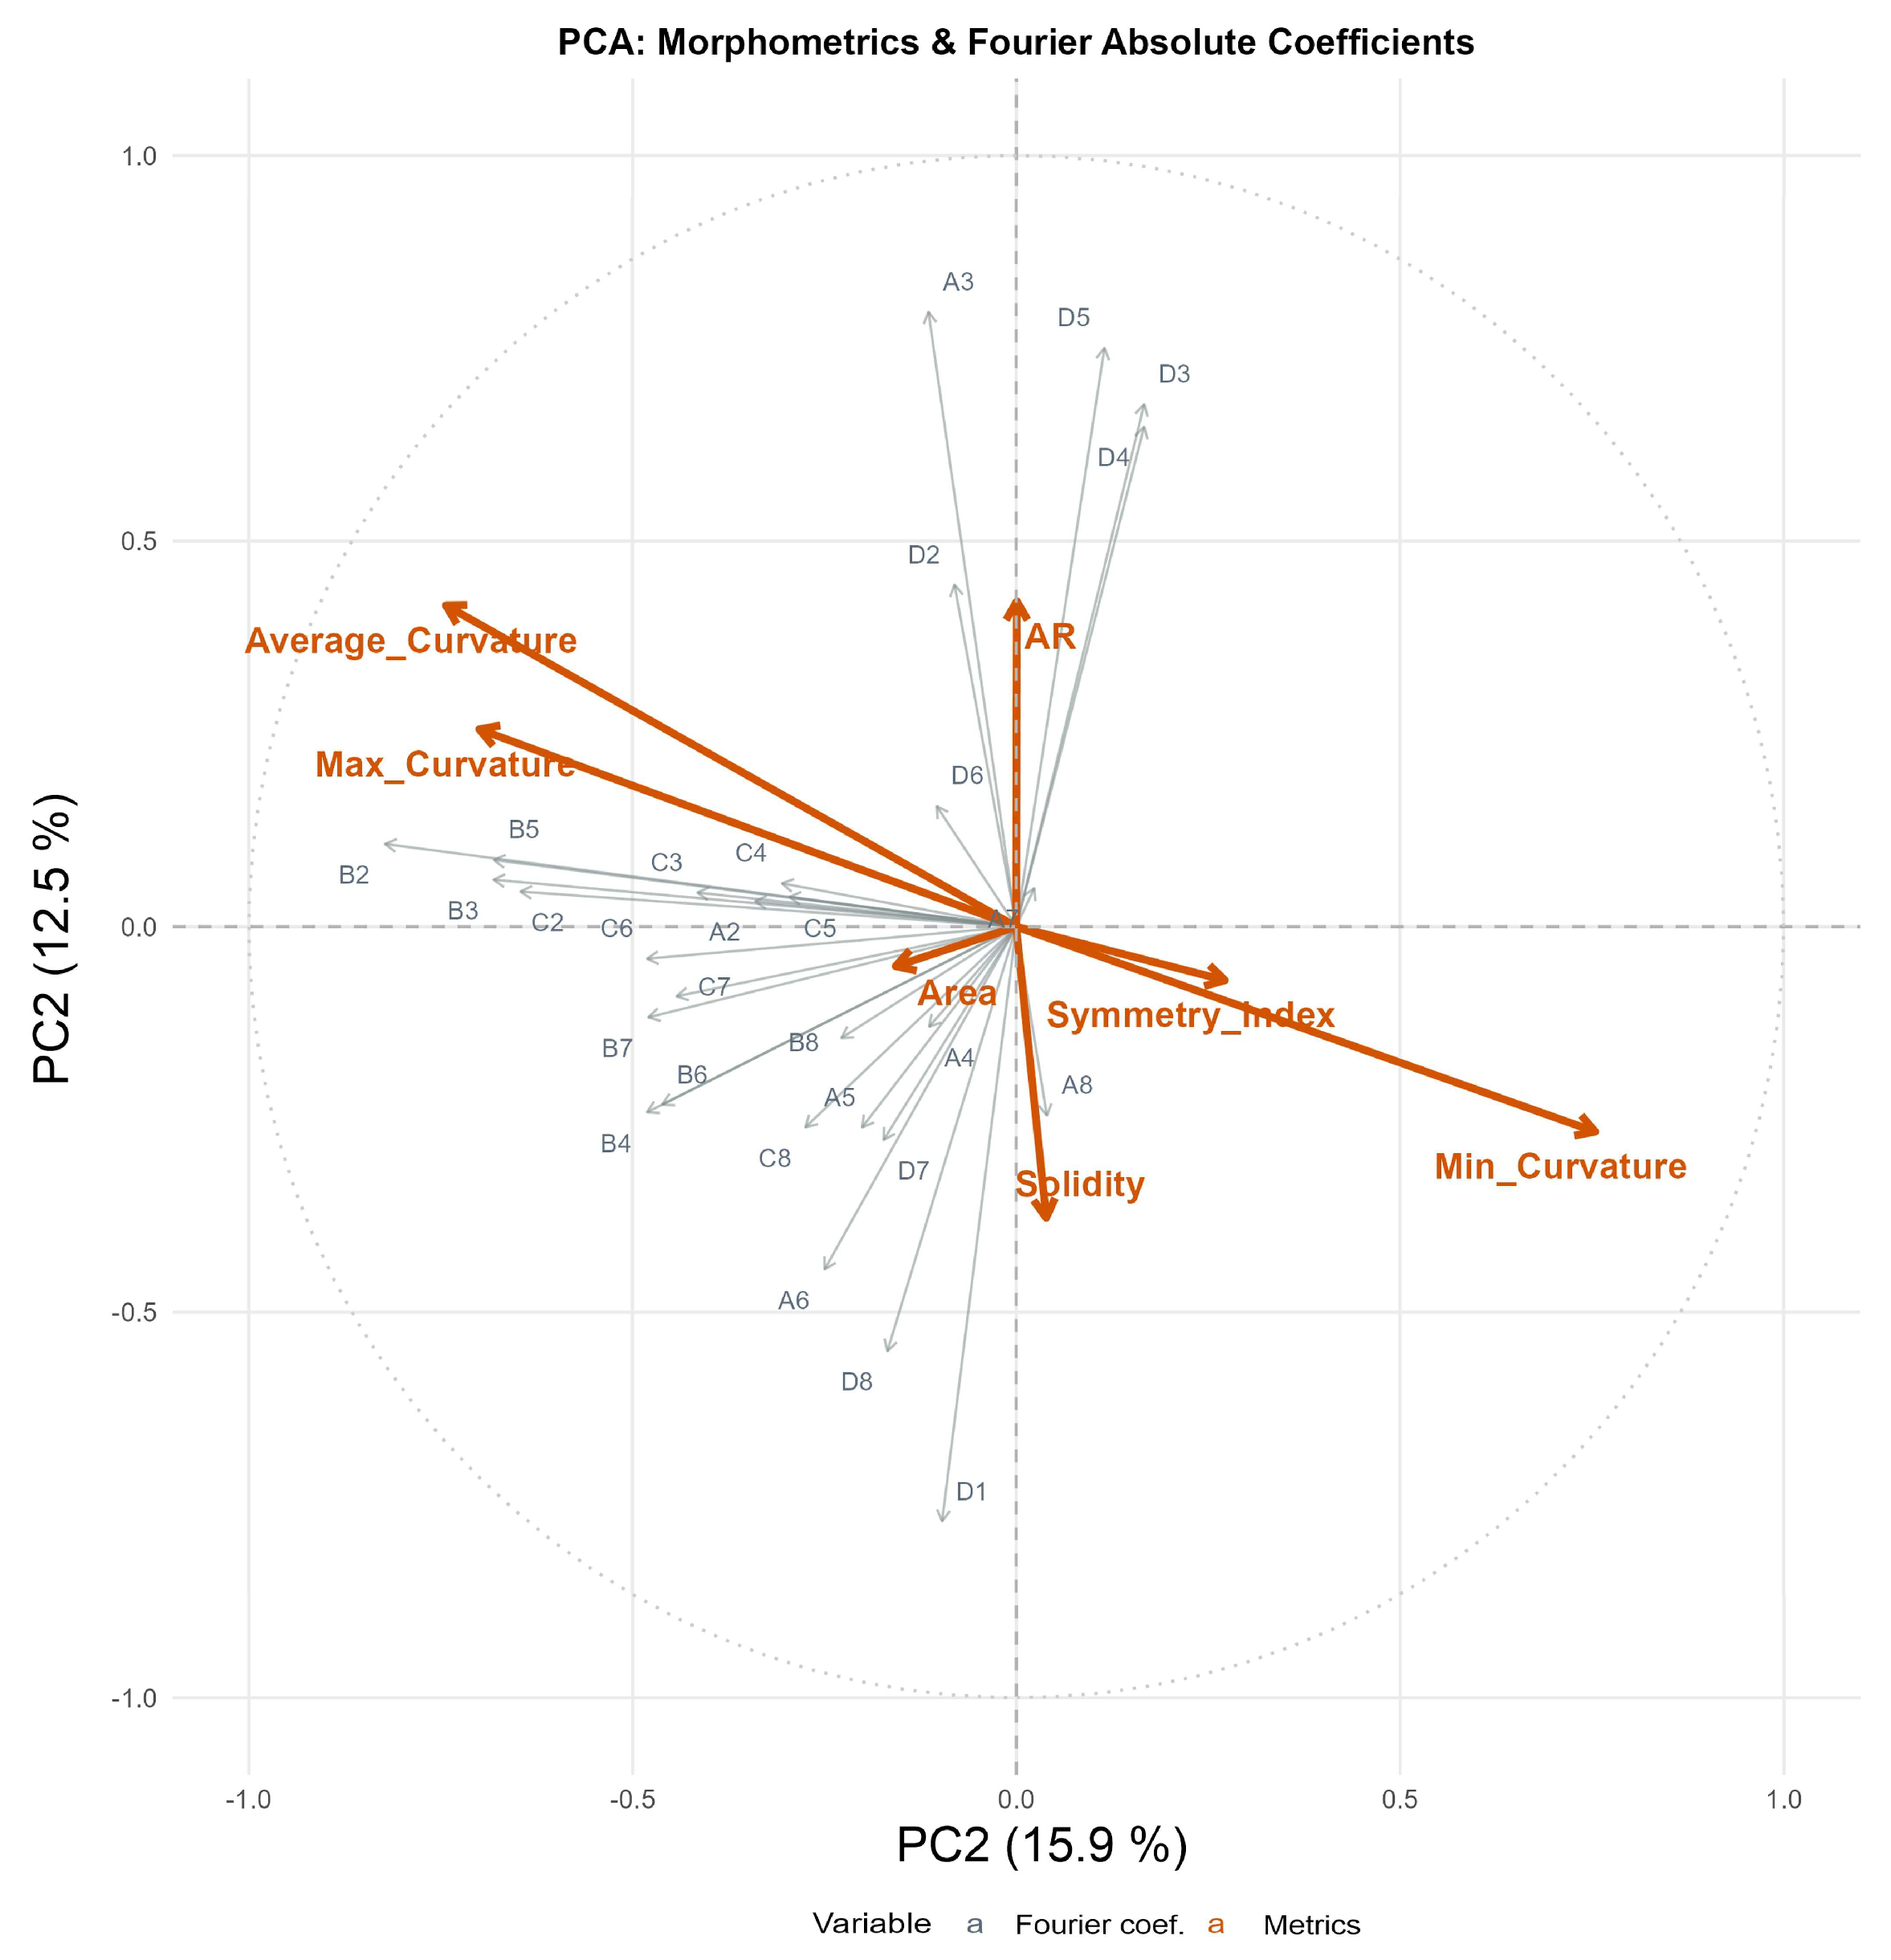
A Principal Component Analysis (PCA) was performed to map the structural dependencies between the Symmetry Index (SI), traditional scalar morphometric descriptors, and the comprehensive suite of elliptic Fourier descriptors (EFDs) spanning the first 8 evaluated harmonics (Figure 4). Because the asymmetric harmonic components—specifically the B and C coefficients—capture directional contour deviations across positive and negative phases in the two-dimensional coordinate space, their absolute values (bn and cn) were utilized to quantify the total magnitude of peripheral deformation. This mathematical transformation prevents algebraic cancellation during multi-attribute statistical modelling, enabling a direct association with the SI, which inherently assesses the cumulative loss of geometric balance regardless of its spatial orientation. Consistent with the pairwise Pearson correlation matrix, the projection vector exhibits near-complete orthogonality relative to both Solidity and Aspect Ratio (AR).
Figure 4.
Principal Component Analysis (PCA) variable loading plot illustrating the morphometric space defined by classical seed dimensions and Elliptic Fourier Descriptors (EFDs) from harmonics 2 to 8. The vectors corresponding to the four global descriptors (Symmetry Index, Area, Aspect Ratio, and Solidity) are contrasted against the 29 structural Fourier coefficients (A2–A8, B2–B8, C2–C8, and D1–D8). The orientation of the vectors relative to the principal axes indicates the sign and weight of their correlation with the respective components, while the angular proximity between arrows reflects the strength of their multi-dimensional relationship (where orthogonality denotes statistical independence). Vector size is dynamically scaled according to the individual percentage contribution (%) of each variable to the variance of the projected principal component plane.
Regarding the mathematical components of the seed contour, the Symmetry Index (SI) is functionally decoupled from the A1 to A8 series and the D1 to D8 harmonic expansions. Instead, the vector shares its principal loading axis with the low-order, side-to-side transformation coefficients, exhibiting a strong structural convergence with the absolute values of the and asymmetry series, alongside the second-harmonic width component (A2). This spatial localization within the multivariate space confirms that the SI effectively captures localized bilateral deviations without being confounded by global seed size or elongation gradients.
Parallel to the multivariate projection, bivariate analysis revealed that the Symmetry Index (SI) exhibits a weak but significant negative correlation with seed area (r = −0.178, p ≤ 0.05) and a weak negative correlation with average curvature (r = −0.074, p ≤ 0.05) (Table 2). In contrast, no statistically significant correlations were observed between the SI and aspect ratio (AR), solidity, or localized maximum and minimum curvature values. This baseline isolation reinforces that geometric bilateral consistency operates independently from the primary longitudinal stretching (AR) or the overall structural compaction (solidity) of the Vitis seed contour.
Table 2.
Correlations between Symmetry Index and Area, Aspect Ratio (AR), Solidity, Maximum Curvature, Minimum curvature and Average Curvature. Values represent Pearson correlation coefficients (r). Asterisks indicate statistical significance: * p < 0.05; ** p < 0.01.
3.2. Variations in Seed Symmetry Across Morphotypes
The initial phase of the morphometric analysis evaluated variation in the Symmetry Index (SI) among the six predefined structural and phylogenetic groups. Mean SI values across the germplasm collection showed a relatively narrow range, varying from 0.9825 in the Muscat lineage (Group IV) to 0.9869 in the wild Vitis species (Group I). The Kruskal–Wallis test revealed a highly significant effect of group membership on seed symmetry (χ2 = 57.09, df = 5, p < 0.01).
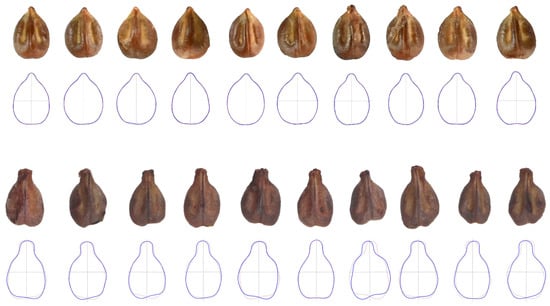
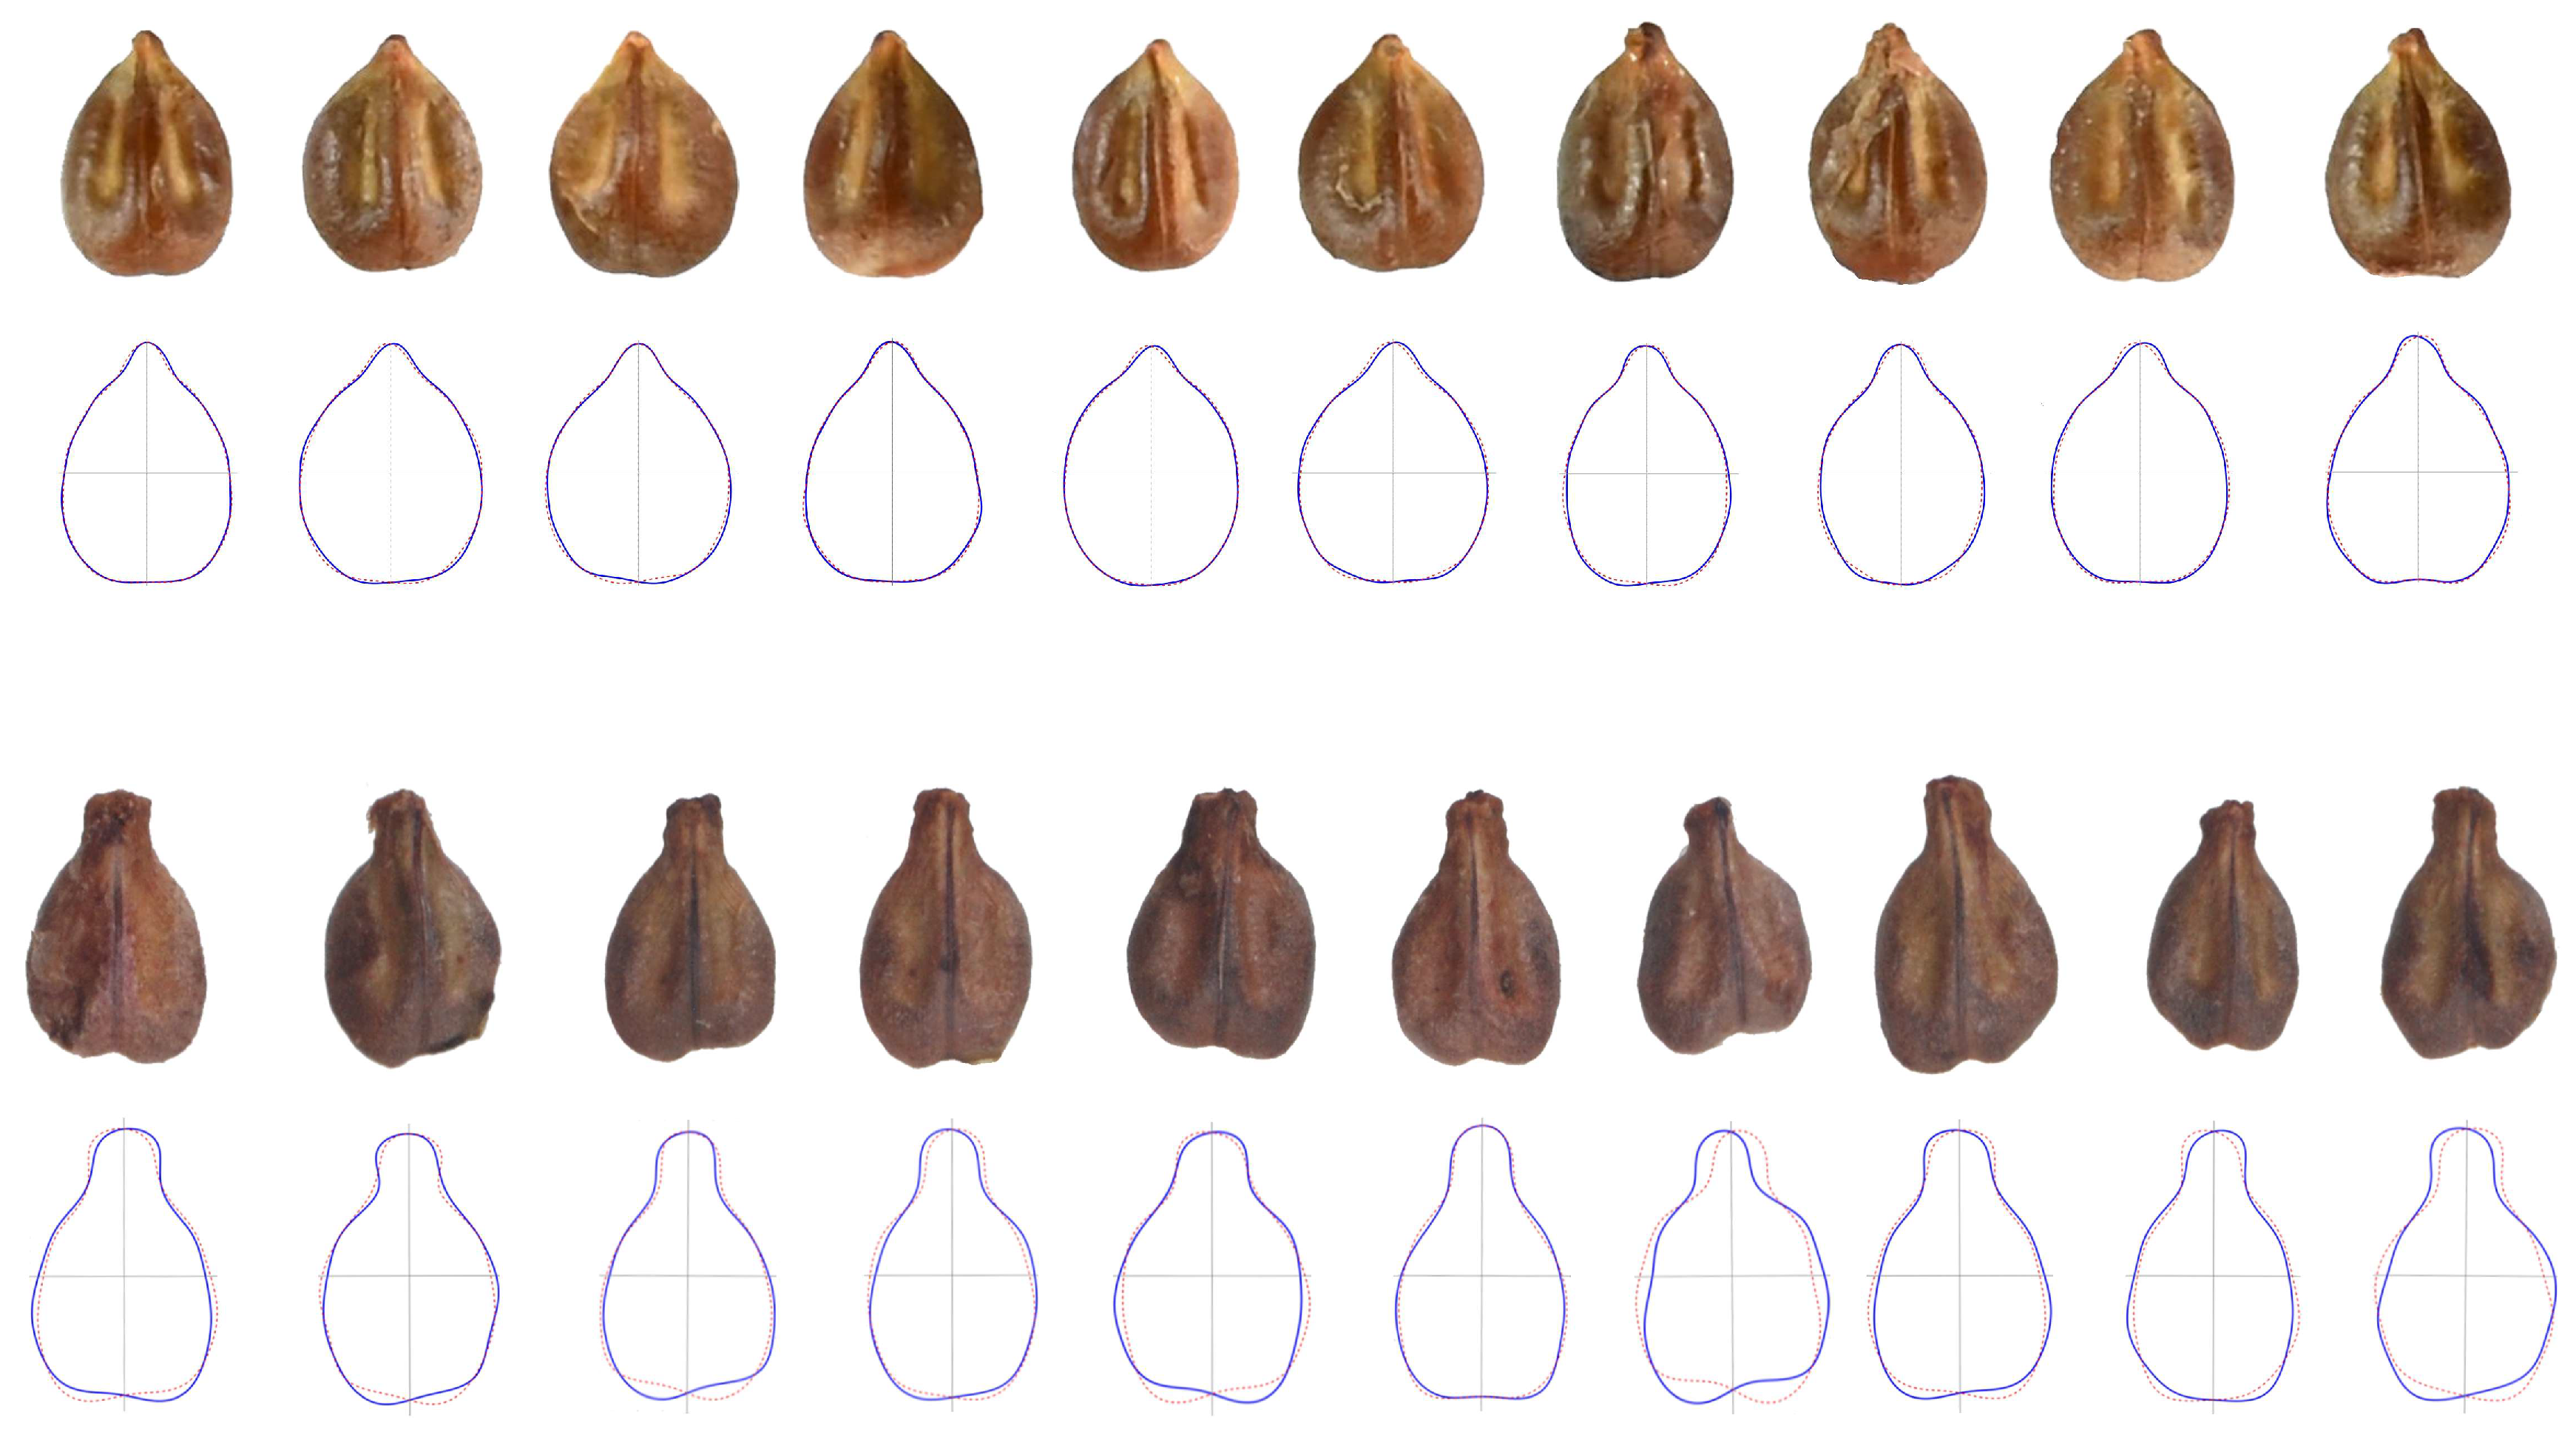
Post hoc pairwise comparisons showed that the wild outgroup (Group I), comprising Vitis amurensis, V. arizonica, and V. mustangensis, exhibited significantly higher bilateral symmetry (group “a”) than the V. vinifera groups represented by Savagnin Blanc and related cultivars (Group III) and Garnacha-derived cultivars (Group V) assigned to group “b” (Table 3). In contrast, the Iberian lineage represented by Hebén and related cultivars (Group II) occupied an intermediate position (group “ab”), showing no significant differences from either the wild outgroup or the central V. vinifera groups. The Muscat lineage (Group IV) displayed the lowest SI values and formed a distinct statistical group (group “c”), differing significantly from all other groups. Figure 5 illustrates the contrasting symmetry profiles of Vitis amurensis (Group I) and the cultivar Alphonse Lavallée (Group IV).
Table 3.
Results of the Kruskal–Wallis and post hoc Mann–Whitney U tests for the comparison of Symmetry Index (SI) values among six groups.
Figure 5.
Representative seed images and corresponding morphological outlines of Vitis amurensis (above) and cv. Alphonse Lavallée (below). Positioned beneath each seed photograph is its respective vectorized contour (blue line) displayed in optimal superposition with its reflected (specular) image (red line) at the orientation of maximum mathematical alignment.
Within-group variability was generally low across all groups. Nevertheless, Groups III, IV, and V exhibited the highest coefficients of variation (1.03%, 0.98%, and 1.17%, respectively), whereas Group I showed the lowest coefficient of variation (0.57%), indicating the greatest consistency in seed symmetry among the groups analysed.
3.3. Differences in Seed Symmetry Between Cultivars
3.3.1. Differences in Seed Symmetry Between Cultivars Within the Progeny of Hebén
To evaluate micro-morphological variation at the cultivar level, differences in the Symmetry Index (SI) were analysed among the 33 cultivars assigned to the Hebén lineage (Group II). The results of the Kruskal–Wallis test and the subsequent post hoc comparisons are summarized in Table 4. A consistent pattern emerged across the lineage: cultivars with lower mean SI values generally exhibited higher coefficients of variation, indicating greater within-cultivar variability in seed symmetry.
Table 4.
Results of the Kruskal–Wallis and post hoc Mann–Whitney U tests for the Symmetry Index (SI) among 13 cultivars in the Hebén group (Group II).
Statistically significant differences were detected between cultivars located at the opposite ends of the symmetry gradient. Cadrete and Derechero exhibited the highest mean SI values (0.990 and 0.988, respectively) and differed significantly from a group of cultivars with the lowest symmetry values, including Viura, Tempranillo, Montúa, Parellada, Aledo, and Albillo Mayor (p ≤ 0.05). Among these, Albillo Mayor displayed the lowest mean SI (0.9772; group “h”), representing the minimum level of bilateral symmetry observed within the Hebén lineage.
3.3.2. Differences in Seed Symmetry Between Cultivars Within the Progeny of Savagnin Blanc
Variation in the Symmetry Index (SI) was also evaluated among the 12 cultivars assigned to the Savagnin Blanc lineage (Group III). The results of the Kruskal–Wallis test and subsequent post hoc comparisons are summarized in Table 5. Significant differences in seed symmetry were detected among cultivars. Carrasquín and Maturana Blanca exhibited the highest mean SI values (0.9877 and 0.9874, respectively) and were assigned to statistical group “a”. These cultivars differed significantly (p ≤ 0.05) from Folgasão and Savagnin Blanc, which displayed the lowest mean SI values (0.9814 and 0.9805, respectively) and were assigned to group “b”. The remaining cultivars, including the reference varieties Cabernet Sauvignon and Sauvignon Blanc, occupied intermediate positions (group “ab”) and showed no significant differences from either of the two extreme groups.
Table 5.
Results of the Kruskal–Wallis and post hoc Mann–Whitney U tests for the Symmetry Index (SI) among 12 cultivars in the Savagnin Blanc group (Group III).
3.3.3. Differences in Seed Symmetry Between Cultivars Within the Muscat Group
Variation in the Symmetry Index (SI) was evaluated among the 13 cultivars assigned to the Muscat lineage (Group IV). The results of the Kruskal–Wallis test and subsequent post hoc comparisons are summarized in Table 6. Significant differences in seed symmetry were detected among cultivars. Moscatel Rosa exhibited the highest mean SI (0.9862) and was assigned to statistical group “a”. This cultivar differed significantly (p ≤ 0.05) from a cluster of cultivars with the lowest SI values, including Muscat Usbekistanskii (0.9754), Cariñena (0.9738), Cardinal (0.9721), and Alphonse Lavallée (0.9708), the latter representing the lowest mean SI observed within the Muscat lineage (group “e”).
Table 6.
Results of the Kruskal–Wallis and post hoc Mann–Whitney U tests for the Symmetry Index (SI) among 13 cultivars in the Muscat group (Group IV).
3.3.4. Differences in Seed Symmetry Between Cultivars Within the Garnacha Group
Variation in the Symmetry Index (SI) was evaluated among the five cultivars assigned to the Garnacha lineage (Group V). The results of the Kruskal–Wallis test and subsequent post hoc comparisons are summarized in Table 7. Significant differences in seed symmetry were detected among cultivars. Marselan exhibited the highest mean SI (0.9877) and was assigned to statistical group “a”, differing significantly (p ≤ 0.05) from all other cultivars within the lineage. In contrast, Caladoc displayed the lowest mean SI (0.9679) and was assigned to group “c”, differing significantly from Marselan, Alicante Henri Bouschet, and Garnacha Tinta.
Table 7.
Results of the Kruskal–Wallis and post hoc Mann–Whitney U tests for the comparison of Symmetry Index (SI) values among 5 cultivars in the Garnacha group (Group V).
Within-group variability also differed among cultivars. Caladoc exhibited the largest coefficient of variation (2.33), whereas Marselan showed the lowest variability (coef. of variation = 0.47), indicating greater consistency in seed symmetry for the latter cultivar.
3.4. Intra-Varietal Differences Across Cultivation Sites
To assess the effects of environmental conditions and genotype-by-environment (G × E) interactions on seed symmetry, variation in the Symmetry Index (SI) was analysed among different populations of individual cultivars (Table 8). Among populations evaluated across different vintages at the same location, temporal stability was generally maintained. Montúa was the only cultivar to exhibit significant temporal variation, with seeds collected in the 2020 vintage showing a significantly higher mean SI (0.9849; group “a”) than those collected in 2024 (0.9753; group “b”; p ≤ 0.05).
Table 8.
Intra-varietal comparisons of Mean Symmetry Index (SI) and coefficients of variation values across different cultivation sites and vintages for Vitis vinifera cultivars.
In contrast, significant spatial variation was detected among cultivation sites for several cultivars. Significant differences were observed in Alfrocheiro, Muscat Hamburg, Savagnin Blanc, Sauvignon Blanc, Cardinal, and Aledo. No consistent site effect was detected across all cultivars. Instead, the direction and magnitude of the differences depended on the cultivar. For example, Alfrocheiro exhibited significantly higher SI values at IMIDRA than at Valbusenda, whereas Muscat Hamburg showed the opposite pattern, with higher SI values recorded at Valbusenda than at IMIDRA in 2025 (p ≤ 0.05). These results indicate that the effect of cultivation site on seed symmetry is cultivar-dependent.
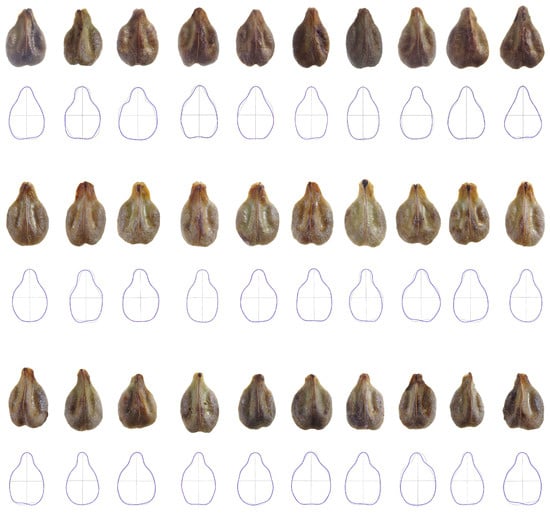
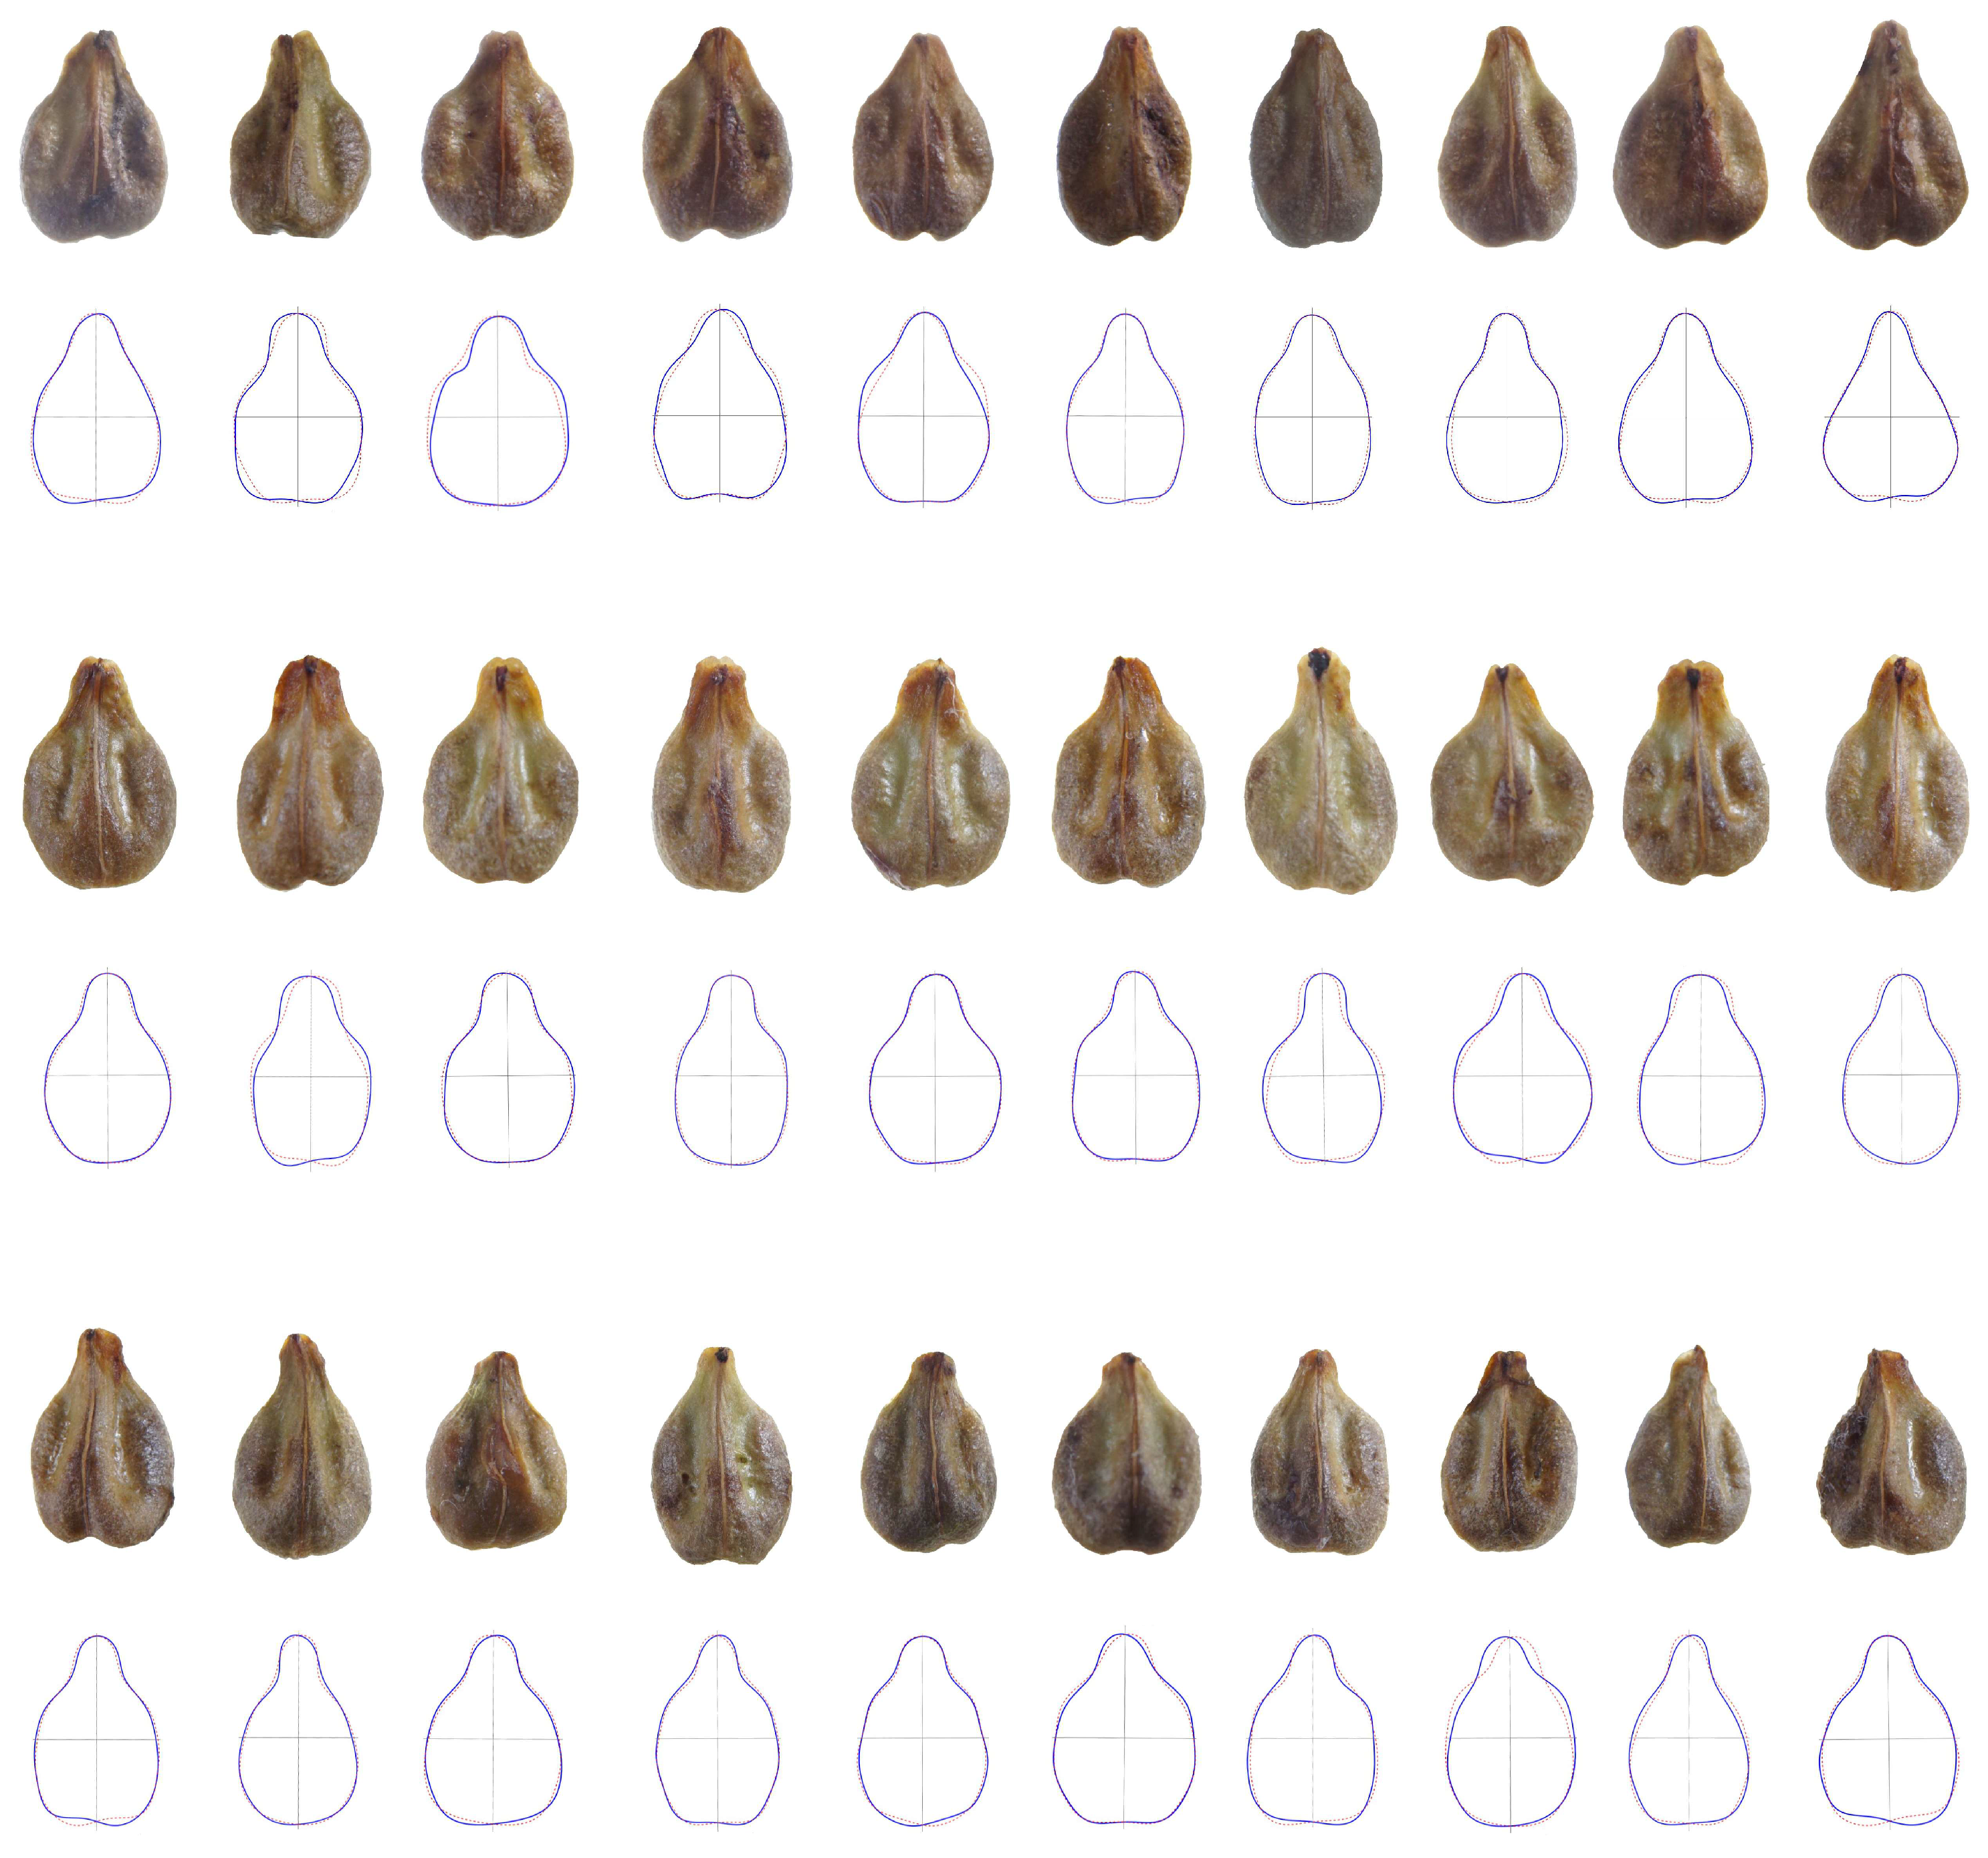
Tempranillo, including its regional variant Tinta de Toro, exhibited the widest geographical variation among the cultivars analysed. The highest mean SI values were recorded for the Abadía Retuerta (Tempranillo standard), INIAV Pt, IMIDRA, Liberalia, and Divina Proporción populations, which formed the highest statistical group (group “a”; mean SI = 0.9793). In contrast, the Tinta de Toro population cultivated at Abadía Retuerta exhibited a significantly lower mean SI (0.9744) and was assigned to the lowest statistical group (group “b”) (Figure 6). The Abadía Retuerta and Divina Proporción populations of Tinta de Toro also exhibited the largest coefficients of variation (0.96 and 1.45, respectively) among all populations analysed, indicating an association between greater within-population variability and low seed symmetry.
Figure 6.
Representative seed cohorts of Vitis vinifera cv. Tempranillo (Tinta de Toro) illustrating localized intra-varietal morphological variation across different cultivation sites. (Top row): Seeds from Abadía Retuerta, exhibiting higher bilateral asymmetry and outline heterogeneity. (Central row): Seeds from Divina Proporción. (Bottom row): Seeds from Liberalia. The cohorts from the latter two vineyards display enhanced structural symmetry and uniform shape.
4. Discussion
4.1. Evolutionary Implications of Seed Symmetry: The Wild-to-Domesticated Divergence
Our analysis revealed a clear difference in bilateral seed symmetry between wild Vitis species and cultivated Vitis vinifera. Wild taxa (Group I), represented by species such as Vitis amurensis, exhibited the highest Symmetry Index (SI) values together with the lowest phenotypic dispersion, whereas cultivated groups showed lower symmetry and greater within-group variability. These results indicate that seed symmetry has been modified during domestication and that cultivated germplasm encompasses substantially greater morphological diversity than its wild counterparts.
Previous morphometric studies have generally compared wild and cultivated grapevines as two relatively homogeneous groups when investigating seed morphology and domestication [3,13,17]. Our results suggest that this simplification overlooks considerable variation within cultivated V. vinifera. In particular, the Muscat lineage forms a distinct morphometric group characterized by significantly lower symmetry and greater phenotypic variability than the remaining cultivated lineages. These findings are consistent with recent genomic studies showing that cultivated grapevine diversity is highly structured and reflects multiple domestication events, historical hybridization, and extensive vegetative propagation rather than a single homogeneous domesticated gene pool [24,33,34].
The greater symmetry observed in wild species is consistent with the concept of developmental canalization, whereby developmental processes generate stable phenotypes despite genetic or environmental perturbations [35,36]. In natural populations, seed morphology contributes directly to reproductive success by influencing seed protection, dormancy, dispersal, and germination. Consequently, stabilizing selection is expected to favour developmental pathways that produce consistent seed architectures. The limited phenotypic variation observed in wild Vitis species is compatible with this expectation. Domestication likely relaxed these developmental constraints. During grapevine improvement, selection has primarily targeted fruit-related traits, including berry size, sugar accumulation, flavour, aroma, and yield [1,33,34], thereby permitting the accumulation of greater morphological variation in seed traits within the cultivated germplasm. Similar trends have been reported in numerous crop species, where domestication has increased phenotypic diversity in traits that are only indirectly associated with agricultural selection [37,38,39].
The Muscat lineage illustrates this pattern particularly well. Compared with the remaining cultivated groups, Muscat cultivars consistently exhibited lower symmetry and greater within-group variability [40]. Although the developmental mechanisms underlying this pattern remain unknown, they may reflect indirect effects of selection on fruit architecture, berry development, or resource allocation during seed formation [2,41]. Integrating geometric morphometrics with genomic analyses and developmental studies will help determine whether the reduced symmetry observed in this lineage results from specific genetic factors or from correlated responses to selection acting on fruit-related traits.
Overall, these results support bilateral seed symmetry as a quantitative descriptor of developmental stability in grapevine seeds. Combined with geometric morphometric approaches, symmetry analysis provides an objective phenotypic trait that can distinguish evolutionary lineages and characterize variation within the cultivated germplasm.
4.2. Cultivar-Specific Homeostasis and Morphological Trajectories
Although cultivated grapevines exhibited lower bilateral symmetry and greater phenotypic variability than wild Vitis species, most Vitis vinifera cultivars maintained highly consistent symmetry profiles, suggesting that seed development remains under strong genetic and developmental control. This observation is consistent with the high genetic uniformity of clonally propagated grapevine cultivars, in which centuries of vegetative propagation have largely preserved cultivar identity while allowing only limited somatic variation to accumulate [1,27,34,42]. The conservation of seed symmetry therefore appears to reflect an intrinsic developmental property of each cultivar rather than a purely environmentally determined characteristic.
From a taxonomic perspective, this high degree of stability generally parallels the morphological conservation observed across different lineages and haplotypes, supporting the use of bilateral symmetry as a quantitative descriptor for cultivar identification in specific cases. Unlike vegetative organs, whose morphology is strongly influenced by environmental conditions, grapevine seeds generally retain stable geometric characteristics across growing environments, making them particularly suitable for morphometric analyses and germplasm characterization [2,5,6,7,8,9]. However, our results also reveal that cultivars belonging to entirely different phylogenetic lineages or possessing distinct parentages frequently exhibit convergent, nearly identical symmetry profiles. This convergence contrasts with overall seed shape, which tends to be conserved within pedigree groups [5,6,7,8,9], suggesting that structural or developmental constraints promote high levels of bilateral symmetry across genetically distinct lineages. Thus, although seed symmetry alone cannot be used to infer close genetic relationships within Vitis, it represents a useful complementary trait for the classification of certain cultivars and may also contribute to clonal identification.
Indeed, significant differences in symmetry were detected among pedigree groups, particularly between the Muscat lineage and the remaining lineages analysed in this study. Rather than following the traditional boundaries defined by proles or pedigrees, symmetry profiles showed substantial convergence across distinct eco-geographical groups, with notable exceptions such as the Muscat lineage, historically associated with Eastern (Pontic) origins. Furthermore, subtle differences in symmetry were detected among samples of the same cultivar grown at different locations, notably in the highly variable cultivar Tempranillo. These observations suggest that symmetry may also provide a valuable metric for evaluating differences among clones or naturally occurring variants within a given cultivar. Together, these findings indicate that although overall seed dimensions have been shaped by regional selection for berry size and end use, the fine geometric balance and bilateral symmetry of Vitis seeds remain strongly buffered by intrinsic developmental processes, largely transcending classical eco-geographical divisions.
A particularly illustrative example of the reduced symmetry observed in the Muscat lineage is Alphonse Lavallée, which exhibited the lowest mean Symmetry Index (SI = 0.9708) together with the greatest within-cultivar variability (coefficient of variation = 1.39). This combination distinguishes it from most of the remaining cultivars and suggests that the mechanisms regulating seed development may differ among genetic backgrounds. The occurrence of such outliers indicates that developmental stability is not uniformly maintained across cultivated grapevines and that individual cultivars may occupy different positions along a continuum of developmental robustness. Alphonse Lavallée is a diploid cultivar cultivated primarily as a table grape, although it has also been used for wine production. It is characterized by exceptionally large, firm berries [43]. One possible explanation for its distinctive symmetry profile is that selection for increased berry size has indirectly altered the physical environment in which seeds develop. During the early stages of berry development, rapid pericarp expansion may modify the dimensions of the locular cavity, potentially imposing localized mechanical constraints on developing seeds. Such constraints could influence seed coat development and generate subtle deviations from bilateral symmetry without implying defects in the underlying developmental program.
Developmental interactions between fruit growth and seed morphology have been documented in several crop species, where selection for fruit size or architecture indirectly affects seed traits through allometric and developmental processes [37,38,44]. Although the present study does not directly test this mechanism, our results suggest that similar developmental trade-offs may also occur in grapevine. Future studies integrating geometric morphometrics with berry anatomy, developmental imaging, and genomic analyses will be required to determine whether the reduced symmetry observed in Alphonse Lavallée reflects mechanical effects associated with fruit enlargement, cultivar-specific developmental pathways, or an interaction between these factors.
4.3. Terroir-Driven Plasticity Versus Intrinsic Clonal Variation
The comparison of populations cultivated at different locations revealed that seed symmetry is influenced by genotype-by-environment (G × E) interactions. Significant differences among cultivation sites were detected for several cultivars, but no consistent site effect was observed across the germplasm. Instead, both the direction and magnitude of the response varied among cultivars, indicating that environmental influences on seed morphology are genotype dependent.
This cultivar-specific behaviour is consistent with previous studies showing that grapevine performance results from complex interactions between genotype and local environmental conditions. Temperature, water availability, soil characteristics, vineyard management, and their interactions all influence berry development and seed formation, although the magnitude of these effects differs among cultivars [45,46]. Similar genotype-dependent responses have been described for numerous grapevine traits, particularly under contrasting environmental conditions and varying levels of water availability [47]. Our results suggest that bilateral seed symmetry represents an additional phenotypic trait that responds to these genotype-specific environmental interactions. Technically, using germplasm collections represents an advantage for establishing baseline morphometric descriptors.
These observations also have practical implications for germplasm characterization. Although seed morphology is generally considered more stable than vegetative traits [5,6,7,8,9,12,13,14,15], our results demonstrate that subtle geometric characteristics, such as bilateral symmetry, can nevertheless exhibit a measurable degree of environmental plasticity. Consequently, symmetry should not be regarded as an immutable cultivar descriptor but rather as a quantitative trait whose expression reflects the interaction between genotype and the environment. Incorporating multiple populations and cultivation sites into morphometric studies may therefore improve the robustness of cultivar characterization while providing additional insight into the developmental plasticity of grapevine seeds.
Taken together, these findings indicate that bilateral seed symmetry is determined by both genetic background and local environmental conditions. Although seed morphology remains a relatively stable taxonomic character, subtle geometric features retain sufficient environmental plasticity to reveal genotype-specific responses to local growing conditions. Consequently, symmetry analysis provides a complementary quantitative descriptor that, when integrated with other morphometric and genetic approaches, may improve the characterization of cultivars, clones, and geographically distinct populations.
4.4. Methodological Advances in Computational Ampelometry
By integrating the Procrustes-based Symmetry Index (SI) with conventional morphometric descriptors, such as seed area and solidity, this study expands the quantitative framework available for grapevine seed characterization. Traditional ampelometric approaches, including the descriptors proposed by the International Organisation of Vine and Wine (OIV), remain valuable for cultivar identification but rely largely on qualitative or semi-quantitative assessments that provide limited resolution for distinguishing closely related cultivars, clones, or regional populations.
Geometric morphometric methods based on Elliptic Fourier Analysis (EFA) have substantially advanced the quantitative analysis of seed shape by describing complete outlines through Fourier coefficients [6,7,8,9,14,15,16,17]. However, EFA primarily captures global shape variation and may be less sensitive to subtle bilateral differences because reconstructed outlines are represented by a finite series of harmonics. The Procrustes-based Symmetry Index complements these approaches by specifically quantifying deviations from bilateral symmetry following the optimal superimposition of mirrored seed outlines. As a scale-independent metric, the SI provides an additional descriptor of seed morphology that is independent of overall seed size. This mathematical framework can be readily implemented as a standardized analytical pipeline for the analysis of seeds from any Vitis cultivar, making it broadly applicable to germplasm characterization.
Although the framework presented here quantifies phenotypic deviations from bilateral symmetry with high precision, it is intended as a descriptive rather than a predictive tool and does not directly identify the environmental or genetic factors underlying the observed variation. The integration of the SI with other geometric variables, particularly solidity and curvature, enables a more comprehensive characterization of seed morphology in Vitis species and cultivars [6,7,8,9]. Whereas solidity describes the compactness of the seed outline and reflects morphological features such as ventral depressions and beak development, the Symmetry Index quantifies the degree of bilateral correspondence. Together, these complementary descriptors provide a multidimensional representation of seed architecture that enhances the discrimination of cultivars and populations. Moreover, the automated workflow developed in this study is fully reproducible and readily applicable to large image datasets, making it well suited for high-throughput phenotyping of grapevine germplasm. Beyond cultivar discrimination, quantitative symmetry analysis may also prove valuable for evaluating clonal variation and characterizing geographically distinct populations. Future studies integrating morphometric, genomic, and environmental datasets will help determine the extent to which bilateral symmetry can serve as a phenotypic indicator of developmental stability across diverse genetic backgrounds and environmental conditions. Bilateral symmetry is not only a useful descriptor for Vitis but also a promising morphometric trait for studying developmental stability and domestication in other seed-bearing crops.
5. Conclusions
This study demonstrates that bilateral seed symmetry is a robust quantitative trait for the characterization of grapevine germplasm. By integrating Elliptic Fourier Analysis (EFA), Generalized Procrustes Analysis (GPA), and automated image processing in R, we developed a reproducible workflow for calculating a scale-independent Symmetry Index (SI). The resulting protocol provides a rapid, objective, and non-destructive approach for analysing large seed collections while minimizing observer bias.
The Symmetry Index revealed biologically meaningful patterns across multiple hierarchical levels. Wild Vitis species exhibited significantly greater bilateral symmetry and lower phenotypic variation than cultivated Vitis vinifera, supporting the view that domestication has been accompanied by increased morphological diversification. Within cultivated grapevines, however, most cultivars maintained highly consistent symmetry profiles, indicating that bilateral seed architecture remains under strong developmental control despite extensive genetic diversification. In contrast, the Muscat lineage consistently displayed lower symmetry and greater phenotypic variability than the remaining cultivated groups, while cultivars such as Alphonse Lavallée exhibited unusually high within-cultivar variation, illustrating that developmental stability differs among genetic backgrounds.
The analysis also demonstrated that bilateral symmetry is influenced by genotype-to-environment interactions. Although seed symmetry proved sufficiently stable to support germplasm characterization, significant differences among populations cultivated under contrasting environmental conditions indicate that this trait retains a measurable degree of environmental plasticity. Consequently, the Symmetry Index complements conventional morphometric descriptors, including seed area, solidity, and curvature, by providing additional quantitative information on seed architecture and developmental variation.
Beyond its methodological contribution, this study advances computational ampelometry by introducing a standardized and scalable framework for the quantitative analysis of bilateral seed symmetry. The automated workflow can be readily integrated with geometric morphometrics, genomic analyses, and archaeobotanical investigations, providing a complementary tool for cultivar identification, germplasm characterization, studies of clonal and geographical variation, and research into grapevine domestication and evolution.
Future studies integrating symmetry analysis with genomic, developmental, and environmental datasets will help elucidate the biological mechanisms underlying variation in seed architecture and determine the broader applicability of bilateral symmetry as a quantitative descriptor of developmental stability in grapevine and other seed-bearing crops.
Supplementary Materials
Images of seeds harvested in IMIDRA in 2020 and 2024 are available at https://zenodo.org/records/15829028 and https://zenodo.org/records/14610754 (accessed on 2 March 2026), respectively. Images of seeds from Abadía Retuerta, IMIDRA, and Jardín Ampelográfico Valbusenda harvested in 2025 are available at https://zenodo.org/records/18622032 (accessed on 2 March 2026). Seed images of the Portuguese collection at INAV are available at https://zenodo.org/records/19566279 (accessed on 21 April 2026). Table S1 (Excel file) containing three Sheets (Populations under study, Data for PCA and Fourier coefficients for 2160 seeds), R code for calculation of Symmetry Index (SI) from Fourier coefficients and samples of the results of SI analysis are available at https://zenodo.org/records/21219841 (accessed on 24 June 2026).
Author Contributions
Conceptualization, E.C. and Á.T.; methodology, E.C., J.J.M.G., J.L.R.-L. and Á.T.; software, E.C. and J.J.M.G.; validation, E.C., J.J.M.G., J.L.R.-L., Á.A.B., F.C.S.d.S.M., G.M.O., J.C. and Á.T.; formal analysis, E.C. and J.J.M.G.; investigation, E.C., J.J.M.G., J.L.R.-L., Á.A.B., F.C.S.d.S.M., G.M.O., J.C. and Á.T.; resources, E.C., J.J.M.G., J.L.R.-L., Á.A.B., F.C.S.d.S.M., G.M.O., J.C. and Á.T.; data curation, E.C. and J.J.M.G.; writing—original draft preparation, E.C.; writing—review and editing, E.C., J.J.M.G., J.L.R.-L., Á.A.B., F.C.S.d.S.M., G.M.O., J.C. and Á.T.; visualization, E.C. and J.J.M.G.; supervision, E.C. and Á.T.; project administration, E.C. and Á.T.; funding acquisition, E.C. and Á.T. All authors have read and agreed to the published version of the manuscript.
Funding
This research received no external funding.
Data Availability Statement
The original contributions presented in this study are included in the article/Supplementary Material. Further inquiries can be directed to the corresponding authors.
Acknowledgments
We acknowledge Bodegas Abadía Retuerta, Ayuso, Divina Proporción, Liberalia and Jardín Ampelográfico Valbusenda for kindly providing seed samples. The script for automated Symmetry Index analysis was obtained with the help of Gemini 1.5 Pro (Google).
Conflicts of Interest
Author Ángel Anocibar Beloqui was employed by the company Abadía Retuerta. The remaining authors declare that the research was conducted in the absence of any commercial or financial relationships that could be construed as a potential conflict of interest.
References
- This, P.; Lacombe, T.; Thomas, M. Historical origins and genetic diversity of wine grapes. Trends Genet. 2006, 22, 511–519. [Google Scholar] [CrossRef] [Scilit]
- Terral, J.-F.; Tabard, E.; Bouby, L.; Ivorra, S.; Pastor, T.; Figueiral, I.; Picq, S.; Chevance, J.-B.; Jung, C.; Fabre, L.; et al. Evolution and history of grapevine (Vitis vinifera) under domestication: New morphometric perspectives to understand seed domestication syndrome and reveal origins of ancient European cultivars. Ann. Bot. 2010, 105, 443–455. [Google Scholar] [CrossRef] [Scilit]
- Bodor-Pesti, P.; Taranyi, D.; Deák, T.; Nyitrainé Sárdy, D.Á.; Varga, Z. A review of ampelometry: Morphometric characterization of the grape (Vitis spp.) leaf. Plants 2023, 12, 452. [Google Scholar] [CrossRef] [Scilit] [PubMed]
- Galet, P. Précis D’ampélographie Pratique, 7th ed.; Pierre Galet: Montpellier, France, 1998. [Google Scholar]
- Cervantes, E.; Martín-Gómez, J.J.; Rodríguez-Lorenzo, J.L.; Del Pozo, D.G.; Cabello Sáenz de Santamaría, F.; Muñoz-Organero, G.; Tocino, Á. Seed morphology in Vitis cultivars related to Hebén. AgriEngineering 2025, 7, 62. [Google Scholar] [CrossRef] [Scilit]
- Martín-Gómez, J.J.; Rodríguez-Lorenzo, J.L.; Espinosa-Roldán, F.E.; Cabello Sáenz de Santamaría, F.; Muñoz-Organero, G.; Tocino, Á.; Cervantes, E. Seed morphometry reveals two major groups in Spanish grapevine cultivars. Plants 2025, 14, 1522. [Google Scholar] [CrossRef] [Scilit] [PubMed]
- Martín-Gómez, J.J.; Rodríguez-Lorenzo, J.L.; Espinosa-Roldán, F.E.; Cabello Sáenz de Santamaría, F.; Muñoz-Organero, G.; Tocino, Á.; Cervantes, E. Morphometric analysis reveals new data in the history of Vitis cultivars. Plants 2025, 14, 2481. [Google Scholar] [CrossRef] [Scilit] [PubMed]
- Martín-Gómez, J.J.; Cunha, J.; Rodríguez-Lorenzo, J.L.; Anocibar Beloqui, Á.; Cabello Sáenz de Santamaría, F.; Muñoz-Organero, G.; Tocino, Á.; Cervantes, E. Biodiversity for sustainable viticulture: Seed morphometry in Portuguese cultivars of Vitis vinifera L. Horticulturae 2026, 12, 634. [Google Scholar] [CrossRef] [Scilit]
- Rodríguez-Lorenzo, J.L.; Martín-Gómez, J.J.; Espinosa-Roldán, F.E.; Tocino, Á.; Cervantes, E. Seed morphological changes associated with the domestication of Vitis cultivars. Phyton 2026, 95, 18. [Google Scholar] [CrossRef] [Scilit]
- OIV. Descriptor List for Grapevine Varieties and Vitis Species, 2nd ed.; Organisation Internationale de la Vigne et du Vin: Paris, France, 2009. [Google Scholar]
- Mangafa, M.; Kotsakis, K. A new method for the identification of wild and cultivated charred grape seeds. J. Archaeol. Sci. 1996, 23, 409–418. [Google Scholar] [CrossRef] [Scilit]
- Obón, C.; Rivera-Obón, D.J.; Valera, J.; Matilla, G.; Alcaraz, F.; Maghradze, D.; Kikvadze, M.; Ocete, C.-A.; Ocete, R.; Nebish, A.; et al. Is there a domestication syndrome in Vitis (Vitaceae) seed morphology? Genet. Resour. Crop Evol. 2025, 72, 1541–1565. [Google Scholar] [CrossRef] [Scilit]
- Rivera, D.; Valera, J.; Maghradze, D.; Kikvadze, M.; Nebish, A.; Ocete, R.; Ocete, C.Á.; Arnold, C.; Laguna, E.; Alcaraz, F.; et al. Heterogeneity in seed samples from vineyards and natural habitats along the Eurasian Vitis vinifera range: Implications for domestication and hybridization. Horticulturae 2025, 11, 92. [Google Scholar] [CrossRef] [Scilit]
- Pagnoux, C.; Bouby, L.; Ivorra, S.; Petit, C.; Valamoti, S.-M.; Pastor, T.; Picq, S.; Terral, J.-F. Inferring the agrobiodiversity of Vitis vinifera L. (grapevine) in ancient Greece by comparative shape analysis of archaeological and modern seeds. Veg. Hist. Archaeobot. 2015, 24, 75–84. [Google Scholar] [CrossRef] [Scilit]
- Pagnoux, C.; Bouby, L.; Valamoti, S.M.; Bonhomme, V.; Ivorra, S.; Gkatzogia, E.; Karathanou, A.; Kotsachristou, D.; Kroll, H.; Terral, J.-F. Local domestication or diffusion? Insights into viticulture in Greece from Neolithic to Archaic times, using geometric morphometric analyses of archaeological grape seeds. J. Archaeol. Sci. 2021, 125, 105263. [Google Scholar] [CrossRef] [Scilit]
- Bonhomme, V.; Terral, J.-F.; Zech-Matterne, V.; Ivorra, S.; Lacombe, T.; Deborde, G.; Kuchler, P.; Limier, B.; Pastor, T.; Rollet, P.; et al. Seed morphology uncovers 1500 years of vine agrobiodiversity before the advent of the Champagne wine. Sci. Rep. 2021, 11, 2305. [Google Scholar] [CrossRef] [Scilit] [PubMed]
- Bouby, L.; Wales, N.; Jalabadze, M.; Rusishvili, N.; Bonhomme, V.; Ramos-Madrigal, J.; Evin, A.; Ivorra, S.; Lacombe, T.; Pagnoux, C.; et al. Tracking the history of grapevine cultivation in Georgia by combining geometric morphometrics and ancient DNA. Veg. Hist. Archaeobot. 2021, 30, 63–76. [Google Scholar] [CrossRef] [Scilit]
- Graham, J.H.; Raz, S.; Hel-Or, H.; Nevo, E. Fluctuating asymmetry: Methods, theory, and applications. Symmetry 2010, 2, 466–540. [Google Scholar] [CrossRef] [Scilit]
- Klingenberg, C. Analyzing fluctuating asymmetry with geometric morphometrics: Concepts, methods, and applications. Symmetry 2015, 7, 843–934. [Google Scholar] [CrossRef] [Scilit]
- Palmer, R.; Strobeck, C. Fluctuating asymmetry analyses revisited. In Developmental Instability: Causes and Consequences; Polak, M., Ed.; Oxford University Press: New York, NY, USA, 2003; pp. 279–319. [Google Scholar]
- Goodall, C. Procrustes methods in the statistical analysis of shape. J. R. Stat. Soc. Ser. B Stat. Methodol. 1991, 53, 285–321. [Google Scholar] [CrossRef] [Scilit]
- Cervantes, E.; Martín-Gómez, J.J.; Espinosa-Roldán, F.E.; Muñoz-Organero, G.; Tocino, Á.; Cabello-Sáenz de Santamaría, F. Seed morphology in key Spanish grapevine cultivars. Agronomy 2021, 11, 734. [Google Scholar] [CrossRef] [Scilit]
- Espinosa-Roldán, F.E.; Rodríguez-Lorenzo, J.L.; Martín-Gómez, J.J.; Tocino, Á.; Martínez, V.R.; Elola, A.R.; de Santamaría, F.C.S.; de Toda, F.M.; Cervantes, E.; Muñoz-Organero, G. Morphometric analysis of grape seeds: Looking for the origin of Spanish cultivars. Seeds 2024, 3, 286–310. [Google Scholar] [CrossRef] [Scilit]
- Dong, Y.; Duan, S.; Xia, Q.; Liang, Z.; Dong, X.; Margaryan, K.; Musayev, M.; Goryslavets, S.; Zdunić, G.; Bert, P.-F.; et al. Dual domestications and origin of traits in grapevine evolution. Science 2023, 379, 892–901. [Google Scholar] [CrossRef] [Scilit] [PubMed]
- Lacombe, T.; Boursiquot, J.-M.; Laucou, V.; Di Vecchi-Staraz, M.; Péros, J.-P.; This, P. Large-scale parentage analysis in an extended set of grapevine cultivars (Vitis vinifera L.). Theor. Appl. Genet. 2013, 126, 401–414. [Google Scholar] [CrossRef] [Scilit] [PubMed]
- Zinelabidine, L.H.; Cunha, J.; Eiras-Dias, J.E.; Cabello, F.; Martínez-Zapater, J.M.; Ibáñez, J. Pedigree analysis of the Spanish grapevine cultivar “Hebén”. Vitis 2015, 54, 81–86. [Google Scholar] [CrossRef]
- Laucou, V.; Launay, A.; Bacilieri, R.; Lacombe, T.; Adam-Blondon, A.-F.; Bérard, A.; Chauveau, A.; De Andrés, M.T.; Hausmann, L.; Ibáñez, J.; et al. Extended diversity analysis of cultivated grapevine Vitis vinifera with 10K genome-wide SNPs. PLoS ONE 2018, 13, e0192540. [Google Scholar] [CrossRef] [Scilit] [PubMed]
- Cunha, J.; Zinelabidine, L.H.; Teixeira-Santos, M.; Brazão, J.; Fevereiro, P.; Martínez-Zapater, J.M.; Ibáñez, J.; Eiras-Dias, J.E. Grapevine cultivar “Alfrocheiro” or “Bruñal” plays a primary role in the relationship among Iberian grapevines. Vitis 2015, 54, 59–65. [Google Scholar] [CrossRef]
- Zinelabidine, L.H.; Haddioui, A.; Rodríguez, V.; Cabello, F.; Eiras-Dias, J.E.; Zapater, J.M.M.; Ibáñez, J. Identification by SNP analysis of a major role for Cayetana Blanca in the genetic network of Iberian Peninsula grapevine varieties. Am. J. Enol. Vitic. 2012, 63, 121–126. [Google Scholar] [CrossRef] [Scilit]
- Bonhomme, V.; Picq, S.; Gaucherel, C.; Claude, J. Momocs: Outline analysis using R. J. Stat. Softw. 2014, 56, 1–24. [Google Scholar] [CrossRef] [Scilit]
- Claude, J. Morphometrics with R; Springer: New York, NY, USA, 2008. [Google Scholar]
- Cervantes, E.; Tocino, A. Geometric analysis of Arabidopsis root apex reveals a new aspect of the ethylene signal transduction pathway in development. J. Plant Physiol. 2005, 162, 1038–1045. [Google Scholar] [CrossRef] [Scilit] [PubMed]
- Myles, S.; Boyko, A.R.; Owens, C.L.; Brown, P.J.; Grassi, F.; Aradhya, M.K.; Prins, B.; Reynolds, A.; Chia, J.-M.; Ware, D.; et al. Genetic structure and domestication history of the grape. Proc. Natl. Acad. Sci. USA 2011, 108, 3530–3535. [Google Scholar] [CrossRef] [Scilit] [PubMed]
- Zhou, Y.; Minio, A.; Massonnet, M.; Solares, E.; Lv, Y.; Beridze, T.; Cantu, D.; Gaut, B.S. The population genetics of structural variants in grapevine domestication. Nat. Plants 2019, 5, 965–979. [Google Scholar] [CrossRef] [Scilit] [PubMed]
- Waddington, C.H. Canalization of development and the inheritance of acquired characters. Nature 1942, 150, 563–565. [Google Scholar] [CrossRef] [Scilit]
- Debat, V.; David, P. Mapping phenotypes: Canalization, plasticity and developmental stability. Trends Ecol. Evol. 2001, 16, 555–561. [Google Scholar] [CrossRef] [Scilit]
- Meyer, R.S.; Purugganan, M.D. Evolution of crop species: Genetics of domestication and diversification. Nat. Rev. Genet. 2013, 14, 840–852. [Google Scholar] [CrossRef] [Scilit] [PubMed]
- Fuller, D.Q.; Denham, T.; Arroyo-Kalin, M.; Lucas, L.; Stevens, C.J.; Qin, L.; Allaby, R.G.; Purugganan, M.D. Convergent evolution and parallelism in plant domestication. Proc. Natl. Acad. Sci. USA 2014, 111, 6147–6152. [Google Scholar] [CrossRef] [Scilit] [PubMed]
- Gross, B.L.; Olsen, K.M. Genetic perspectives on crop domestication. Trends Plant Sci. 2010, 15, 529–537. [Google Scholar] [CrossRef] [Scilit] [PubMed]
- Crespan, M.; Milani, N. The Muscats: A molecular analysis of synonyms, homonyms and genetic relationships within a large family of grapevine cultivars. Vitis 2001, 40, 23–30. [Google Scholar] [CrossRef]
- Houel, C.; Martin-Magniette, M.-L.; Nicolas, S.D.; Lacombe, T.; Le Cunff, L.; Franck, D.; Torregrosa, L.; Conéjéro, G.; Lalet, S.; This, P.; et al. Berry size. Austr J. Grape Wine Res. 2013, 19, 208–220. [Google Scholar] [CrossRef] [Scilit]
- Xiao, H.; Wang, Y.; Liu, W.; Shi, X.; Huang, S.; Cao, S.; Long, Q.; Wang, X.; Liu, Z.; Xu, X.; et al. Impacts of reproductive systems on grapevine genome and breeding. Nat. Commun. 2025, 16, 2031. [Google Scholar] [CrossRef] [Scilit] [PubMed]
- Vitis International Variety Catalogue (VIVC). Available online: https://www.vivc.de (accessed on 24 June 2026).
- Hussain, Q.; Shi, J.; Scheben, A.; Zhan, J.; Wang, X.; Liu, G.; Yan, G.; King, G.J.; Edwards, D.; Wang, H. Genetic and signalling pathways of dry fruit size: Targets for genome editing-based crop improvement. Plant Biotechnol. J. 2020, 18, 1124–1140. [Google Scholar] [CrossRef] [Scilit] [PubMed]
- van Leeuwen, C.; Friant, P.; Choné, X.; Tregoat, O.; Koundouras, S.; Dubourdieu, D. Influence of climate, soil and cultivar on terroir. Am. J. Enol. Vitic. 2004, 55, 207–217. [Google Scholar] [CrossRef] [Scilit]
- van Leeuwen, C.; Seguin, G. The concept of terroir in viticulture. J. Wine Res. 2006, 17, 1–10. [Google Scholar] [CrossRef] [Scilit]
- Gambetta, G.A.; Herrera, J.C.; Dayer, S.; Feng, Q.; Hochberg, U.; Castellarin, S.D. The physiology of drought stress in grapevine: Towards an integrative definition of drought tolerance. J. Exp. Bot. 2020, 71, 4658–4676. [Google Scholar] [CrossRef] [Scilit] [PubMed]

Disclaimer/Publisher’s Note: The statements, opinions and data contained in all publications are solely those of the individual author(s) and contributor(s) and not of MDPI and/or the editor(s). MDPI and/or the editor(s) disclaim responsibility for any injury to people or property resulting from any ideas, methods, instructions or products referred to in the content. |
© 2026 by the authors. Licensee MDPI, Basel, Switzerland. This article is an open access article distributed under the terms and conditions of the Creative Commons Attribution (CC BY) license.