


Highlights
What are the main findings?
- A natural-scene Wuyi rock-tea shoot dataset was constructed across four cultivars, covering occlusion, illumination variation, scale changes, and branch/stem interference.
- YOLO11s-CSNG integrated CSFEB, NWD, and GhostConv and produced small, statistically non-significant numerical increases in mean mAP@0.5 across five matched seeds on the validation and internal test sets.
- TensorRT FP16 evaluation on Jetson Xavier NX showed that the model was compatible with edge-device inference without increasing model-only inference times.
What are the implications of the main findings?
- Under the present sampling conditions, YOLO11s-CSNG offers a compact visual component for candidate shoot detection in Wuyi rock-tea plantation images.
- Multi-season, multi-site, and system-level evaluation can further extend this detector toward plantation monitoring and selective-harvesting pipelines.
Abstract
Accurate field detection of candidate tea shoots could support plantation monitoring, yield estimation, fresh-leaf assessment, and future selective-harvesting research. Wuyi rock-tea shoots are small and slender, have weak visual boundaries, and are easily confused with branches, petioles, and complex canopy backgrounds. Here, we developed YOLO11s-CSNG for candidate shoot detection in natural plantation scenes. The model combines a channel-spatial feature enhancement bottleneck, a normalized Wasserstein distance constraint for bounding-box regression, and ghost convolution layers in the detection head. We evaluated the model through detector comparisons, module ablations, and repeated training with five matched random seeds on a natural-scene dataset containing four Wuyi rock-tea cultivars. Across the five matched seeds, the mean mAP@0.5 increased from 67.37 ± 0.91% to 67.97 ± 0.90% on the validation set and from 61.29 ± 0.40% to 61.88 ± 0.66% on the internal test set. Neither paired difference was statistically significant: The 95% confidence intervals included zero, and the exact two-sided paired-permutation p values were 0.375 and 0.250, respectively. The mean mAP@0.5:0.95 did not improve. YOLO11s-CSNG retained a model size and model-only edge-inference time comparable to YOLO11s, providing a compact design for candidate shoot-region detection under the sampled field conditions.
1. Introduction
Wuyi rock tea is a regionally important northern Fujian oolong tea produced from cultivars of Camellia sinensis, and its growth and quality are influenced by cultivars and the production environment [1,2]. Recent official statistics valued the Wuyishan tea-industry chain at RMB 13.5 billion—approximately USD 1.9 billion—with the sector accounting for nearly 50% of local farmers’ per capita income [3]. In precision horticulture, reliable candidate-shoot perception could support fresh-leaf inspection, yield estimation, selective-harvesting decisions, and plantation management [4,5,6,7]. The candidate targets examined here were open Wuyi rock-tea shoots with extended contours and complex shoot–leaf connections; in field images, they frequently overlapped mature leaves, branches, and the canopy background. Reviews of robotic harvesting for high-value crops identify occlusion, crop variability, and background interference as persistent constraints in unstructured agricultural scenes [8]. Perception is also closely coupled to spatial understanding and subsequent task decisions in selective harvesting systems [4]. Field evaluations of a robotic apple harvester documented visual-detection failures associated with occluded fruits [9]. Motion-planning analysis for sweet-pepper harvesting further shows that dense canopies create constrained obstacle environments for robotic operation [10]. Target visibility and localisation accuracy therefore remain important constraints in horticultural vision systems [11]. Accordingly, this study is limited to two-dimensional bounding-box detections of rock-tea shoots in natural plantation images, with emphasis on candidate detection and box-level localisation.
Deep learning approaches have extended tea-shoot perception from bounding-box detection to keypoint localisation, three-dimensional localisation, and multi-cultivar analysis. A YOLO-based keypoint-localisation network demonstrated joint tea-shoot detection and keypoint localisation within a deep learning framework [12]. RGB-D studies of in-field shoot detection and three-dimensional localisation found that illumination changes, occlusion, small targets, and dense growth jointly complicate plantation perception [5]. Multi-cultivar studies examined tea-shoot detection and picking-point localisation in complex backgrounds across different varieties [13]. Cultivar composition and training settings affect field-image detection performance in ways that dataset-scale comparisons alone do not capture [14]. End-to-end feature learning has become the dominant approach for handling object-scale variation and natural backgrounds in agricultural deep learning [15]. Dataset construction, object scale, multimodal fusion, and feature extraction remain central challenges in horticultural crop perception [16]. Rock-tea shoot detection therefore requires stable fine-grained features in complex canopies rather than simplified backgrounds or single handcrafted rules.
Recent tea-shoot detection research has increasingly targeted small objects, weak boundaries, and informative local regions [17,18,19,20,21]. Apple-orchard segmentation studies emphasised that fruit recognition in canopies must account for occlusion and background complexity [22]. Monocular instance segmentation of sweet peppers links two-dimensional segmentation with subsequent fruit positioning [23]. MangoYOLO benchmarking highlighted the need to evaluate detection accuracy together with inference speed and computational demand [24]. A two-stage network combining YOLOv3 and DenseNet201 addressed tea-shoot detection and grade classification, with imaging angle emerging as a key source of variation [25]. Tea-shoot detection has also been integrated with yield estimation for early production assessment [6]. A top-view transformer framework used gradient-guided attention and position-sensitive loss to improve localisation of tiny shoots with weak boundaries [17]. Pose-estimation-guided CNNs handle colour similarity, morphological inconsistency, dense distribution, and mutual occlusion in natural plantations [18]. Anchor-free detection with graph reasoning exploits geometric relationships for dense tea-shoot detection and picking-point identification [19]. Multimodal large models may extend agricultural perception towards multi-source information and scene knowledge, though practical resource requirements remain an important constraint [26].
The YOLO family has become a widely used approach for tea-shoot detection because of its efficient one-stage inference and compact architecture [20,21,27,28,29]. An improved YOLOv4 network reduced computational demand while maintaining shoot-detection accuracy in complex agricultural environments [27]. Ghost convolution (GhostConv), BAM attention, and weighted feature fusion have been incorporated into YOLOv5 to address computational redundancy, background suppression, and low- and high-level feature fusion, respectively [28]. Detection and picking-sequence planning in high-density tea canopies face particular challenges with crowded targets and occlusion [7]. Tea Bud DG used the scale-, spatial-, and task-aware components of Dynamic Head with an adaptive loss to enhance shoot features and bounding-box regression [20]. Comparisons of SE, ECA, CBAM, and CA attention in YOLOv7 found CBAM performing well under dense, occluded, and small-object conditions [29]. Depth-camera systems combined improved YOLOv5 detection with pose-vertex search, extending tea-shoot vision from recognition to spatial-structure perception [30]. RT-DETR-Tea introduced cascaded group attention for intra-scale feature interaction together with a separate cross-scale fusion design for multi-cultivar detection [31]. RFA-YOLOv8 combined RFCAConv and SPPFCSPC to improve tea-shoot detection under complex orchard illumination [21]. Gated attention encoding in SpikeYOLO enriched the spatiotemporal information carried by spike inputs [32]. Related defect-detection work on bamboo strips highlighted the need to discriminate targets from locally similar background patterns [33]. Spatial-frequency enhancement demonstrated that combining spatial- and frequency-domain representations can improve image-detail modelling [34].
Despite this progress, most studies report aggregate improvements at the full-model level. The relationships among channel-spatial responses, bounding-box regression sensitivity, and detection-head redundancy remain insufficiently examined for slender small targets. An improved YOLOv7 network for multi-scale, multi-target tea-shoot and leaf detection further suggests that scale variation requires task-specific architectural adaptation [35]. Multi-scale convolutional block attention has also been applied to tea-shoot detection under complex backgrounds [36]. CNN-based tea-shoot keypoint localisation supports explicit modelling of local shoot structure [37]. Reviews of YOLO development identify feature fusion, detection-head design, loss functions, and efficiency as major directions of architectural evolution [38]. Broader object-detection reviews trace the transition from convolutional detectors to transformer-based architectures and their complementary representation mechanisms [39]. A system integrating YOLOv4-lighted, ICBAM, and RGB-D sensing further illustrates the combined use of visual detection, attention, and depth information in complex plantations [40].
Accordingly, the scientific objective of this study was to determine whether coordinated changes to feature representation, bounding-box regression, and detection-head feature generation could improve candidate-level detection of small, slender rock-tea shoots in natural plantation scenes while retaining a compact model. We tested the expectation that, relative to YOLO11s, the resulting YOLO11s-CSNG configuration would produce a higher mean mAP@0.5 across repeated training runs and on the internal test set without a material increase in model size or edge-device inference time. The task was defined as the discovery of candidate shoot regions. Accordingly, mAP@0.5 was the primary evaluation and model-selection metric. Precision, recall, F1, and mAP@0.5:0.95 were secondary measures of false-positive, missed-detection, and stricter-localisation trade-offs. The main contributions are as follows:
- We constructed a natural-scene dataset for Wuyi rock-tea shoot detection as a field-perception resource for oolong tea plantation monitoring. It covers branch and leaf occlusion, strong light and shadow, distance-dependent scale variation, depth-of-field differences, and confusion with branches and stems. The dataset supports analysis of slender shoot morphology and interference from similar linear backgrounds.
- We developed a channel-spatial feature enhancement bottleneck (CSFEB), a channel-spatial feature refinement module embedded within the bottleneck. The channel enhancement block (CEB) and spatial response enhancement (SRE) participate directly in C3k2 feature generation. CEB recalibrates channel responses under branch–stem confusion, whereas SRE enhances informative regions across foreground–background depth layers, thereby strengthening local shoot features before hierarchical abstraction.
- We integrated CSFEB, normalized Wasserstein distance (NWD), and GhostConv into YOLO11s-CSNG and examined their conditional effects through a three-factor ablation and repeated-seed validation. Under the fixed evaluation protocol, the final model balances candidate detection with acceptable complexity, supporting its use as a compact visual component for candidate shoot detection under the present evaluation protocol.
2. Materials and Methods
2.1. Dataset Construction
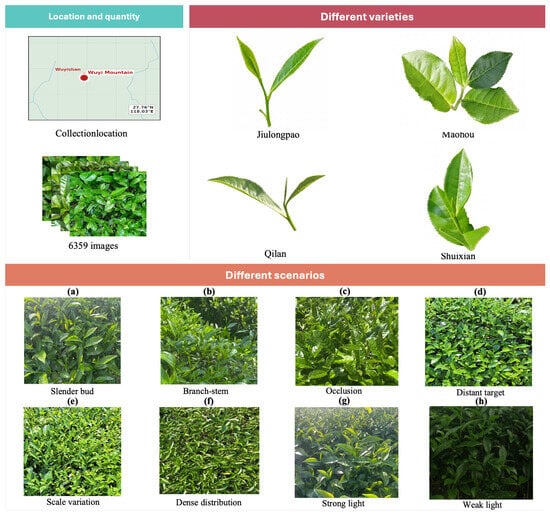
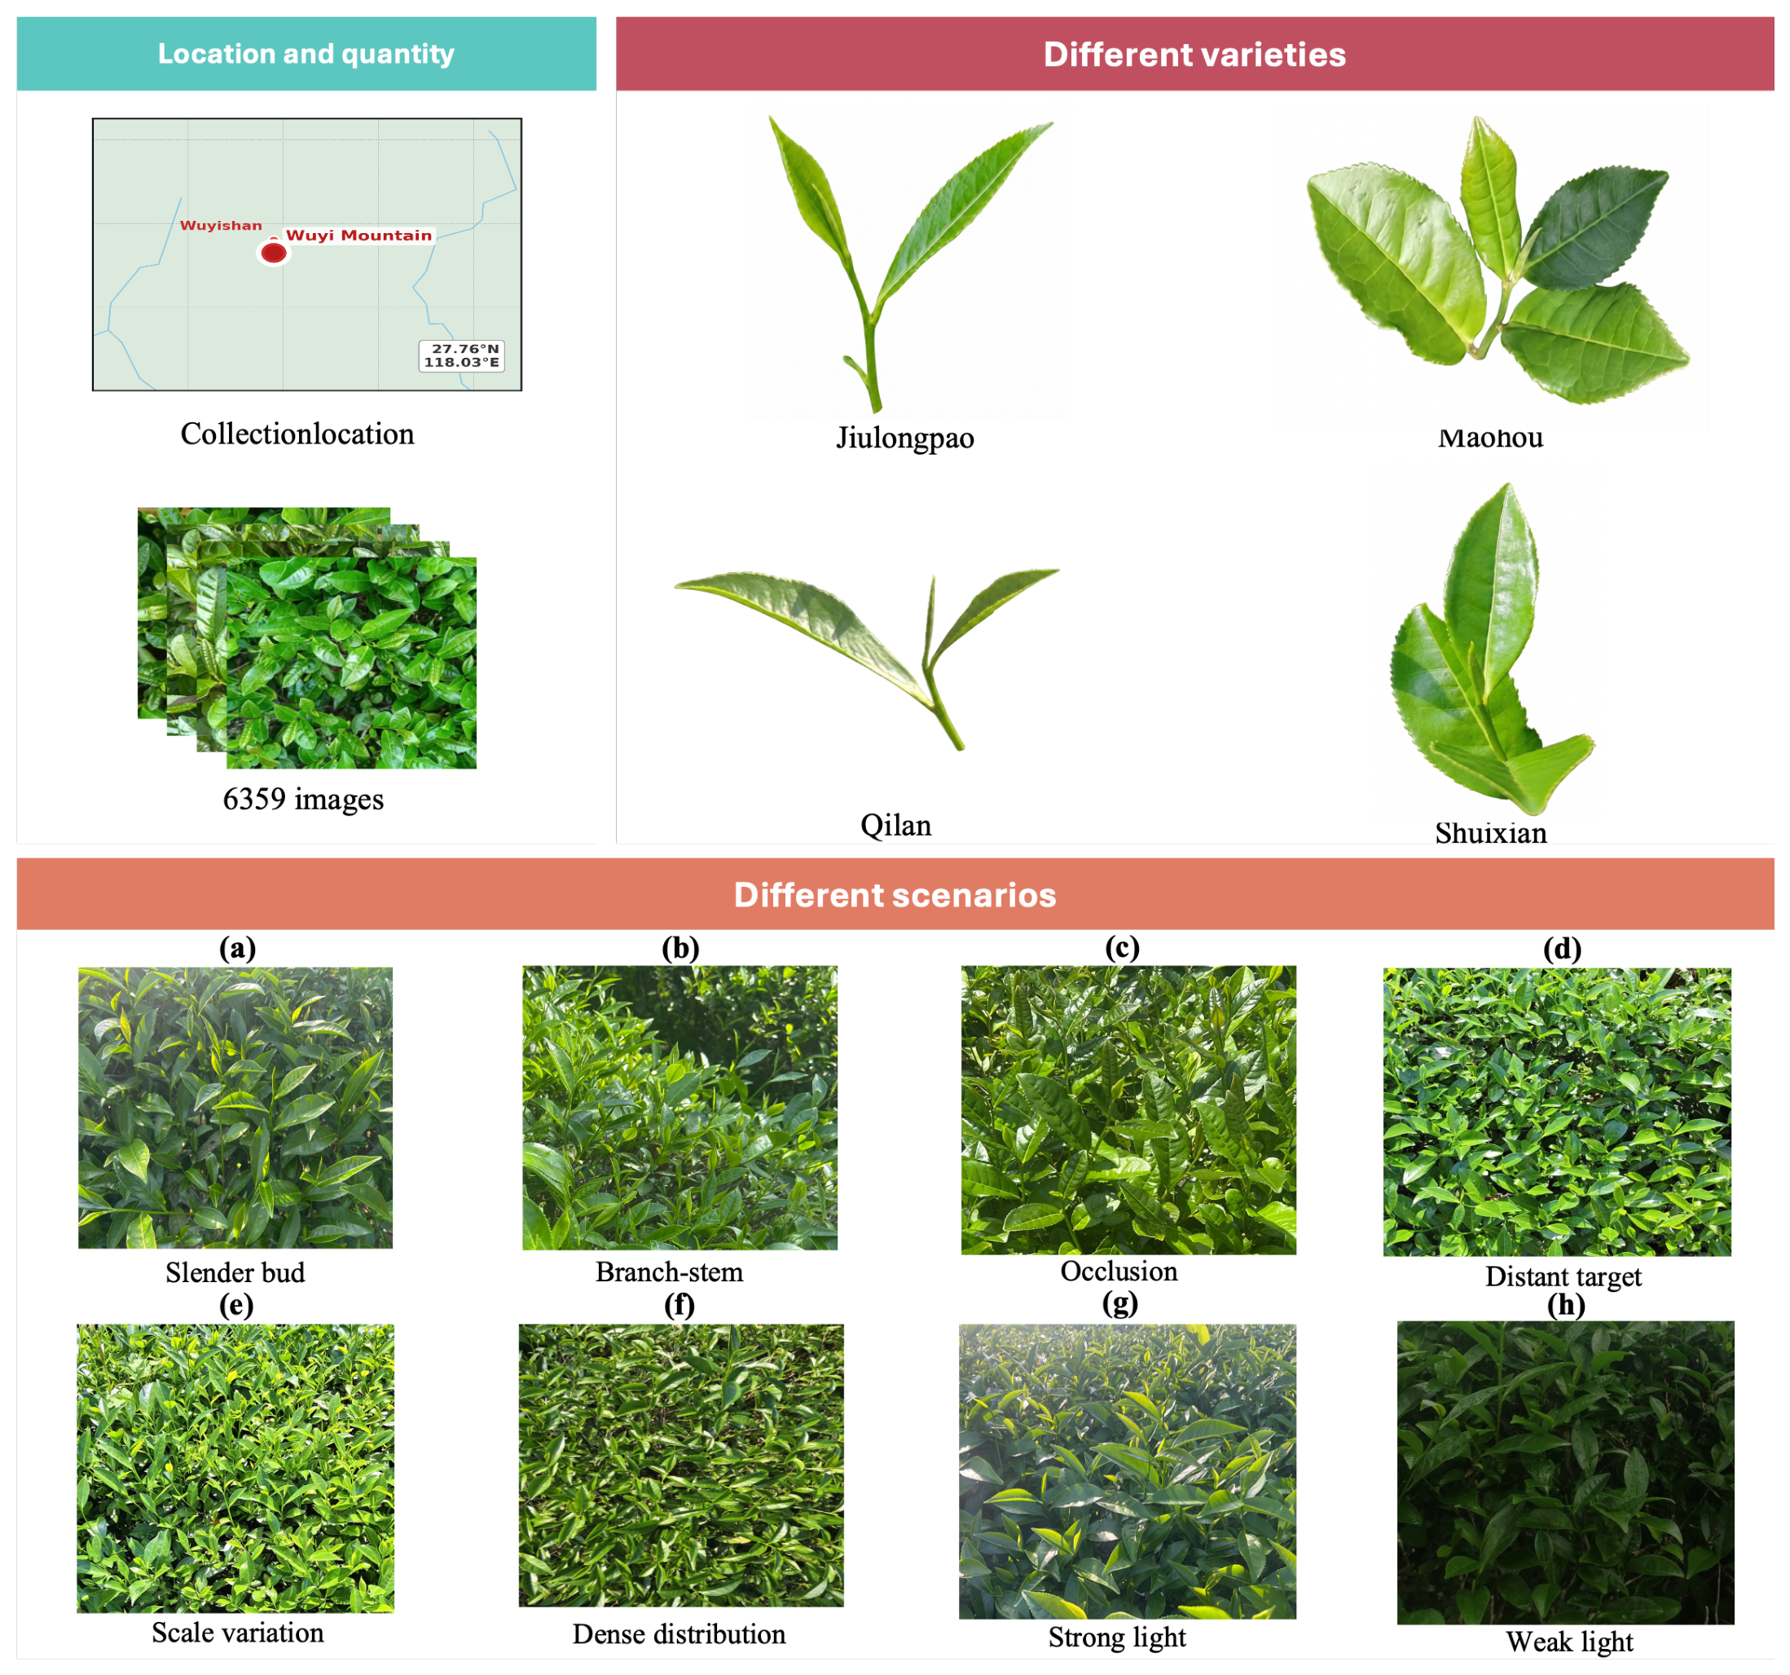
The dataset comprised four Wuyi rock-tea cultivars sampled in Wuyishan. The sampled cultivars were Camellia sinensis ‘Jiulongpao’, Camellia sinensis ‘Maohou’, Camellia sinensis ‘Qilan’, and Camellia sinensis ‘Shuixian’. Data were collected at several plantation locations and times from 1 to 4 May 2025. Multiple operators acquired the field images in standard RGB photography modes using an Apple iPhone 15 Pro (Apple Inc., Cupertino, CA, USA), Huawei nova 13 and Pura 70 smartphones (Huawei Technologies Co., Ltd., Shenzhen, China), and Xiaomi 14 and Redmi K80 smartphones (Xiaomi Corporation, Beijing, China). A unified camera-parameter protocol was used across devices, including consistent aperture ratio, white balance, and other exposure-related settings. The collection included variations in illumination, camera angle, and target scale and yielded 4750 original images. Representative acquisition conditions and complex field scenes are shown in Figure 1.
Figure 1.
Data collection and representative complex scenes for Wuyi rock-tea shoots. The upper-left panel shows the collection location and the final set of 6359 cropped images. The upper-right panel presents natural-canopy examples of C. sinensis ‘Jiulongpao’, C. sinensis ‘Maohou’, C. sinensis ‘Qilan’, and C. sinensis ‘Shuixian’. Panels (a–h) show slender shoots, branch or stem interference, occlusion, distant small targets, scale variation, dense distribution, strong illumination, and low-light conditions, respectively.
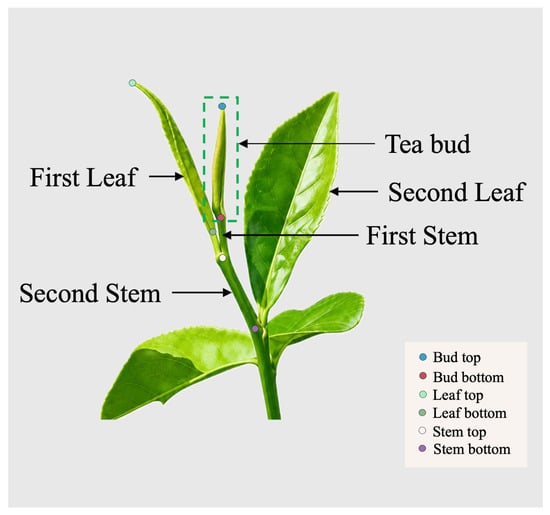
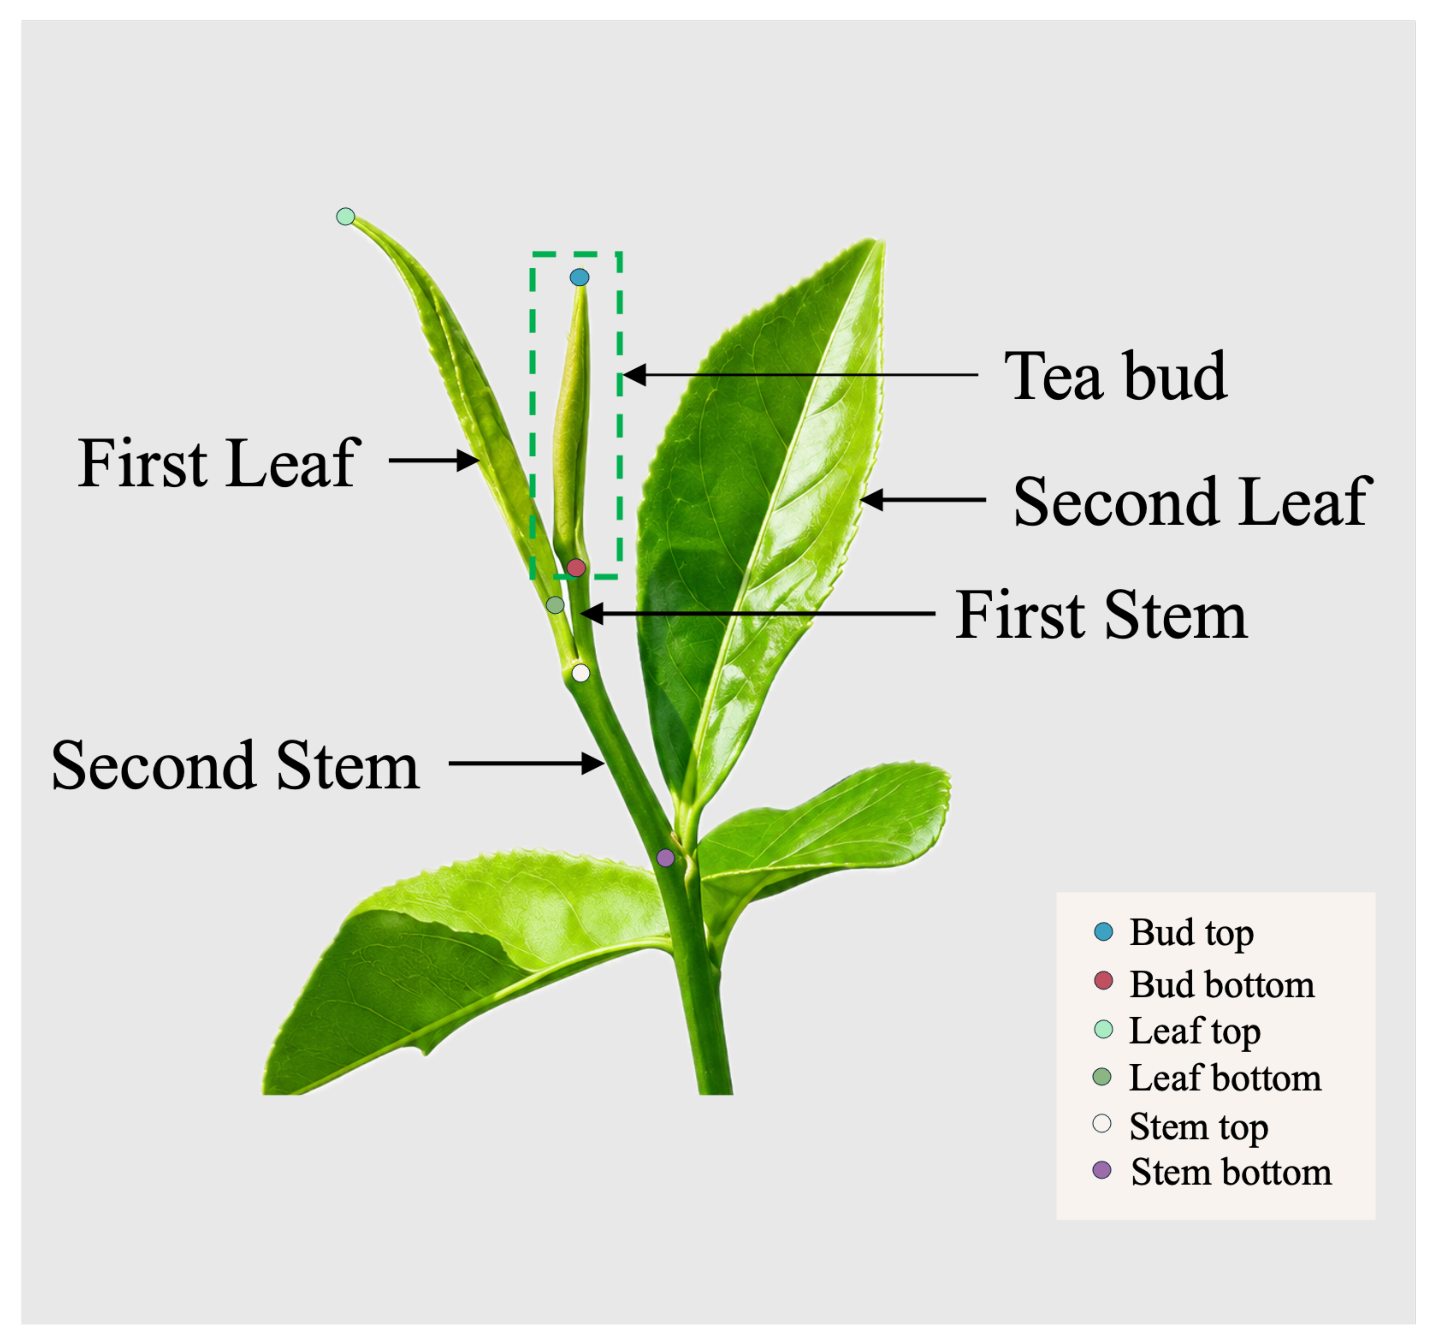
All four cultivars were sampled using the same visual target criterion. The selected shoots were at comparable developmental stages during the collection period. No fixed morphological rule specified the number of leaves per bud; targets were visually identifiable young shoots that met the annotation criteria shown in Figure 2. Formal cultivar-specific phenological-stage scores were not recorded. Residual developmental differences among cultivars may therefore have influenced shoot appearance and detection difficulty.
Figure 2.
Bounding-box annotation protocol for rock-tea shoots. Reference points include the shoot top, shoot bottom, leaf top, leaf bottom, stem top, and stem bottom. The green dashed box indicates the complete candidate region.
Annotation was based on the visible shoot. Bounding boxes were assigned only to foreground shoots whose identity and visible extent could be reliably determined. Partially occluded shoots, small but identifiable distant shoots, branch or stem interference, illumination variation, and dense canopy backgrounds were retained when a consistent visible bounding box could be defined. Targets were excluded only when severe blur, heavy occlusion, or indistinct distant appearance made the shoot identity or bounding-box extent unreliable.
Three trained annotators, including the first author, annotated the images using the common visual target and bounding-box criteria illustrated in Figure 2. The first author subsequently reviewed every annotated image and revised or re-annotated boxes that did not meet these criteria. Images were not independently double-annotated, so formal inter-annotator agreement and bounding-box IoU were not calculated. Annotation quality control therefore comprised common training followed by full-dataset adjudication by the first author.
During preprocessing, 1080 × 1080-pixel regions were used as cropping units. Each crop was centred on the target when sufficient surrounding pixels were available. Near image boundaries, the crop window was shifted to retain the complete target while maintaining a fixed output size. Adjacent windows were allowed to overlap to avoid truncating targets near crop boundaries. Data were split at the original-image level: The 4750 original images were assigned to the training, validation, and test subsets before region-of-interest crops were generated. All overlapping crops derived from a given original image remained in the same subset, preventing near-duplicate leakage across subsets. This process produced 6359 cropped images. The dataset contained 13,775 valid bounding boxes. The training, validation, and test subsets contained 10,852 boxes in 5011 images, 1227 boxes in 610 images, and 1696 boxes in 738 images, respectively. The natural cultivar imbalance comprised 2971 C. sinensis ‘Jiulongpao’ boxes in 1583 images, 5485 C. sinensis ‘Maohou’ boxes in 2349 images, 3611 C. sinensis ‘Qilan’ boxes in 1556 images, and 1708 C. sinensis ‘Shuixian’ boxes in 871 images. Tiny objects smaller than 32 × 32 pixels represented 44.0% of all boxes, and small objects from 32 × 32 to 96 × 96 pixels represented 52.4%. Objects larger than 96 × 96 pixels accounted for only 3.6%. Bounding boxes with aspect ratios below 1.5, from 1.5 to 2.5, and at least 2.5 accounted for 24.9%, 43.0%, and 32.1%, respectively. These distributions reflect the small and frequently elongated geometry of open oolong tea shoots. No cultivar-specific weighting or oversampling was applied because all annotated shoots were treated as a single detection class and cultivar identity was not included in the loss function. Data were split at the original-image level. The natural cultivar composition was retained, and cultivar-stratified sampling was not applied. Consequently, the pooled metrics reflect the observed sample distribution. Cultivar-specific results and an equally weighted cultivar-macro evaluation were additionally conducted to assess performance across the four cultivars. The training set was used for parameter learning, whereas the validation set supported architecture selection, module ablation, and parameter comparison. The test set was excluded from training, architecture selection, and hyperparameter adjustment and was used only for the final assessment of representative models on internally held-out data.
2.2. YOLO11s Baseline
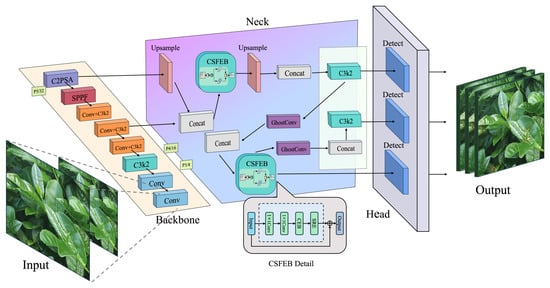
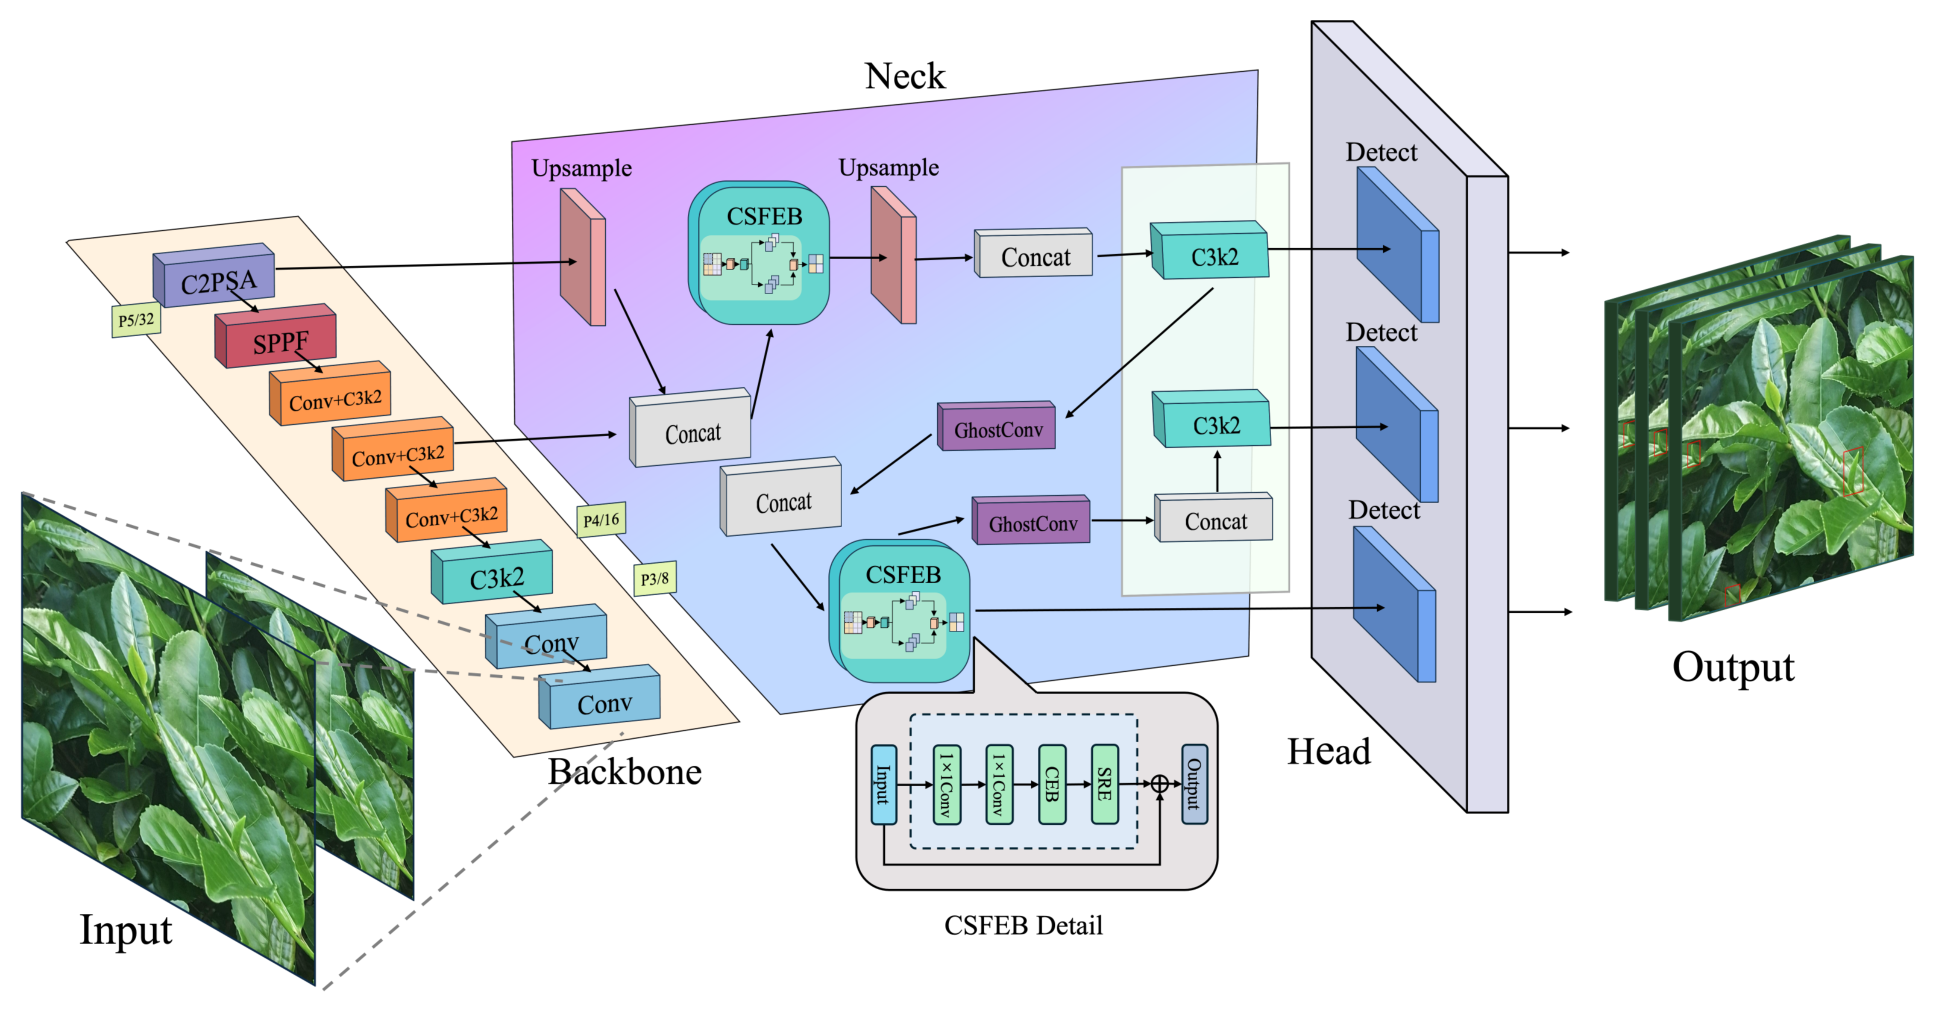
YOLO11 extends the YOLO family of object detectors and comprises a backbone, neck, and detection head for feature extraction, multi-scale fusion, and prediction, respectively. The backbone extracts hierarchical representations through convolution and downsampling. The neck fuses features across scales, and the detection head performs classification and bounding-box regression. Modules including Conv, C3k2, SPPF, C2PSA, Concat, and Detect support local feature extraction, receptive-field expansion, and cross-layer fusion while maintaining computational efficiency. Rock-tea shoots are typically small and slender; have weak visual boundaries; and are affected by occlusion, illumination changes, and similar background textures. Their detection therefore requires shallow textural and edge cues together with deeper semantic features. The multi-scale architecture of YOLO11 provides a suitable baseline for these conditions. YOLO11 variants differ in depth, width, and parameter count, producing different trade-offs among representation capacity, model size, computation, and inference efficiency. YOLO11n has lower computational costs but more limited feature capacity, whereas YOLO11m offers stronger feature extraction at greater parameter and computational cost. Rock-tea shoot detection requires discrimination of small, weak-boundary targets from similar backgrounds while retaining potential for field deployment. We therefore selected YOLO11s as the baseline. It provides greater feature capacity than YOLO11n and lower model and computational cost than YOLO11m. Their empirical performance is compared in Section 3.
2.3. Improved YOLO11s-CSNG Model
Based on the preceding description of the YOLO11 architecture and the selection of YOLO11s as the baseline model, we further developed the improved YOLO11s-CSNG model. Although YOLO11s provides a favourable balance among model size, inference efficiency, and multi-scale detection capability, its original structure remains a general-purpose object detection framework and does not explicitly model the elongated morphology, weak boundaries, small-object localisation requirements, or interference from visually similar branches, stems, and petioles in rock-tea shoot detection.
In complex tea-canopy images, the local textures, edge contours, and spatial cues of young shoots can be weakened during successive downsampling and semantic abstraction. This can lead to missed detections, false detections, and localisation deviations in occluded regions, distant small targets, and visually similar linear backgrounds. Meanwhile, small-scale bounding boxes are sensitive to slight positional shifts. When regression relies only on conventional IoU-based losses, training can be affected by fluctuations in the box-overlap ratio. These observations motivated targeted improvements to feature representation, bounding-box regression, and the detection head while controlling model complexity.
The resulting YOLO11s-CSNG architecture is shown in Figure 3.
Figure 3.
Overall architecture of YOLO11s-CSNG. CSFEB is embedded in the C3k2 bottleneck, NWD supplements bounding-box regression, and GhostConv provides low-cost feature generation in the detection head. Dashed lines and outlines indicate enlarged structural details, red boxes denote detected candidate shoots, and colors distinguish functional module types.
2.3.1. Channel-Spatial Feature Enhancement Bottleneck
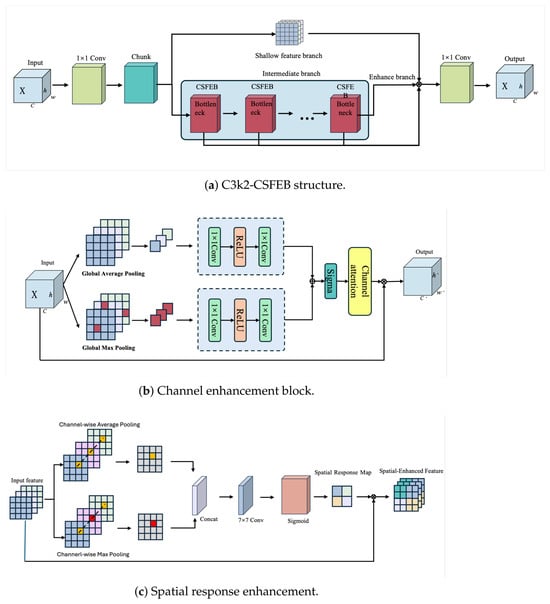
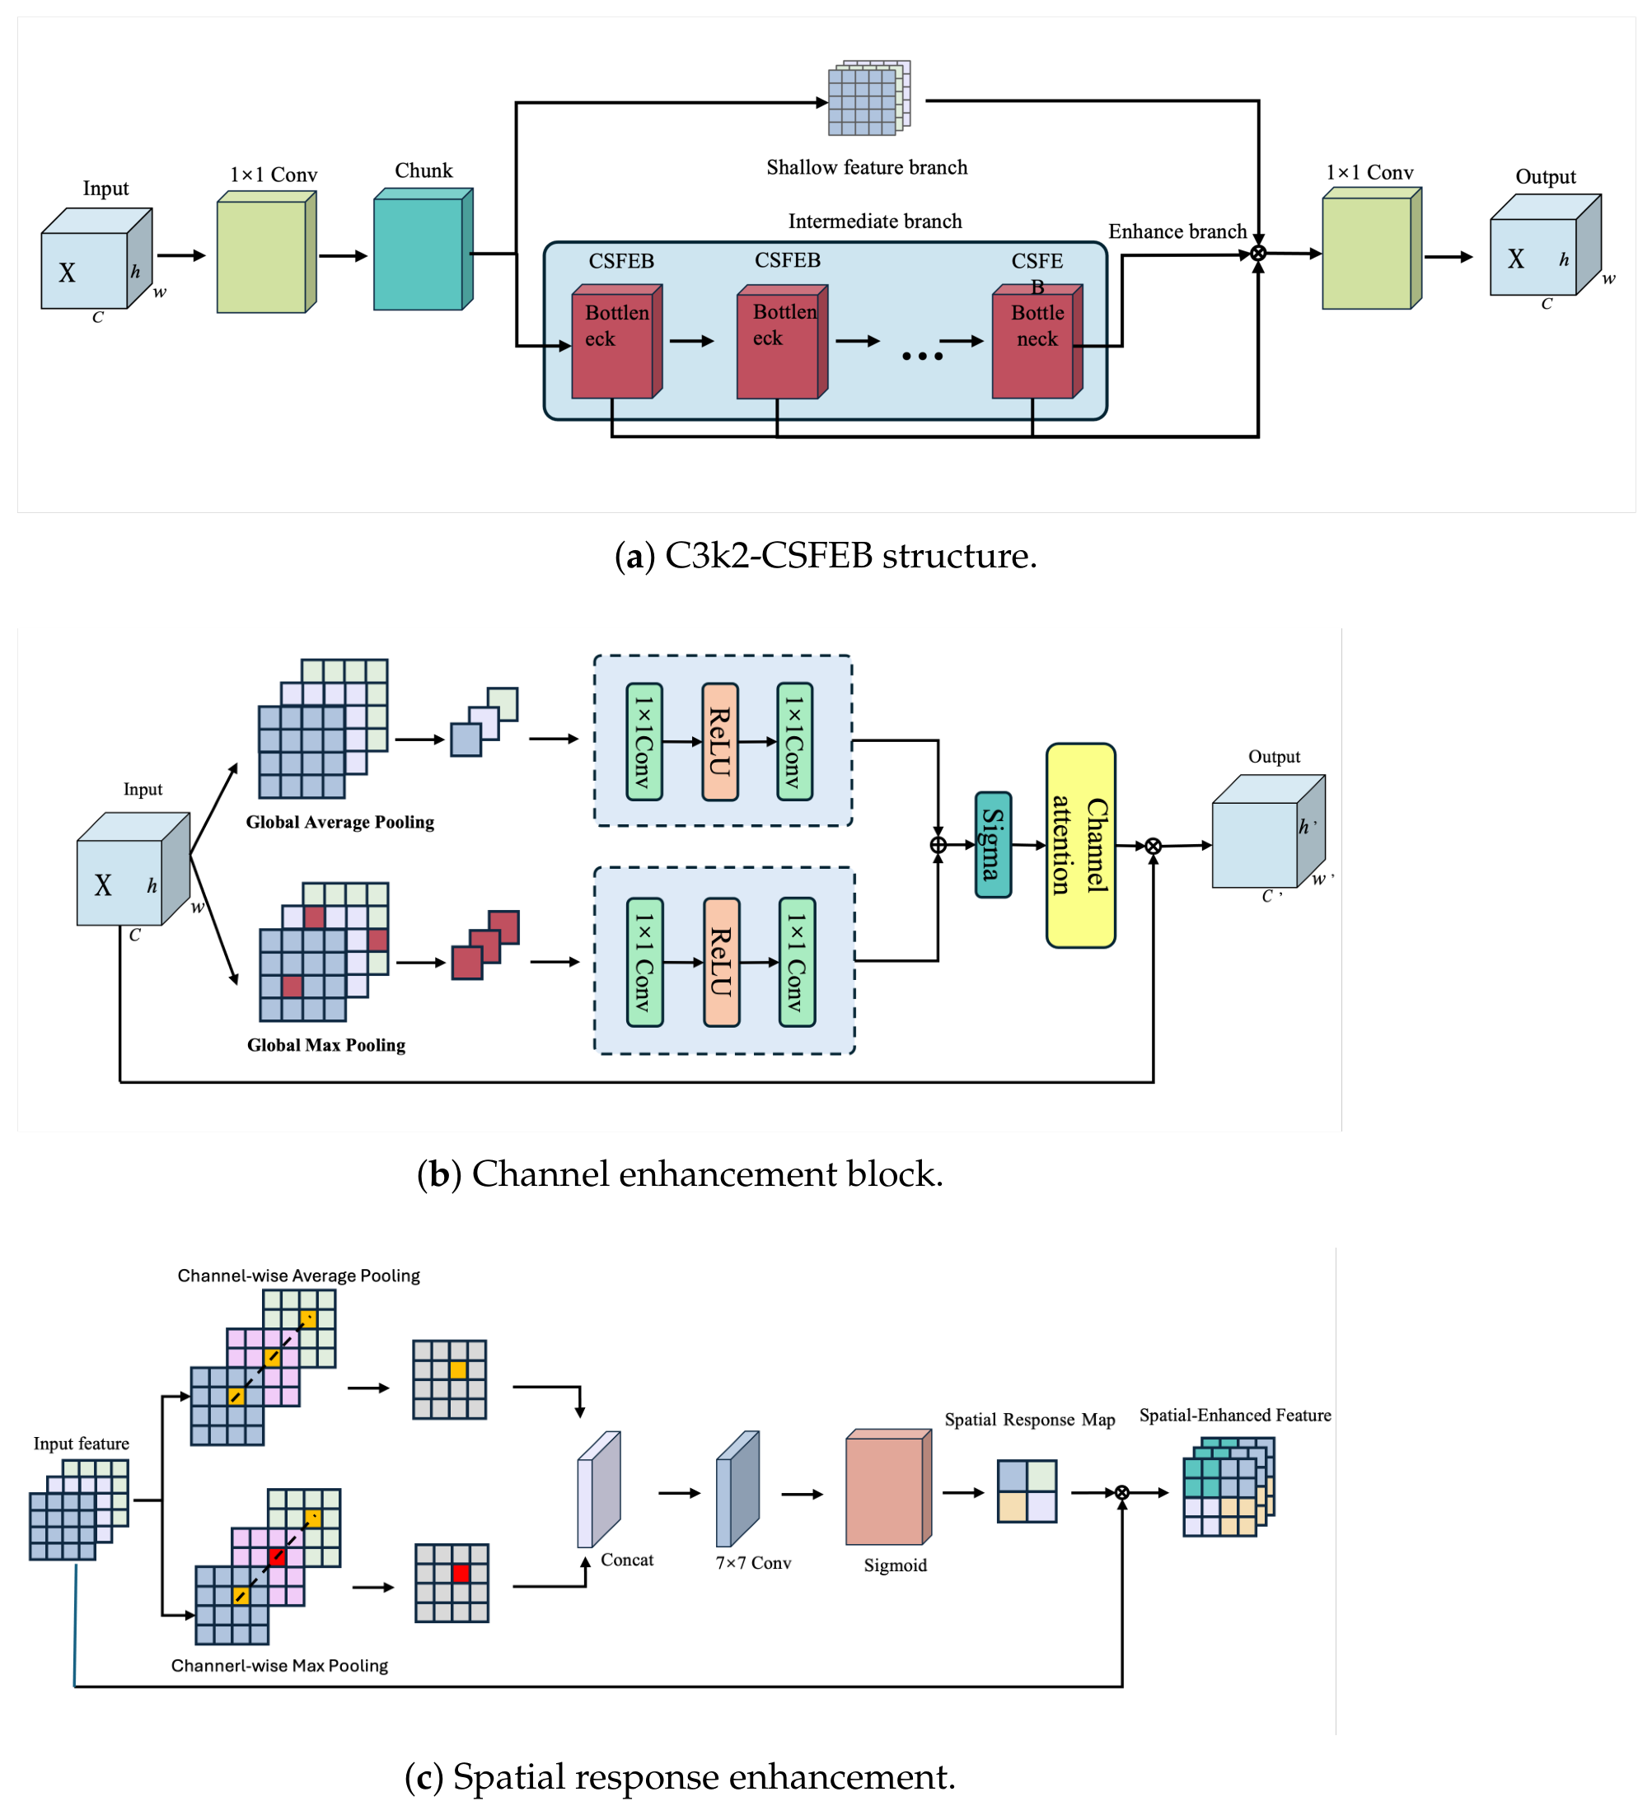
False and missed detections of rock-tea shoots often arise from insufficient local discrimination. The targets are small and slender and visually resemble branches, leaves, and shadowed regions. Conventional convolutions extract edges, textures, and semantics using shared local receptive fields, but this task requires stable separation among highly similar linear structures. Shallow texture and edge information is particularly important because shoots are frequently small and partly occluded. Attention modules commonly recalibrate channels or spatial locations after feature generation. When attached externally, however, they participate less directly in bottleneck feature formation. Weak-boundary shoots may benefit from earlier separation of target responses from branch and stem interference before high-level abstraction. We constructed the channel-spatial feature enhancement bottleneck (CSFEB) by combining a channel enhancement block (CEB) with a spatial response enhancement (SRE) branch and embedding them within C3k2 to form C3k2-CSFEB, replacing the C3k2 modules at layers 13 and 19. The CEB design was adapted from the channel enhancement block in SFMFusion [34]. SRE uses the dual channel-statistic pooling and spatial-gating principle of the convolutional block attention module [41]; we implemented this branch for the present detector using channel-wise mean and maximum responses, a 7 × 7 convolution, and sigmoid weighting. The contribution of CSFEB therefore lies in the task-specific combination of CEB and SRE within C3k2 bottleneck feature generation rather than in claiming either attention operation as an independently novel operator. Global average and maximum pooling in CEB model channel dependencies and generate weights that emphasise semantic channels associated with shoots. In SRE, the mean and maximum responses form two H × W spatial descriptors. Their concatenation is processed by the spatial convolution and sigmoid function and then multiplied element-wise with the input. Mean responses describe the overall spatial distribution, whereas maximum responses emphasise locally salient regions. Unlike externally attached attention modules, CSFEB places channel and spatial enhancement inside the bottleneck so that both branches participate in intermediate feature generation, transmission, and concatenation. CEB and SRE are formulated as follows:
Here, X is the input feature tensor; is the channel-enhanced feature tensor; and denote global average and maximum pooling, respectively; is the shared multilayer-perceptron mapping; is the sigmoid activation; ⊗ denotes element-wise multiplication.
Here, is the channel–spatially enhanced feature tensor; and calculate the mean and maximum along the channel dimension, respectively; is a spatial convolution with a kernel; the semicolon inside the brackets denotes channel-wise concatenation. The subscript identifies the channel dimension.
The CSFEB bottleneck output is as follows:
Here, Y is the output of the CSFEB bottleneck, and + denotes the residual element-wise addition of the input X and the enhanced feature tensor .
Rather than adding post hoc attention, CSFEB introduces channel-spatial refinement within the bottleneck, where it contributes to local convolutional feature generation and subsequent multi-branch fusion. This embedded design is evaluated under complex rock-tea shoot conditions in the Results section. The architecture and branch structure of CSFEB are shown in Figure 4.
Figure 4.
CSFEB architecture and branch structures. The branches participate in bottleneck feature generation and strengthen channel and spatial responses in candidate shoot regions. The ellipsis in (a) denotes repeated CSFEB bottlenecks; dashed outlines in (b) indicate grouped transformation branches, dashed paths in (c) illustrate the pooling routes, and colors distinguish feature and operation types.
2.3.2. NWD Constraint for Small-Object Bounding-Box Regression
Localisation errors depend not only on whether the model detects a shoot but also on the sensitivity of small bounding boxes to pixel displacement. Slight translation or scaling of a small, elongated prediction can markedly change IoU. GIoU extends regression signals to non-overlapping boxes [42], and DIoU explicitly constrains the distance between predicted and ground-truth centres [43]. Nevertheless, small boxes remain sensitive to minor shifts, particularly under branch occlusion, strong illumination, shadows, and foreground–background similarity. Motivated by the NWD metric of Xu et al. [44], we incorporated the resulting NWD term as a supplementary regression constraint and represented predicted and ground-truth boxes as two-dimensional Gaussian distributions. Their distance term is
Here, and are the predicted and ground-truth bounding boxes, respectively; and are their centre coordinates; and are the width and height of ; and are the width and height of ; is the squared second-order Wasserstein distance under the Gaussian-box representation. The subscripts and denote predicted and ground-truth quantities.
The normalised NWD similarity is
Here, is the normalised Wasserstein similarity; is the exponential function; is the normalisation constant; is the numerical-stability term, consistent with the implementation.
The NWD localisation loss is
Here, is the weighted NWD localisation loss; i indexes the matched foreground samples; and are the paired predicted and ground-truth boxes for sample i; is the sample weight derived from the target-matching score.
Unlike IoU-based losses, which depend mainly on overlap, NWD jointly considers centre displacement and differences in width and height, providing a smoother constraint for small objects. The relative weights of NWD and the original IoU-based regression term were treated as an experimental factor. The results for different NWD-CIoU mixtures are reported together in the ablation experiments; this section defines only the regression formulation.
2.3.3. Efficient GhostConv Feature Generation in the Detection Head
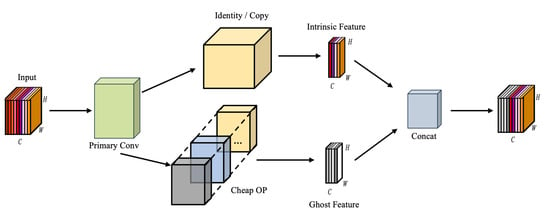
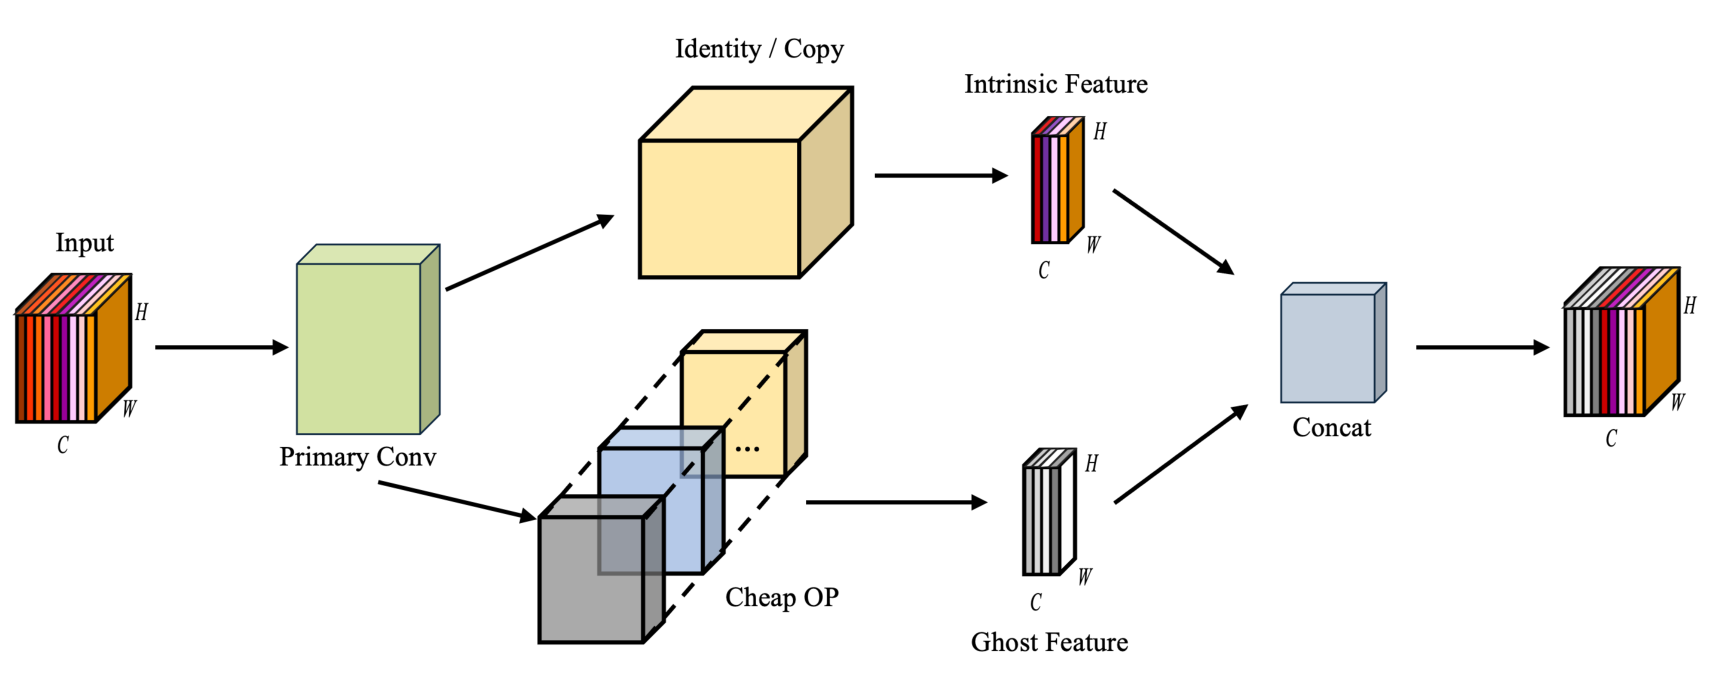
Increasing detection accuracy in complex agricultural scenes often requires stronger feature representations, but such enhancement can increase parameters, computation, and model size. Rock-tea shoot detection requires robustness to occlusion, illumination variation, and similar backgrounds while retaining a compact model. Excessive architectural expansion could reduce feasibility for inspection devices or harvesting-assistance systems. CSFEB strengthens representations of shoot texture, edges, and informative spatial regions but introduces some additional complexity. The detection head follows multi-scale fusion and directly performs classification and regression, making its feature transformations important to final predictions. GhostConv follows the low-cost feature-generation principle introduced in GhostNet [45]: A primary convolution generates intrinsic feature maps, and a low-cost depthwise convolution derives supplementary feature maps from them. GhostNetV2 subsequently extended this model family with long-range attention [46]. These architectures support efficient feature generation in compact networks. Tea shoots, branches, veins, and weeds all contain elongated structures, and excessive repetition in detection-head features may strengthen similar background responses. We therefore introduced GhostConv into the detection head to adjust redundant feature generation while retaining compactness. For an input feature tensor X, GhostConv first uses the primary convolution branch to generate half of the requested output channels as intrinsic features:
Here, X is the real-valued input feature tensor; denotes the set of real numbers; , H, and W are the input channel count, height, and width, respectively; is the requested output channel count; is the number of intrinsic feature channels; is the floor operation. The descriptive subscripts and denote inputs and outputs.
Here, is the intrinsic feature tensor produced by the primary convolution; denotes a convolution with kernel size ; and are the resulting spatial height and width, respectively.
A 5 × 5 depthwise separable convolution then generates ghost feature maps, with the number of groups equal to :
Here, is the supplementary ghost-feature tensor; denotes a depthwise convolution; specifies one convolution group per intrinsic channel.
The GhostConv output is obtained by concatenation along the channel dimension:
Here, Y is the GhostConv output tensor, and denotes concatenation of and along the channel dimension.
GhostConv first generates intrinsic features through the primary convolution branch and then produces supplementary features through a low-cost transformation branch. The two feature sets are concatenated along the channel dimension. Compared with feature transformation based entirely on stacked standard convolutions, this process reduces channel redundancy while preserving local feature transformation in a compact model.
The GhostConv-based detection-head design is shown in Figure 5.
Figure 5.
Efficient feature generation with GhostConv in the detection head. A primary convolution produces intrinsic features, and a low-cost depthwise branch generates supplementary features. The ellipsis denotes additional cheap operations of the same type; dashed outlines indicate repeated generated feature maps, and colors distinguish intrinsic and ghost features.
3. Results
3.1. Experimental Settings
All experiments used the same software and hardware environment. Training was conducted on a workstation running Ubuntu 20.04 with an NVIDIA GeForce RTX 4090D GPU (24 GB; NVIDIA Corporation, Santa Clara, CA, USA) and an Intel Xeon Platinum 8481C CPU at 2.10 GHz (Intel Corporation, Santa Clara, CA, USA). The software environment comprised Python 3.10.19, Ultralytics 8.4.21, PyTorch 2.5.1+cu121, torchvision 0.20.1+cu121, CUDA 12.1, and cuDNN 9.1.0. For YOLO11s and YOLO11s-CSNG, training was limited to 200 epochs and stopped when validation fitness did not improve for 50 consecutive epochs. In Ultralytics 8.4.21, detection fitness for checkpoint selection corresponds to validation mAP@0.5:0.95; the checkpoint with the highest fitness was saved as best.pt and used for validation and internal-test evaluation. Evaluation used a confidence threshold of 0.001 and an NMS IoU threshold of 0.7. The freeze option was unset, so no transferred backbone or detection-head weights were frozen during training; Ultralytics retained only its fixed DFL projection convolution as non-trainable. The main hyperparameters are listed in Table 1.
Table 1.
Main training configuration.
Performance was evaluated using precision, recall, F1, mAP@0.5, mAP@0.5:0.95, parameter count, FLOPs, model size, throughput, and per-image inference time. Precision measures the proportion of predicted shoots that are true shoots, whereas recall measures the proportion of true shoots detected. F1 summarises the balance between false and missed detections. Precision, recall, and F1 describe performance at a selected confidence threshold, whereas mAP summarises detection performance over the precision–recall curve and is therefore more suitable for model comparison. mAP@0.5 emphasises candidate detection at a relatively permissive IoU threshold, whereas mAP@0.5:0.95 assesses localisation across stricter thresholds. Because the task is defined as candidate shoot-region detection, mAP@0.5 was the primary metric, with mAP@0.5:0.95 reported to characterise stricter localisation. For the five-seed comparison of YOLO11s and YOLO11s-CSNG, we report the mean ± standard deviation of each metric and the paired mean difference (YOLO11s-CSNG − YOLO11s). A 95% confidence interval for the paired mean difference was obtained from the Student t distribution with four degrees of freedom. An exact two-sided paired permutation test on the five seed-wise differences provided a non-parametric significance assessment. With five seeds, the minimum attainable two-sided p value is 0.0625. This test therefore cannot demonstrate statistical significance at under the present design. Parameter count and model size reflect storage demand, whereas FLOPs estimate theoretical computation. Because the modules target different aspects of the detector, configurations were assessed jointly by detection accuracy, performance at higher IoU thresholds, and complexity rather than by a single metric.
3.2. Baseline Comparison
Table 2 presents a practical benchmark of YOLO11 variants, lightweight YOLO models, and representative detection frameworks on the fixed validation set. This comparison is intended as a practical performance reference under the implemented training and evaluation pipelines, rather than as a strict architecture comparison with fully identical optimisation settings across detector families. All models were evaluated using the same data split and metric definitions. The YOLO-family models used matched training settings, whereas RT-DETR-L and the torchvision-based detectors used model-specific adapted training protocols to obtain stable convergence. The final YOLO11s-CSNG model was included to show changes in performance and complexity relative to YOLO11s. Within the matched YOLO11-family comparison, YOLO11n achieved 65.02% mAP@0.5 and 31.59% mAP@0.5:0.95 with 2.582 million parameters and 6.30 billion FLOPs. Although YOLO11m has greater model capacity and theoretical feature-representation capability than YOLO11s, its 20.09 million parameters and 68.00 billion FLOPs did not yield better detection performance under the present protocol: Its mAP@0.5 and mAP@0.5:0.95 were 67.42% and 32.84%, respectively, both below the corresponding YOLO11s values of 67.58% and 33.18%. YOLO11s therefore achieved the best accuracy–complexity balance among the three variants. It also achieved higher detection accuracy than YOLOv5s and YOLOv8s under the implemented settings. These quantitative results supported the selection of YOLO11s as the baseline for the subsequent within-family module ablations.
Table 2.
Practical benchmark of detector performance and complexity on the fixed validation set.
Under this practical benchmark, more complex detection paradigms did not yield a better overall accuracy–complexity trade-off. RT-DETR-L had substantially higher parameter and computational costs but did not exceed YOLO11s in detection accuracy under the adapted protocol. Faster R-CNN achieved high recall but low precision, consistent with redundant proposals in complex foliage backgrounds. RetinaNet and SSD300-VGG16 showed lower overall performance under the implemented settings. These observations are therefore interpreted only as practical reference outcomes for the present dataset and training pipelines, not as definitive evidence of architectural superiority across detector families.
Within this practical-benchmark framing, YOLO11s provided a favourable accuracy–complexity trade-off under the implemented settings and was therefore selected as the baseline for the subsequent within-family module ablations. This selection does not imply a universal ranking of detector architectures beyond the present protocol.
3.3. Main Ablation Analysis
We conducted a three-factor ablation to examine feature enhancement, localisation constraints, and efficient detection-head feature generation. Starting from YOLO11s, we compared single modules, two-module combinations, and the complete model. For the ablation analysis, model configurations were selected primarily according to the validation-set mAP@0.5, provided that parameter count and model size remained comparable to the YOLO11s baseline. Precision, recall, F1, and mAP@0.5:0.95 were used to characterise the associated detection and localisation trade-offs. This configuration-level rule was distinct from checkpoint selection within each training run, for which Ultralytics validation fitness based on mAP@0.5:0.95 was used.
3.3.1. Validation of the CSFEB Structure
Table 3 shows that CSFEB had the clearest structural effect on feature representation. CEB alone achieved 67.60% precision and 33.78% mAP@0.5:0.95, indicating improved discrimination at stricter IoU thresholds. SRE alone achieved 68.41% mAP@0.5, consistent with enhanced responses in candidate regions. Simple external serial connections of CEB and SRE did not yield a consistent gain, producing 67.96% mAP@0.5 and 33.03% mAP@0.5:0.95. In contrast, bottleneck-embedded CSFEB achieved 68.61% mAP@0.5, 68.04% recall, and 33.37% mAP@0.5:0.95. The effect of channel and spatial recalibration therefore depended on both the modules and their insertion point. Embedding recalibration within C3k2 feature generation may preserve target-related textures, edges, and spatial cues before hierarchical abstraction. The same-position CBAM control indicated that the gain did not arise simply from adding attention. YOLO11s+CBAM achieved 66.69% mAP@0.5 and 32.53% mAP@0.5:0.95, both below CSFEB. Different channel-spatial recalibration mechanisms therefore produced distinct outcomes at the same insertion point. By embedding CEB and SRE within the bottleneck, CSFEB redistributes shoot-related features during their generation and improves candidate detection under weak boundaries and similar backgrounds.
Table 3.
Auxiliary ablation of CEB, SRE, and CSFEB configurations.
CSFEB did not optimise every metric. Relative to CEB alone, it had lower precision and mAP@0.5:0.95 but higher recall and mAP@0.5. Its principal effect under the present protocol was therefore greater candidate-detection coverage rather than uniform improvement across all metrics. It also provided a feature basis for subsequent localisation and detection-head changes.
3.3.2. Ablation of the NWD Weight
To determine the contribution of NWD to regression, we tested different NWD-CIoU mixture weights after adding CSFEB (Table 4). The settings characterised trade-offs among precision, recall, F1, mAP@0.5, and mAP@0.5:0.95 and informed selection of pure NWD.
Table 4.
Ablation of the NWD mixture weight.
NWD weight produced clear metric trade-offs. A weight of 0.7 gave the highest recall, 70.25%, but reduced precision to 62.16%. A strong distance constraint may therefore increase candidate detections while admitting more branch, petiole, or background false positives. A weight of 0.5 gave the highest mAP@0.5, 68.78%, but its F1 of 66.68% remained below the 68.04% obtained with pure NWD. At a weight of 1.0, precision, recall, and F1 were 67.31%, 68.79%, and 68.04%, respectively. Precision and F1 were the highest in Table 4, and recall remained high. After CSFEB strengthened foreground features, pure NWD therefore provided a favourable balance between candidate detection and false-positive control. Table 5 further shows that NWD depended on the quality of preceding features. NWD alone achieved 65.13% precision, 67.16% recall, 66.13% F1, 67.10% mAP@0.5, and 33.19% mAP@0.5:0.95. Its overall performance was close to the baseline, and mAP@0.5 was below the baseline value of 67.58%. A distance metric cannot substitute for discrimination when the model still confuses shoots, branches, and petioles. Combining CSFEB with NWD yielded the highest precision, recall, and F1 in Table 5, at 67.31%, 68.79%, and 68.04%. CSFEB provides more stable shoot-region responses, whereas NWD modifies the trade-off among precision, recall, F1, and mAP@0.5.
Table 5.
Three-factor ablation results.
3.3.3. Three-Factor Ablation
Table 5 compares YOLO11s, single-module models, two-module combinations, and YOLO11s-CSNG on the fixed validation set. Relative to YOLO11s, YOLO11s-CSNG increased mAP@0.5 from 67.58% to 69.37%, a gain of 1.79 percentage points. Precision, recall, and F1 increased from 63.24%, 66.67%, and 64.91% to 66.92%, 67.26%, and 67.09%, respectively. mAP@0.5:0.95 changed only slightly, from 33.18% to 33.14%. The complete model therefore achieved a higher candidate-level mAP@0.5 value in this fixed-split ablation, while stricter localisation remained broadly unchanged.
Among single modules, CSFEB produced the clearest detection gain. It increased recall from 66.67% to 68.04%, mAP@0.5 from 67.58% to 68.61%, and mAP@0.5:0.95 from 33.18% to 33.37%. Embedding channel and spatial recalibration in bottleneck feature generation may have strengthened texture, edge, and positional responses associated with shoots. NWD alone increased precision, recall, F1, and mAP@0.5:0.95 but slightly reduced mAP@0.5 to 67.10%, indicating a limited independent effect that depended on stronger foreground features. GhostConv alone increased precision from 63.24% to 67.09% and mAP@0.5 to 68.13%, and it was associated with higher prediction specificity. Recall, however, decreased to 64.22%, showing that GhostConv also required complementary preceding modules. Two-module combinations further demonstrated conditional complementarity. CSFEB+NWD achieved the highest precision, recall, and F1 in Table 5, at 67.31%, 68.79%, and 68.04%. NWD was associated with a favourable balance between candidate detection and false-positive control after channel-spatial features had been strengthened. GhostConv+NWD increased recall to 68.59% and mAP@0.5:0.95 to 33.23%, both above the baseline. By contrast, CSFEB+GhostConv achieved 67.02% mAP@0.5, below the baseline, indicating that feature enhancement and detection-head adjustment alone lacked the supplementary regression constraint. Under this selection rule, YOLO11s-CSNG was retained because it achieved the highest validation-set mAP@0.5, at 69.37% while maintaining a compact model. CSFEB+NWD achieved higher precision, recall, and F1 and may be preferable when balanced classification performance is prioritised. The complete CSNG configuration was therefore selected for its candidate-detection and compactness objective, without implying superiority across all evaluation metrics. To assess sensitivity to training stochasticity, we repeated YOLO11s and YOLO11s-CSNG training with five matched random seeds (40, 42, 44, 123, and 2026). For each seed, the two models used identical training and evaluation settings except for random initialisation and data-loader stochasticity. Both models were evaluated on the validation and internally held-out test sets (Table 6).
Table 6.
Five-seed mean ± standard deviation results for YOLO11s and YOLO11s-CSNG on the validation and internal test sets.
Across the five seeds, the mean validation-set mAP@0.5 was 67.37 ± 0.91% for YOLO11s and 67.97 ± 0.90% for YOLO11s-CSNG. The corresponding internal-test values were 61.29 ± 0.40% and 61.88 ± 0.66%. The paired mean differences were percentage points on the validation set (95% CI ; exact two-sided paired-permutation ) and percentage points on the internal test set (95% CI ; ). Neither difference was statistically significant because both confidence intervals included zero. The five-seed experiment therefore did not demonstrate a statistically reliable advantage over YOLO11s.
The mean mAP@0.5:0.95 changed from 33.00 ± 0.30% to 32.96 ± 0.22% on the validation set and from 30.97 ± 0.19% to 30.73 ± 0.41% on the internal test set. The proposed modifications therefore showed small and uncertain numerical changes in candidate detection at IoU , whereas localisation performance across stricter IoU thresholds decreased slightly.
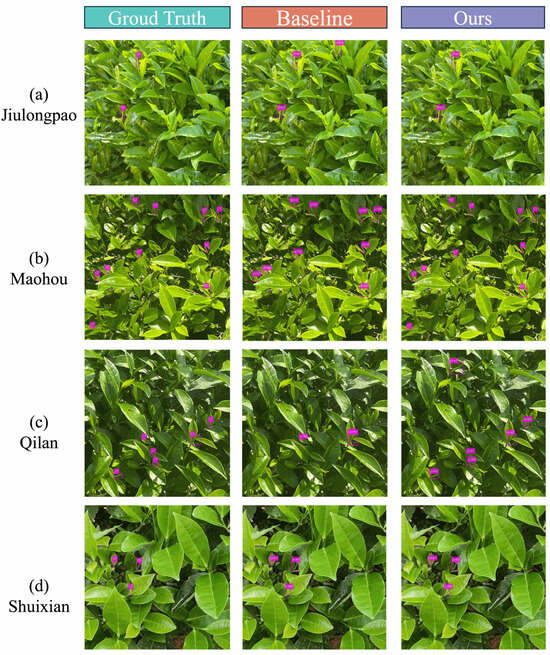
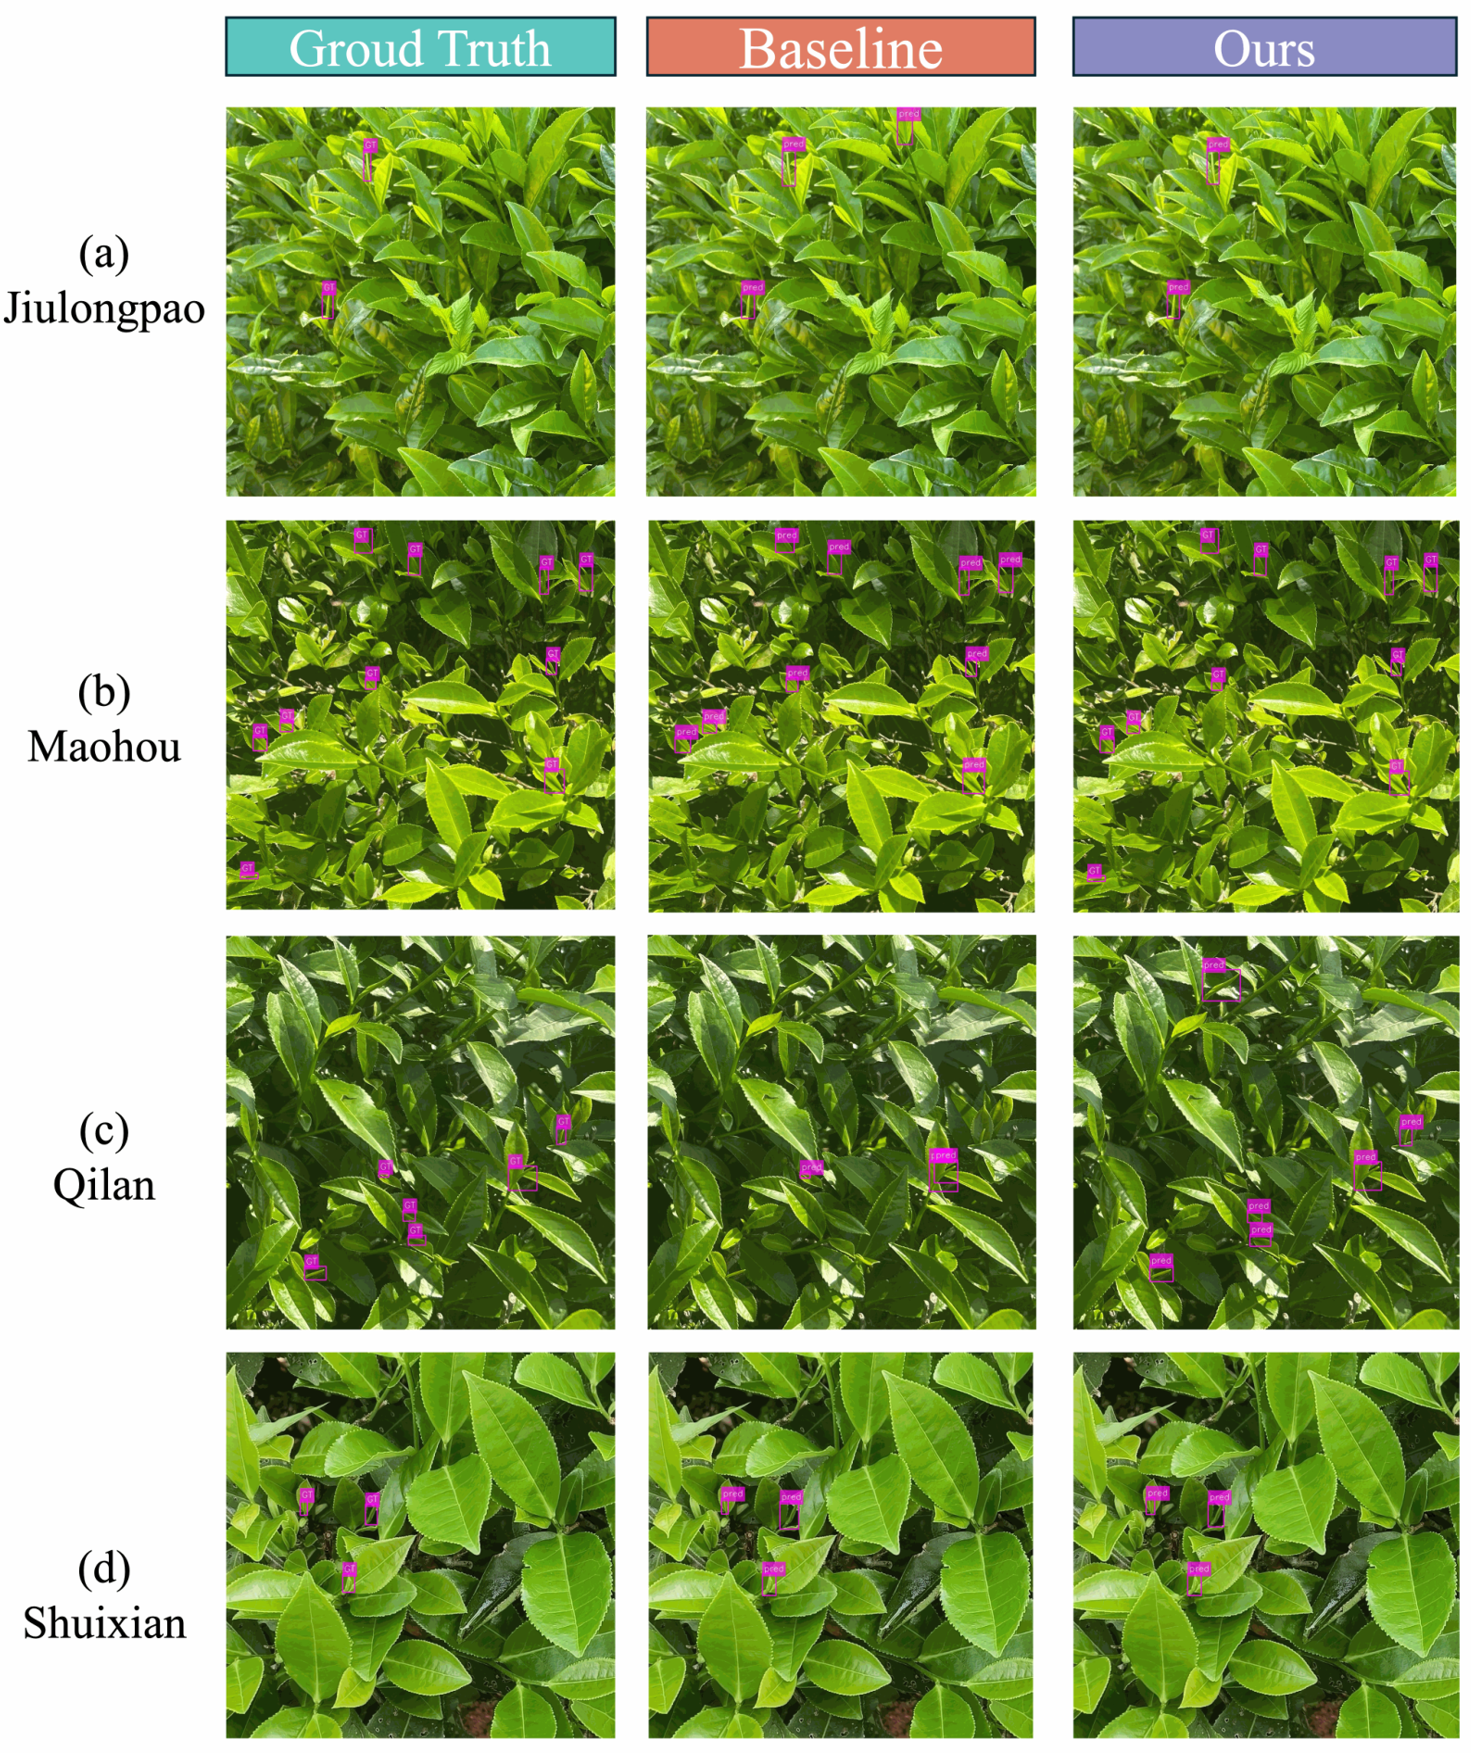
Qualitative detection results for the four cultivars are compared in Figure 6.
Figure 6.
Visual comparison of multi-cultivar rock-tea shoot detection. Columns show ground truth, YOLO11s predictions, and YOLO11s-CSNG predictions. Rows correspond to C. sinensis ‘Jiulongpao’, C. sinensis ‘Maohou’, C. sinensis ‘Qilan’, and C. sinensis ‘Shuixian’.
The examples show ground truth, baseline, and YOLO11s-CSNG predictions for four cultivars in natural plantation scenes. In the selected images, YOLO11s-CSNG detected additional candidate shoots among slender targets, occluded leaves, and branch-stem backgrounds, with fewer missed detections. Its boxes also more closely followed the annotated shoot regions. These qualitative examples complement the candidate-detection metrics in Table 6 and Table 7 but do not constitute independent performance evidence.
Table 7.
Five-seed cultivar-specific and equally weighted cultivar-macro validation results.
Across five seeds, the equally weighted cultivar-macro mAP@0.5 was 67.91 ± 0.97% for YOLO11s and 68.62 ± 0.98% for YOLO11s-CSNG, corresponding to a difference of +0.71 percentage points. The cultivar-macro mAP@0.5:0.95 was 33.22 ± 0.31% and 33.29 ± 0.32%, respectively. mAP@0.5 increased for C. sinensis ‘Jiulongpao’, C. sinensis ‘Qilan’, and C. sinensis ‘Shuixian’, whereas both mAP metrics decreased for C. sinensis ‘Maohou’. The equally weighted cultivar-macro analysis likewise showed a small numerical difference, while the cultivar-specific results were heterogeneous.
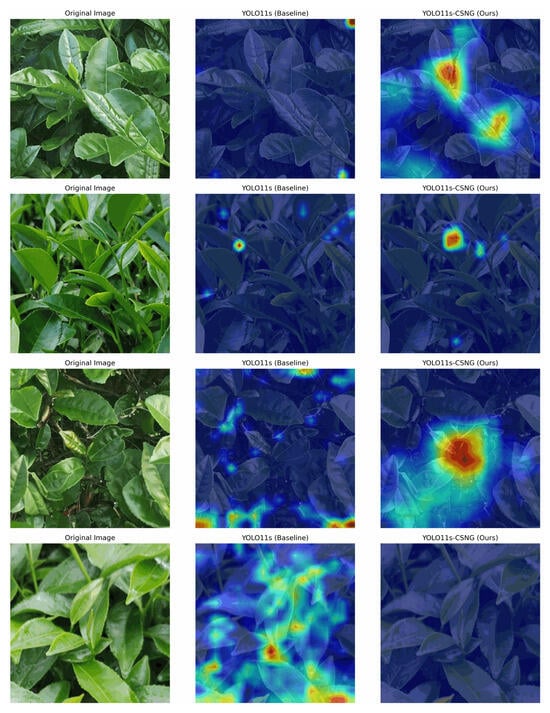
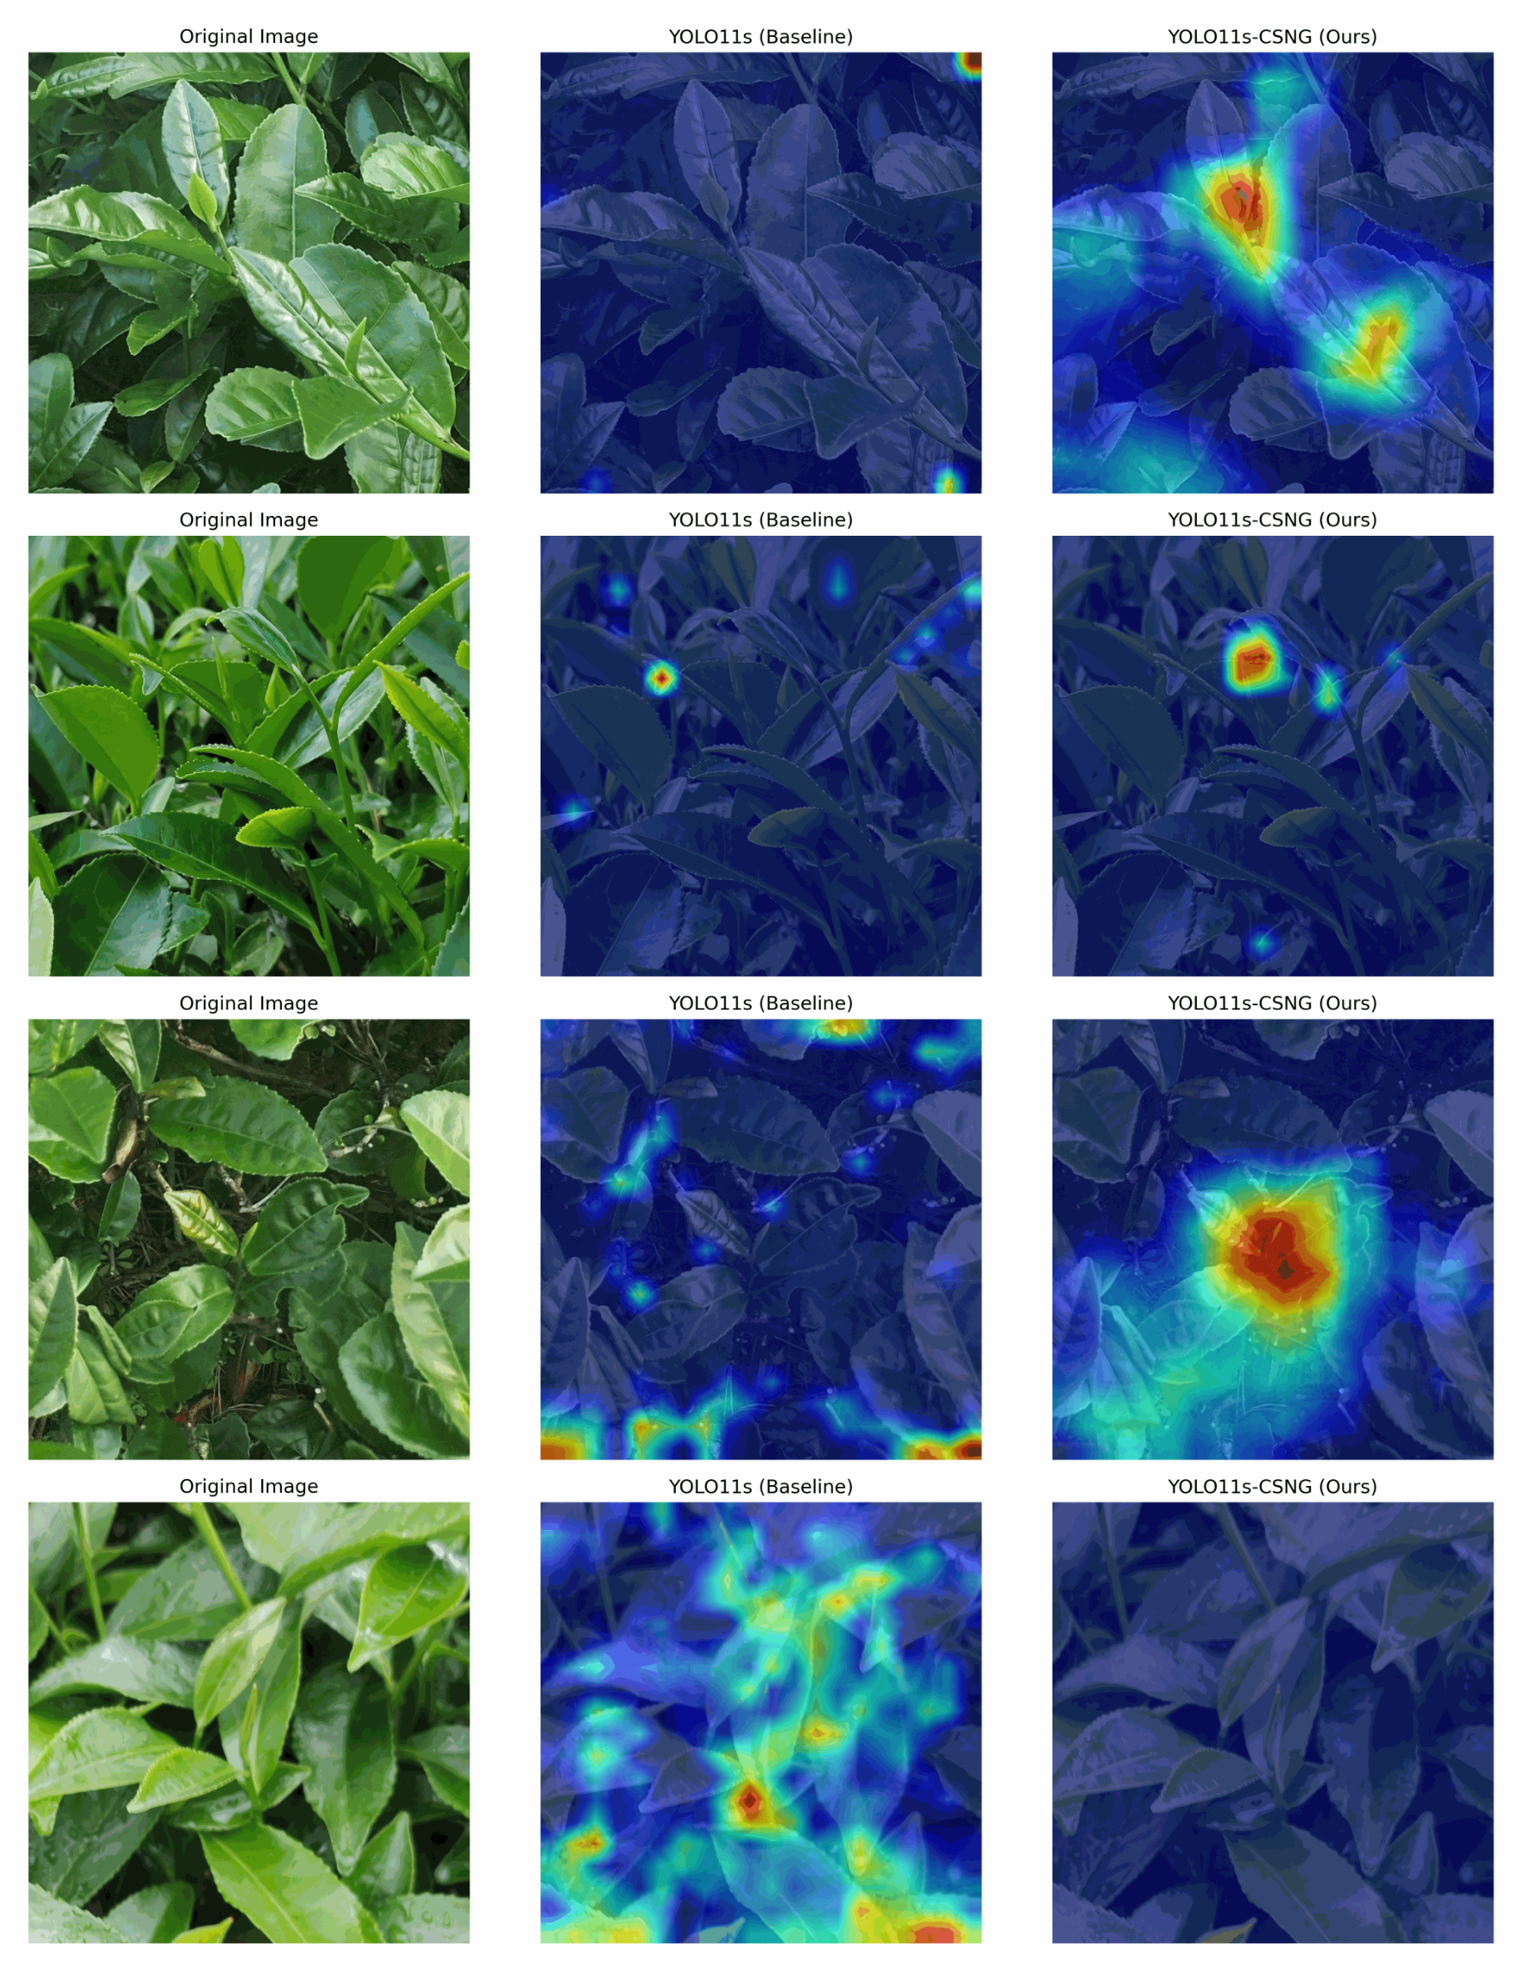
The Grad-CAM comparison between YOLO11s and YOLO11s-CSNG is shown in Figure 7.
Figure 7.
Grad-CAM comparison between YOLO11s and YOLO11s-CSNG. Columns show the original image, baseline heat map, and YOLO11s-CSNG heat map. Warm colors (yellow to red) indicate stronger activation, whereas cool colors (green to blue) indicate weaker activation.
In the selected examples, YOLO11s-CSNG responses were more concentrated on shoot bodies, leaf-tip boundaries, and annotated candidate regions than baseline responses. Diffuse activation over background leaves, branches, and non-target regions was reduced. These maps qualitatively suggest more focused spatial responses under canopy complexity, occlusion, and similar textures.
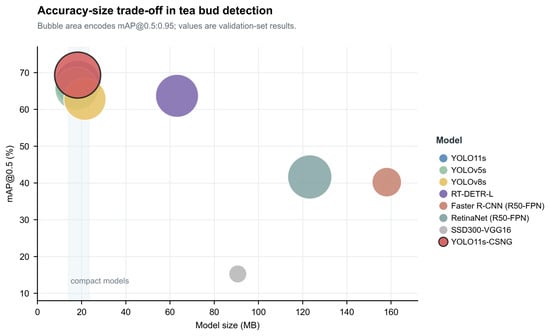
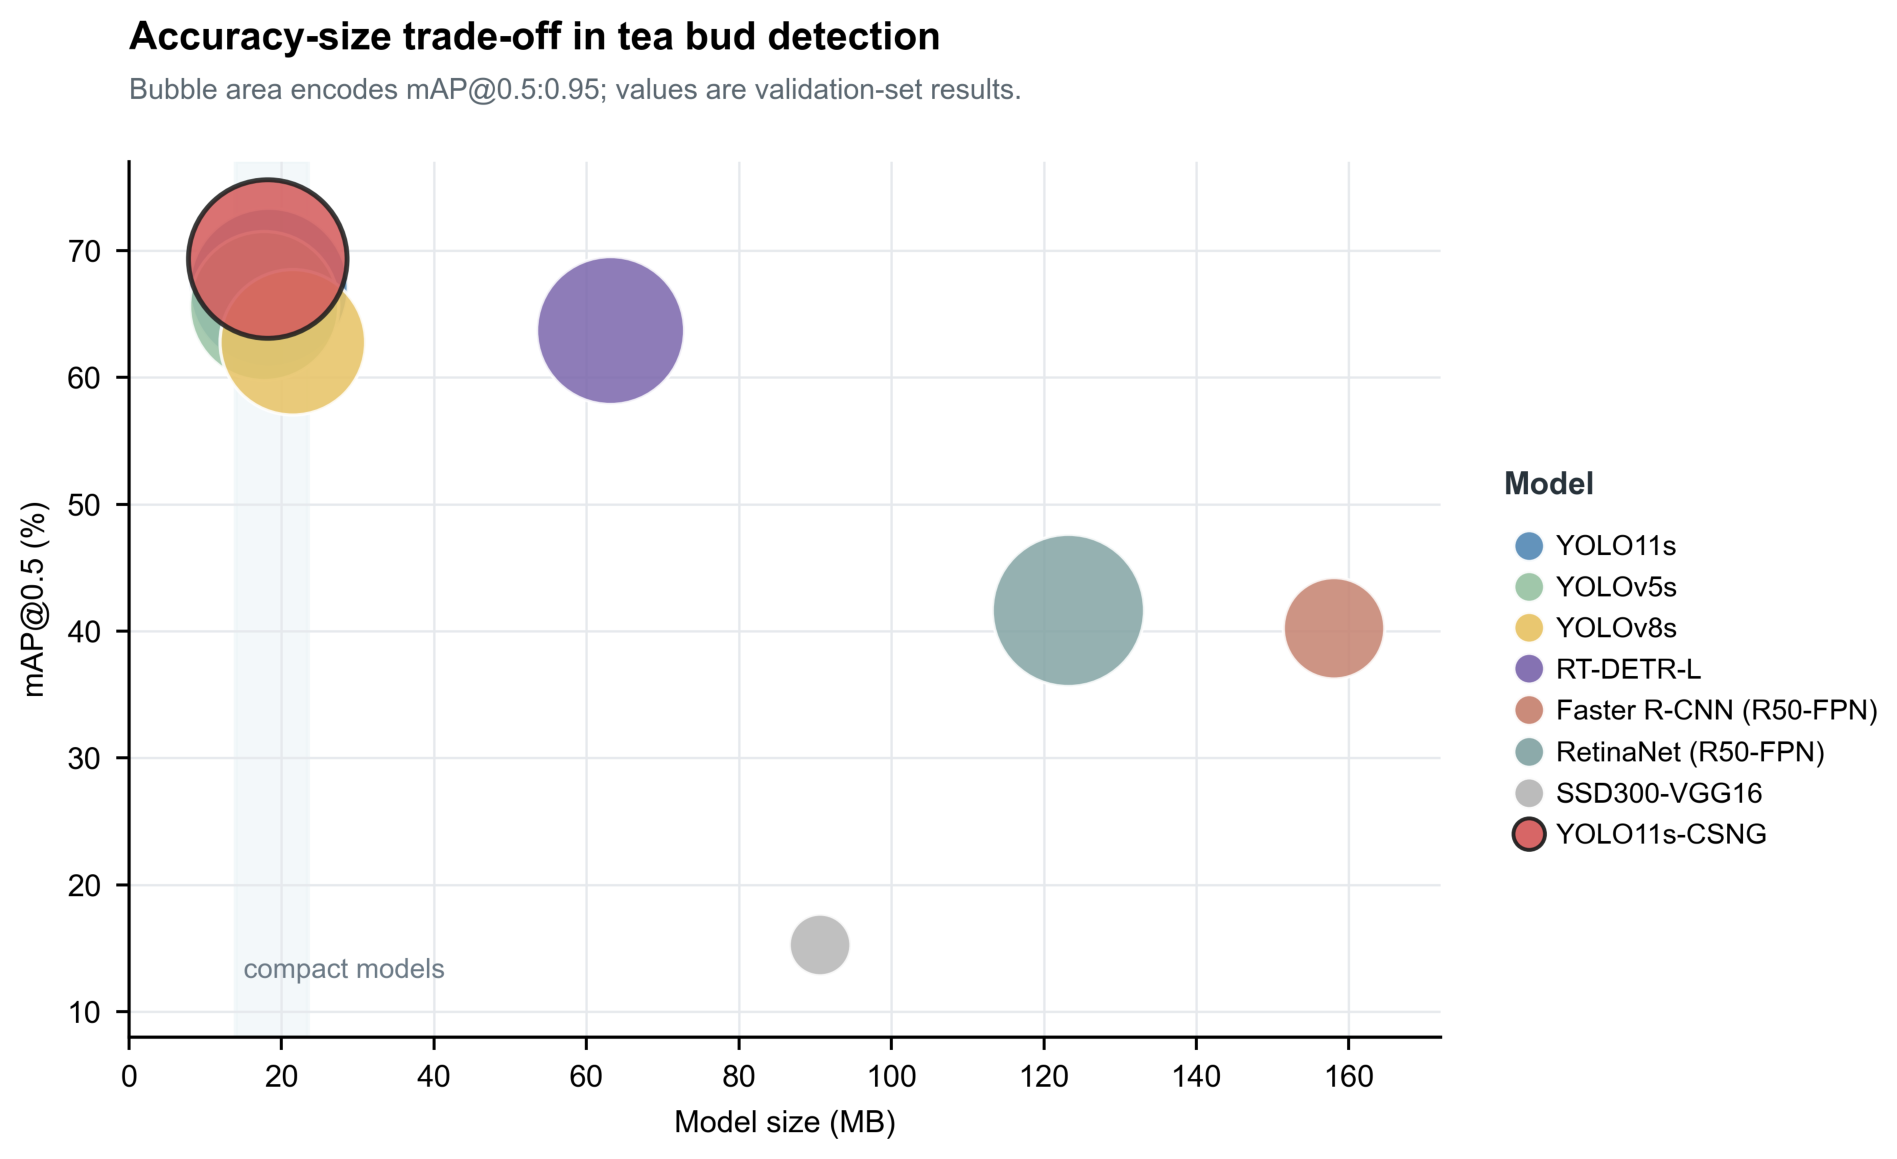
The accuracy–model-size trade-off across detectors is visualised in Figure 8.
Figure 8.
Accuracy–size trade-off across detectors. Bubble area encodes mAP@0.5:0.95, and the shaded band marks compact models.
Across the main and auxiliary ablations and the five-seed experiments, CSFEB, NWD, and GhostConv affected different aspects of the detector. CSFEB increased recall and both mAP metrics as a single module, supporting channel-spatial refinement within the bottleneck. NWD depended on its weight and on preceding feature quality. After CSFEB stabilised foreground responses, CSFEB+NWD achieved high precision, recall, and F1, supporting distribution distance as a supplementary regression constraint. GhostConv adjusted feature generation in the detection head and was associated with the numerical mAP@0.5 increase in the complete model without substantial additional complexity.
3.4. TensorRT FP16 Deployment on Jetson Xavier NX
To evaluate portability across inference environments, YOLO11s and YOLO11s-CSNG were exported as ONNX models with a fixed 640 × 640 input, batch size of 1, and opset of 12. TensorRT FP16 engines were built on an edge device with 16 GB memory constructed around an NVIDIA Jetson Xavier NX module (NVIDIA Corporation, Santa Clara, CA, USA). The environment used JetPack 4.6.1, CUDA 10.2, cuDNN 8.2, and TensorRT 8.2.1. Deployment evaluation used the same 610 images and 1,227 annotations as the fixed validation set. Images were letterboxed to 640 × 640 while preserving the aspect ratio. The confidence threshold was 0.001, and the non-maximum suppression IoU threshold was 0.7. Table 8 reports TensorRT FP16 inference. YOLO11s-CSNG achieved 64.64% mAP@0.5 versus 63.58% for the baseline. Its inference time was 30.46 ms per image, corresponding to 32.83 frames s−1, compared with 31.73 ms and 31.52 frames s−1 for the baseline. Absolute deployment metrics were lower than native PyTorch validation metrics because FP16 export and backend evaluations used a distinct pipeline. We therefore focus on relative differences within the same TensorRT backend. Under this matched protocol, YOLO11s-CSNG showed a higher mAP@0.5 value without a measurable increase in inference time.
Table 8.
TensorRT FP16 deployment results on Jetson Xavier NX.
YOLO11s-CSNG was compatible with TensorRT FP16 model-only inference on Jetson Xavier NX without an evident increase in inference time. This result supports model-level edge-device portability and provides a practical basis for subsequent system-level field evaluation.
4. Discussion
The main finding is a divergence between candidate-region detection and stricter bounding-box localisation. Across the fixed-split and repeated-seed evaluations, the numerical improvement was concentrated in mAP@0.5, whereas performance averaged over stricter IoU thresholds remained unchanged or decreased slightly; the seed-averaged differences were also statistically uncertain. This pattern is consistent with the known sensitivity of small-object IoU to minor changes in bounding-box position and scale. For small and elongated tea shoots, translating or rescaling a bounding box by only a few pixels can produce a substantial change in IoU. Similar sensitivity has motivated GIoU, DIoU, and distribution-distance formulations for bounding-box regression [42,43,44]. The proposed modifications therefore appear more effective at recovering candidate shoot regions than at refining their boundaries under stricter overlap criteria. Future work will investigate finer target representations and boundary-aware regression strategies to determine whether improvements in candidate recovery can be extended to more precise localisation.
The ablation results suggest a progressive relationship among the three modules. CSFEB acts at the representation stage: Channel recalibration emphasises which responses are informative, while spatial refinement indicates where candidate shoots are likely to occur. Previous tea-shoot detectors have also used gradient-guided, pose-guided, or convolutional attention to enhance small and partially occluded targets [17,18,29,36]. The present controls further indicate that the effect depends on how attention is integrated: Both the external CEB+SRE connection and the same-position CBAM control underperformed the bottleneck-embedded CSFEB. Thus, CSFEB can be interpreted as establishing a foreground representation that identifies what and where the detector should emphasise. NWD subsequently modifies the geometry used to penalise coordinate and scale deviations [44]. Its effect was neither monotonic across different weights nor consistently beneficial when used alone. Its stronger balance of precision, recall, and F1 after CSFEB suggests that distribution-aware regression is more useful when the preceding representation already separates shoots from branches, petioles, and background foliage. GhostConv then operates in the detection head, generating supplementary features through low-cost transformations rather than repeated standard convolutions [45,46]. Although the complete architecture had slightly higher total FLOPs, its parameter count and model size remained slightly below those of YOLO11s, preserving a compact storage footprint while limiting redundant feature generation in the prediction head. Together, the three modules form a coherent functional sequence: CSFEB enhances the semantic and spatial selectivity of foreground features, NWD reshapes the regression constraint on coordinate and scale deviations, and GhostConv limits redundant feature generation in the prediction head through low-cost transformations. Because the current Grad-CAM evidence remains qualitative, future experiments will combine activation visualisation with quantitative attribution analysis and controlled module interventions to test this proposed sequence more directly.
The cultivar-specific results indicate that the effectiveness of this processing chain is influenced by target morphology and scene composition. Candidate-detection performance increased numerically for three cultivars, whereas Maohou showed a numerical decrease, indicating that the improvement was not consistent across cultivars. A single aggregate metric can therefore conceal interactions among shoot shape, occlusion, canopy structure, and background similarity. This observation is consistent with previous multi-cultivar tea studies showing that cultivar composition, labelling strategy, training configuration, and complex backgrounds can materially affect detection performance [13,14,31]. Direct numerical ranking across these studies would be inappropriate because their cultivars, datasets, annotation rules, and evaluation protocols differ. Their findings nevertheless support reporting both aggregate and cultivar-specific results when evaluating tea-shoot detectors. The Jetson Xavier NX experiment adds a deployment perspective to this comparison. TensorRT FP16 inference preserved a small within-backend mAP@0.5 difference and achieved inference time comparable to YOLO11s, indicating that the architectural modifications did not prevent model-level edge-device deployment. This evidence is limited to detector inference. Future work will extend the current detector from bounding-box detection to keypoint or three-dimensional localisation, enabling a more precise spatial description of candidate shoots [5,12].
The conclusions are bounded by the temporal, geographic, statistical, and annotation scope of the experiment. The images were collected within one production region during a four-day period, so performance under seasonal and geographic distribution shifts remains unknown. Five matched seeds provided an initial estimate of training variability but limited the statistical resolution for small effects. The inclusion of several smartphone manufacturers increased acquisition diversity, although the dataset was not designed for device-stratified or held-out-camera evaluation. Annotation consistency was supported through common training for the three annotators and full-dataset adjudication by the first author. Formal inter-annotator agreement was not quantified. These limitations define concrete directions for further evaluation: independently acquired multi-season and multi-region datasets, additional random seeds, device-held-out testing, and end-to-end field trials. Such experiments will determine whether the observed candidate-detection trend persists under distribution shifts and whether it can support reliable localisation and harvesting decisions. Within this scope, this study provides a reproducible reference for edge-deployed candidate Wuyi rock-tea shoot detection and clarifies the conditional contributions of feature refinement, distribution-aware regression, and lightweight detection-head design.
5. Conclusions
The coordinated feature-refinement, regression, and detection-head modifications retained compactness and produced small numerical increases in mAP@0.5, but a statistically reliable advantage over YOLO11s was not demonstrated in the present five-seed experiment. TensorRT FP16 evaluation on Jetson Xavier NX supported model-level edge-device inference with inference time comparable to YOLO11s.
Future work will extend evaluation to independently acquired data across seasons, production regions, plantations, cultivars, and imaging devices and will add quantitative annotation-agreement assessment. Device-stratified evaluation, finer target representations, and end-to-end measurements of latency, energy consumption, spatial localisation, and manipulation success will further advance the model towards plantation monitoring and selective-harvesting applications.
Author Contributions
Conceptualization, C.R. and H.Q.; methodology, H.Q., C.R., and X.Y.; software, H.Q. and X.Y.; validation, H.Q., X.Y., and J.Y. (Jinglong Yuan); formal analysis, H.Q. and C.R.; investigation, H.Q., J.Y. (Jinglong Yuan), and J.C.; resources, C.R., B.G., J.Y. (Jun Yang), and J.C.; data curation, H.Q., X.Y., and J.Y. (Jinglong Yuan); writing—original draft preparation, H.Q.; writing—review and editing, C.R., X.Y., B.G., J.Y. (Jun Yang), and J.C.; visualization, H.Q. and X.Y.; supervision, C.R. and J.Y. (Jun Yang); project administration, C.R.; funding acquisition, C.R. All authors have read and agreed to the published version of the manuscript.
Funding
This work was supported by the National Natural Science Foundation of China (61903288); Guiding Project of Fujian Provincial Department of Science and Technology (2026N0015); Key Agricultural Core Technology Research Project of Fujian Provincial Department of Agriculture (20251105); Fujian Provincial Small and Medium-sized Technological Innovation Fund Project (2025C0026); and Wuyi University Talent Research Start-up Funding Program (YJ202320).
Institutional Review Board Statement
Not applicable.
Informed Consent Statement
Not applicable.
Data Availability Statement
The data supporting the findings of this study are available from the corresponding author upon reasonable request, as related research is ongoing.
Acknowledgments
The authors thank the tea plantation for providing the field environment and the students who assisted with image acquisition. During the preparation of this manuscript, the authors used OpenAI GPT tools for formatting assistance and language polishing and DeepSeek to assist in monitoring model training. The authors reviewed and verified all AI-assisted outputs and take full responsibility for the content of the publication.
Conflicts of Interest
Author Jiayou Chen was employed by the company Fujian Jiayou Tea Machinery Intelligent Technology Co., Ltd. The remaining authors declare that the research was conducted in the absence of any commercial or financial relationships that could be construed as a potential conflict of interest.
Abbreviations
The following abbreviations are used in this manuscript:
| CEB | Channel enhancement block |
| CSFEB | Channel-spatial feature enhancement bottleneck |
| NWD | Normalized Wasserstein distance |
| SRE | Spatial response enhancement |
| FP16 | 16-bit floating point |
References
- Ye, J.; Zhang, Q.; Jia, M.; Wang, Y.; Zhang, Y.; Jia, X.; Zheng, X.; Wang, H. The Effects of Rock Zones and Tea Tree Varieties on the Growth and Quality of Wuyi Rock Tea Based on the OPLS-DA Model and Machine Learning. Agriculture 2024, 14, 573. [Google Scholar] [CrossRef] [Scilit]
- Zhang, Y.; Kang, S.; Yan, H.; Xie, D.; Chen, Q.; Lv, H.; Lin, Z.; Zhu, Y. Insights into Characteristic Volatiles in Wuyi Rock Teas with Different Cultivars by Chemometrics and Gas Chromatography Olfactometry/Mass Spectrometry. Foods 2022, 11, 4109. [Google Scholar] [CrossRef] [Scilit] [PubMed]
- Han, X.; Song, B.; Fei, S.; Li, H.; Guan, S.; Chen, Y. Influencing Factors and Transmission Mechanisms of Pro-Environmental Behavior: Evidence from Tea Farmers in Wuyishan National Park. Land 2025, 14, 1367. [Google Scholar] [CrossRef] [Scilit]
- Rajendran, V.; Debnath, B.; Mghames, S.; Mandil, W.; Parsa, S.; Parsons, S.; Ghalamzan-E, A. Towards autonomous selective harvesting: A review of robot perception, robot design, motion planning and control. J. Field Robot. 2024, 41, 2247–2279. [Google Scholar] [CrossRef] [Scilit]
- Li, Y.; He, L.; Jia, J.; Lv, J.; Chen, J.; Qiao, X.; Wu, C. In-field tea shoot detection and 3D localization using an RGB-D camera. Comput. Electron. Agric. 2021, 185, 106149. [Google Scholar] [CrossRef] [Scilit]
- Zhou, C.; Zhu, Y.; Zhang, J.; Ding, Z.; Jiang, W.; Zhang, K. The tea buds detection and yield estimation method based on optimized YOLOv8. Sci. Hortic. 2024, 338, 113730. [Google Scholar] [CrossRef] [Scilit]
- Lin, G.; Xiong, J.; Zhao, R.; Li, X.; Hu, H.; Zhu, L.; Zhang, R. Efficient detection and picking sequence planning of tea buds in a high-density canopy. Comput. Electron. Agric. 2023, 213, 108213. [Google Scholar] [CrossRef] [Scilit]
- Bac, C.W.; van Henten, E.J.; Hemming, J.; Edan, Y. Harvesting robots for high-value crops: State-of-the-art review and challenges ahead. J. Field Robot. 2014, 31, 888–911. [Google Scholar] [CrossRef] [Scilit]
- Silwal, A.; Davidson, J.R.; Karkee, M.; Mo, C.; Zhang, Q.; Lewis, K. Design, integration, and field evaluation of a robotic apple harvester. J. Field Robot. 2017, 34, 1140–1159. [Google Scholar] [CrossRef] [Scilit]
- Bac, C.W.; Roorda, T.; Reshef, R.; Berman, S.; Hemming, J.; van Henten, E.J. Analysis of a motion planning problem for sweet-pepper harvesting in a dense obstacle environment. Biosyst. Eng. 2016, 146, 85–97. [Google Scholar] [CrossRef] [Scilit]
- Lehnert, C.; McCool, C.; Sa, I.; Perez, T. Performance improvements of a sweet pepper harvesting robot in protected cropping environments. J. Field Robot. 2020, 37, 1197–1223. [Google Scholar] [CrossRef] [Scilit]
- Chen, S.; Liao, Y.; Chen, J.; Lin, F. Improved keypoint localization network for tea bud based on YOLO framework. Comput. Electr. Eng. 2024, 119, 109505. [Google Scholar] [CrossRef] [Scilit]
- Shuai, L.; Mu, J.; Jiang, X.; Chen, P.; Zhang, B.; Li, H.; Wang, Y.; Li, Z. An improved YOLOv5-based method for multi-species tea shoot detection and picking point location in complex backgrounds. Biosyst. Eng. 2023, 231, 117–132. [Google Scholar] [CrossRef] [Scilit]
- Zhang, Z.; Lu, Y.; Yang, M.; Wang, G.; Zhao, Y.; Hu, Y. Optimal training strategy for high-performance detection model of multi-cultivar tea shoots based on deep learning methods. Sci. Hortic. 2024, 328, 112949. [Google Scholar] [CrossRef] [Scilit]
- Attri, I.; Awasthi, L.K.; Sharma, T.P.; Rathee, P. A review of deep learning techniques used in agriculture. Ecol. Inform. 2023, 77, 102217. [Google Scholar] [CrossRef] [Scilit]
- Jin, Y.; Xia, X.; Gao, Q.; Yue, Y.; Lim, E.G.; Wong, P.; Ding, W.; Zhu, X. Deep learning in produce perception of harvesting robots: A comprehensive review. Appl. Soft Comput. 2025, 174, 112971. [Google Scholar] [CrossRef] [Scilit]
- Wang, J.; Guo, Y.; Han, Y.; Zhu, Y.; Lan, Y. A top-view transformer-based framework for tiny tea bud detection with gradient-guided attention and position-sensitive loss. Comput. Electron. Agric. 2026, 240, 111123. [Google Scholar] [CrossRef] [Scilit]
- Shen, Z.; Yu, J.; Cai, Y.; Yang, J.; Chen, P.; Ruan, W.; Zhen, W.; Ma, R.; Qi, L. Pose estimation-guided CNN for tea bud detection and plucking point identification. Comput. Electron. Agric. 2026, 247, 111743. [Google Scholar] [CrossRef] [Scilit]
- Shen, Z.; Cai, Y.; Yuan, K.; Liu, B.; Zhen, W.; Ma, R.; Qi, L. Exploiting anchor-free and graph reasoning framework for dense tea bud detection and picking point identification. Eng. Appl. Artif. Intell. 2026, 178, 115056. [Google Scholar] [CrossRef] [Scilit]
- Lu, J.; Luo, H.; Yu, C.; Liang, X.; Huang, J.; Wu, H.; Wang, L.; Yang, C. Tea Bud DG: A lightweight tea bud detection model based on dynamic detection head and adaptive loss function. Comput. Electron. Agric. 2024, 227, 109522. [Google Scholar] [CrossRef] [Scilit]
- Yang, Q.; Gu, J.; Xiong, T.; Wang, Q.; Huang, J.; Xi, Y.; Shen, Z. RFA-YOLOv8: A robust tea bud detection model with adaptive illumination enhancement for complex orchard environments. Agriculture 2025, 15, 1982. [Google Scholar] [CrossRef] [Scilit]
- Bargoti, S.; Underwood, J.P. Image segmentation for fruit detection and yield estimation in apple orchards. J. Field Robot. 2017, 34, 1039–1060. [Google Scholar] [CrossRef] [Scilit]
- Chen, C.; Li, B.; Liu, J.; Bao, T.; Ren, N. Monocular positioning of sweet peppers: An instance segmentation approach for harvest robots. Biosyst. Eng. 2020, 196, 15–28. [Google Scholar] [CrossRef] [Scilit]
- Koirala, A.; Walsh, K.B.; Wang, Z.; McCarthy, C. Deep learning for real-time fruit detection and orchard fruit load estimation: Benchmarking of MangoYOLO. Precis. Agric. 2019, 20, 1107–1135. [Google Scholar] [CrossRef] [Scilit]
- Xu, W.; Zhao, L.; Li, J.; Shang, S.; Ding, X.; Wang, T. Detection and classification of tea buds based on deep learning. Comput. Electron. Agric. 2022, 192, 106547. [Google Scholar] [CrossRef] [Scilit]
- Liu, J.; Wang, X. Multimodal large models for smart agriculture: Frameworks and applications. Expert Syst. Appl. 2026, 300, 130394. [Google Scholar] [CrossRef] [Scilit]
- Li, J.; Li, J.; Zhao, X.; Su, X.; Wu, W. Lightweight detection networks for tea bud on complex agricultural environment via improved YOLO v4. Comput. Electron. Agric. 2023, 211, 107955. [Google Scholar] [CrossRef] [Scilit]
- Gui, Z.; Chen, J.; Li, Y.; Chen, Z.; Wu, C.; Dong, C. A lightweight tea bud detection model based on YOLOv5. Comput. Electron. Agric. 2023, 205, 107636. [Google Scholar] [CrossRef] [Scilit]
- Wang, Y.; Xiao, M.; Wang, S.; Jiang, Q.; Wang, X.; Zhang, Y. Detection of famous tea buds based on improved YOLOv7 network. Agriculture 2023, 13, 1190. [Google Scholar] [CrossRef] [Scilit]
- Chen, Z.; Chen, J.; Li, Y.; Gui, Z.; Yu, T. Tea bud detection and 3D pose estimation in the field with a depth camera based on improved YOLOv5 and the optimal pose-vertices search method. Agriculture 2023, 13, 1405. [Google Scholar] [CrossRef] [Scilit]
- Chen, Y.; Guo, Y.; Li, J.; Zhou, B.; Chen, J.; Zhang, M.; Cui, Y.; Tang, J. RT-DETR-Tea: A multi-species tea bud detection model for unstructured environments. Agriculture 2024, 14, 2256. [Google Scholar] [CrossRef] [Scilit]
- Liu, J.; Jiang, J.; Liang, H.; Zhu, G.; Ye, M.; Chen, H.; Chen, Y.; Cheng, A.; Sun, R.; Zhong, Y. GAE-SpikeYOLO: An energy-efficient tea bud detection model with spiking neural networks for complex natural environments. Agriculture 2026, 16, 353. [Google Scholar] [CrossRef] [Scilit]
- Yang, X.; Ruan, C.; Yu, F.; Yang, R.; Guo, B.; Yang, J.; Gao, F.; He, L. TEB-YOLO: A lightweight YOLOv5-based model for bamboo strip defect detection. Forests 2025, 16, 1219. [Google Scholar] [CrossRef] [Scilit]
- Sun, H.; Lv, L.; Zhang, P.; Tang, T.; Tian, F.; Sun, W.; Lu, H. Spatial-frequency enhanced Mamba for multi-modal image fusion. IEEE Trans. Image Process. 2025, 34, 7684–7696. [Google Scholar] [CrossRef] [Scilit] [PubMed]
- Chen, T.; Li, H.; Chen, J.; Zeng, Z.; Han, C.; Wu, W. Detection network for multi-size and multi-target tea bud leaves in the field of view via improved YOLOv7. Comput. Electron. Agric. 2024, 218, 108700. [Google Scholar] [CrossRef] [Scilit]
- Gui, J.; Wu, D.; Xu, H.; Chen, J.; Tong, J. Tea bud detection based on multi-scale convolutional block attention module. J. Food Process Eng. 2024, 47, e14556. [Google Scholar] [CrossRef] [Scilit]
- Cheng, Y.; Li, Y.; Zhang, R.; Gui, Z.; Dong, C.; Ma, R. Locating tea bud keypoints by keypoint detection method based on convolutional neural network. Sustainability 2023, 15, 6898. [Google Scholar] [CrossRef] [Scilit]
- Diwan, T.; Anirudh, G.; Tembhurne, J.V. Object detection using YOLO: Challenges, architectural successors, datasets and applications. Multimed. Tools Appl. 2023, 82, 9243–9275. [Google Scholar] [CrossRef] [Scilit] [PubMed]
- Arkin, E.; Yadikar, N.; Xu, X.; Aysa, A.; Ubul, K. A survey: Object detection methods from CNN to transformer. Multimed. Tools Appl. 2023, 82, 21353–21383. [Google Scholar] [CrossRef] [Scilit]
- Guo, S.; Yoon, S.C.; Li, L.; Wang, W.; Zhuang, H.; Wei, C.; Liu, Y.; Li, Y. Recognition and positioning of fresh tea buds using YOLOv4-lighted + ICBAM model and RGB-D sensing. Agriculture 2023, 13, 518. [Google Scholar] [CrossRef] [Scilit]
- Woo, S.; Park, J.; Lee, J.Y.; Kweon, I.S. CBAM: Convolutional Block Attention Module. In Proceedings of the European Conference on Computer Vision (ECCV); Springer International Publishing: Cham, Switzerland, 2018; pp. 3–19. [Google Scholar] [CrossRef] [Scilit]
- Rezatofighi, H.; Tsoi, N.; Gwak, J.; Sadeghian, A.; Reid, I.; Savarese, S. Generalized Intersection over Union: A metric and a loss for bounding box regression. In Proceedings of the IEEE/CVF Conference on Computer Vision and Pattern Recognition; IEEE: New York, NY, USA, 2019; pp. 658–666. [Google Scholar] [CrossRef] [Scilit]
- Zheng, Z.; Wang, P.; Liu, W.; Li, J.; Ye, R.; Ren, D. Distance-IoU Loss: Faster and better learning for bounding box regression. Proc. Aaai Conf. Artif. Intell. 2020, 34, 12993–13000. [Google Scholar] [CrossRef] [Scilit]
- Xu, C.; Wang, J.; Yang, W.; Yu, H.; Yu, L.; Xia, G.-S. Detecting tiny objects in aerial images: A normalized Wasserstein distance and a new benchmark. ISPRS J. Photogramm. Remote Sens. 2022, 190, 79–93. [Google Scholar] [CrossRef] [Scilit]
- Han, K.; Wang, Y.; Tian, Q.; Guo, J.; Xu, C.; Xu, C. GhostNet: More features from cheap operations. In Proceedings of the IEEE/CVF Conference on Computer Vision and Pattern Recognition; IEEE: New York, NY, USA, 2020; pp. 1580–1589. [Google Scholar] [CrossRef] [Scilit]
- Tang, Y.; Han, K.; Guo, J.; Xu, C.; Xu, C.; Wang, Y. GhostNetV2: Enhance cheap operation with long-range attention. Adv. Neural Inf. Process. Syst. 2022, 35, 9969–9982. [Google Scholar] [CrossRef] [Scilit]

Disclaimer/Publisher’s Note: The statements, opinions and data contained in all publications are solely those of the individual author(s) and contributor(s) and not of MDPI and/or the editor(s). MDPI and/or the editor(s) disclaim responsibility for any injury to people or property resulting from any ideas, methods, instructions or products referred to in the content. |
© 2026 by the authors. Licensee MDPI, Basel, Switzerland. This article is an open access article distributed under the terms and conditions of the Creative Commons Attribution (CC BY) license.