


Abstract
Flavonoids are essential secondary metabolites that predominantly affect flower pigmentation in plants. Understanding the molecular mechanisms underlying flower color divergence is crucial for ornamental plant breeding. This study aimed to elucidate the factors responsible for the differences in color between white-petaled Cosmos bipinnatus and orange-petaled Cosmos sulphureus. We employed an integrated approach combining untargeted LC–MS/MS metabolomics and high-throughput transcriptome sequencing of fresh petals to analyze pigment composition and differential gene expression. Petal pigment extraction, total flavonoid quantification, and metabolomic profiling consistently revealed that differences in flavonoid abundance are responsible for flower color divergence between the two species. In contrast, carotenoids, previously considered potential contributors to flower coloration, were neither evident in the oil phase of the pigment extracts nor detected by metabolomic analysis. Flavonoid compounds accumulated at relatively high levels in the orange petals of C. sulphureus, reaching 11.36 times that of C. bipinnatus, contributing to its bright appearance. Transcriptomic analysis revealed differences in gene expression patterns between the two species, highlighting key candidate genes involved in the flavonoid biosynthesis pathway, such as chalcone synthase. These findings indicate that the orange coloration of C. sulphureus may be associated with CHS-regulated accumulation of naringenin chalcone and downstream compounds in the flavonoid metabolic pathway after CHS, providing valuable theoretical support for a deeper understanding of the causes underlying the differences in flower color between C. bipinnatus and the orange-petaled C. sulphureus.
1. Introduction
Flavonoids are a class of phenolic secondary metabolites that are widely distributed throughout the plant kingdom. From bryophytes to angiosperms, flavonoids accumulate abundantly across diverse plant lineages [1]. Structurally, flavonoids share a characteristic C6-C3-C6 carbon skeleton [2]. They are major secondary metabolites responsible for the coloration of most flowers [3,4,5], fruits, and seeds and are synthesized through branched pathways that yield both colorless compounds (e.g., flavonols) and colored pigments (e.g., anthocyanins, as well as polymeric phlobaphenes and proanthocyanidins) [6]. On the basis of structural features surrounding the heterocyclic C ring, flavonoids can be classified into six major groups: flavanones, flavones, flavonols, isoflavones, anthocyanins, and chalcones [7]. Accumulating evidence indicates that flavonoids regulate plant reproductive processes and exhibit pronounced organ-specific accumulation patterns in stems, leaves, fruits, and other tissues [8]. In addition, flavonoids have strong antioxidant activity and increase stress tolerance to adverse conditions such as ultraviolet radiation, drought, and flooding [9,10]. They can also promote the recruitment and activity of rhizosphere microorganisms and facilitate plant uptake of nitrogen after it is released into the soil [11,12,13].
To date, studies of the flavonoid biosynthetic pathway have relied heavily on model species such as maize, Arabidopsis, and Petunia. Through analyses of flavonoid-related mutants and characterization of numerous structural and regulatory genes [6,7,8], the core flavonoid biosynthetic pathway has been largely established. Flavonoid biosynthesis is a branch of the phenylpropanoid pathway, in which the C6-C3 backbone is derived from phenylalanine [14]. The first committed step of flavonoid biosynthesis is catalyzed by chalcone synthase (CHS), which condenses three molecules of malonyl-CoA with one molecule of 4-coumaroyl-CoA to produce naringenin chalcone. Chalcone isomerase (CHI) then converts naringenin chalcone to naringenin. Naringenin is subsequently hydroxylated by flavanone 3-hydroxylase (F3H) to form dihydrokaempferol, which is further converted to dihydroquercetin and dihydromyricetin by flavonoid 3’-hydroxylase (F3’H) and flavonoid 3’,5’-hydroxylase (F3’5’H) [15], respectively. Finally, sequential reactions catalyzed by dihydroflavonol 4-reductase (DFR) and anthocyanidin synthase (ANS) convert dihydroflavonols into colored anthocyanidin aglycones that are subsequently glycosylated [16]. Using molecular biological approaches, researchers have targeted key biosynthetic enzyme-encoding genes in the flavonoid pathway to modulate their expression and thereby alter flower color in plants [17,18,19].
The CHS gene was first successfully isolated from Petroselinum hortense [20]. CHS belongs to the type III polyketide synthase (PKS) superfamily and is one of its best-known representatives. This family also includes stilbene synthase, acridone synthase, pyrone synthase, bibenzyl synthase, and p-coumaroyl triacetic acid synthase [21,22] and catalyzes the formation of diverse scaffolds for plant secondary metabolites. Type III PKSs show high sequence similarity in amino acid alignment, and PKS-catalyzed reactions are initiated by the thiol group of the catalytic cysteine within the Cys–His–Asn catalytic triad [22]. Moreover, the active-site region of type III PKSs adopts a conserved three-dimensional structure such that substitutions at only a few amino acid residues can markedly reshape the substrate-binding pocket and redirect enzyme function [23]. CHS activity has been linked to pigmentation in multiple plant tissues and to flavonoid accumulation [24,25]. Loss of CHS enzymatic activity can cause albinism and prevent flavonoid accumulation [26,27]. In Oncidium spp., CHS loss of function results in a complete inability of floral organs to accumulate anthocyanins [27]. In Clivia miniata, the expression of multiple CHS genes is significantly greater in red leaves and fruit peels than in green tissues [24]. In Malus spectabilis, CHS has been identified as a key regulatory factor underlying red petal coloration, directly controlling the dynamics of anthocyanin biosynthesis [25]. Gutterson et al. introduced an antisense CHS construct into pink chrysanthemum via Agrobacterium-mediated transformation, resulting in complete flower-color whitening [28]. These findings further suggest that fine-tuned CHS expression patterns contribute to complex floral pigmentation and highlight CHS as an important target for the molecular design of flower color in ornamental plants.
C. bipinnatus is an annual or perennial herbaceous plant in the Asteraceae family (genus Cosmos). Its ray florets can be purplish red, pink, or white [29]. Another species in the genus, C. sulphureus (also known as sulfur Cosmos), differs from C. bipinnatus in that its ray florets are golden yellow or orange [30]. Because of its strong stress tolerance, short growth cycle, and diverse flower colors, Cosmos is widely cultivated as an ornamental plant [31].
Flower color is not only a key ornamental trait but also reflects ecological adaptation, pollinator attraction, and stress-response mechanisms [32,33]. Given these characteristics, Cosmos represents a suitable system for investigating the molecular mechanisms underlying floral coloration. However, the molecular basis for the rich color variation in Cosmos flowers remains unclear. Here, we used white flowers of C. bipinnatus and orange flowers of C. sulphureus as study materials. We first identified flavonoid compounds associated with flower color at the metabolite level. We subsequently screened genes related to flower color divergence at the genetic level and identified two key CHS genes, CCHS2 and CCHS1. Although the metabolomic and transcriptomic differences between the two species may involve broader species-specific biological divergence beyond flower color, this study focuses primarily on resolving the changes in flavonoid metabolic pathways related to flower color. Finally, by characterizing the key CHS genes, we elucidated their specific roles in Cosmos flower color formation.
2. Materials and Methods
2.1. Collection of Plant Materials
Two Cosmos species (white flower C. bipinnatus and orange flower C. sulphureus) were used in this study. The plant materials used were taxonomically authenticated by Prof. Zhihua Liao. The plants were grown at Southwest University, Chongqing, China (29°82′ N, 106°42′ E). Flowers with two distinct petal colors, namely, orange (Cs) and white (Cb), were collected. Immediately after sampling, the sepals and reproductive organs were removed, and the petals were collected, snap-frozen in liquid nitrogen, transported to the laboratory, and stored at −80 °C. Each group included three biological replicates. Fresh petals were collected for subsequent experiments.
2.2. Petal Pigment Extraction and Determination of the Total Flavonoid Content
In plants, orange pigments can be classified into two main categories: lipid-soluble pigments, typically carotenoids, and water-soluble pigments, typically flavonoids [34]. To preliminarily identify the chemical basis underlying the difference in flower color between C. bipinnatus (white petals) and C. sulphureus (orange petals), pigments were extracted using a 1:1 (v/v) mixture of water and dichloromethane [35,36,37]. The total flavonoid content in the two sample types was subsequently determined by a colorimetric method, and the total flavonoid content was expressed as milligrams per gram fresh weight (mg/g FW). Briefly, 0.1 g of fresh petals was weighed, rapidly frozen in liquid nitrogen, and freeze-dried to constant weight. The dried material was ground into a fine powder. The powder was extracted with 1 mL of 70% (v/v) methanol in water, vortexed, and centrifuged. The supernatant was filtered through a 0.22-µm microporous membrane to obtain extracts for total flavonoid quantification.
Next, 1 mL of extract was mixed with 0.2 mL of 10% (w/v) AlCl3 in methanol, 0.2 mL of 1 M potassium acetate, and 5.6 mL of distilled water. The mixture was incubated at room temperature for 30 min, after which the absorbance was measured at 415 nm. A quercetin standard curve was generated by substituting 1 mL of quercetin standard solutions of graded concentrations for the sample extract and processing them in the same manner. The total flavonoid content in the petals of the two colors was calculated using the resulting linear regression equation. The results are expressed as mg/g quercetin equivalents, reported as milligrams per gram of dry extract (mg QE/g) [34].
2.3. Extraction, Identification, and Quantification of Total Flavonoids in Petals
The petals of the two flower colors were collected. For each sample, 0.1 g of fresh petals was weighed, snap-frozen in liquid nitrogen, and immediately ground into a powder. The powder was extracted with 1 mL of 70% (v/v) methanol in water, vortexed for 5 min, and centrifuged for 3 min (12,000 rpm, 4 °C). The supernatant was collected, and the extraction was repeated twice. The supernatants from the two extractions were combined, filtered through a 0.22 µm membrane, transferred to autosampler vials, and used for LC–MS/MS analysis.
The samples were analyzed using a Thermo Fisher LC–MS system consisting of a VanquishTM Flex UHPLC coupled to an Orbitrap ExplorisTM 120 mass spectrometer (Thermo Fisher Scientific, Waltham, MA, USA). A 3 µL aliquot of extract was injected onto a C18 column (Waters ACQUITY UPLC HSS T3, 1.8 µm, 2.1 mm × 150 mm). Metabolite identification and quantification were performed using Compound Discoverer 3.0, with annotations supported by public metabolite databases, including MassBank (http://www.massbank.jp/, accessed on 22 January 2025), KNAPSAcK (https://www.knapsackfamily.com/KNApSAcK/, accessed on 22 January 2025), HMDB (http://www.hmdb.ca/, accessed on 22 January 2025), MoToDB (http://www.ab.wur.nl/moto/, accessed on 22 January 2025), ChemBank (http://chembank.med.harvard.edu/compounds, accessed on 22 January 2025), PubChem (https://pubchemblog.ncbi.nlm.nih.gov/, accessed on 22 January 2025), NIST(https://www.nist.gov/, accessed on 22 January 2025), Chemistry WebBook (http://webbook.nist.gov/, accessed on 22 January 2025), and METLIN (http://metlin.scripps.edu/index.php, accessed on 22 January 2025). Qualitative analysis of MS1 and MS2 data was carried out by comparing accurate precursor ions (Q1), product ions (Q3), and retention times (RT). All the identified flavonoids were putatively annotated, as no authentic reference standards were used in this study. Annotation confidence, mass error, MS/MS spectral matching quality, and absolute abundance were used as supporting evidence for data reliability.
The peak areas for the identified compounds were used for principal component analysis (PCA) and orthogonal partial least squares discriminant analysis (OPLS-DA). Differentially accumulated flavonoids were defined using the following criteria: a fold change ≥ 2 or ≤ 0.5 and a variable importance in projection (VIP) score ≥ 1. OmicShare (https://www.omicshare.com/, accessed on 25 January 2025) was used to perform PCA clustering and volcano plot analysis across three replicates per sample type. TBtoolsV2.210 was used to generate a heatmap of metabolite abundances for the two samples, with both row-wise and column-wise normalization [38].
2.4. Transcriptome Analysis of Petals with Different Colors
Freeze-dried petal tissues were ground at low temperature, and total RNA was extracted using TRIzol reagent. RNA purity was assessed using an Allsheng NanoDrop spectrophotometer (Allsheng, Hangzhou, China, https://www.allsheng.com.cn/products-detail-23, accessed on 25 January 2025). The RNA concentration and total yield were quantified with a Qubit fluorometer. RNA fragment integrity was evaluated by RNase-free agarose gel electrophoresis. mRNA was enriched using mRNA capture beads (oligo dT beads). Fragmented mRNA was reverse transcribed into cDNA, followed by dA tailing for end repair and ligation to sequencing adapters. Magnetic beads were used for purification or size selection, and the libraries were amplified by PCR. Library concentration and fragment size distributions were evaluated, and the libraries were pooled according to the required sequencing output. High-throughput sequencing was performed on a NovaSeq 6000 platform. All procedures were carried out by Benagen Technology Co., Ltd. (Wuhan, China).
Raw reads generated by the sequencing platform were filtered using fastp to obtain high-quality clean reads for downstream assembly and analysis. De novo transcriptome assembly was performed using Trinity v2.1.9. Transcript abundance was quantified with salmon v1.10.1. Redundant protein sequences were removed using CD-HIT v4.8.1. All transcripts were annotated against the Kyoto Encyclopedia of Genes and Genomes (KEGG) database. Genes meeting the criteria of p ≤ 0.05 and a fold change ≥ 2 or ≤ 0.5 were identified as differentially expressed genes (DEGs). OmicShare (https://www.omicshare.com/, accessed on 27 January 2025) was used for volcano plot analysis and correlation heatmap visualization of DEGs among the three sample groups, and KEGG enrichment analysis was performed for subsequent analyses.
Assembly statistics, including N50, N90, average length, total length, GC content, and the number of unigenes, were calculated for quality assessment. Transcript annotation was performed against the KEGG database using BlastKOALA, and the annotation rate was recorded. Detailed quality metrics are provided in the Supplementary Materials (Table S1).
2.5. Quantitative Real-Time PCR Analysis
cDNA prepared from Cosmos and sulfur Cosmos was used for qPCR analysis of CHS2, CHS1, CHI1, CHI2, CYP758, F3H, FLS, FNSII, and KGLT expression with Thermo Fisher’s SYBR dye (https://www.thermofisher.cn/order/catalog/product/cn/zh/S11494, accessed on 30 January 2025). qPCR primers were designed using Primer-BLAST V2.5.0 (https://www.ncbi.nlm.nih.gov/tools/primer-blast/index.cgi, accessed on 30 January 2025). The Cbactin gene was used as the internal reference control [39]. Relative expression levels were calculated using the 2−ΔΔCt method, and statistical significance was determined by Student’s t-test. Primer information, amplification efficiency, melting-curve validation, and amplification curves of the reference gene are available in the Supplementary Materials (Table S2, Figure S1).
2.6. Sequence Alignment and Phylogenetic Analysis of CCHS2 and CCHS1
Reported CHS genes from filamentous fungi, diatoms, and higher plants retrieved from the NCBI database, together with CCHS1 and CCHS2 identified in Cosmos in this study, were used to construct a phylogenetic tree. Amino acid sequences were aligned using the E-INS-i algorithm in MAFFT v7.475. A phylogenetic tree was constructed with IQ-TREE v2.1.2 using a maximum-likelihood model (LG + F + G4). The tree was rooted with CHS from filamentous fungi (Clade 1). Visualization and annotation were performed using iTOL v6.
2.7. Enzyme Activity Assays for CCHS2 and CCHS1
PCR products corresponding to the full-length open reading frames (ORFs) of CCHS2 and CCHS1 were cloned and inserted into the pET28a(+) expression vector, digested with SalI and BamHI, and transformed into the Escherichia coli strain BL21 (DE3). Cells were grown at 37 °C to an OD600 of 0.4–0.6 and induced with 0.5 mM isopropyl beta-D-1-thiogalactopyranoside at 16 °C for 22 h. N-terminal 6xHis-tagged proteins were purified and desalted using a PD MiniTrap G-25 column.
Enzyme reactions (100 µL total volume) were conducted in buffer containing 0.1 M potassium phosphate (pH 7.2) with 30 µg of purified protein, 80 µM 4-coumaroyl-CoA, and 160 µM malonyl-CoA and incubated at 30 °C for 1 h. The reaction products were dissolved in 100 µL of methanol. As a negative control, 30 µg of purified CCHS2 or CCHS1 protein was heat-inactivated by boiling for 15 min and processed in parallel. The reaction mixtures from both the experimental and control groups were analyzed by high-performance liquid chromatography (HPLC) [40,41].
3. Results
3.1. Pigment Extraction and Total Flavonoid Contents in Petals
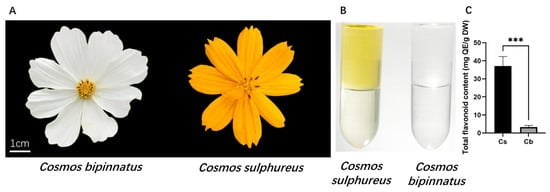
The results of the extraction assays revealed that both the aqueous and organic phases of the extracts from C. bipinnatus white petals were colorless, whereas the extracts from C. sulphureus orange petals displayed an orange–yellow aqueous phase and a light-yellow organic phase. These results indicate that the yellow compounds in C. sulphureus are predominantly water-soluble and are therefore likely to be flavonoids (Figure 1B). The total flavonoid content was subsequently quantified via colorimetric assay. The total flavonoid content in C. sulphureus orange petals was 37.05 mg/g FW, whereas that in C. bipinnatus white petals was 3.26 mg/g FW, indicating that the total flavonoid content in the orange petals is 11.36 times that in the white petals (Figure 1C). Together, these findings support a dominant role for flavonoids in the formation of orange petals. Accordingly, subsequent analyses focused on the flavonoid biosynthetic pathway to elucidate the molecular mechanisms underlying flower color formation.
Figure 1.
Analysis of the total flavonoid content: (A) Flower color phenotypes of C. sulphureus and C. bipinnatus. (B) Pigment extraction from C. sulphureus and C. bipinnatus. (C) Total flavonoid contents in C. sulphureus and C. bipinnatus. QE, quercetin equivalents; Cs, C. sulphureus; Cb, C. bipinnatus. Three biological replicates were used for each group. Asterisks denote statistical significance (* p < 0.05, ** p < 0.01, *** p < 0.001).
3.2. Untargeted Metabolomic Analysis of Petals
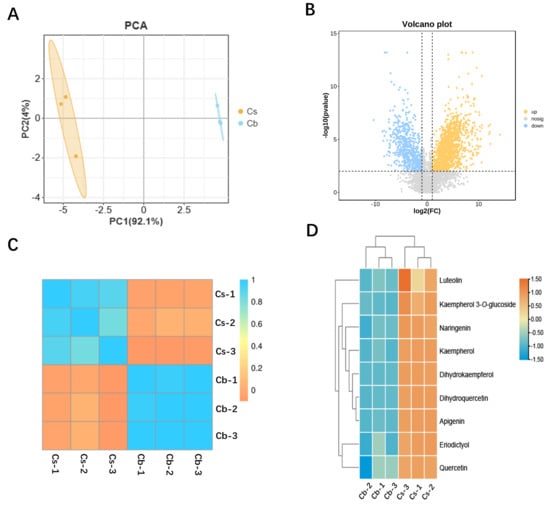
UPLC–MS/MS profiling was performed to characterize the composition and abundance of metabolites in the petals of C. sulphureus and C. bipinnatus, yielding a total of 3845 metabolites identified across the two petal colors. Principal component analysis (PCA) revealed that the first principal component (PC1) and the second principal component (PC2) explained 92.1% and 4.0% of the total variance, respectively, accounting for 96.1% of the overall variation. These findings indicate that PC1 and PC2 capture the major information contained in the original dataset (Figure 2A). Sample clustering further revealed clear separation between orange C. sulphureus petals and white C. bipinnatus petals, while the differences among the biological replicates within each group were small, indicating good reproducibility (Figure 2C).
Figure 2.
Metabolomic analysis of petals from C. sulphureus and C. bipinnatus: (A) PCA of untargeted metabolomic profiles of C. sulphureus and C. bipinnatus. Orange dots (Cs) indicate C. sulphureus, and blue dots (Cb) indicate C. bipinnatus; three biological replicates per group. (B) Differentially abundant metabolites between Cs and Cb petals. Cs, C. sulphureus; Cb, C. bipinnatus; orange dots represent compounds enriched in C. sulphureus, and blue dots represent compounds enriched in C. bipinnatus. (C) Hierarchical clustering of metabolomic samples. Three biological replicates per group were used. (D) Heatmap of the abundances of nine flavonoid compounds in C. sulphureus and C. bipinnatus.
To further identify the metabolites contributing to the color difference between C. bipinnatus (Cb) and C. sulphureus (Cs) petals, a volcano plot was generated with the Log2 fold change (Cs/Cb) on the x-axis and the −log10 (p value) on the y-axis. This analysis revealed 602 metabolites that accumulated at relatively high levels in C. bipinnatus white petals and 1135 metabolites that accumulated at relatively high levels in C. sulphureus petals (Figure 2B). Notably, nine flavonoids were highly abundant in C. sulphureus (Table 1, Figure S2, and Table S3). These compounds are yellow pigments, and their high accumulation in C. sulphureus petals likely underlies yellow coloration, whereas they were barely detectable in C. bipinnatus petals, which appear white (Figure 2D).
Table 1.
Differentially accumulated flavonoid compounds in petals with different flower colors.
3.3. Transcriptome Sequencing and Differential Expression Analysis
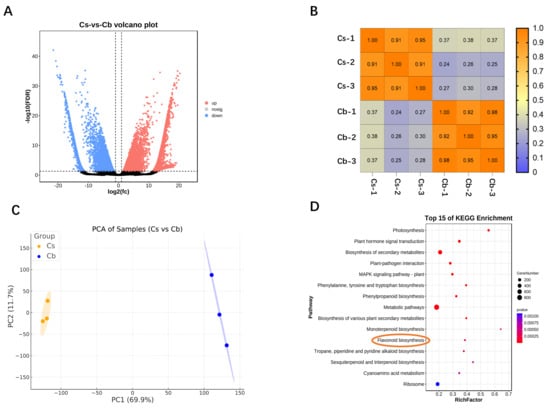
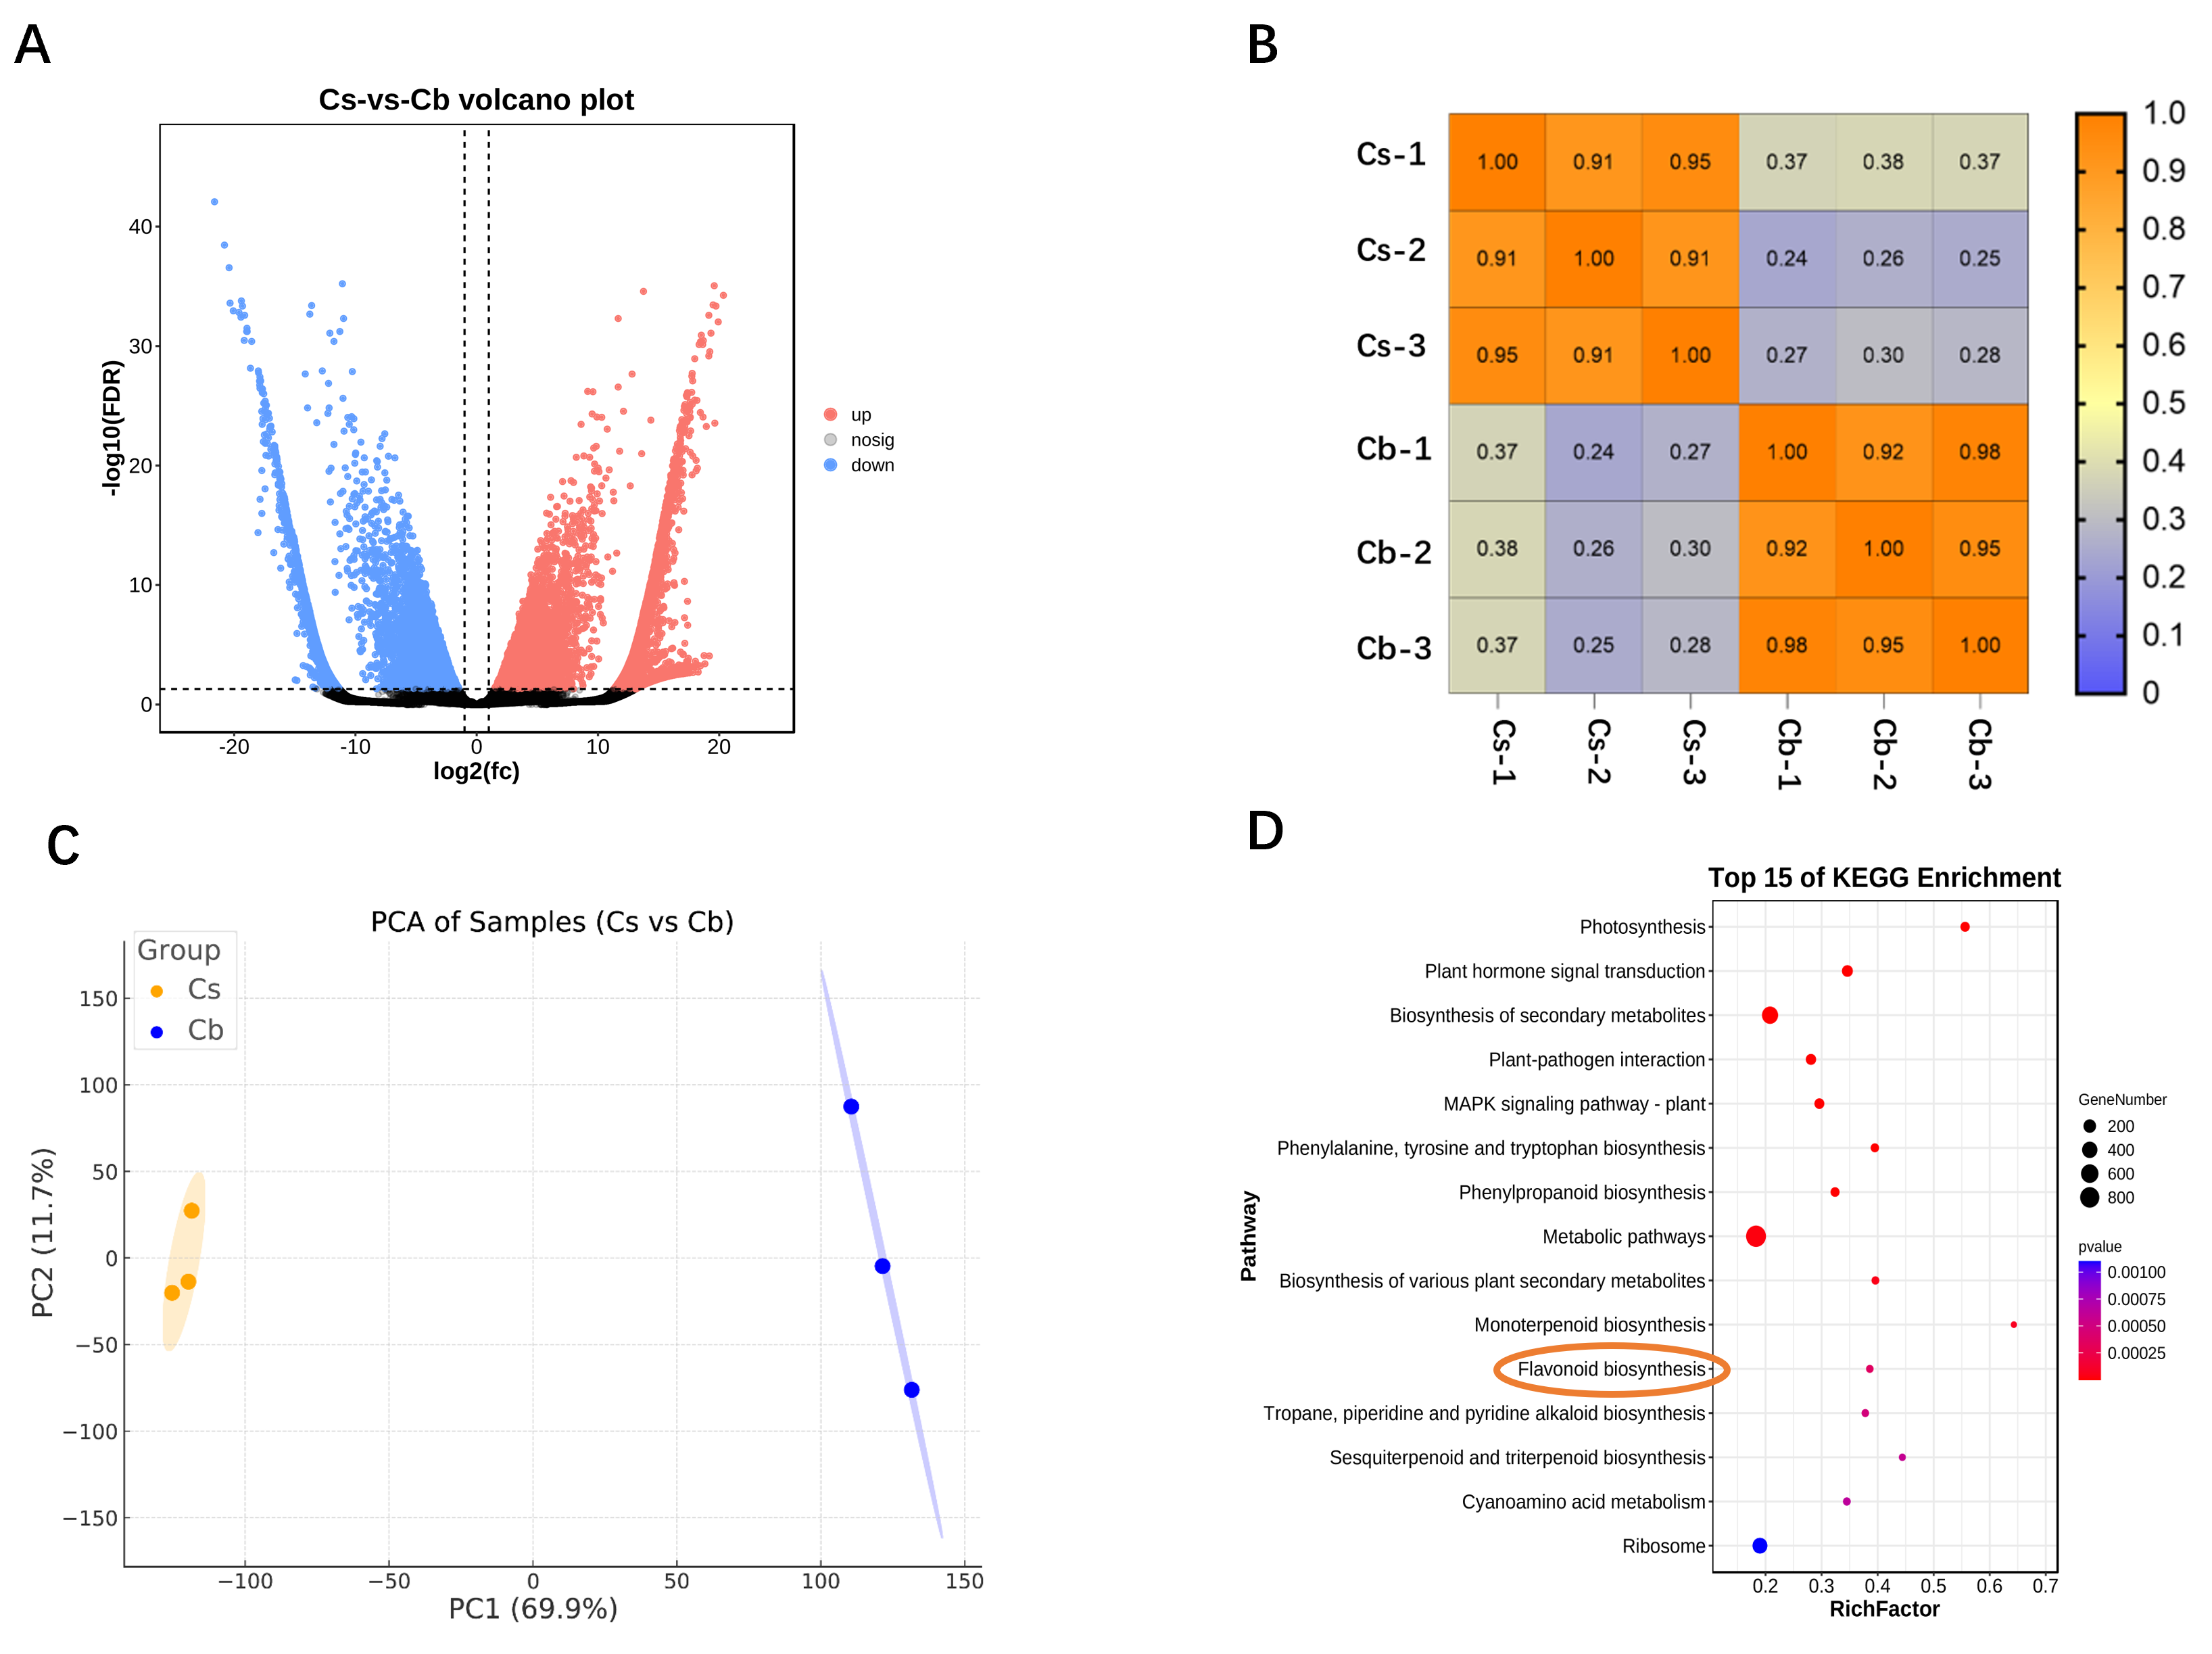
Fresh petals from C. sulphureus and C. bipinnatus were subjected to transcriptome sequencing, with three biological replicates per group. Each replicate yielded more than 6 Gb of data, and the Q30 values exceeded 80% for all the samples. After expression normalization, PCA revealed that PC1 and PC2 explained 69.9% and 11.7% of the total variance, respectively, accounting for 81.6% of the overall variation, indicating that these two components capture the major structure of the dataset (Figure 3C). Sample clustering indicated good reproducibility among the three independent replicates of each species (Figure 3B). The two species were clearly separated, suggesting substantial divergence in gene expression patterns. Differential expression analysis using DESeq2, with thresholds of |log2FoldChange| > 1 and p < 0.05, revealed 13,763 differentially expressed genes (DEGs), including 8073 genes whose expression was upregulated and 5690 genes whose expression was downregulated in C. sulphureus petals (Figure 3A).
Figure 3.
Transcriptome analysis of petals from C. sulphureus and C. bipinnatus: (A) Differentially expressed genes between C. sulphureus and C. bipinnatus petals. (B) Sample clustering analysis of transcriptomic data. Cs, C. sulphureus; Cb, C. bipinnatus. (C) PCA of the transcriptomes of C. sulphureus and C. bipinnatus. Orange dots indicate C. sulphureus; blue dots indicate C. bipinnatus. (D) KEGG enrichment analysis of DEGs between C. sulphureus and C. bipinnatus petals.
In addition, we assessed the quality of the transcriptome assembly and RNA-seq data. The co-assembly generated 760,881 unigenes with an N50 of 1057 bp and an average length of 708.7 bp (Supplementary Table S1-1). For each of the six samples, the clean reads ranged from X to Y million, with Q30 values exceeding 93% and mapping rates to the co-assembled transcriptome ranging from 93.6% to 96.2% (Supplementary Table S1-2). Furthermore, 21.61% of the unigenes were successfully annotated against the KEGG database (Supplementary Table S1-1). These results demonstrate that the transcriptome assembly and RNA-seq data are of high quality and suitable for subsequent differential expression and functional analyses.
KEGG enrichment analysis of the DEGs revealed that the flavonoid biosynthesis pathway was significantly enriched (Figure 3D). These results suggest that the difference in the expression of genes involved in flavonoid biosynthesis contributes to the differences in flower color between C. bipinnatus and C. sulphureus.
3.4. Analysis of the Flavonoid Biosynthetic Pathway
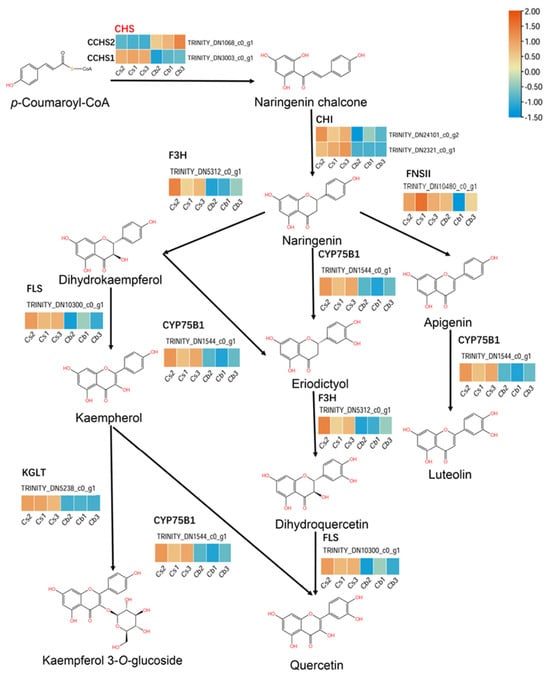
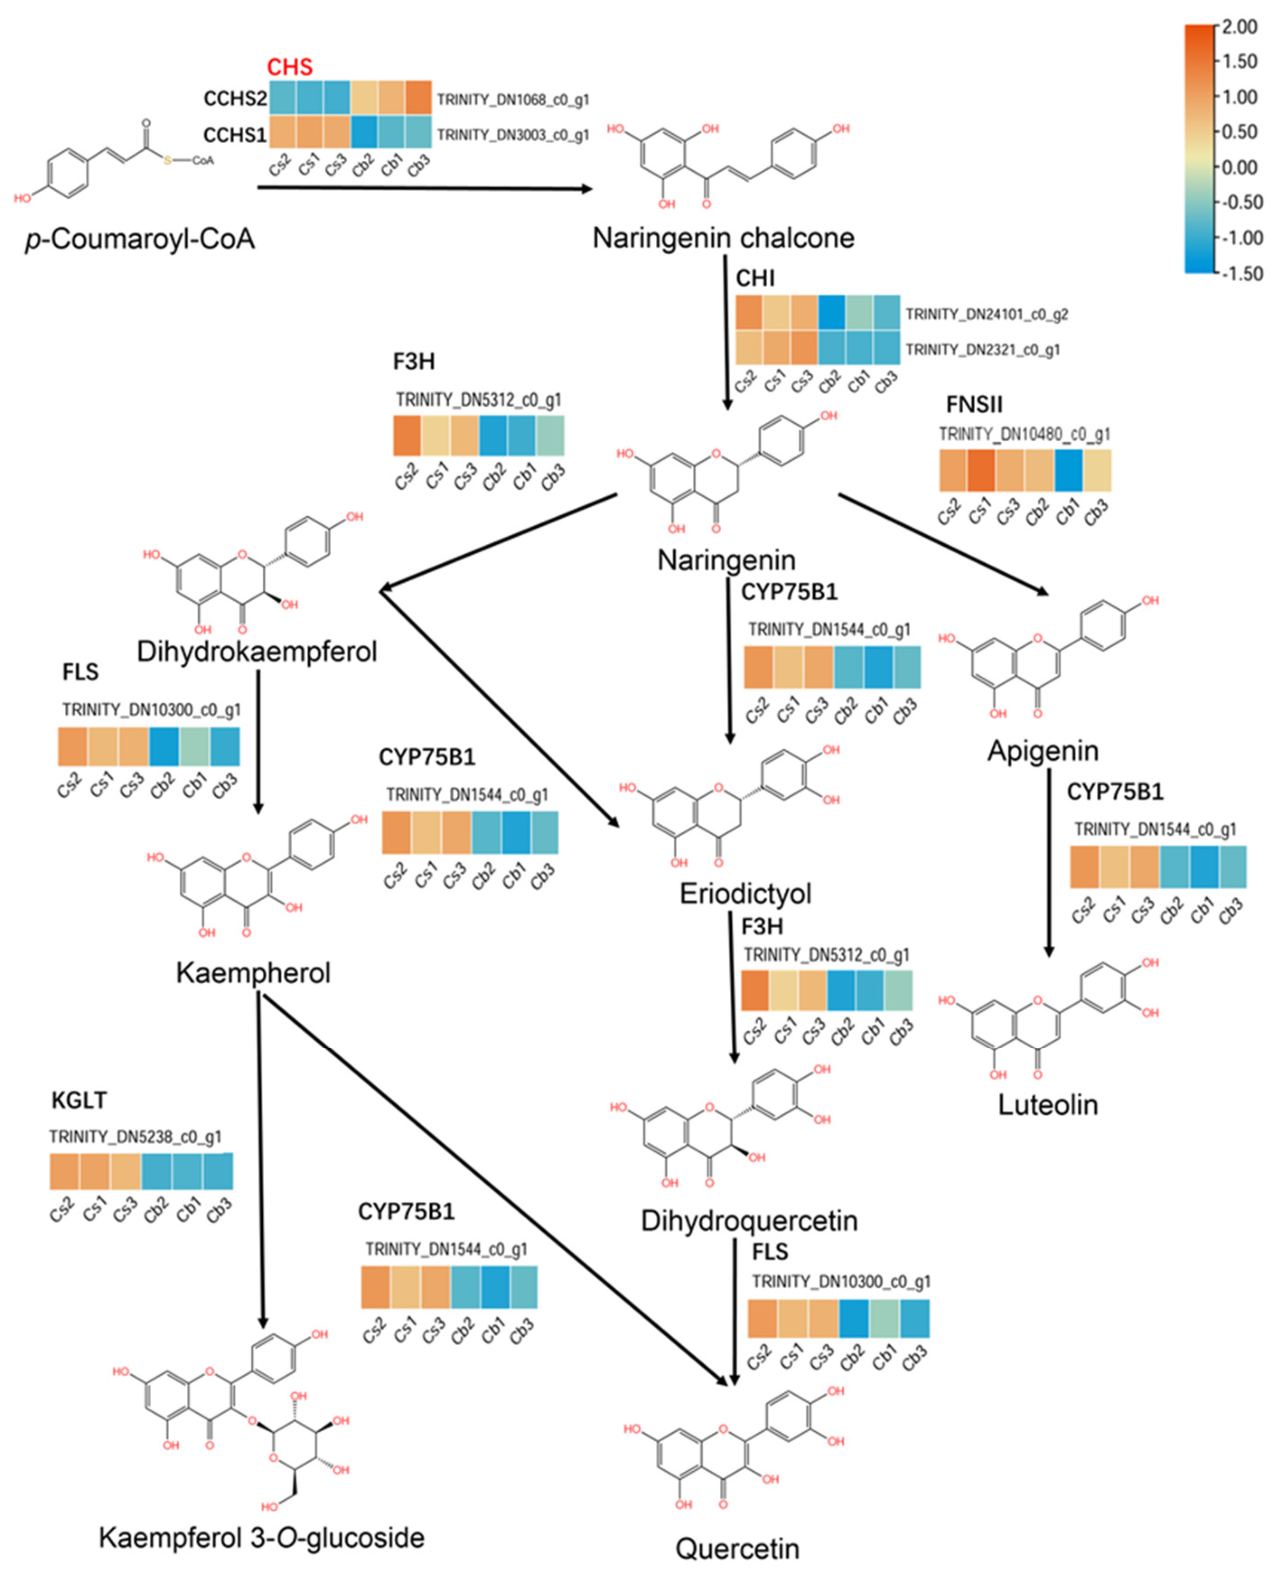
To further elucidate the molecular basis of flower color formation in C. bipinnatus and C. sulphureus, we integrated metabolite accumulation data with transcriptomic expression profiles to systematically analyze key metabolites and enzyme-encoding genes in the flavonoid biosynthetic pathway. The findings delineate the metabolic route from the precursor p-coumaroyl-CoA to multiple flavonoid products, and a heatmap of the expression levels of the corresponding biosynthetic genes is presented in Figure 4.
Figure 4.
Transcriptomic expression patterns of flavonoid biosynthetic genes in C. sulphureus and C. bipinnatus.
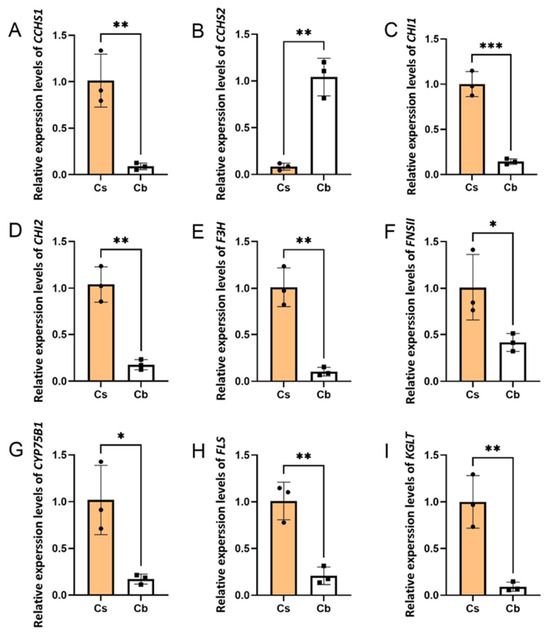
First, chalcone synthase (CHS), the entry-point enzyme of flavonoid biosynthesis, catalyzes the conversion of p-coumaroyl-CoA to naringenin chalcone. Two CHS transcripts were identified in the two species: TRINITY_DN3003_c0_g1 (CCHS1) and TRINITY_DN1068_c0_g1 (CCHS2). CCHS1 was highly expressed in C. sulphureus petals but nearly undetectable in C. bipinnatus petals, whereas CCHS2 showed the opposite pattern, being highly expressed in C. bipinnatus petals but barely expressed in C. sulphureus petals (Figure 5).
Figure 5.
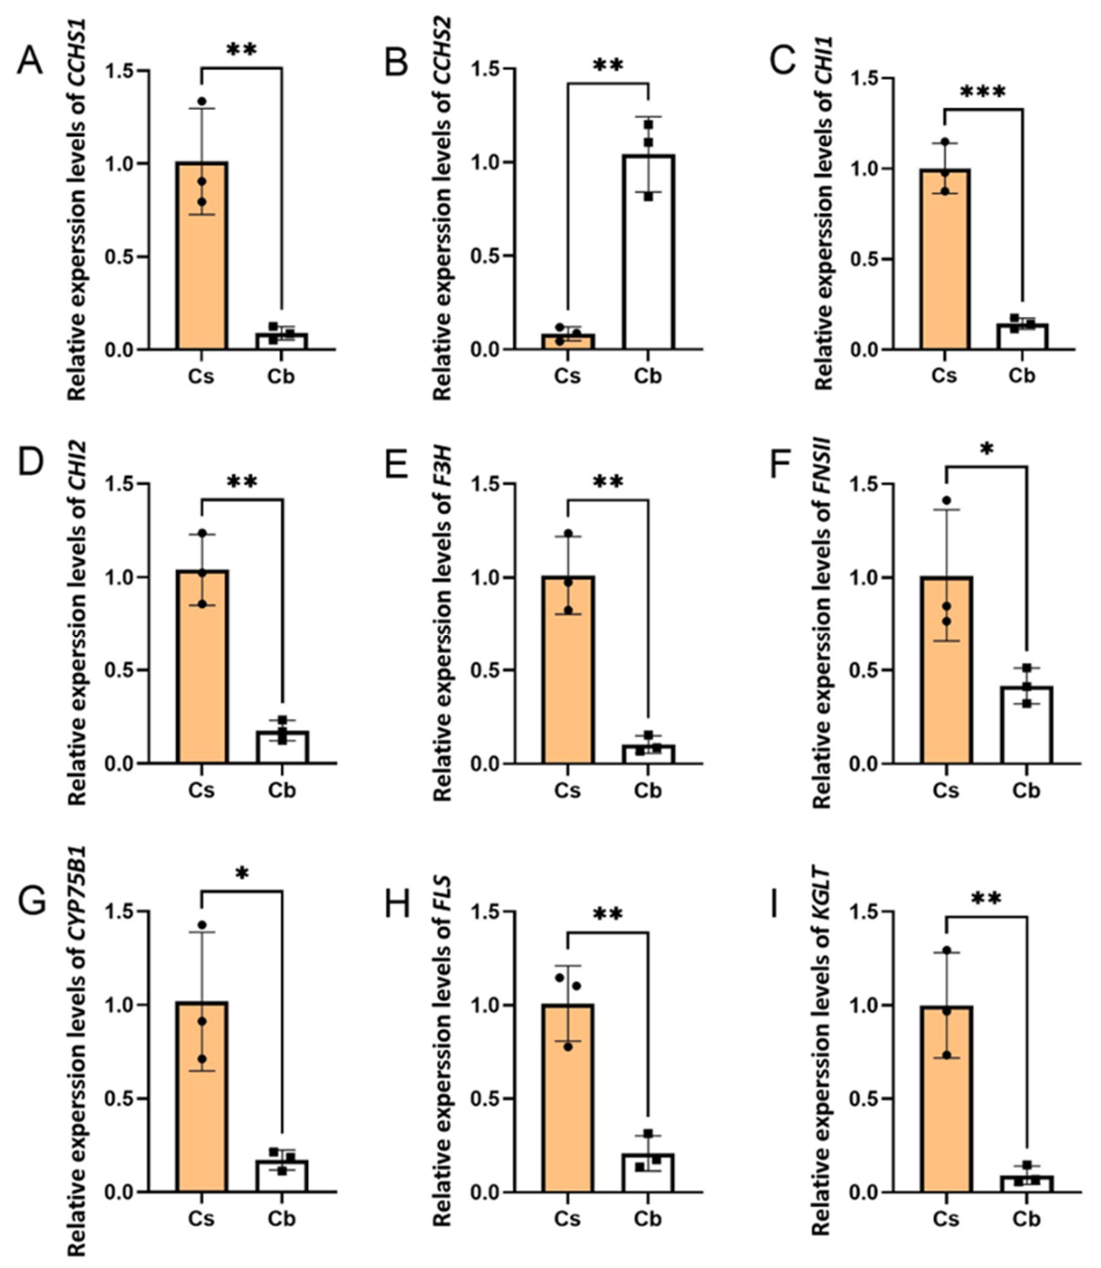
qRT–PCR validation of flavonoid biosynthesis pathway gene expression: (A) CCHS1 (TRINITY_DN3003_c0_g1); (B) CCHS2 (TRINITY_DN1068_c0_g1); (C) CHI1 (TRINITY_DN24101_c0_g2); (D) CHI2 (TRINITY_DN2321_c0_g1); (E) F3H (TRINITY_DN5312_c0_g1); (F) FNSII (TRINITY_DN10480_c0_g1); (G) CYP75B1 (TRINITY_DN1544_c0_g1); (H) FLS (TRINITY_DN10300_c0_g1); (I) KGLT (TRINITY_DN5238_c0_g1). Cs, C. sulphureus (orange bars); Cb, C. bipinnatus (white bars). The error bars represent the standard deviation (n = 3). Asterisks denote statistical significance (* p < 0.05, ** p < 0.01, *** p < 0.001).
Chalcone isomerase (CHI), a key enzyme that catalyzes the isomerization of naringenin chalcone to naringenin, was represented by two transcripts (TRINITY_DN24101_c0_g2 and TRINITY_DN2321_c0_g1), both of which were expressed at significantly higher levels in C. sulphureus petals than in C. bipinnatus petals (Figure 5).
During the conversion of naringenin into multiple downstream branches, F3H (TRINITY_DN5312_c0_g1), FLS (TRINITY_DN10300_c0_g1), CYP75B1 (TRINITY_DN1544_c0_g1), and KGLT (TRINITY_DN5238_c0_g1) play important roles, and all four genes were expressed at much higher levels in C. sulphureus petals than in C. bipinnatus petals (Figure 5). F3H catalyzes the formation of dihydrokaempferol from naringenin. Dihydrokaempferol is then further converted by FLS and CYP75B1 to flavonols such as kaempferol and quercetin. KGLT catalyzes the glycosylation of kaempferol to form astragalin. In addition, FNSII (TRINITY_DN10480_c0_g1) was more highly expressed in C. sulphureus petals than in C. bipinnatus petals; FNSII mediates the formation of apigenin from naringenin, and apigenin is subsequently converted to luteolin by CYP75B1. These expression patterns were further validated by qRT–PCR.
3.5. Phylogenetic Analysis
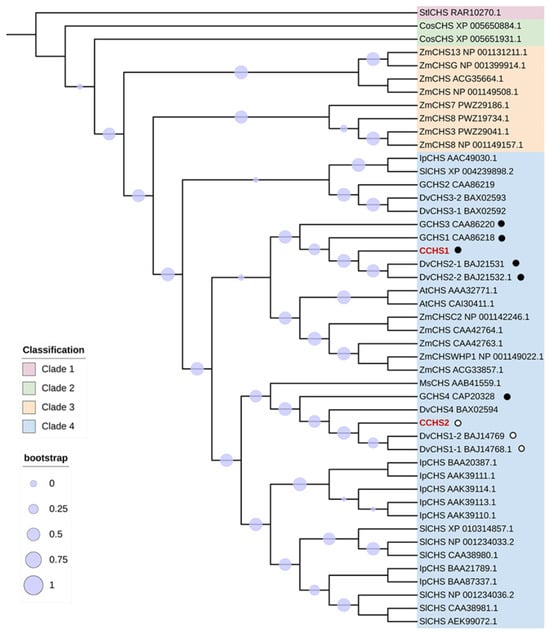
A phylogenetic tree was constructed using CCHS1 and CCHS2 together with previously reported CHS family members from diverse species. These results indicate that CHS phylogeny is closely associated with species evolution. Using CHS from the filamentous fungus Stemphylium lycopersici as the outgroup (Clade 1), Clade 2 contained two CHSs from the green alga Coccomyxa subellipsoidea, Clade 3 contained maize-specific CHSs from monocots, and Clade 4 included numerous CHSs from core angiosperms as well as several maize CHSs (Figure 6).
Figure 6.
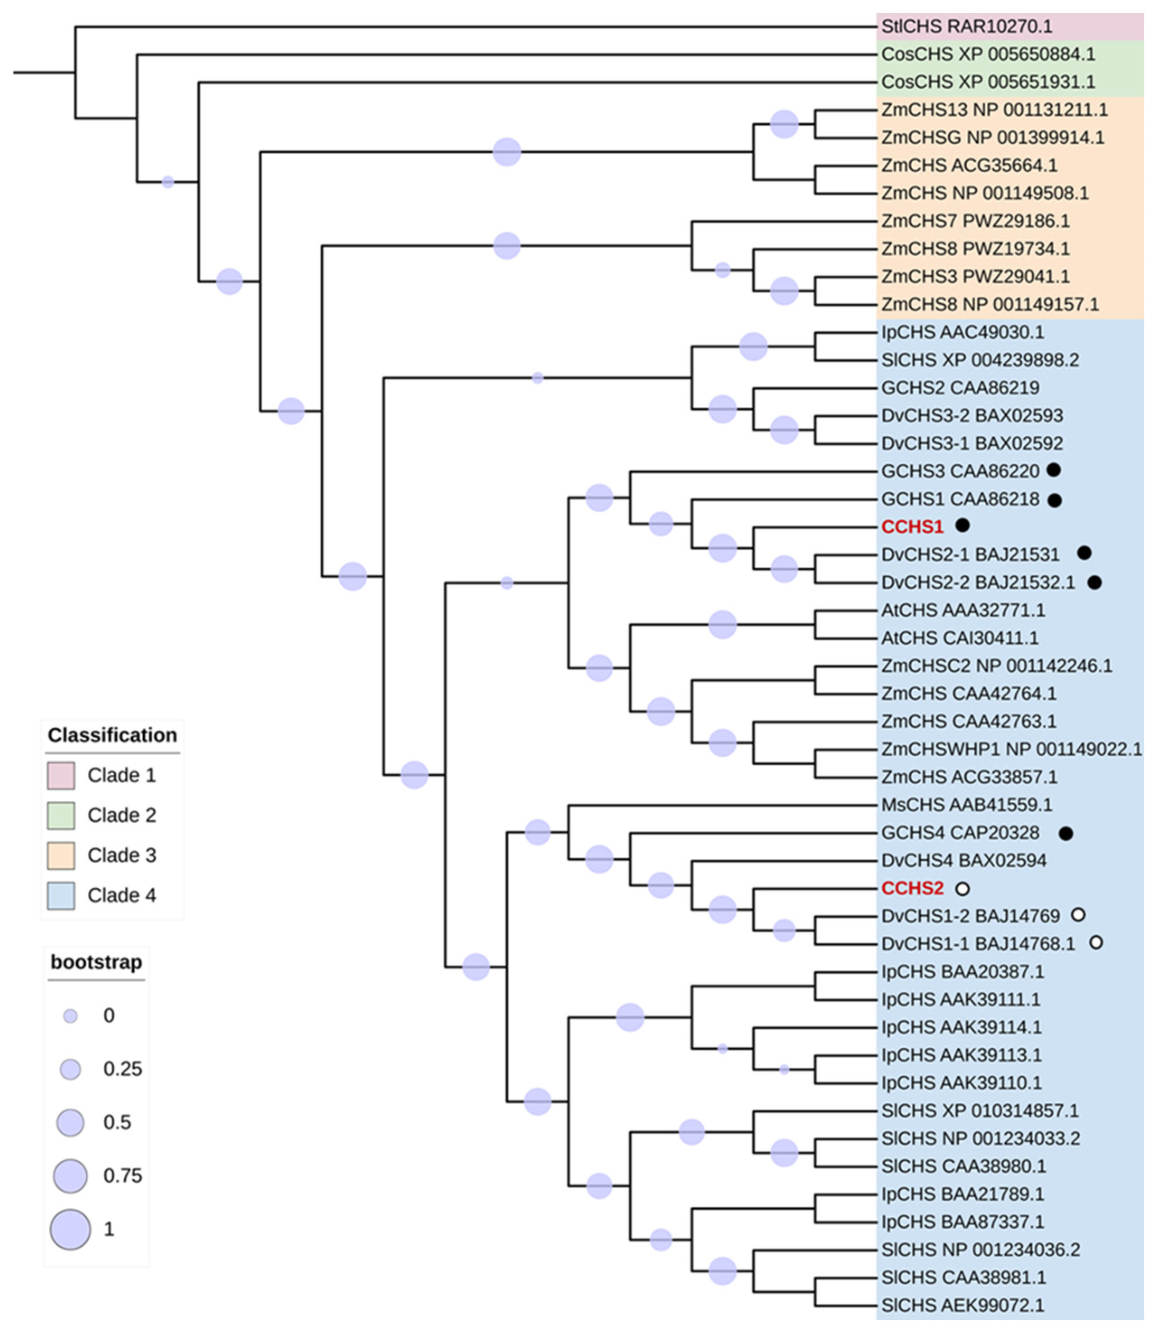
Phylogenetic analysis of CHS proteins. Filled black circles indicate Asteraceae CHSs experimentally validated to catalyze naringenin chalcone formation; open circles indicate Asteraceae CHSs experimentally validated to negatively regulate naringenin chalcone formation, as well as CCHS2 identified in this study as nonfunctional.
Both CCHS1 and CCHS2 clustered within Clade 4, and they shared 80.2% amino acid identity. This clade also contained functionally validated CHSs, including the alfalfa chalcone synthase MsCHS and the gerbera chalcone synthases GCHS1, GCHS3, and GCHS4 (Figure 6), which have been demonstrated to function as catalytic CHSs involved in flavonoid biosynthesis in alfalfa and gerbera petals [41]. The proteins most closely related to CCHS1 and CCHS2 were derived from the bicolored dahlia (Dahlia variabilis), which also belongs to Asteraceae (Figure 6). The closest homolog of CCHS1 was DvCHS2 (Figure 6), with 95.5% amino acid identity. Previous work has shown that DvCHS2 is expressed in the red regions of dahlia petals and acts as a functional CHS contributing to flavonoid biosynthesis [42]. In contrast, the closest homolog of CCHS2 was DvCHS1 (Figure 6), sharing 96.4% amino acid identity. DvCHS1 has been reported to be expressed in the white regions of dahlia petals and to suppress the expression of both itself and DvCHS2 via posttranscriptional gene silencing (PTGS) [43].
Taken together with the expression patterns observed in Cosmos and in bicolored dahlia, CCHS1 and DvCHS2 appear to retain canonical CHS function, catalyzing the formation of the key flavonoid precursor naringenin chalcone. Nevertheless, whether CCHS2, similar to DvCHS1, acts as a negative regulator of flavonoid biosynthesis remains unknown.
3.6. Prokaryotic Recombinant Expression and Functional Characterization of CCHS2 and CCHS1
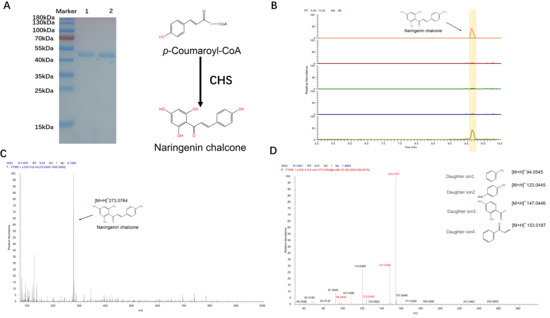
The engineered plasmids were subsequently transformed into competent Escherichia coli BL21 (DE3) cells. Positive clones were screened by colony PCR and induced with IPTG, and the target proteins were purified using Ni-NTA affinity chromatography. The predicted molecular masses of His-tagged CCHS1 and His-tagged CCHS2 were 44.4 kDa and 46.8 kDa, respectively. SDS–PAGE analysis revealed distinct bands between 40 and 50 kDa in the 100 mM imidazole elution fractions in both purification experiments, which is consistent with the expected sizes and indicates successful purification of the recombinant proteins (Figure 7A).
Figure 7.
Expression and functional identification of CCHS2 and CCHS1: (A) SDS–PAGE analysis of His-tagged CCHS1 and His–tagged CCHS2. Lane 1, 100 mM imidazole elution for His–tagged CCHS1 purification; Lane 2, 100 mM imidazole elution for His-tagged CCHS2 purification. (B) Enzymatic activity analysis of His–tagged CCHS1 and His–tagged CCHS2. (C) MS1 spectrum of the product catalyzed by His–tagged CCHS1. (D) MS2 spectrum of the product catalyzed by His–tagged CCHS1.
Freshly purified His-tagged CCHS1 and His-tagged CCHS2 were immediately used for in vitro activity assays, and the reaction products were identified by LC–MS/MS. When malonyl-CoA and coumaroyl-CoA were used as substrates, His-tagged CCHS1 produced a characteristic compound with an [M+H]+ m/z of 273.0764. Its diagnostic fragment ions [M+H]+ at m/z 94.0545, 123.0445, 147.0446, and 153.0187 matched those of the naringenin chalcone standard (Figure 7D). This product eluted at 9.61 min, which is consistent with the retention time of the naringenin chalcone standard (Figure 7B). In contrast, neither His-tagged CCHS2 nor heat-inactivated protein produced this product (Figure 7B). These results demonstrate that CCHS1, which is highly expressed in C. sulphureus, catalyzes the formation of naringenin chalcone from malonyl-CoA and coumaroyl-CoA. Naringenin chalcone can then be converted by downstream enzymes into multiple yellow flavonoid compounds. In contrast, CCHS2, which is highly expressed in C. bipinnatus, lacks detectable catalytic activity for naringenin chalcone formation, thereby limiting flavonoid biosynthesis and resulting in white petals.
4. Discussion
In addition to their diverse biological functions in plants, flavonoids are among the key determinants of pigmentation in flowers and fruits. Here, we used C. bipinnatus (white petals) and C. sulphureus (orange petals) as study systems to investigate the molecular mechanisms underlying flower color formation. By integrating metabolomics, transcriptomics, and molecular approaches with a focus on flavonoids, we identified factors responsible for the color divergence between these two species.
By pigment extraction followed by untargeted LC–MS/MS metabolomics, we identified a set of flavonoid compounds associated with flower color. These compounds accumulated at high levels in C. sulphureus petals. Their conjugated double-bond systems exhibit absorption maxima in the UV–visible region (380–450 nm), resulting in a bright yellow appearance [44]. Previous studies have further shown that the position of the hydroxyl groups in flavonoids from orange flowers can increase molecular conjugation and yellow hues [45] and that flavonoid accumulation in petal epidermal cells is positively correlated with increased yellow intensity [46]. Together, these findings underscore the importance of flavonoid accumulation for yellow pigmentation. In contrast, flavonoid levels are markedly lower in white petals than in orange petals, which is consistent with the white phenotype. Notably, flower color is shaped not only by the abundance and composition of flavonoids but also by the vacuolar microenvironment, metal ions, and copigmentation effects [47,48]. Although these factors have been most thoroughly characterized in anthocyanin-based coloration, variations in cellular pH may also influence the stability and visual expression of flavonoid-derived yellow pigments, thereby modulating color hue and intensity. Moreover, flavonoids may interact with other phenolic compounds, including flavonols, flavones, and hydroxycinnamic acid derivatives, altering their light absorption properties and enhancing or stabilizing petal pigmentation [49]. In orange flowers, carotenoids may further contribute to visible coloration, either independently or in concert with flavonoids [50,51]. However, in this study, carotenoids were barely visible in the oil phase during the extraction experiment, and no clear presence of carotenoids was detected in the metabolomic analysis. Thus, the orange phenotype of C. sulphureus is likely not determined by flavonoid accumulation alone but may arise from the combined effects of the vacuolar environment, pigment copigmentation, and carotenoids or other auxiliary pigments. Future studies combining targeted carotenoid profiling, vacuolar pH measurements, and pigment interaction analyses will help clarify the relative contributions of these factors to flower color formation in Cosmos.
Comparative transcriptomic analyses of the flavonoid biosynthetic pathway in the petals of C. sulphureus and C. bipinnatus revealed significant upregulation of genes encoding chalcone isomerase (CHI), flavanone 3-hydroxylase (F3H), flavone synthase II (FNSII), flavonoid hydroxylase (CYP75B1), flavonol synthase (FLS), and a glycosyltransferase (KGLT) in C. sulphureus. High CHI expression promotes the conversion of chalcones to flavanones, thereby establishing a stable flavonoid backbone [52]. Elevated F3H activity drives the conversion of flavanones to dihydroflavonols, which supply substrates for downstream flavone/flavonol branches [53]. In contrast, reduced expression or silencing of these genes in C. bipinnatus petals likely constrains flux through the pathway and limits the production of pigmented flavonoid derivatives [54]. Moreover, differential expression of FNSII can directly affect flavone biosynthetic efficiency; loss of FNSII expression has been associated with sharply reduced apigenin accumulation [55]. In addition, CYP75B1-mediated B-ring hydroxylation can increase absorption in the visible range and thereby increase coloration [56]. The high expression of FLS in C. sulphureus may also promote the accumulation of flavonols (e.g., quercetin), which can stabilize yellow tones via copigmentation with chalcones [57]. Finally, KGLT-mediated glycosylation alters flavonoid solubility and vacuolar deposition patterns; highly glycosylated flavonoids often display weaker coloration because of increased dispersion [58]. Collectively, these expression differences likely drive pronounced differences in flavonoid composition and abundance, resulting in yellow–orange versus white phenotypes [59].
On the basis of the transcriptomic data and the results of the in vitro enzymatic activity assays of CCHS1 and CCHS2, we hypothesize that the white/orange flower color differentiation between C. bipinnatus and C. sulphureus is closely associated with the allocation of CHS-mediated flavonoid metabolic flux. This phenomenon may be attributable to the role of the “metabolic bottleneck effect” in flower pigmentation. In the present study, the expression level of CHS, the rate-limiting enzyme that initiates flavonoid biosynthesis, directly affected the accumulation threshold of naringenin chalcone, thereby controlling the flux through downstream metabolic branches [22,60]. In C. sulphureus, CCHS1 ensures an abundant supply of chalcone precursors by efficiently catalyzing the condensation of 4-coumaroyl-CoA and malonyl-CoA, maintaining the continuous synthesis of flavones and flavonols [61,62]. Conversely, the deficiency of chalcone synthesis in white C. bipinnatus [63] forces the metabolic flux toward nonchromogenic compounds [64], a metabolic remodeling mechanism highly similar to that observed in white-flowered mutants of Brassicaceae [65].
In addition, we hypothesize that the impact of CHS functional loss on the floral phenotype may have evolutionary adaptive significance. For instance, the UV absorption properties of chalcones facilitate photoprotection under intense light [66]; C. sulphureus achieves both pigmentation and stress resistance through high CHS expression, whereas white C. bipinnatus might sacrifice pigmentation for other adaptive advantages, such as reduced metabolic costs [67]. Furthermore, the impact of genetic mutations on CHS activity warrants attention: in Chrysanthemum, mutations in the CHS gene trigger petal bleaching [68], which is a possible mechanism for the variation in flower color in Cosmos. Recent evidence indicated that genotypic variation in environmental response modulates resource allocation and secondary metabolism, suggesting that C. sulphureus may employ high CHS expression for pigmentation and photoprotection, whereas C. bipinnatus may divert resources to alternative adaptive traits [69]. These hypotheses have not yet been validated in Cosmos species and currently remain speculative. Nevertheless, they provide new directions for subsequent experimental investigations.
5. Conclusions
In this study, white-petaled C. bipinnatus and orange-petaled C. sulphureus were used as research materials. By combining pigment extraction, untargeted LC–MS/MS metabolomics, comparative transcriptomics, and related molecular analyses, we systematically investigated the causes of flower color differentiation in the genus Cosmos. The results revealed that the differences in flower color between the two species were closely related to the accumulation levels and compositional differences of flavonoids, as well as changes in the expression of key structural genes in the flavonoid biosynthesis pathway.
Metabolomic analysis revealed that compared with white petals, orange petals of C. sulphureus were significantly enriched in multiple flavonoid compounds related to yellow-to-orange coloration. These compounds have strongly conjugated structures and can absorb in the ultraviolet–visible region, thereby promoting the formation of yellow or orange tones in petals. In contrast, the accumulation levels of related flavonoid metabolites in the white petals of C. bipinnatus were relatively low, indicating that insufficient synthesis of flavonoid pigments is one of the important reasons for its white color. Follow-up experiments should investigate other factors in addition to flavonoids, such as vacuolar pH and carotenoids, to address the limitations of the current study.
Transcriptome analysis further revealed that genes related to the flavonoid biosynthesis pathway were generally expressed at relatively high levels in C. sulphureus petals. In particular, the upregulation of genes such as CHI, F3H, FNSII, CYP75B1, FLS, and KGLT may promote flavonoid skeleton formation, hydroxylation modification, flavone/flavonol branch metabolism, and glycosylation, thereby increasing the synthesis and accumulation of colored flavonoid derivatives. In contrast, the lower expression levels of these genes in C. bipinnatus may restrict flavonoid metabolic flux, resulting in insufficient production of colored compounds.
In addition, this study emphasized the central regulatory role of CHS in flower color formation in Cosmos. As the initial rate-limiting enzyme in the flavonoid biosynthesis pathway, the expression level and functional status of CHS directly affect the synthesis of chalcone precursors and further determine the metabolic flux distribution of downstream flavonoids. In C. sulphureus, the high expression of CCHS1 may ensure a continuous supply of chalcone precursors, thereby promoting the accumulation of flavones and flavonol pigments. In C. bipinnatus, weakened CHS-related function may cause a “metabolic bottleneck” in the flavonoid biosynthesis pathway, directing metabolic flux toward colorless or weakly colored branches and ultimately leading to the formation of a white-petal phenotype. According to the results of the phylogenetic tree analysis, the amino acid sequence of CCHS2 in white flowers was highly similar to that of the other two types of CHS genes. Therefore, it is speculated that the expression of CCHS2 may negatively regulate CCHS1, and follow-up experiments will further investigate this possibility.
In summary, the white/orange flower color differentiation between C. bipinnatus and C. sulphureus is the result of the combined effects of multilayered regulation, among which differences in flavonoid metabolite accumulation and CHS-mediated flavonoid metabolic flux distribution are important factors.
Supplementary Materials
The following supporting information can be downloaded at: https://www.mdpi.com/article/10.3390/horticulturae12070771/s1, Figure S1. qPCR melting curve; Figure S2. MSMS spectra of nine flavonoids. Table S1. Transcriptome quality assessment; Table S2. qPCR primer information; Table S3. Other detection data for the nine flavonoids. Text S1. Sequences involved in phylogenetic tree construction.
Author Contributions
Conceptualization, L.Z. and W.C.; methodology, L.Z. and W.C.; software, W.C., F.Z. and J.L.; validation, W.C., S.H., M.Y., Z.L., J.Z. and X.L.; formal analysis, W.C., C.G. and M.Q.; investigation, M.Z. and C.Y.; resources, M.Z. and C.Y.; data curation, W.C.; writing—original draft preparation, L.Z. and W.C.; writing—review and editing, L.Z. and W.C.; visualization, L.Z.; supervision, L.Z. and C.Y.; project administration, L.Z.; funding acquisition, L.Z.; LC-MS analysis, L.Z. All authors have read and agreed to the published version of the manuscript.
Funding
This work was supported by the Chongqing Postgraduate Research and Innovation Project (CYB240105) and the Science and Technology Foundation of Xizang Autonomous Region (XZ202401ZY0009).
Data Availability Statement
The transcriptome data and gene sequences have been uploaded to NCBI. C. sulphureus’s transcriptome is PRJNA1451823, and C. bipinnatus’s transcriptome is PRJNA1451726. C. sulphureus’s gene sequence is PZ310414, and C. bipinnatus’s gene sequence is PZ310415. The original contributions presented in this study are included in the article. Further inquiries can be directed to the corresponding authors.
Conflicts of Interest
The authors declare no conflicts of interest.
Abbreviations
The following abbreviations are used in this manuscript:
| CHS | Chalcone synthase |
| CHI | Chalcone isomerase |
| F3H | Flavanone 3-hydroxylase |
| F3’H | Flavanone 3’-hydroxylase |
| DFR | Dihydroflavonol 4-reductase |
| ANS | Anthocyanin synthase |
| UFGT | Flavonoid-3-O-glucosyltransferase |
| PSY | Phytoene synthase |
| PDS | Phytoene desaturase |
| ZDS | ζ-carotene desaturase |
| LCYB | Lycopene β cyclase |
| LC-MS/MS | Liquid chromatograph mass spectrometer |
| HPLC | High-performance liquid chromatography |
| PCR | Polymerase chain reaction |
| qRT-PCR | Quantitative real-time polymerase chain reaction |
| CCHS2 | Cosmos bipinnatus chalcone synthase |
| CCHS1 | Cosmos sulphureus chalcone synthase |
| CYP75B1 | Cytochrome75B1 |
| FNSII | Flavone synthase II |
| KGLT | Kaempferol 3-O-β-D-galactosyltransferase |
| StlCHS | Stemphylium lycopersici Chalcone synthase |
| CosCHS | Coccomyxa subellipsoidea Chalcone synthase |
| ZmCHS | Zea mays chalcone synthase |
| IpCHS | Ipomoea nil chalcone synthase |
| SlCHS | Solanum lycopersicum chalcone synthase |
| GCHS | Gerbera jamesonii chalcone synthase |
| DvCHS | Dahlia variabilis chalcone synthase |
References
- Koes, R.E.; Quattrocchio, F.; Mol, J.N.M. The flavonoid biosynthetic pathway in plants: Function and evolution. BioEssays 1994, 16, 123–132. [Google Scholar] [CrossRef] [Scilit]
- Weston, L.A.; Mathesius, U. Flavonoids: Their structure, biosynthesis and role in the rhizosphere, including allelopathy. J. Chem. Ecol. 2013, 39, 283–297. [Google Scholar] [CrossRef] [Scilit] [PubMed]
- Zheng, T.; Zhang, D.-L.; Sun, B.-Y.; Liu, S.-M. Evaluating the impacts of climate factors and flavonoids content on Chinese prickly ash peel color based on HPLC-MS and structural equation model. Foods 2022, 11, 2539. [Google Scholar] [CrossRef] [Scilit] [PubMed]
- Yang, L.; Tian, L.; Shi, J.; Wei, A. Transcriptome and metabolome profiling provide insights into flavonoid biosynthesis and the mechanism of color formation in Zanthoxylum bungeanum Maxim. Plants 2025, 14, 558. [Google Scholar] [CrossRef] [Scilit] [PubMed]
- Zhang, X.; Zhang, L.; Zhang, D.; Liu, Y.; Lin, L.; Xiong, X.; Zhang, D.; Sun, M.; Cai, M.; Yu, X.; et al. Transcriptomic and metabolomic profiling provides insights into flavonoid biosynthesis and flower coloring in Loropetalum chinense and Loropetalum chinense var. rubrum. Agronomy 2023, 13, 1296. [Google Scholar] [CrossRef] [Scilit]
- Koes, R.; Verweij, W.; Quattrocchio, F. Flavonoids: A colorful model for the regulation and evolution of biochemical pathways. Trends Plant Sci. 2005, 10, 236–242. [Google Scholar] [CrossRef] [Scilit] [PubMed]
- Peterson, J.; Dwyer, J. Flavonoids: Dietary occurrence and biochemical activity. Nutr. Res. 1998, 18, 1995–2018. [Google Scholar] [CrossRef] [Scilit]
- Falcone Ferreyra, M.L.; Rius, S.P.; Casati, P. Flavonoids: Biosynthesis, biological functions, and biotechnological applications. Front. Plant Sci. 2012, 3, 222. [Google Scholar] [CrossRef] [Scilit] [PubMed]
- Ninkuu, V.; Aluko, O.O.; Yan, J.; Zeng, H.; Liu, G.; Zhao, J.; Li, H.; Chen, S.; Dakora, F.D. Phenylpropanoids metabolism: Recent insight into stress tolerance and plant development cues. Front. Plant Sci. 2025, 16, 1571825. [Google Scholar] [CrossRef] [Scilit] [PubMed]
- Shomali, A.; Das, S.; Arif, N.; Sarraf, M.; Zahra, N.; Yadav, V.; Aliniaeifard, S.; Chauhan, D.K.; Hasanuzzaman, M. Diverse physiological roles of flavonoids in plant environmental stress responses and tolerance. Plants 2022, 11, 3158. [Google Scholar] [CrossRef] [Scilit] [PubMed]
- Schwinn, K.E.; Ngo, H.; Kenel, F.; Brummell, D.A.; Albert, N.W.; McCallum, J.A. The onion (Allium cepa L.) R2R3-MYB gene MYB1 regulates anthocyanin biosynthesis. New Phytol. 2016, 210, 953–963. [Google Scholar] [CrossRef] [Scilit]
- Shehata, M.G.; Al Marzooqi, H.M.; Afifi, H.S.; Masry, S.H.D. Phytochemical characterization and antioxidant, antimicrobial, and poultry meat preservation potential of Ziziphus mauritiana. Foods 2026, 15, 1193. [Google Scholar] [CrossRef] [Scilit] [PubMed]
- Lugo-Gamboa, R.R.; Muñoz-Sevilla, N.P.; Apún-Molina, J.P.; Fierro-Coronado, J.A.; Cruz-Mendívil, A.; Espinoza-Ortiz, M.; Valdez-Morales, M.; Santamaria-Miranda, A. Phenolic profile and antioxidant capacity of extracts from papache (Randia echinocarpa Moc. & Sessé Ex DC), a plant used in traditional Mexican medicine. Plants 2026, 15, 1086. [Google Scholar] [CrossRef] [Scilit] [PubMed]
- Liu, W.; Feng, Y.; Yu, S.; Fan, Z.; Li, X.; Li, J.; Yin, H. The flavonoid biosynthesis network in plants. Int. J. Mol. Sci. 2021, 22, 12824. [Google Scholar] [CrossRef] [Scilit] [PubMed]
- Zhu, S.; Fu, R.; Martin, C.; Zhao, Q.; Zhang, Y. Recent advances in biosynthesis, regulation, and metabolic engineering of flavonoids. Plant Physiol. 2025, 199, kiaf356. [Google Scholar] [CrossRef] [Scilit] [PubMed]
- Ma, Y.; Ma, X.; Gao, X.; Wu, W.; Zhou, B. Light induced regulation pathway of anthocyanin biosynthesis in plants. Int. J. Mol. Sci. 2021, 22, 11116. [Google Scholar] [CrossRef] [Scilit] [PubMed]
- Tanaka, Y.; Sasaki, N.; Ohmiya, A. Biosynthesis of plant pigments: Anthocyanins, betalains and carotenoids. Plant J. 2008, 54, 733–749. [Google Scholar] [CrossRef] [Scilit] [PubMed]
- Noda, N.; Yoshioka, S.; Kishimoto, S.; Nakayama, M.; Douzono, M.; Tanaka, Y.; Aida, R. Generation of blue chrysanthemums by anthocyanin B-ring hydroxylation and glucosylation and its coloration mechanism. Sci. Adv. 2017, 3, e1602785. [Google Scholar] [CrossRef] [Scilit] [PubMed]
- Tanaka, Y.; Brugliera, F.; Kalc, G.; Senior, M.; Dyson, B.; Nakamura, N.; Katsumoto, Y.; Chandler, S. Flower color modification by engineering of the flavonoid biosynthetic pathway: Practical perspectives. Biosci. Biotechnol. Biochem. 2010, 74, 1760–1769. [Google Scholar] [CrossRef] [Scilit] [PubMed]
- Reimold, U.; Kröger, M.; Kreuzaler, F.; Hahlbrock, K. Coding and 3′ non-coding nucleotide sequence of chalcone synthase mRNA and assignment of amino acid sequence of the enzyme. EMBO J. 1983, 2, 1801–1805. [Google Scholar] [CrossRef] [Scilit] [PubMed]
- Austin, M.B.; Noel, J.P. The chalcone synthase superfamily of type III polyketide synthases. Nat. Prod. Rep. 2003, 20, 79–110. [Google Scholar] [CrossRef] [Scilit] [PubMed]
- Ferrer, J.L.; Jez, J.M.; Bowman, M.E.; Dixon, R.A.; Noel, J.P. Structure of chalcone synthase and the molecular basis of plant polyketide biosynthesis. Nat. Struct. Mol. Biol. 1999, 6, 775–784. [Google Scholar] [CrossRef] [Scilit] [PubMed]
- Jez, J.M.; Bowman, M.E.; Dixon, R.A.; Noel, J.P. Structure and mechanism of the evolutionarily unique plant enzyme chalcone isomerase. Nat. Struct. Biol. 2000, 7, 786–791. [Google Scholar] [CrossRef] [Scilit] [PubMed]
- Liu, Y.; Li, Y.Q.; Meng, X.Y.; Huang, J.; Tang, H.; Li, Y.H.; Gao, X.; Zhao, C.L. Cloning and Functional Characterization of Chalcone Synthase Genes (CmCHS) from Clivia miniata. Acta Hortic. Sin. 2021, 48, 1847–1858. [Google Scholar]
- Tai, D.; Tian, J.; Zhang, J.; Song, T.; Yao, Y. A Malus crabapple chalcone synthase gene, McCHS, regulates red petal color and flavonoid biosynthesis. PLoS ONE 2017, 9, e110570. [Google Scholar] [CrossRef] [Scilit]
- van der Krol, A.R.; Lenting, P.E.; Veenstra, J.; van der Meer, I.M.; Koes, R.E.; Gerats, A.G.M.; Mol, J.N.M.; Stuitje, A.R. An anti-sense chalcone synthase gene in transgenic plants inhibits flower pigmentation. Nature 1988, 333, 866–869. [Google Scholar] [CrossRef] [Scilit]
- Liu, X.-J.; Chuang, Y.-N.; Chiou, C.-Y.; Chin, D.-C.; Shen, F.-Q.; Yeh, K.-W. Methylation effect on chalcone synthase gene expression determines anthocyanin pigmentation in floral tissues of two Oncidium orchid cultivars. Planta 2012, 236, 401–409. [Google Scholar] [CrossRef] [Scilit] [PubMed]
- Courtney-Gutterson, N.; Napoli, C.; Lemieux, C.; Morgan, A.; Firoozabady, E.; Robinson, K.E.P. Modification of flower color in florist’s chrysanthemum: Production of a white–flowering variety through molecular genetics. Nat. Biotechnol. 1994, 12, 268–271. [Google Scholar] [CrossRef] [Scilit]
- Editorial Committee of Flora of China. Cosmos bipinnata. Flora China 1979, 75, 368. [Google Scholar]
- Editorial Committee of Flora of China. Cosmos sulphureus. Flora China 1979, 75, 369. [Google Scholar]
- Yu, X.; Yang, L.; Fan, C.; Hu, J.; Zheng, Y.; Wang, Z.; Liu, Y.; Xiao, X.; Yang, L.; Lei, T.; et al. Cosmos bipinnatus alleviates cadmium toxicity by enhancing the adsorption of cadmium to root cell walls and inducing antioxidant defense system. Ecotoxicol. Environ. Saf. 2023, 268, 115101. [Google Scholar] [CrossRef] [Scilit]
- Schaefer, H.M.; Ruxton, G.D. Plant-Animal Communication; Oxford University Press: Oxford, UK, 2011; Chapter 4; pp. 87–112. [Google Scholar]
- Gould, K.S.; Lister, C. Anthocyanin Function in Vegetative Organs; Springer: Berlin/Heidelberg, Germany, 2006; Volume 1, pp. 1–22. [Google Scholar] [CrossRef] [Scilit]
- Aryal, S.; Baniya, M.K.; Danekhu, K.; Kunwar, P.; Gurung, R.; Koirala, N. Total phenolic content, flavonoid content and antioxidant potential of wild vegetables from Western Nepal. Plants 2019, 8, 96. [Google Scholar] [CrossRef] [Scilit] [PubMed]
- Hefied, F.; Ahmed, Z.B.; Yousfi, M. Optimization of ultrasonic-assisted extraction of phenolic compounds and antioxidant activities From Pistacia atlantica Desf. galls using response surface methodology. J. Appl. Res. Med. Aromat. Plants Vol. 2023, 32, 100449. [Google Scholar] [CrossRef] [Scilit]
- Kim, D.O.; Jeong, S.W.; Lee, C.Y. Antioxidant capacity of phenolic phytochemicals from various cultivars of plums. Food Chem. 2003, 81, 321–326. [Google Scholar] [CrossRef] [Scilit]
- Harborne, J.B. Phytochemical Methods: A Guide to Modern Techniques of Plant Analysis, 3rd ed.; Chapman & Hall: London, UK, 1998; Volume 1, pp. 1–302. [Google Scholar]
- Chen, C.; Wu, Y.; Li, J.; Wang, X.; Zeng, Z.; Xu, J.; Liu, Y.; Feng, J.; Chen, H.; He, Y.; et al. TBtools-II: A “one for all, all for one” bioinformatics platform for biological big-data mining. Mol. Plant 2023, 16, 1733–1742. [Google Scholar] [CrossRef] [Scilit] [PubMed]
- Liu, Y.; Yu, X.; Feng, Y.; Zhang, C.; Wang, C.; Zeng, J.; Huang, Z.; Kang, H.; Fan, X.; Sha, L.; et al. Physiological and transcriptome response to cadmium in Cosmos (Cosmos bipinnatus Cav.) seedlings. Sci. Rep. 2017, 7, 14691. [Google Scholar] [CrossRef] [Scilit] [PubMed]
- Sun, W.; Meng, X.; Liang, L.; Jiang, W.; Huang, Y.; He, J.; Hu, H.; Almqvist, J.; Gao, X.; Wang, L. Molecular and biochemical analysis of chalcone synthase from Freesia hybrid in the flavonoid biosynthetic pathway. PLoS ONE 2015, 10, e0119054. [Google Scholar] [CrossRef] [Scilit] [PubMed]
- Deng, X.; Bashandy, H.; Ainasoja, M.; Kontturi, J.; Pietiäinen, M.; Laitinen, R.A.E.; Albert, V.A.; Valkonen, J.P.T.; Elomaa, P.; Teeri, T.H. Functional diversification of duplicated chalcone synthase genes in anthocyanin biosynthesis of Gerbera hybrida. New Phytol. 2014, 201, 1469–1483. [Google Scholar] [CrossRef] [Scilit] [PubMed]
- Ohno, S.; Hosokawa, M.; Kojima, M.; Kitamura, Y.; Hoshino, A.; Tatsuzawa, F.; Doi, M.; Yazawa, S. Simultaneous post-transcriptional gene silencing of two different chalcone synthase genes resulting in pure white flowers in the octoploid dahlia. Planta 2011, 234, 945–958. [Google Scholar] [CrossRef] [Scilit] [PubMed]
- Ohno, S.; Hori, W.; Hosokawa, M.; Tatsuzawa, F.; Doi, M. Post-transcriptional silencing of chalcone synthase is involved in phenotypic lability in petals and leaves of bicolor dahlia (Dahlia variabilis) ‘Yuino’. Planta 2018, 247, 413–428. [Google Scholar] [CrossRef] [Scilit] [PubMed]
- Forkmann, G.; Heller, W. Biosynthesis of flavonoids. In The Flavonoids Advances in Research Since 1986; Routledge: New York, NY, USA, 1999; Volume 77, pp. 1–35. [Google Scholar] [CrossRef] [Scilit]
- Stich, K.; Eidenberger, T.; Wurst, F.; Forkmann, G. Enzymatic conversion of dihydroflavonols to flavan-3,4-diols using flower extracts of Dianthus caryophyllus L. (carnation). Planta 1992, 187, 103–108. [Google Scholar] [CrossRef] [Scilit] [PubMed]
- Ryan, K.G.; Swinny, E.E.; Markham, K.R.; Winefield, C. Flavonoid gene expression and UV photoprotection in transgenic and mutant Petunia leaves. Phytochemistry 2002, 59, 23–32. [Google Scholar] [CrossRef] [Scilit] [PubMed]
- Kondo, T. Blue flower color development by anthocyanins: From chemical structure to cell physiology. Nat. Prod. Rep. 2009, 26, 884–915. [Google Scholar] [CrossRef] [Scilit] [PubMed]
- Zhao, D.; Tao, J. Recent advances on the development and regulation of flower color in ornamental plants. Front. Plant Sci. 2015, 6, 261. [Google Scholar] [CrossRef] [Scilit] [PubMed]
- Khoo, H.E.; Azlan, A.; Tang, S.T.; Lim, S.M. Anthocyanidins and anthocyanins: Colored pigments as food, pharmaceutical ingredients, and the potential health benefits. Food Nutr. Res. 2017, 61, 1361779. [Google Scholar] [CrossRef] [Scilit] [PubMed]
- Sun, T.; Yuan, H.; Cao, H.; Yazdani, M.; Tadmor, Y.; Li, L. Carotenoid metabolism in plants: The role of plastids. Mol. Plant 2018, 11, 58–74. [Google Scholar] [CrossRef] [Scilit] [PubMed]
- Yuan, H.; Zhang, J.; Nageswaran, D.; Li, L. Carotenoid metabolism and regulation in horticultural crops. Hortic. Res. 2015, 2, 15036. [Google Scholar] [CrossRef] [Scilit] [PubMed]
- Shimada, N.; Aoki, T.; Sato, S.; Nakamura, Y.; Tabata, S.; Ayabe, S.-I. A cluster of genes encodes the two types of chalcone isomerase involved in the biosynthesis of general flavonoids and legume-specific 5-deoxy(iso)flavonoids in Lotus japonicus. Plant Physiol. 2001, 127, 725–733. [Google Scholar] [CrossRef] [Scilit]
- Moyano, E.; Martínez-Garcia, J.F.; Martin, C. Apparent redundancy in myb gene function provides gearing for the control of flavonoid biosynthesis in antirrhinum flowers. Plant Cell 1996, 8, 1519–1532. [Google Scholar] [CrossRef] [Scilit]
- Pelletier, M.K.; Burbulis, I.E.; Winkel-Shirley, B. Disruption of specific flavonoid genes enhances the accumulation of flavonoid enzymes and end-products in Arabidopsis seedlings. Plant Mol. Biol. 1997, 34, 911–921. [Google Scholar] [CrossRef] [Scilit]
- Righini, S.; Rodriguez, E.J.; Berosich, C.; Grotewold, E.; Casati, P.; Falcone Ferreyra, M.L. Apigenin produced by maize flavone synthase I and II protects plants against UV-B-induced damage. Plant Cell Environ. 2019, 42, 495–508. [Google Scholar] [CrossRef] [Scilit] [PubMed]
- Lui, A.C.W.; Lam, P.Y.; Chan, K.H.; Wang, L.; Tobimatsu, Y.; Lo, C. Convergent recruitment of 5′-hydroxylase activities by CYP75B flavonoid B-ring hydroxylases for tricin biosynthesis in Medicago legumes. New Phytol. 2020, 228, 269–284. [Google Scholar] [CrossRef] [Scilit] [PubMed]
- Owens, D.K.; Alerding, A.B.; Crosby, K.C.; Bandara, A.B.; Westwood, J.H.; Winkel, B.S.J. Functional analysis of a predicted flavonol synthase gene family in Arabidopsis. Plant Physiol. 2008, 147, 1046–1061. [Google Scholar] [CrossRef] [Scilit] [PubMed]
- Ren, C.; Qian, J.; Wang, Y.; Xie, L.; Guo, Y.; Chen, K.; Li, X. Flavonoid UDP-glycosyltransferase in plants: Functional identification, substrate recognition mechanism, and biotechnology application. Phytochem. Rev. 2025, 24, 4451–4474. [Google Scholar] [CrossRef] [Scilit]
- Holton, T.A.; Brugliera, F.; Lester, D.R.; Tanaka, Y.; Hyland, C.D.; Menting, J.G.T.; Lu, C.-Y.; Farcy, E.; Stevenson, T.W.; Cornish, E.C. Cloning and expression of cytochrome P450 genes controlling flower colour. Nature 1993, 366, 276–279. [Google Scholar] [CrossRef] [Scilit] [PubMed]
- Kreuzaler, F.; Hahlbrock, K. Enzymatic synthesis of aromatic compounds in higher plants: Formation of naringenin (5,7,4′-trihydroxyflavanone) from p-coumaroyl coenzyme A and malonyl coenzyme A. FEBS Lett. 1972, 28, 69–72. [Google Scholar] [CrossRef] [Scilit] [PubMed]
- Palmer, C.M.; Miller, K.K.; Nguyen, A.; Alper, H.S. Engineering 4-coumaroyl-CoA derived polyketide production in Yarrowia lipolytica through a β-oxidation mediated strategy. Metab. Eng. 2020, 57, 174–181. [Google Scholar] [CrossRef] [Scilit] [PubMed]
- Durbin, M.L.; Learn, G.H., Jr.; Huttley, G.A.; Clegg, M.T. Evolution of the chalcone synthase gene family in the genus Ipomoea. Proc. Natl. Acad. Sci. USA 1995, 92, 3338–3342. [Google Scholar] [CrossRef] [Scilit] [PubMed]
- Hrazdina, G.; Zobel, A.M.; Hoch, H.C. Subcellular localization of flavonoid synthesizing enzymes in Pisum sativum. Plant Physiol. 1982, 70, 745–748. [Google Scholar] [CrossRef] [Scilit] [PubMed]
- Ibrahim, R.K.; Anzellotti, D. Chapter one The enzymatic basis of flavonoid biodiversity. In Recent Advances in Phytochemistry; Elsevier: Amsterdam, The Netherlands, 2003; Volume 37, pp. 1–36. [Google Scholar] [CrossRef] [Scilit]
- Sasaki, N.; Nishizaki, Y.; Ozeki, Y.; Miyahara, T. Recent advances in understanding the anthocyanin modification steps in carnation flowers. Sci. Rep. 2014, 4, 5183. [Google Scholar] [CrossRef] [Scilit]
- Jenkins, G.I. Signal transduction in responses to UV-B radiation. Annu. Rev. Plant Biol. 2009, 60, 407–431. [Google Scholar] [CrossRef] [Scilit] [PubMed]
- Neilson, E.H.; Goodger, J.Q.; Woodrow, I.E.; Møller, B.L. Plant chemical defense: At what cost? Trends Plant Sci. 2013, 18, 250–258. [Google Scholar] [CrossRef] [Scilit] [PubMed]
- Wang, Y.; Zhou, L.-J.; Song, A.; Wang, Y.; Geng, Z.; Zhao, K.; Jiang, J.; Chen, S.; Chen, F. Comparative transcriptome analysis and flavonoid profiling of floral mutants reveals CmMYB11 regulating flavonoid biosynthesis in chrysanthemum. Plant Sci. 2023, 336, 111837. [Google Scholar] [CrossRef] [Scilit] [PubMed]
- Ben El Caid, M.; Lachheb, M.; Lagram, K.; Wang, X.; Serghini, M.A. Ecotypic variation and environmental influence on saffron (Crocus sativus L.) vegetative growth: A multivariate performance analysis. J. Appl. Res. Med. Aromat. Plants 2024, 43, 100601. [Google Scholar] [CrossRef] [Scilit]

Disclaimer/Publisher’s Note: The statements, opinions and data contained in all publications are solely those of the individual author(s) and contributor(s) and not of MDPI and/or the editor(s). MDPI and/or the editor(s) disclaim responsibility for any injury to people or property resulting from any ideas, methods, instructions or products referred to in the content. |
© 2026 by the authors. Licensee MDPI, Basel, Switzerland. This article is an open access article distributed under the terms and conditions of the Creative Commons Attribution (CC BY) license.