


Abstract
Cowpea (Vigna unguiculata L. Walp.) is an important legume crop contributing to food and nutritional security. However, its systematic evaluation for yield and adaptability, particularly in the Middle-Lower Yangtze River region of China, remains insufficient. In this study, conducted in Jiangxi Province across two seasons (April and August 2024), a comprehensive analytic hierarchy process (AHP) model evaluated 139 Chinese cowpea accessions based on 18 agronomic traits. The evaluation showed coefficients of variation for 11 quantitative traits ranged from 5.18% to 49.42%, with single pod weight and pod length exhibiting the highest variation. Shannon–Wiener index analysis indicated pod width and SPAD (Soil Plant Analysis Development) were the most diverse traits (H′ = 1.04 and 1.01). Based on the AHP model, 139 accessions were classified into four grades. Notably, Grade I accessions demonstrated high comprehensive scores, comprising three cultivars: ‘Changde Baipi Doujiao’, ‘Guilin Changjiangdou’, and ‘Guangrao Wuyuemang’. These exhibit promising performance under field conditions and high yield potential, making them worthy of further regional testing. Cluster and principal component analyses revealed natural groupings and variation patterns within the germplasm resources. This study provides a practical, preliminary decision-support tool for yield and field adaptation evaluation.
1. Introduction
With the continuous growth of the global population and intensifying climate change, world food security faces severe challenges [1]. At the current annual growth rate of approximately 1.1%, the global population is projected to reach approximately 9.7 billion by 2050 [2], placing immense pressure on existing agricultural productivity. Climate warming exacerbates extreme weather events and destabilizes precipitation patterns, leading to concurrent droughts and floods that not only reduce crop yields but also disrupt pest forecasting and control [3,4]. Against this backdrop, developing and promoting crops with strong adaptability and high stress tolerance has become particularly urgent.
Cowpea (Vigna unguiculata L. Walp.) is a crop of global importance for food and nutritional security, notable for its resilience to climatic variability. It originated in Africa and is now widely cultivated across Africa, Asia, and the Americas [5]. Cowpea exhibits high adaptability, demonstrating good performance on low-fertility soils and tolerance to a broad pH spectrum, along with pronounced heat and drought resistance [6,7]. These characteristics underscore its important role in enhancing agricultural resilience to climate change. China stands as one of the secondary centers of cowpea domestication and ranks among the world’s leading producers and consumers [8,9]. Notably, the Middle-Lower Yangtze River region, as a core production area, faces acute threats from climate change, with uneven precipitation and frequent high temperatures emerging as primary constraints on local yield stability and quality [10,11]. In July 2015, Hubei Province launched the third national crop germplasm survey and collection action, and collected 62 cowpea accessions [12]. Between 2017 and 2023, Jiangxi Province successively implemented the third national crop germplasm survey and collection action and the “Jiangxi Provincial Agricultural Germplasm Survey,” and together they collected a total of 767 cowpea accessions [13]. Despite these foundational efforts, research into systematic breeding for resilient varieties remains insufficient. Therefore, there is an urgent need to strengthen the development of cowpea varieties with targeted, comprehensive resistance traits to sustain the long-term viability of the regional industry.
In crop breeding and genetic improvement, the collection and evaluation of germplasm resources are foundational work [14]. Due to regional disparities in climate and consumption habits, cowpea cultivars vary significantly, forming distinct regional varieties with limited adaptability [15]. Introducing cowpea germplasm from diverse regions is crucial for enhancing phenotypic diversity. Germplasm resource evaluation is essential for improving the efficiency and quality of breeding programs [16,17]. Current research on cowpea germplasm primarily focuses on phenotypic diversity analysis, with relatively few studies on resistance-related traits [8,18,19]. Specifically, there is a lack of integrated multi-trait evaluation frameworks aligned with regional priorities and of assessments tailored to the stress conditions of the Middle-Lower Yangtze River region. This hinders the identification of germplasm accessions with comprehensive resilience and high yield potential.
The Analytic Hierarchy Process (AHP) represents a practical tool for addressing such a complex multi-criteria selection problem [20]. AHP, proposed by Saaty [21] in 1980, is one of the most widely used approaches. AHP structures complex multi-indicator problems through hierarchical modeling, quantifies the relative weights of indicators via pairwise comparisons, and synthesizes comprehensive evaluation results [22]. In recent years, this method has found extensive applications in resource allocation, quality management, healthcare, and environmental ecology [23,24,25,26]. In agriculture, AHP is frequently employed in germplasm evaluation. For example, Sun et al. [27] built a multi-tuber taro germplasm evaluation system based on quality, yield, and growth traits, selecting 5 excellent resources. Wang et al. [28] used AHP, proposing 3 main criteria (adaptability, ornamental features, growth habits) and 18 sub-criteria, identifying 4 top-tier Paeonia lactiflora germplasms for low-latitude areas; Feng et al. [29] used AHP to classify 55 Rosa hybrida cultivars into three classes according to 17 key aromatic compounds, selecting four germplasms suitable for essential oil, aromatherapy, and healthcare. These studies highlight the significant advantages of AHP in multi-trait comprehensive evaluation.
In this study, 139 cowpea accessions from diverse sources were collected. Variation and phenotypic diversity analyses were conducted on 18 trait indicators across two consecutive growing seasons. To select elite varieties, the AHP was applied to establish a cowpea germplasm evaluation model. PCA and cluster analysis were used as complementary multivariate tools to examine whether the major phenotypic structure of the dataset was broadly consistent with the AHP-based classification. This study provides a preliminary decision-support framework for cowpea germplasm screening and utilization in the middle-lower reaches of the Yangtze River.
2. Materials and Methods
2.1. Plant Materials
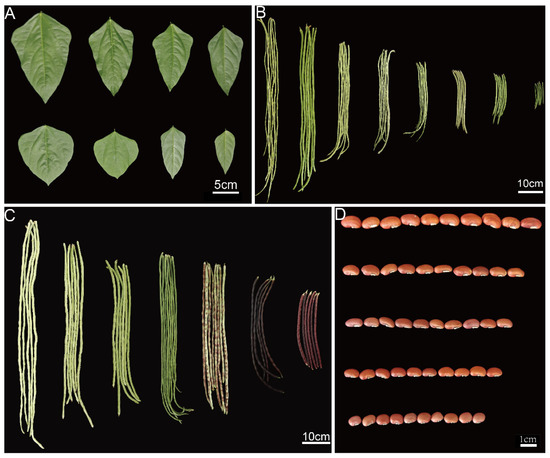
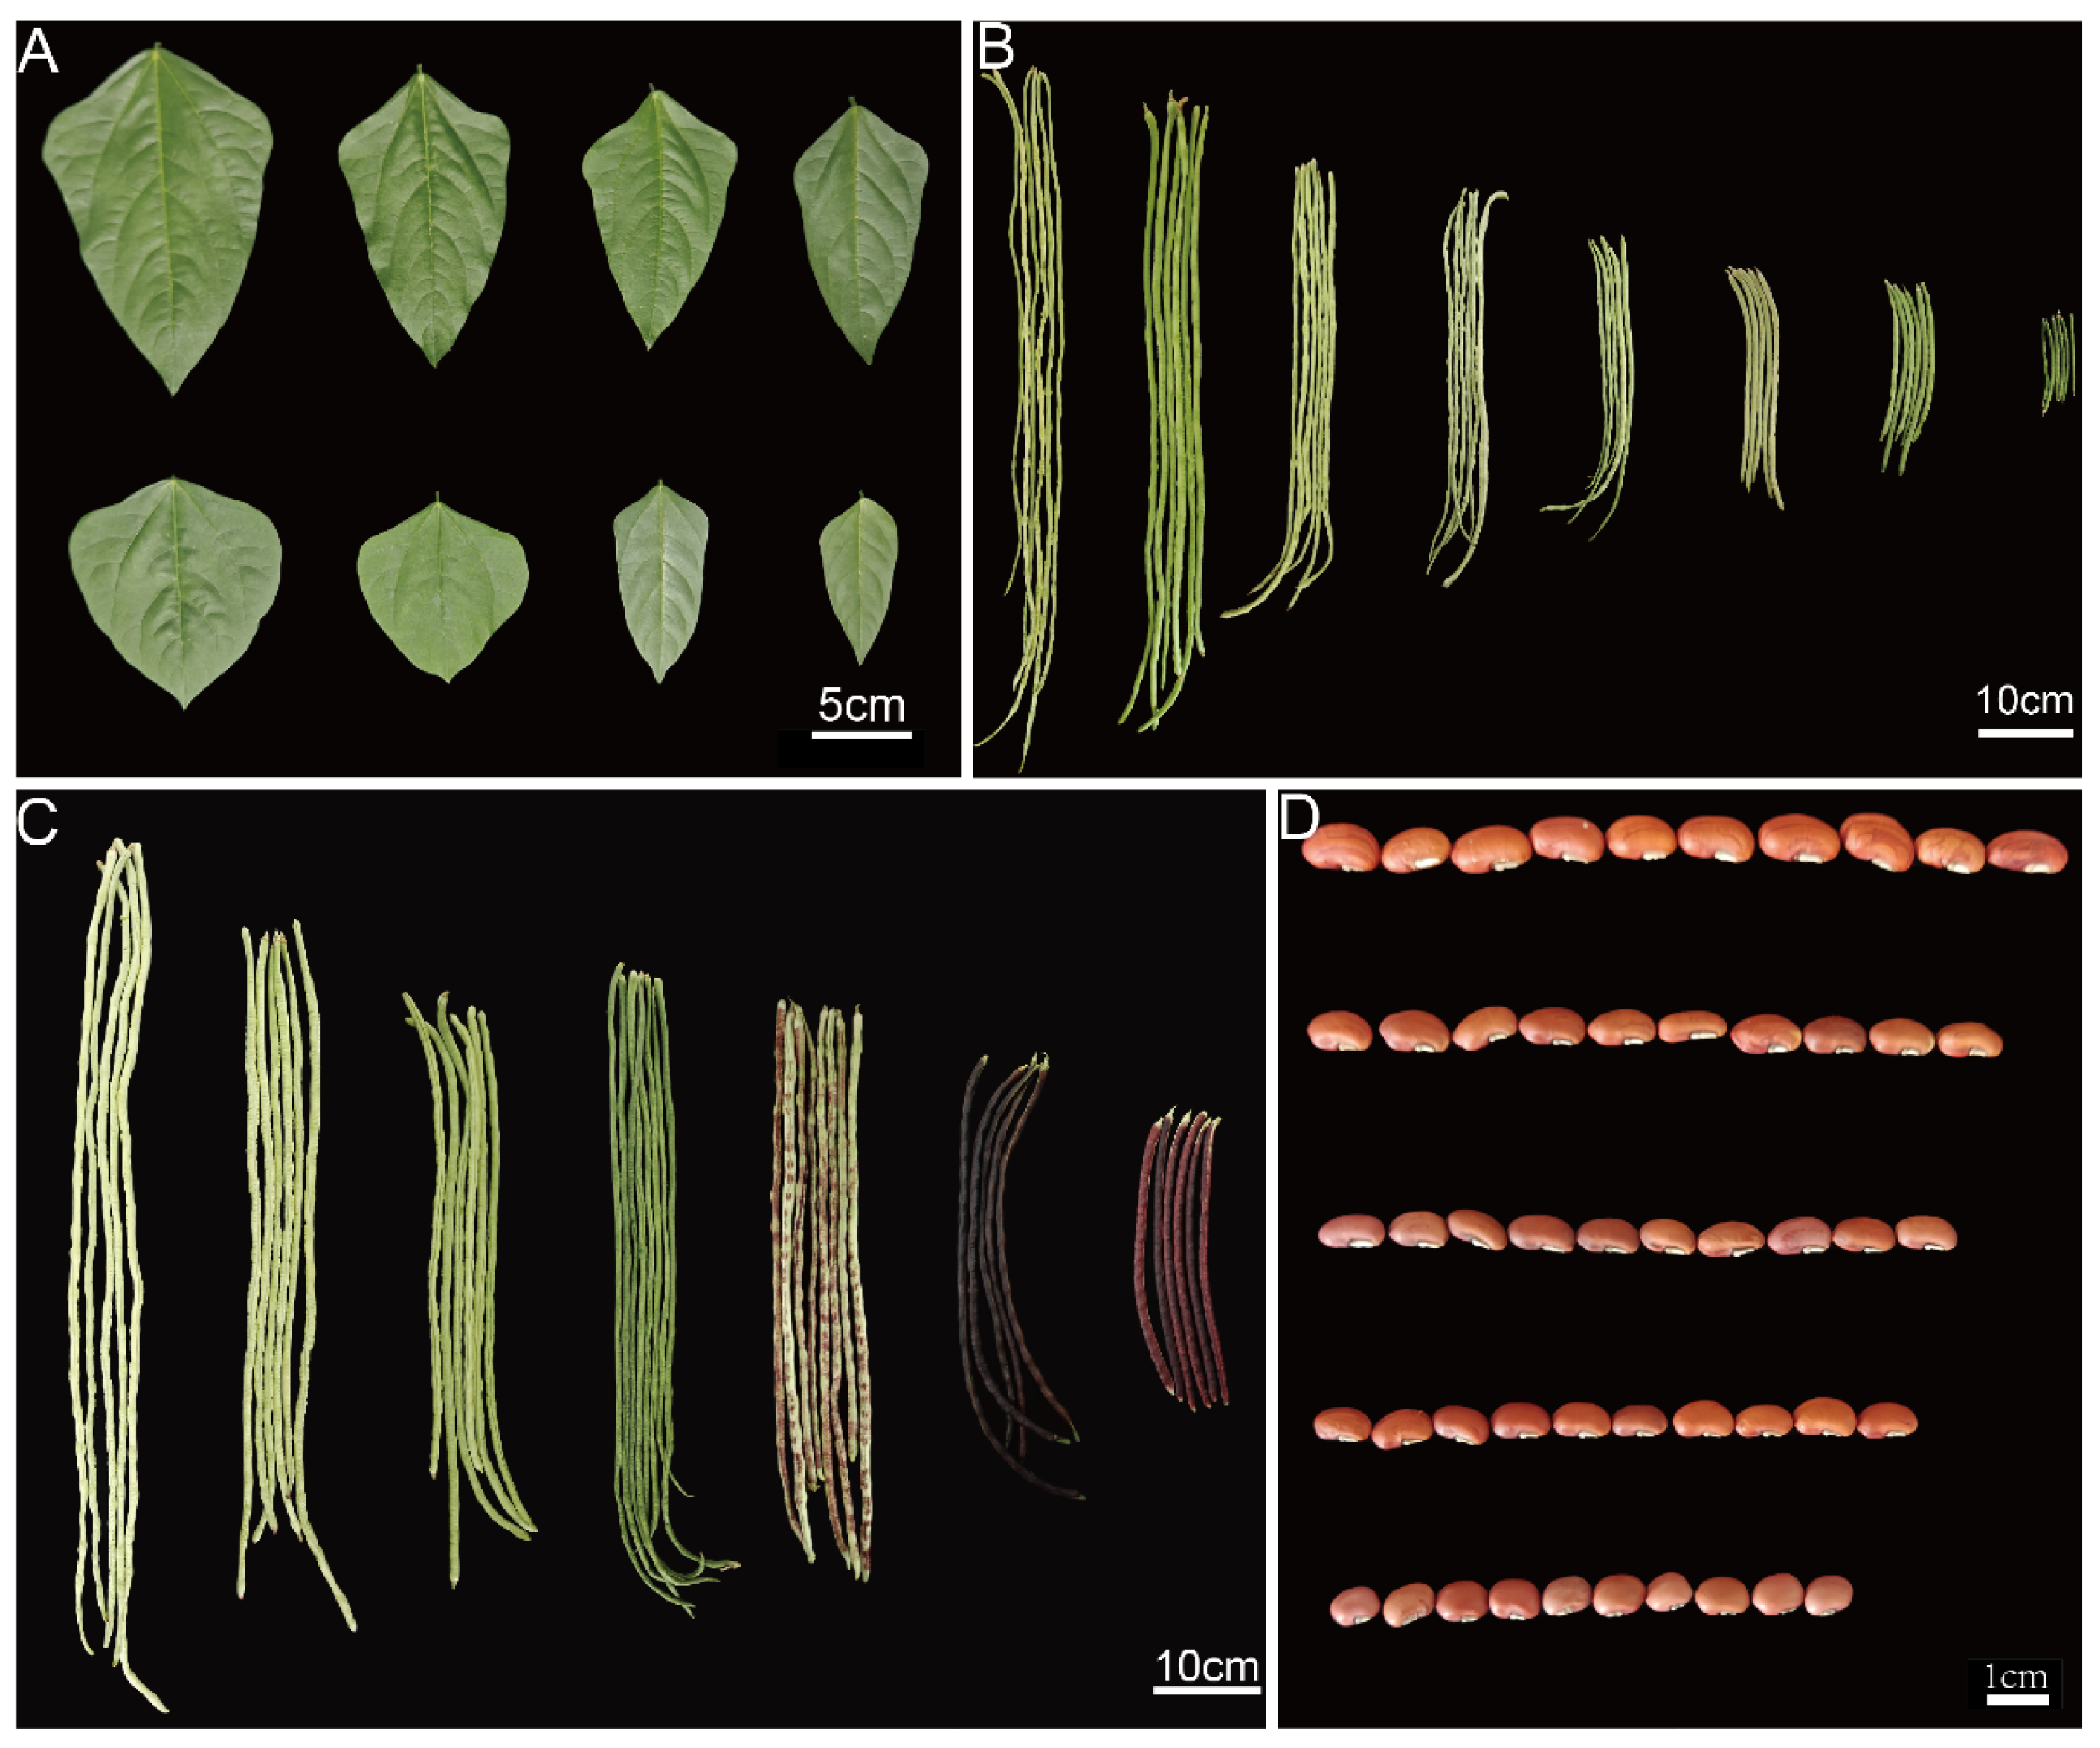
To ensure sufficient genetic representation in key agronomic traits and stress tolerance, this study systematically introduced 139 cowpea germplasm accessions. These materials exhibited rich diversity in critical phenotypic traits such as leaf morphology, pod length and color, and seed size (Figure 1A–D), providing a solid foundation for a comprehensive evaluation of trait variation. The germplasm was sourced as follows: 95 accessions were obtained from the National Mid-term Genebank for Vegetables (Beijing, China), 10 were commercial cultivars supplied by Huanong Seed Co., Ltd. (Nanchang, China), and the remaining 34 were local landraces. The names and sources of the germplasm resources are listed in Table S1. The international sharing of these germplasm resources is subject to the regulations of the People’s Republic of China [30]. Any provision to overseas users requires prior approval from the competent authorities.
Figure 1.
Phenotypic diversity in cowpea germplasm. (A) Leaf morphology variation. (B) Pod length diversity. (C) Immature pod color diversity. (D) Seed size variation.
The experiments were conducted in two consecutive growing seasons (April–July and August–November 2024) in arch-roofed plastic greenhouses at the Jiangxi Huanong Seed Industry Technology Park, Nanchang, Jiangxi Province (116.04° E, 28.74° N). The climate information for the two growing seasons is shown in Table 1. During the first growing season (April to July), the average monthly high temperature ranged from 24 °C to 35 °C, with July being the hottest month at 35 °C. In the second season (September to November), the average high ranged from 20 °C to 33 °C, with September as the warmest month at 33 °C. Field beds were approximately 20 cm high and 85 cm wide, with furrows 45 cm wide. Each bed was planted with two rows, with a row spacing of about 45 cm and hill spacing of 25 cm. A sub-membrane drip irrigation system was used to ensure uniform water and nutrient management. Pest and disease assessments were based on natural infestation in a greenhouse with open sides to allow for natural airflow and insect movement.
Table 1.
Climatic Conditions for Two Growing Seasons.
A randomized complete block design with three blocks was employed. Sowing was conducted to avoid edge rows. For each accession, 12 plants were established within each block, and three plants were randomly chosen from each block for the measurement of agronomic traits. In the course of data analysis, the three measured values for each accession within a block were averaged to yield one value at the block level. Consequently, each accession had three block values per season. These block values were then averaged within each season to obtain the seasonal accession means. Finally, the seasonal means from the two seasons were combined through arithmetic averaging to generate the final value utilized in subsequent analyses and AHP scoring.
2.2. Investigation of 18 Agronomic Traits
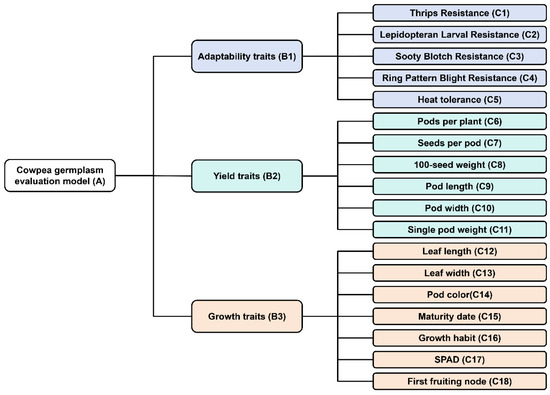
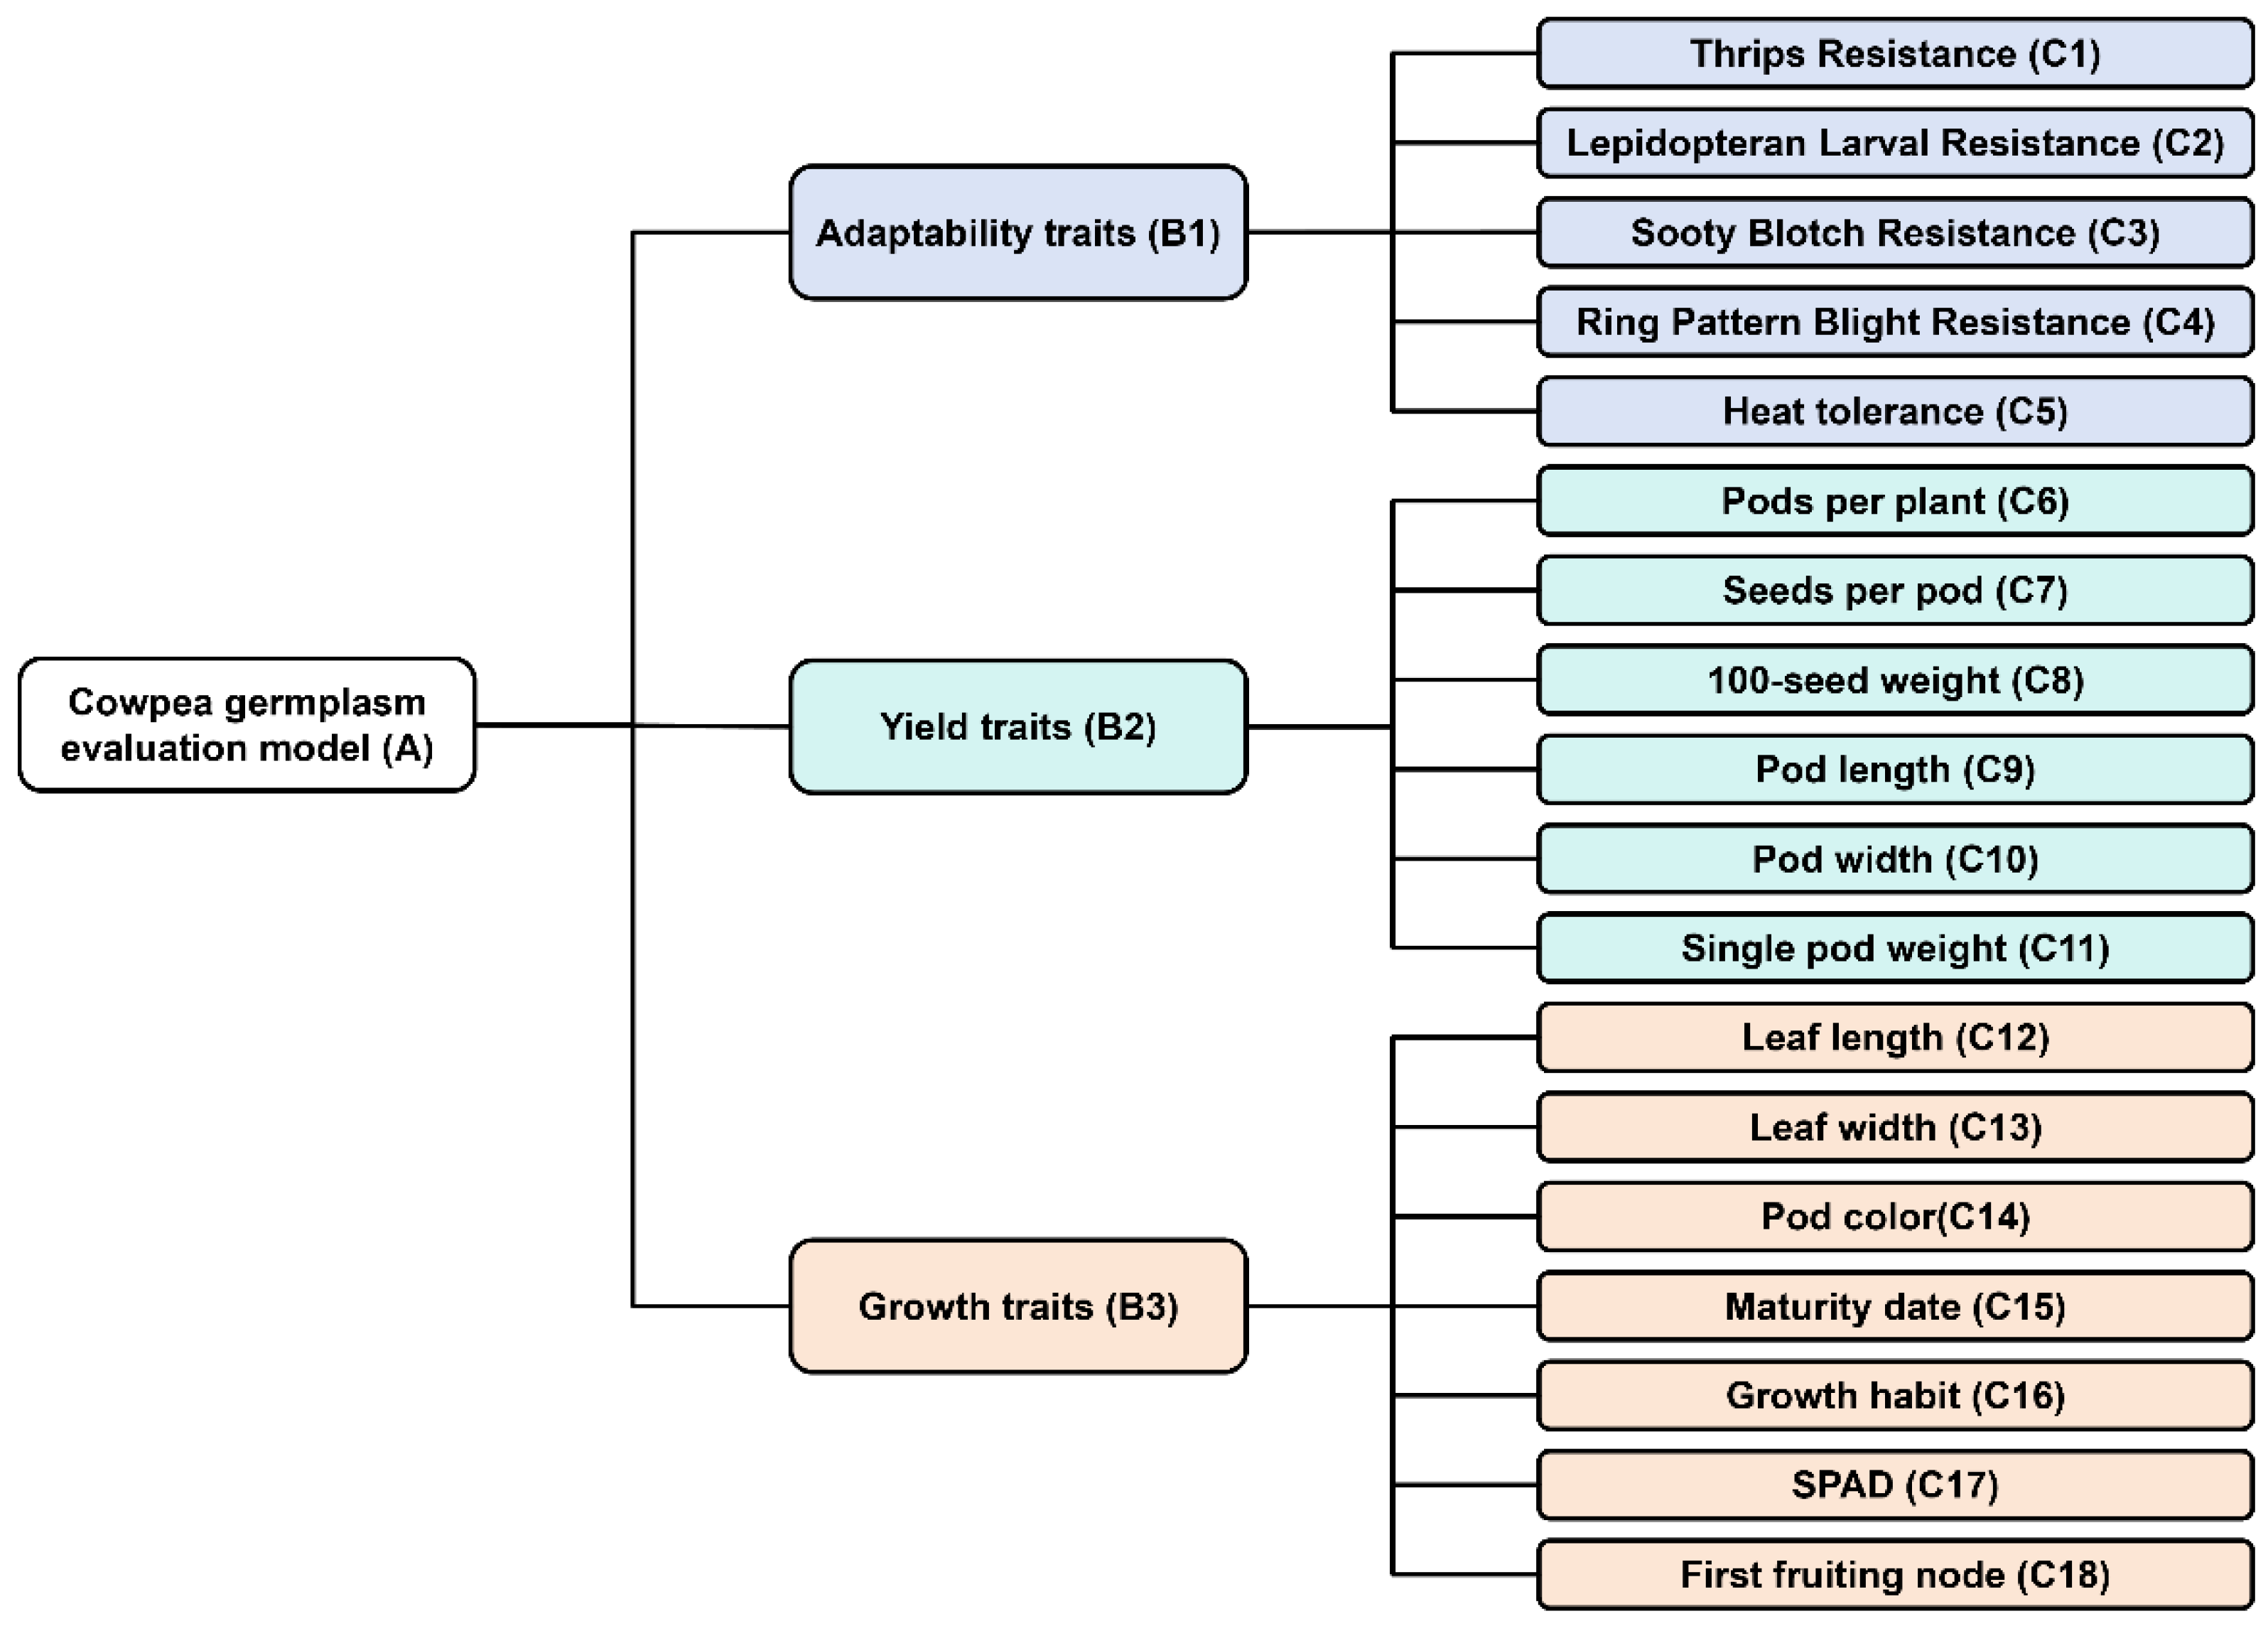
At the full pod-filling stage, we systematically investigated 18 agronomic traits (C1–C18) across 139 cowpea germplasm. These traits were categorized into 7 qualitative traits (C1: Thrips Resistance, C2: Lepidopteran Larval Resistance, C3: Sooty Blotch Resistance, C4: Ring Pattern Blight Resistance, C5: Heat tolerance, C14: Pod color, C16: Growth habit) and 11 quantitative traits (C6: Pods per plant, C7: Seeds per pod, C8: 100-seed weight, C9: Pod length, C10: Pod width, C11: Single pod weight, C12: Leaf length, C13: Leaf width, C15: Maturity date, C17: SPAD (Soil Plant Analysis Development), C18: First fruiting node). Functionally, traits were classified into Adaptability traits (C1–C5), Yield traits (C6–C11), and Growth traits (C12–C18) (Figure 2). Trait investigation followed the descriptors of IBPGR [31] and Wang and Li [32], supplemented by standardized protocols for evaluating thrips resistance, lepidopteran larval resistance, ring pattern blight resistance, and heat tolerance. Detailed rating scales and measurement standards for all 18 traits are provided in Table S2. The raw phenotypic data collected for all accessions and traits are available in Table S3.
Figure 2.
AHP-based evaluation model of cowpea germplasm.
2.3. Development of the Analytical Hierarchy Process Model
Based on the characteristic traits of cowpea and existing research frameworks, a comprehensive evaluation model was established (Figure 2). The Target Level (A) represents the comprehensive evaluation of cowpea germplasm. The Criterion Level integrates three core dimensions: Adaptability Traits (B1), Yield Traits (B2), and Growth Traits (B3). The Indicator Level systematically incorporates 18 specific trait parameters: Thrips Resistance (C1), Lepidopteran Larval Resistance (C2), Sooty Blotch Resistance (C3), Ring Pattern Blight Resistance (C4), Heat tolerance (C5), Pods per plant (C6), Seeds per pod (C7), 100-seed weight (C8), Pod length (C9), Pod width (C10), Single pod weight (C11), Leaf length (C12), Leaf width (C13), Pod color (C14), Maturity date (C15), Growth habit (C16), SPAD (C17), and First fruiting node (C18) (Figure 2).
2.4. Construction of Judgment Matrices
Pairwise comparisons of evaluation indicators were conducted based on expert assessments to construct an n × n judgment matrix A, as expressed in Equation (1) [8].
where aij denotes the importance rating of element i relative to element j.
This study convened a panel of 38 experts in cowpea research, comprising 13 senior cowpea breeders, 10 cultivation specialists, and 15 professors and graduate students in the field. They completed structured questionnaires, providing pairwise comparisons for the target traits based on Saaty‘s [21] 1–9 ratio scale (Table 2). Responses with a consistency ratio (CR) greater than 0.1 were excluded, resulting in valid questionnaires that met the acceptable consistency threshold (CR < 0.1). These expert judgments were aggregated by applying the geometric mean to each corresponding matrix element [33,34], resulting in the consolidated group comparison matrix presented in Table 3.
Table 2.
Determination principles of AHP judgment scale.
Table 3.
The pairwise comparison matrix established in this study.
2.5. Computing Global Weights
The weight vector was calculated using the geometric mean method based on the judgment matrix. For each row of the matrix, the geometric mean of all elements was first computed, and the resulting values were then normalized to obtain the weight vector, as shown in Equation (2):
Here, aij denotes an element of the judgment matrix A, Wi represents the weight vector, and n signifies the order of the judgment matrix.
2.6. Conducting Consistency Tests
The maximum eigenvalue λmax is calculated using Equation (3):
where A denotes the judgment matrix, W represents the weight vector, and n is the matrix order.
Consistency Index (CI) and Consistency Ratio are calculated using Equation (4) and Equation (5), respectively:
RI denotes the random consistency index. A judgment matrix is considered to possess satisfactory consistency when CR < 0.1. Otherwise, the matrix requires revision to improve its consistency level [35].
2.7. Scoring Criteria for Hierarchical Trait Indicators
Referencing the methods of Wang and Li [32] and synthesizing existing research findings [8,31,36], a three-level scoring system (with scores of 1, 3, and 5) was established for each evaluation indicator (Table 4). The comprehensive evaluation value for each accession was then calculated as the weighted sum of these scores using their corresponding AHP-derived weights. The final composite scores were scaled to a 100-point scale for comparative ranking using Equation (6):
where S is the raw composite score of an accession, and Smin and Smax are the theoretical minimum and maximum possible composite scores under the AHP scoring system.
Table 4.
Hierarchical trait scoring criteria.
2.8. Data Analysis
The mean, variance, standard deviation, and coefficient of variation in agronomic traits were analyzed using Excel 2019 software (Microsoft, Redmond, WA, USA). Qualitative and quantitative traits were converted into three ordered classes and assigned scores of 1, 3, or 5 according to Table 4. The formula for the coefficient of variation is given in Equation (7):
The diversity of each agronomic trait was evaluated using the Shannon–Weaver diversity index, following the method described by Hong and Wu [39], as shown in Equation (8):
where Pi represents the frequency of occurrence of the i-th variant type.
The raw data were standardized to Z-scores using SPSS 26.0 (IBM Corp., Armonk, NY, USA). Correlation analysis was performed using the Pearson correlation coefficient; cluster analysis was conducted by calculating Euclidean distance with Ward’s method; both principal component analysis and cluster analysis were carried out on standardized data. Correlation analysis, cluster analysis, principal component analysis, and figure generation were conducted using OriginPro 2025 (OriginLab Corporation, Northampton, MA, USA).
3. Results
3.1. Phenotypic Diversity and Phenotypic Variation in the Selected Cowpea Germplasm
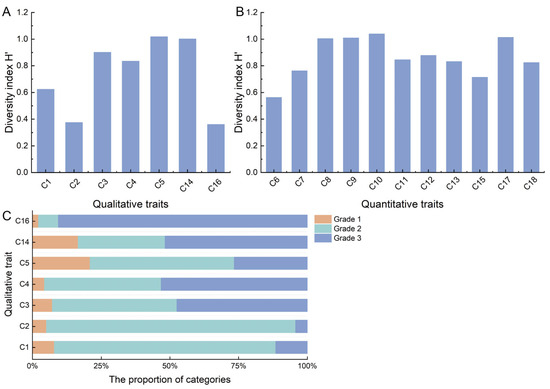
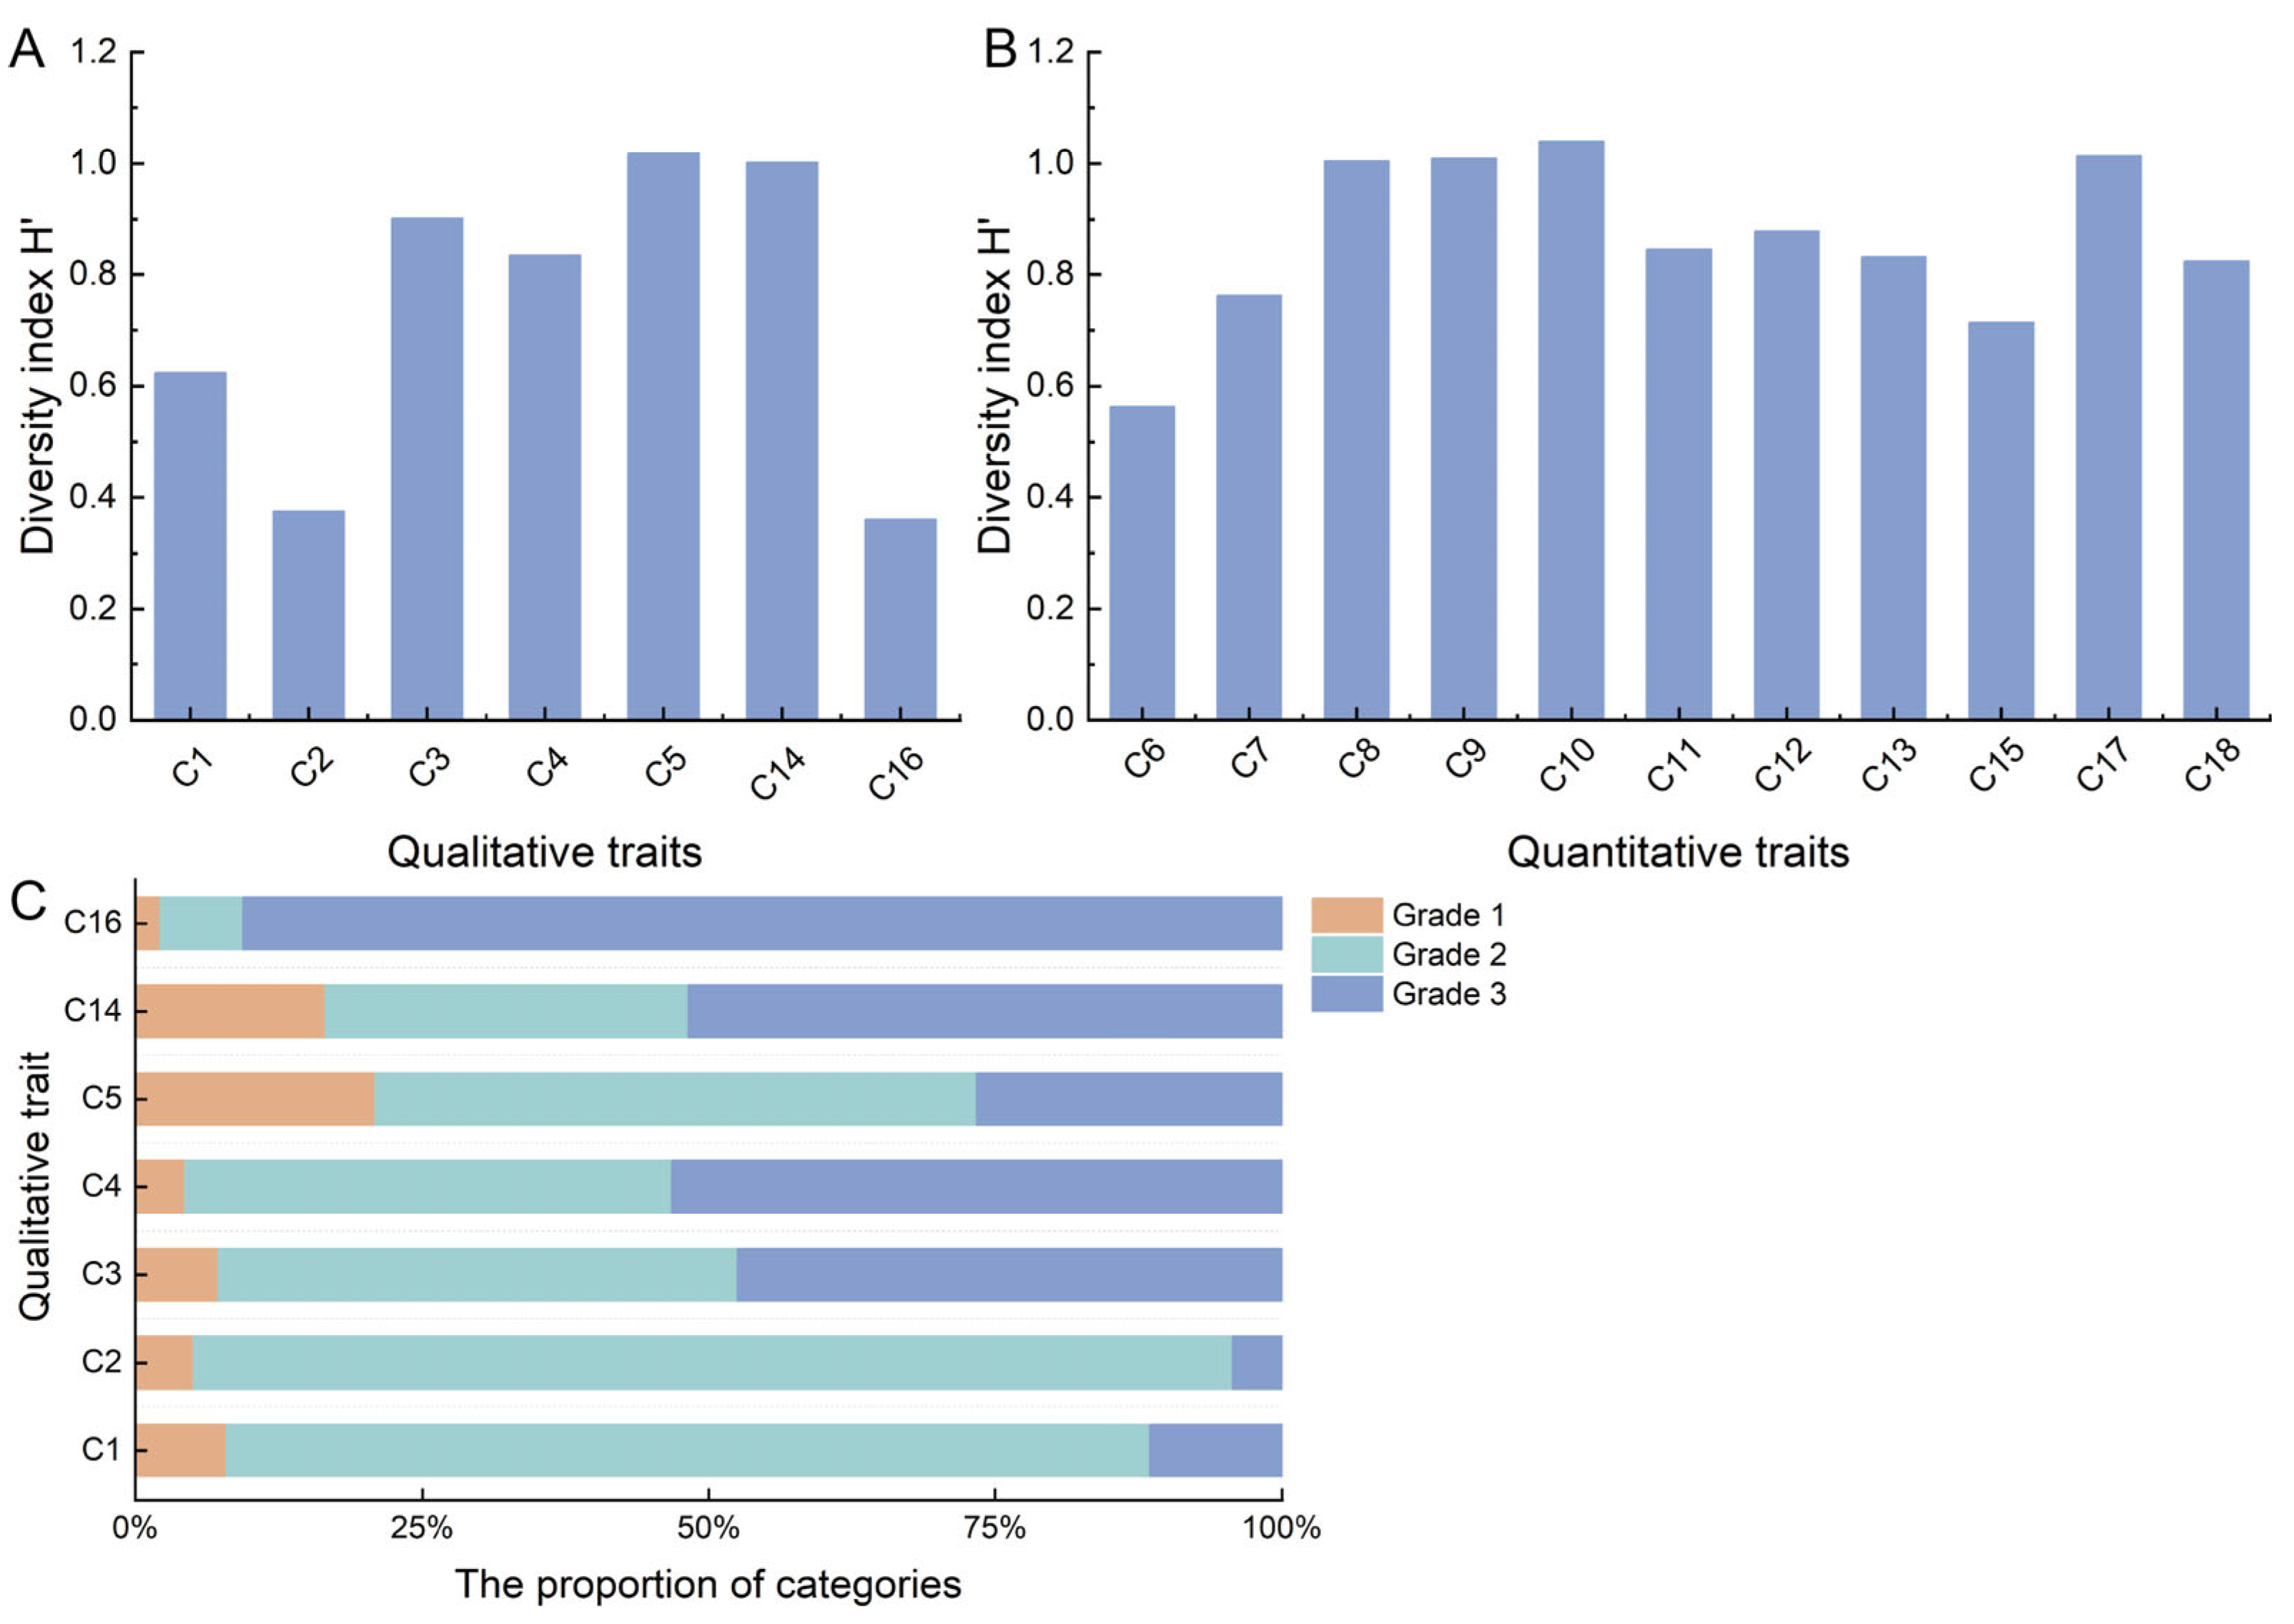
The analysis of the 7 qualitative traits showed that the Shannon diversity index ranged from 0.36 to 1.02, indicating substantial variation across traits (Figure 3A). Among them, heat tolerance (C5) and pod color (C14) exhibited the highest diversity, with Shannon indices of 1.02 and 1.00, respectively, largely attributable to balanced grade distributions (Figure 3C). In contrast, growth habit (C16) and Lepidopteran larval resistance (C2) exhibited markedly lower diversity due to the dominance of a single category, with the vine-type growth habit and intermediate resistance levels accounting for 90.65% of the accessions, resulting in Shannon indices of only 0.38 for both traits.
Figure 3.
Variation and phenotypic diversity analysis of cowpea germplasm. (A) Bar chart of diversity indices for qualitative traits. (B) Bar chart of diversity indices for quantitative traits. (C) Proportion distribution of qualitative trait categories. Note: Scoring criteria: Grade 1 = 1 point, Grade 2 = 3 points, Grade 3 = 5 points.
The analysis of the 11 quantitative traits exhibited coefficients of variation (CV) ranging from 5.18% to 49.42%, with Shannon diversity indices (H′) between 0.56 and 1.04 (Table S4, Figure 3B). Single pod weight (C11, CV = 49.42%) and pod length (C9, CV = 39.35%) exhibited the highest phenotypic variation, whereas maturity date (C15, CV = 5.18%) showed the lowest variation. High levels of phenotypic diversity (H′ ≥ 1.00) were detected for 100-seed weight (C8, H′ = 1.01), pod length (C9, H′ = 1.01), pod width (C10, H′ = 1.04), and SPAD (C17, H′ = 1.01). Conversely, pods per plant (C6, H′ = 0.56) displayed the lowest diversity, while the first fruiting node (C18, H′ = 0.82) showed moderate diversity. Notably, the maturity date (C15) not only had the lowest CV (5.18%) but also a significantly lower Shannon index (H′ = 0.71) compared to other traits, suggesting a potentially homogeneous genetic background and an associated risk of phenotypic diversity loss.
3.2. Correlation Analysis Among Agronomic Traits
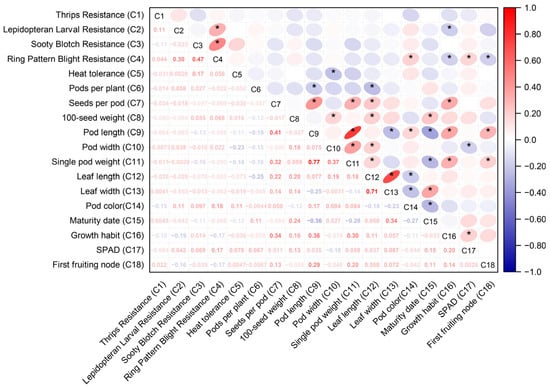
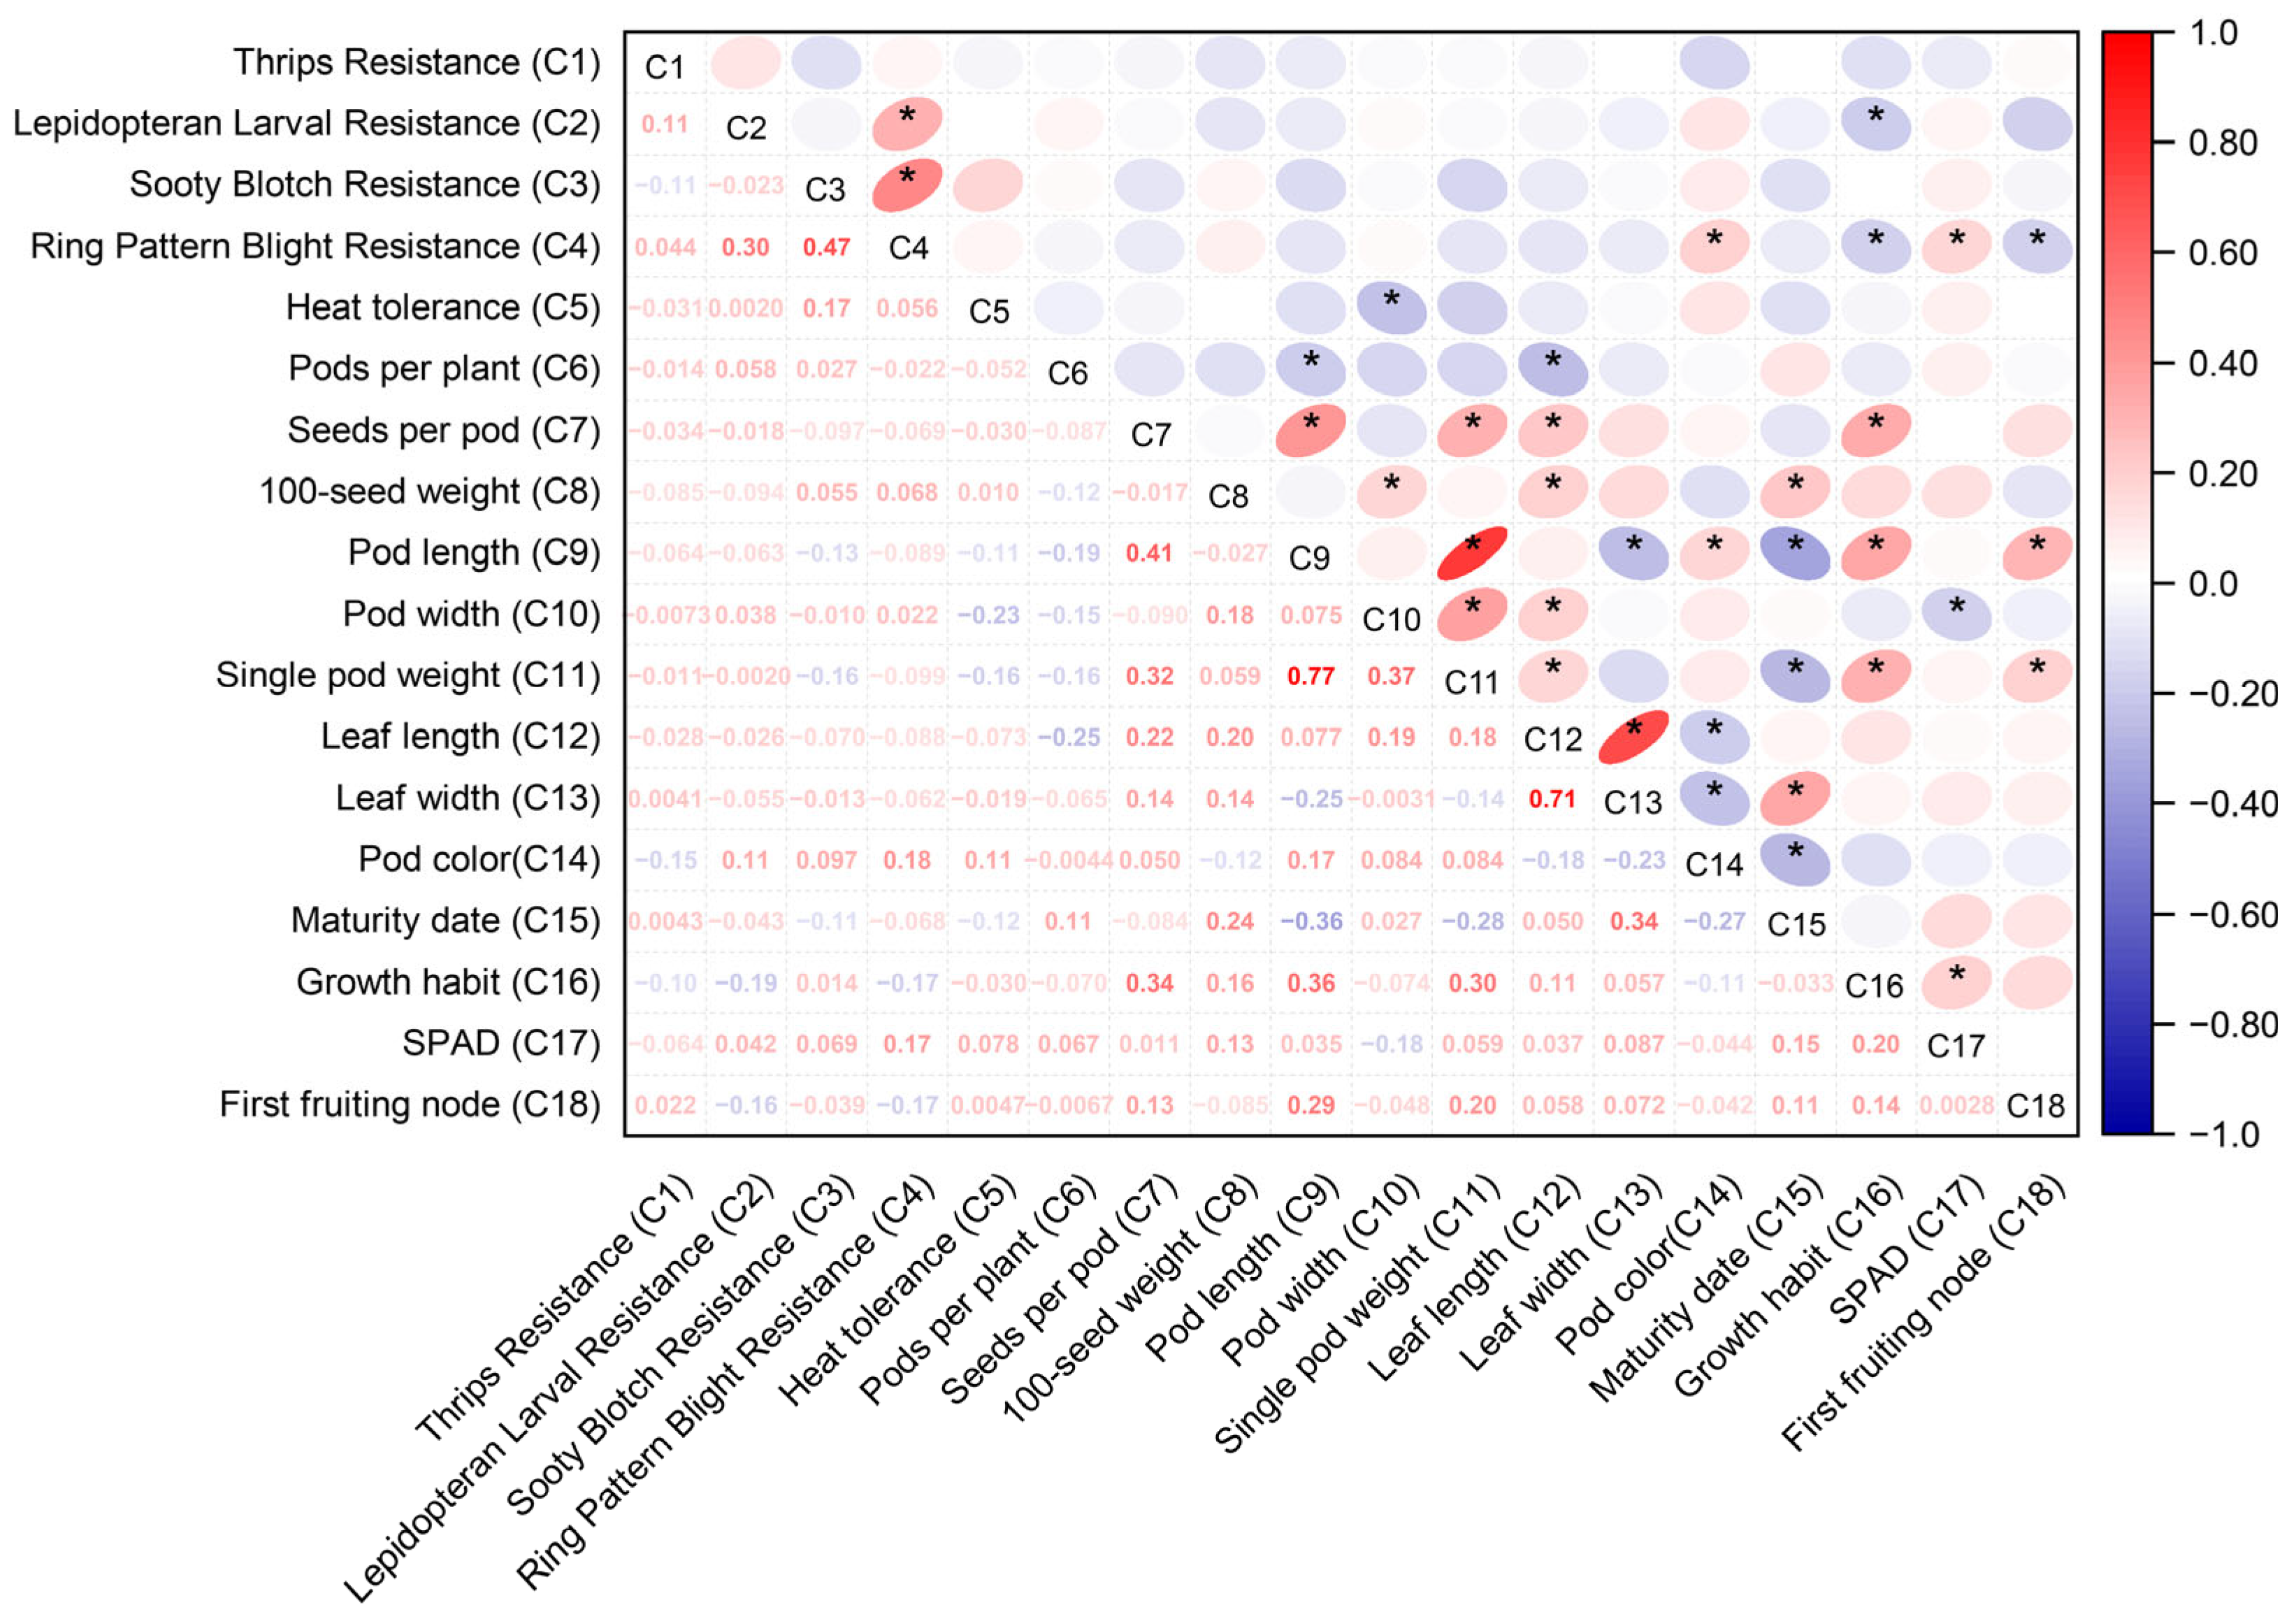
Pairwise correlation analysis was performed using Pearson’s correlation coefficient. The resulting coefficients (r) ranged from −0.36 to 0.77 (Figure 4). The strongest positive correlation was observed between pod length (C9) and single pod weight (C11; r = 0.77), indicating that longer pods generally contributed to heavier pod weight (Figure 4). Similarly, leaf length (C12) and leaf width (C13) also showed a strong positive relationship (r = 0.71), reflecting coordinated leaf growth (Figure 4). Furthermore, ring pattern blight resistance (C4) and sooty blotch resistance (C3) showed a positive correlation (r = 0.47), which was associated with their phenotypic co-occurrence in the germplasm (Figure 4). Conversely, maturity date (C15) showed weak negative correlations with pod length (C9) (r = −0.36) and single pod weight (C11) (r = −0.28). Growth habit (C16) was also weakly negatively correlated with ring pattern blight resistance (C4) (r = −0.17) and lepidopteran larval resistance (C2) (r = −0.19) (Figure 4). Whether this pattern is driven by environmental influences, pleiotropic effects, or other confounding factors requires further targeted studies to clarify. These findings highlight both synergistic and antagonistic relationships among traits, which provide valuable guidance for breeding strategies targeting yield and resistance improvement.
Figure 4.
Correlation heatmap of the 18 agronomic traits of the 139 cowpea germplasm. Red indicates positive correlations, blue indicates negative correlations. The darker color represents a greater absolute value of the Pearson correlation coefficient. * p < 0.05.
3.3. Local and Global Weights of Criteria and Sub-Criteria
Through statistical analysis of questionnaire data, hierarchical judgment matrices were constructed at different levels, and local and global weights for each trait were calculated (Table 5 and Table 6). Consistency test results indicated that the Consistency Ratios (CR) for adaptability traits, yield traits, and growth traits layers were all below 0.10, demonstrating satisfactory consistency and reliability of the matrices (Table 5).
Table 5.
The local weights of criteria and consistency test of the pairwise comparison matrix.
Table 6.
Global weights of the three criteria and eighteen sub-criteria.
In the local weight analysis, yield traits (B2) exhibited the highest weight at the criterion layer (0.633), followed by adaptability traits (B1, 0.261) and growth traits (B3, 0.106) (Table 5). Among adaptability traits, thrips resistance (C1) had the highest weight (0.462), highlighting its significance in cowpea growth; lepidopteran larval resistance (C2) and sooty blotch resistance (C3) both shared substantial weights (0.195 each), underscoring their important roles. Within yield traits, pods per plant (C6) ranked first (0.419), followed by single pod weight (C11) (0.187), confirming the critical influence of pod-related traits on yield formation (Table 5). In growth traits, maturity date (C15) and color of immature pod (C14) demonstrated the highest weights (0.298 and 0.281, respectively), whereas leaf length (C12) and leaf width (C13) showed the lowest weights (0.051 each) (Table 5).
Global weight results revealed that pods per plant (C6) and thrips resistance (C1) were the dominant contributors (0.265 and 0.121), while leaf length (C12) and leaf width (C13) contributed minimally (0.005 each), indicating their negligible impact on the comprehensive evaluation (Table 6). These findings emphasize the central role of pod-setting capacity and thrips resistance in holistic cowpea germplasm trait assessment, while confirming that pod-related traits are primary determinants of yield performance.
3.4. Comprehensive Evaluation and Ranking of Cowpea Germplasm Accessions
Based on the established evaluation criteria and AHP-derived weights, comprehensive scores were calculated for the 139 cowpea germplasm accessions across 18 agronomic traits (Table S5). Utilizing these scores, the accessions were classified into four distinct tiers based on the following score thresholds: Grade I (score ≥ 80), Grade II (score ≥ 65), Grade III (score ≥ 50), and Grade IV (score < 50). Grade I accessions (n = 3), including ‘Changde Baipi Doujiao’, ‘Guilin Changjiangdou’ and ‘Guangrao Wuyuemang’, displayed exceptional yield potential and robust disease resistance. Grade II accessions (n = 32) exhibited superior disease resistance and environmental adaptability with notable yield advantages; Grade III accessions (n = 79) showed moderate performance in yield and resistance, with specific limitations suggesting suitability for targeted regional deployment. In contrast, Grade IV accessions (n = 25) consistently presented deficient yield and overall performance, rendering them unsuitable for cultivation in the middle-lower reaches of the Yangtze River.
3.5. Cluster Analysis of Cowpea Germplasm
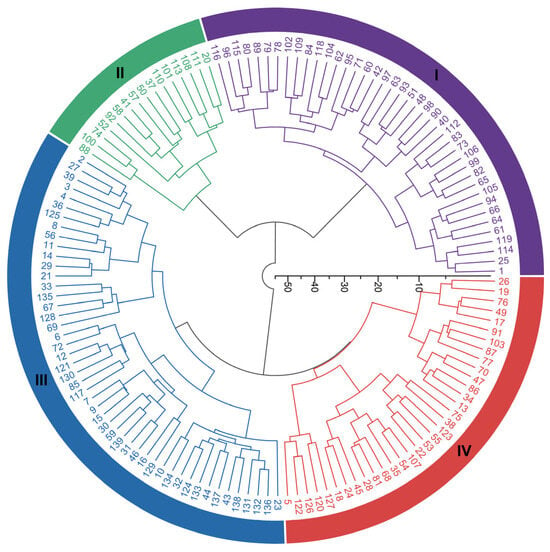
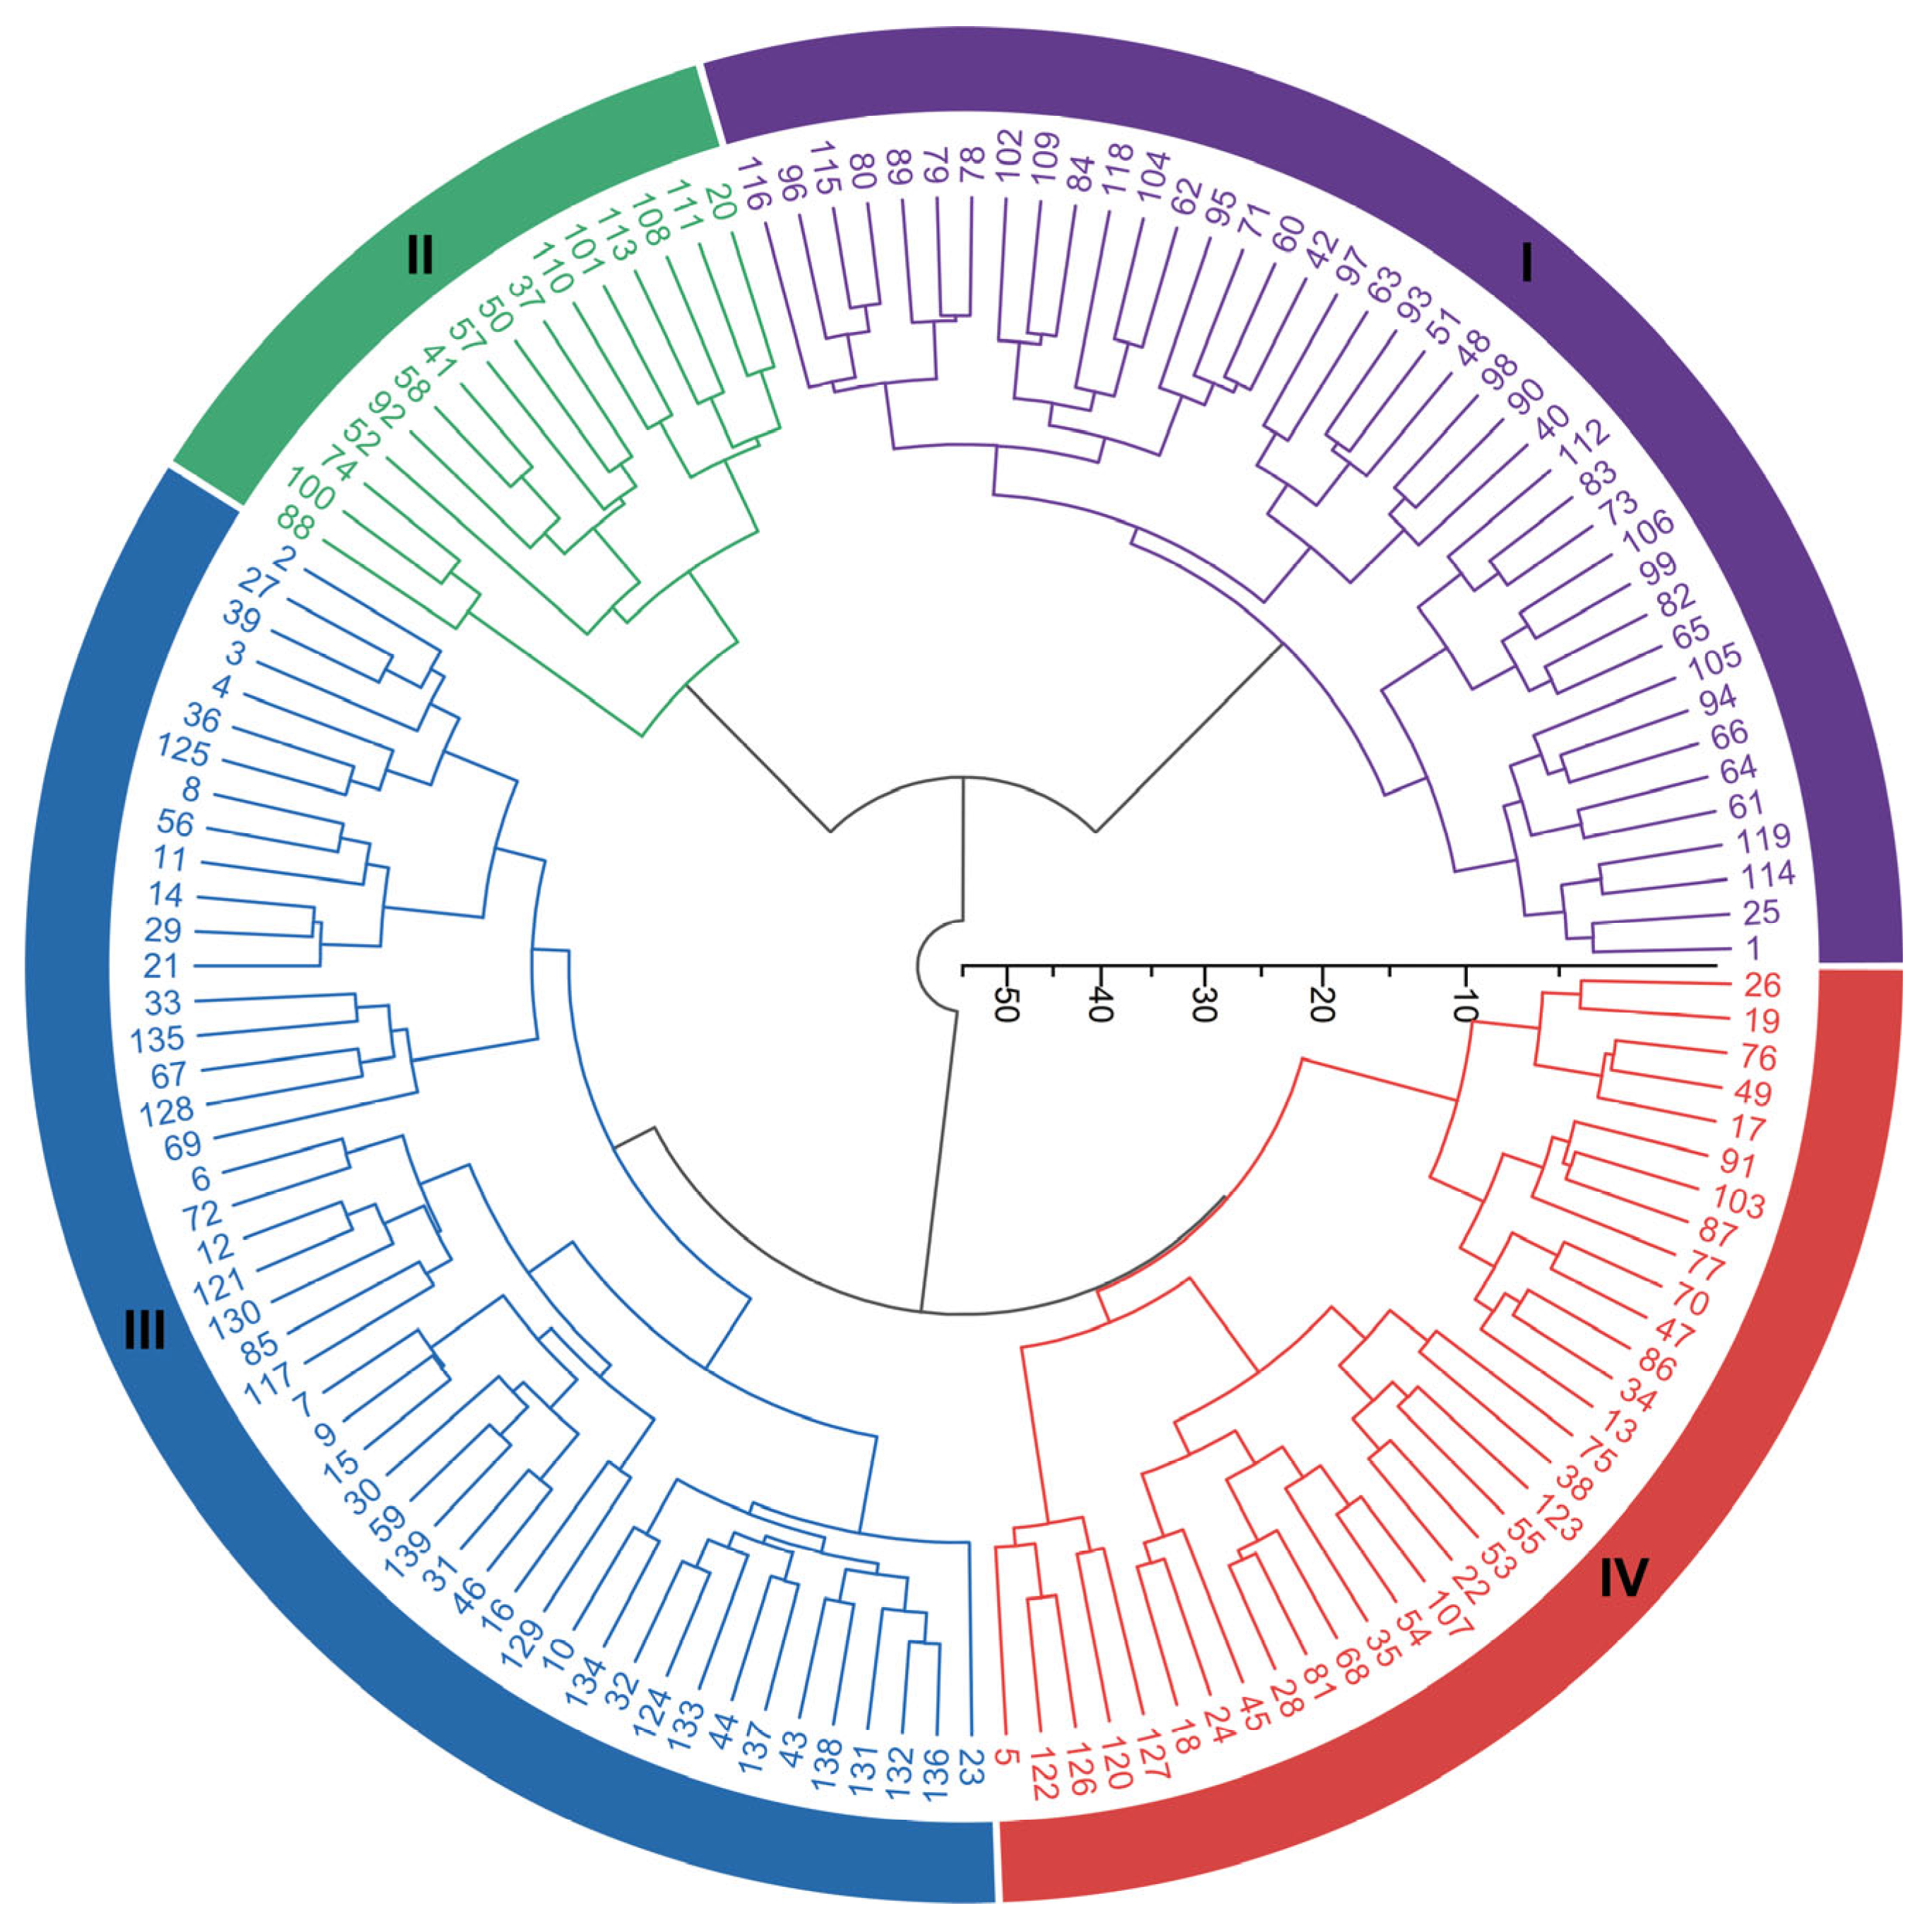
Cluster analysis was performed on the 18 agronomic traits of 139 cowpea germplasm after Z-score standardization, using Ward’s method with Euclidean distance as the similarity measure. At a distance threshold of 21, the germplasm was divided into four phenotypically distinct groups (Figure 5). Group I accessions (n = 41, 29.50%) showed fewer pods per plant (C6) but robust pest resistance, achieving high-resistance levels against thrips (C1), sooty blotch disease (C3), and ring pattern disease (C4) (Figure 5). Group II accessions (n = 16, 11.51%) featured short pods, high first fruiting nodes (C18), and strong stress resistance, but lower pods per plant (C6) and 100-seed weight (C8) compared to the population mean (Figure 5). Group III accessions (n = 48, 34.53%) displayed moderate pod length (C9), stable yield performance, and above-average adaptability, indicating a yield-stable and broadly adaptable type (Figure 5). Conversely, Group IV accessions (n = 34, 24.46%) exhibited exceptional pod length (C9) and significant yield advantages, but lower adaptability (Figure 5). These clustering results showed a partial overlap with the AHP-based classification.
Figure 5.
Cluster dendrogram of 139 cowpea germplasm based on 18 agronomic traits. Hierarchical cluster analysis was performed using Ward’s method with Euclidean distance, resulting in four distinct groups at a cutoff distance of 21. Color coding for accession groups: Blue indicates Group I accessions, Green indicates Group II accessions, Purple indicates Group III accessions, and Orange indicates Group IV accessions.
3.6. Principal Component Analysis of Cowpea Germplasm
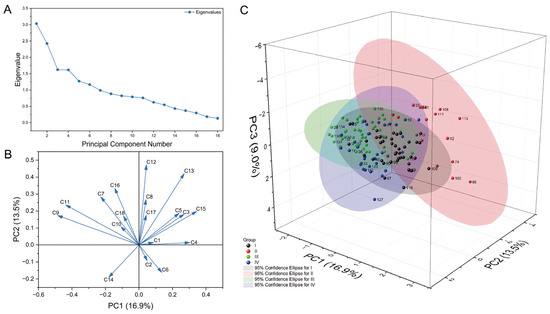
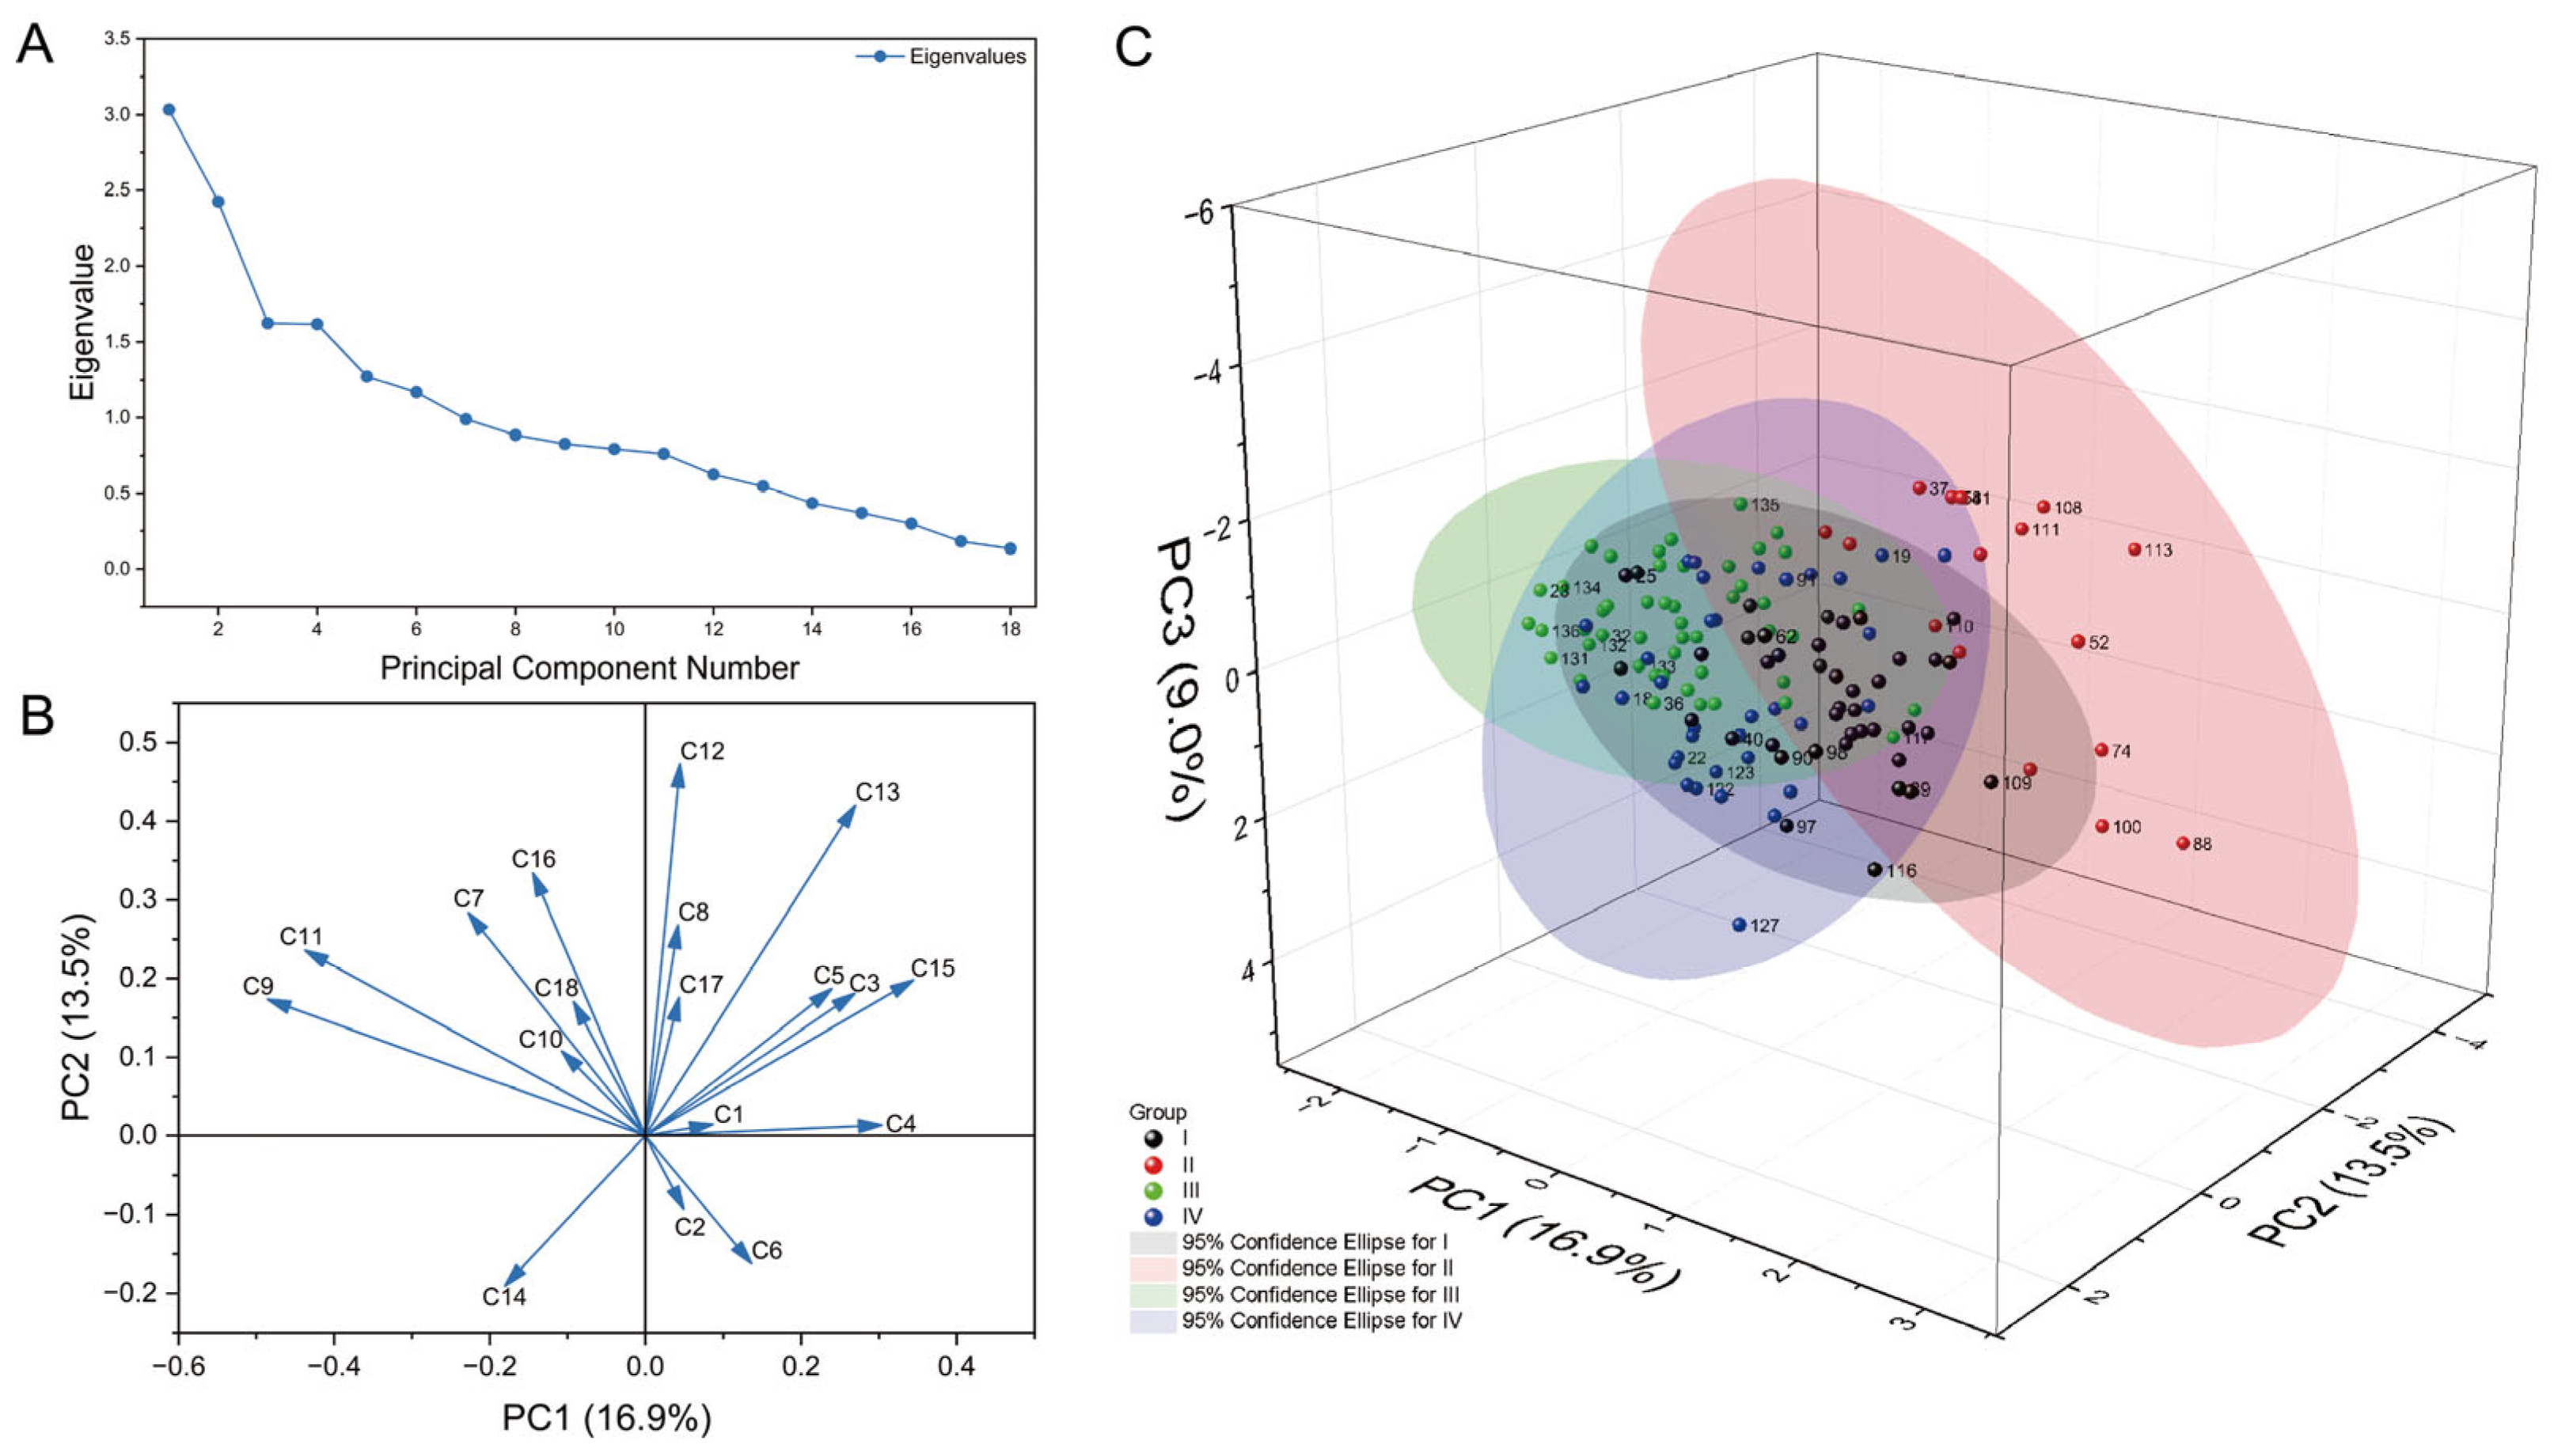
Principal component analysis was performed on the standardized dataset to elucidate the associations among traits. Phenotypic variation in this dataset is distributed across multiple principal components, and the PC1-PC2 plot (Figure 6B) is presented only to visualize the dominant two-dimensional trend of germplasm distribution and trait loadings, rather than to represent the total phenotypic variation in the dataset. Detailed loading information for all principal components is provided in the Supplementary Table S6.
Figure 6.
PCA analysis of 139 cowpea germplasm based on 18 agronomic traits. (A) a scree plot for principal component selection. (B) PC1-PC2 loadings plot with variance contribution percentages in parentheses. (C) Integrated PCA scores and dendrogram where colored dots represent distinct cluster groups with 95% confidence ellipses.
The first seven principal components cumulatively explained 67.41% of the phenotypic variation (Figure 6A, Table S6). Among these, PC1, with an eigenvalue of 3.034 and a variance contribution rate of 16.86%, was dominated by ring pattern blight resistance (C4), heat tolerance (C5), and maturity date (C15), reflecting the major contribution of adaptive traits to phenotypic variation (Figure 6B, Table S6); PC2, with an eigenvalue of 2.427 and a variance contribution rate of 13.48%, was strongly associated with growth habit (C16), leaf length (C12), and leaf width (C13), indicating an independent dimension of phenotypic variation related to plant architecture (Figure 6B, Table S6); PC3, with an eigenvalue of 1.625 and a variance contribution rate of 9.03%, was primarily loaded by ring pattern blight resistance (C4) and thrips resistance (C1), indicating a coordinated trend in the phenotypic variation in these two resistance traits (Table S6). Among the subsequent principal components, PC4 (eigenvalue 1.618, variance contribution 9.0%) contributed mainly to variation associated with single pod weight (C11) (Table S6); PC5 (eigenvalue 1.272, variance contribution 7.07%) primarily reflected the association between SPAD chlorophyll content (C17) and first flowering node (C18) in the phenotypic dataset (Table S6). Figure 6C shows the distribution pattern of 139 cowpea germplasm accessions in the principal component space.
Notably, traits that received high weights in the AHP model, such as sooty blotch resistance (C3), ring pattern blight resistance (C4), and pod length (C9), constituted the core components of PC1, the principal component with the highest cumulative variance contribution (Figure 6B).
4. Discussion
4.1. Germplasm Diversity and Phenotypic Variation in Introduced Cowpea Materials
Germplasm serves as foundational material for parental selection and functional genomics in breeding [14,40]. Given the limited diversity and insufficient systematic management of cowpea resources in China [41,42], this study introduced accessions from diverse ecological regions to enrich the genetic base. The introduced germplasm exhibited substantial variation in both qualitative and quantitative traits. Notably, heat tolerance (C5) and pod color (C14) achieved the highest Shannon diversity indices, indicating rich differentiation potential (Figure 3, Table S4). Regarding yield-related traits, pod length (C9) and pod weight (C11), as key components, demonstrated high phenotypic variation and a highly significant positive correlation (r = 0.77) (Figure 4, Table S4). This finding corroborates previous studies indicating the synergistic regulation of yield by pod morphology traits [18,43].
It should be noted that the diversity analysis in this study was based on phenotypic traits. The results primarily reflect patterns of phenotypic variation, which are jointly influenced by genetic and environmental factors, and thus cannot be equated with molecular-level genetic diversity [44]. Future research should integrate molecular marker technologies to dissect the genetic basis of these traits, which could ultimately improve selection efficiency.
4.2. Construction of a Multi-Trait AHP Evaluation System Aligned with Regional Breeding Objectives
In the process of crop breeding, reliance on a single trait often fails to comprehensively reflect the overall performance of a variety [14]. For instance, complex interactions may exist among traits such as yield, disease resistance, adaptability, and quality, making it difficult to accurately determine the superiority of a variety based solely on a single indicator [45]. To systematically integrate multi-trait information, this study introduced the AHP and constructed a comprehensive evaluation framework encompassing 18 agronomic traits across three categories: adaptability, yield, and growth traits. (Figure 2). Our weight analysis revealed that market-related traits dominated the evaluation system. Pods per plant (C6) received the highest priority due to its decisive role in yield stability, underscoring its status as a core trait for high and stable yields (Table 6) [46]. Pod length (C9) and single pod weight (C11) emerged as key indicators of commercial value, directly aligning with market demands for economically beneficial traits [47]. Considering that the Middle-Lower Yangtze River region has a subtropical monsoon humid climate, with persistent high temperatures and humidity that exacerbate pests, diseases, and heat stress [48,49], we enhanced the weights of critical adaptive traits like thrips resistance (C1) and sooty blotch resistance (C3) (Table 6). It must be acknowledged that although the 18 traits selected in this study target the primary stresses in this region, they may not cover all key adaptive challenges, such as low temperature, drought, waterlogging, and soil constraints. Future research should focus on developing standardized evaluation methods for these traits and integrating them into a more comprehensive system to improve the accuracy and generalizability of adaptability predictions.
The core of the AHP approach lies in determining relative trait weights through pairwise comparisons within a hierarchical structure. However, this process inevitably introduces subjectivity, as the assignment of weights by expert panels directly influences the final ranking [50,51]. Consequently, changes in expert selection or adjustments to the comparison matrix could lead to significant fluctuations in the rankings. The presented ranking should be interpreted as a plausible and context-specific prioritization rather than a definitive, immutable order. To overcome this limitation, future studies should incorporate sensitivity analysis or Monte Carlo simulations to assess the robustness of the ranking order to perturbations in the weight matrix [52,53]. Furthermore, integrating expert-defined weights with objective statistical methods, such as the entropy method or coefficient of variation method, could establish a more reproducible and rigorous evaluation framework, thereby enhancing the objectivity of germplasm selection [54,55].
4.3. Tiered Utilization Strategy of Cowpea Germplasm Based on AHP Grading
Based on the comprehensive evaluation and AHP grading of 139 cowpea germplasm accessions, we propose a resource application strategy with clear hierarchy and targeted applicability: Grade I materials are prioritized as candidates for advanced regional trials and parental selection; Grade II accessions, while slightly inferior to Grade I in one or more traits, still possess a solid agronomic foundation and can serve as supplementary or alternative germplasm to main cultivated varieties; Grade III accessions require region-specific improvement tailored to local ecological characteristics, for instance, through hybridization or marker-assisted selection to enhance their yield, disease resistance, or adaptability, thereby expanding their application potential [56,57]; Grade IV accessions, predominantly local landraces or wild relatives with deficiencies in yield, are not recommended for direct cultivation in the Middle-Lower Yangtze River region [58].
However, it should be noted that the phenotypic evaluation in this study was based on single-location, two-season data, which cannot fully capture genotype × environment (G × E) interaction effects [44]. Secondly, in terms of analytical methods, in order to obtain a comprehensive ranking, we merged the two-season data into a single mean value, which reflects the average performance across seasons rather than a statistically significant response to environmental changes. Therefore, conclusions regarding “strong adaptability” and “regional promotion potential” remain preliminary and require validation through multi-location and multi-year stability trials (e.g., AMMI and GGE biplot analysis). In particular, for resistance-related traits, future studies should incorporate standardized inoculation or artificial stress assays to improve the repeatability of phenotypic identification.
4.4. Multivariate Analysis and Data Discretization Limitations
Principal Component Analysis and cluster analysis are widely used multivariate statistical methods in the identification, evaluation, and classification of germplasm resources [59,60,61]. Cluster analysis divided the germplasm into four distinct groups with marked phenotypic characteristics (Figure 5), showing significant differences in key agronomic traits such as disease resistance and yield. Principal Component Analysis revealed that the first seven principal components collectively explained 67.41% of the total phenotypic variation, with the first principal component (PC1) contributing the most (Figure 6A). Notably, traits assigned higher weights in the AHP evaluation—such as Sooty Blotch Resistance (C3), Ring Pattern Blight Resistance (C4), and Pod length (C9)—were also identified as core traits with high loadings on PC1 (Figure 6B). While AHP defined the relative importance of traits based on breeding objectives, PCA objectively extracted the main phenotypic dimensions driving population differentiation from data variance. This convergence indicates that these traits are not only prioritized targets in breeding decisions but also significant, objectively measured features that drive phenotypic differentiation within the germplasm.
Notably, the discretization of continuous or qualitative traits into a finite number of grades may compress subtle gradient differences and affect the distribution of the distance matrix and the precise estimation of principal component variance [62,63]. Therefore, the cluster structure and PCA loading plots obtained in this study tend to reflect macro-level classification trends influenced by discretization, rather than fine-scale continuous phenotypic variation. Nevertheless, the current analysis has successfully identified the grouping patterns of germplasm resources in terms of major resistance, yield, and adaptability dimensions, providing valuable references for subsequent breeding selection. In future studies, consideration could be given to directly using standardized raw continuous data for analysis to more fully preserve phenotypic information, thereby enabling a more finely resolved hierarchy and detail of phenotypic variation.
4.5. Limitations and Future Directions
The AHP-based comprehensive evaluation system constructed in this study provides a valuable preliminary framework for the utilization of cowpea germplasm resources in the Middle-Lower Yangtze River region. This system can efficiently integrate multiple agronomic traits into a reusable decision-making tool, offering the advantages of low cost and high efficiency in the preliminary screening of germplasm. Despite certain limitations, it remains a valid and practical tool within the defined scope of this research. To further enhance the model’s accuracy, robustness, and general applicability, future work should be systematically carried out from the following three aspects:
First, at the data level, the foundation of phenotypic identification needs to be solidified. Multi-year, multi-location stability trials should be conducted to accurately assess genotype × environment (G × E) interactions and verify the broad adaptability of high-ranking germplasm [64]. Simultaneously, for key resistance-related traits, standardized artificial inoculation or controlled stress assays should be supplemented to obtain precise and repeatable phenotypic data.
Second, at the methodological level, the robustness and resolution of the evaluation system should be optimized. For the subjectivity of AHP weights, future studies can introduce sensitivity analysis to quantify the impact of weight fluctuations on the ranking of resources, thereby identifying robust core elite germplasm [65].
Finally, at the mechanistic and applied level, it is necessary to promote the leap from phenotypic evaluation to genetic dissection. Leveraging high-throughput molecular marker technologies to dissect the genetic basis of important traits, developing functional markers, and realizing marker-assisted selection will provide a sustainable solution for cowpea breeding.
5. Conclusions
This study conducted variation and phenotypic diversity analysis on 139 introduced cowpea accessions, fully demonstrating the rich phenotypic diversity within this population. Subsequently, we developed an AHP evaluation model based on 18 key indicators of adaptability, yield, and growth traits. This model systematically assessed the 139 accessions, categorizing them into four groups by score. Through this evaluation, we identified three accessions that showed relatively favorable overall performance across multiple agronomic traits, and these may serve as useful candidate materials for future cowpea germplasm screening and breeding research. Clustering and principal component analysis revealed the phenotypic architecture and natural grouping patterns of the cowpea germplasm. Overall, this study provides useful germplasm information and a preliminary decision-support framework for cowpea germplasm screening in the middle-lower reaches of the Yangtze River.
Supplementary Materials
The following supporting information can be downloaded at: https://www.mdpi.com/article/10.3390/horticulturae12040479/s1, Table S1: Names and origins of cowpea germplasm; Table S2: Standardized measurement protocols for 18 agronomic and stress-tolerance traits; Table S3: Investigation results of main agronomic traits in cowpea germplasm resources; Table S4: Diversity analysis of quantitative traits in cowpea germplasm resources; Table S5: Scores and rankings of 139 cowpea germplasm accessions; Table S6: Principal component eigenvalue analysis based on correlation matrix.
Author Contributions
Conceptualization, Y.Y.; methodology, X.W.; investigation, F.D., T.Z., B.Z. and J.L. (Jiaxuan Li); resources and data curation, F.D. and T.Z.; writing—original draft preparation, F.D.; writing—review and editing, F.D., X.W., J.L. (Jianping Liu) and Y.Y.; supervision, H.H., Y.G., X.W., J.L. (Jianping Liu) and Y.Y.; project administration, Y.Y. and X.W.; funding acquisition, Y.Y. and X.W. All authors have read and agreed to the published version of the manuscript.
Funding
This research was supported by the earmarked fund for Jiangxi Agriculture Research System (JXARS-04), the Jiangxi Provincial Natural Science Foundation (20252BAC200068).
Data Availability Statement
The original contributions presented in this study are included in the article/Supplementary Materials. Further inquiries can be directed to the corresponding authors.
Conflicts of Interest
The authors declare no conflicts of interest.
Abbreviations
The following abbreviations are used in this manuscript:
| AHP | Analytic hierarchy process |
| SPAD | Soil Plant Analysis Development |
| CV | Coefficient of Variation |
| H′ | Shannon–Weaver diversity index |
| CI | Consistency index |
| RI | Random index |
| PCA | Principal component analysis |
References
- FAO. The State of Food Security and Nutrition in the World 2018. Building Climate Resilience for Food Security and Nutrition; FAO: Rome, Italy, 2018. [Google Scholar]
- United Nations. World Population Prospects 2019: Highlights (ST/ESA/SERA/423) Department of Economic Social Affairs, Population Division. 2019. Available online: https://population.un.org/wpp/assets/Files/WPP2019_Highlights.pdf (accessed on 1 January 2020).
- Monteleone, B.; Borzí, I.; Bonaccorso, B.; Martina, M. Quantifying crop vulnerability to weather-related extreme events and climate change through vulnerability curves. Nat. Hazards 2022, 116, 2761–2796. [Google Scholar] [CrossRef] [Scilit]
- Yang, Q.; Du, T.; Li, N.; Liang, J.; Javed, T.; Wang, H.; Guo, J.; Liu, Y. Bibliometric Analysis on the Impact of Climate Change on Crop Pest and Disease. Agronomy 2023, 13, 920. [Google Scholar] [CrossRef] [Scilit]
- Hall, A.E.; Ehlers, J.D. Cowpea (Vigna unguiculata L. Walp.). Field Crops Res. 1997, 53, 187–204. [Google Scholar]
- Carvalho, M.; Lino-Neto, T.; Rosa, E.; Carnide, V. Cowpea: A legume crop for a challenging environment. J. Sci. Food Agric. 2017, 97, 4273–4284. [Google Scholar] [CrossRef] [Scilit]
- Sindhu, M.; Kumar, A.; Yadav, H.; Chaudhary, D.; Jaiwal, R.; Jaiwal, P.K. Current advances and future directions in genetic enhancement of a climate resilient food legume crop, cowpea (Vigna unguiculata L. Walp.). Plant Cell Tissue Organ Cult. (PCTOC) 2019, 139, 429–453. [Google Scholar] [CrossRef] [Scilit]
- Wang, B.; Wu, X.; Li, S.; Chen, X.; Li, Y.; Wang, Y.; Lu, Z.; Wu, X.; Li, G. Evaluation of Cowpea Germplasm Accessions Collected from Zhejiang Province. J. Plant Genet. Resour. 2021, 2, 380–389. [Google Scholar]
- Wang, S. Origin, Classification and Germplasm Resources of Cowpea. China Veg. 1989, 6, 49–52. [Google Scholar]
- He, H.; Li, M.; Zhao, L.; Yu, J.; Li, Q.; Hu, Z.; Zhang, X. Climate change aggravates the Spatiotemporal imbalance of water resources in the Rice-Wheat rotation region of the middle and lower Yangtze river. Theor. Appl. Climatol. 2025, 156, 455. [Google Scholar] [CrossRef] [Scilit]
- Liu, W.; Sun, W.; Huang, J.; Wen, H.; Huang, R. Excessive Rainfall Is the Key Meteorological Limiting Factor for Winter Wheat Yield in the Middle and Lower Reaches of the Yangtze River. Agronomy 2021, 12, 50. [Google Scholar] [CrossRef] [Scilit]
- Li, L.; Liu, C.; Han, X.; Chunhai, J. Survey and Collection of Food Legumes Germplasm Resources in Hubei Province. China Seed Ind. 2025, 5, 34–39. [Google Scholar]
- Xin, J.; Zhang, N.; Tu, Y.; Zhang, Y.; Guan, F.; Tang, J. Investigation Analysis of Edible Bean Germplasm Resources in Jiangxi Screening of Excellent Resources. J. Plant Genet. Resour. 2025, 26, 441–454. [Google Scholar]
- Tian, W.; Li, Z.; Wang, L.; Sun, S.; Wang, D.; Wang, K.; Wang, G.; Liu, Z.; Lu, X.; Feng, J.; et al. Comprehensive Evaluation of Apple Germplasm Genetic Diversity on the Basis of 26 Phenotypic Traits. Agronomy 2024, 14, 1264. [Google Scholar] [CrossRef] [Scilit]
- Rao, L.; Chen, X.; Chen, X.; Feng, G.; Zheng, J. Identification Comprehensive Evaluation of Vigna unguiculata subsp sesquipedalis Germplasm Resources. J. Zhejiang Agric. Sci. 2009, 1, 39–41. [Google Scholar]
- Zhang, R.; Cao, H.; Sun, C.; Martin, J.J.J. Characterization of Morphological and Fruit Quality Traits of Coconut (Cocos nucifera L.) Germplasm. HortScience 2021, 56, 961–969. [Google Scholar] [CrossRef] [Scilit]
- Zhang, Y.; Cao, Y.-F.; Huo, H.-L.; Xu, J.-Y.; Tian, L.-M.; Dong, X.-G.; Qi, D.; Liu, C. An assessment of the genetic diversity of pear (Pyrus L.) germplasm resources based on the fruit phenotypic traits. J. Integr. Agric. 2022, 21, 2275–2290. [Google Scholar] [CrossRef] [Scilit]
- Wu, Z.; Wu, Y.; Li, X.; Wang, X.; Gao, F. Phenotypic Diversity Analysis of Local Cowpea Germplasms Collected from Hainan Province. Seed 2023, 42, 9–15. [Google Scholar]
- Zhang, Z.; Sun, C.; Zhan, Y.; Tian, J.; Yang, L.; Ma, J. Agronomic Characters of Cowpea Germplasm Resources: Correlation, Principal Component and Cluster Analysis. Chin. Agric. Sci. Bull. 2017, 33, 63–71. [Google Scholar]
- Tavana, M.; Soltanifar, M.; Santos-Arteaga, F.J. Analytical hierarchy process: Revolution and evolution. Ann. Oper. Res. 2021, 326, 879–907. [Google Scholar] [CrossRef] [Scilit]
- Saaty, T.L. The Analytic Hierarchy Process; Mcgraw-Hill: New York, NY, USA, 1980. [Google Scholar]
- Saaty, T.L. Decision making with the analytic hierarchy process. Int. J. Serv. Sci. 2008, 1, 83–98. [Google Scholar] [CrossRef] [Scilit]
- Ramanathan, R.; Ganesh, L.S. Using AHP for resource allocation problems. Eur. J. Oper. Res. 1995, 80, 410–417. [Google Scholar] [CrossRef] [Scilit]
- Rodríguez Sousa, A.A.; Parra-López, C.; Sayadi-Gmada, S.; Barandica, J.M.; Rescia, A.J. A multifunctional assessment of integrated and ecological farming in olive agroecosystems in southwestern Spain using the Analytic Hierarchy Process. Ecol. Econ. 2020, 173, 106658. [Google Scholar] [CrossRef] [Scilit]
- Sulthonuddin, I.; Herdiansyah, H. Sustainability of Batik wastewater quality management strategies: Analytical hierarchy process. Appl. Water Sci. 2021, 11, 31. [Google Scholar] [CrossRef] [Scilit]
- Wątróbski, J.; Bączkiewicz, A.; Rudawskad, I. A Strong Sustainability Paradigm Based Analytical Hierarchy Process (SSP-AHP) Method to Evaluate Sustainable Healthcare Systems. Ecol. Indic. 2023, 154, 110493. [Google Scholar] [CrossRef] [Scilit]
- Sun, Y.; Huang, X.; He, Y.; Dong, H.; Li, F.; Li, M.; Zhong, L.; Huang, L.; Ke, W. Evaluating germplasm of taro with numerous cormelsvia analytic hierarchy process. J. Huazhong Agric. Univ. 2015, 34, 16–22. [Google Scholar]
- Wang, X.; Zhang, R.; Zhang, K.; Shao, L.; Xu, T.; Shi, X.; Li, D.; Zhang, J.; Xia, Y. Development of a Multi-Criteria Decision-Making Approach for Evaluating the Comprehensive Application of Herbaceous Peony at Low Latitudes. Int. J. Mol. Sci. 2022, 23, 14342. [Google Scholar] [CrossRef] [Scilit]
- Feng, Y.; Cheng, X.; Lu, Y.; Wang, H.; Chen, D.; Luo, C.; Liu, H.; Gao, S.; Lei, T.; Huang, C.; et al. Gas chromatography-mass spectrometry analysis of floral fragrance-related compounds in scented rose (Rosa hybrida) varieties and a subsequent evaluation on the basis of the analytical hierarchy process. Plant Physiol. Biochem. 2022, 185, 368–377. [Google Scholar] [CrossRef] [Scilit]
- Ministry of Agriculture of the People’s Republic of China. Measures for the Management of Crop Germplasm Resources. China Cucurbits Veg. 2006, 5, 52. [Google Scholar]
- IBPGR (International Board for Plant Genetic Resources). Descriptors for Cowpea; IBPGR (International Board for Plant Genetic Resources): Rome, Italy, 1983. [Google Scholar]
- Wang, P.; Li, X. Descriptors and Data Standard for Cowpea [Vigna unguiculata (L.) Walp.]; China Agriculture Press: Beijing, China, 2005. [Google Scholar]
- Buckley, J.J. Ranking alternatives using fuzzy numbers. Fuzzy Sets Syst. 1985, 15, 21–31. [Google Scholar] [CrossRef] [Scilit]
- Wang, Y.-M.; Luo, Y.; Hua, Z. On the extent analysis method for fuzzy AHP, its applications. Eur. J. Oper. Res. 2008, 186, 735–747. [Google Scholar] [CrossRef] [Scilit]
- Xiang, W.; Xue, S.; Qin, S.; Xiao, L.; Liu, F.; Yi, Z. Development of a multi-criteria decision making model for evaluating the energy potential of Miscanthus germplasms for bioenergy production. Ind. Crops Prod. 2018, 125, 602–615. [Google Scholar] [CrossRef] [Scilit]
- Wang, P.; Han, F.; Liu, J.; Feng, Q.; Wang, H. Comprehensive evaluation of elite germplasm in cowpea. J. Plant Genet. Resour. 2001, 2, 34–37. [Google Scholar]
- Tripathi, K.; Pamarthi, R.K.; Gore, P.G.; Nagaraju, S.; Madhavan, L.; Gayacharan, C.; Singh, N.; Ahlawat, S.P.; Rana, J.C.; Pratap, A.; et al. Identification and development of key descriptors for phenotypic characterization of tuber cowpea [Vigna vexillata (L.) A. Rich.]. Genet. Resour. Crop Evol. 2022, 69, 1375–1389. [Google Scholar] [CrossRef] [Scilit]
- Qu, S.; Yang, J.; Huang, C. Research Evaluation of Local Variety Resources of Cowpea in Shandong Province. J. Laiyang Agric. Coll. 2001, 18, 177–180. [Google Scholar]
- Hong, W.; Wu, C.Z. Modification of Shannon-wiener index. J. Trop. Subtrop. Bot. 1999, 7, 120–124. [Google Scholar]
- Tripathi, K.; Gore, P.G.; Ahlawat, S.P.; Semwal, D.P.; Gautam, N.K.; Kumar, A. Cowpea genetic resources and its utilization: Indian perspective—A review. Legume Res. Int. J. 2019, 42, 437–446. [Google Scholar] [CrossRef] [Scilit]
- Pan, L.; Li, Y.; Yu, X.; Li, J.; Chen, C. Research Progress of Molecular Geneties in Cowpea (Vigna unguiculata). J. Change Veg. 2014, 24, 1–13. [Google Scholar]
- Xiong, H.; Shi, A.; Mou, B.; Qin, J.; Motes, D.; Lu, W.; Ma, J.; Weng, Y.; Yang, W.; Wu, D. Genetic Diversity Population Structure of Cowpea (Vigna unguiculata, L. Walp). PLoS ONE 2016, 11, e0160941. [Google Scholar] [CrossRef] [Scilit]
- Huang, Z.; Yan, J.; Meng, H.; Pan, L.; Zhu, W. Phenotypic Diversity Analysis of Local Cowpea Germplasm Resources in Shanghai. Vegetables 2025, Z1, 130–138. [Google Scholar]
- Kozak, M.; Bocianowski, J.; Liersch, A.; Tartanus, M.; Bartkowiak-Broda, I.; Piotto, F.A.; Azevedo, R.A. Genetic divergence is not the same as phenotypic divergence. Mol. Breed. 2011, 28, 277–280. [Google Scholar] [CrossRef] [Scilit]
- Parry, M.A.J.; Hawkesford, M.J. An Integrated Approach to Crop Genetic Improvement. J. Integr. Plant Biol. 2012, 54, 250–259. [Google Scholar] [CrossRef] [Scilit] [PubMed]
- Wang, X.; Yan, M.; Wang, X.; Wu, Z.; Zhou, J.; Wang, C.; Chen, R.; Qin, X.; Yang, H.; Wei, H.; et al. The phenotypic diversity of Schisandra sphenanthera fruit and SVR model for phenotype forecasting. Ind. Crops Prod. 2022, 186, 115162. [Google Scholar] [CrossRef] [Scilit]
- He, H.; Ma, X.; Guan, H.; Wang, F.; Shen, P. Recognition of soybean pods and yield prediction based on improved deep learning model. Front. Plant Sci. 2023, 13, 1096619. [Google Scholar] [CrossRef] [Scilit]
- Wang, X.; Qian, L.; Dong, C.; Tang, R. Evaluating the Impacts of Waterlogging Disasters on Wheat and Maize Yields in the Middle and Lower Yangtze River Region, China, by an Agrometeorological Index. Agronomy 2023, 13, 2590. [Google Scholar] [CrossRef] [Scilit]
- Zhang, M.; Li, Z.; Feng, K.; Ji, Y.; Xu, Y.; Tu, D.; Teng, B.; Liu, Q.; Liu, J.; Zhou, Y.; et al. Strategies for indica rice adapted to high-temperature stress in the middle and lower reaches of the Yangtze River. Front. Plant Sci. 2023, 13, 1081807. [Google Scholar] [CrossRef] [Scilit]
- Pascoe, S. A Simplified Algorithm for Dealing with Inconsistencies Using the Analytic Hierarchy Process. Algorithms 2022, 15, 442. [Google Scholar] [CrossRef] [Scilit]
- Munier, N.; Hontoria, E. Shortcomings of the AHP Method. In Uses and Limitations of the AHP Method: A Non-Mathematical and Rational Analysis; Munier, N., Hontoria, E., Eds.; Springer International Publishing: Cham, Switzerland, 2021; pp. 41–90. [Google Scholar]
- Dobrovolskienė, N.; Pozniak, A. Simple Additive Weighting versus Technique for Order Preference by Similarity to an Ideal Solution: Which method is better suited for assessing the sustainability of a real estate project. Entrep. Sustain. Issues 2021, 8, 180–196. [Google Scholar] [CrossRef] [Scilit]
- Ivanco, M.; Hou, G.; Michaeli, J. Sensitivity analysis method to address user disparities in the analytic hierarchy process. Expert Syst. Appl. 2017, 90, 111–126. [Google Scholar] [CrossRef] [Scilit]
- Qin, L.; Meng, Z.; Hu, Y. Evaluation of Business Competence of Elevator Inspectors Based on Combination-Variable Weights. IAENG Int. J. Appl. Math. 2025, 55, 3207–3218. [Google Scholar]
- Zhang, Z.; Ma, G.; Song, N.; Wang, Y.; Xia, J.; Xu, X.; Shen, N. A performance evaluation method for energy storage systems adapted to new power system interaction requirements. Front. Energy Res. 2024, 12, 1365419. [Google Scholar] [CrossRef] [Scilit]
- Kumar, R.; Das, S.P.; Choudhury, B.U.; Kumar, A.; Prakash, N.R.; Verma, R.; Chakraborti, M.; Devi, A.G.; Bhattacharjee, B.; Das, R.; et al. Advances in genomic tools for plant breeding: Harnessing DNA molecular markers, genomic selection, and genome editing. Biol. Res. 2024, 57, 80. [Google Scholar] [CrossRef] [Scilit] [PubMed]
- Xu, Y.; Yang, W.; Qiu, J.; Zhou, K.; Yu, G.; Zhang, Y.; Wang, X.; Jiao, Y.; Wang, X.; Hu, S.; et al. Metabolic marker-assisted genomic prediction improves hybrid breeding. Plant Commun. 2025, 6, 101199. [Google Scholar] [CrossRef] [Scilit]
- Zafeiriou, I.; Sakellariou, M.; Mylona, P.V. Seed Phenotyping and Genetic Diversity Assessment of Cowpea (V. unguiculata) Germplasm Collection. Agronomy 2023, 13, 274. [Google Scholar] [CrossRef] [Scilit]
- Xin, Y.; Wu, Y.; Qiao, B.; Su, L.; Xie, S.; Ling, P. Evaluation on the phenotypic diversity of Calamansi (Citrus microcarpa) germplasm in Hainan island. Sci. Rep. 2022, 12, 371. [Google Scholar] [CrossRef] [Scilit]
- Chen, Y.H.; Gao, H.F.; Wang, S.; Liu, X.Y.; Hu, Q.X.; Jian, Z.H.; Wan, R.; Song, J.H.; Shi, J.L. Comprehensive evaluation of 20 pomegranate (Punica granatum L.) cultivars in China. J. Integr. Agric. 2022, 21, 434–445. [Google Scholar]
- Zhou, C.; Wu, H.; Sheng, Q.; Cao, F.; Zhu, Z. Study on the Phenotypic Diversity of 33 Ornamental Xanthoceras sorbifolium Cultivars. Plants 2023, 12, 2448. [Google Scholar] [CrossRef] [Scilit] [PubMed]
- Jolliffe, I.T.; Cadima, J. Principal component analysis: A review and recent developments. Philos. Trans. R. Soc. A Math. Phys. Eng. Sci. 2016, 374, 20150202. [Google Scholar] [CrossRef] [Scilit]
- Nirmal, K.R.; Satyanarayana, K.V.V. Validating the Effect of Different Discretization Methods for Redic K-Prototype Clustering Algorithm. Int. J. Innov. Technol. Explor. Eng. 2019, 8, 2231–2236. [Google Scholar]
- Sabaghnia, N.; Mohammadi, M.; Karimizadeh, R. Yield stability of performance in multi-environment trials of barley (Hordeum vulgare L.) genotypes. Acta Univ. Agric. Silvic. Mendel. Brun. 2013, 61, 787–793. [Google Scholar] [CrossRef] [Scilit]
- Emmenegger, B.; Zapletal, F.; Hudec, M.; Portmann, E. Weighted multi-criteria decision-making with coalition strategies: A framework for citizens public participation. Central Eur. J. Oper. Res. 2025. advance online publication. [Google Scholar]

Disclaimer/Publisher’s Note: The statements, opinions and data contained in all publications are solely those of the individual author(s) and contributor(s) and not of MDPI and/or the editor(s). MDPI and/or the editor(s) disclaim responsibility for any injury to people or property resulting from any ideas, methods, instructions or products referred to in the content. |
© 2026 by the authors. Licensee MDPI, Basel, Switzerland. This article is an open access article distributed under the terms and conditions of the Creative Commons Attribution (CC BY) license.