


Abstract
Selenium biofortification is an effective way to improve the nutritional value of edible fungi. In this study, Pleurotus geesteranus ‘Xiuzhen 909’ was cultivated on a substrate in which 40% of the cottonseed hulls were replaced with lychee wood sawdust and to which sodium selenite (Na2SeO3) was added at 0, 100, 200, 300, 400, and 500 mg/kg Mycelial growth, days to full colonization, single-fruit-body weight, and selenium content were determined, and differentially accumulated metabolites (DAMs) and differentially expressed genes (DEGs) were analyzed by widely targeted LC-MS metabolomics and Illumina transcriptome sequencing. Selenium content in fruiting bodies increased from 0.052 to 0.277 mg/kg with increasing substrate selenium concentration. Days to full colonization were shortest at 200 mg/kg (28.6 d) and longest at 500 mg/kg (34.6 d), and single-fruit-body weight was highest at 200 mg/kg (74.4 g) and lowest at 500 mg/kg (56.3 g, 17.7% below the control). A total of 7729 metabolites were identified. The five comparisons yielded 2206 to 3246 DAMs, mainly involved in galactose metabolism, amino sugar and nucleotide sugar metabolism, glutathione metabolism, and 418 to 3685 DEGs, with significant enrichment of starch and sucrose metabolism, arginine and proline metabolism, and five other pathways at 100 mg/kg. RT-qPCR of eight candidate genes, six of which encode starch and sucrose metabolism enzymes, agreed with the transcriptome data. The DA scores of amino sugar and nucleotide sugar metabolism, galactose metabolism, and starch and sucrose metabolism were 1.00 between 100 and 400 mg/kg, and at 500 mg/kg only galactose metabolism remained at 1.00. Cell wall biogenesis and (1 → 6)-β-D-glucan synthesis were also enriched at 300 and 400 mg/kg. At 500 mg/kg, purine metabolism and glycine, serine and threonine metabolism turned negative, the numbers of DAMs and DEGs decreased, and colonization was delayed. Starch and sucrose metabolism is the core pathway of the selenium response in this strain, and these results provide comparable data for choosing selenium concentrations in P. geesteranus cultivation.
1. Introduction
Pleurotus geesteranus is an edible mushroom with a delicious flavor and high nutritional value that can convert inorganic selenium into organic selenium, making it a high-quality selenium-supplementing food. Selenium biofortification is an effective approach to improving the nutritional and functional value of edible mushrooms [1,2]. The species, concentration, and application mode of exogenous selenium significantly affect selenium enrichment efficiency, selenium speciation, and yield; among different exogenous selenium species, selenomethionine (SeMet) was the predominant organic selenium species in P. geesteranus fruiting bodies, and synergistic or antagonistic changes in mineral element accumulation were also observed [3]. Selenium biofortification also increased the polysaccharide content and selenium level of P. geesteranus and altered the monosaccharide composition and antioxidant activity of its polysaccharides [4]. Integrating transcriptomics and metabolomics is an important strategy for elucidating abiotic stress responses in plants and fungi [5,6], and RT-qPCR is a common method for validating the expression of key genes [7]. Multi-omics analyses have been used to reveal the developmental programs and metabolic regulation of edible fungi [8], and transcriptome sequencing has been used to characterize gene expression at different developmental stages and during primordium formation in P. pulmonarius [9,10]. The molecular mechanisms underlying selenium uptake, transport, and metabolism in P. geesteranus nevertheless remain unclear, and systematic studies of metabolite and gene expression changes in fruiting bodies across selenium concentrations are still scarce. Selenium is essential at trace levels but inhibitory at higher concentrations, and the suitable range varies with species, selenium source, and cultivation practice [11].
Most studies have focused on a single selenium source or on the final selenium content of the product, and the coordinated networks of metabolic reprogramming and gene expression regulation across low, medium, and high selenium concentrations are still poorly understood. In Lentinula edodes, selenium biofortification increased fruiting body biomass and nutritional quality; organic selenium occurred mainly as SeMet at low concentrations (≤300 mg/kg) and shifted to Se-methylselenocysteine at high concentrations (≥400 mg/kg) [11]. Cultivating edible mushrooms on selenium-fortified substrates altered the chemical composition, mineral bioavailability, and yield of fruiting bodies [2]. Multi-omics technologies have been widely applied to the genetics and breeding, growth and development, and stress responses of edible fungi [12]. Integrated metabolomic and transcriptomic analyses of P. geesteranus across selenium concentrations are nevertheless still limited, and most studies have not measured selenium accumulation and growth performance together with gene expression and metabolite data, which limits the interpretation of dose effects.
In this study, P. geesteranus ‘Xiuzhen 909’ was cultivated on a substrate in which 40% of the cottonseed hulls were replaced with lychee wood sawdust, with sodium selenite gradients of 0, 100, 200, 300, 400, and 500 mg/kg. Mycelial growth, days to full colonization, single-fruit-body weight, and selenium content were determined, DAMs and DEGs were identified by widely targeted metabolomics and Illumina transcriptome sequencing, and eight core genes of starch and sucrose metabolism were validated by RT-qPCR. The aims were to characterize selenium accumulation, growth performance, and the metabolome and transcriptome along the concentration gradient in this strain and substrate, to identify the pathways that respond to selenium, and to determine the selenium concentration that balances growth and selenium content. The results provide a reference for selenium-enriched cultivation of P. geesteranus.
2. Materials and Methods
2.1. Fungal Strain and Reagents
The P. geesteranus strain used in this study was ‘Xiuzhen 909’. Glucose, agar, sodium selenite, phenol, chloroform, anhydrous ethanol, and 75% ethanol were purchased from Sinopharm Chemical Reagent Co., Ltd. (Shanghai, China). RNase-free water and Trizol reagent were purchased from Nanjing Novizan Biotechnology Co., Ltd. (Nanjing, China). The FastPure® Universal Plant Total RNA Isolation Kit and the HiScript II 1st Strand cDNA Synthesis Kit were purchased from Nanjing Vazyme Biotech Co., Ltd. (Nanjing, China). The NEB Next Ultra II RNA Library Prep Kit for Illumina was purchased from New England Biolabs (NEB, Ipswich, MA, USA). Agarose and GelRed nucleic acid stain were purchased from Hunan Aikerui Bioengineering Co., Ltd. (Changsha, China); DNA Marker III was purchased from Beijing Lanjeco Technology Co., Ltd., and DNA/RNA Loading Buffer was purchased from Beijing Solarbio Science & Technology Co., Ltd. (Beijing, China).
2.2. Substrate Formula
The substrate consisted of cottonseed hulls (40%, w/w), lychee (Litchi chinensis) wood sawdust (40%, w/w), wheat bran (18%, w/w), gypsum (1%, w/w), and quicklime (1%, w/w), with a moisture content of 60% (w/w).
2.3. Cultivation Management
Six Na2SeO3 concentrations (0, 100, 200, 300, 400, and 500 mg/kg on a dry substrate basis) were designated CK, XZB, XZC, XZD, XZE, and XZF, and each treatment had three biological replicates. The substrate for each treatment was prepared as three independent batches, one per replicate, adjusted to 60% moisture (w/w), mixed thoroughly, and packed into polypropylene bags (15 × 30 cm, 0.005 cm thick; 500 g wet substrate per bag); about 10 kg of substrate was used per treatment. The bags were sealed with fruiting rings, sterilized at 121 °C and 0.12 MPa for 3 h, cooled, and inoculated individually in a clean bench with the same batch of spawn. The inoculated bags were placed in a single cultivation room and distributed randomly on the shelves. Mycelia were incubated at 20–25 °C and 75–85% relative humidity with ventilation twice daily; illumination was provided by the climate chamber at approximately 10 lx with a 12 h light/12 h dark photoperiod. The room was disinfected every 2 d and contaminated bags were removed promptly. When the mycelium had fully colonized the bags, the bags were opened for fruiting at 18–24 °C and 80–90% relative humidity with ventilation twice daily.
Fruiting bodies were harvested at maturity, when the caps were not fully expanded, the margins were slightly incurved, the stipes were solid, and the color was dark. Ten bags per treatment were used to determine mycelial growth rate, days to full colonization, and single-fruit-body weight. The three biological replicates for omics analysis came from the three independently prepared substrate batches: one bag was selected at random from each batch, one mature fruiting body was taken per bag, and the samples were flash-frozen and stored at −80 °C (18 samples in total). Replicates were therefore independent substrate batches, and variation among replicates includes batch-level variation.
2.4. Metabolite Profiling by Ultra-Performance Liquid Chromatography–Tandem Mass Spectrometry (UPLC-MS/MS)
Freeze-dried samples were ground at 60 Hz for 30 s, and 25 ± 1 mg of each sample was accurately weighed into a 2 mL centrifuge tube. Then 1000 μL of extraction solution (methanol/water, 4:1, v/v, containing internal standards) and two 3.2 mm steel balls were added. The mixture was vortexed for 30 s, homogenized at 45 Hz for 4 min, and ultrasonicated in an ice-water bath for 5 min. After standing at −20 °C for 1 h, the samples were centrifuged at 12,000 rpm and 4 °C for 15 min, and the supernatant was filtered through a 0.22 μm membrane into injection vials. Equal volumes of sample extracts were pooled as quality control (QC) samples, and three QC injections were interspersed in the analytical sequence to assess instrument stability and repeatability. A total of 9956 peaks were extracted from the raw data; peaks absent from more than 50% of the samples were removed, missing values were imputed with half the minimum value, and the data were normalized to the total ion current (TIC), leaving 7729 metabolites for downstream analysis.
Chromatographic conditions: a Vanquish ultra-high-performance liquid chromatograph equipped with a Kinetex C18 column (2.1 mm × 50 mm, 2.6 μm); mobile phase A was 0.01% acetic acid aqueous solution and mobile phase B was 50% acetonitrile/isopropanol; the column temperature was 25 °C, the autosampler temperature was 4 °C, the injection volume was 2 μL, and the flow rate was 0.3 mL/min. Mass spectrometric conditions: a Stellar quadrupole–linear ion trap mass spectrometer equipped with a heated electrospray ionization source (H-ESI) operated in parallel reaction monitoring (PRM) mode; the spray voltage was 3.8 kV/−3.4 kV, the sheath, auxiliary, and sweep gas flow rates were 50, 15, and 1 arb, respectively, the ion transfer tube temperature was 320 °C, and the vaporization temperature was 450 °C.
Metabolites were identified against an in-house plant standard database and a plant-specific database on the basis of retention time and matching of precursor and fragment ions. Multiple adducts and fragment ions of the same compound were merged for identification, and the fragment ion with the best stability and specificity was used for quantification.
2.5. Metabolomics Data Analysis
After LOG transformation and UV scaling, principal component analysis (PCA) and orthogonal partial least squares discriminant analysis (OPLS-DA) were performed in SIMCA 18.0.1 (Sartorius Stedim Data Analytics AB, Umeå, Sweden), and models were evaluated by 7-fold cross-validation. Hierarchical clustering analysis (HCA) was performed with the pheatmap package in R. The OPLS-DA models of the five comparisons had R2Y of 0.999–1.000 and Q2 of 0.970–0.993 (Table S1), and 200 permutation tests gave R2Y and Q2 intercepts of 0.84–0.88 and −0.39 to −0.34, respectively (Table S1). DAMs were defined by variable importance in projection (VIP) > 1 and p < 0.05 (Student’s t-test), and Benjamini–Hochberg (BH) adjusted q values were also calculated for all metabolites (Table S2). KEGG pathway enrichment was performed with the KEGG database and MetaboAnalyst; because KEGG has no pathway annotation for P. geesteranus, metabolites were mapped through the Arabidopsis thaliana pathway database. The differential abundance (DA) score was calculated to summarize the direction of change within a pathway: a score of 1 indicates that all annotated DAMs in the pathway are upregulated and −1 that all are downregulated.
2.6. RNA Extraction and Transcriptome Sequencing
Approximately 100 mg of sample was ground to a fine powder in liquid nitrogen, and total RNA was extracted using the FastPure® Universal Plant Total RNA Isolation Kit according to the manufacturer’s instructions. RNA purity was assessed with a NanoDrop spectrophotometer (OD260/280 = 1.9–2.1; Thermo Scientific, Wilmington, DE, USA), and RNA integrity was assessed using an Agilent 5400 system (Agilent Technologies, Santa Clara, CA, USA). Total RNA that passed quality control (≥1 μg per sample) was used for enrichment of polyadenylated mRNA with Oligo(dT) magnetic beads. The mRNA was randomly fragmented to approximately 300 bp using divalent cations, after which first-strand cDNA was synthesized with random primers followed by second-strand synthesis; end repair, A-tailing, and adaptor ligation were then performed. Target fragments were selected using AMPure XP beads and amplified by PCR to construct the sequencing library. Libraries were preliminarily quantified with Qubit 2.0 (Thermo Fisher Scientific, Waltham, MA, USA), insert sizes were checked on the Agilent 5400, and effective concentrations were measured by qPCR. Libraries were pooled proportionally and sequenced on an Illumina NovaSeq X Plus platform (PE150; Illumina, San Diego, CA, USA).
Raw data were quality-filtered using fastp (v0.23.4): reads containing adapters, reads with low-quality bases (Q ≤ 20), reads containing more than five ambiguous bases (N), and reads shorter than 15 bp were removed to obtain high-quality clean data for subsequent analysis.
2.7. Transcriptome Assembly, Annotation, and Differential Expression Analysis
Clean reads were assembled de novo with Trinity (v2.15.2) and clustered with Corset (v1.09) to remove redundancy, yielding 148,216 unigenes with an N50 of 3963 bp and a mean length of 1496.8 bp. Assembly completeness was assessed with BUSCO (v5.8.2, eukaryota_odb10, 255 BUSCOs), and 99.6% of BUSCOs were complete. Coding regions were predicted with TransDecoder (v5.7.1). GO terms were assigned with InterProScan (v5.59-91.0), KEGG annotations with KofamKOALA (v1.3.0), NR, KOG, and SwissProt hits with DIAMOND (v2.1.9), and Pfam domains with PfamScan (v1.6). The annotation rates were 57.17% (NR), 46.93% (SwissProt), 16.84% (KEGG), 31.20% (GO), and 31.16% (Pfam), with 67.48% of unigenes annotated in at least one database. The best NR hits were dominated by Pleurotus pulmonarius (49.76%), followed by Phaeodactylum tricornutum (6.48%), P. ostreatus (5.18%), and Capsaspora owczarzaki (3.25%); GO and KEGG assignments therefore rest on homology and domain prediction and are putative annotations. Clean reads were aligned to the unigene set with Bowtie2 (v2.3.5.1), and FPKM values were calculated with RSEM (v1.3.3); unigenes with a mean FPKM below 0.1 were filtered out. Each selenium treatment was compared with the control using the negative binomial generalized linear model of DESeq2 (v1.38.3), with |log2FoldChange| > 1 and padj < 0.05 as the threshold for DEGs. GO and KEGG enrichment of DEGs was performed with clusterProfiler (v4.6.2) at padj < 0.05, and gene set enrichment analysis (GSEA) was also run. Candidate genes are referred to by the unigene identifiers of this assembly, and their correspondence with homolog identifiers in public databases is given in Table S3.
2.8. RT-qPCR Validation
Using the starch and sucrose metabolism genes previously identified as selenium-responsive in Lentinula edodes [11] as a reference, homologous unigenes were identified in the transcriptome of this study (Table S3), and primers were designed from the unigene sequences (Table 1). Primer specificity was confirmed by melt curve analysis and agarose gel electrophoresis.
Table 1.
Primer sequences used for RT-qPCR.
Reverse transcription was performed with the HiScript II 1st Strand cDNA Synthesis Kit in a 20 μL reaction containing 1 μg of RNA, 1 μL of Oligo(dT) primer, 4 μL of 5× reverse transcription buffer, 2 μL of dNTP mixture (10 mmol/L), 1 μL of RNase inhibitor, and 1 μL of reverse transcriptase. qPCR was performed with SYBR Green chemistry in a 20 μL reaction containing 10 μL of 2× SYBR premix, 0.4 μL of forward primer (10 μmol/L), 0.4 μL of reverse primer (10 μmol/L), 1–2 μL of cDNA, and an appropriate volume of RNase-free water; the program was 95 °C for 30 s, followed by 40 cycles of 95 °C for 5 s and 60 °C for 30 s, and a final melt curve analysis. The 18S rRNA gene was used as the reference gene, as in the Lentinula edodes selenium study [11]. Each treatment had three biological replicates and each sample had three technical wells, and relative expression was calculated by the 2−ΔΔCt method with the control as calibrator. All comparisons were made between selenium treatments of the same gene.
2.9. Determination of Growth, Single-Fruit-Body Weight, and Selenium Content
Ten bags per treatment were selected at random, a starting line was marked when the mycelium reached the shoulder of the bag, and mycelial extension was measured after 7 d to calculate the mycelial growth rate (cm/d); days to full colonization (d) was the interval from inoculation to complete colonization of the bag. Ten first-flush fruiting bodies per treatment were weighed to determine single-fruit-body weight (g). Selenium content was measured by inductively coupled plasma mass spectrometry (ICP-MS) after pressure-vessel digestion: 0.01–0.5 g of dried sample was digested with 5 mL of nitric acid at 80 °C for 2 h, 120 °C for 2 h, and 160 °C for 4 h; the digest was evaporated to near dryness, redissolved in 1% nitric acid, and made up to 25 mL; and selenium was measured on a NexION 1000 ICP-MS (PerkinElmer, Waltham, MA, USA), with three independent fruiting bodies digested per treatment. GBW10022 (garlic powder) was used as the quality control material, with measured selenium contents of 0.359–0.391 mg/kg against a certified value of 0.39 ± 0.07 mg/kg, and reagent blanks were 0.072–0.087 μg/L.
2.10. Statistical Analysis
Data are presented as the mean ± standard deviation. Mycelial growth rate, days to full colonization, single-fruit-body weight, and selenium content were analyzed by one-way ANOVA in SPSS 26.0 with Duncan’s multiple range test (p < 0.05), and F and p values are reported. Metabolite abundances were compared between the control and each selenium treatment by Student’s t-test, and BH-adjusted q values were calculated. Within-group variation was assessed as the coefficient of variation (CV = standard deviation/mean × 100%) of the three biological replicates, calculated for all 7729 metabolites and for the 1762 highly expressed genes with a mean FPKM ≥ 10 in every treatment group. For the gene–metabolite analysis, FPKM values and metabolite abundances within a pathway were log2(x + 1) transformed and correlated by Pearson’s method across the 18 samples, with BH correction; |r| ≥ 0.8 and q < 0.05 were considered significant. Figures were prepared with GraphPad Prism 9.0.
2.11. Use of AI-Assisted Language Tools
During the preparation of this manuscript, the authors used DeepSeek-V3 (deepseek-chat, DeepSeek AI, Hangzhou, China) for language editing, translation between the Chinese and English drafts, and consistency checking of numerical values and references across the text, tables, and Supplementary Files. The tool was not used to generate experimental data, to perform statistical analyses, or to create or process images. All scientific content, interpretations, and conclusions were produced and verified by the authors, who reviewed and edited all output and take full responsibility for the content of this publication.
3. Results
3.1. Growth, Single-Fruit-Body Weight, and Selenium Accumulation
Growth responded non-monotonically to substrate selenium concentration (Table 2). The mycelial growth rate did not differ among treatments (1.03–1.11 cm/d; F = 0.11, p = 0.991). Days to full colonization differed strongly (F = 25.22, p < 0.001): colonization was fastest at 200 mg/kg (28.6 ± 1.3 d) and was extended to 31.3, 32.6, and 34.6 d at 300, 400, and 500 mg/kg, respectively, 5.0 d longer than the control at 500 mg/kg. Single-fruit-body weight was highest at 200 mg/kg (74.4 ± 12.7 g, 8.8% above the control) and lowest at 500 mg/kg (56.3 ± 18.5 g, 17.7% below the control); the overall difference among treatments was not significant (F = 1.75, p = 0.139), although the values declined as selenium concentration increased.
Table 2.
Effects of sodium selenite concentration on mycelial growth, days to full colonization, single-fruit-body weight, and selenium content of P. geesteranus.
Selenium content, in contrast, increased continuously with substrate selenium concentration: from 0.052 mg/kg in the control to 0.113 ± 0.002, 0.134 ± 0.002, 0.154 ± 0.003, 0.181 ± 0.002, and 0.277 ± 0.007 mg/kg at 100, 200, 300, 400, and 500 mg/kg, respectively (Table 2; F = 814.58, p < 0.001). The increase was noticeably steeper between 400 and 500 mg/kg (0.181 to 0.277 mg/kg, 53.0%), a range in which colonization was also delayed and single-fruit-body weight declined. The values in Table 2 are total selenium measured by ICP-MS and do not distinguish selenium species. The concentration that gave the fastest colonization and the highest single-fruit-body weight (200 mg/kg) was therefore not the one that gave the highest selenium content (500 mg/kg): at 200 mg/kg, selenium reached 0.134 mg/kg, 2.6 times the control, while growth performance was maintained; at 500 mg/kg, selenium reached 0.277 mg/kg, 5.3 times the control, but colonization was 5.0 d longer and single-fruit-body weight 17.7% lower.
3.2. Quality Assessment of Transcriptome Sequencing Data
Sequencing of the 18 fruiting body samples from six selenium treatments on an Illumina NovaSeq X Plus platform (PE150) yielded 911,982,206 raw reads and 136.8 Gb of raw bases. After quality control, clean reads per sample ranged from 39.95 to 91.92 million and clean bases from 5.98 to 13.73 Gb; Q20 was above 99.2%, Q30 above 95.8%, and GC content was 51.8–54.6% (Table 3). De novo assembly produced 148,216 unigenes with an N50 of 3963 bp, 99.6% of 255 eukaryote BUSCOs were complete, and 67.48% of unigenes were annotated. Pearson correlations between the three biological replicates of each treatment were 0.895–0.982 on a log2(FPKM + 1) scale for the 4927 genes with FPKM ≥ 1 in all samples. The sequencing data were therefore of sufficient quality for the downstream analyses.
Table 3.
Quality statistics of the transcriptome sequencing data.
3.3. Overall Analysis of the Metabolome
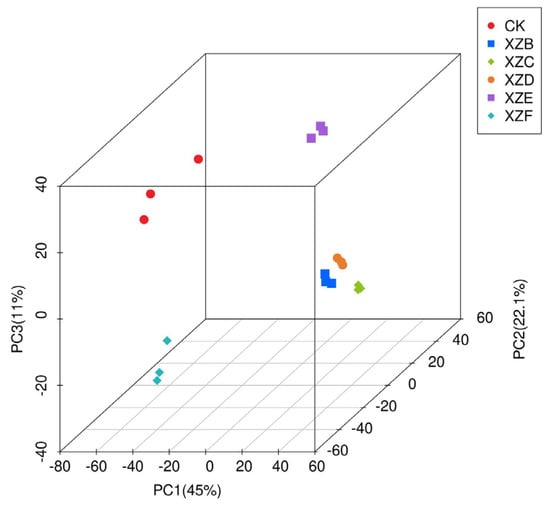
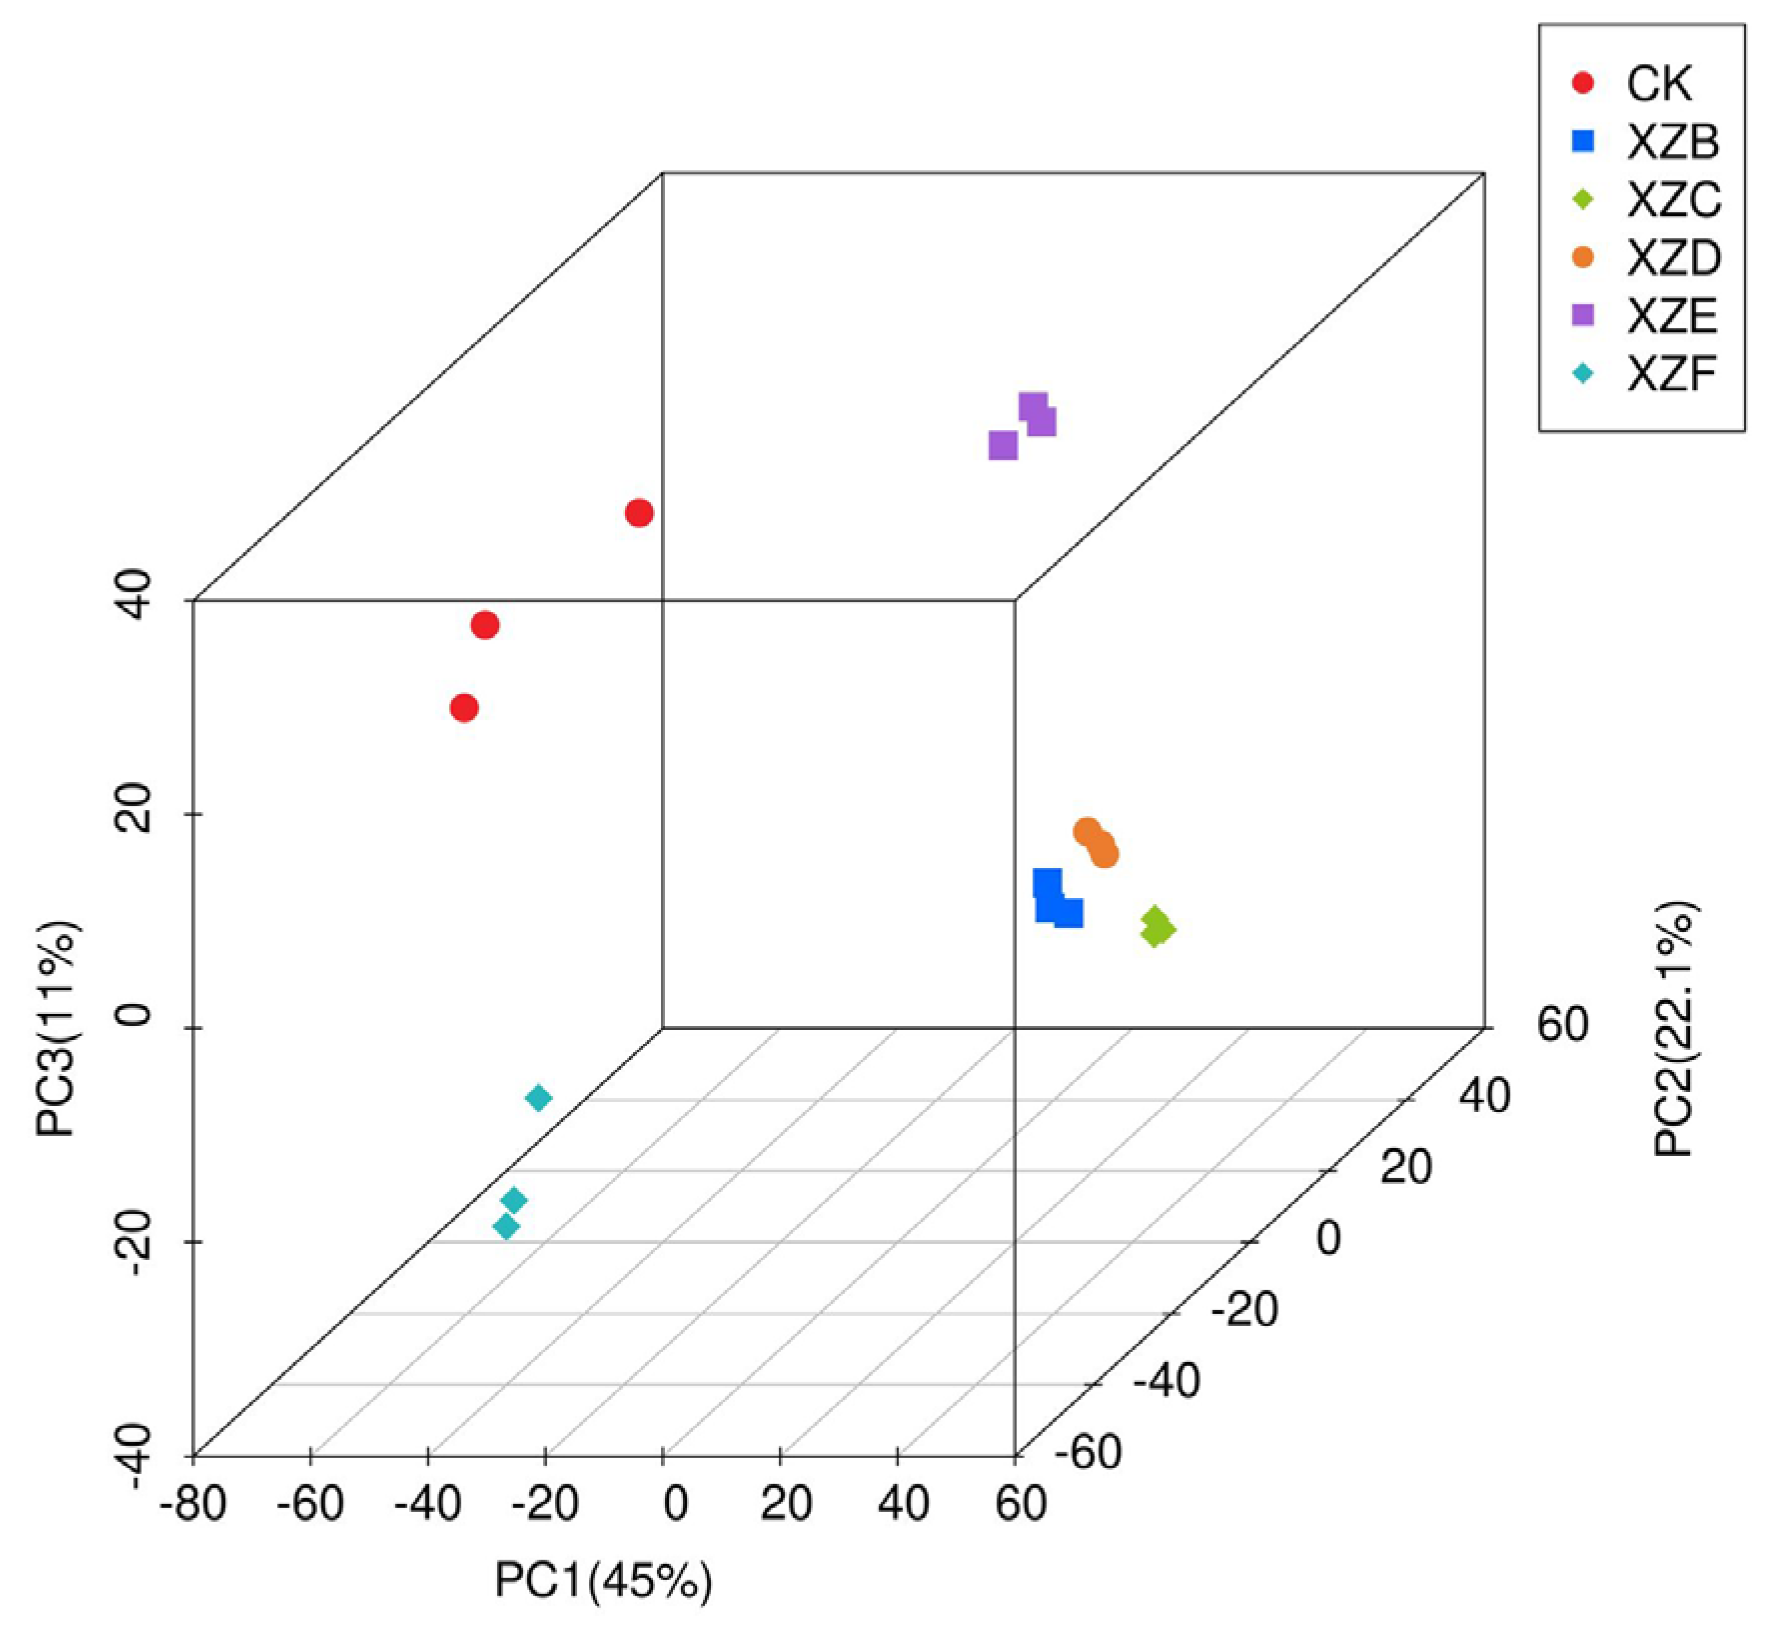
To examine the overall differences in metabolic profiles, PCA was performed on the metabolite quantification data. The three-dimensional PCA score plot showed variance contributions of 45%, 22.1%, and 11% for the first, second, and third principal components (PC1, PC2, and PC3), respectively, for a total of 78.1% (Figure 1). Replicates of the same treatment clustered tightly, whereas treatments separated clearly, indicating that selenium concentration was the main driver of metabolic differentiation.
Figure 1.
Three-dimensional PCA score plot of metabolites in P. geesteranus under different sodium selenite concentrations.
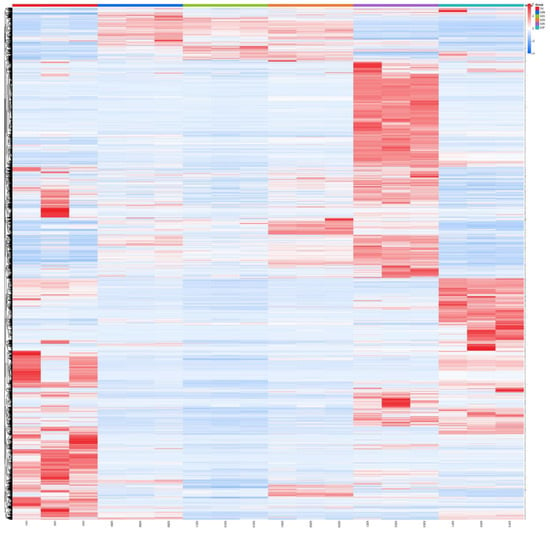
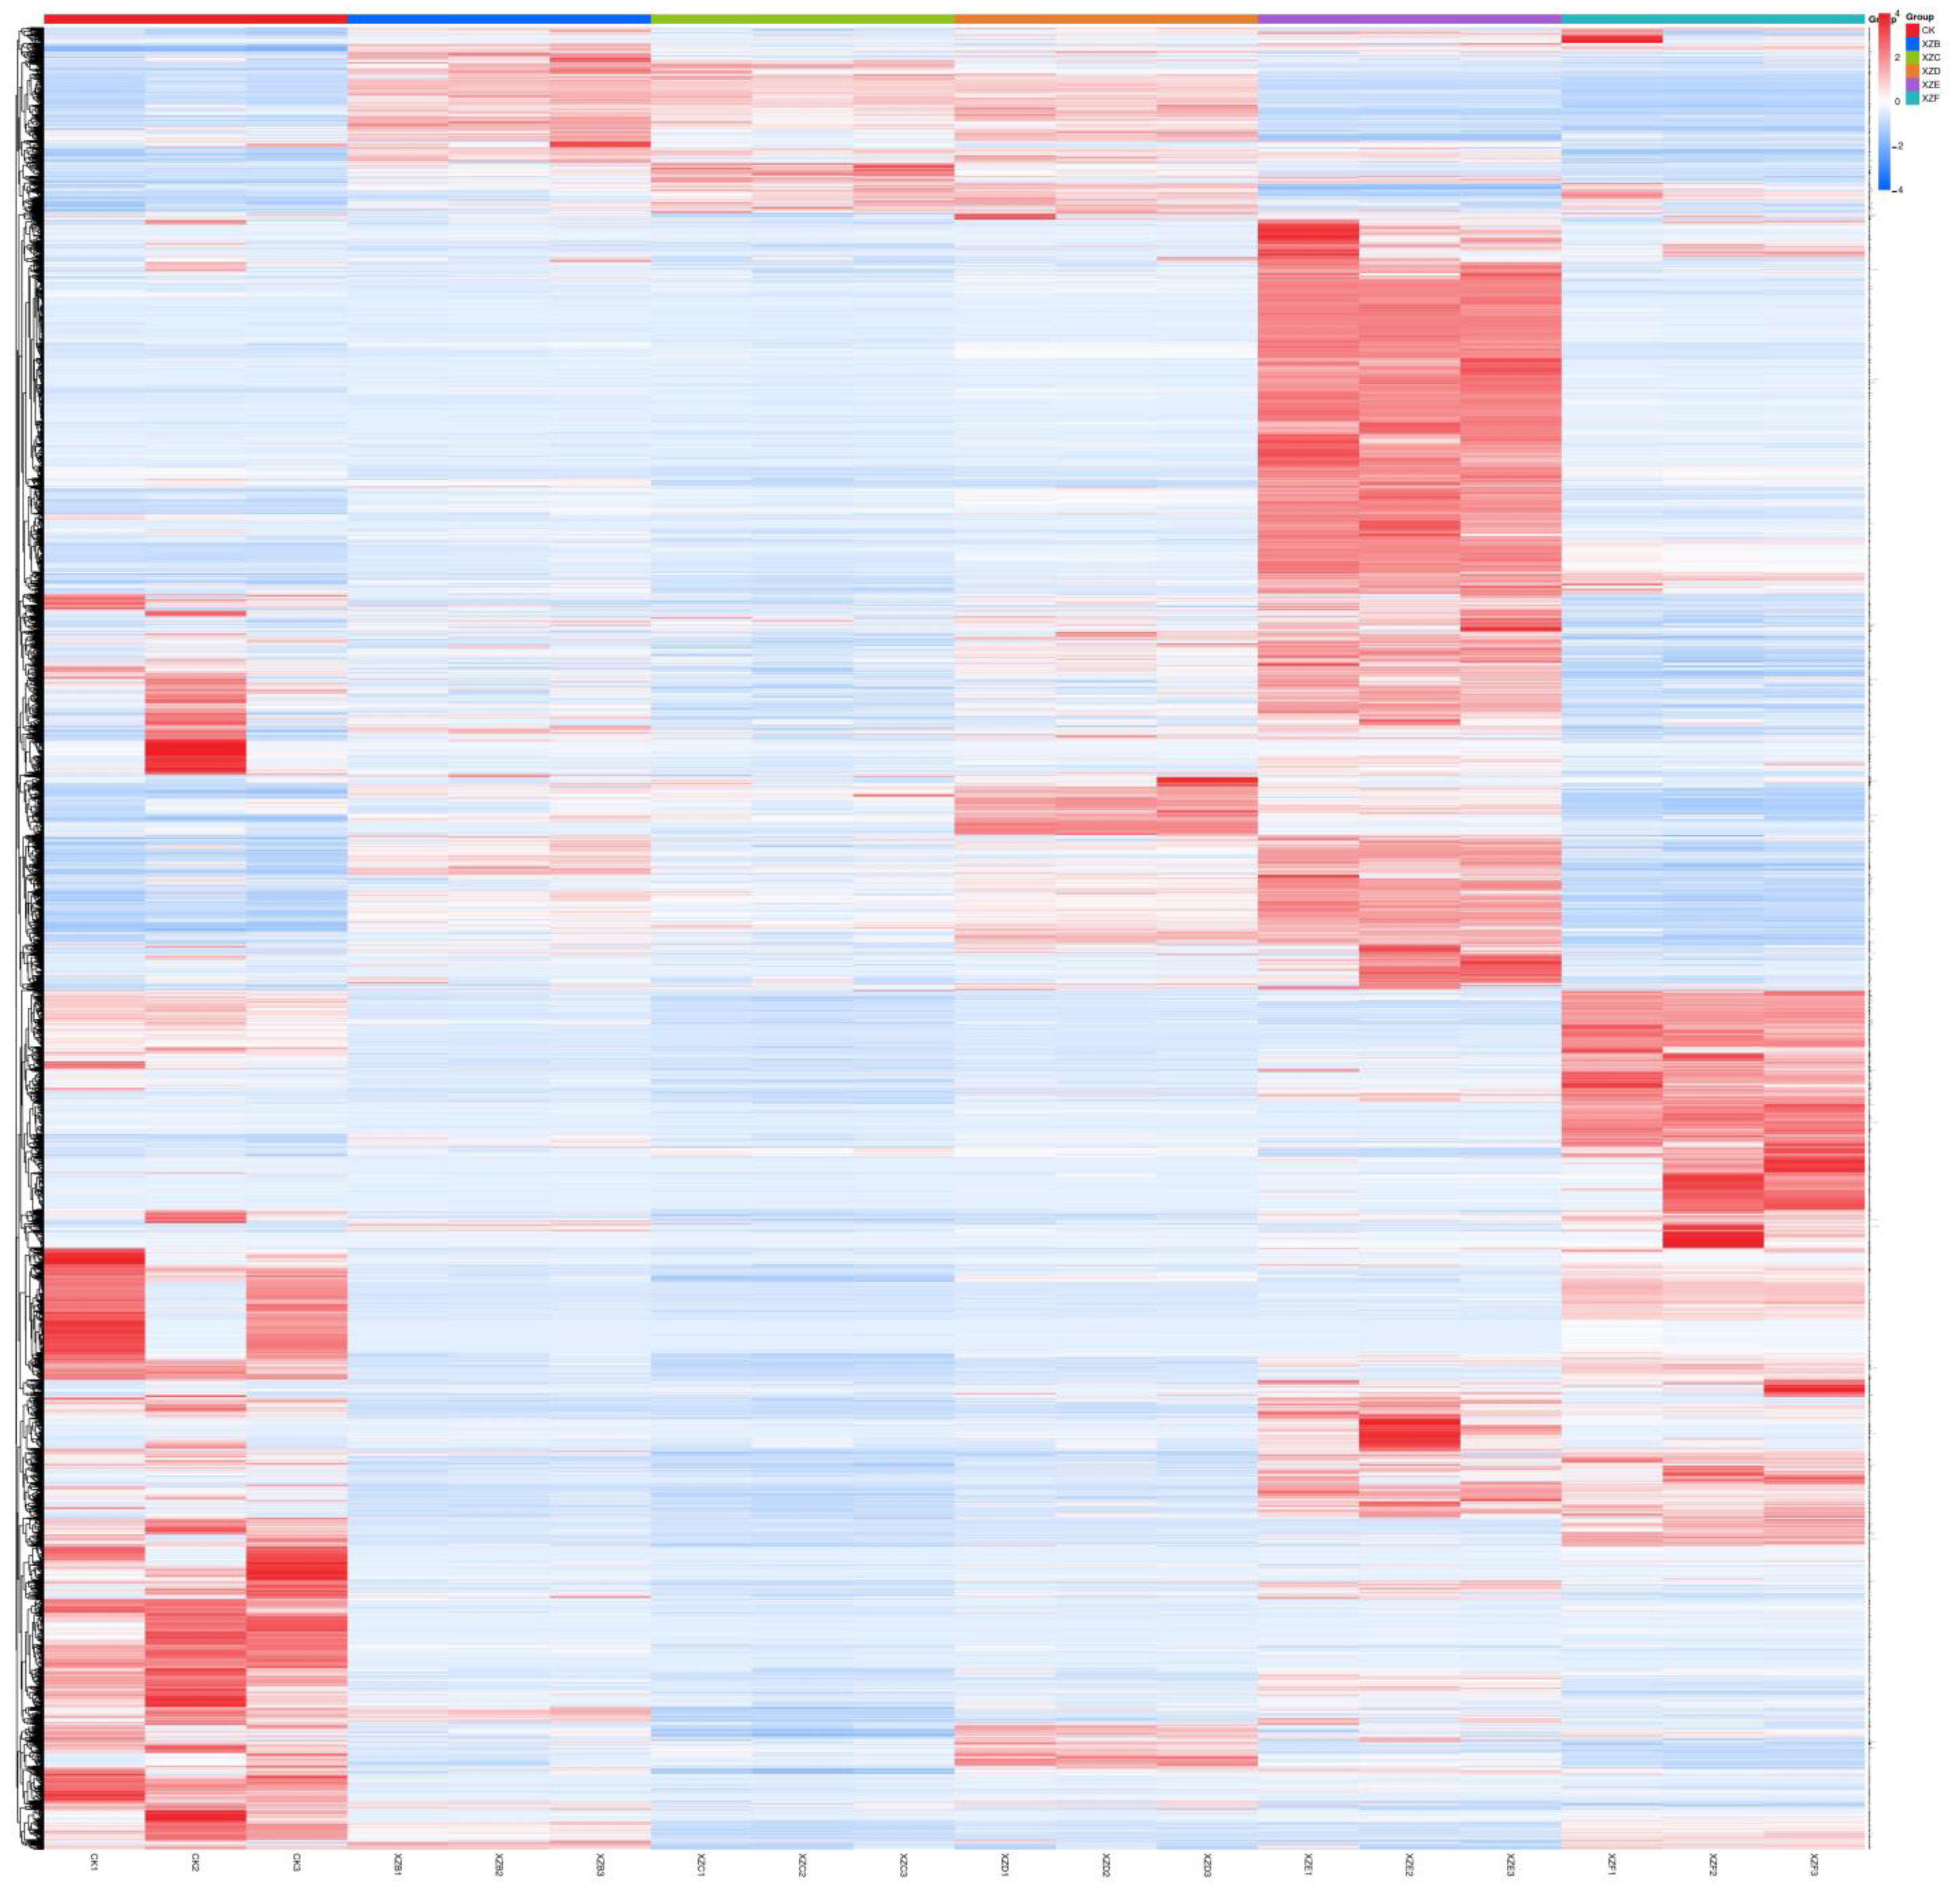
HCA further showed that metabolite abundance patterns were highly similar among replicates of the same concentration and clearly separated among treatments (Figure 2); the difference between the low-selenium group (100–200 mg/kg) and the high-selenium group (400–500 mg/kg) was the most pronounced, indicating that selenium concentration altered the overall metabolic profile of the fruiting bodies.
Figure 2.
Heatmap of hierarchical clustering of metabolites in all treatment groups. Note: The horizontal axis represents the sample groups, and the vertical axis represents all metabolites; each colored block represents the relative abundance of the metabolite at the corresponding position, with red indicating high abundance and blue indicating low abundance.
3.4. Statistical Analysis of Differentially Accumulated Metabolites
With VIP > 1 and p < 0.05 as the criteria, 2512, 2768, 2908, 3246, and 2206 DAMs were identified in CK vs. XZB, CK vs. XZC, CK vs. XZD, CK vs. XZE, and CK vs. XZF, of which 1374, 1276, 1819, 2386, and 1379 were upregulated and 1138, 1492, 1089, 860, and 827 were downregulated (Table 4). With the stricter criterion of VIP > 1 and BH-adjusted q < 0.05, 1287, 1524, 1912, 2365, and 937 DAMs were retained in the five comparisons (51.2%, 55.1%, 65.7%, 72.9%, and 42.5% of the original numbers; Table S2), and the concentration-dependent trend was unchanged. The number of DAMs first increased and then decreased with selenium concentration, peaking in CK vs. XZE (400 mg/kg) and falling markedly in CK vs. XZF. To test whether this fall reflected greater variability among replicates, the CV of the three replicates was calculated for all metabolites in each group: the medians were 25.2%, 25.9%, 22.7%, 22.9%, and 24.1% for the five selenium treatments and 41.5% for the control. Variability at 500 mg/kg was therefore not higher than at 100–400 mg/kg, and the smaller number of DAMs more likely reflects a smaller amplitude of metabolic response.
Table 4.
Statistics of differentially accumulated metabolites under different sodium selenite concentrations.
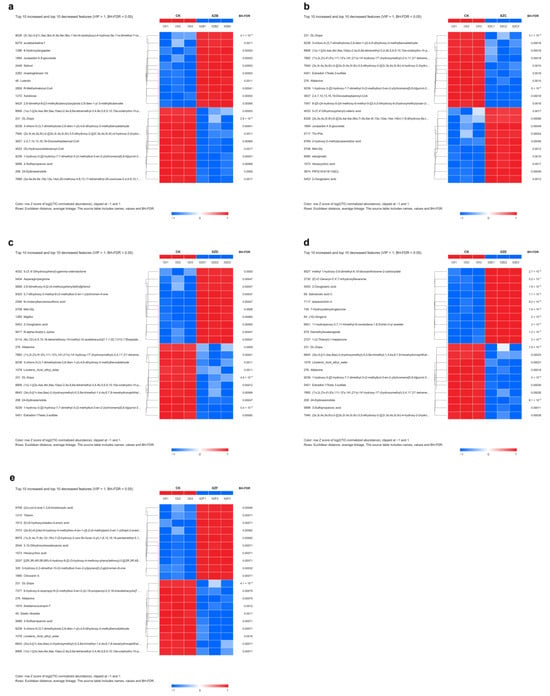
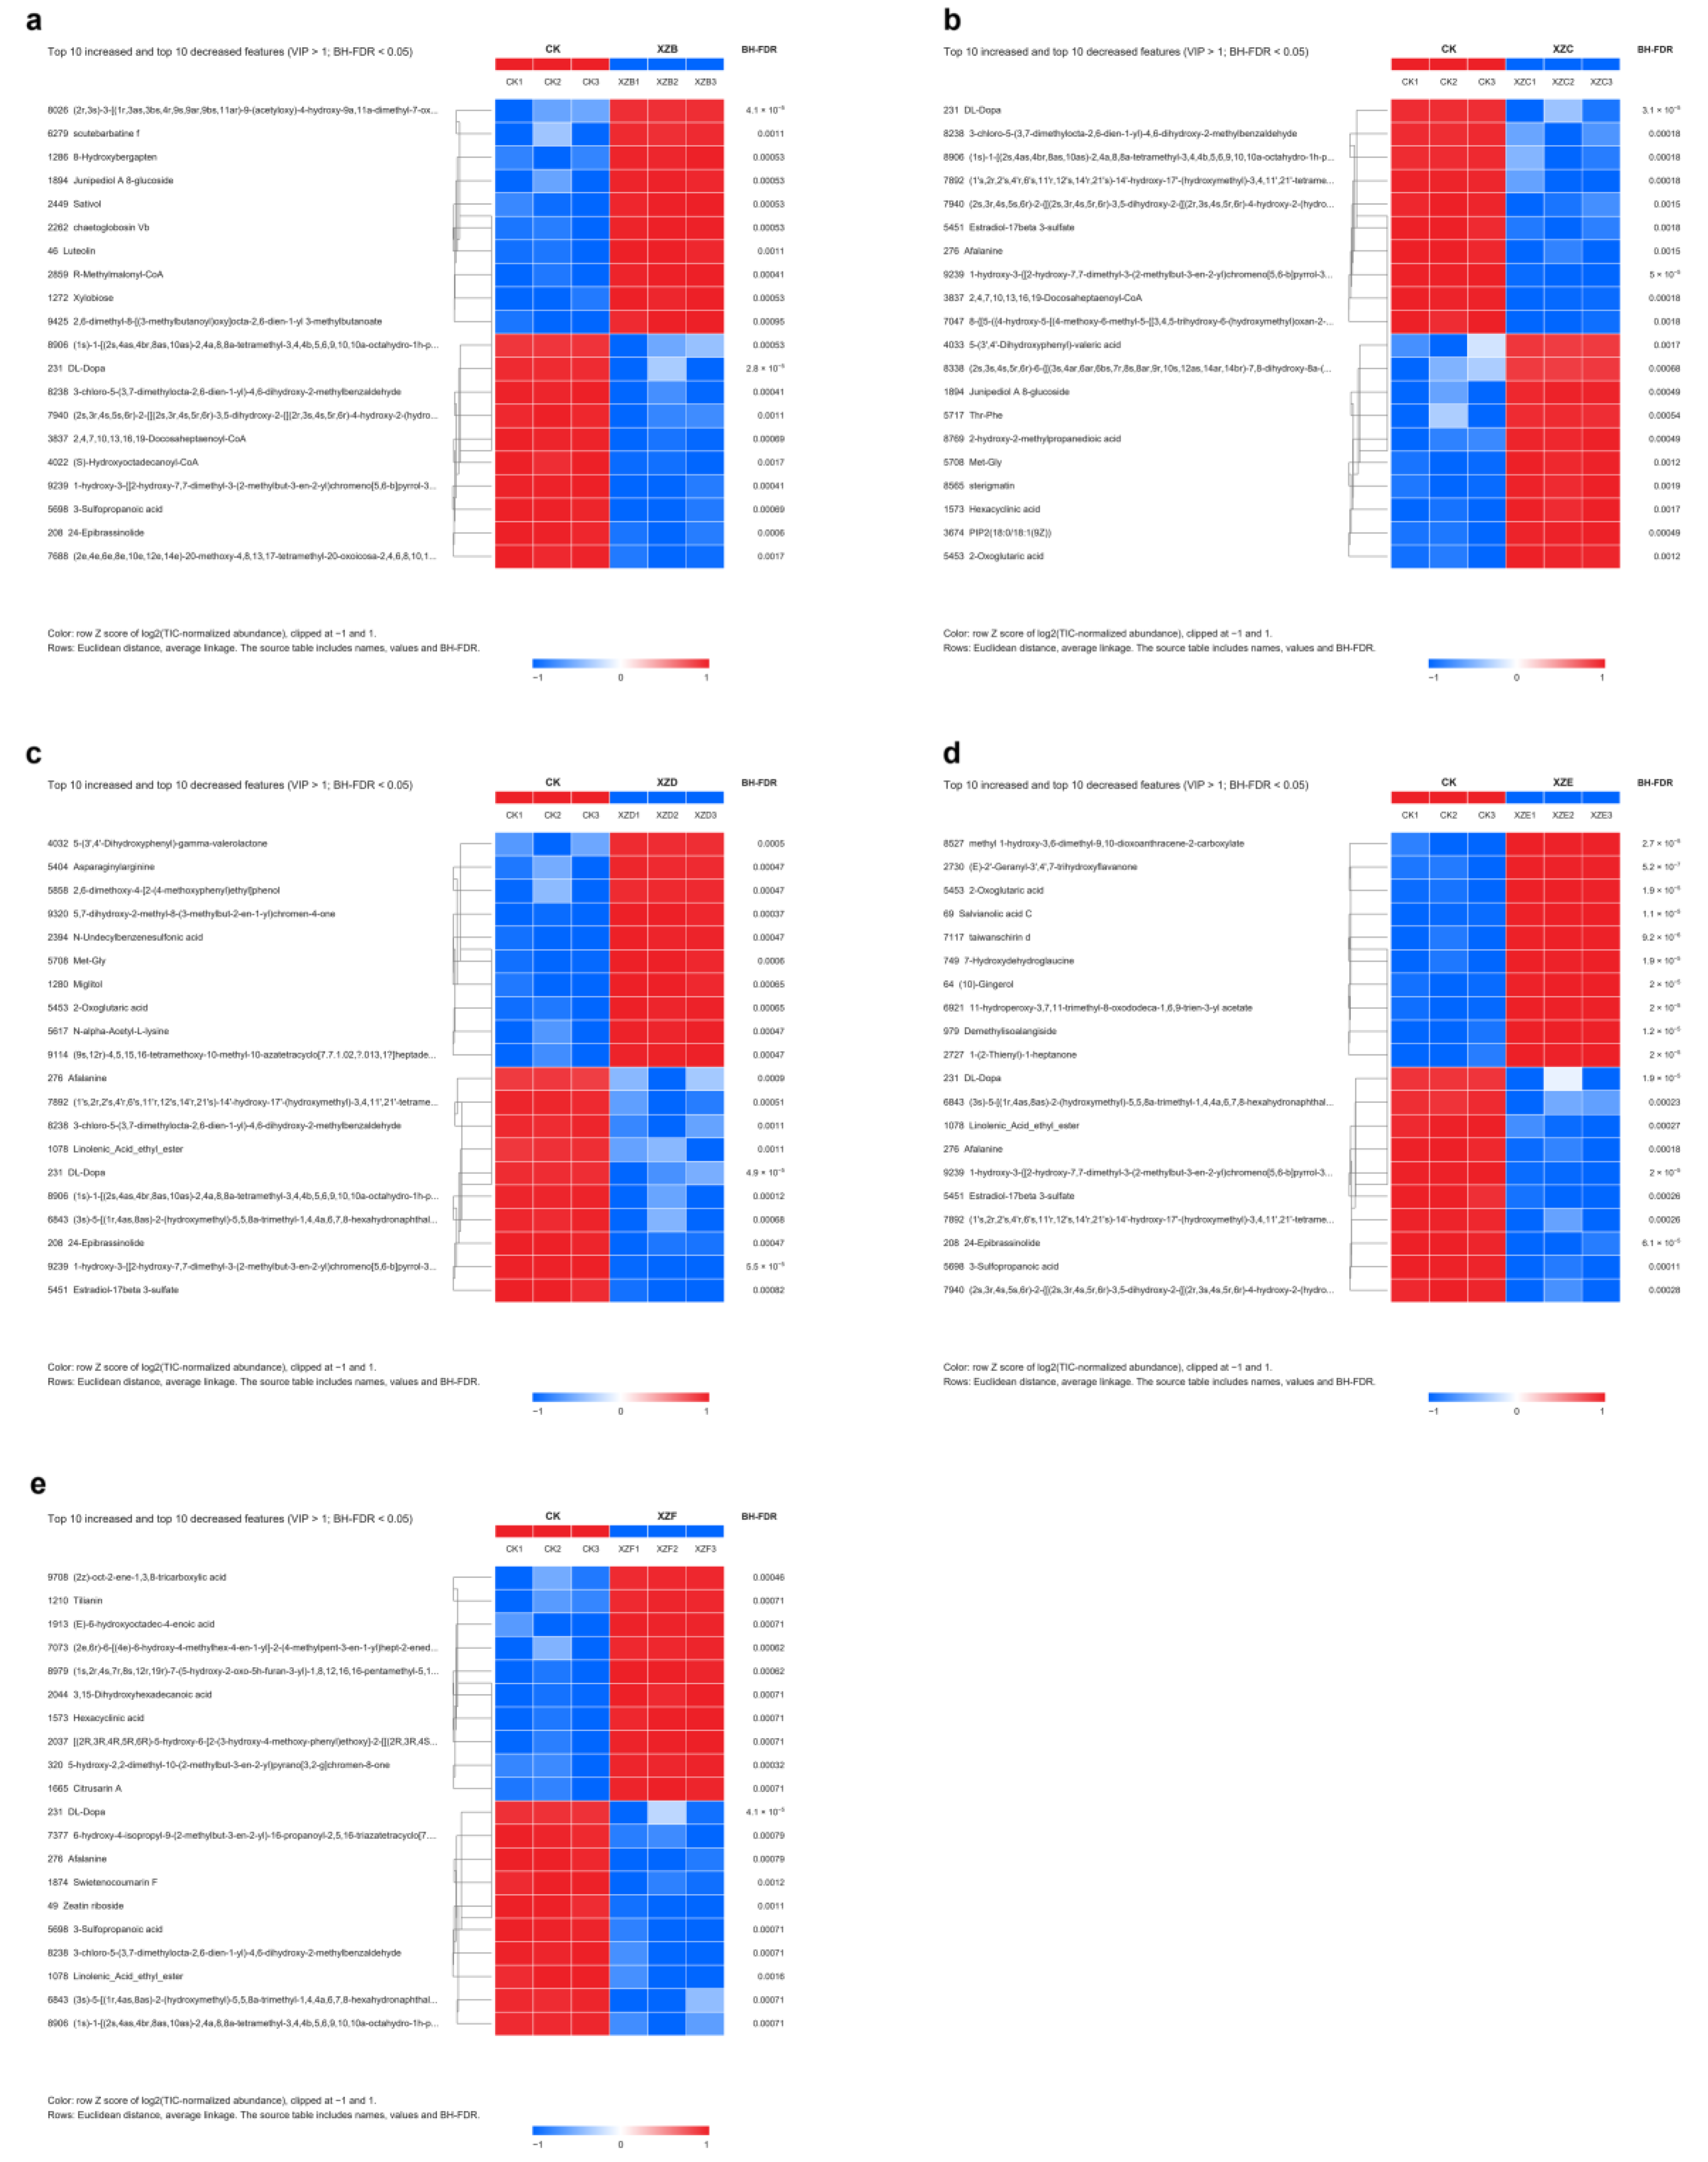
The expression patterns of the DAMs are shown in Figure 3, in which the 10 most significantly upregulated and the 10 most significantly downregulated DAMs of each comparison are plotted. In CK vs. XZB, upregulated metabolites were dominated by flavonoids and sugars such as luteolin, junipediol A 8-glucoside, xylobiose, and R-methylmalonyl-CoA, whereas 24-epibrassinolide, 3-sulfopropanoic acid, and L-DOPA were significantly downregulated (Figure 3a). CK vs. XZC was characterized by the upregulation of threonyl-phenylalanine, phosphatidylinositol 4,5-bisphosphate, sterigmatocystin, hexacyclinic acid, and 2-oxoglutaric acid (Figure 3b). In CK vs. XZD, 5-(3′,4′-dihydroxyphenyl)-γ-valerolactone, miglitol, methionyl-glycine, N-α-acetyl-L-lysine, asparaginyl-arginine, and 2-oxoglutaric acid were significantly upregulated (Figure 3c). CK vs. XZE was characterized by large changes in secondary metabolites such as terpenoids, phenolic acid derivatives, and glycosides (Figure 3d), and CK vs. XZF by changes in benzodioxole derivatives, terpenoid derivatives, and unsaturated fatty acid derivatives (Figure 3e). In terms of metabolite composition, the response involved flavonoids, phenolic acids, and sugars at 100–200 mg/kg, secondary metabolites at 300–400 mg/kg, and fatty acids and terpenoid derivatives at 500 mg/kg.
Figure 3.
Heatmaps of differentially accumulated metabolites in the five comparisons ((a): CK vs. XZB; (b): CK vs. XZC; (c): CK vs. XZD; (d): CK vs. XZE; (e): CK vs. XZF). For each comparison, the 10 most significant upregulated and 10 most significant downregulated DAMs with VIP > 1 and BH-adjusted q < 0.05 were selected; rows are metabolites and columns are the six samples; colors are z scores of log2 abundance standardized by row, and row order follows average-linkage hierarchical clustering.
3.5. KEGG Pathway Enrichment Analysis of DAMs
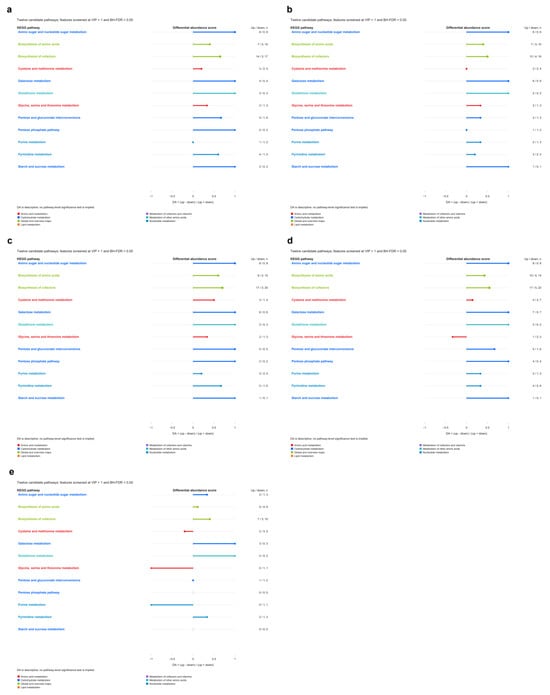
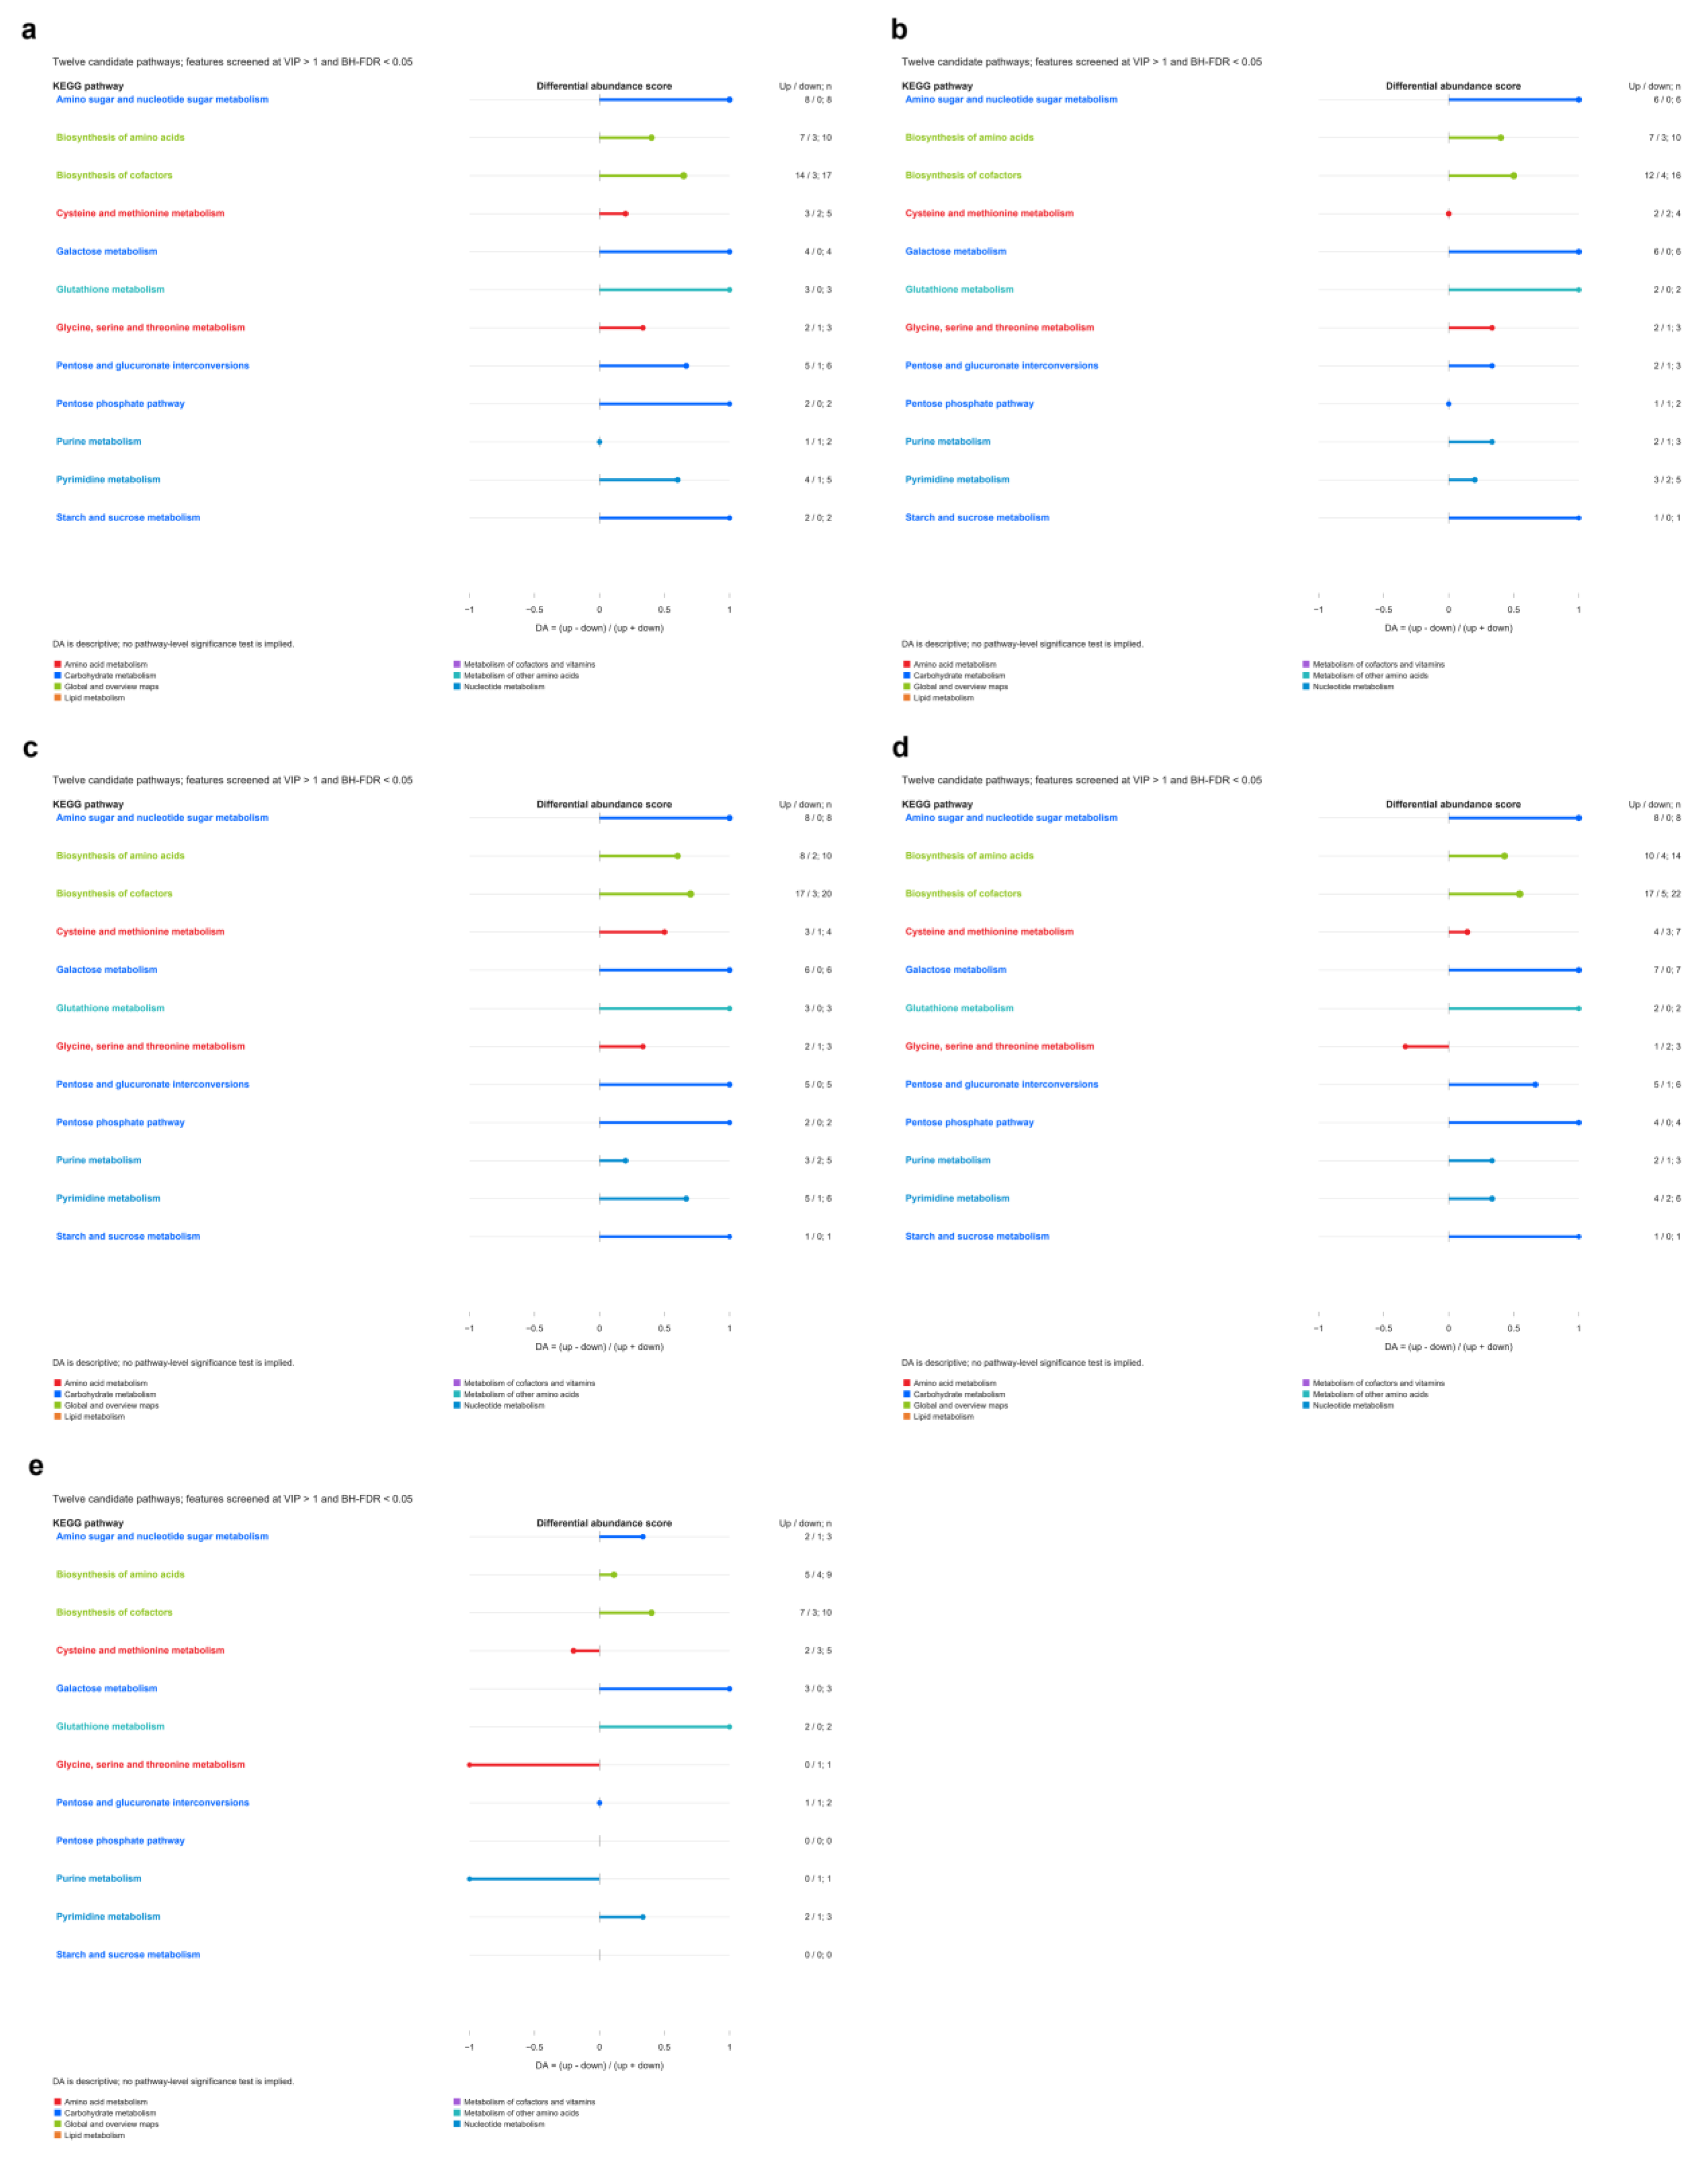
The DAMs with VIP > 1 and BH-adjusted q < 0.05 were mapped to KEGG pathways, and DA scores were calculated for the 12 pathways shared by the five comparisons (Figure 4). Sugar metabolism pathways remained positive between 100 and 400 mg/kg: the DA score of amino sugar and nucleotide sugar metabolism was 1.00 at 100, 200, 300, and 400 mg/kg (8, 6, 8, and 8 annotated DAMs, respectively), that of galactose metabolism was 1.00 in all five comparisons (3–7 DAMs), that of starch and sucrose metabolism was 1.00 between 100 and 400 mg/kg (1–2 DAMs), and that of the pentose phosphate pathway was 1.00 at 100, 300, and 400 mg/kg (2–4 DAMs). Glutathione metabolism had a DA score of 1.00 in all five comparisons (2–3 DAMs).
Figure 4.
Differential abundance (DA) score plots of DAMs in the five comparisons: (a) CK vs. XZB, (b) CK vs. XZC, (c) CK vs. XZD, (d) CK vs. XZE and (e) CK vs. XZF. In each panel the twelve pathways with the largest numbers of DAMs are shown. DA scores were calculated from DAMs with VIP > 1 and BH-adjusted q < 0.05 as (number of upregulated DAMs − number of downregulated DAMs)/number of annotated DAMs in the pathway, and range from −1 (all annotated DAMs downregulated) to +1 (all upregulated); the values on the right give the numbers of upregulated and downregulated DAMs and the number of annotated DAMs. Colours indicate the KEGG class of each pathway: amino acid metabolism (red), carbohydrate metabolism (blue), global and overview maps (light green), lipid metabolism (orange), metabolism of cofactors and vitamins (purple), metabolism of other amino acids (teal) and nucleotide metabolism (dark blue). The DA score is descriptive and no pathway-level test of significance was applied.
At 500 mg/kg, the number of DAMs passing the FDR threshold fell across pathways: starch and sucrose metabolism and the pentose phosphate pathway dropped to zero DAMs, and amino sugar and nucleotide sugar metabolism fell from 8 to 3 DAMs with a DA score of 0.33, whereas galactose metabolism and glutathione metabolism remained at 1.00. In the opposite direction, purine metabolism and glycine, serine and threonine metabolism fell to −1.00 at 500 mg/kg, and cysteine and methionine metabolism decreased from 0.14–0.50 at 300–400 mg/kg to −0.20. Sugar metabolism pathways thus maintained a stable positive response between 100 and 400 mg/kg, supplying carbon skeletons and reducing power, whereas at 500 mg/kg the number of significant metabolites decreased in most pathways and nucleotide and some amino acid pathways turned negative, in agreement with the longer colonization time and lower single-fruit-body weight.
3.6. Screening of Differentially Expressed Genes
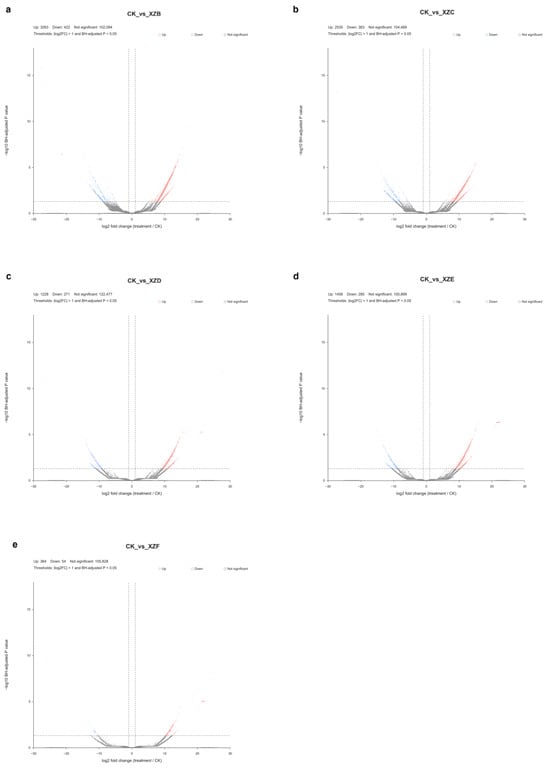
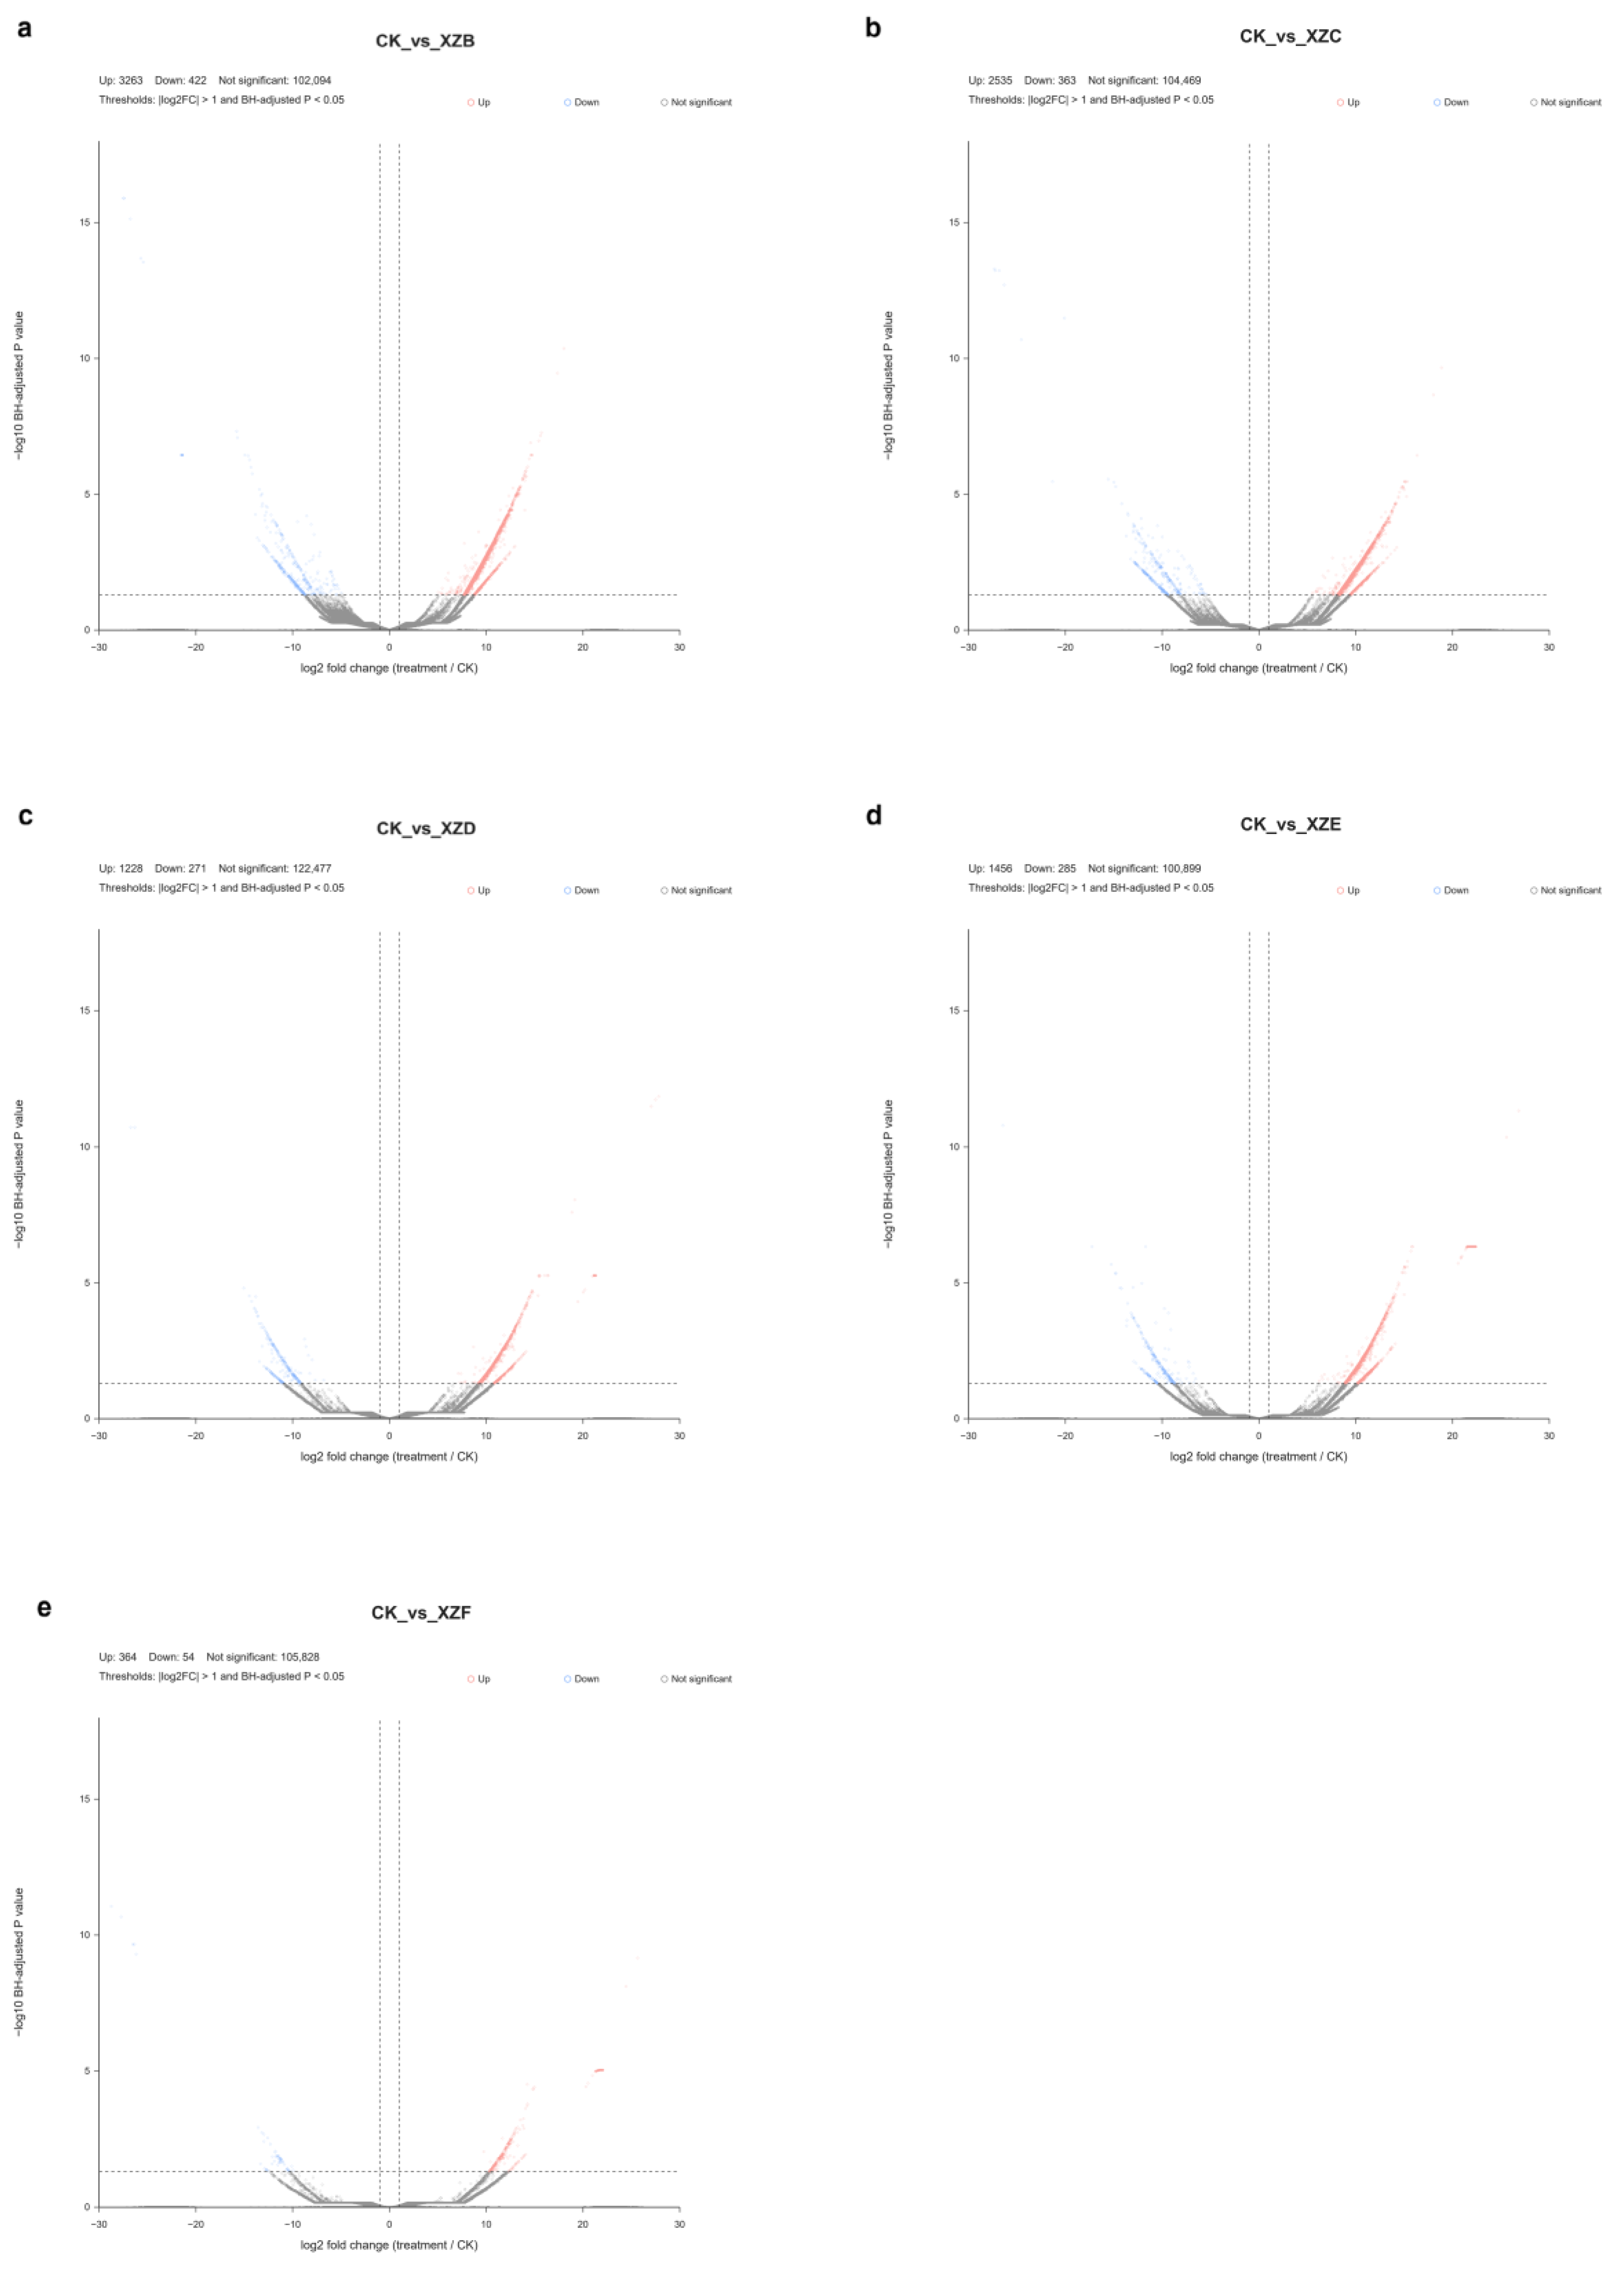
With |log2FoldChange| > 1 and padj < 0.05 as the criteria, 3685 (CK vs. XZB), 2898 (CK vs. XZC), 1499 (CK vs. XZD), 1741 (CK vs. XZE), and 418 (CK vs. XZF) DEGs were identified (Table 5, Figure 5). The number of DEGs decreased with increasing selenium concentration, with a slight recovery at 400 mg/kg; the low-selenium comparison (CK vs. XZB) showed the strongest transcriptional response and the high-selenium comparison (CK vs. XZF) the weakest. Among the 1762 highly expressed genes (mean FPKM ≥ 10 in every group), the median CV was lower at 100 and 200 mg/kg (10.4% and 16.8%) than at 300, 400, and 500 mg/kg (21.4%, 38.9%, and 34.6%; control 21.4%), indicating greater variability among replicates at high selenium and the possible loss of some DEGs. The smaller number of DEGs therefore reflects both a smaller transcriptional amplitude and greater among-replicate variation.
Table 5.
Statistics of differentially expressed genes under different sodium selenite concentrations.
Figure 5.
Volcano plots of differentially expressed genes in the five comparisons: (a) CK vs. XZB, (b) CK vs. XZC, (c) CK vs. XZD, (d) CK vs. XZE and (e) CK vs. XZF. The horizontal axis gives the log2 fold change (treatment/CK) and the vertical axis gives −log10 of the BH-adjusted p value. Dashed lines mark the thresholds |log2FC| = 1 and BH-adjusted p = 0.05. Red points indicate significantly upregulated genes, blue points significantly downregulated genes and grey points genes that met neither threshold; the numbers above each panel give the counts of upregulated, downregulated and non-significant genes.
3.7. GO Enrichment Analysis of DEGs
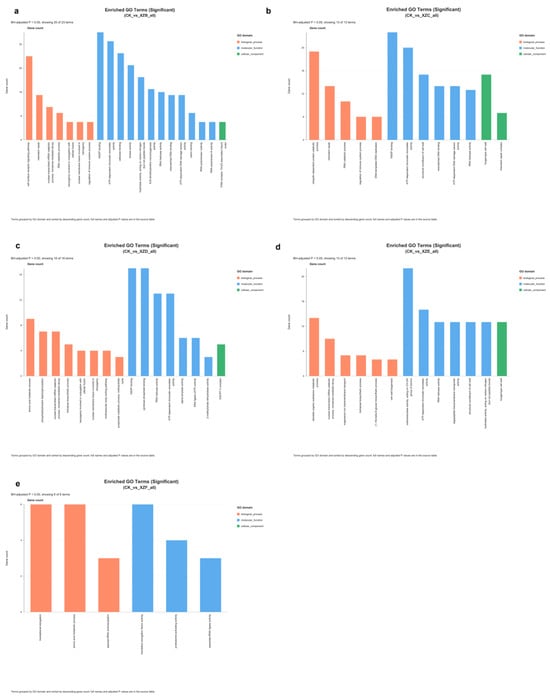
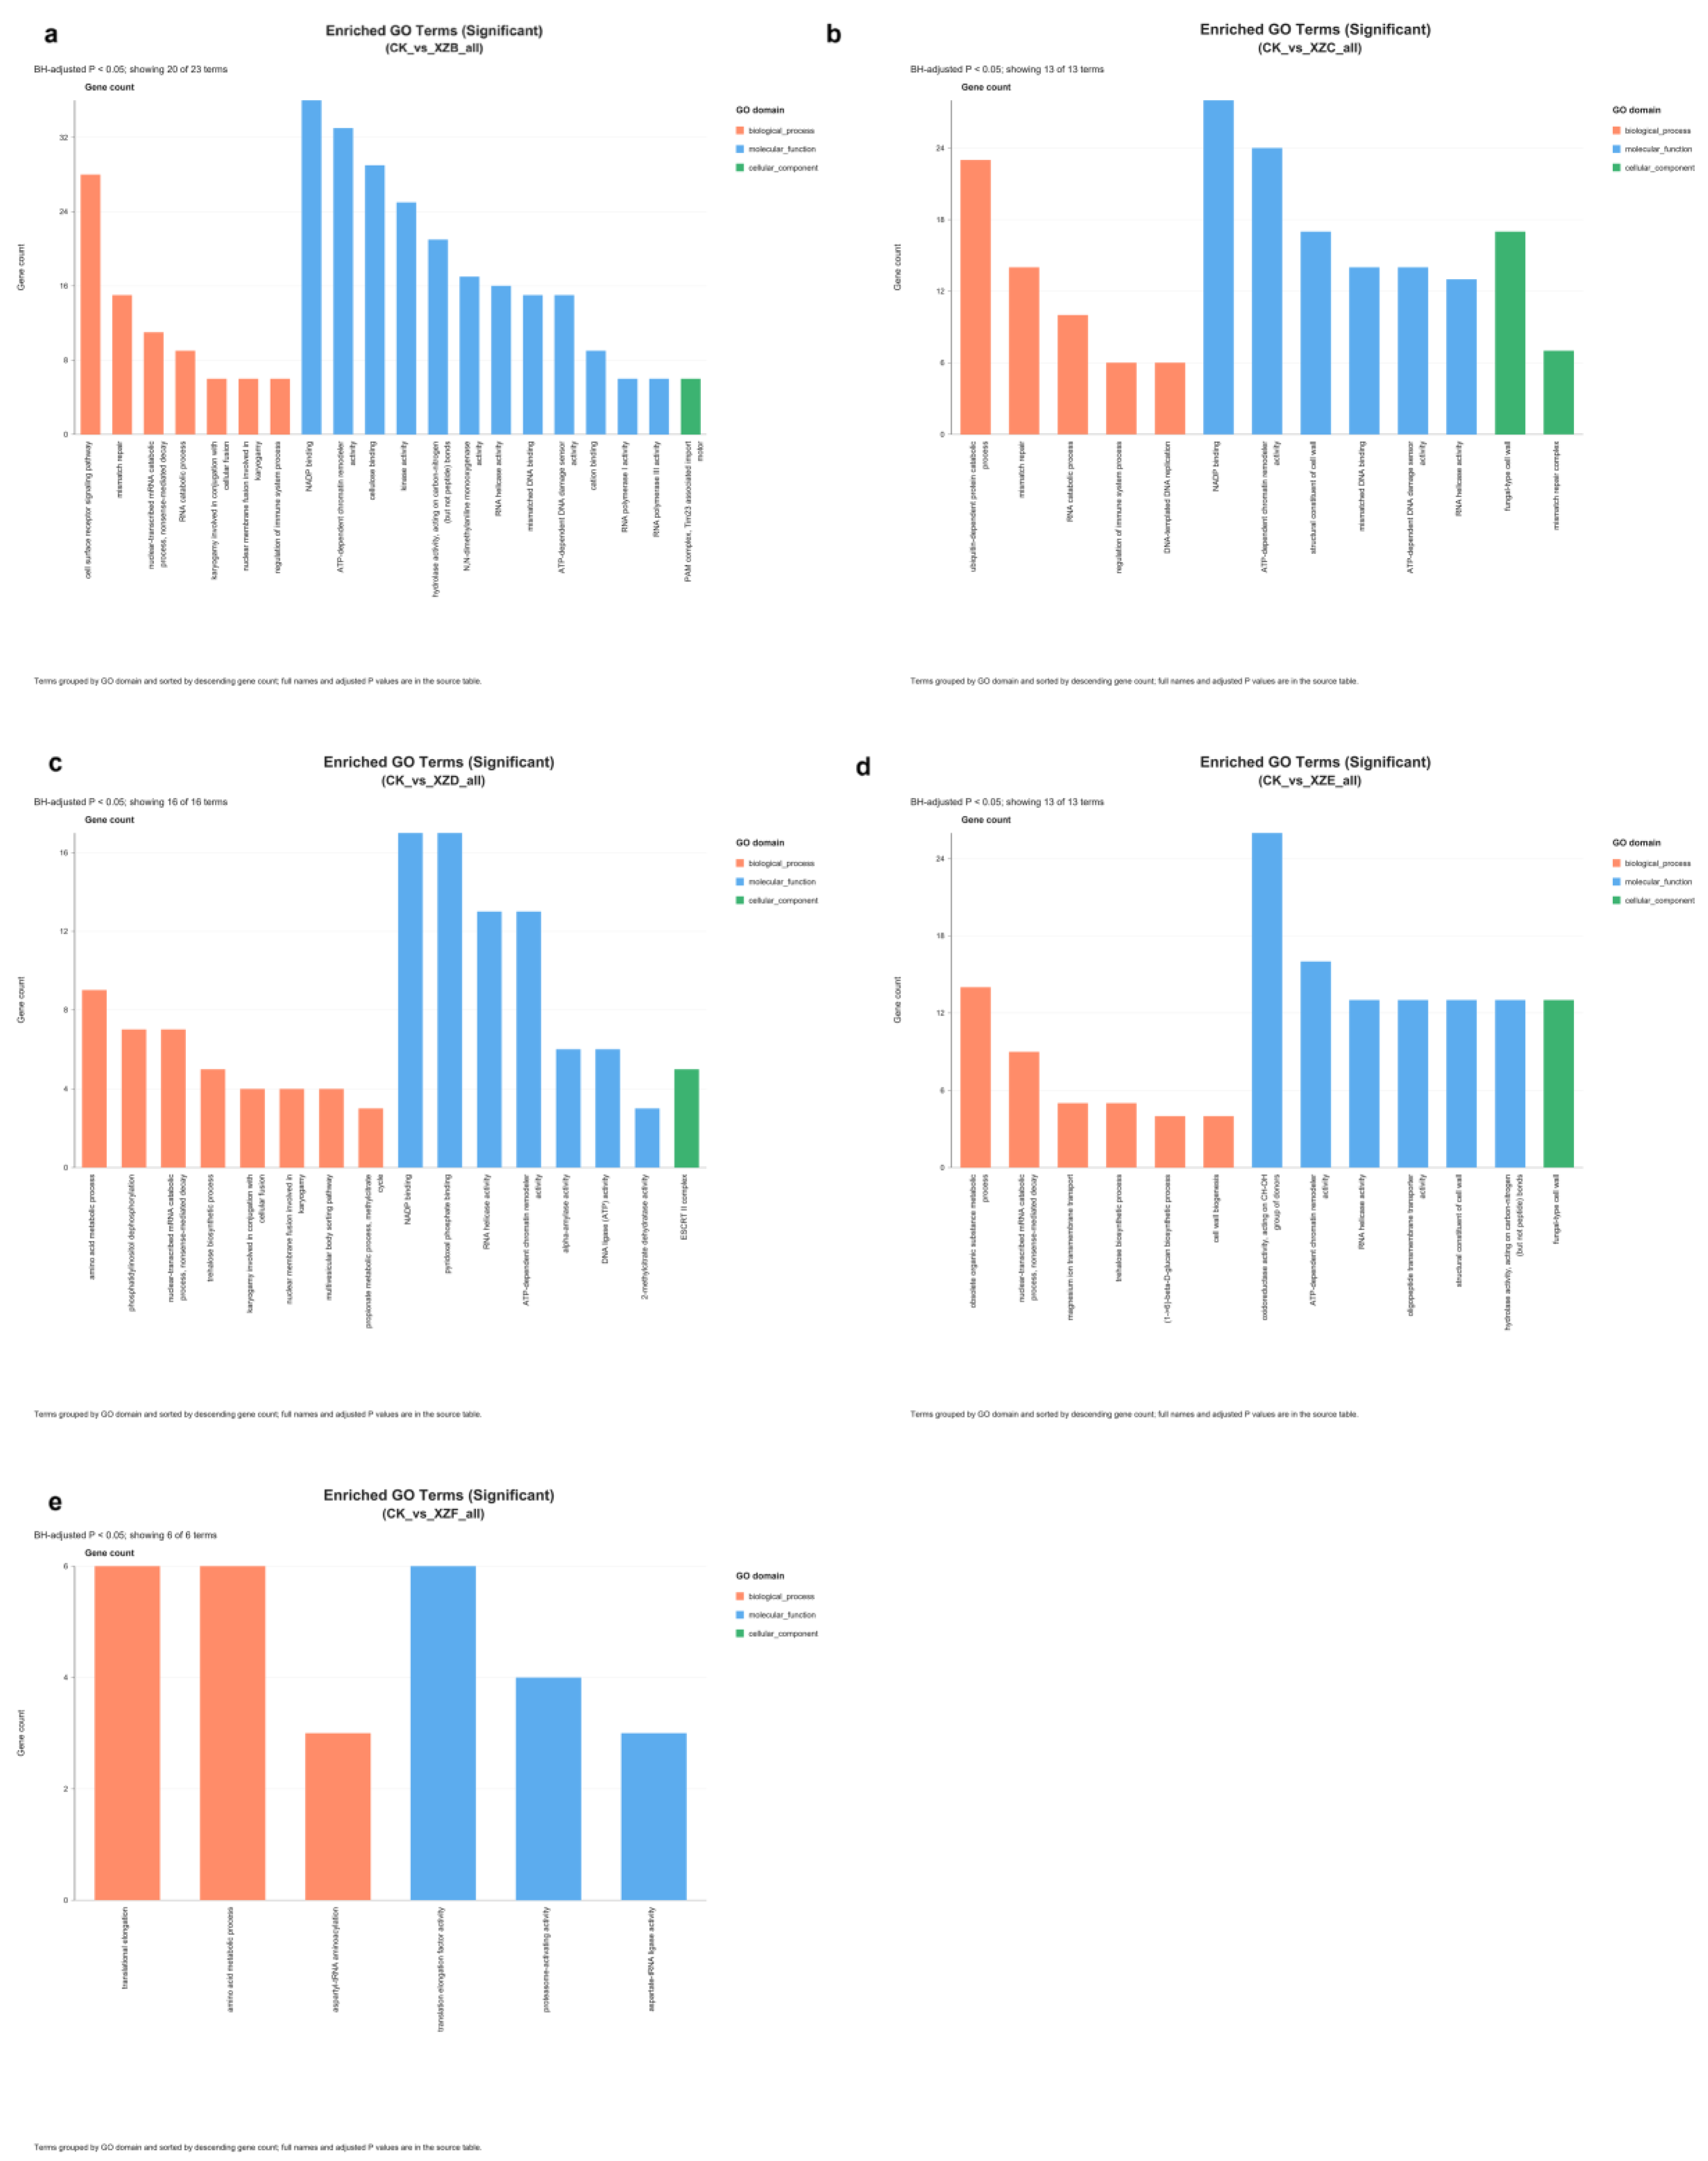
GO functional enrichment analysis of the DEGs identified 23, 13, 16, 13, and 6 significantly enriched terms in the CK vs. XZB to CK vs. XZF comparisons, respectively (Figure 6). ATP-dependent chromatin remodeler activity (fold enrichment, FE = 2.91–3.16) and RNA helicase activity (FE = 3.57–6.89) were the two terms shared by the CK vs. XZB to CK vs. XZE comparisons, indicating that transcriptional regulation centered on chromatin remodeling and RNA metabolism operated between 100 and 400 mg/kg. The functional profile then diverged among treatments. CK vs. XZB was enriched in mismatch repair (FE = 2.97), cell surface receptor signaling pathway (FE = 2.26), and the PAM complex (CC, FE = 7.35), consistent with stress perception and damage repair. CK vs. XZC was enriched in regulation of immune system process (FE = 7.84), mismatch repair complex (FE = 5.27), ubiquitin-dependent protein catabolic process (FE = 2.24), and fungal-type cell wall (FE = 2.61). CK vs. XZD was enriched in the trehalose biosynthetic process (FE = 8.04) and the multivesicular body sorting pathway (FE = 11.65). CK vs. XZE was enriched in (1→6)-β-D-glucan biosynthetic process (FE = 14.24), cell wall biogenesis (FE = 9.21), trehalose biosynthetic process (FE = 6.75), magnesium ion transmembrane transport (FE = 8.90), and oligopeptide transmembrane transport (FE = 4.39), indicating osmotic adjustment and cell wall reinforcement. CK vs. XZF had no significant CC term and retained only translational elongation (FE = 11.26), aspartyl-tRNA aminoacylation (FE = 29.64), and proteasome-activating activity (FE = 14.46), processes related to protein synthesis and turnover. The GO profile therefore shifted from stress perception and damage repair, through metabolic reprogramming and structural reinforcement, to protein synthesis and turnover as selenium concentration increased. Because GO terms rest on homology to public databases, categories such as regulation of immune system process must be read together with their gene composition: the six genes of this term in CK vs. XZB and CK vs. XZC were annotated as PAG1 (cell morphogenesis protein, four genes) and hypothetical proteins (two genes), and the term most likely reflects conserved domain homology rather than an immune function.
Figure 6.
GO enrichment analysis of DEGs in the five comparisons: (a) CK vs. XZB, (b) CK vs. XZC, (c) CK vs. XZD, (d) CK vs. XZE and (e) CK vs. XZF. Terms with BH-adjusted p < 0.05 are shown (up to 20 per comparison, and all significant terms when fewer than 20), and the bar height gives the number of DEGs annotated to that term. Bars are coloured by GO domain: biological process (orange), molecular function (blue) and cellular component (green). Term names are given in full; term identifiers, gene counts and adjusted P values are provided in the source data table.
3.8. KEGG Enrichment Analysis of DEGs
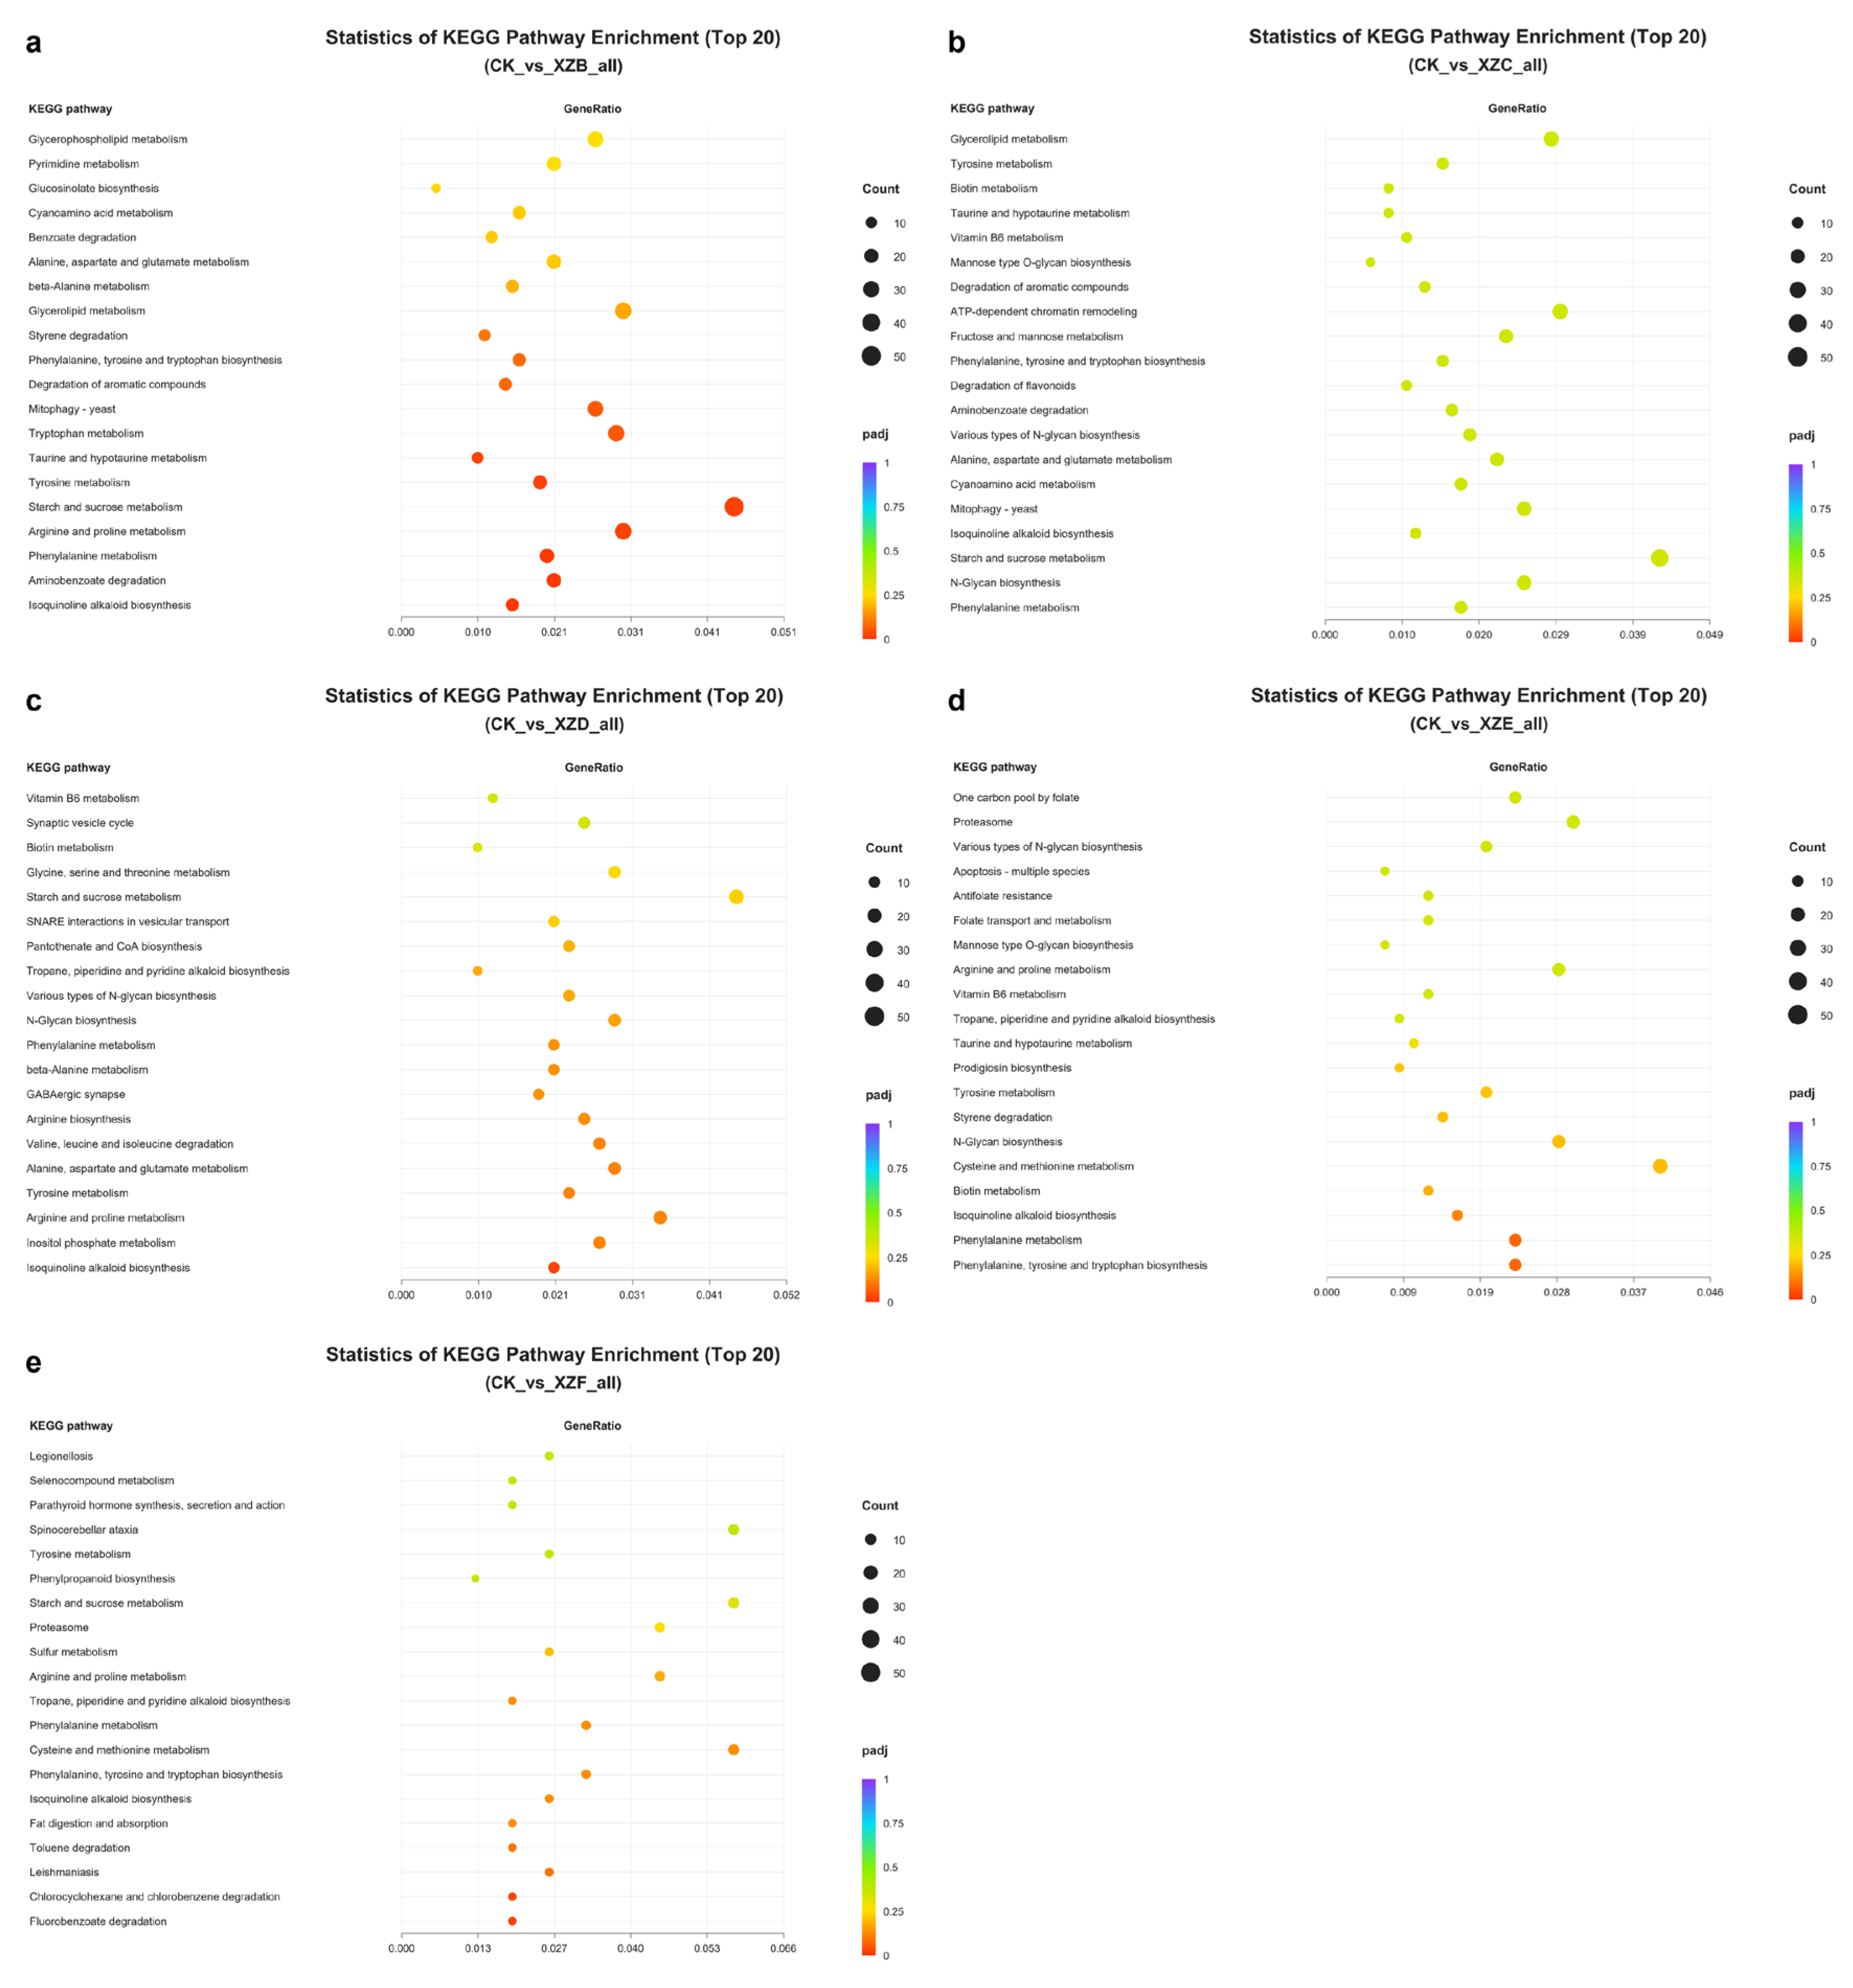
The DEGs of the five comparisons were mapped to KEGG, and the top 20 pathways ranked by p value are shown in Figure 7. After Benjamini–Hochberg correction, 7, 0, 1, 0, and 2 pathways had padj < 0.05 in CK vs. XZB, CK vs. XZC, CK vs. XZD, CK vs. XZE, and CK vs. XZF, respectively. CK vs. XZB was significantly enriched in starch and sucrose metabolism (48 genes, padj = 0.019), arginine and proline metabolism (32 genes, padj = 0.019), taurine and hypotaurine metabolism (11 genes, padj = 0.023), tyrosine metabolism (20 genes, padj = 0.019), phenylalanine metabolism (21 genes, padj = 0.0087), aminobenzoate degradation (22 genes, padj = 0.0069), and isoquinoline alkaloid biosynthesis (16 genes, padj = 0.0069). CK vs. XZD was enriched only in isoquinoline alkaloid biosynthesis (10 genes, padj = 0.021). The two significant pathways of CK vs. XZF were fluorobenzoate degradation and chlorocyclohexane and chlorobenzene degradation (three genes each, padj = 0.017 and 0.025), both of which are bacterial degradation pathways and should not be interpreted functionally in a fungus. No pathway passed BH correction in CK vs. XZC or CK vs. XZE, and the pathways in Figure 7 are ranked by p value.
Figure 7.
KEGG pathway enrichment bubble plots of DEGs in the five comparisons: (a) CK vs. XZB, (b) CK vs. XZC, (c) CK vs. XZD, (d) CK vs. XZE and (e) CK vs. XZF. The 20 pathways with the smallest p values are shown for each comparison. The horizontal axis gives the gene ratio, bubble size represents the number of DEGs annotated to the pathway, and bubble colour represents the BH-adjusted p value (padj) from 0 (red) to 1 (purple).
3.9. Selenium-Related Metabolic Pathways and Key Candidate Genes
Comparison of the enriched pathways across treatments showed that taurine and hypotaurine metabolism, tyrosine metabolism, starch and sucrose metabolism, arginine and proline metabolism, and phenylalanine metabolism ranked near the top of the KEGG lists in several comparisons; starch and sucrose metabolism was significantly enriched in CK vs. XZB (48 genes, padj = 0.019) and did not pass correction in the other comparisons. Taking the selenium-responsive genes identified in Lentinula edodes [11] as a reference and using the KEGG annotation of this study, eight candidate genes were selected from starch and sucrose metabolism and adjacent steps (Table 1 and Table S3): β-glucosidase (Cluster-81238.7249), α-amylase (Cluster-81238.33198), glucoamylase (Cluster-81238.49762), UDP-glucose pyrophosphorylase (Cluster-81238.25636), exo-1,3-β-glucanase (Cluster-81238.42428), and trehalose-6-phosphate phosphatase (Cluster-81238.22626), together with two unigenes not assigned to starch and sucrose metabolism (Cluster-81238.15715 and Cluster-81238.22223).
3.10. RT-qPCR Validation of Candidate Genes
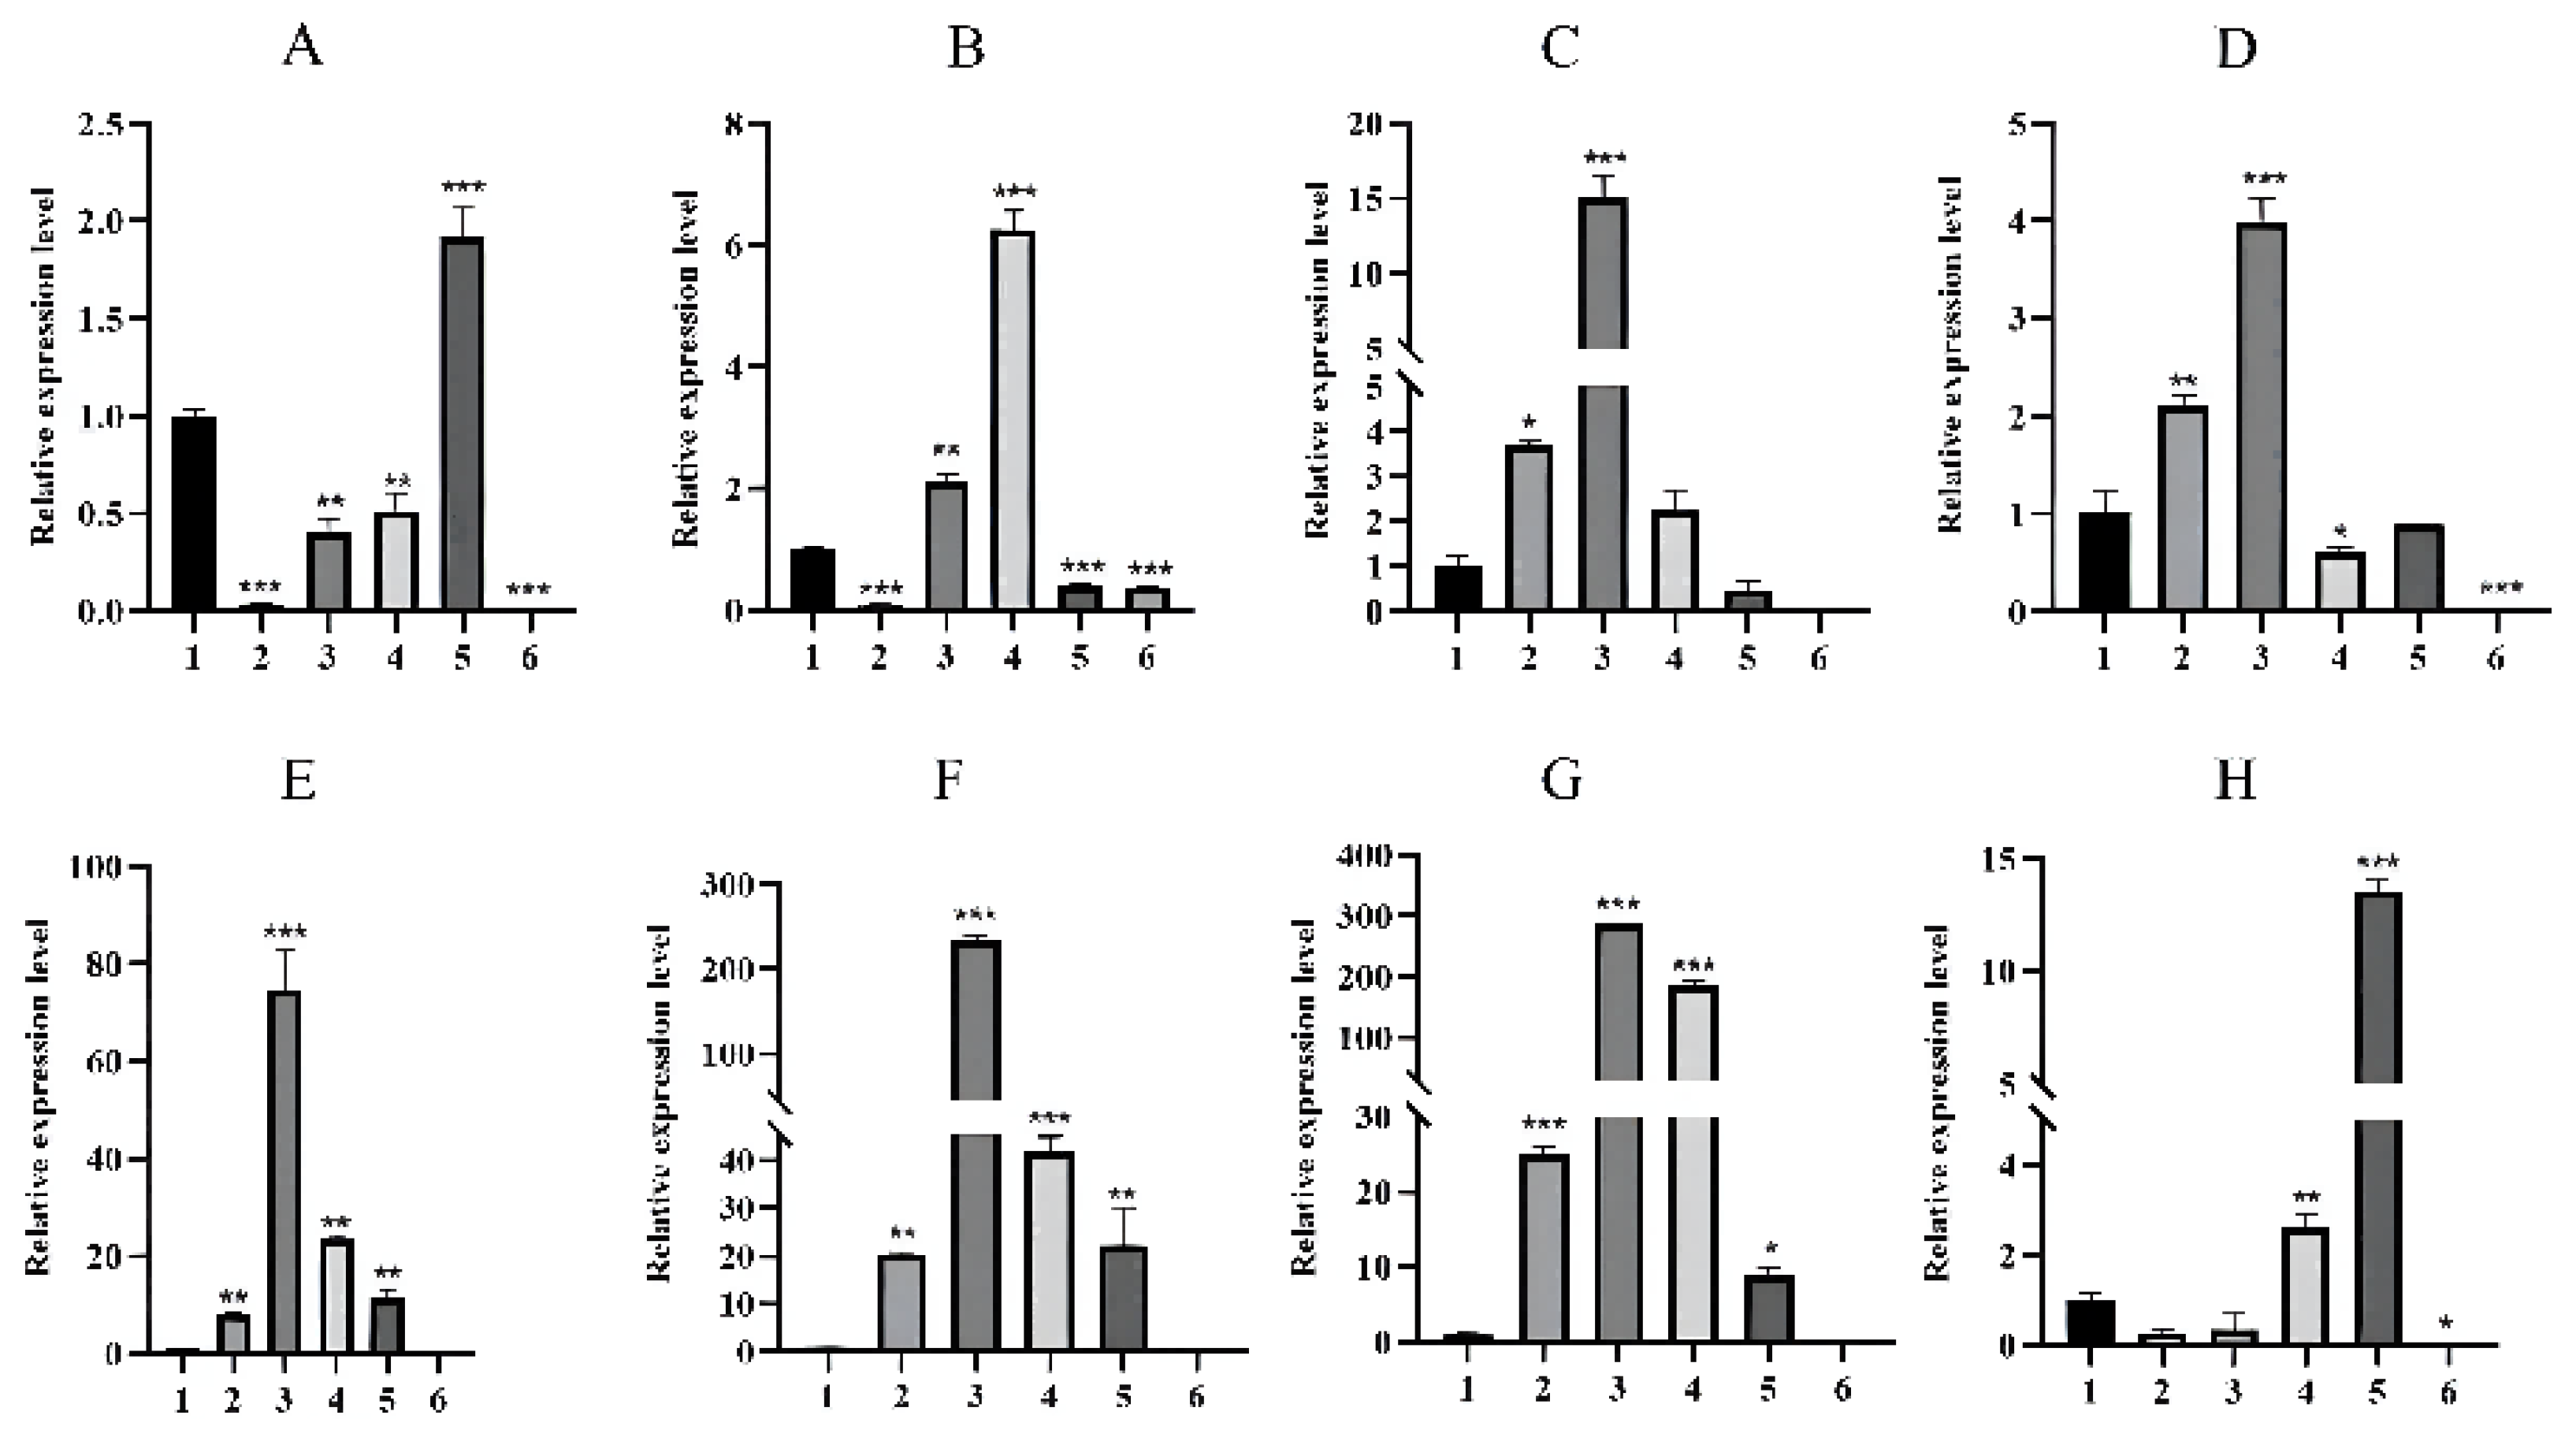
RT-qPCR was used to measure the relative expression of the eight candidate genes under the different selenium concentrations (Figure 8; A–H correspond to rows 1–8 of Table 1). The expression trends of all eight genes agreed with the transcriptome data. β-Glucosidase (Cluster-81238.7249), α-amylase (Cluster-81238.33198), and glucoamylase (Cluster-81238.49762) hydrolyze starch and cellobiose to release glucose; UDP-glucose pyrophosphorylase (Cluster-81238.25636) converts glucose-1-phosphate and UTP to UDP-glucose and pyrophosphate; and exo-1,3-β-glucanase (Cluster-81238.42428) hydrolyzes and remodels β-1,3-glucan. The upregulation of these genes suggests enhanced synthesis and turnover of soluble sugars, supplying energy and carbon skeletons for growth. The two remaining unigenes (Cluster-81238.15715 and Cluster-81238.22223) were annotated as methionyl-tRNA synthetase and an MRE11 homolog, respectively, which are not directly related to starch and sucrose metabolism, and their functional assignment requires verification. Differences in fold change between the two methods are common in comparisons of RNA-seq and qPCR data, but the direction of change was consistent, supporting a role of starch and sucrose metabolism genes in the selenium response of this strain.
Figure 8.
RT-qPCR validation of the eight candidate genes; (A–H) correspond to rows 1–8 of Table 1. Bars show the relative expression level (2−ΔΔCt, normalized to 18S rRNA and calibrated to the control) for the six treatments (1, CK; 2–6, 100, 200, 300, 400 and 500 mg/kg sodium selenite); error bars indicate the standard deviation of three biological replicates. Asterisks indicate significant differences from the control: * p < 0.05, ** p < 0.01, *** p < 0.001 (Student’s t-test).
3.11. Integration of the Transcriptome and Metabolome
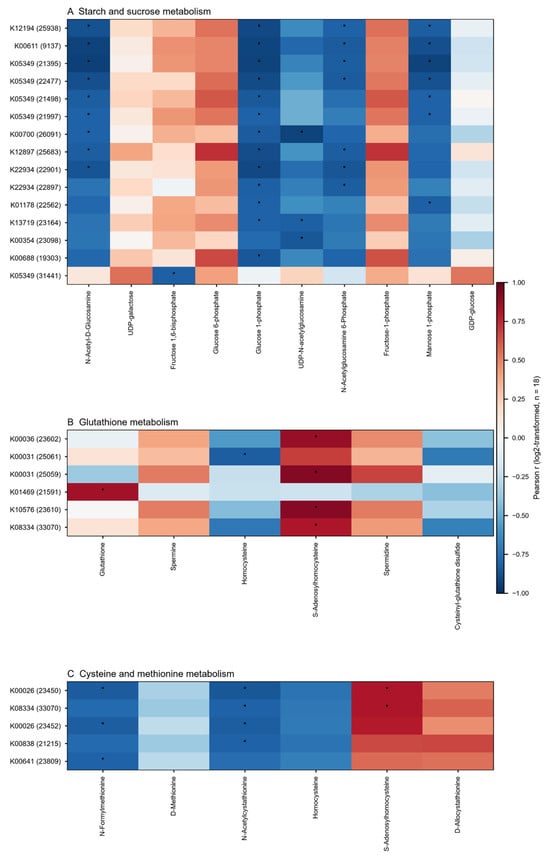
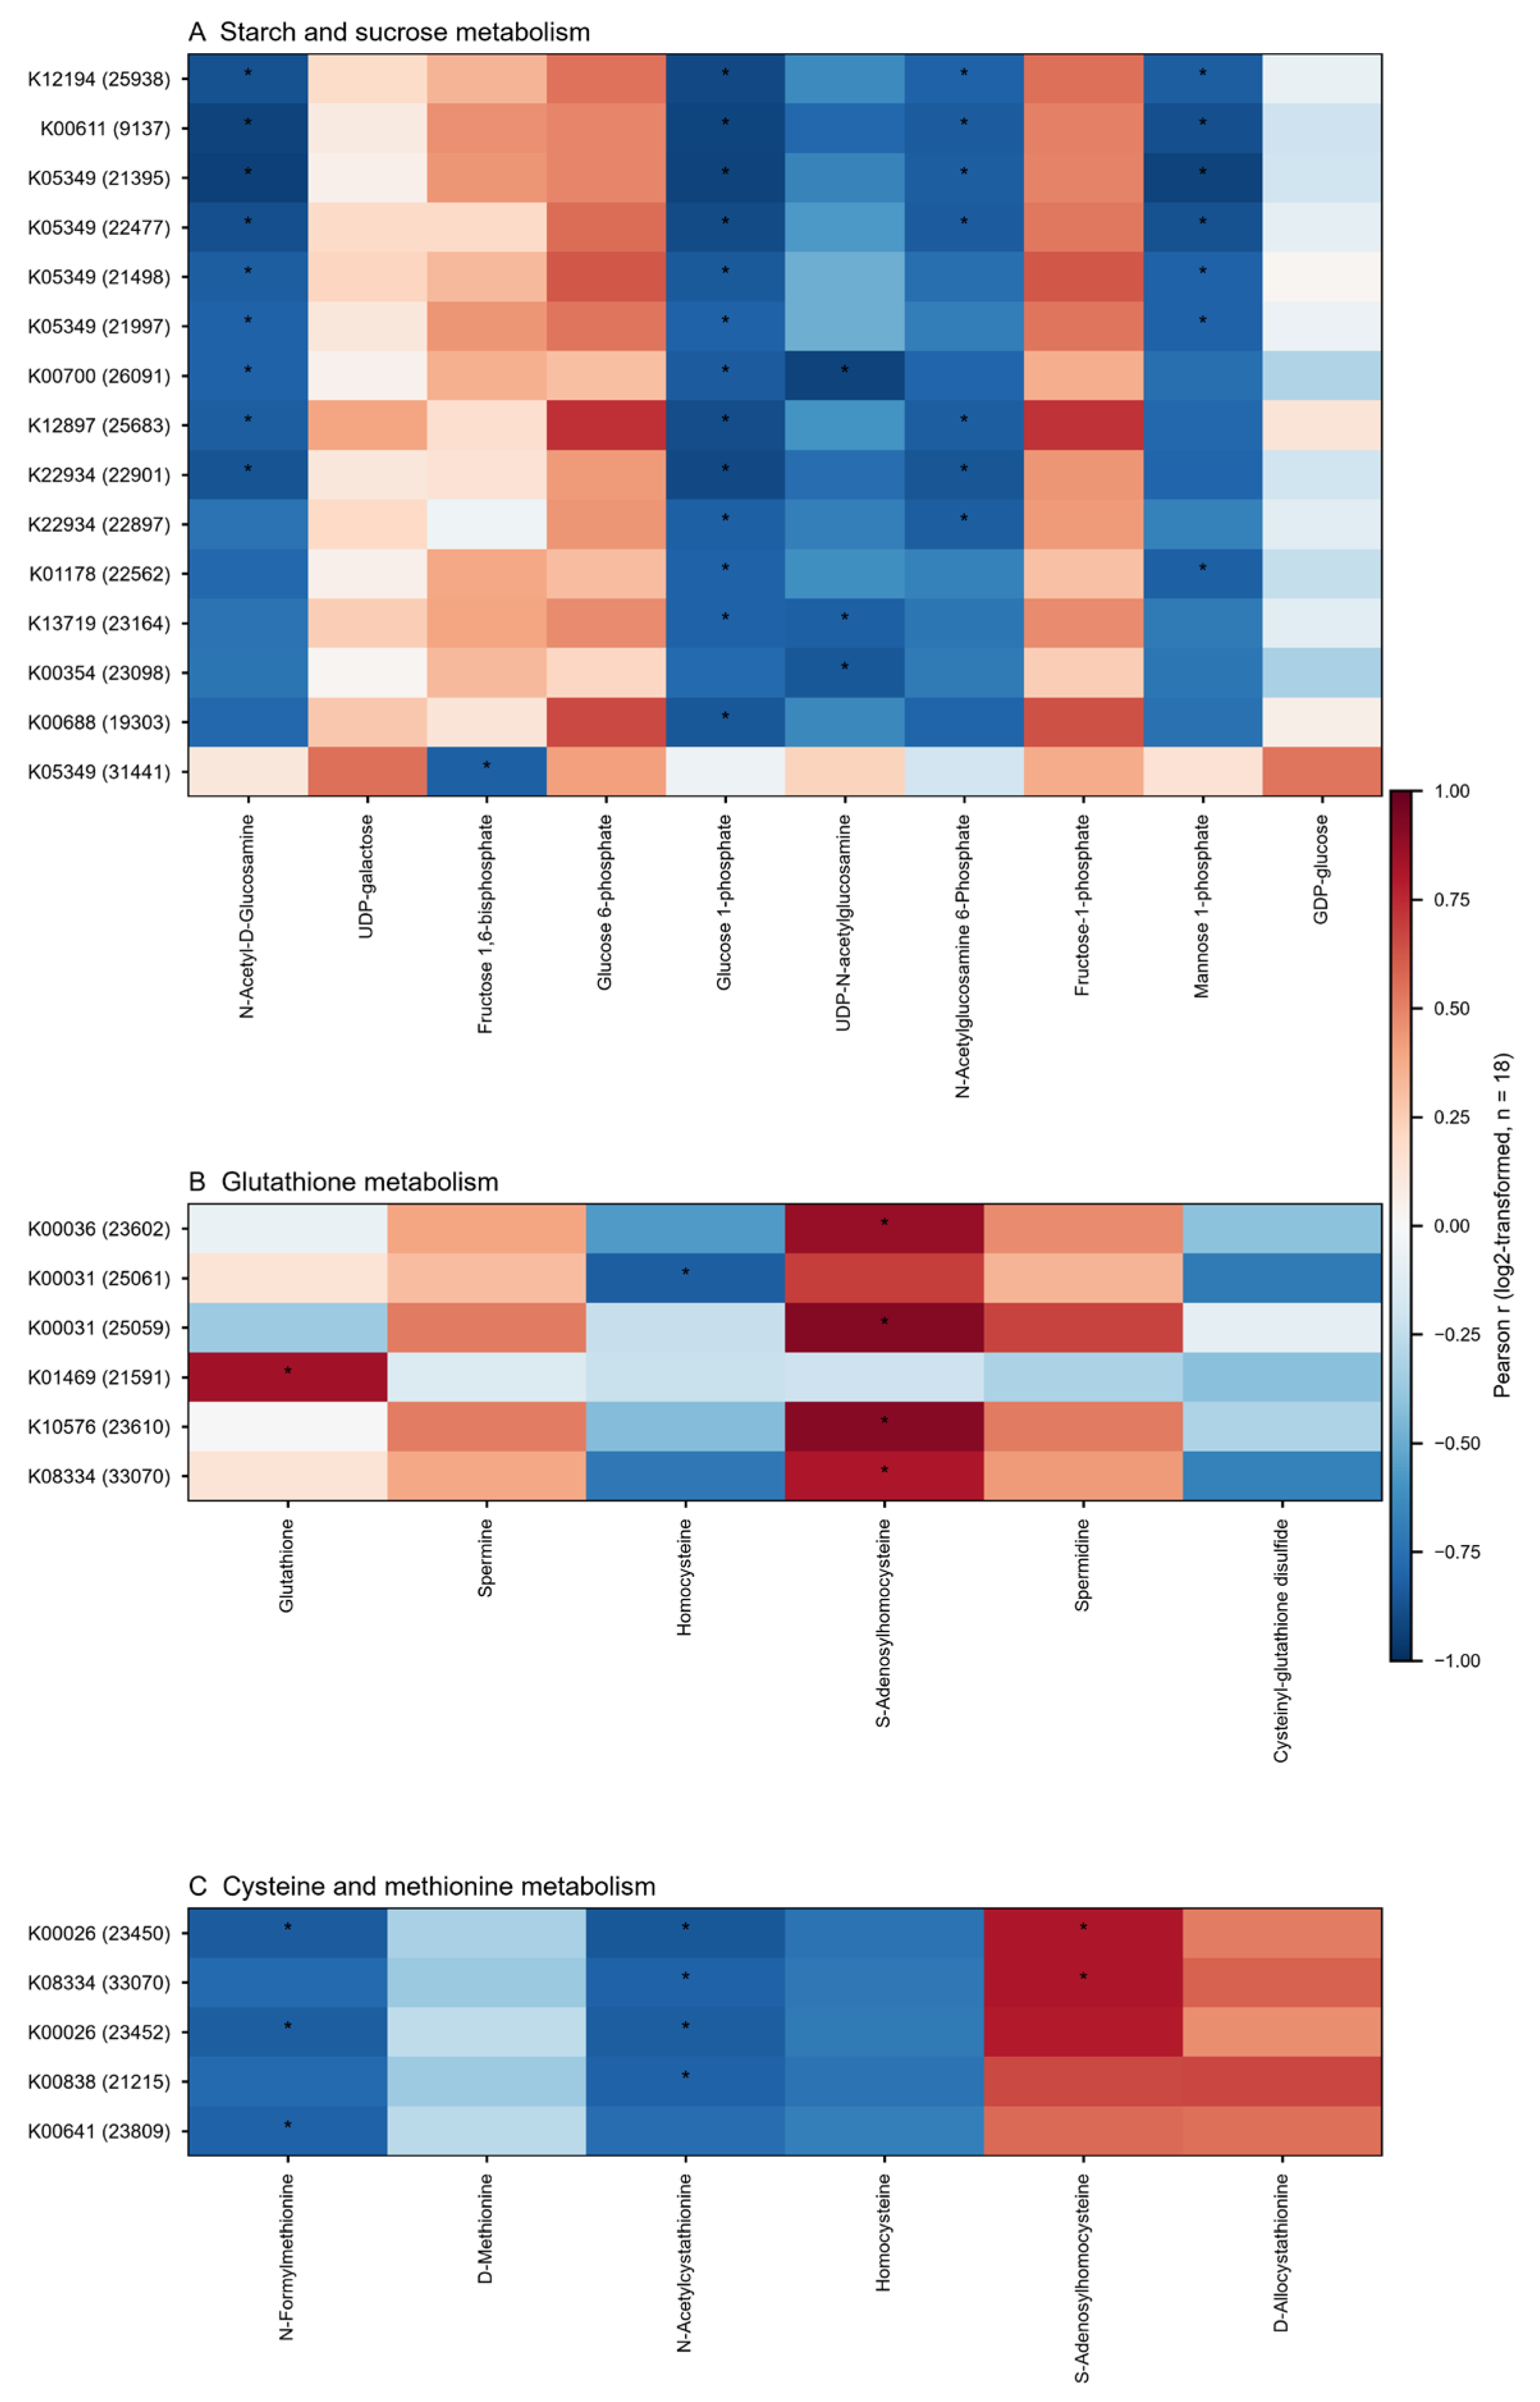
To examine the coordination between the transcriptome and metabolome, FPKM values of genes and abundances of metabolites within three pathways were correlated by Pearson’s method across the 18 samples (Figure 9, Table S4). In starch and sucrose metabolism, 188 expressed genes and 10 sugar phosphate and nucleotide sugar metabolites yielded 43 significant pairs (|r| ≥ 0.8, BH-adjusted q < 0.05): α-amylase (Cluster-81238.33198, K01176) was strongly positively correlated with fructose 1,6-bisphosphate (r = 0.951), β-glucosidase (Cluster-81238.21395, K05349) was strongly negatively correlated with N-acetyl-D-glucosamine and mannose-1-phosphate (r = −0.931 and −0.929), and 1,4-α-glucan branching enzyme (Cluster-81238.26091, K00700) was negatively correlated with UDP-N-acetylglucosamine (r = −0.923). Six pairs were significant in glutathione metabolism (97 genes, 6 metabolites) and nine in cysteine and methionine metabolism (134 genes, 6 metabolites) (Table S4). Gene expression and metabolite abundance within a pathway therefore varied together along the selenium gradient, with the direction of correlation differing among genes and metabolites.
Figure 9.
Correlation between gene expression and metabolite abundance in three metabolic pathways ((A): starch and sucrose metabolism; (B): glutathione metabolism; (C): cysteine and methionine metabolism; * BH-adjusted q < 0.05).
4. Discussion
This study combined widely targeted metabolomics and transcriptomics with measurements of growth, single-fruit-body weight, and selenium content to characterize the response of P. geesteranus ‘Xiuzhen 909’ to a sodium selenite gradient. Selenium content in fruiting bodies rose from 0.052 to 0.277 mg/kg, whereas days to full colonization were shortest at 200 mg/kg (28.6 d) and longest at 500 mg/kg (34.6 d), and single-fruit-body weight was highest at 200 mg/kg and lowest at 500 mg/kg (17.7% lower). Selenium accumulation and growth performance therefore did not peak at the same concentration: at 200 mg/kg colonization was fastest and selenium reached 0.134 mg/kg, 2.6 times the control, whereas at 500 mg/kg selenium reached 0.277 mg/kg, 5.3 times the control, at the cost of 5.0 d longer colonization. Comparable concentration-dependent growth effects have been reported in other edible fungi [2,11]: in Lentinula edodes, selenium occurred mainly as SeMet at ≤300 mg/kg and shifted to Se-methylselenocysteine at ≥400 mg/kg, while fruiting body biomass decreased [11]. For production, 200 mg/kg was the better choice in this strain and substrate when growth and selenium content are weighed together, whereas 500 mg/kg maximizes selenium content at the cost of a longer colonization period. The 53.0% increase in selenium content between 400 and 500 mg/kg, accompanied by the decline in growth traits, marks the transition between selenium gain and growth cost.
A total of 7729 metabolites were detected, covering flavonoids, terpenoids, carboxylic acid derivatives, steroids, amino acids and peptides, carbohydrates, and alkaloids. At 100–200 mg/kg, flavonoids and terpenoids such as luteolin and junipediol A 8-glucoside were significantly upregulated, and phenolic acid derivatives also changed, consistent with reports of antioxidant metabolite accumulation in selenium-enriched edible fungi [4] and with the substrate-driven modulation of the phenolic acid profile of P. pulmonarius fruiting bodies [13]. At 300–400 mg/kg, the changes concentrated on secondary metabolites such as terpenoids, phenolic acid derivatives, and glycosides, and the number of DAMs peaked at 400 mg/kg (3246), indicating the largest adjustment of the metabolic network in this range. At 500 mg/kg, the number of DAMs fell to 2206, and galactose metabolism and glutathione metabolism retained DA scores of 1.00, whereas purine metabolism and glycine, serine and threonine metabolism fell to −1.00 and amino sugar and nucleotide sugar metabolism dropped from 1.00 to 0.33, shifting the response from secondary metabolites to nucleotides, amino acids, and fatty acids. These changes are consistent with antioxidant defense, but reactive oxygen species (ROS), antioxidant enzyme activities, and lipid peroxidation products were not measured; the upregulation of flavonoids and phenolic acids is therefore reported as a metabolic feature associated with antioxidant properties rather than as evidence of increased antioxidant capacity.
The parallel decrease in DAMs and DEGs at 500 mg/kg has been interpreted as the exhaustion of selenium tolerance, but fewer significant changes do not by themselves indicate metabolic inhibition. In this study, the median metabolite CV at 500 mg/kg was 24.1%, similar to the 22.7–25.9% at 100–400 mg/kg, and the control was the most variable group (41.5%), whereas at the gene level variability increased at high selenium. Together with the 5.0 d delay in colonization and the 17.7% reduction in single-fruit-body weight, the growth cost at 500 mg/kg is clear, and the smaller molecular response coexists with greater variability. In Argania spinosa under salinity, proline and soluble sugar contents and catalase and peroxidase activities increased and then declined sharply beyond a threshold [14], a pattern similar to the strongest response at 400 mg/kg and the weaker response at 500 mg/kg observed here, although the absence of antioxidant enzyme measurements in this study allows only a qualitative comparison. In addition, only one concentration above 400 mg/kg was tested, so the transition can be located only between 400 and 500 mg/kg.
At the transcript level, the number of DEGs fell from 3685 at 100 mg/kg to 418 at 500 mg/kg and the number of enriched GO terms from 23 to 6, with the functional profile shifting along the gradient: mismatch repair, chromatin remodeling, RNA helicase activity, and cell wall components predominated at 100–200 mg/kg, corresponding to stress perception and damage repair; trehalose biosynthesis, multivesicular body sorting, (1→6)-β-D-glucan biosynthesis, and cell wall biogenesis appeared at 300–400 mg/kg, with a fold enrichment of 14.24 for (1→6)-β-D-glucan biosynthesis at 400 mg/kg, suggesting activation of cell wall polysaccharide synthesis; and translational elongation, aspartyl-tRNA aminoacylation, and proteasome-activating activity dominated at 500 mg/kg, where protein synthesis and turnover became the main enriched processes. This sequence agrees with the general pattern of coordinated transcriptional and metabolic remodeling under abiotic stress [5], with the reorganization of glutathione metabolism and arginine and proline metabolism in P. pulmonarius under heat stress [15,16], and with the trend of antioxidant dominance at low selenium and growth inhibition at high selenium in Lentinula edodes [11]. It should be noted that the decrease in DEGs at 500 mg/kg coincided with increased among-replicate variation (median CV of highly expressed genes 34.6%, versus 10.4–16.8% at 100–200 mg/kg), so part of the smaller transcriptional amplitude reflects reduced statistical power, and the data do not support the conclusion that transcription was globally suppressed.
The integrated analysis shows that sugar metabolism is the main link between the transcriptomic and metabolomic responses. DEGs were significantly enriched in starch and sucrose metabolism at 100 mg/kg (48 genes, padj = 0.019), and the DA scores of amino sugar and nucleotide sugar metabolism, galactose metabolism, and starch and sucrose metabolism were 1.00 between 100 and 400 mg/kg; the expression trends of six starch and sucrose metabolism genes agreed with RNA-seq (RT-qPCR), and starch and sucrose metabolism has likewise been identified as a selenium-responsive pathway in Lentinula edodes [11]. Correlation analysis showed strong positive correlation between α-amylase and fructose 1,6-bisphosphate (r = 0.951), strong negative correlations between β-glucosidase and N-acetyl-D-glucosamine and mannose-1-phosphate (r = −0.931 and −0.929), and a negative correlation between 1,4-α-glucan branching enzyme and UDP-N-acetylglucosamine (r = −0.923), indicating that gene expression in this pathway and the sugar phosphate and nucleotide sugar pools vary together along the selenium gradient. Trehalose was not detected in the metabolome, so the relationship between trehalose-6-phosphate phosphatase and osmotic adjustment remains a hypothesis that requires targeted measurement of trehalose, sucrose, and maltose. The DA score of cysteine and methionine metabolism was 0.00–0.50 between 100 and 400 mg/kg and turned to −0.20 at 500 mg/kg; its DEGs ranked high in the KEGG lists but did not pass BH correction, and sulfur metabolism was within the top 20 pathways at 500 mg/kg (padj = 0.204) without passing correction. The direction of change is consistent across these pathways, but transcriptional support remains limited.
Several limitations should be noted. Selenium was measured only as total selenium, without speciation, so the proportion of organic selenium and the synthesis of selenoamino acids cannot be assessed [17]. ROS, antioxidant enzyme activities, and lipid peroxidation products were not measured, so the interpretation of antioxidant responses is limited to metabolic features. The function of the candidate genes was not verified by gene editing or heterologous expression and requires functional experiments. The experiment involved one strain and one substrate, with three biological replicates per treatment and 100 mg/kg intervals between concentrations, which limits the power to detect small effects; the difference in single-fruit-body weight among treatments was not significant. Substrate composition and the microbial community were not monitored, although substrate properties can modulate gene expression and metabolism in edible fungi [18]. The concentration ranges and pathway conclusions are therefore restricted to the conditions of this experiment, and their applicability to other strains, substrates, and cultivation practices requires separate verification; the data nevertheless provide a comparison and reference for choosing selenium concentrations in P. geesteranus cultivation.
5. Conclusions
In summary, the response of P. geesteranus ‘Xiuzhen 909’ to sodium selenite was concentration-dependent. Selenium content in fruiting bodies increased from 0.052 mg/kg in the control to 0.277 mg/kg at 500 mg/kg; days to full colonization were shortest at 200 mg/kg and longest at 500 mg/kg, and single-fruit-body weight was highest at 200 mg/kg and lowest at 500 mg/kg. At 100–200 mg/kg, DAMs involved flavonoids, phenolic acids, and sugars, and DEGs were enriched in mismatch repair and chromatin remodeling; at 300–400 mg/kg, secondary metabolites changed most, DAMs peaked at 400 mg/kg, and terms related to cell wall polysaccharide synthesis were enriched; at 500 mg/kg, the numbers of DAMs and DEGs decreased, amino sugar and nucleotide sugar metabolism fell to 0.33, purine and glycine, serine and threonine metabolism turned negative, colonization was delayed, and single-fruit-body weight decreased. Sugar metabolism pathways remained positively enriched between 100 and 400 mg/kg, starch and sucrose metabolism genes participated in the selenium response of this strain, and eight candidate genes were validated by RT-qPCR. When growth performance and selenium content are weighed together, 200 mg/kg was the more suitable concentration under the conditions of this experiment; when selenium content is the target, the concentration can be raised to 500 mg/kg at the cost of a longer growth period and lower single-fruit-body weight. Selenium speciation analysis, antioxidant measurements, and functional validation of the candidate genes are the next steps.
Supplementary Materials
The following supporting information can be downloaded at: https://www.mdpi.com/article/10.3390/horticulturae12111443/s1, Table S1, parameters of the OPLS-DA models for the five comparisons; Table S2, DAM statistics including VIP, p, BH-adjusted q, and log2FC; Table S3, annotation and primers of the candidate genes; Table S4, significant gene–metabolite pairs; Table S5, DEG lists; Table S6, metabolite quantification matrix. Plotting data and code for Figure 3, Figure 4, Figure 5, Figure 6 and Figure 7 are provided in the Supplementary Files (python_figures/).
Author Contributions
Conceptualization, L.O.; methodology, W.X., P.X., and L.L.; formal analysis, W.X., P.X., L.L., L.O., T.Y., J.T., and B.J.; investigation, W.X. and P.X.; data curation, W.X. and P.X.; writing—original draft preparation, P.X.; writing—review and editing, W.X., L.L., and L.O.; supervision, L.L. and L.O.; funding acquisition, L.L. and L.O. All authors have read and agreed to the published version of the manuscript.
Funding
This research was funded by the Guangdong Science and Technology Program (2022DZXHT072 and 2023S018087).
Institutional Review Board Statement
Not applicable.
Informed Consent Statement
Not applicable.
Data Availability Statement
The LC-MS metabolomics data have been deposited in MetaboLights under accession MTBLS16415 (https://www.ebi.ac.uk/metabolights/MTBLS16415; accessed on 13 November 2026). The RNA-seq data have been deposited in NCBI BioProject under accession PRJNA1558238. The metabolite quantification tables and all other data supporting the findings of this study are provided as Supplementary Tables S1–S6.
Acknowledgments
The authors would like to thank all colleagues and collaborators who provided technical assistance during this study. During the preparation of this manuscript, the authors used DeepSeek-V3(deepseek-chat, DeepSeek AI, Hangzhou, China) for the purposes of language editing, translation between the Chinese and English drafts, and consistency checking of numerical values and references. The authors have reviewed and edited the output and take full responsibility for the content of this publication.
Conflicts of Interest
The authors declare no conflicts of interest.
Abbreviations
The following abbreviations are used in this manuscript:
| BP | biological process |
| CC | cellular component |
| DA | differential abundance |
| DAMs | differentially accumulated metabolites |
| DEGs | differentially expressed genes |
| FE | fold enrichment |
| GO | Gene Ontology |
| HCA | hierarchical clustering analysis |
| KEGG | Kyoto Encyclopedia of Genes and Genomes |
| LC-MS | liquid chromatography–mass spectrometry |
| MF | molecular function |
| Na2SeO3 | sodium selenite |
| OPLS-DA | orthogonal partial least squares discriminant analysis |
| PCA | principal component analysis |
| RT-qPCR | reverse transcription quantitative PCR |
| Se | selenium |
| VIP | variable importance in projection |
References
- Xin, T.-Z.; Fu, Y.; Wang, X.-S.; Jiang, N.; Zhai, D.-D.; Shang, X.-D.; Dong, H.-R.; Luan, T.-Y.; Tang, G.-R.; Yu, H.-L. Research Progress of Selenium-Enriched Edible Fungi. Horticulturae 2025, 11, 531. [Google Scholar] [CrossRef] [Scilit]
- de Souza, D.F.; da Silva, M.C.S.; de Souza, T.C.; Rocha, G.C.; Kasuya, M.C.M.; Eller, M.R. Effect of Selenium-Enriched Substrate on the Chemical Composition, Mineral Bioavailability, and Yield of Edible Mushrooms. Biol. Trace Elem. Res. 2023, 201, 3077–3087. [Google Scholar] [CrossRef] [Scilit]
- Yao, L.; Tian, H.; Bao, Z.; Xie, S.; Feng, T.; Sun, M.; Ma, H.; Yao, L.; Lang, Q. Biofortification of Pleurotus geesteranus via Exogenous Selenium Species: Selenium Distribution, Speciation and Its Effect on Mineral Elements Accumulation. LWT 2025, 230, 118240. [Google Scholar] [CrossRef] [Scilit]
- Yao, L.; Bao, Z.; Tian, H.; Feng, T.; Sun, M.; Liang, Y.; Yao, L.; Ma, H. Influence of Different Selenium Biofortification Methods on Structural Features and Antioxidant Bioactivities of Pleurotus geesteranus Polysaccharides. Foods 2026, 15, 1660. [Google Scholar] [CrossRef] [Scilit]
- Yu, T.; Ma, X.; Zhang, J.; Cao, S.; Li, W.; Yang, G.; He, C. Progress in Transcriptomics and Metabolomics in Plant Responses to Abiotic Stresses. Curr. Issues Mol. Biol. 2025, 47, 421. [Google Scholar] [CrossRef] [Scilit]
- Lu, N.; Chen, G.; Wei, H.; Lin, J.; Wang, W. Integrated Transcriptomic and Metabolomic Analysis Reveals the Regulatory Networks in Response to Heat Stress in Pleurotus pulmonarius. Int. Microbiol. 2026, 29, 1345–1356. [Google Scholar] [CrossRef] [Scilit]
- Gomes, T.G.; de Assis Fonseca, F.C.; Alves, G.S.C.; de Siqueira, F.G.; Miller, R.N.G. Development of Reference Genes for RT-qPCR Analysis of Gene Expression in Pleurotus pulmonarius for Biotechnological Applications. Sci. Rep. 2023, 13, 12296. [Google Scholar] [CrossRef] [Scilit]
- Liu, Y.Y.; Jia, Z.Y.; Jiang, T.; Zhang, N.; Song, L.X.; Zhang, J.; Wan, X.L.; Wang, H.Q.; Du, C.; Shen, D.Y.; et al. Integrated Multi-Omics Reveals the Developmental Programs and Metabolic Regulation of the Rare Edible Fungus Buchwaldoboletus xylophilus. Biology 2026, 15, 1343. [Google Scholar] [CrossRef] [Scilit]
- Huang, Q.; Cheng, X.H.; Chen, X.H.; Huang, X.H.; Gong, W.B.; Xia, Z.L.; Xie, L. Dynamic Changes in Umami and Aroma Compounds and Transcriptome Analysis of Pleurotus pulmonarius at Different Growth Stages. Food Chem. 2026, 506, 148047. [Google Scholar] [CrossRef] [Scilit]
- Wang, C.X.; Ge, Z.P.; Li, W.C.; Li, C.; Wang, L.D.; Chen, M.F.; Li, Y.N.; Zheng, S.Y. Characterization of PpZCP11 as a Key Regulator of Primordium Formation in Pleurotus pulmonarius. Agriculture 2026, 16, 211. [Google Scholar] [CrossRef] [Scilit]
- Zhang, Y.Y.; Duan, L.F.; Xu, H.Y.; Li, Q.S.; Li, Y.; Wang, Y.; Ke, F.; Shen, C.; Qin, B.F. Cytology, Transcriptomics, and Proteomics Analyses Revealed Selenium Accumulation Mechanisms and Nutritional Quality Changes at Sodium Selenite in Lentinula edodes. Ind. Crops Prod. 2025, 234, 121638. [Google Scholar] [CrossRef] [Scilit]
- Cao, L.P.; Zhang, Q.; Miao, R.Y.; Lin, J.B.; Feng, R.C.; Ni, Y.Q.; Li, W.S.; Yang, D.L.; Zhao, X. Application of Omics Technology in the Research on Edible Fungi. Curr. Res. Food Sci. 2023, 6, 100430. [Google Scholar] [CrossRef] [Scilit]
- Kalinowska, M.; Smolewska, M.; Gołębiewska, E.; Ignaciuk, A.; Świderski, G.; Zawadzka, M.; Zapora, E.; Saeed, M.; Karar, W.; Sivasamugham, L.A.; et al. Substrate-Driven Modulation of Nutritional Composition and Bioactive Compound Profile in Pleurotus pulmonarius Cultivated on Diversified Agri-Waste. Foods 2026, 15, 2404. [Google Scholar] [CrossRef] [Scilit]
- Ait Hammou, R.; Ben El Caid, M.; Harrouni, C.; Daoud, S. Germination Enhancement, Antioxidant Enzyme Activity, and Metabolite Changes in Late Argania spinosa Kernels under Salinity. J. Arid Environ. 2023, 219, 105095. [Google Scholar] [CrossRef] [Scilit]
- Wang, W.K.; Lu, N.; Lin, J.Y.; Lai, L.Q.; Chen, G.P. Transcriptome Analysis Reveals Key Genes and Pathways Associated with Heat Stress in Pleurotus pulmonarius. Int. Microbiol. 2025, 28, 165–172. [Google Scholar] [CrossRef] [Scilit]
- Lu, Z.H.; Ke, B.R.; Lin, H.Y.; Yuan, B.; Ke, L.N.; Chen, M.Y.; Lu, Y.P. Morphological and Transcriptomic Response Mediated by Heat Stress in Pleurotus pulmonarius. Curr. Microbiol. 2025, 82, 397. [Google Scholar] [CrossRef] [Scilit]
- Bierla, K.; Siwulski, M.; Ouerdane, L.; Lobinski, R.; Mleczek, P.; Mleczek, M. Identification of New Selenium Compounds Produced by Edible Mushrooms. Food Chem. 2025, 496, 146763. [Google Scholar] [CrossRef] [Scilit]
- Ezov, N.; Amiram, A.; Khatib, S.; Danay, O.; Levanon, D.; Pereman, I. Transcriptomic and Metabolomic Profiling of Pleurotus eryngii Cultivated on Olive Mill Solid Waste-Enriched Substrates. Agronomy 2025, 15, 1811. [Google Scholar] [CrossRef] [Scilit]

Disclaimer/Publisher’s Note: The statements, opinions and data contained in all publications are solely those of the individual author(s) and contributor(s) and not of MDPI and/or the editor(s). MDPI and/or the editor(s) disclaim responsibility for any injury to people or property resulting from any ideas, methods, instructions or products referred to in the content. |
© 2026 by the authors. Licensee MDPI, Basel, Switzerland. This article is an open access article distributed under the terms and conditions of the Creative Commons Attribution (CC BY) license.