


Abstract
Heyndrickxia coagulans is widely used for industrial L-lactic acid production, but carbon catabolite repression (CCR) and its link to fermentative metabolism remain poorly understood. A ccpA deletion mutant (ΔccpA) and a complementation strain (C-ccpA) were constructed to investigated the physiological, enzymatic, and transcriptomic consequences of CcpA loss. Deletion of ccpA completely abolished glucose-mediated CCR, enabling simultaneous glucose–xylose co-utilization, and triggered a marked shift from L-lactic to mixed-acid fermentation, with an 82.5% reduction in lactate titer accompanied by 24.1-fold and 51.6-fold increases in acetate and formate, respectively. Enzyme activity assays showed that L-lactate dehydrogenase activity was reduced by half, whereas acetate kinase activity increased nearly six-fold. Transcriptomic analysis revealed downregulation of ldhL and upregulation of pflB and ackA. Scale-up fermentation in a 5 L bioreactor confirmed that the wild type directed 90.2% of carbon flux to lactate (yield, 0.95 g/g glucose), compared with only 24.5% in the mutant. All phenotypes were fully restored upon complementation. These results demonstrate that CcpA is as an indispensable dual regulator of both CCR and L-lactic fermentation, providing a foundation for rational metabolic engineering of H. coagulans.
1. Introduction
L-lactic acid is a versatile platform chemical with extensive applications in the food, pharmaceutical, cosmetic, and chemical industries [1]. In particular, optically pure L-lactic acid is an essential monomer for the synthesis of poly-lactic acid (PLA), a biodegradable and sustainable alternative to petroleum-based plastics that has attracted rapidly growing global demand [2]. Among the various production routes, microbial fermentation of renewable carbohydrates has emerged as the most economically competitive and environmentally favorable approach for large-scale L-lactic acid manufacturing [3]. Within the broad spectrum of lactic acid-producing microorganisms, Heyndrickxia coagulans (formerly Bacillus coagulans) stands out as a particularly promising industrial candidate. This thermotolerant, facultatively anaerobic bacterium can produce optically pure L-lactic acid at elevated temperatures (optimally 50–55 °C), achieving titers exceeding 200 g/L and yields above 0.90 g/g glucose [4,5]. Its inherent thermotolerance, low-pH resistance, and spore-forming ability further enable open (non-sterile) fermentation, substantially reducing operational costs and contamination risks in industrial settings [6].
Despite these advantages, the efficient co-utilization of mixed sugars remains a significant metabolic challenge for H. coagulans. In most Gram-positive bacteria, the presence of a preferred carbon source such as glucose suppresses the expression of genes required for the catabolism of alternative sugars, a regulatory phenomenon known as carbon catabolite repression (CCR) [7,8]. CCR imposes a sequential sugar-consumption pattern, in which alternative carbon sources such as xylose are utilized only after glucose depletion, resulting in diauxic growth, prolonged fermentation time, and reduced overall process efficiency [7,9]. Understanding the molecular basis of CCR and identifying strategies to overcome it are therefore of both fundamental and practical importance for optimizing carbon utilization in H. coagulans.
In low-G+C Gram-positive bacteria, CCR is primarily mediated by catabolite control protein A (CcpA), a pleiotropic transcriptional regulator belonging to the LacI/GalR family [10]. The regulatory mechanism of CcpA has been well elucidated in the model organism Bacillus subtilis: when a preferred carbon source is actively metabolized, elevated intracellular concentrations of fructose-1,6-bisphosphate (FBP) and ATP stimulate the bifunctional HPr kinase/phosphorylase (HprK/P) to phosphorylate the histidine-containing protein HPr at the Ser46 residue. The resulting CcpA-HPr (Ser46-P) complex binds to cis-acting catabolite-responsive elements (cre) in the promoter regions of target genes to either activate or repress transcription, depending on the position of the cre site relative to the promoter [11,12].
Importantly, accumulating evidence from diverse lactic acid bacteria (LAB) indicates that the regulatory scope of CcpA extends beyond canonical CCR, encompassing direct control of central carbon metabolism and fermentative pathway selection. In Lactococcus lactis, CcpA directly activates the las operon encoding phosphofructokinase, pyruvate kinase, and L-lactate dehydrogenase by binding to a cre site in its promoter; disruption of ccpA resulted in a four-fold reduction in las operon transcription and diminished glycolytic flux [13]. In Streptococcus bovis, CcpA reciprocally regulates the transcription of ldh (activation) and pfl (repression), functioning as a metabolic switch that controls carbon-flux between lactate and formate at the pyruvate branch point [14]. In Lactobacillus plantarum, inactivation of ccpA relieved CCR and triggered a metabolic shift from L-lactic toward mixed-acid fermentation, accompanied by significant changes in the activities of glycolytic and fermentative enzymes [15,16,17]. Similar phenotypes have been reported in Lactobacillus delbrueckii subsp. bulgaricus, where CcpA deficiency led to reduced LDH, PFK, and PK activities and decreased lactate production [18]. In Parageobacillus thermoglucosidasius, mutations in PTS components (e.g., PtsI, PtsG) and related regulatory genes were identified through a 2-deoxyglucose (2-DG)-based adaptive evolution strategy and removed CCR, enabling efficient co-utilization of mixed carbon sources such as glucose and xylose [19]. Collectively, these studies establish CcpA as a master regulator that integrates carbon-source sensing with the maintenance of L-lactic fermentation in Gram-positive bacteria.
Despite the well-documented roles of CcpA in these model organisms, its function in H. coagulans has not been systematically investigated. Specifically, it remains unclear (i) whether CcpA mediates CCR and to what extent its deletion affects mixed-sugar co-utilization in this species; (ii) whether, and how strongly, CcpA is required to maintain the L-lactic fermentation phenotype; (iii) what global transcriptional changes accompany CcpA deficiency; and (iv) how ccpA deletion impacts fermentation performance under industrially relevant bioreactor conditions. Addressing these knowledge gaps is essential for both the fundamental understanding of carbon metabolic regulation and the rational metabolic engineering of H. coagulans. In this study, we constructed a ccpA deletion mutant (ΔccpA) and its complementation strain (C-ccpA) in H. coagulans and performed a comprehensive, multi-level characterization encompassing cell growth and carbon-source utilization, metabolite profiling, key enzyme activity measurements, comparative transcriptomic analysis, and scale-up batch fermentation in a 5 L bioreactor. Our findings demonstrate that CcpA is indispensable for both hierarchical sugar utilization and the maintenance of L-lactic fermentation in H. coagulans, providing new mechanistic insights into carbon metabolic regulation in this industrially important species.
2. Materials and Methods
2.1. Bacterial Strains, Plasmids, and Growth Conditions
Heyndrickxia coagulans ATCC 7050 was used as the parental strain throughout this study. Escherichia coli DH5α was employed as the host for all cloning and plasmid propagation procedures. The temperature-sensitive shuttle vector pMAD, which carries a thermosensitive replication origin for Gram-positive bacteria and an erythromycin-resistance cassette (ermC), was used for markerless gene deletion in H. coagulans. The shuttle vector pHY300PLK, carrying a tetracycline-resistance marker, was used to construct the complementation strain.
H. coagulans was routinely cultivated in BC medium (10 g/L yeast extract, 10 g/L peptone, 5 g/L NaCl, 5 g/L beef extract, and 20 g/L glucose; pH 6.0) at 37 °C under aerobic (for propagation) or microaerophilic (for fermentation) conditions unless otherwise specified. E. coli was grown in Luria–Bertani (LB) medium at 37 °C with shaking at 200 rpm. When required, antibiotics were supplemented at the following concentrations: erythromycin at 5 μg/mL for H. coagulans and 150 μg/mL for E. coli; ampicillin at 100 μg/mL for E. coli; and tetracycline at 10 μg/mL for H. coagulans (for complementation). All strains were preserved in 30% (v/v) glycerol at −80 °C.
2.2. Construction of the ΔccpA Mutant and Complementation Strain (C-ccpA)
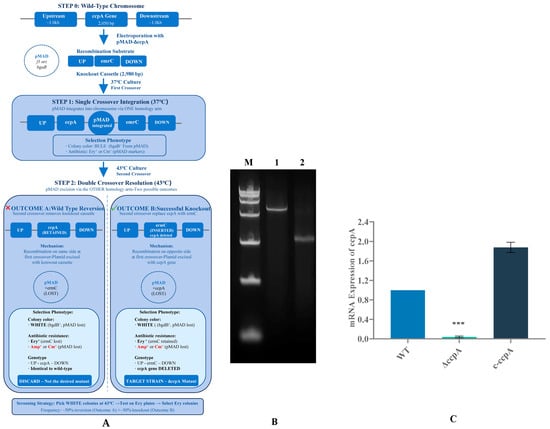
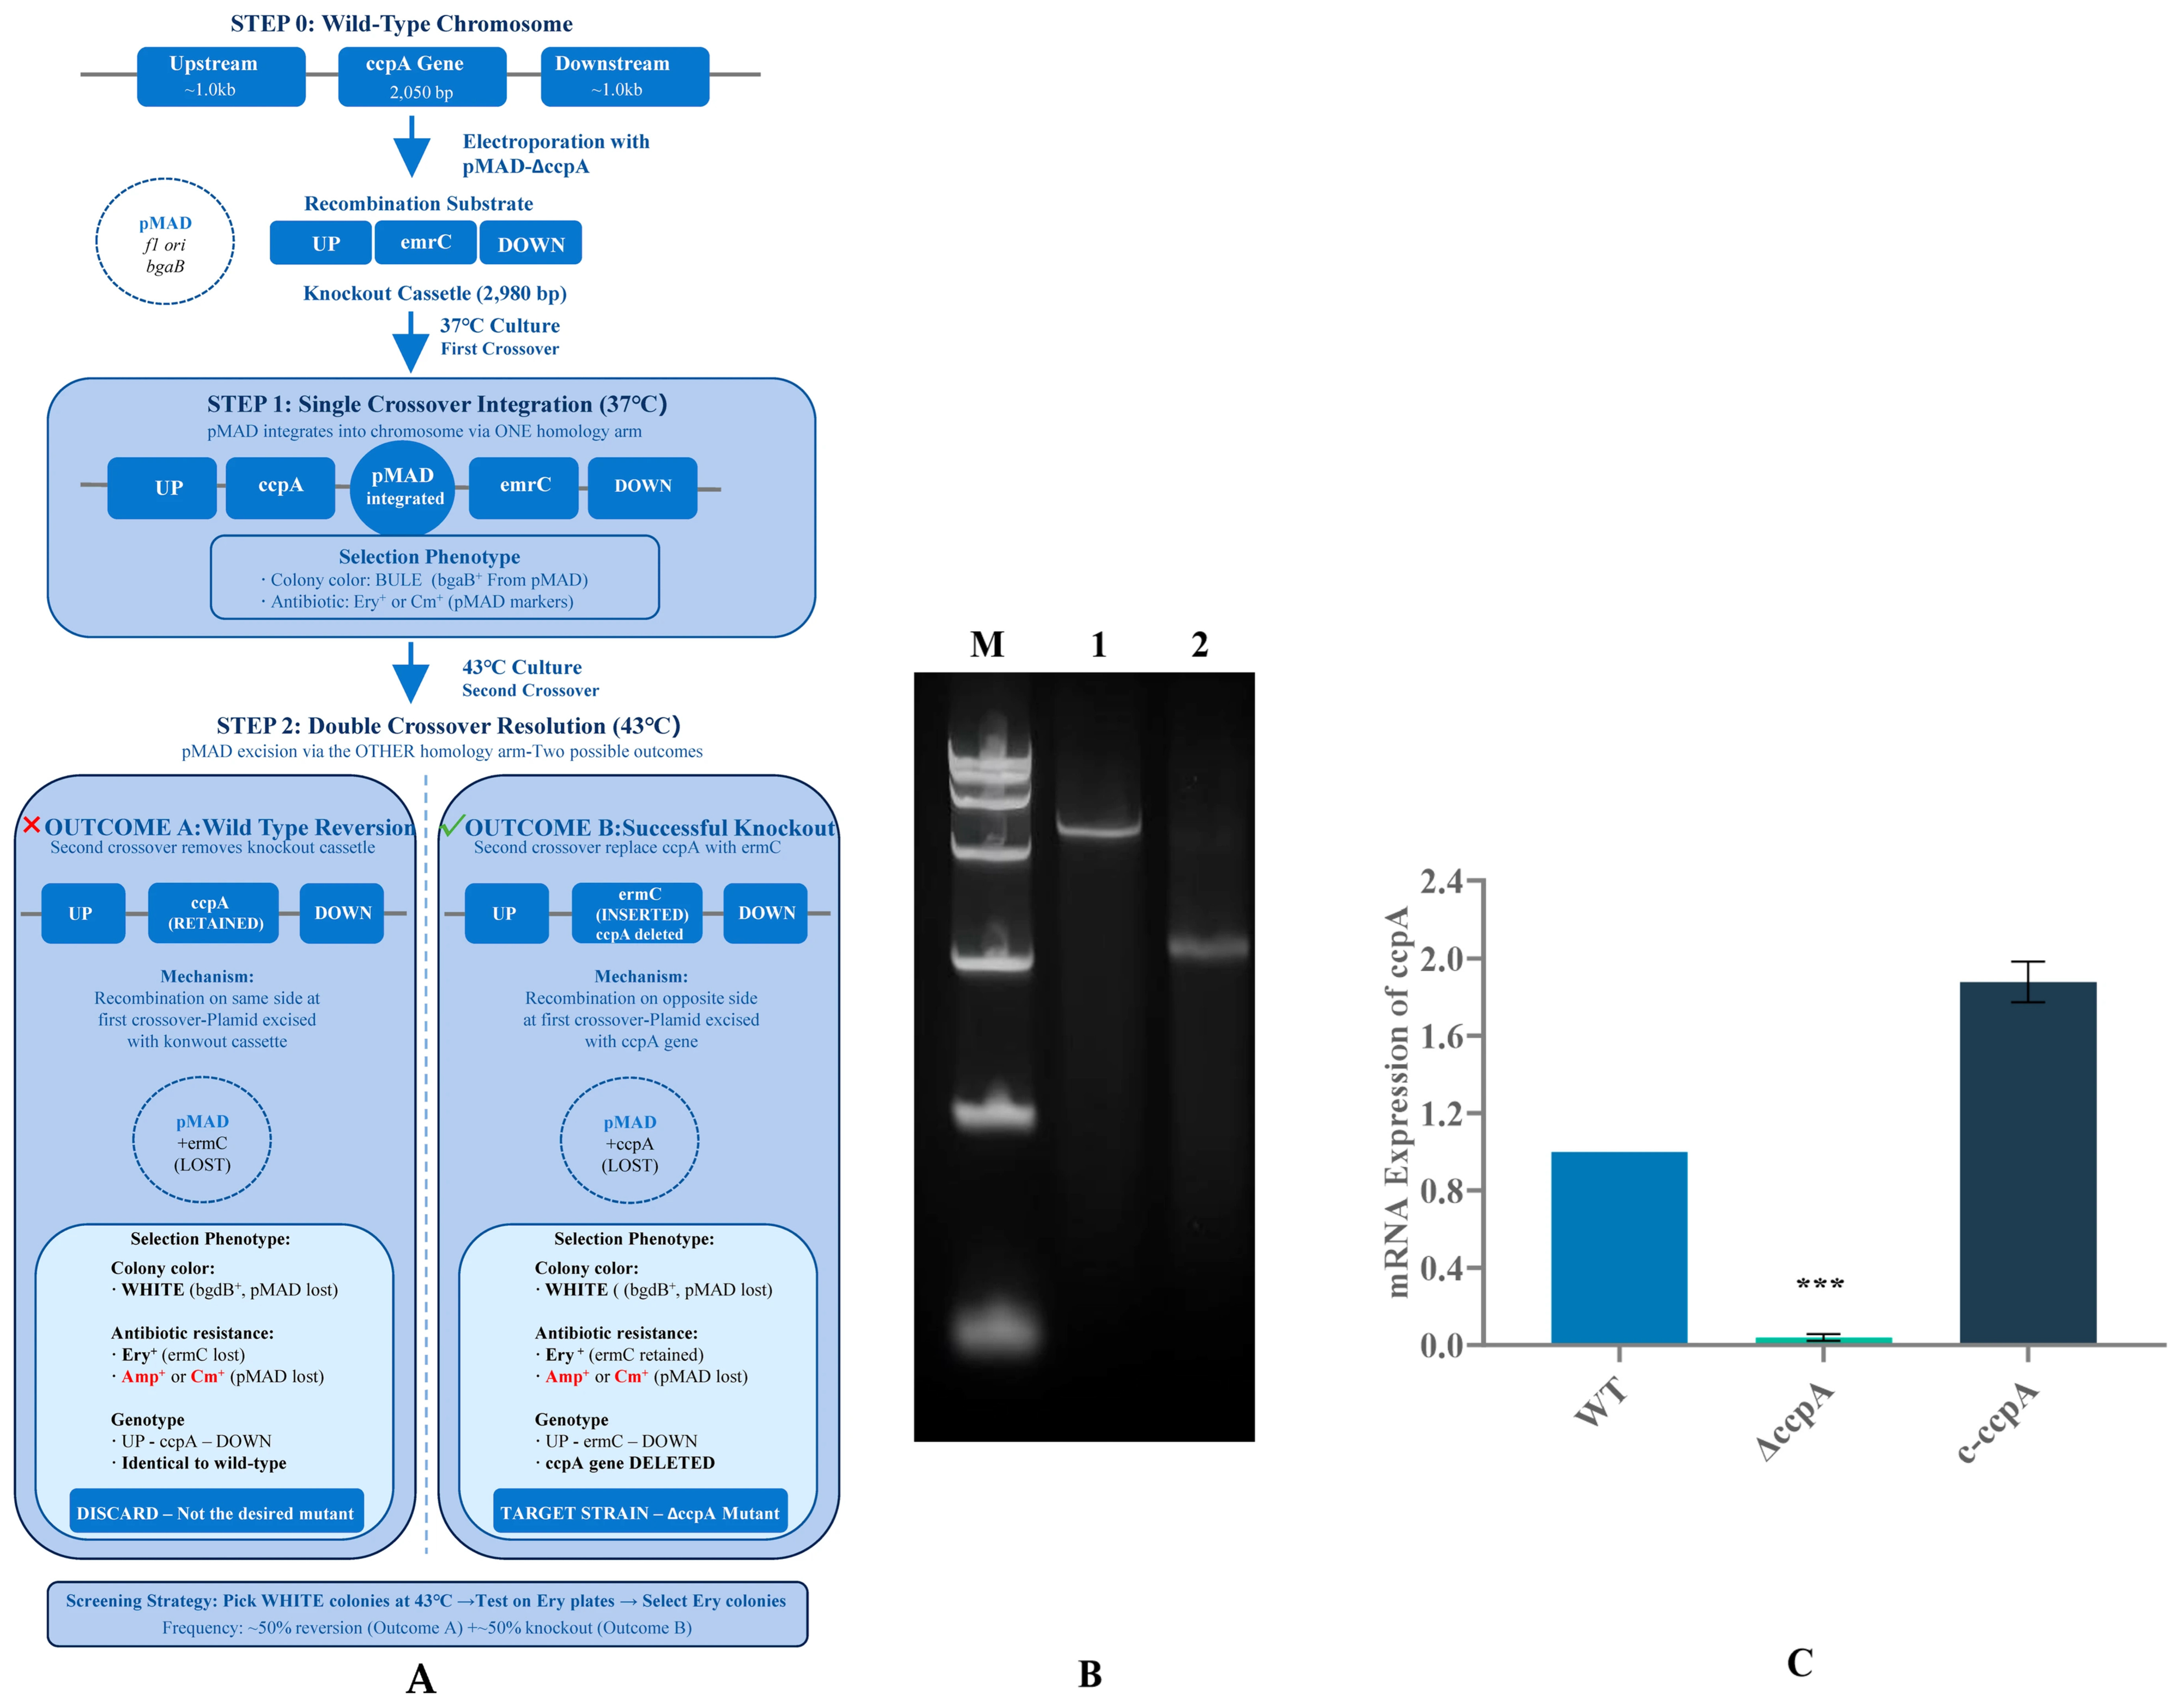
The ccpA gene was deleted from the chromosome of H. coagulans ATCC7050 via a markerless, double-crossover homologous recombination strategy using the temperature-sensitive plasmid pMAD. Briefly, the upstream (476 bp) and downstream (392 bp) flanking regions of ccpA were amplified from H. coagulans genomic DNA by PCR using primer pairs ccpA-UF/ccpA-UR and ccpA-DF/ccpA-DR, respectively (Table S1). The two fragments were joined by overlap-extension PCR and cloned into the BamHI and EcoRI sites of pMAD to generate the knockout vector pMAD-ΔccpA. The resulting plasmid was verified by restriction enzyme digestion and DNA sequencing and then transformed into H. coagulans by electroporation (2.5 kV, 25 μF, 200 Ω, 1 mm cuvette). Transformants were selected on BC plates containing erythromycin (5 μg/mL) at the permissive temperature of 37 °C to allow plasmid replication and chromosomal integration via single-crossover recombination. Subsequently, single-crossover integrants were identified by colony PCR and transferred to antibiotic-free BC medium at the non-permissive temperature of 50 °C for three successive passages to promote plasmid excision and the second homologous recombination event, as shown in Figure 1A. Erythromycin-sensitive colonies were screened, and the desired ccpA deletion was confirmed by PCR using flanking primers ccpA-VF/ccpA-VR (Table S1), followed by Sanger sequencing of the amplified product.
Figure 1.
Construction and verification of ΔccpA and C-ccpA in H. coagulans. (A) Schematic of markerless ccpA deletion using the temperature-sensitive vector pMAD via two-step homologous recombination, yielding either WT reversion or the ΔccpA genotype after plasmid excision. (B) Colony PCR verification using flanking primers: Lane 1, WT (1864 bp); Lane 2, ΔccpA (868 bp); M, DL2000 DNA marker. (C) Relative ccpA transcript levels in WT, ΔccpA, and C-ccpA determined by RT-qPCR using 16S rRNA as the internal reference. Data are mean ± SD (n = 3 biological replicates). Statistical significance was determined by one-way ANOVA followed by Tukey’s post hoc test. *** p < 0.05 compared to WT.
For the construction of the complementation strain (C-ccpA), the full-length ccpA open reading frame, together with its native promoter region (~400 bp upstream of the start codon), was amplified using primers ccpA-CF/ccpA-CR (Table S1) and cloned into the BamHI and XbaI sites of the shuttle vector pHY300PLK. The recombinant plasmid was verified by sequencing and introduced into the ΔccpA strain by electroporation. Positive transformants were selected on BC plates supplemented with tetracycline (10 µg/mL) and confirmed by PCR and sequencing.
2.3. Growth Curves and Sugar Utilization Assays
To evaluate the effect of ccpA deletion on cell growth and carbon-source utilization, the wild-type, ΔccpA, and C-ccpA strains were cultivated in BC medium containing one of the following carbon sources: (i) glucose (20 g/L) as the sole carbon source, (ii) xylose (20 g/L) as the sole carbon source, or (iii) a mixture of glucose (10 g/L) and xylose (10 g/L). Overnight seed cultures were inoculated into 50 mL of fresh medium in 250 mL Erlenmeyer flasks at an initial optical density at 600 nm (OD600) of 0.05 and incubated at 37 °C with shaking at 180 rpm under microaerophilic conditions.
Cell growth was monitored by measuring OD600 using a UV-1800 (Shimadzu, Kyoto, Japan) spectrophotometer at 3 h intervals. At each time point, 1.0 mL of culture broth was collected and centrifuged at 12,000× g for 5 min at 4 °C. The cell-free supernatant was filtered through a 0.22 μm membrane and stored at −20 °C for subsequent sugar and metabolite quantification. All experiments were performed in triplicate.
2.4. Analytical Methods
Residual sugars (glucose and xylose) and fermentation products (L-lactic acid, acetic acid, formic acid, and ethanol) were quantified simultaneously by high-performance liquid chromatography (HPLC). Cell-free culture supernatants were diluted appropriately with ultrapure water and filtered through 0.22 μm syringe filters prior to injection. The HPLC system (Agilent 1260 Infinity II, Agilent Technologies, Santa Clara, CA, USA) was equipped with a Bio-Rad Aminex HPX-87H column (300 × 7.8 mm, Bio-Rad, Hercules, CA, USA) maintained at 65 °C. The mobile phase was 5 mM H2SO4 delivered isocratically at a flow rate of 0.6 mL/min. Detection was performed using a refractive index detector (RID) maintained at 50 °C. The injection volume was 10 μL. Analyte concentrations were determined using calibration curves prepared with authentic standards of each compound (Sigma-Aldrich, St. Louis, MO, USA) at five or more concentration levels covering the expected sample range.
2.5. Enzyme Activity Assays
The activities of two key metabolic enzymes, L-lactate dehydrogenase (LDH, EC 1.1.1.27) and acetate kinase (ACK, EC 2.7.2.1), were measured in cell-free crude extracts of the wild-type, ΔccpA, and C-ccpA strains. Cells were cultivated in BC medium supplemented with 30 g/L glucose and 15 g/L xylose. Samples were collected at 0, 6, 12, and 24 h and harvested by centrifugation at 8000× g for 10 min at 4 °C. Cell pellets were washed twice with 50 mM Tris-HCl buffer (pH 7.5) and resuspended in lysis buffer (50 mM Tris-HCl, 1 mM DTT, pH 7.5). Cells were disrupted by ultrasonication (400 W, 3 s on/3 s off, 10 min) on ice, and the lysate was centrifuged at 12,000× g for 20 min at 4 °C to obtain the soluble fraction. Protein concentration in the crude extract was determined using the Bradford method with bovine serum albumin (BSA) as the standard (Bio-Rad Protein Assay Kit, Hercules, CA, USA).
The sampling time points (0, 6, 12, and 24 h) were selected based on preliminary growth-curve analysis to capture different metabolic phases: lag phase (0 h), early exponential phase (6 h, OD600 ≈ 2.0), late exponential phase (12 h, OD600 ≈ 4.5), and stationary phase (24 h, OD600 ≈ 5.5). This temporal profiling was designed to capture dynamic changes in enzyme activities during the transition from glucose to mixed-sugar metabolism and the onset of CCR in the wild-type strain. The 6 h time point was additionally used for detailed comparisons, as it represents a period of high metabolic activity and pronounced differences in sugar-utilization patterns between strains.
LDH activity was assayed in the direction of pyruvate reduction by monitoring the decrease in absorbance at 340 nm (NADH oxidation, ε = 6220 M−1 cm−1). The reaction mixture (1.0 mL) contained 50 mM Tris-HCl (pH 7.5), 0.2 mM NADH, 5 mM sodium pyruvate, and an appropriate amount of crude extract. ACK activity was assayed in the direction of acetyl phosphate formation by coupling with hydroxylamine and quantifying the resulting acetohydroxamic acid-Fe3+ complex at 540 nm. The reaction mixture contained 50 mM Tris-HCl (pH 7.4), 200 mM potassium acetate, 10 mM ATP, 10 mM MgCl2, and 400 mM hydroxylamine hydrochloride.
All enzymatic reactions were performed at 37 °C and initiated by the addition of substrate. One unit (U) of enzyme activity was defined as the amount of enzyme that catalyzed the conversion of 1 μmol of substrate per minute under the assay conditions. Specific activity was expressed as U per milligram of total protein (U/mg). All assays were performed in triplicate.
2.6. RNA Extraction and Transcriptomic Analysis
For transcriptomic profiling, the wild-type and ΔccpA strains were cultivated in BC medium supplemented with 10 g/L glucose and 10 g/L xylose. Cells were harvested at 18 h post-inoculation, corresponding to early stationary phase, when glucose was depleted and differences in xylose utilization between strains were most pronounced. This time point was specifically selected based on preliminary experiments showing (1) complete glucose exhaustion in both strains, minimizing glucose-mediated transcriptional effects; (2) maximum divergence in xylose consumption between the wildtype (minimal utilization) and ΔccpA (substantial utilization) and (3) stable expression of fermentative pathway genes after metabolic adaptation. This sampling strategy was designed to capture the steady-state transcriptional differences attributable to CcpA regulation rather than transient responses during metabolic transitions.
Cells were harvested at the mid-exponential phase (OD600 ≈ 2.0, approximately 18 h post-inoculation) by centrifugation at 8000× g for 5 min at 4 °C. Cell pellets were immediately frozen in liquid nitrogen and stored at −80 °C until RNA extraction. Three independent biological replicates were prepared for each strain.
Total RNA was extracted using TRIzol Reagent (Invitrogen, Carlsbad, CA, USA). Genomic DNA contamination was removed by treatment with RNase-free DNase I (Takara, Shiga, Japan). RNA integrity was assessed using an Agilent 2100 Bioanalyzer (Santa Clara, CA, USA), and only samples with an RNA integrity number (RIN) ≥ 7.5 were used for library preparation. RNA concentration and purity were determined using a NanoDrop 2000 spectrophotometer (Thermo Fisher Scientific, Waltham, MA, USA).
Ribosomal RNA was depleted using the Ribo-Zero rRNA Removal Kit (Illumina, San Diego, CA, USA). Strand-specific cDNA libraries were constructed using the NEBNext Ultra Directional RNA Library Prep Kit (New England Biolabs (NEB), Ipswich, MA, USA) for Illumina following the manufacturer’s protocol. Library quality was assessed on an Agilent 2100 Bioanalyzer and quantified by qPCR. Qualified libraries were sequenced on an Illumina NovaSeq 6000 platform (San Diego, CA, USA) using a paired-end 150 bp (PE150) strategy by Novogene Co., Ltd. (Beijing, China).
Raw sequencing reads were processed to remove adapter sequences, low-quality reads (Phred quality score < 20), and reads shorter than 36 bp using Trimmomatic (v0.39). Clean reads were aligned to the H. coagulans DSM 1 reference genome (GenBank accession: [CP009709.1]) using Bowtie2 (v2.4.2). Gene-level read counts were generated using HTSeq (v0.11.2). Differential gene expression analysis between ΔccpA and the wild-type strain was performed using DESeq2 (v1.26.0), with genes meeting the criteria of |log2(fold change)| ≥ 1 and adjusted p-value (Benjamini–Hochberg) < 0.05 considered as significantly differentially expressed genes (DEGs). Functional annotation and enrichment analysis of DEGs were conducted using the Gene Ontology (GO) and Kyoto Encyclopedia of Genes and Genomes (KEGG) databases, with a corrected p-value < 0.05 as the significance threshold.
2.7. Bioreactor Batch Fermentation
Scale-up batch fermentation was carried out in a BioFlo 115 (Eppendorf, Hamburg, Germany) bioreactor with a total volume of 5 L and a working volume of 2.0 L. The fermentation medium contained the same components as the BC medium used in shake flasks. The bioreactor was sterilized by autoclaving at 121 °C for 20 min. Seed cultures were prepared by inoculating a single colony into 100 mL of BC medium and cultivating at 50 °C for 12 h. The seed culture was then transferred into the bioreactor at an inoculation volume of 10% (v/v).
Fermentation was conducted at 50 °C with an agitation speed of 200 rpm. The pH was maintained at 6.0 ± 0.1 by automatic addition of 10 M NaOH. Anaerobic conditions were maintained by omitting air sparging, with nitrogen sparging at 0.5 vvm applied as needed. Samples (5 mL) were withdrawn at 3 h intervals for the determination of OD600, residual sugar concentrations, and metabolite concentrations as described in Section 2.3 and Section 2.4. Fermentation was terminated after 48 h or when residual glucose was below 0.5 g/L. All bioreactor fermentations were performed in duplicate independent runs.
L-lactic acid yield was calculated as the ratio of L-lactic acid produced (g) to total sugar consumed (g). Volumetric productivity was calculated as the final L-lactic acid titer (g/L) divided by the total fermentation time (h).
2.8. Carbon Balance Calculation
To evaluate the distribution of metabolic carbon flux, a carbon-balance analysis was performed for bioreactor batch fermentations.
Due to technical limitations in directly measuring CO2 evolution under microaerobic conditions, CO2 production was estimated stoichiometrically based on established metabolic pathways. Specifically, CO2 production was approximated assuming equimolar CO2 formation with each mole of formate and ethanol produced. This estimation assumes (1) formate is not further metabolized to CO2 and H2 by formate hydrogen-lyase, which is consistent with the absence of hydrogen detection in our fermentation; (2) the contribution of the pyruvate dehydrogenase complex to CO2 production is negligible under microaerobic conditions; and (3) no significant CO2 fixation occurs through anaplerotic reactions.
The limitations of this approach include potential underestimation of CO2 from minor pathways and the assumption of strict stoichiometry. To assess the reliability of the carbon balance, we compared the calculated CO2 values with theoretical yields from known pathways. The slightly lower carbon recovery in the ΔccpA strain (94.5% vs. 98.3% in WT) may reflect either enhanced CO2 production through alternative pathways or accumulation of unmeasured minor metabolites. Future studies employing online CO2 monitoring would provide more accurate carbon-flux distribution.
Carbon recovery was calculated according to the following equation:
where C_substrate is the total moles of carbon in the consumed glucose, and Σ C_product is the sum of carbon moles present in all quantified fermentation products. The carbon content of each compound was calculated based on its molecular formula: glucose (C6H12O6, 6 C-mol/mol), L-lactic acid (C3H6O3, 3 C-mol/mol), acetic acid (C2H4O2, 2 C-mol/mol), formic acid (CH2O2, 1 C-mol/mol), and ethanol (C2H6O, 2 C-mol/mol). Carbon incorporated into biomass was estimated from the dry cell weight using an average elemental composition of CH1.8O0.5N0.2 corresponding to a carbon content of approximately 48% (w/w). Dry cell weight was determined by correlating OD600 values with gravimetrically measured cell dry weight using a pre-established calibration curve (1 OD600 ≈ 0.35 g DCW/L). CO2 production was calculated stoichiometrically from mixed-acid fermentation pathways as described above.
Carbon recovery (%) = (Σ C_product)/C_substrate × 100%
2.9. Statistical Analysis
All experiments were independently performed with at least three biological replicates unless otherwise stated. Data normality was assessed using the Shapiro–Wilk test, and homogeneity of variances was evaluated using Levene’s test. For normally distributed data with equal variances, statistical significance between two groups was assessed using the unpaired, two-tailed Student’s t-test, and comparisons among three or more groups were performed using one-way analysis of variance (ANOVA) followed by Tukey’s post hoc test.
For non-normally distributed data or data with unequal variances, non-parametric tests were applied: the Mann–Whitney U test for two-group comparisons and the Kruskal–Wallis test followed by Dunn’s post hoc test for multiple comparisons. Effect sizes were calculated using Cohen’s d for t-tests and η2 for ANOVA. A p-value < 0.05 was considered statistically significant. All statistical analyses and graphical visualizations were performed using GraphPad Prism 10.1 software.
During the preparation of this manuscript, the author(s) used Doubao, 12.2.3 for the purposes of generated various elements and combined them together.
3. Results
3.1. Verification of the ΔccpA Deletion and Complementation Strain (C-ccpA)
Successful deletion of ccpA was first verified by colony PCR using primers flanking the ccpA locus. The ΔccpA mutant yielded an 868 bp amplicon, which was clearly distinguishable from the wild-type (WT) amplicon (1864 bp), consistent with precise removal of the ccpA coding region (Figure 1B). In addition, RT-qPCR analysis showed that ccpA transcripts were essentially undetectable in ΔccpA, whereas the complementation strain (C-ccpA) restored ccpA expression to a level comparable to WT (Figure 1C). Together, these data confirm successful construction of the deletion and complementation strains for subsequent phenotypic analyses.
3.2. Effect of ccpA Deletion on Cell Growth and Carbon Source Utilization
To determine how CcpA affects growth and sugar utilization, WT, ΔccpA, and C-ccpA were cultivated in BC medium containing glucose, xylose, or a glucose–xylose mixture as the carbon source.
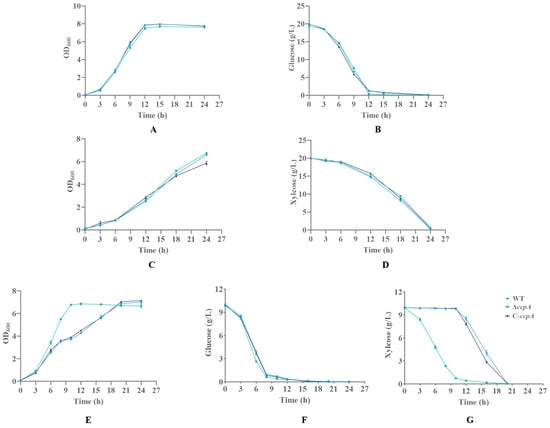
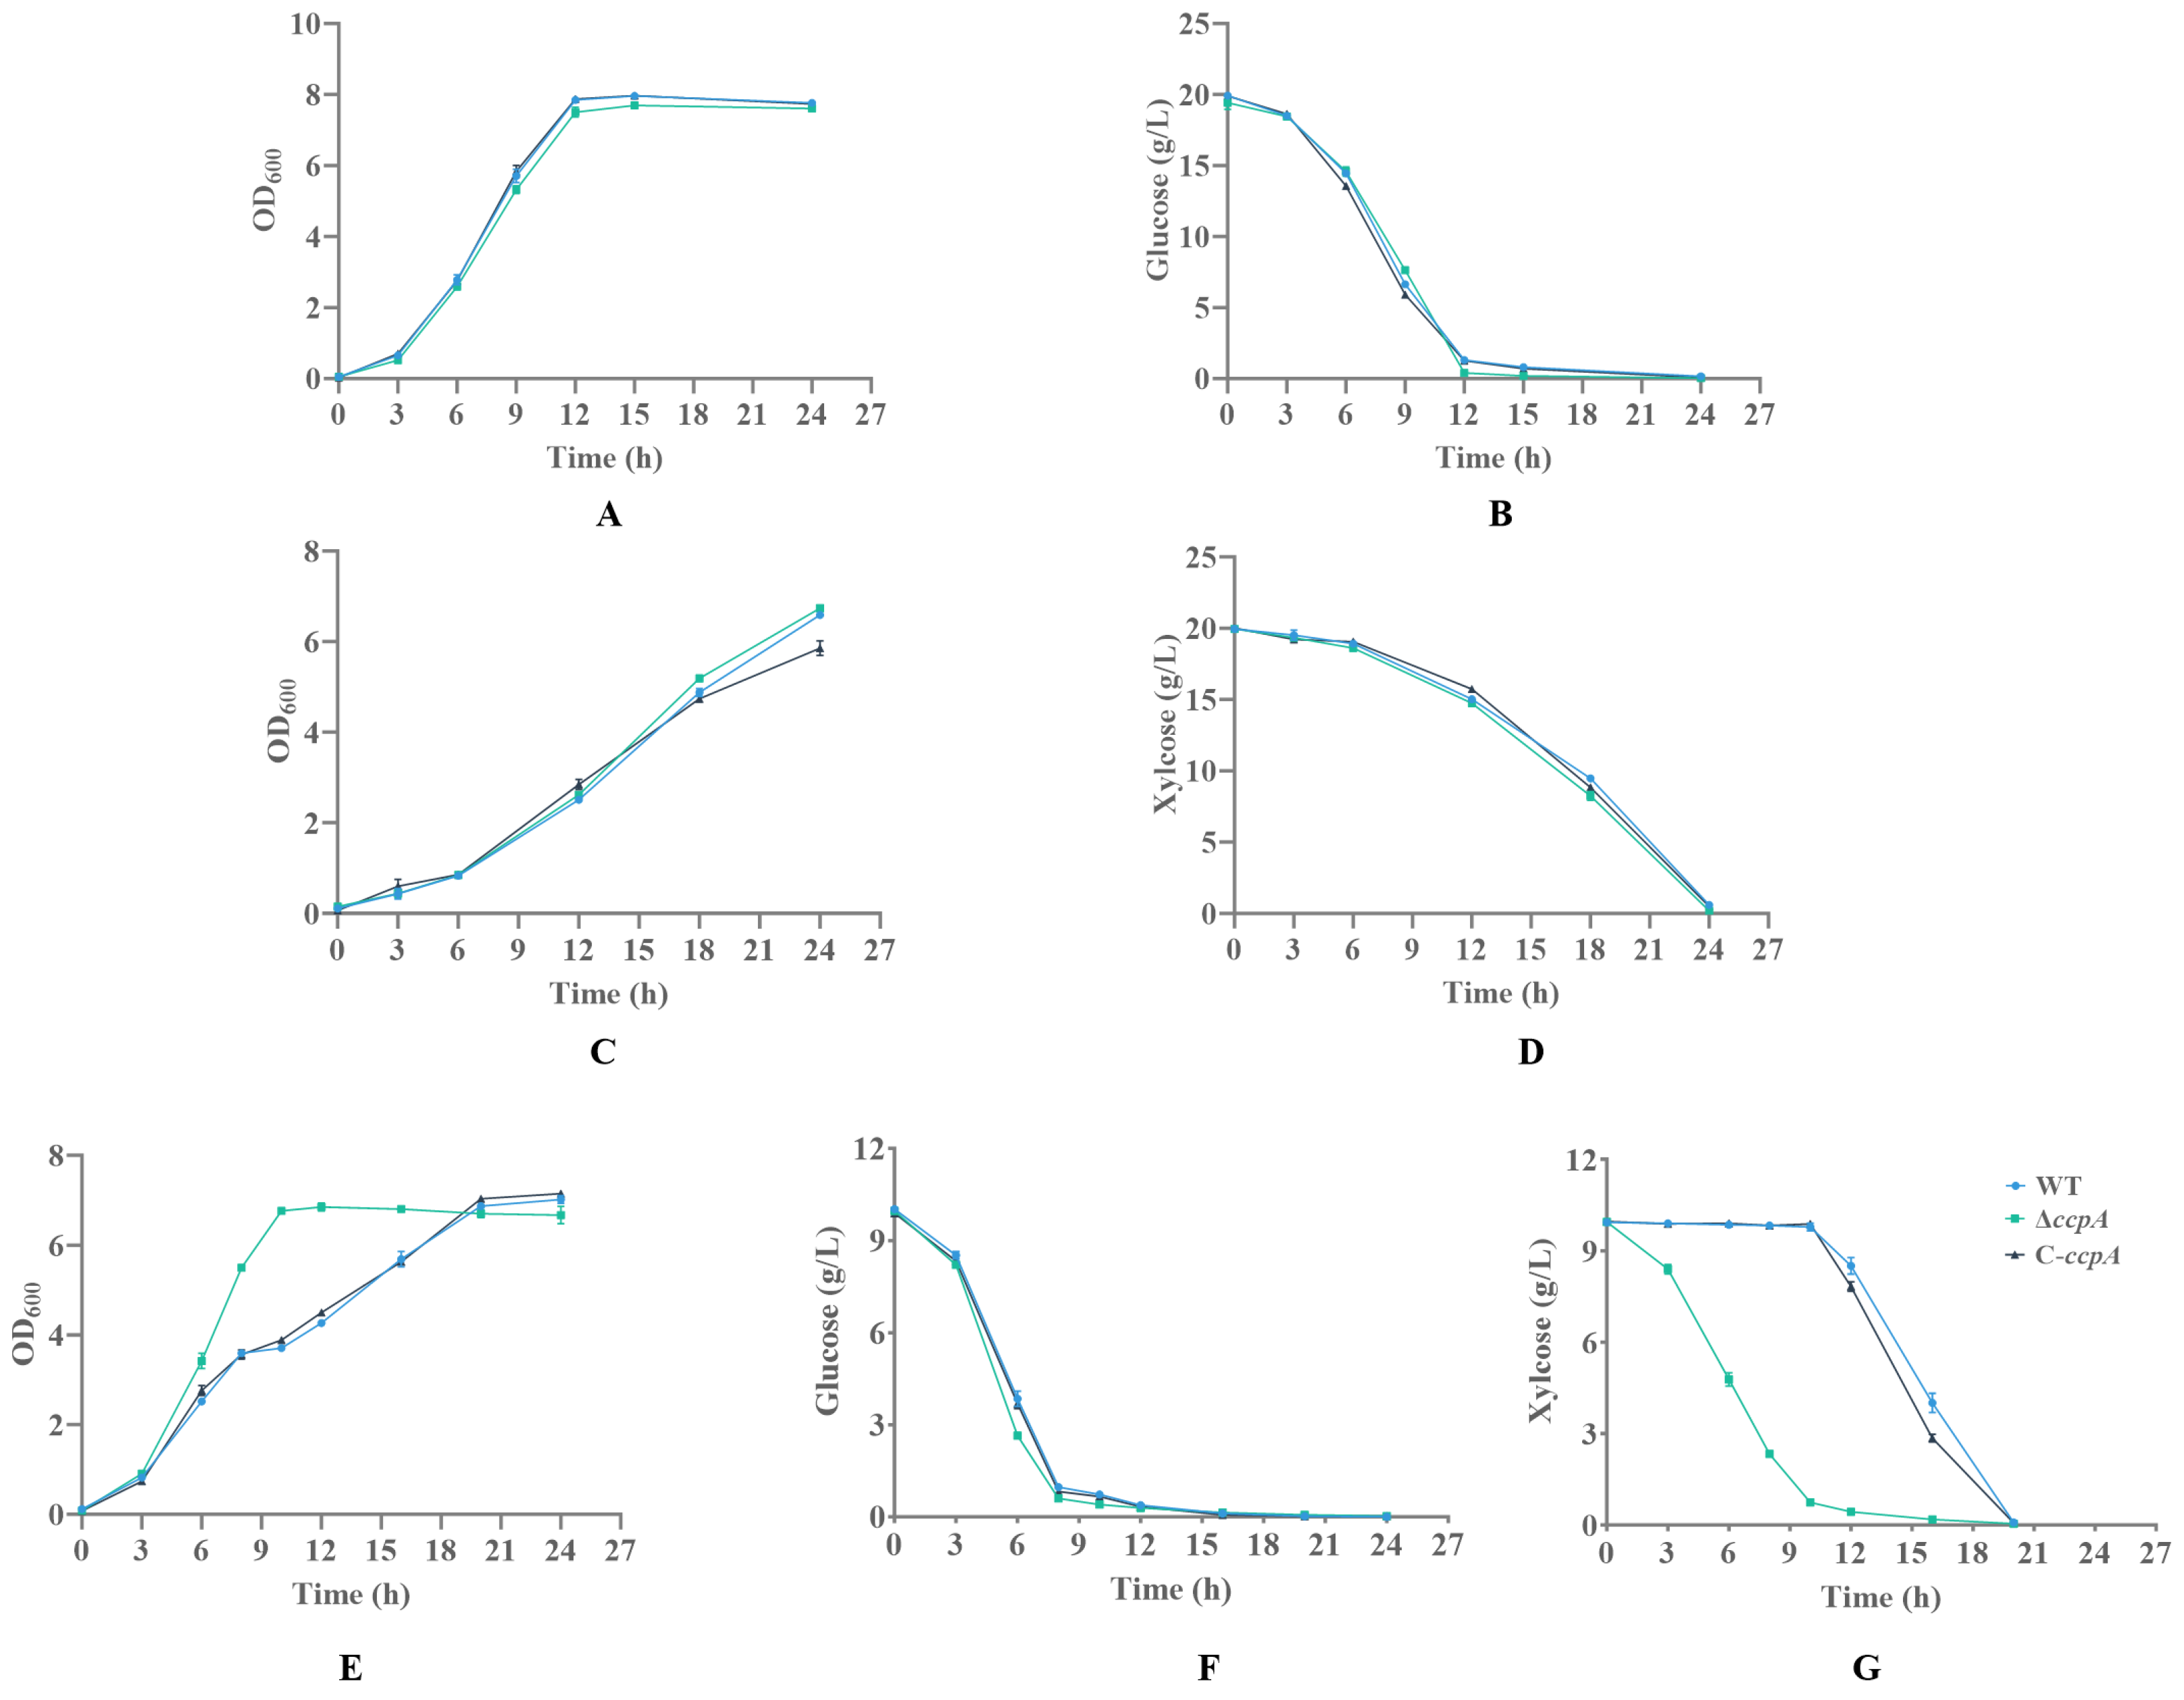
When glucose (20 g/L) served as the sole carbon source, all three strains exhibited comparable growth profiles and glucose consumption kinetics, indicating that CcpA is not essential for glucose-based growth under these conditions (Figure 2A,B). In contrast, when xylose (20 g/L) was provided as the sole carbon source, the ΔccpA strain showed a moderately enhanced xylose consumption rate compared to the WT and C-ccpA strains, with statistically significant differences observed at the 12 h and 18 h time points (p < 0.05), although the overall growth profiles were broadly similar (Figure 2C,D). This moderate enhancement is consistent with basal-level CcpA-dependent repression of xylose catabolic genes.
Figure 2.
Growth and sugar consumption of WT, ΔccpA, and C-ccpA in BC medium. (A,B) Growth (A) and residual glucose (B) with glucose (20 g/L). (C,D) Growth (C) and residual xylose (D) with xylose (20 g/L). (E–G) Growth (E), residual glucose (F), and residual xylose (G) with glucose (10 g/L) + xylose (10 g/L). Data are mean ± SD (n = 3).
The most striking phenotype was observed under mixed-sugar conditions (10 g/L glucose + 10 g/L xylose). All three strains consumed glucose at similar rates, with near-complete depletion by 9 h (Figure 2F). However, the ΔccpA strain initiated xylose consumption significantly earlier and at a faster rate than the WT and C-ccpA strains, resulting in a substantially higher overall sugar utilization efficiency (Figure 2G). Growth curves under mixed-sugar conditions also reflected this advantage, with the ΔccpA strain reaching a slightly higher final OD600 (Figure 2E). The C-ccpA strain exhibited a xylose consumption pattern similar to that of the WT, confirming that the observed phenotype was specifically attributable to ccpA deletion. This result suggests that CcpA may exert basal-level repression of xylose catabolic genes in H. coagulans even in the absence of glucose. Unlike the classical CCR observed under mixed-sugar conditions, this glucose-independent regulatory effect likely reflects residual CcpA activity driven by intracellular metabolic signals generated during xylose catabolism.
3.3. Deletion of ccpA Redirects Carbon Flux from L-Lactate Toward Mixed-Acid Products
To evaluate whether ccpA deletion alters fermentative end-product distribution, the three strains were cultivated in BC medium with high glucose, and extracellular metabolites were quantified at the end of fermentation (24 h).
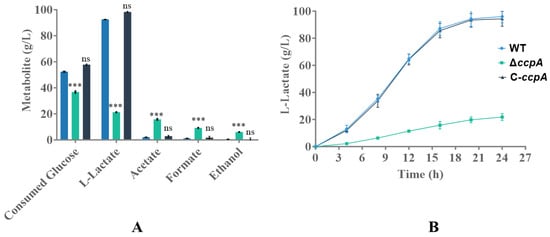
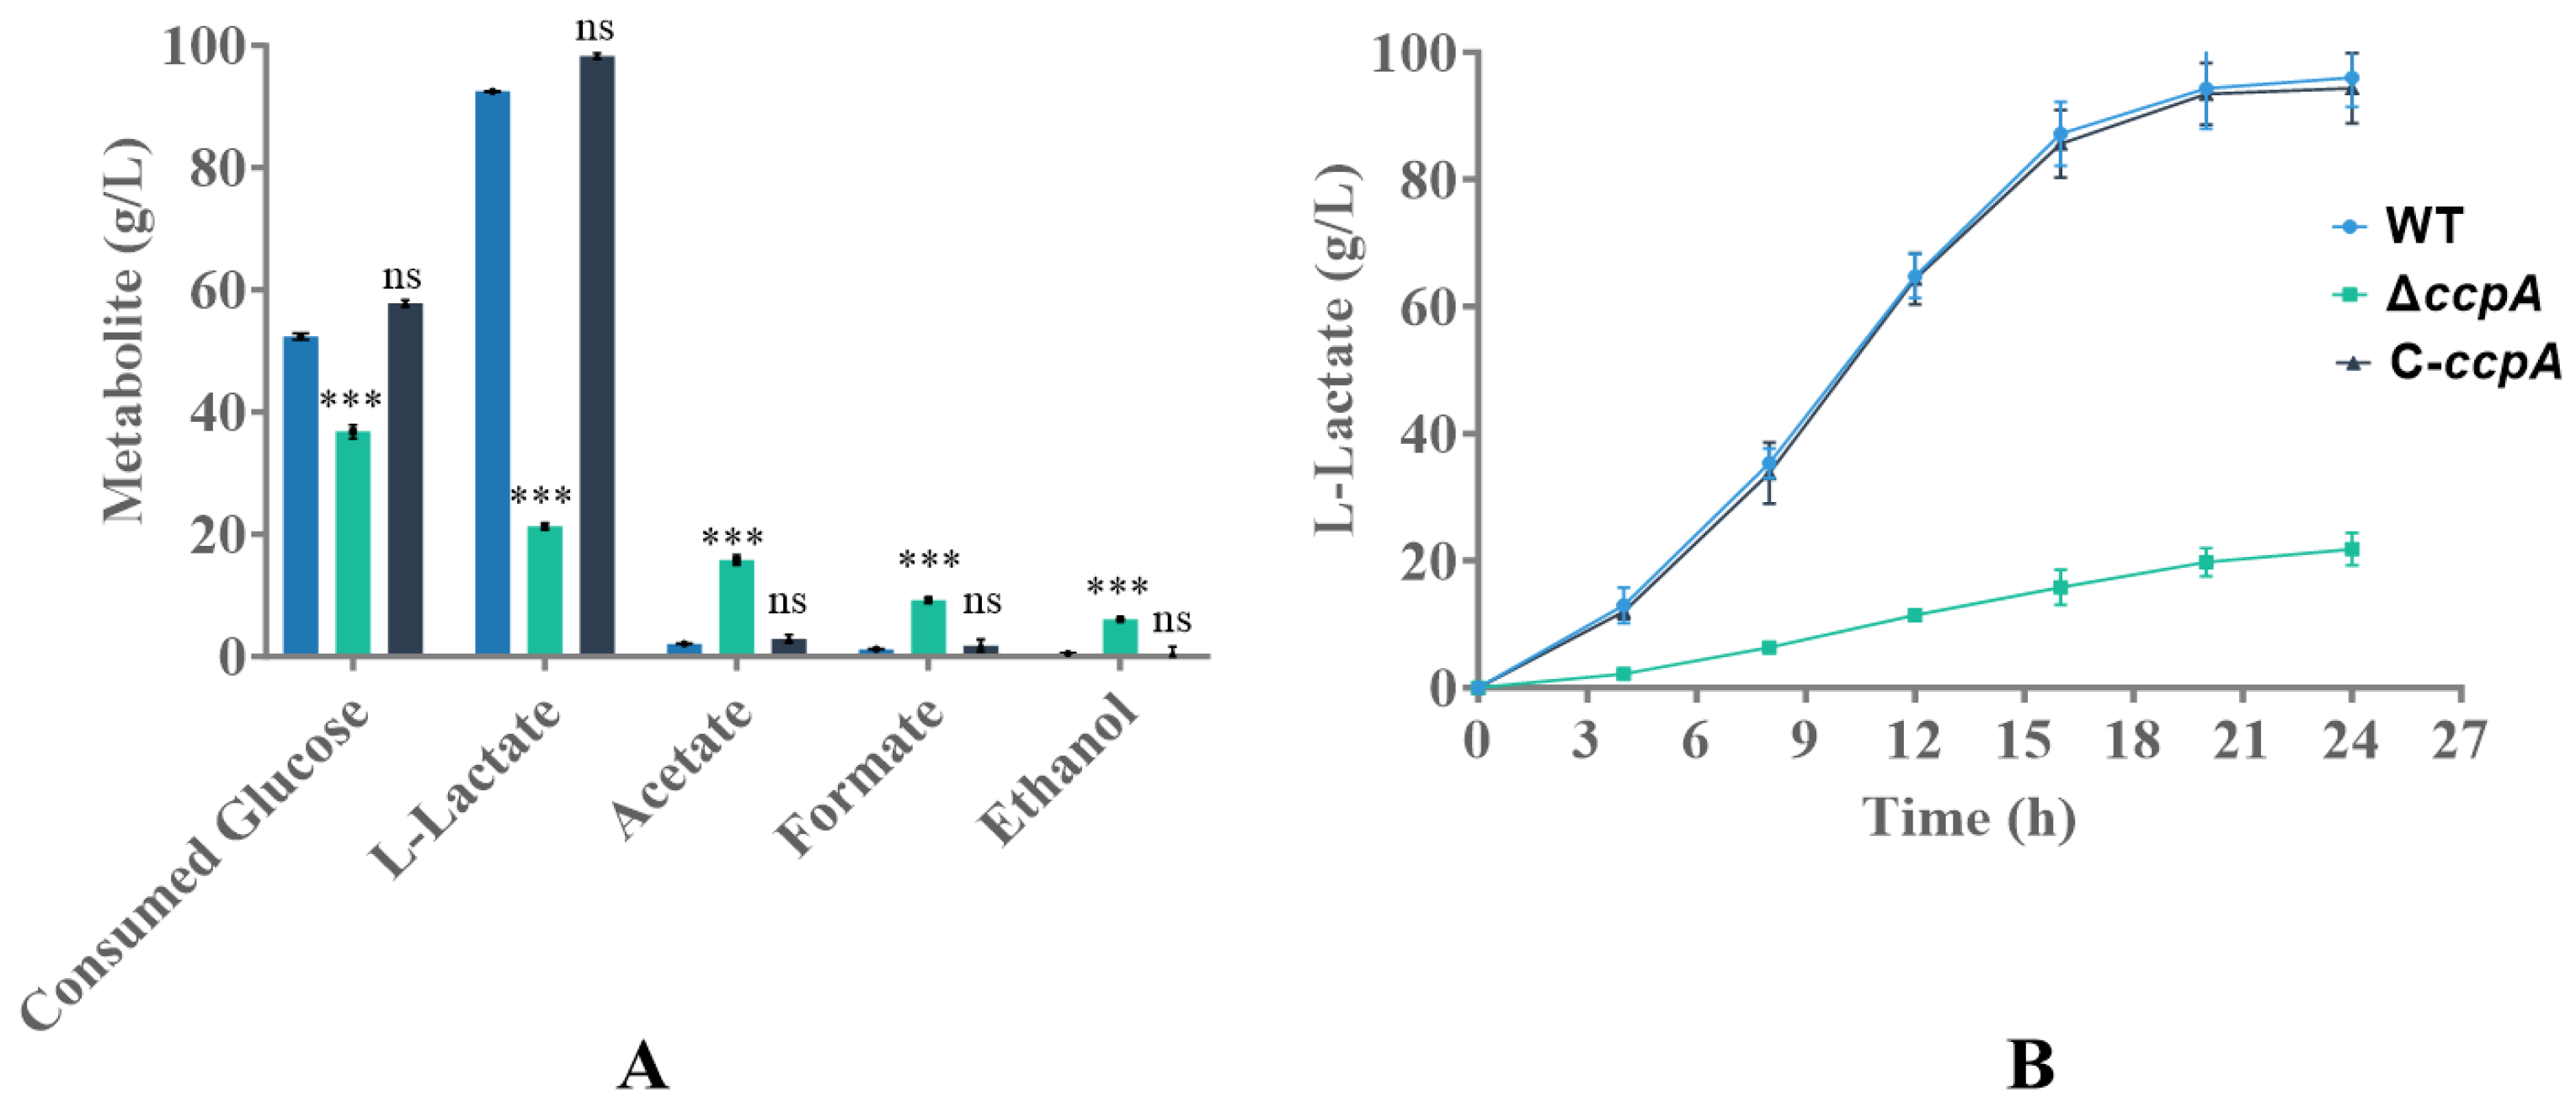
The WT and C-ccpA strains consumed approximately 52 and 58 g/L glucose, respectively, and produced high titers of L-lactate (~92 and ~98 g/L) as the predominant fermentation product, with only trace amounts of acetate, formate, and ethanol detected (Figure 3A). In stark contrast, the ΔccpA strain consumed significantly less glucose (~62 g/L) and produced dramatically reduced L-lactate (~21 g/L), while accumulating substantially elevated levels of acetate (~16 g/L), formate (~9 g/L), and ethanol (~6 g/L) (Figure 3A). These differences were statistically significant (p < 0.001) for the ΔccpA strain relative to the WT, whereas the C-ccpA strain showed no significant deviation from the WT, confirming that the metabolic shift was a direct consequence of ccpA deletion.
Figure 3.
Effect of ccpA deletion on L-lactate production and metabolite profiles in H. coagulans. (A) Comparison of consumed glucose and major metabolite concentrations (L-lactate, acetate, formate, and ethanol) among WT (blue), ΔccpA (green), and C-ccpA (black) strains at the end of fermentation (24 h). (B) Time course of L-lactate accumulation during fermentation. All strains were cultured in MRS medium containing 100 g/L glucose at 37 °C with shaking at 180 rpm. Data are presented as means ± standard deviation (n = 3). Statistical significance was determined by one-way ANOVA followed by Tukey’s post hoc test. *** p < 0.05 compared to WT; ns, not significant.
Time-course analysis of L-lactate accumulation further illustrated this divergence (Figure 3B). The WT and C-ccpA strains exhibited rapid and sustained lactate production, reaching approximately 95 g/L by 24 h. In contrast, L-lactate accumulation in the ΔccpA strain plateaued at approximately 20 g/L. These results indicate that CcpA plays a central role in directing carbon flux toward L-lactic fermentation in H. coagulans, and its absence triggers a metabolic shift toward mixed-acid fermentation.
3.4. ccpA Deletion Decreases LDH Activity and Increases ACK Activity
To probe the enzymatic basis of the altered product spectrum, activities of lactate dehydrogenase (LDH) and acetate kinase (ACK), key enzymes at the pyruvate branch point, were measured over the course of cultivation.
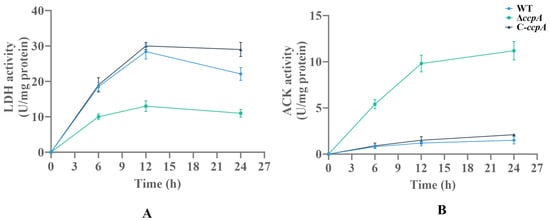
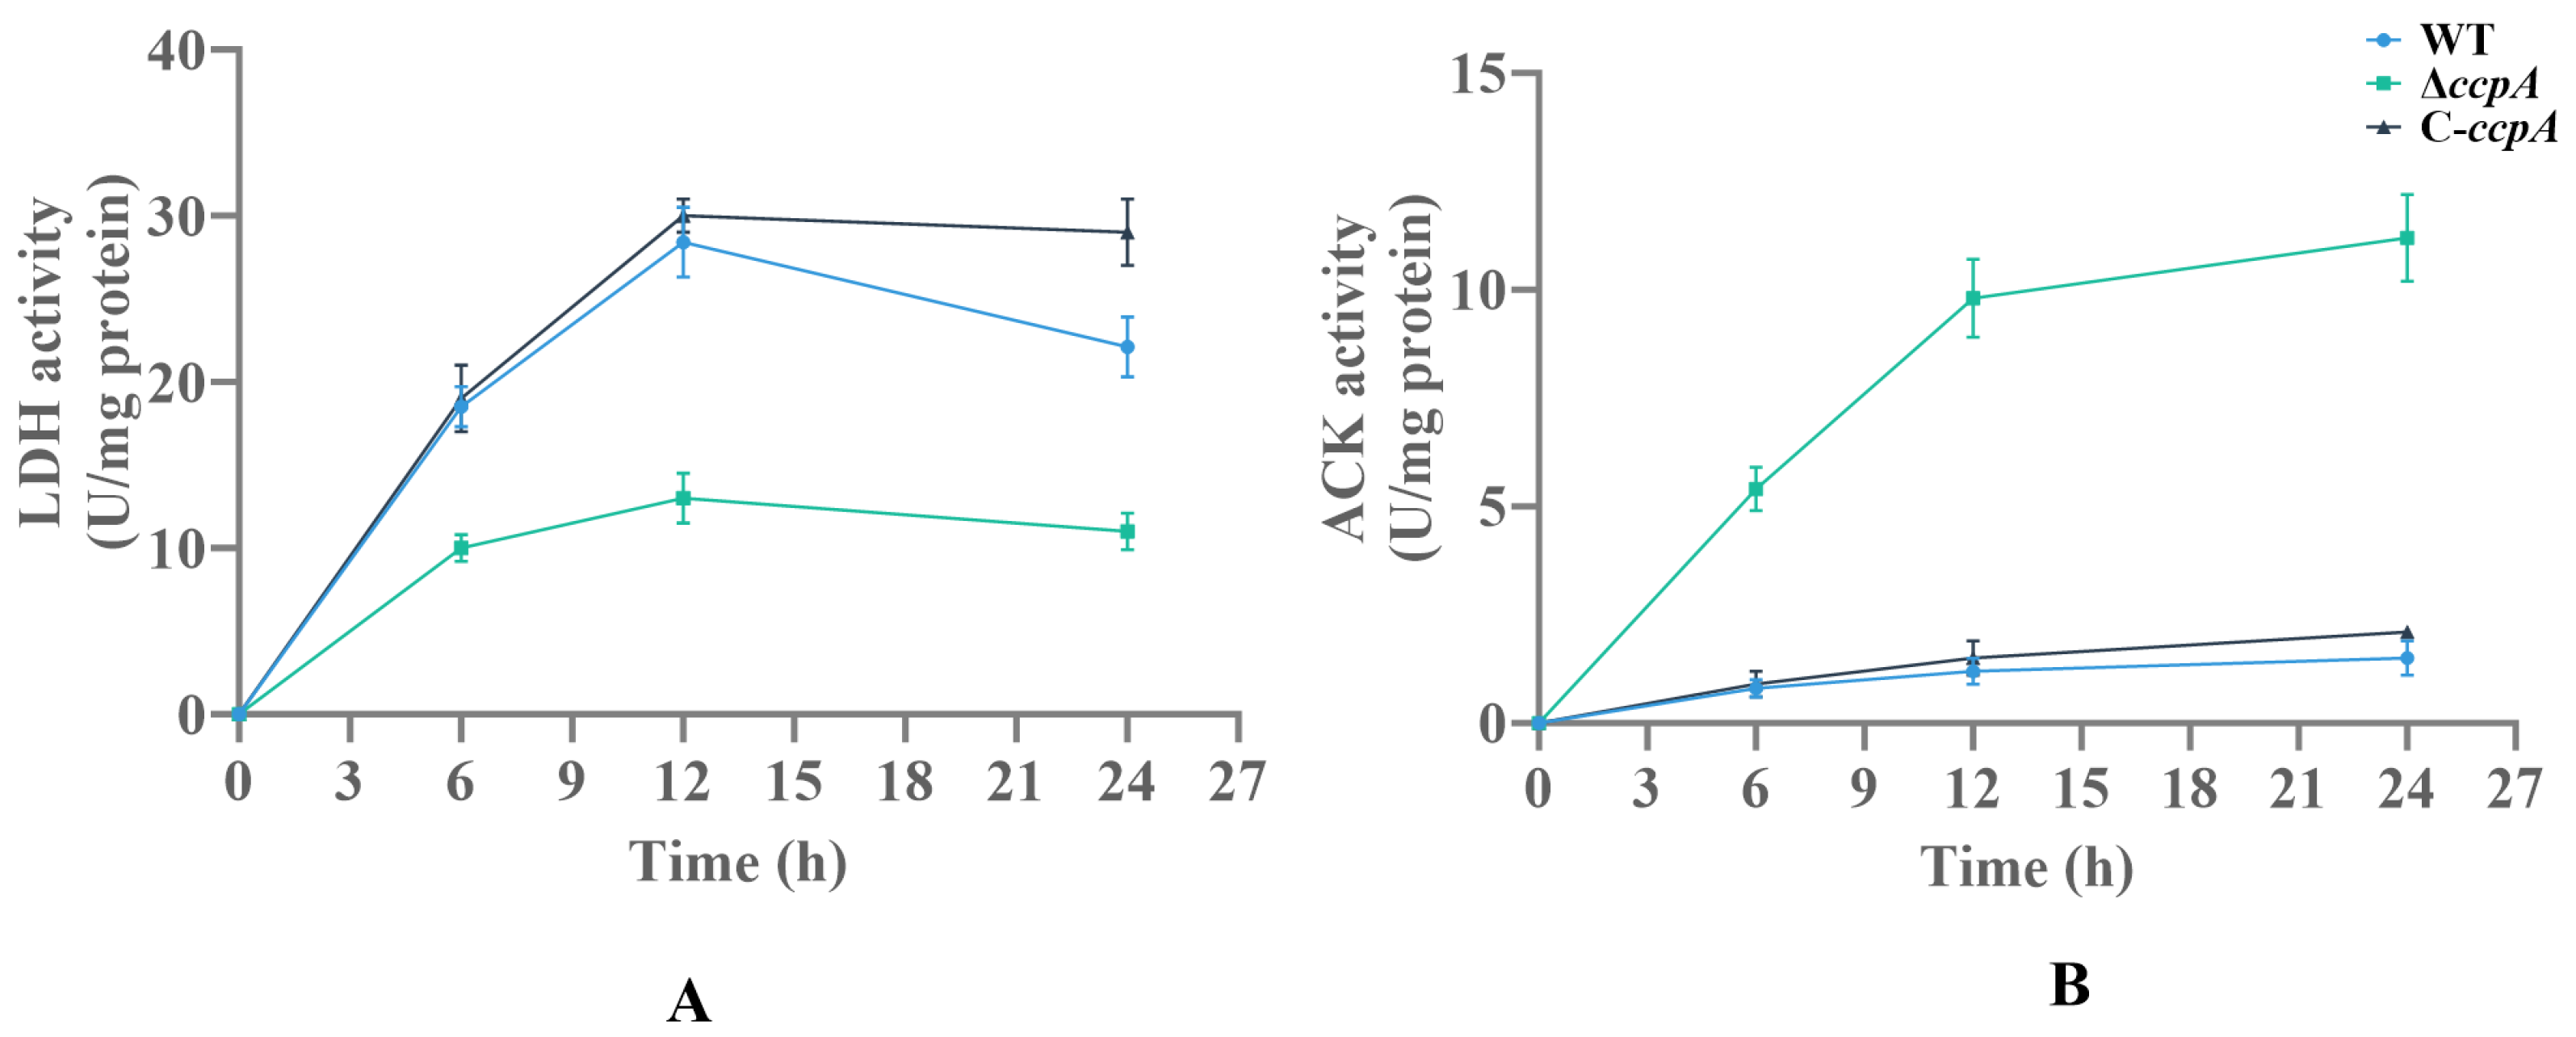
LDH activity in the WT and C-ccpA strains increased rapidly during the exponential growth phase, reaching peak values of approximately 28 and 30 U/mg protein at 12 h, respectively (Figure 4A). In the ΔccpA strain, however, LDH activity was significantly lower at all time points, peaking at only ~13 U/mg protein at 12 h and declining thereafter. This substantial reduction in LDH activity is consistent with the decreased L-lactate production observed in the ΔccpA strain.
Figure 4.
LDH and ACK activities in WT, ΔccpA, and C-ccpA. (A) LDH activity and (B) ACK activity measured at 0, 6, 12, and 24 h. Data are mean ± SD (n = 3).
Conversely, ACK activity exhibited the opposite trend (Figure 4B). While the WT and C-ccpA strains maintained relatively low ACK activity throughout fermentation (~1–2 U/mg protein), the ΔccpA strain displayed a pronounced and progressive increase in ACK activity, reaching approximately 12 U/mg protein by 24 h. This marked elevation in ACK activity is in agreement with the significantly enhanced acetate accumulation observed in the ΔccpA mutant (Figure 3A).
Taken together, these enzyme activity data demonstrate that CcpA positively regulates LDH activity while repressing ACK activity in H. coagulans, thereby maintaining the metabolic flux toward L-lactic fermentation. The deletion of ccpA disrupts this balance, leading to diminished lactate production and enhanced acetate biosynthesis.
3.5. Transcriptomic Analysis Reveals Broad CcpA-Dependent Regulation of Central Metabolism
To gain a genome-wide understanding of the regulatory network governed by CcpA, comparative transcriptomic analysis was performed between the WT and ΔccpA strains cultured in BC medium with mixed carbon sources (10 g/L glucose + 10 g/L xylose) at 18 h.
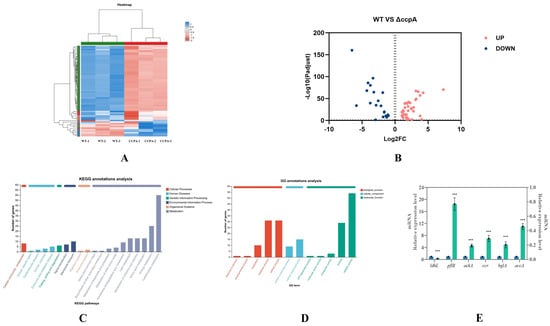
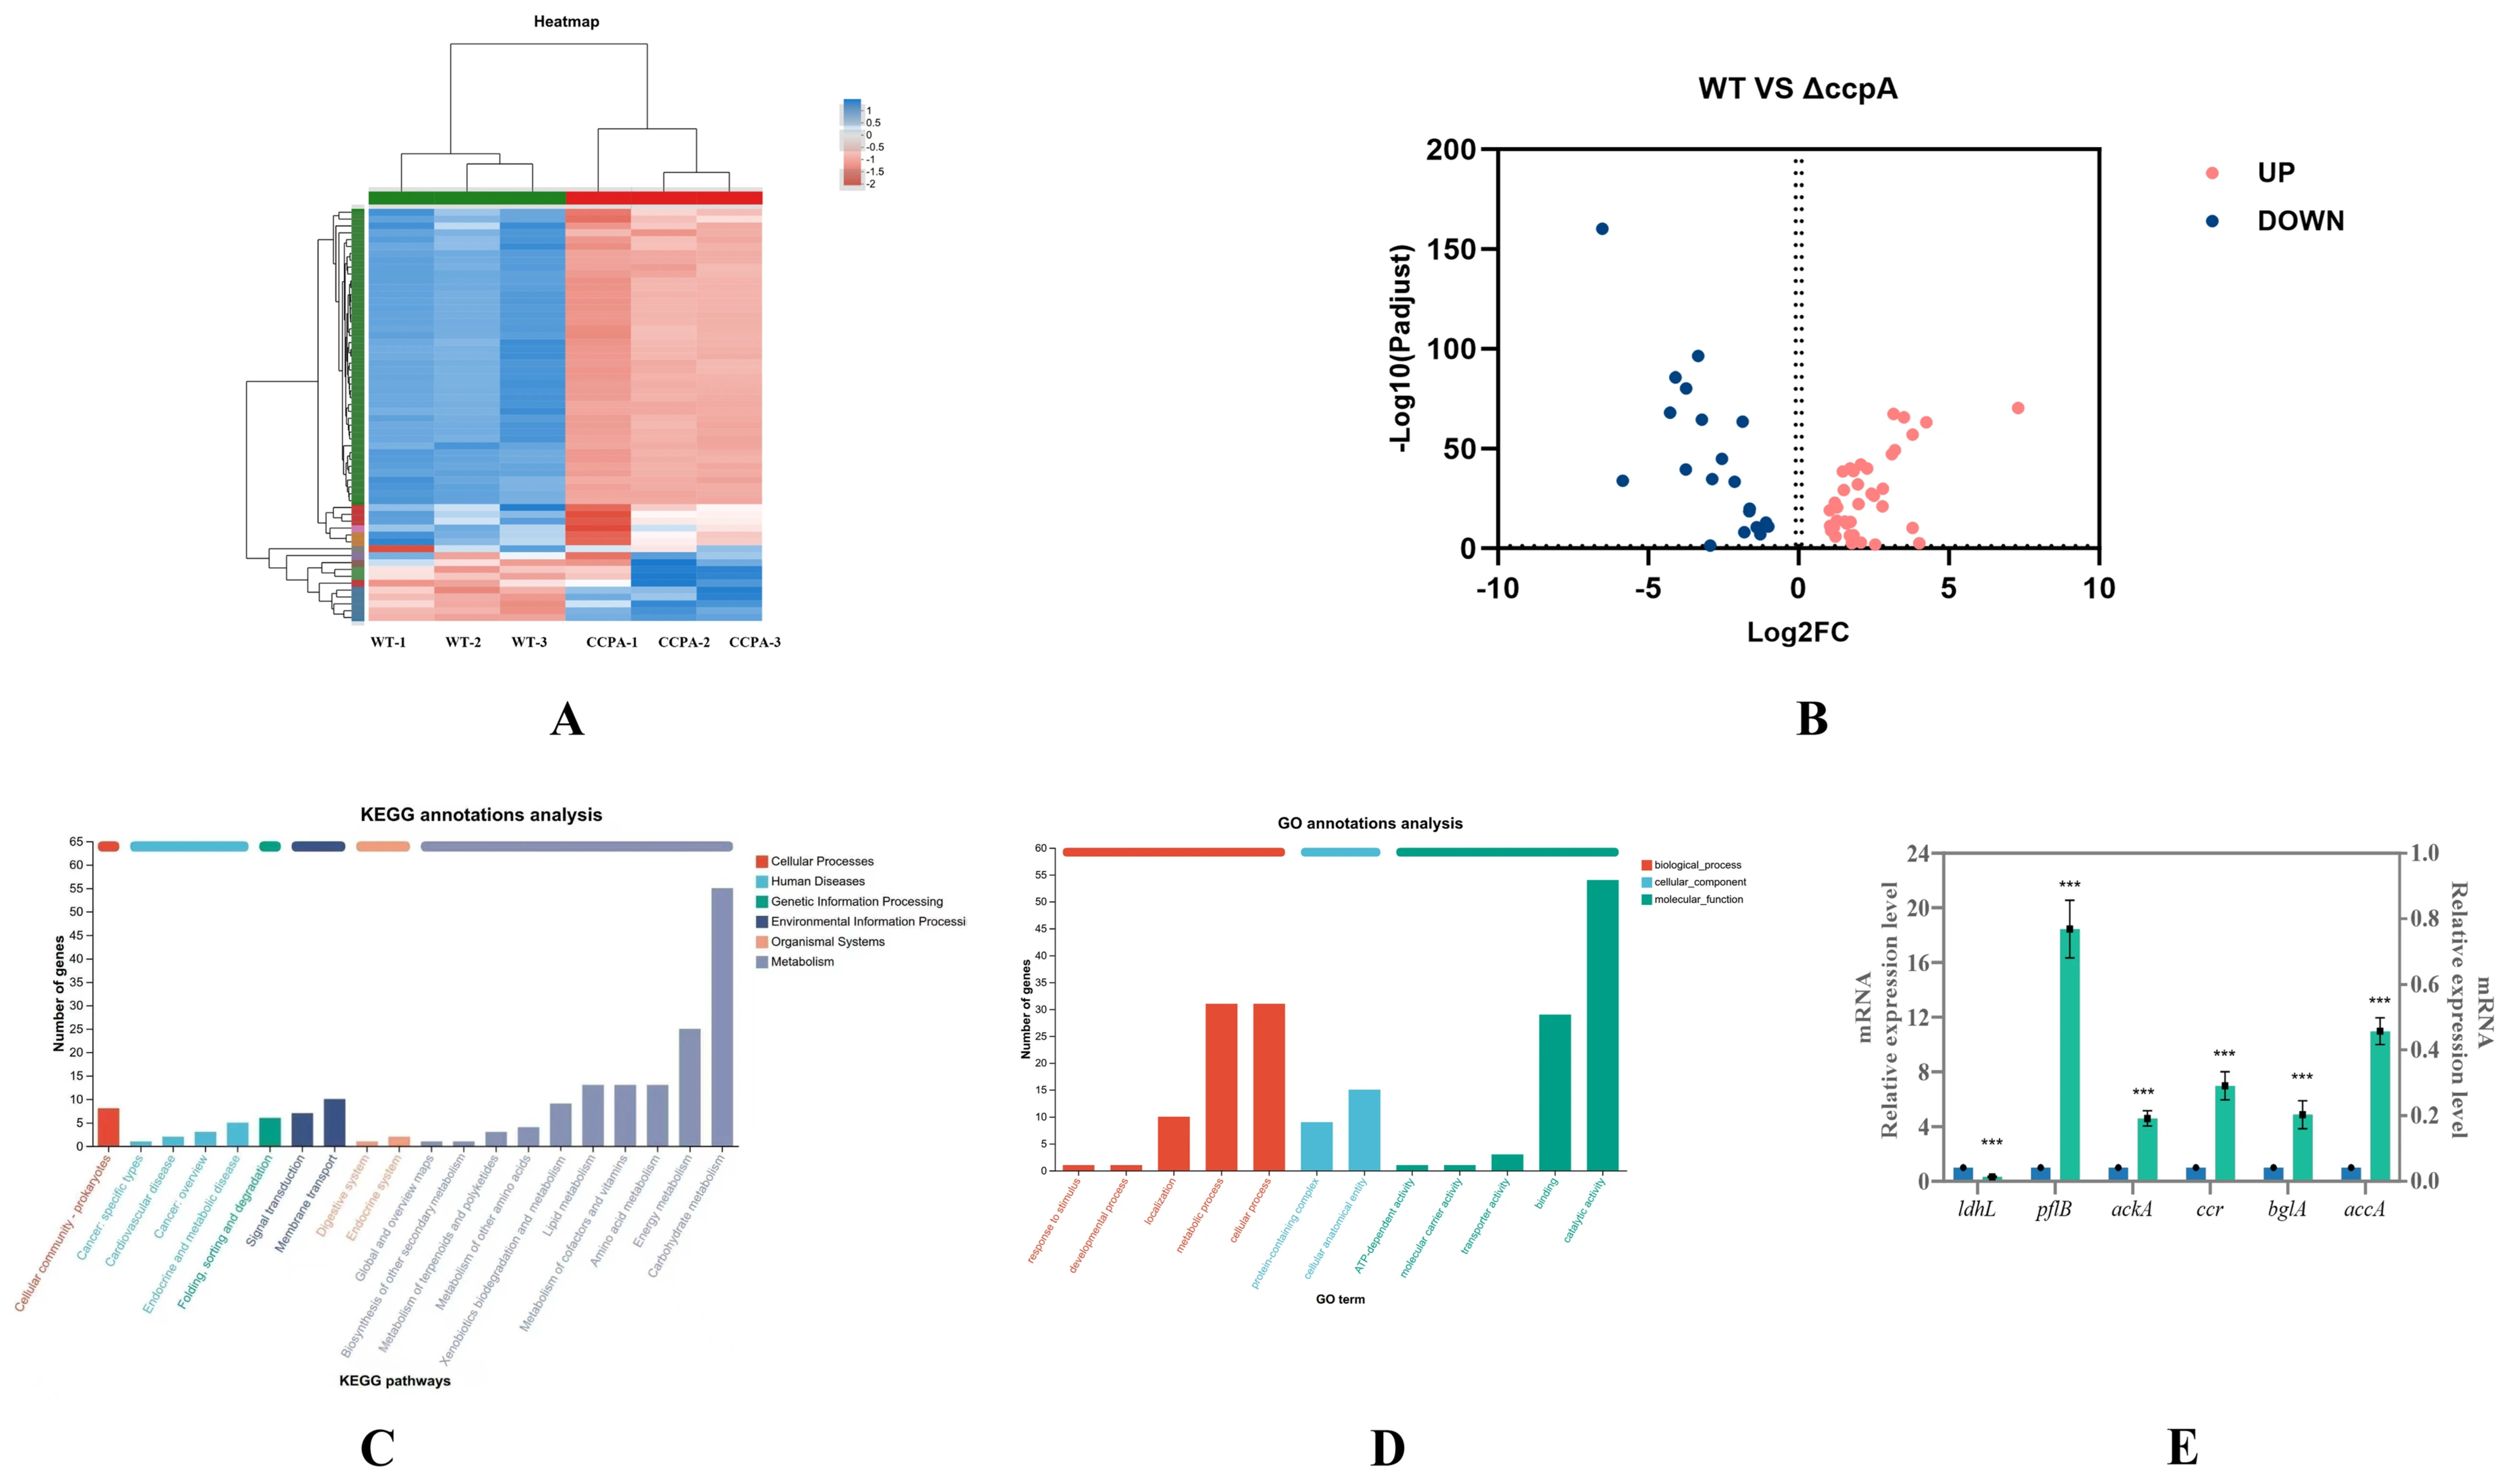
A total of 60 differentially expressed genes (DEGs) were identified (|log2FC| ≥ 1, adjusted p < 0.05). Hierarchical clustering analysis revealed a clear separation of gene expression profiles between the two strains, with distinct clusters of upregulated and downregulated genes in the ΔccpA mutant relative to the WT (Figure 5A). The volcano plot further illustrated the distribution of DEGs, with a subset of genes showing highly significant changes in expression (Figure 5B).
Figure 5.
Transcriptomic profiling of WT vs. ΔccpA under mixed-sugar conditions. (A) Heatmap of DEGs with hierarchical clustering. (B) Volcano plot of differential expression. The dashed line is used to demarcate the UP and DOWN. (C) GO enrichment of DEGs. (D) KEGG enrichment of DEGs. (E) RT-qPCR validation of selected DEGs (16S rRNA as reference), WT (blue), ΔccpA (green). Data are mean ± SD (n = 3). Statistical significance was determined by one-way ANOVA followed by Tukey’s post hoc test. *** p < 0.05 compared to WT.
Gene Ontology (GO) enrichment analysis indicated that DEGs were predominantly associated with biological processes related to metabolic processes, cellular processes, and catalytic activity, suggesting broad metabolic reprogramming upon ccpA deletion (Figure 5C). KEGG pathway enrichment analysis revealed that the DEGs were significantly enriched in pathways related to carbohydrate metabolism, amino acid metabolism, and energy metabolism, further supporting the central role of CcpA in coordinating carbon and energy metabolism in H. coagulans (Figure 5D).
To validate the transcriptomic data, six representative DEGs involved in central carbon metabolism were selected for RT-qPCR analysis (Figure 5E). Consistent with the RNA-seq results, ldhL (encoding L-lactate dehydrogenase) and crr (encoding a component of the glucose-specific phosphotransferase system) were significantly downregulated in the ΔccpA strain, whereas pflB (encoding pyruvate formate-lyase), ackA (encoding acetate kinase), bglA (encoding a β-glucosidase), and accA (encoding acetyl-CoA carboxylase subunit alpha) were significantly upregulated. These expression patterns are in full agreement with the observed metabolic and enzymatic phenotypes, confirming that CcpA acts as a transcriptional activator of ldhL and a repressor of mixed-acid fermentation genes in H. coagulans.
3.6. Bioreactor-Scale Fermentation Confirms the Metabolic Shift Caused by ccpA Deletion
To test whether the metabolic phenotypes observed at the flask scale were reproducible under more industrially relevant conditions, batch fermentations of the WT and ΔccpA strains were conducted in a 5 L stirred bioreactor with 100 g/L glucose under micro-aerobic conditions.
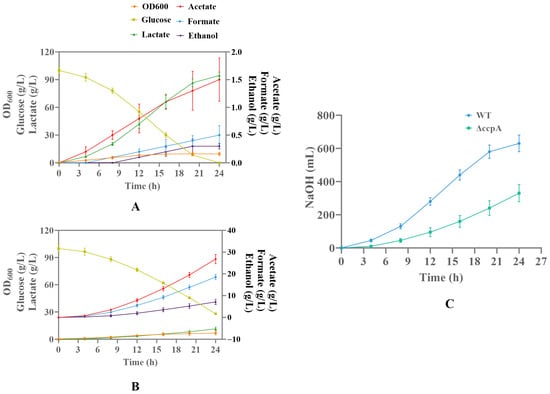
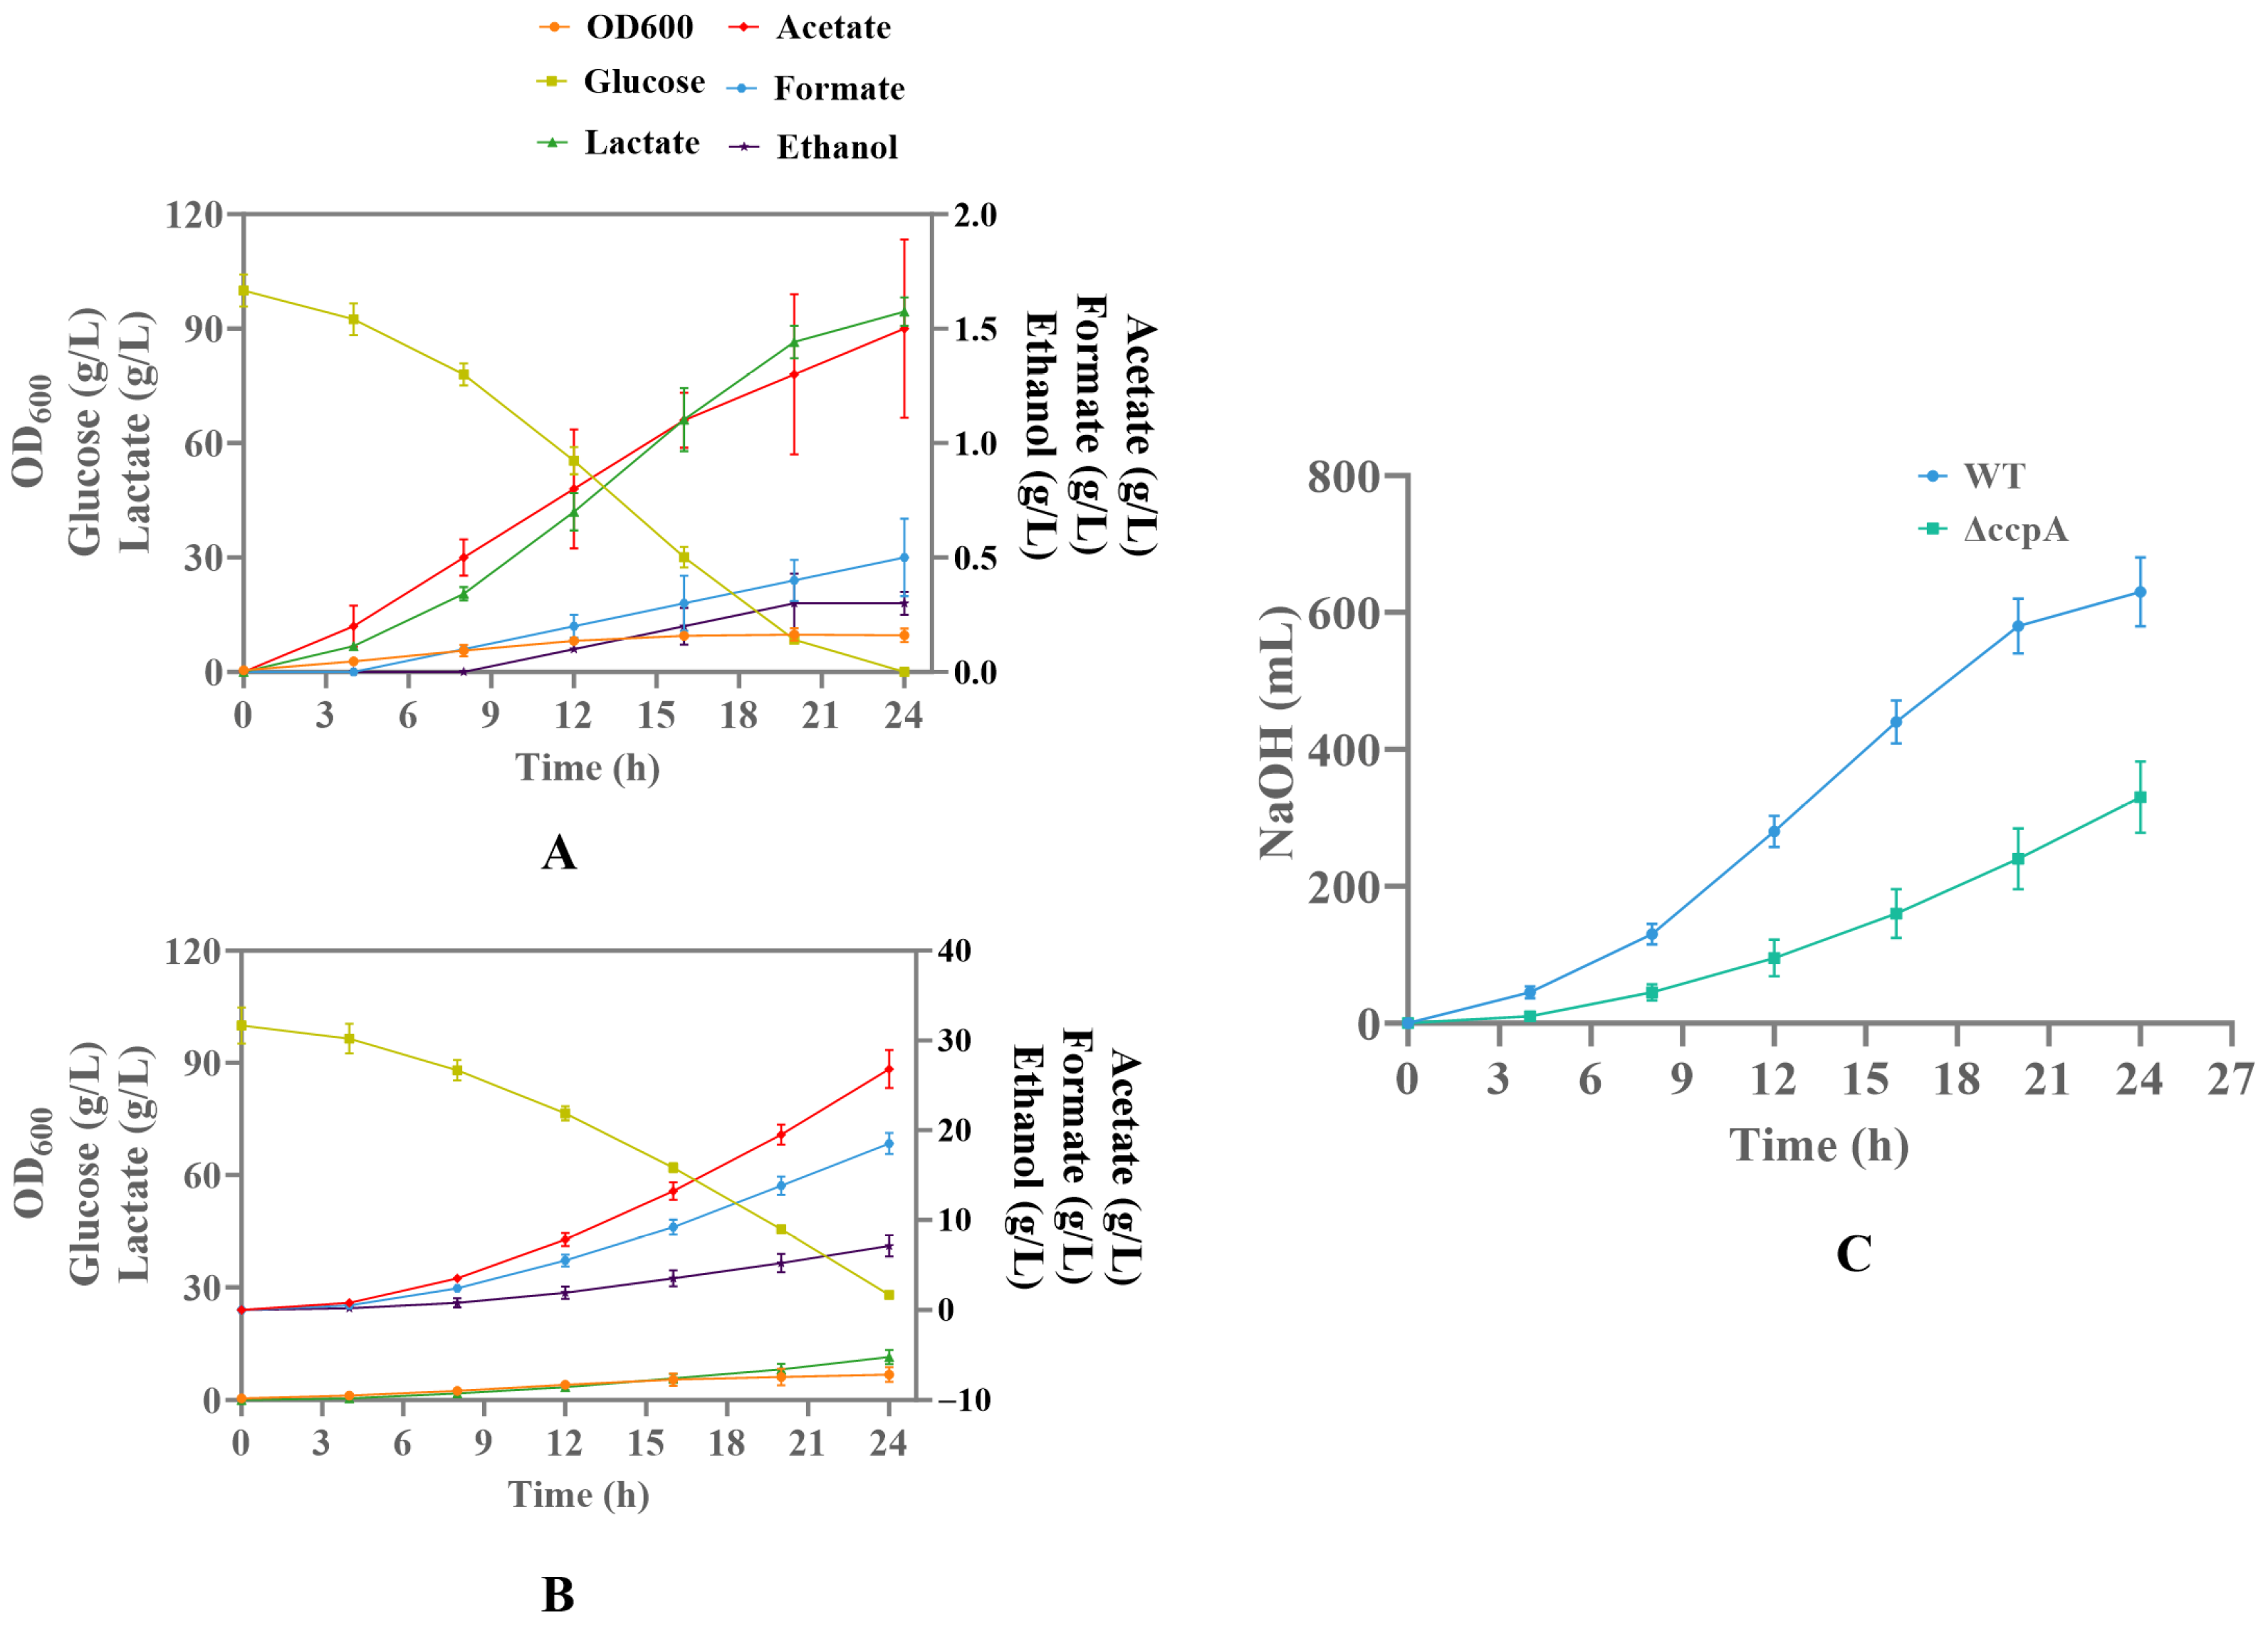
The WT strain exhibited robust growth and efficient L-lactic fermentation, consuming nearly all glucose within 24 h and producing 94.5 g/L L-lactate with a yield of 0.95 g/g glucose (Figure 6A; Table 1). Only minor amounts of acetate (1.5 g/L) and formate (0.5 g/L) were detected, and NaOH consumption reached approximately 600 mL by the end of fermentation, reflecting vigorous acid production (Figure 6C).
Figure 6.
Bioreactor batch fermentation profiles of WT and ΔccpA. (A) Time courses of cell growth (OD600), residual glucose, L-lactate, acetate, formate, and ethanol concentrations for the WT strain. The left y-axis represents OD600, glucose, and L-lactate concentrations (g/L); the right y-axis represents acetate, formate, and ethanol concentrations (g/L). (B) Time courses of cell growth (OD600), residual glucose, L-lactate, acetate, formate, and ethanol concentrations for the ΔccpA strain. The left y-axis represents OD600, glucose, and L-lactate concentrations (g/L); the right y-axis represents acetate, formate, and ethanol concentrations (g/L). (C) Cumulative NaOH consumption (mL) during fermentation for WT and ΔccpA strains, reflecting total acid production rates. Fermentations were performed in batch mode with BC medium containing 100 g/L glucose at 37 °C, 200 rpm, under micro-aerobic conditions. The pH was maintained at 6.0 by automatic addition of NaOH. Data are presented as means ± standard deviation (n = 3).
Table 1.
Comparison of key fermentation parameters for WT and ΔccpA strains of H, coagulans in bioreactor culture.
In contrast, the ΔccpA strain displayed markedly impaired growth and a fundamentally altered fermentation profile (Figure 6B). The maximum specific growth rate decreased by 44.8% (0.32 vs. 0.58 h−1), and the fermentation time was prolonged to 36 h (Table 1). Most notably, L-lactate production dropped to only 16.5 g/L (↓ 82.5%), while acetate and formate titers increased dramatically to 36.2 g/L (↑ 24.1-fold) and 25.8 g/L (↑ 51.6-fold), respectively. The lactate yield plummeted from 0.95 to 0.17 g/g, whereas the acetate yield surged from 0.02 to 0.36 g/g. Correspondingly, NaOH consumption by the ΔccpA strain was substantially lower than that of the WT throughout fermentation (Figure 6C), consistent with reduced total acid accumulation. The specific glucose consumption rates were comparable among strains (WT: 1.85 ± 0.12 g/(g DCW·h); ΔccpA: 1.72 ± 0.15 g/(g DCW·h); C-ccpA: 1.80 ± 0.10 g/(g DCW·h); p > 0.05). In contrast, the specific xylose consumption rate of the ΔccpA strain under mixed-sugar conditions was significantly higher than that of the WT (0.68 ± 0.08 vs. 0.22 ± 0.05 g/(g DCW·h); p < 0.01), providing quantitative support for CCR relief.
Carbon balance analysis further quantified the metabolic redistribution (Table 2). In the WT strain, 90.2% of the consumed carbon was channeled to lactate, confirming its L-lactic nature. In the ΔccpA strain, however, only 24.5% of the carbon flux was directed toward lactate, with the majority redistributed to acetate (35.2%), formate (16.8%), and ethanol (13.2%). Total carbon recoveries of 98.3% and 94.5% for the WT and ΔccpA strains, respectively, validated the reliability of the metabolite quantification.
Table 2.
Carbon balance of WT and ΔccpA strains during bioreactor fermentation.
These bioreactor-scale results are consistent with the flask-level observations and unequivocally demonstrate that CcpA is indispensable for maintaining L-lactic fermentation in H. coagulans. Its deletion causes a global metabolic shift from L-lactic to mixed-acid fermentation, characterized by severely reduced lactate production and markedly increased accumulation of acetate, formate, and ethanol.
Comparison of fermentation parameters between WT and ΔccpA strains of H. coagulans in bioreactor cultivation. Batch fermentations were performed in a 5 L stirred bioreactor with BC medium containing 100 g/L glucose at 37 °C, 200 rpm, under micro-aerobic conditions with pH maintained at 6.0 by automatic addition of NaOH. Data are presented as means ± standard deviation (n = 3). μmax, maximum specific growth rate; DCWmax, maximum dry cell weight; Qs, volumetric sugar consumption rate; Clac, final L-lactate titer; Cace, final acetate titer; Cfor, final formate titer; Ylac/s, lactate yield on glucose; Yace/s, acetate yield on glucose. Arrows indicate the direction of change in ΔccpA relative to WT.
4. Discussion
CcpA (catabolite control protein A) is a pleiotropic transcriptional regulator of the LacI/GalR-family transcriptional regulator that coordinates carbon catabolite repression (CCR) and central carbon metabolism in many low-G+C Gram-positive bacteria [7]. Although its regulatory roles have been extensively characterized in model organisms such as Bacillus subtilis, Lactococcus lactis, and multiple Lactobacillus species [13,15,19], the function of CcpA in H.coagulans, an industrially significant thermotolerant lactic acid bacterium, has remained largely unexplored. In this study, we constructed a ccpA deletion mutant and a complementation strain in H. coagulans and systematically investigated the physiological, metabolic, enzymatic, and transcriptomic consequences of CcpA deficiency. The data support a dual role for CcpA in this organism: (i) enforcing CCR to shape hierarchical carbon utilization and (ii) sustaining the predominantly L-lactic fermentation phenotype by controlling carbon flux distribution at the pyruvate node.
A defining function of CcpA in Firmicutes is the enforcement of CCR, typically mediated by formation of the CcpA–HPr(Ser46-P) complex and its binding to catabolite-responsive elements (cre) in target promoters, thereby repressing pathways for non-preferred carbon sources in the presence of glucose [11]. Our growth and sugar consumption analyses indicate that ccpA deletion in H. coagulans alleviates CCR: the ΔccpA strain displayed enhanced xylose utilization and, under mixed-sugar conditions, initiated xylose consumption earlier and more rapidly than the wild type, improving overall mixed-sugar conversion (Figure 2C–G). This behavior aligns with the canonical CCR mechanisms described in B. subtilis, where CcpA represses the xylose catabolism via cre-dependent regulation [20,21], and in L. plantarum, where a ccpA mutation relieves repression of alternative carbohydrate utilization systems [15]. Notably, the ΔccpA did not exhibit an obvious growth defect on glucose alone (Figure 2A,B), in contrast to some reports in L. plantarum [15], suggesting that the contribution of CcpA to glycolytic capacity and glucose-dependent growth can be species- and context-dependent. Relief of CCR is particularly relevant for bioprocessing of lignocellulosic hydrolysates, which commonly contain both glucose and xylose [9,22]. The capacity of the ΔccpA to improve co-utilization of these sugars highlights CcpA as an engineering lever to enhance mixed-sugar conversion in H. coagulans-based bioprocesses.
The most prominent phenotype associated with ccpA deletion was a pronounced shift from homolactic to mixed-acid fermentation. In bioreactor cultivation, the wild-type strain maintained high L-lactate yield (0.95 g/g glucose), consistent with the well-established L-lactic character of H. coagulans [4,6,23]. In contrast, ΔccpA showed a substantial reduction in lactate titer and yield, accompanied by strongly increased acetate and formate accumulation (Figure 6; Table 1). Similar qualitative outcomes have been reported in other lactic acid bacteria. In Lc. lactis, CcpA activates the las operon (pfk-pyk-ldh) through cre-dependent control, and disruption of ccpA reduces las transcription and increases mixed-acid end products [13]. In L. plantarum, ccpA inactivation also promotes mixed-acid formation under certain conditions [16,17], and in L. delbrueckii subsp. bulgaricus, loss of CcpA decreases activities of key glycolytic and fermentative enzymes, including LDH, consistent with reduced lactate production [18]. The magnitude of the flux redistribution observed in H. coagulans—with lactate yield declining from 0.95 to 0.17 g/g and marked increases in acetate and formate—suggests that this thermotolerant species is particularly dependent on CcpA-mediated regulation to sustain a homolactic metabolic state under the tested conditions.
This trade-off—CCR relief versus preservation of lactic acid yield—has direct implications for strain design. While complete removal of CcpA improves mixed-sugar utilization, the accompanying reduction in lactate yield is undesirable for industrial lactic acid production. Several engineering directions could help decouple these traits: (1) Targeted cre-site engineering to relieve CCR selectively. Mutating or deleting cre sites associated with xylose utilization genes (e.g., xylA, xylB) could reduce CCR on pentose catabolism while preserving CcpA-dependent activation of lactate-associated loci (e.g., ldhL), if such activation depends on specific cre architecture; (2) Tunable ccpA expression for phase-dependent control. Implementing an inducible or growth-phase-responsive promoter to modulate ccpA expression could enable low CcpA activity during early mixed-sugar uptake (supporting co-utilization), followed by increased CcpA activity during production to restore high lactate flux; (3) Reinforcement of homolactic flux in a CCR-relieved background. In the ΔccpA background, expressing ldhL from a strong CcpA-independent promoter and/or downregulating mixed-acid branch genes (e.g., pflB, ackA) via promoter replacement, CRISPRi, or other transcriptional control could potentially recover lactate yield while maintaining improved pentose utilization.
From an industrial standpoint, ΔccpA may also be of interest beyond lactic acid as a primary product. Its elevated acetate production at elevated temperature could be advantageous in niche processes where acetate is a desired product or intermediate, or where mixed-acid outputs are intentionally routed into downstream conversion steps. Nonetheless, whether such use cases are economically competitive would require dedicated process optimization and downstream integration analyses.
The enzymatic and transcriptomic datasets jointly support a model in which CcpA promotes homolactic fermentation by activating lactate formation capacity while repressing mixed-acid pathways. ΔccpA showed reduced LDH activity and strongly increased ACK activity (Figure 4), providing a direct biochemical correlate for the altered end-product spectrum. At the transcriptional level, ldhL was downregulated, whereas pflB and ackA were upregulated (Figure 5E), consistent with a reciprocal control logic at the pyruvate branch point. This pattern resembles regulatory principles described in Streptococcus bovis, where CcpA activates ldh and represses pfl through cre-associated interactions [14]. In classical cre-mediated control, cre position relative to the core promoter often influences regulatory outcome, with upstream/overlapping cre sites sometimes associated with activation and downstream cre sites frequently associated with repression [11,12]. Accordingly, it is reasonable to hypothesize that functional cre sites exist near ldhL and mixed-acid branch genes in H. coagulans; however, direct binding evidence is required before assigning direct regulation.
Scale-up fermentation in a 5 L bioreactor confirmed that the phenotypes observed at smaller scale persist under controlled conditions (Figure 6; Table 1 and Table 2). Carbon balance analysis showed that most carbon in the wild type was routed to lactate, whereas ΔccpA redistributed carbon toward acetate, formate, and ethanol, with high overall carbon recovery supporting the reliability of the analytical measurements. Together, these results underscore that CcpA is a key determinant of product specificity in H. coagulans and is required to maintain robust L-lactic fermentation under the tested bioreactor conditions. This conclusion is consistent with previous reports of high-performance L-lactic acid production by H. coagulans (high titers and yields) under optimized processes [5].
Several questions remain. First, although the transcriptomic patterns are consistent with CcpA-dependent regulation, direct CcpA–cre interactions should be validated using electrophoretic mobility shift assays (EMSA) and/or chromatin immunoprecipitation sequencing (ChIP-seq) to distinguish direct from indirect effects and to define the CcpA regulon in H. coagulans. Second, the upstream signaling layer controlling CcpA activity—particularly the role of HPr kinase/phosphorylase (HprK/P) and HPr(Ser46) phosphorylation—remains to be elucidated in this organism. Third, the current RNA-seq design captures a single time point (18 h), and some observed differences may reflect secondary responses to divergent metabolic states. Time-resolved transcriptomics across growth and production phases, combined with direct binding assays, would enable a more precise causal model of CcpA-dependent regulation. Ultimately, such mechanistic insight should facilitate rational engineering of H. coagulans strains that simultaneously (i) co-ferment lignocellulose-derived mixed sugars efficiently and (ii) maintain high-yield, optically pure L-lactate production.
Supplementary Materials
The following supporting information can be downloaded at: https://www.mdpi.com/article/10.3390/fermentation12030150/s1, Table S1: Primers used for the construction and verification of ccpA knockout strain in this study.
Author Contributions
Conceptualization, J.Y. and P.L.; methodology, J.Z. and S.W.; validation, J.Y. and J.Y.; formal analysis, J.Y. and P.L.; investigation, M.L.; resources, S.W.; data curation, J.Y. and P.L.; writing—original draft preparation, J.Y. and P.L.; writing—review and editing, M.L.; visualization, J.Y., C.W. and D.W.; supervision, D.Z. and S.W.; project administration, C.W. and M.L.; funding acquisition, M.L. All authors have read and agreed to the published version of the manuscript.
Funding
This research was funded by the Open Research Fund Program of Key Laboratory of Cosmetic, China National Light Industry, Beijing Technology and Business University (KLC-2022-YB2).
Institutional Review Board Statement
Not applicable.
Informed Consent Statement
Not applicable.
Data Availability Statement
The dataset supporting the conclusions of this article are available in the NCBI repository, accession number PRJNA 1399367. The GenBank accession number for the gene involved in this study is Heyndrickxia coagulans ATCC 7050 NCBI RefSeq assembly GCF_000832905.1.
Acknowledgments
During the preparation of this manuscript, the author(s) used Doubao, 12.2.3 for the purposes of generated various elements and combined them together. The authors have reviewed and edited the output and take full responsibility for the content of this publication.
Conflicts of Interest
The authors declare no conflicts of interest.
References
- Abdel-Rahman, M.A.; Tashiro, Y.; Sonomoto, K. Recent advances in lactic acid production by microbial fermentation processes. Biotechnol. Adv. 2013, 31, 877–902. [Google Scholar] [CrossRef]
- Auras, R.; Harte, B.; Selke, S. An overview of polylactides as packaging materials. Macromol. Biosci. 2004, 4, 835–864. [Google Scholar] [CrossRef]
- Wee, Y.J.; Kim, J.N.; Ryu, H.W. Biotechnological production of lactic acid and its recent applications. Food Technol. Biotechnol. 2006, 44, 163–172. [Google Scholar]
- Ou, M.S.; Ingram, L.O.; Shanmugam, K.T. L-(+)-Lactic acid production from non-food carbohydrates by thermotolerant Bacillus coagulans. J. Ind. Microbiol. Biotechnol. 2011, 38, 599–605. [Google Scholar] [CrossRef]
- Oliveira, R.A.; Komesu, A.; Rossell, C.E.V.; Maciel Filho, R. High-titer and productivity of L-(+)-lactic acid using exponential fed-batch fermentation with Bacillus coagulans arr4. Biotechnol. Rep. 2018, 19, e00279. [Google Scholar] [CrossRef]
- Patel, M.A.; Ou, M.S.; Harbrucker, R.; Aldrich, H.C.; Buszko, M.L.; Ingram, L.O.; Shanmugam, K.T. Isolation and characterization of acid-tolerant, thermophilic bacteria for effective fermentation of biomass-derived sugars to lactic acid. Appl. Environ. Microbiol. 2006, 72, 3228–3235. [Google Scholar] [CrossRef]
- Görke, B.; Stülke, J. Carbon catabolite repression in bacteria: Many ways to make the most out of nutrients. Nat. Rev. Microbiol. 2008, 6, 613–624. [Google Scholar] [CrossRef]
- Huang, X.; Tian, W.; Wang, X.; Qin, J. Time-resolved transcriptomic and proteomic profiling of Heyndrickxia coagulans during NaOH-buffered L-lactic acid production. Front. Microbiol. 2023, 14, 1296692. [Google Scholar] [CrossRef] [PubMed]
- An, N.; Chen, X.; Sheng, H.; Wang, J.; Sun, X.; Yan, Y.; Shen, X.; Yuan, Q. Rewiring the microbial metabolic network for efficient utilization of mixed carbon sources. J. Ind. Microbiol. Biotechnol. 2021, 48, kuab040. [Google Scholar] [CrossRef] [PubMed]
- Henkin, T.M.; Grundy, F.J.; Nicholson, W.L.; Chambliss, G.H. Catabolite repression of α-amylase gene expression in Bacillus subtilis involves a trans-acting gene product homologous to the Escherichia coli lacI and galR repressors. Mol. Microbiol. 1991, 5, 575–584. [Google Scholar] [CrossRef] [PubMed]
- Deutscher, J. The mechanisms of carbon catabolite repression in bacteria. Curr. Opin. Microbiol. 2008, 11, 87–93. [Google Scholar] [CrossRef] [PubMed]
- Fujita, Y. Carbon catabolite control of the metabolic network in Bacillus subtilis. Biosci. Biotechnol. Biochem. 2009, 73, 245–259. [Google Scholar] [CrossRef]
- Luesink, E.J.; van Herpen, R.E.M.A.; Grossiord, B.P.; Kuipers, O.P.; de Vos, W.M. Transcriptional activation of the glycolytic las operon and catabolite repression of the gal operon in Lactococcus lactis are mediated by the catabolite control protein CcpA. Mol. Microbiol. 1998, 30, 789–798. [Google Scholar] [CrossRef]
- Asanuma, N.; Yoshii, T.; Hino, T. Molecular characterization of CcpA and involvement of this protein in transcriptional regulation of lactate dehydrogenase and pyruvate formate-lyase in the ruminal bacterium Streptococcus bovis. Appl. Environ. Microbiol. 2004, 70, 5244–5251. [Google Scholar] [CrossRef] [PubMed]
- Muscariello, L.; Marasco, R.; De Felice, M.; Sacco, M. The functional ccpA gene is required for carbon catabolite repression in Lactobacillus plantarum. Appl. Environ. Microbiol. 2001, 67, 2903–2907. [Google Scholar] [CrossRef] [PubMed]
- Zotta, T.; Ricciardi, A.; Guidone, A.; Sacco, M.; Muscariello, L.; Mazzeo, M.F.; Siciliano, R.A.; Parente, E. Inactivation of ccpA and aeration affect growth, metabolite production and stress tolerance in Lactobacillus plantarum WCFS1. Int. J. Food Microbiol. 2012, 155, 51–59. [Google Scholar] [CrossRef]
- Lu, Y.; Song, S.; Tian, H.; Yu, H.; Zhao, J.; Chen, C. Functional analysis of the role of CcpA in Lactobacillus plantarum grown on fructooligosaccharides or glucose: A transcriptomic perspective. Microb. Cell Fact. 2018, 17, 173. [Google Scholar] [CrossRef]
- Li, Y.; Hugenholtz, J.; Abee, T.; Molenaar, D. Effect of the absence of the CcpA gene on growth, metabolic production, and stress tolerance in Lactobacillus delbrueckii ssp. bulgaricus. J. Dairy Sci. 2016, 99, 5155–5161. [Google Scholar] [CrossRef] [PubMed]
- Liang, J.; van Kranenburg, R.; Bolhuis, A.; Leak, D.J. Removing carbon catabolite repression in Parageobacillus thermoglucosidasius DSM 2542. Front. Microbiol. 2022, 13, 985465. [Google Scholar] [CrossRef]
- Sonenshein, A.L. Control of key metabolic intersections in Bacillus subtilis. Nat. Rev. Microbiol. 2007, 5, 917–927. [Google Scholar] [CrossRef]
- Galinier, A.; Haiech, J.; Kilhoffer, M.C.; Jaquinod, M.; Stülke, J.; Deutscher, J.; Martin-Verstraete, I. The Bacillus subtilis crh gene encodes a HPr-like protein involved in carbon catabolite repression. Proc. Natl. Acad. Sci. USA 1997, 94, 8439–8444. [Google Scholar] [CrossRef]
- Stülke, J.; Hillen, W. Regulation of carbon catabolism in Bacillus species. Annu. Rev. Microbiol. 2000, 54, 849–880. [Google Scholar] [CrossRef] [PubMed]
- Hu, J.; Zhang, Z.; Lin, Y.; Zhao, S.; Mei, Y.; Liang, Y.; Peng, N. High-titer lactic acid production from NaOH-pretreated corn stover by Bacillus coagulans LA204 using fed-batch simultaneous saccharification and fermentation under non-sterile condition. Bioresour. Technol. 2015, 182, 251–257. [Google Scholar] [CrossRef]

Disclaimer/Publisher’s Note: The statements, opinions and data contained in all publications are solely those of the individual author(s) and contributor(s) and not of MDPI and/or the editor(s). MDPI and/or the editor(s) disclaim responsibility for any injury to people or property resulting from any ideas, methods, instructions or products referred to in the content. |
© 2026 by the authors. Licensee MDPI, Basel, Switzerland. This article is an open access article distributed under the terms and conditions of the Creative Commons Attribution (CC BY) license.