


Abstract
Pumping stations serve as critical hydraulic infrastructure for water conveyance and irrigation. Sediment deposition in forebays can deteriorate intake flow conditions, increase hydraulic losses, reduce pumping efficiency, and consequently impair the long-term operational performance of pumping systems. To accurately predict sediment deposition in complex three-dimensional flow fields, we developed a dynamics-driven boundary-responsive numerical model that integrates sediment particle dynamics with real-time bed evolution. This model adopts the near-bed vertical velocity of sediment particles as the deposition discrimination criterion and dynamically updates bed topography via a mass-conservation-based boundary response strategy. The proposed method was validated against open-channel experimental data. The simulated flow structures, deposition patterns, and temporal variations in deposition thickness agreed well with the measurements, with average deviations below 4%. Compared with conventional static-boundary numerical methods, the proposed model reproduces the coupled evolution of sediment transport, flow redistribution, and bed deformation with higher fidelity. The developed framework provides an effective numerical tool for sediment deposition prediction and offers practical support for hydraulic structure optimization, maintenance scheduling, and energy-efficient operation of pumping stations with sediment-laden flow.
1. Introduction
Pumping stations are among the most energy-intensive hydraulic infrastructures in large-scale irrigation and water transfer systems. Their hydraulic performance directly determines electricity consumption, operational efficiency, and the long-term sustainability of water delivery. In sediment-laden rivers, sediment deposition in forebays distorts the inlet flow field, elevates hydraulic losses, impairs flow uniformity, reduces pump efficiency, and raises energy consumption and maintenance costs. Therefore, accurate prediction and control of sediment deposition have become essential not only for ensuring operational safety but also for improving the energy efficiency of pumping station systems. The Yellow River, which carries one of the highest sediment loads worldwide, transports nearly 300 million tons of sediment annually, with peak average sediment concentrations approaching 20 kg/m3. Under typical operating conditions, sediment concentrations entering pumping stations commonly range from 8 to 15 kg/m3 [1,2]. Studies have shown that severe sediment deposition can reduce pumping efficiency by 15–30% and, in extreme cases, completely block water intake structures [3]. At present, most pumping stations in the Yellow River diversion irrigation districts suffer from severe forebay sediment deposition. Annual dredging costs account for over 20% of total operation and maintenance expenses. Dredging works typically take 15–30 days during peak irrigation periods, raising operational costs and compromising the stable, energy-efficient operation of irrigation systems [4].
The hydraulic characteristics inside pumping station forebays are governed by highly complex three-dimensional flow structures. Under the combined effects of the diffusion angle, forebay geometry, bed slope, and pump suction, inflow undergoes intense horizontal and vertical diffusion, generating significant velocity gradients, large-scale recirculation zones, and coherent vortex structures near the back of the forebay and the corners of the inlet sump [5,6]. These vortical structures not only increase local hydraulic energy dissipation but also strongly influence sediment entrainment, transport, and deposition. Recent studies have demonstrated that coherent vortices and recirculation regions dominate the residence time and transport pathways of sediment particles, ultimately determining the spatial distribution of sediment deposition [2,7]. The strong interaction between turbulent flow structures and sediment particles results in highly anisotropic transport behavior and dynamically evolving deposition morphology, making quantitative prediction considerably more challenging than that of conventional river sediment transport problems [6].
Current engineering approaches for predicting sediment deposition can generally be divided into two categories, both of which exhibit inherent limitations. The first relies on indirect discrimination using flow velocity or sediment concentration. In these approaches, deposition-prone regions are identified according to critical velocity thresholds (e.g., below 0.3 m/s) or local sediment concentration distributions [8,9]. However, flow velocity primarily represents the horizontal transport capacity of the flow and cannot directly characterize the vertical particle motion responsible for gravitational settling. Likewise, sediment concentration only reflects the instantaneous distribution of suspended particles and cannot distinguish suspended particles from those undergoing deposition. Consequently, these methods exhibit limited correlation with the actual deposition process and provide insufficient accuracy for evaluating the hydraulic performance degradation associated with sediment accumulation. Experimental investigations have further demonstrated that sediment deposition within recirculation zones is jointly controlled by turbulence intensity, vortex residence time, and particle settling dynamics rather than by a single hydraulic parameter [10].
The second category adopts one-dimensional suspended-load riverbed deformation models derived from classical river dynamics [11,12]. These methods determine deposition evolution using cross-sectionally averaged flow velocity and sediment transport capacity, fundamentally simplifying the inherently three-dimensional forebay flow into a one-dimensional hydraulic problem. Such simplifications neglect lateral currents, secondary circulation, coherent vortices, and other essential flow characteristics governing sediment transport in pumping station forebays, leading to considerable deviations in predicting deposition boundaries. In addition, particle-settling models originating from fluidized-bed engineering, such as minimum fluidization velocity and void-fraction criteria [13,14], generally rely on macroscopic threshold parameters and ignore the continuous two-way interaction between evolving bed morphology and surrounding flow fields. Although recent studies have attempted to identify universal sediment-control mechanisms by analyzing forebay flow patterns, these findings remain largely qualitative and cannot accurately predict dynamically evolving deposition boundaries or quantify their influence on hydraulic losses and pumping efficiency under varying operating conditions [15].
With the rapid development of computational fluid dynamics (CFD), high-resolution numerical simulation has become an indispensable tool for investigating flow characteristics, hydraulic performance, and sediment transport processes in complex pumping systems. Compared with traditional empirical approaches, CFD enables detailed resolution of three-dimensional flow structures and provides an effective framework for evaluating hydraulic losses and supporting energy-efficient operation. Nevertheless, the reliability of numerical predictions still depends on robust physical modeling, rigorous verification, and accurate representation of sediment–flow interactions [16]. Existing numerical methods still cannot simultaneously capture the coupled features of highly three-dimensional turbulent flow, dynamic bed deformation, continuously evolving boundaries, and two-way flow–sediment interaction in pumping station forebays.
Existing numerical methods for forebay sediment deposition generally have two main limitations. First, most deposition criteria are indirect, relying on parameters such as Shields number or bed shear stress, which require empirical parameter calibration and introduce additional uncertainty [17]. Second, conventional dynamic bed updating methods either reconstruct the mesh at every time step, leading to high computational cost and potential numerical instability for long-term simulations [18], or use fixed immersed boundaries which sacrifice geometric accuracy [19]. To address these limitations, this study develops a particle-dynamics-driven, boundary-responsive numerical model for sediment deposition in pumping station forebays. The proposed approach introduces a direct particle-settling discrimination criterion based on vertical particle velocity, together with a dynamically updated bed boundary based on sediment mass conservation and the “virtual monitoring-physical updating” coupled mechanism, enabling stable two-way coupling between sediment transport and flow evolution throughout the numerical simulation. This direct criterion avoids empirical parameter errors of indirect methods, while the coupled boundary mechanism balances simulation accuracy and computational efficiency for engineering-scale applications. The model is systematically validated using an open-channel experimental benchmark before being applied to sediment deposition prediction in a typical Yellow River pumping station forebay. The proposed methodology provides a reliable numerical tool for accurate forebay sediment deposition prediction, hydraulic performance assessment, and energy-efficient operation and management of pumping stations in sediment-laden irrigation districts. Compared with conventional dynamic mesh methods that perform mesh reconstruction every few time steps, the proposed virtual monitoring mechanism only triggers local mesh updating when a full grid layer of net deposition accumulates. This significantly reduces the number of mesh reconstruction operations, avoids numerical divergence caused by frequent mesh deformation, and improves stability for long-period engineering simulation of pumping station forebay deposition.
2. Construction of Computational Models
2.1. Three-Dimensional Flow Complexity in Forebays
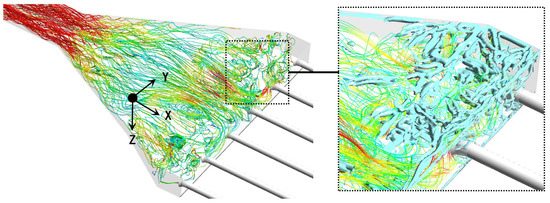
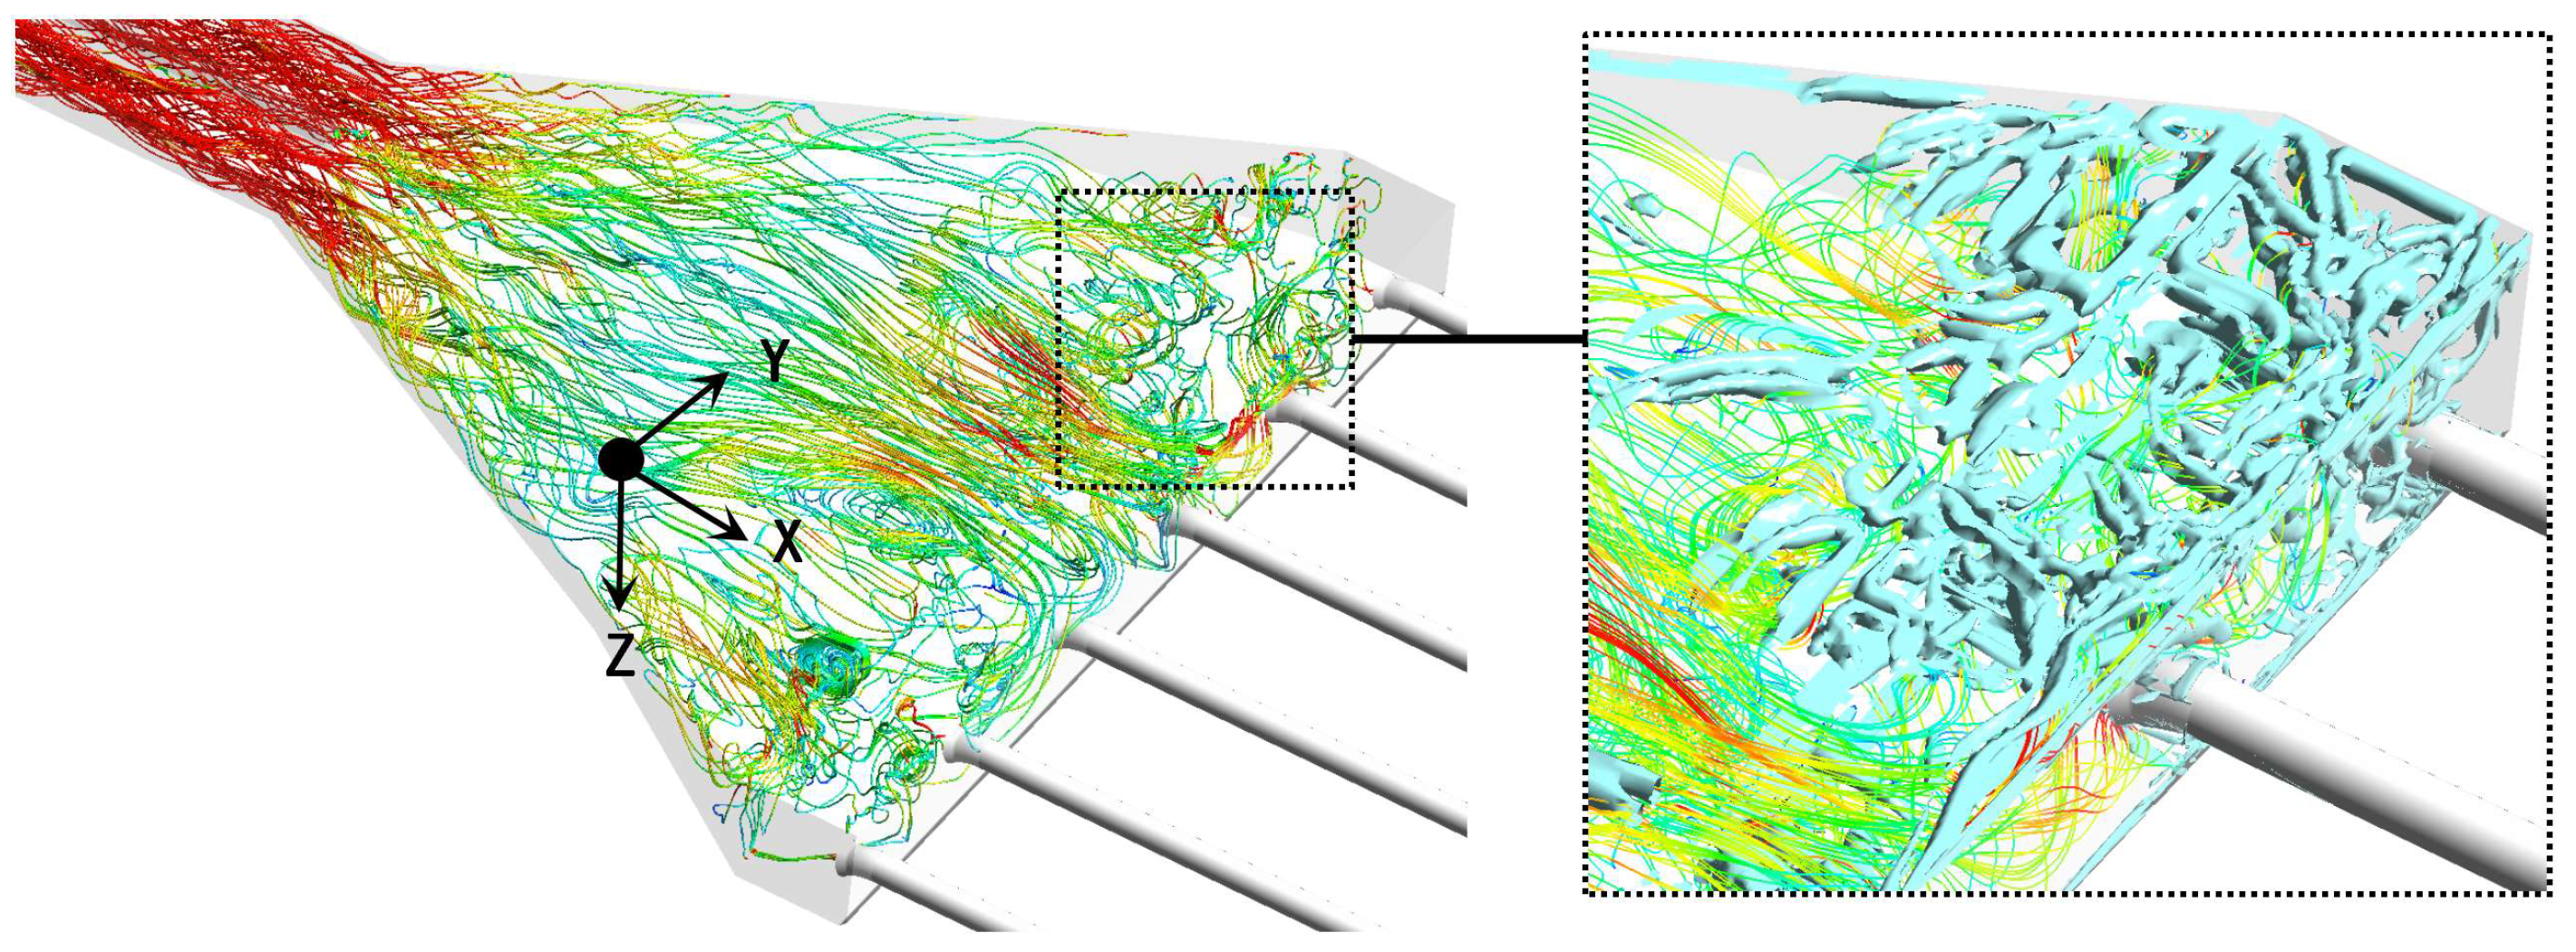
The flow patterns in the forebays of Yellow River pumping stations exhibit pronounced three-dimensional complexity (Figure 1). Under the combined effects of horizontal and vertical diffusion, large-scale vortices form, where streamwise, spanwise, and vertical fluid motions interact, generating non-uniform velocity distributions and intense local turbulence and shear stress. This complex 3D flow directly induces anisotropic sediment transport: regions of low velocity and weak vorticity favor the formation of irregular deposition bodies, while strong shear and vortex regions suppress sediment settling and can even trigger scour.
Figure 1.
Flow pattern diagram of pumping station forebay.
Specifically, the lateral diffusion width of the flow can reach 2–3 times the width of the inlet channel, and strong vertical velocity gradients near the bed form a three-dimensional flow pattern characterized by “lateral spreading and vertical stratification” [20]. Multi-scale vortex structures develop in the rear of the forebay and corner regions of the inlet sump. Large-scale vortices are induced by shear between the main current and the recirculation zone, while small-scale vortices are randomly distributed with turbulent fluctuations. These vortex structures not only alter local flow directions but also impede sediment suspension through the low-kinetic-energy environment within vortex cores, producing a characteristic spatial distribution of sediment that is “concentrated at corners, sparse at the center, and enriched near the bed” [21].
2.2. Core Computational Requirements
According to the aforementioned flow characteristics, four core requirements must be satisfied for engineering sediment deposition calculations in pumping station forebays:
- (1)
- Accurate deposition state discrimination: The criterion must be directly linked to the vertical motion characteristics of sediment particles, distinguishing depositing particles from suspended particles rather than relying on indirect macroscopic flow parameters;
- (2)
- Dynamic deposition height calculation: The model must track in real time the accumulation of depositing particle mass and the reduction of resuspended particle mass, reflecting the physical process of alternating deposition and resuspension.
- (3)
- Bidirectionally coupled boundary evolution: As deposition alters the bed surface morphology, the computational domain boundary must be updated promptly to accurately reflect the feedback effect of deposition on the subsequent flow field.
- (4)
- Computational efficiency and engineering practicality: The model must be embeddable within existing CFD frameworks while maintaining precision, enabling efficient solution of engineering-scale problems.
These four requirements are derived from the physical mechanisms of flow-sediment movement in pumping station forebays and practical engineering demands for sediment prediction. The first requirement addresses the fundamental need for accurate deposition state discrimination, which is the basis of all sediment evolution calculations [6,10]. The second requirement reflects the mass conservation nature of sediment accumulation and erosion, ensuring quantitative accuracy of deposition height calculation, which is a core principle of classical water-sediment mathematical models [11,12]. The third requirement accounts for the two-way coupling between bed deformation and flow field, which is essential for long-term deposition evolution simulation in multiphase sediment-laden flows [15,21]. The fourth requirement considers the computational efficiency required for engineering-scale applications, making the model embeddable in general CFD frameworks and feasible for practical pumping station design and operation [22].
Existing methods are generally able to satisfy only some of these requirements, and none can simultaneously fulfill all four. The dynamics-driven, boundary-responsive model proposed in this paper is constructed precisely around these four core requirements.
2.3. Model Concept
This model was developed based on the physical mechanisms of sediment transport to address three key limitations of conventional models: inaccurate particle motion state discrimination, deposition height calculation inconsistent with physical mechanisms, and delayed boundary response that distorts simulation results.
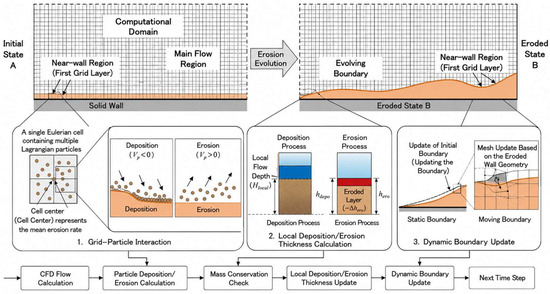
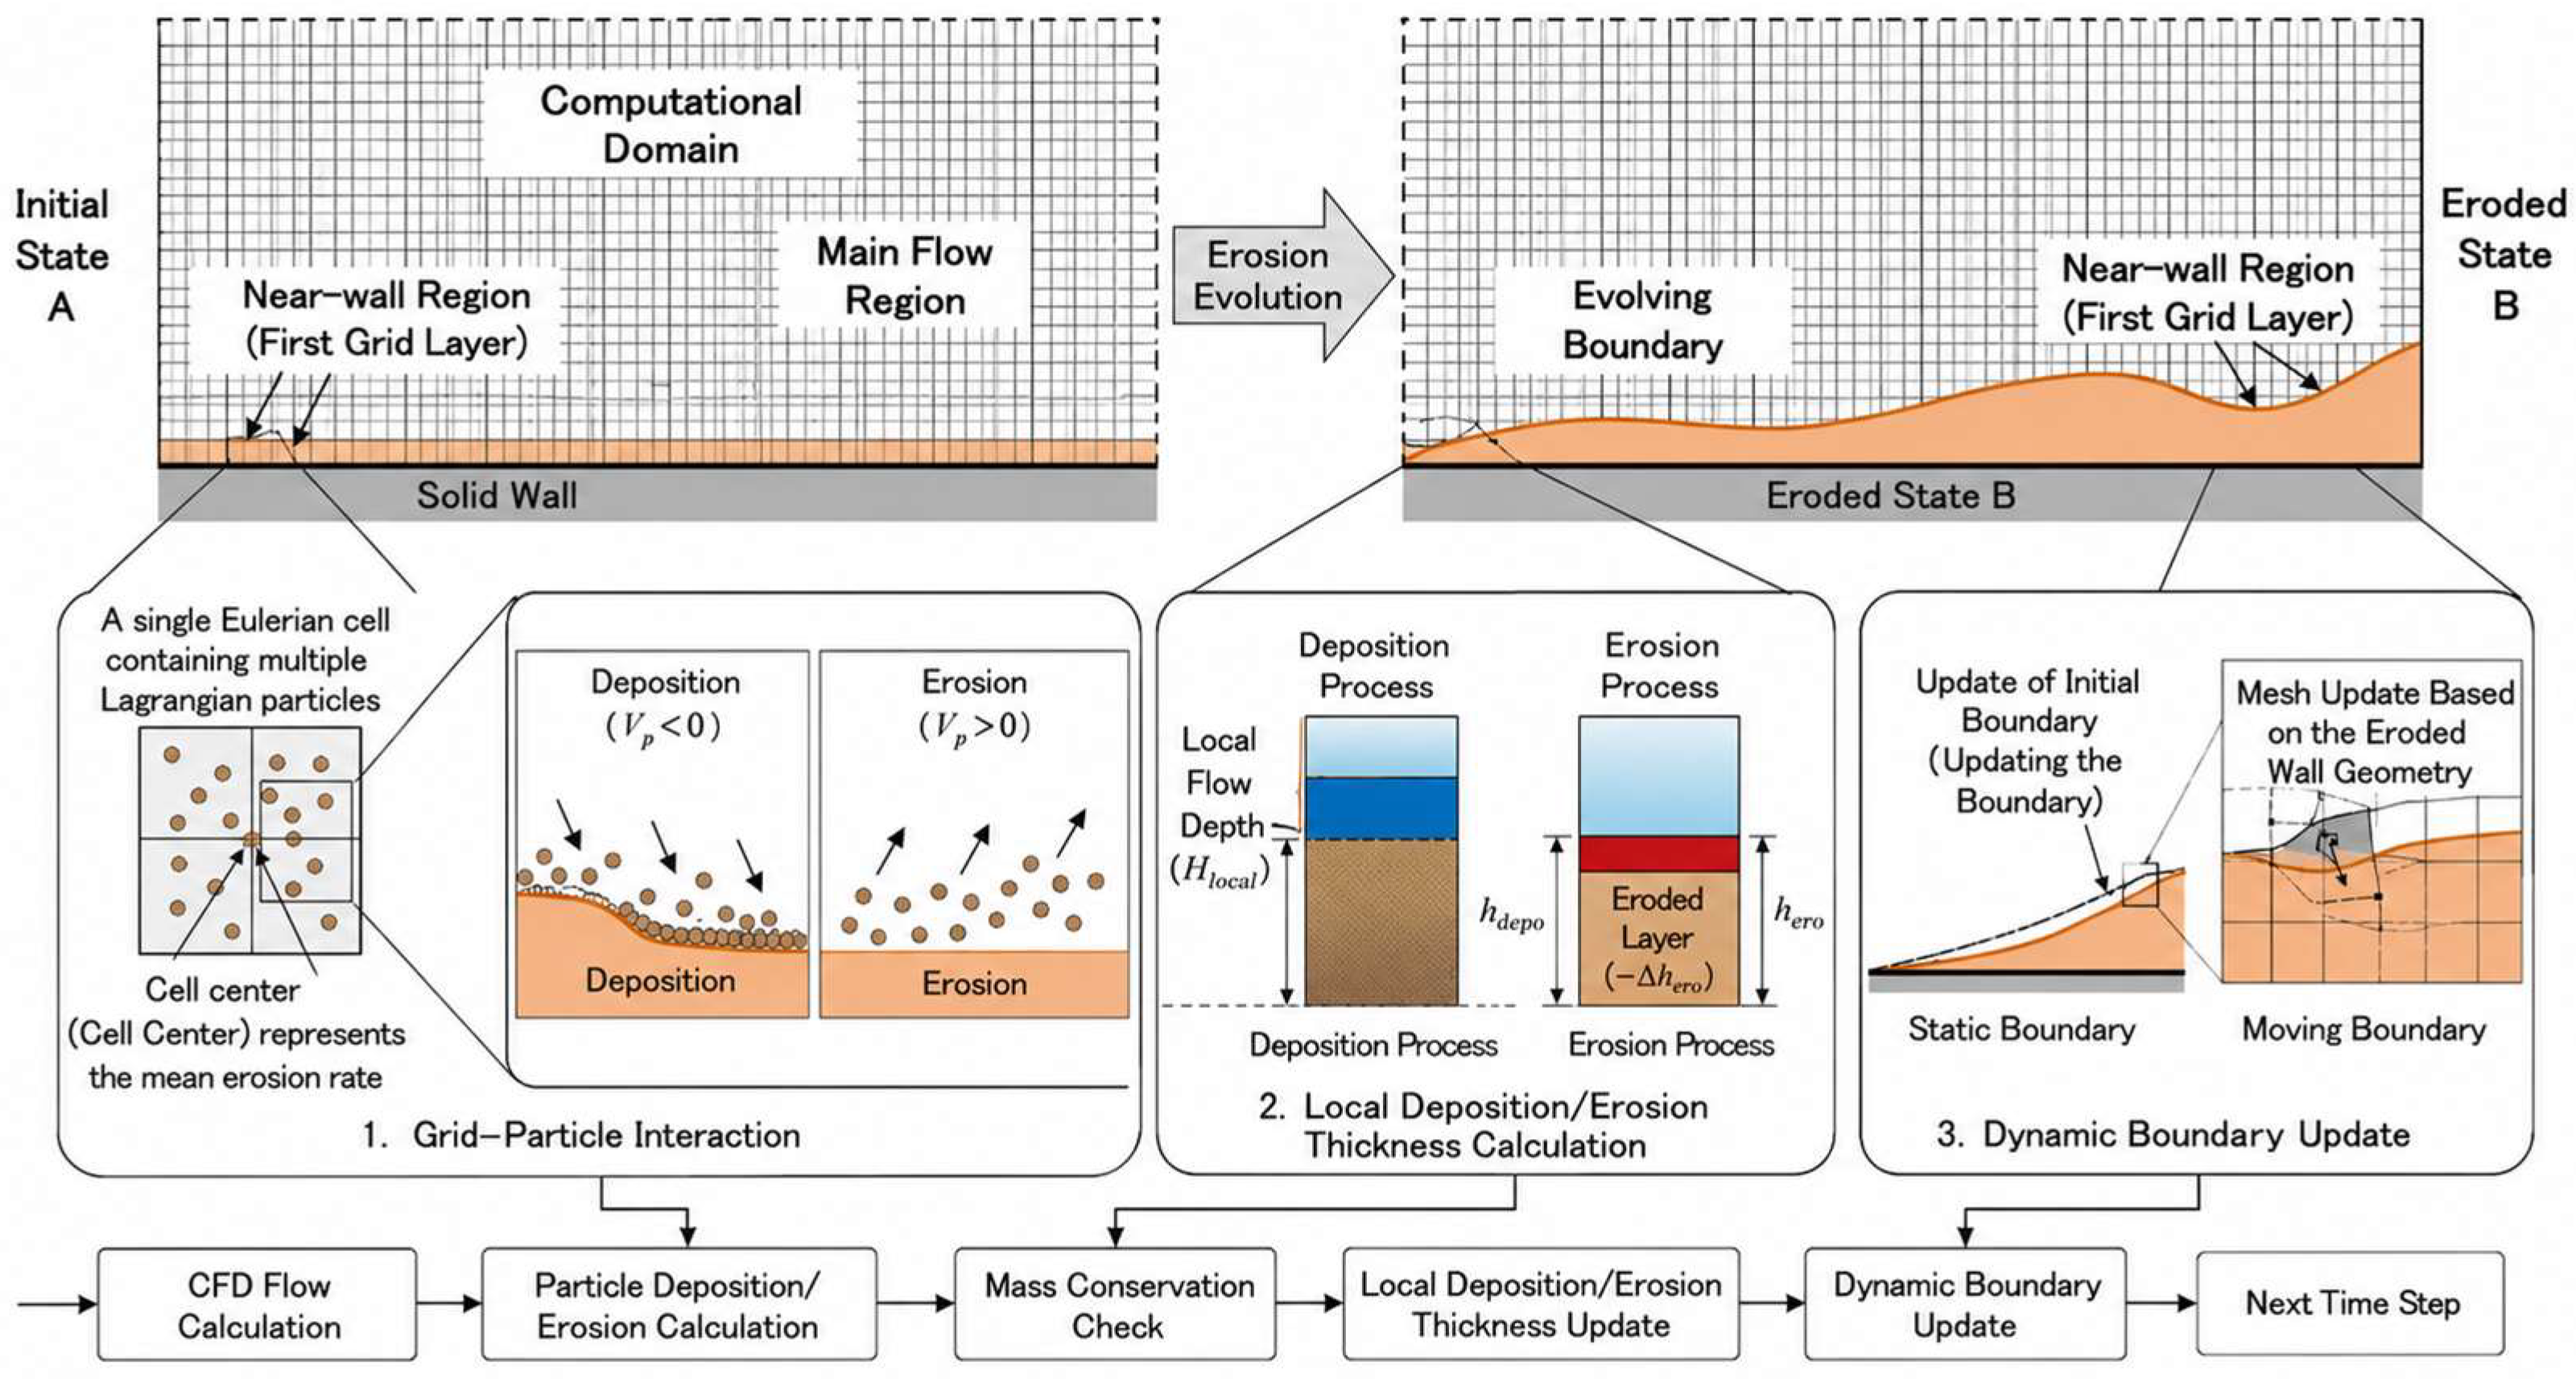
In complex pumping station flow environments, sediment particle motion is directly driven by flow field characteristics; deposition and resuspension are direct responses to flow parameters, while accumulated deposition exerts a feedback effect on the flow field boundary by altering the cross-sectional geometry and thus redistributing the flow and sediment trajectories. Based on this principle, the model takes flow field parameters from the first grid layer above the deposition bed as direct inputs for sediment motion state discrimination, ensuring good consistency between the discrimination results and the actual particle motion trend, while fully considering the boundary deformation feedback induced by sediment deposition. This achieves dynamic coupling among the flow field, sediment, and boundary (Figure 2).
Figure 2.
Schematic diagram of coupling simulation of sediment deposition and boundary evolution in pumping station.
The overall model framework consists of three core modules forming a closed computational loop: deposition discrimination based on particle vertical velocity → dynamic deposition height calculation based on mass conservation → “virtual monitoring–physical updating” coupled boundary mechanism.
2.4. Deposition Discrimination Method Based on Particle Vertical Velocity
The model used the vertical velocity component VZ of the sediment phase at the first grid layer above the deposition bed as the deposition discrimination criterion, which established an explicit physical judgment rule:
From the perspective of physical mechanisms, the motion of sediment particles near the deposition bed arises from the combined effects of gravity, drag force, lift force, and turbulent diffusion force. The dynamic equilibrium of these forces is ultimately and directly reflected in the particle’s vertical velocity. The direction of VZ directly indicates the particle’s tendency of motion in the vertical direction, and its magnitude quantitatively corresponds to the intensity of that motion; it is therefore the most fundamental and direct parameter for characterizing particle motion state.
This direct judgment based on particle vertical motion is consistent with the development trend of modern particle transport simulation, which directly characterizes particle movement state rather than relying on indirect force balance inference [23]. This approach has three advantages over traditional indirect discrimination: (1) It has a direct and unambiguous physical meaning, as it bypasses intermediate force analysis and avoids errors potentially introduced by iterative solutions of force balance equations. (2) The quantitative relationship is simple and efficient—only the sign of the velocity component is needed for the core state determination, with low computational complexity and easy integration into existing CFD frameworks. (3) It provides an accurate basis for deposition quantity calculation by precisely filtering depositing particles in each grid cell, supplying reliable source-term data for subsequent deposition height calculations. It should be noted that this criterion naturally considers both deposition and resuspension (floating up) processes: when the sand-phase vertical velocity VZ in the near-wall first grid is negative, particles are judged to be settling and the deposition height is accumulated; when VZ is positive, particles are judged to be floating up and the accumulated deposition height is deducted. Permanent deposition is judged only when the net accumulated deposition height in a grid cell reaches the height of one complete grid layer, before triggering physical boundary updating. Instantaneous negative vertical velocity is not directly taken as permanent deposition, and short-term downward motion followed by turbulent resuspension is automatically excluded by the net accumulation mechanism. This engineering criterion is validated against open-channel experiment results, showing consistent deposition range and thickness with traditional Shields-based methods, while avoiding empirical parameter calibration.
The “first grid layer near the deposition surface” refers specifically to the near-wall grid of the pumping station forebay floor when there is initially no deposition and always the first computational grid layer above the latest deposition surface as the boundary updates with deposition development. This dynamic reference ensures that the discrimination target always accurately corresponds to the actual sediment–bed interface.
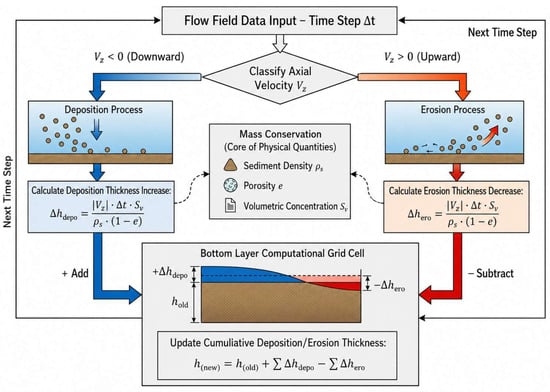
2.5. Dynamic Deposition Height Calculation Based on Mass Conservation
After completing deposition/resuspension state discrimination, the model employs the law of mass conservation to construct a dynamic calculation method for deposition height. Taking the first grid layer near the deposition surface as the computational unit, the model converts the mass of depositing particles per time step into a deposition height increment and subtracts the mass of resuspended particles, forming a dynamic updating mechanism of “deposition accumulation and resuspension reduction”.
The deposition height change Δh for a single grid cell within time step Δt is given by
where VZ is the vertical velocity of the sediment phase (m/s), ρs is the density of the sediment particle phase (kg/m3), Sv is the mass concentration of the sediment particle phase (kg/m3), Δt is the time step (s), and e is the porosity. When VZ < 0, Δh > 0 (deposition height increases); when VZ > 0, Δh < 0 (deposition height decreases). The real-time cumulative deposition height htotal is obtained by summing Δh over all time steps (Figure 3).
Figure 3.
Schematic diagram of sediment deposition height calculation.
It should be noted that this criterion does not take instantaneous negative vertical velocity as permanent deposition. Instead, it uses a mass-conservation-based net accumulation logic: when sand-phase vertical velocity VZ in the near-wall grid is negative, settling mass is added to the deposition counter; when VZ is positive (particles moving upward due to turbulent fluctuation, lift force or shear stress), the accumulated deposition height is automatically deducted. This naturally includes the resuspension/floating up process, and short-term downward motion followed by turbulent resuspension is automatically excluded from permanent deposition.
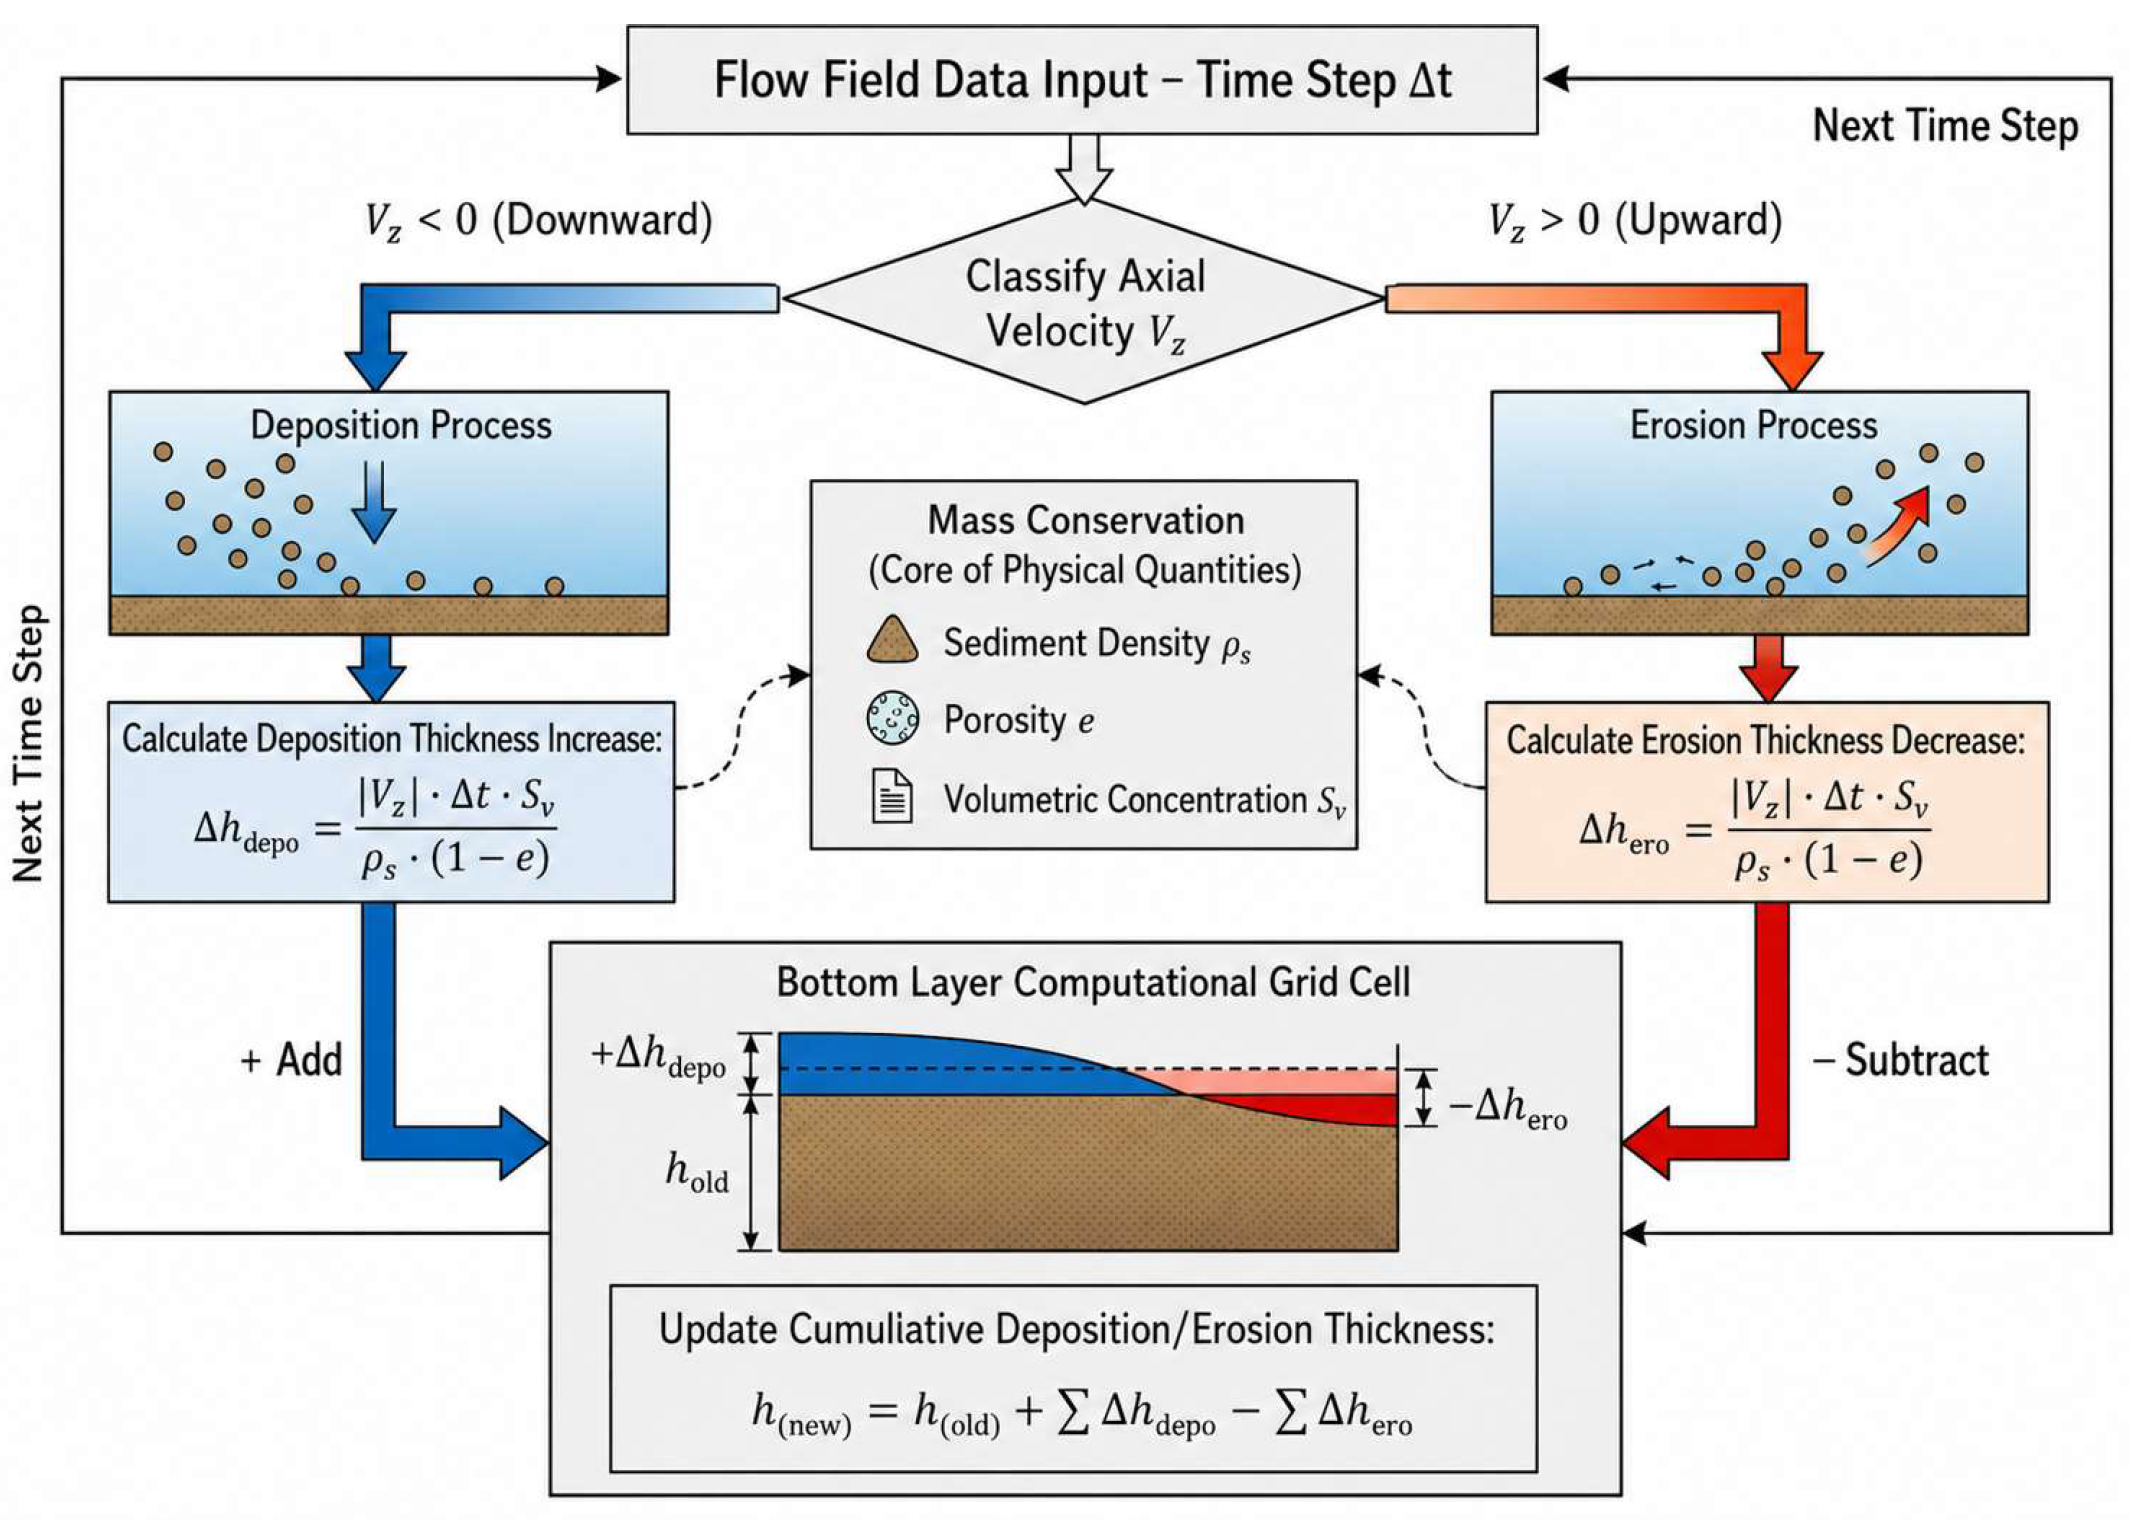
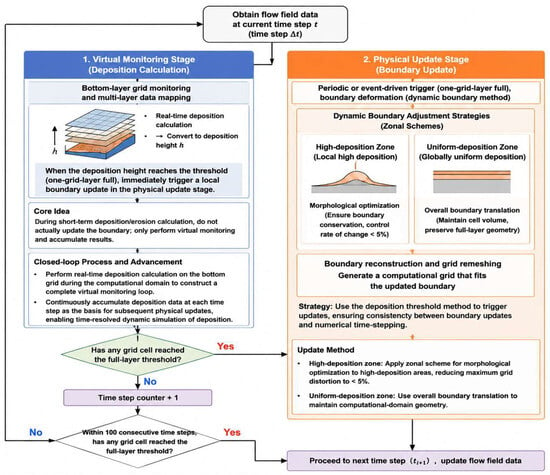
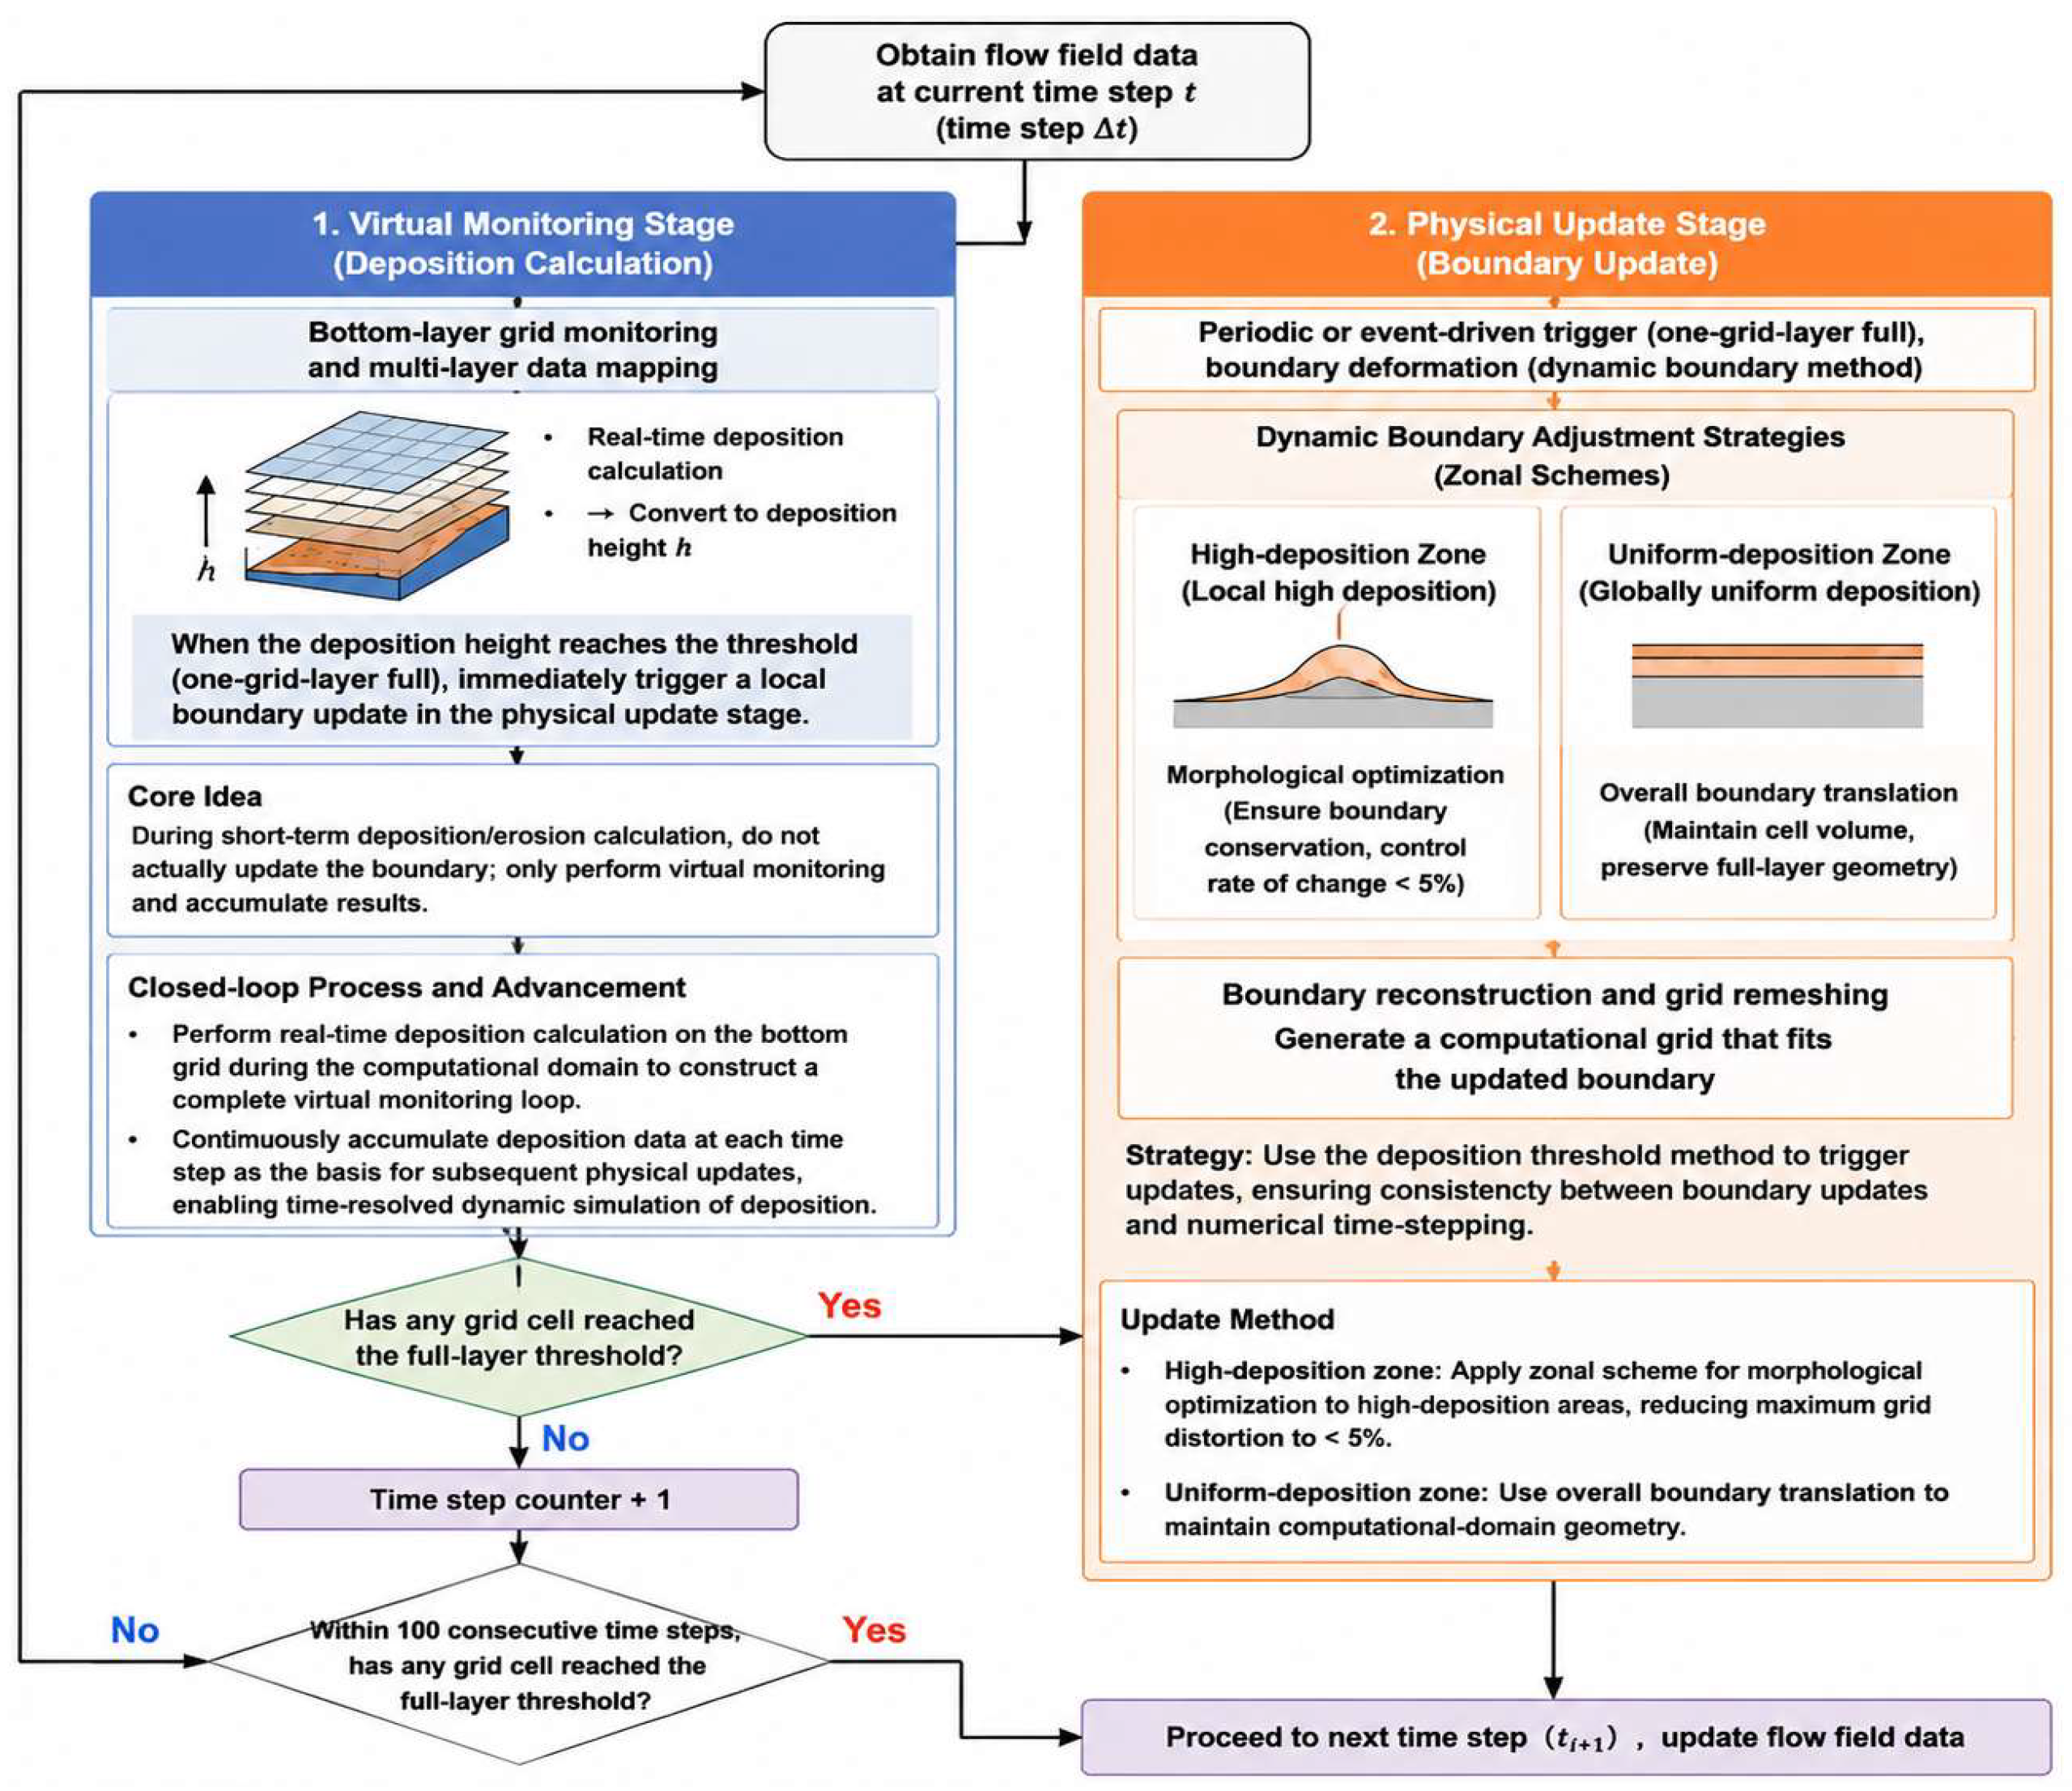
2.6. “Virtual Monitoring–Physical Updating” Coupled Boundary Mechanism
Bed surface morphology changes caused by deposition directly affect the subsequent flow field. If the computational boundary is not updated, the simulated flow field is calculated based on the original or outdated bed geometry, which fails to capture the actual boundary feedback induced by sediment deposition, including cross-sectional contraction and flow deflection. Therefore, dynamic boundary updating is an essential component for ensuring the fidelity of deposition simulations.
To maintain physical fidelity while preserving computational stability, this study proposes a “virtual monitoring–physical updating” coupled boundary mechanism (Figure 4) operating in two coordinated tiers.
Figure 4.
Schematic diagram of boundary deformation treatment.
In this mechanism, the “virtual height” refers to the cumulative deposition thickness recorded in each grid cell during the virtual monitoring stage, which is stored as a computational variable without altering the physical computational domain. The use of virtual monitoring boundaries provides two key advantages: first, it avoids frequent mesh deformation and reconstruction that can cause numerical divergence and computational instability; second, it maintains strict mass conservation of sediment by accumulating deposition quantities continuously across time steps.
Virtual monitoring stage (base tier): Layered grid cells serve as monitoring units, each equipped with a real-time deposition height counter. Sediment settling quantities in each time step are accumulated in real time and converted into instantaneous deposition height h using the grid cell cross-sectional area. No key computational parameters—such as inlet sediment concentration or wall conditions—are modified throughout; only a “virtual” height count is maintained without triggering physical boundary adjustments, thereby avoiding computational domain distortion from frequent updates. When the cumulative deposition height in a given grid cell reaches the threshold corresponding to the full cell height (i.e., “one cell layer filled”), the physical update stage is triggered.
Compared with updating physical boundaries at every time step, the threshold-based updating strategy brings considerable improvements in both computational efficiency and stability. It greatly reduces the frequency of mesh reconstruction operations in typical engineering simulations. Meanwhile, the physical boundary is updated promptly once the deposition height reaches a full grid layer, preserving the accuracy of flow-sediment coupling.
Physical update stage (trigger tier): The physical update stage follows a dual predefined trigger rule: (1) When the cumulative deposition height in any grid cell reaches the full-layer threshold, local boundary updating for that region is initiated immediately. (2) If no grid cell reaches the full-layer threshold within 100 consecutive time steps, a mandatory global boundary update is performed to prevent flow field distortion caused by a long period without boundary updates. Upon triggering, the system generates a refined spatial deposition distribution map based on the accumulated layer information from virtual monitoring and applies a “zone-specific” boundary adjustment strategy: local mesh reconstruction is prioritized for high-deposition zones with grid distortion controlled below 5%, while boundary translation is applied to uniform-deposition zones. After boundary adjustment, the system performs new mesh discretization, designates the bottom-most grid layer of the new boundary as the new virtual monitoring baseline, clears the counters, and enters the next “monitoring–updating” cycle.
It should be noted that the full-layer threshold refers to the height of the first computational grid adjacent to the current deposition surface: when there is no initial deposition, it corresponds to the near-wall grid at the forebay bottom; as deposition develops, it updates with the moving boundary, always corresponding to the first grid layer on the latest deposition surface. The full-layer triggering mechanism is selected to balance simulation accuracy and computational efficiency: too frequent boundary updating (triggered before a full layer accumulates) leads to redundant mesh reconstruction and excessive computational cost for long-period deposition processes; too infrequent updating (triggered after multiple layers accumulate) causes flow field distortion and simulation errors. The full-layer updating scheme is verified to be the optimal choice balancing both engineering accuracy and computational efficiency for long-term pumping station deposition simulation.
The two stages complement each other, forming a closed-loop system of “pre-judgment—precise execution—baseline reset” that achieves coordinated optimization of computational efficiency and simulation accuracy.
For the same simulation case, benchmark tests on identical hardware show that compared with conventional dynamic mesh methods, the proposed virtual monitoring-dynamic updating method improves calculation efficiency by about 20%. This design avoids redundant mesh reconstruction and also prevents numerical divergence caused by frequent large-scale mesh deformation, significantly improving stability for long-period engineering simulation.
2.7. Governing Equations and Numerical Framework
Due to the enormous quantity of fine sand particles per unit volume in Yellow River pumping station forebays, DEM methods that individually track each particle under an Euler–Lagrange framework are computationally prohibitive at engineering scales. This model adopts the Euler–Euler two-fluid model, which treats both the water phase and sand phase as interpenetrating continuous pseudo-fluids. Each phase has its own set of conservation equations, and they share a common pressure field, with inter-phase momentum coupling achieved through inter-phase interaction forces.
The Reynolds-averaged governing equations for water phase and sand phase are as follows [24]:
where q = f denotes the liquid phase (water) and q = s the solid phase (sand); α is the volume fraction with αf + αs = 1; ρ is density; u is the velocity vector; p is pressure; μq is dynamic viscosity; μtq is turbulent viscosity; and Finterphase is the inter-phase interaction force. The inter-phase force accounts for drag, virtual mass force, lift, and turbulent dispersion force. The drag force dominates the momentum transfer between the water and sediment phases; the virtual mass force accounts for the additional force required to accelerate the surrounding fluid as particles accelerate; the lift force arises from transverse velocity gradients acting on particles; and the turbulent dispersion force describes the diffusive effect of turbulent fluctuations on particle motion. Detailed formulations and validation of these force terms can be found in previous multiphase flow studies [24], with drag computed using the classical Wen–Yu model:
In the force balance of sediment particles, FD represents the drag force exerted by the flowing water on sediment particles, which is the primary hydrodynamic force driving particle motion. The drag coefficient is calculated using the Wen–Yu model, which is widely adopted for dilute two-phase flows and has been extensively validated for sediment-laden flow simulations in hydraulic engineering. This model is particularly suitable for the low sediment concentration conditions encountered in Yellow River pumping station forebays, providing accurate prediction of particle-fluid momentum exchange.
Turbulence is closed using the SST k-ω model [22], which combines the advantages of the k-ε and k-ω models. It accurately captures flow separation under strong adverse pressure gradients, achieves high simulation accuracy for large-scale vortex structures in recirculation zones, and is highly suitable for complex forebay flow simulations. Sand-phase turbulent viscosity is determined using the Hinze–Tchen algebraic model.
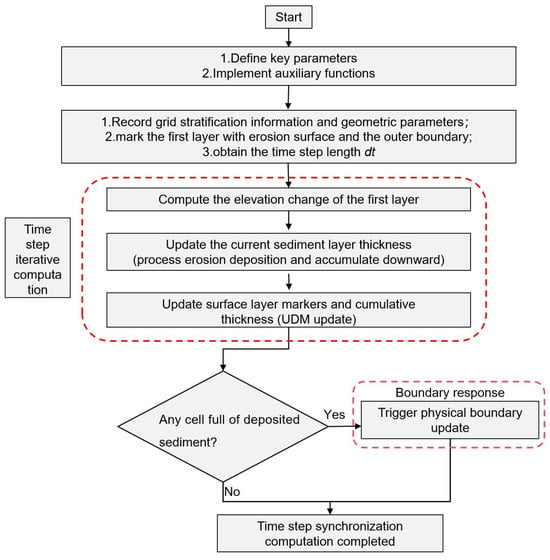
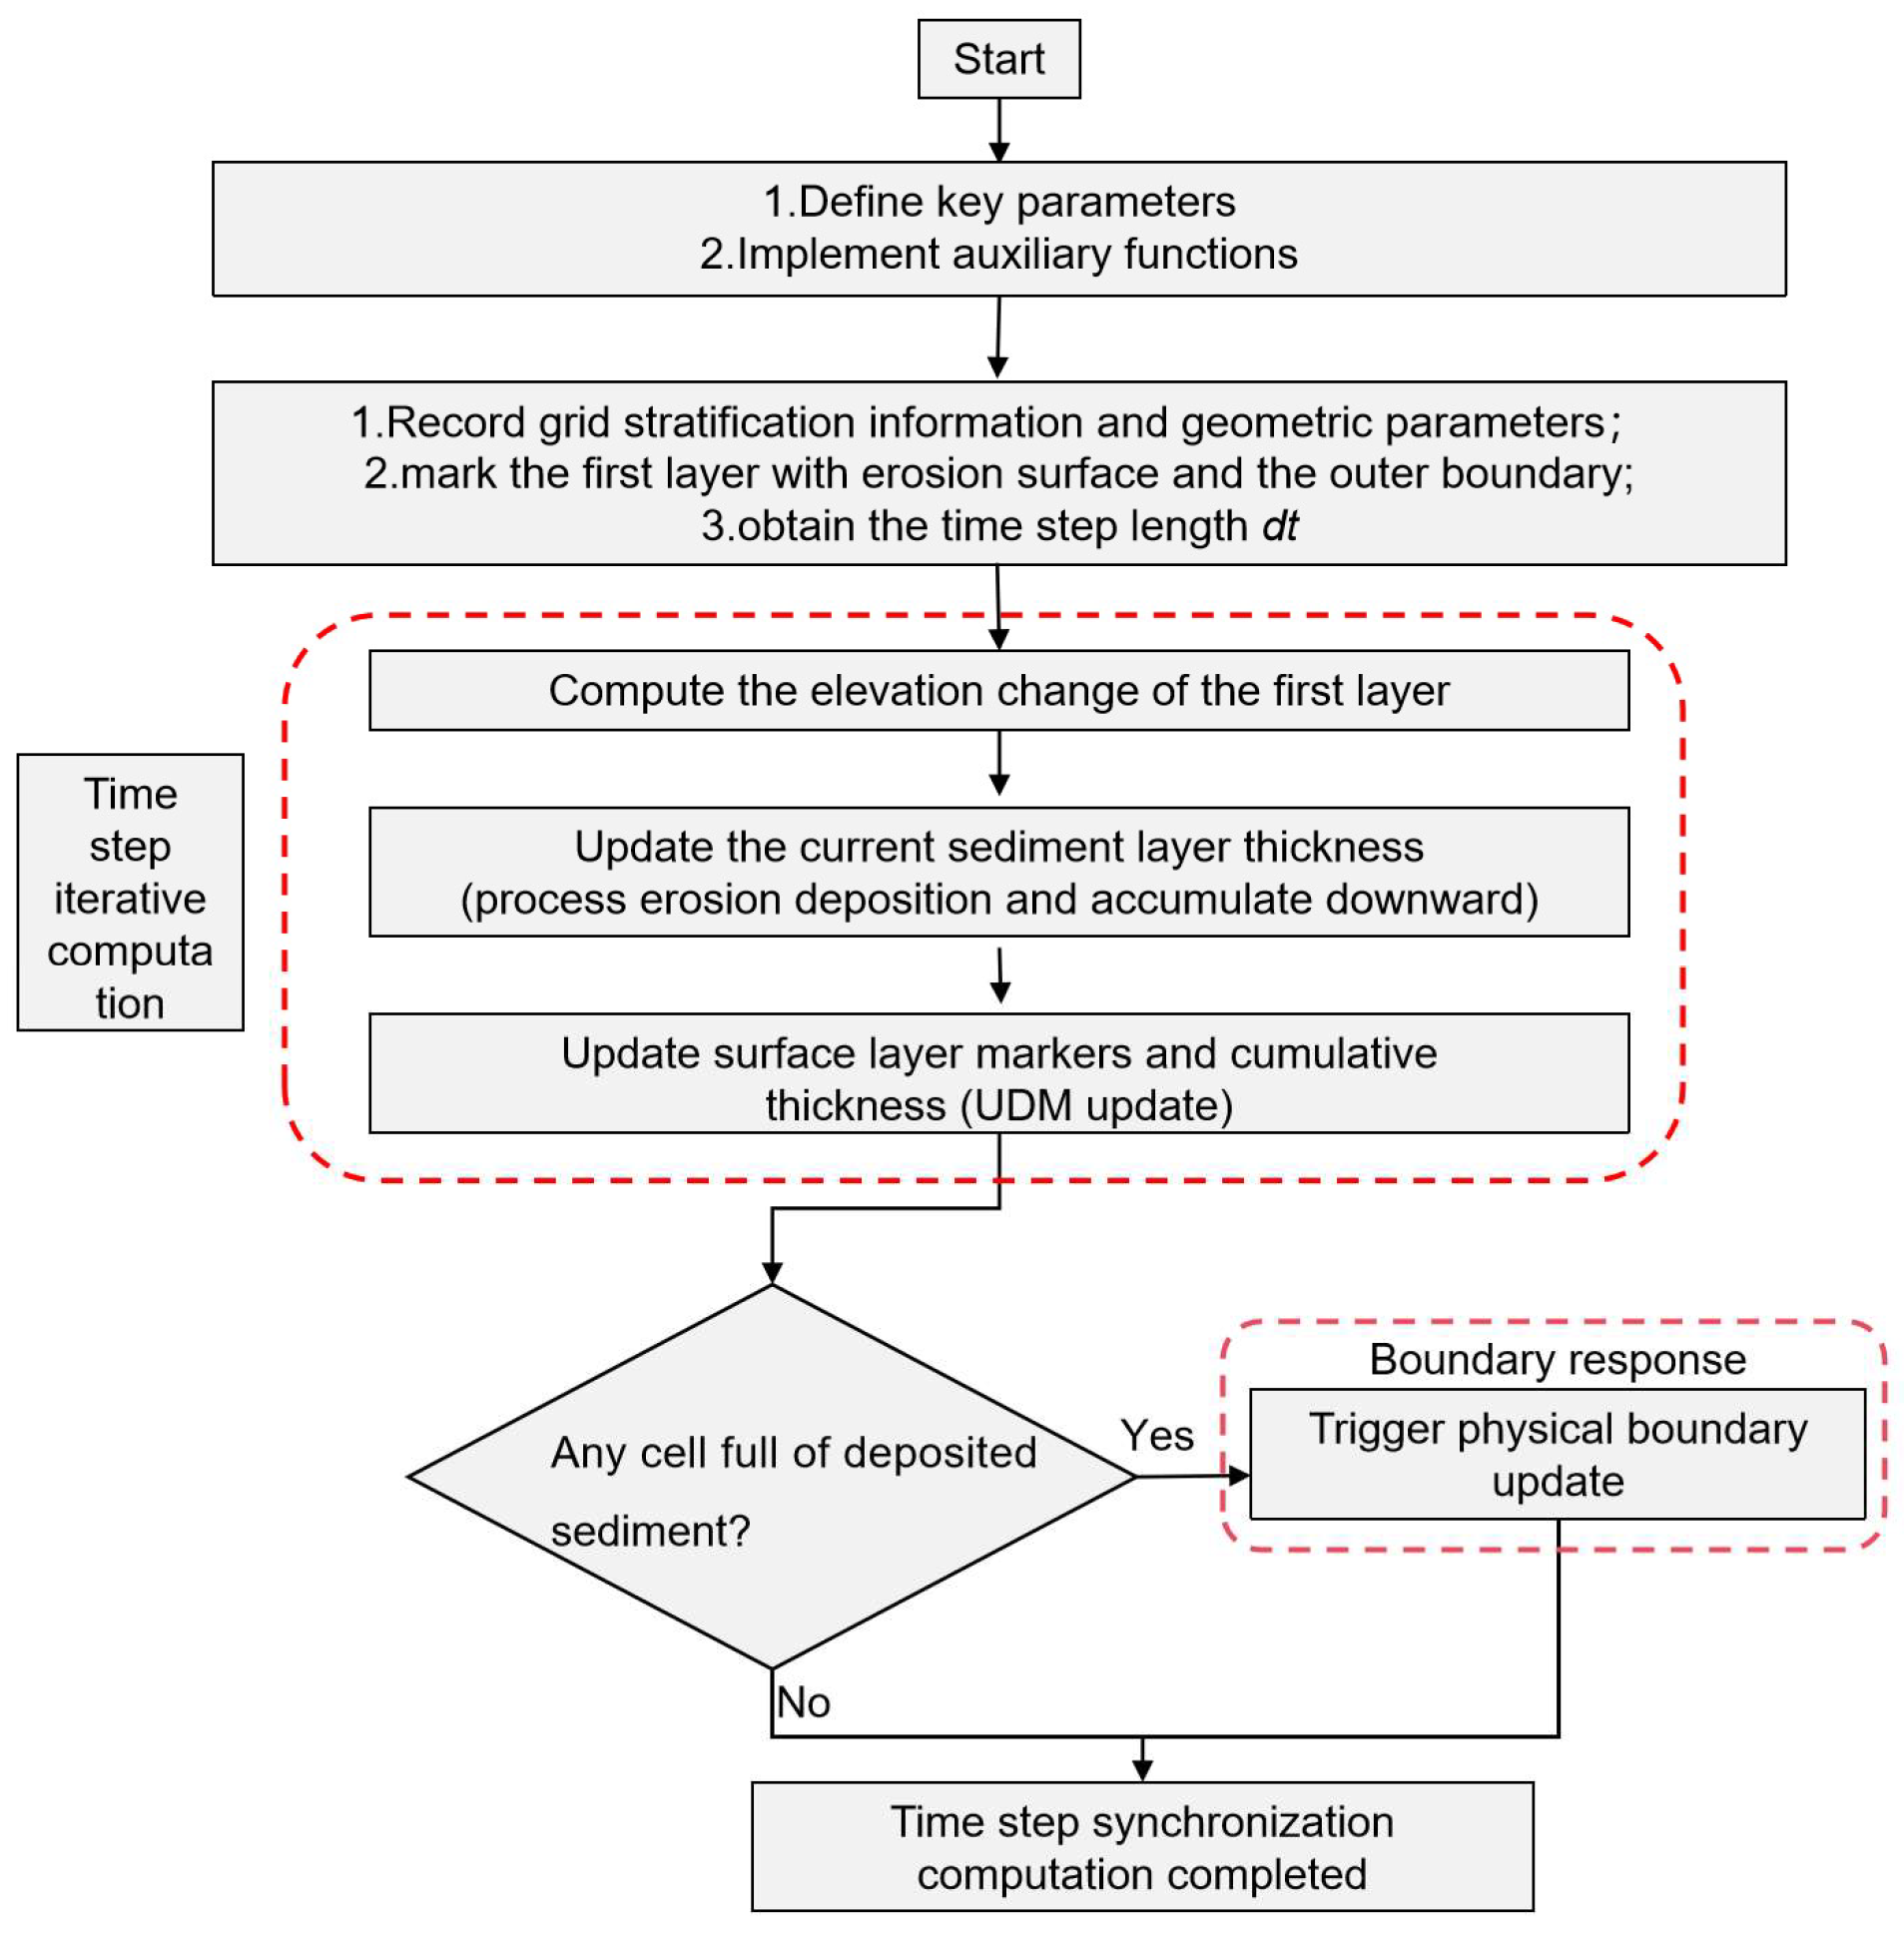
Numerical solutions are obtained using a fully implicit coupled solver. The diffusion terms are discretized with central differencing, the convective terms with the second-order upwind scheme, and the transient terms with second-order Euler backward differencing. The time step Δt is set to 0.1 s, and the convergence criterion is set to 1.0 × 10⁻⁶. The particle vertical velocity discrimination, dynamic deposition height calculation, and coupled boundary mechanism are all implemented as UDF (User-Defined Functions) and can be dynamically linked to existing CFD solvers (e.g., ANSYS Fluent 2021 R1), with low integration cost and good engineering applicability for hydraulic performance evaluation and energy-efficient operation (Figure 5).
Figure 5.
Program framework diagram of dynamic-driven boundary response sediment deposition calculation model.
3. Results
3.1. Selection of Validation Case
In this study, Group 3 from the open-channel sediment deposition test in the shallow water recirculation zone conducted by Wang et al. was selected as the validation case [25]. The rationale is as follows:
- (1)
- High flow-regime similarity: This case simulates a shallow-water recirculation zone downstream of a side pier in an open channel, which is highly consistent with the core flow regime commonly observed in pumping station forebays; both involve sediment deposition driven by a low-velocity recirculation zone.
- (2)
- Comprehensive data: This group provides full temporal data from initial state to deposition equilibrium, covering deposition morphology evolution and longitudinal deposition thickness distribution.
- (3)
- Strong parameter representativeness: The sediment concentration of 25.4 kg/m3 and still-water settling velocity of 0.0593 cm/s are representative of actual hydro-sediment conditions in Yellow River pumping station forebays. The data were acquired using PTV measurement and infrared photoelectric concentration meters, with high measurement accuracy.
3.2. Experimental Setup and Parameters
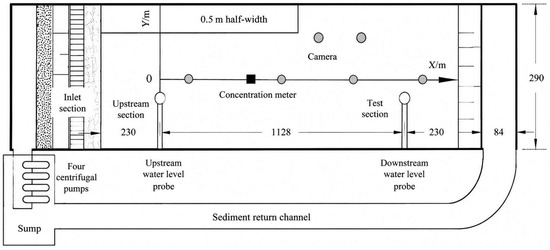
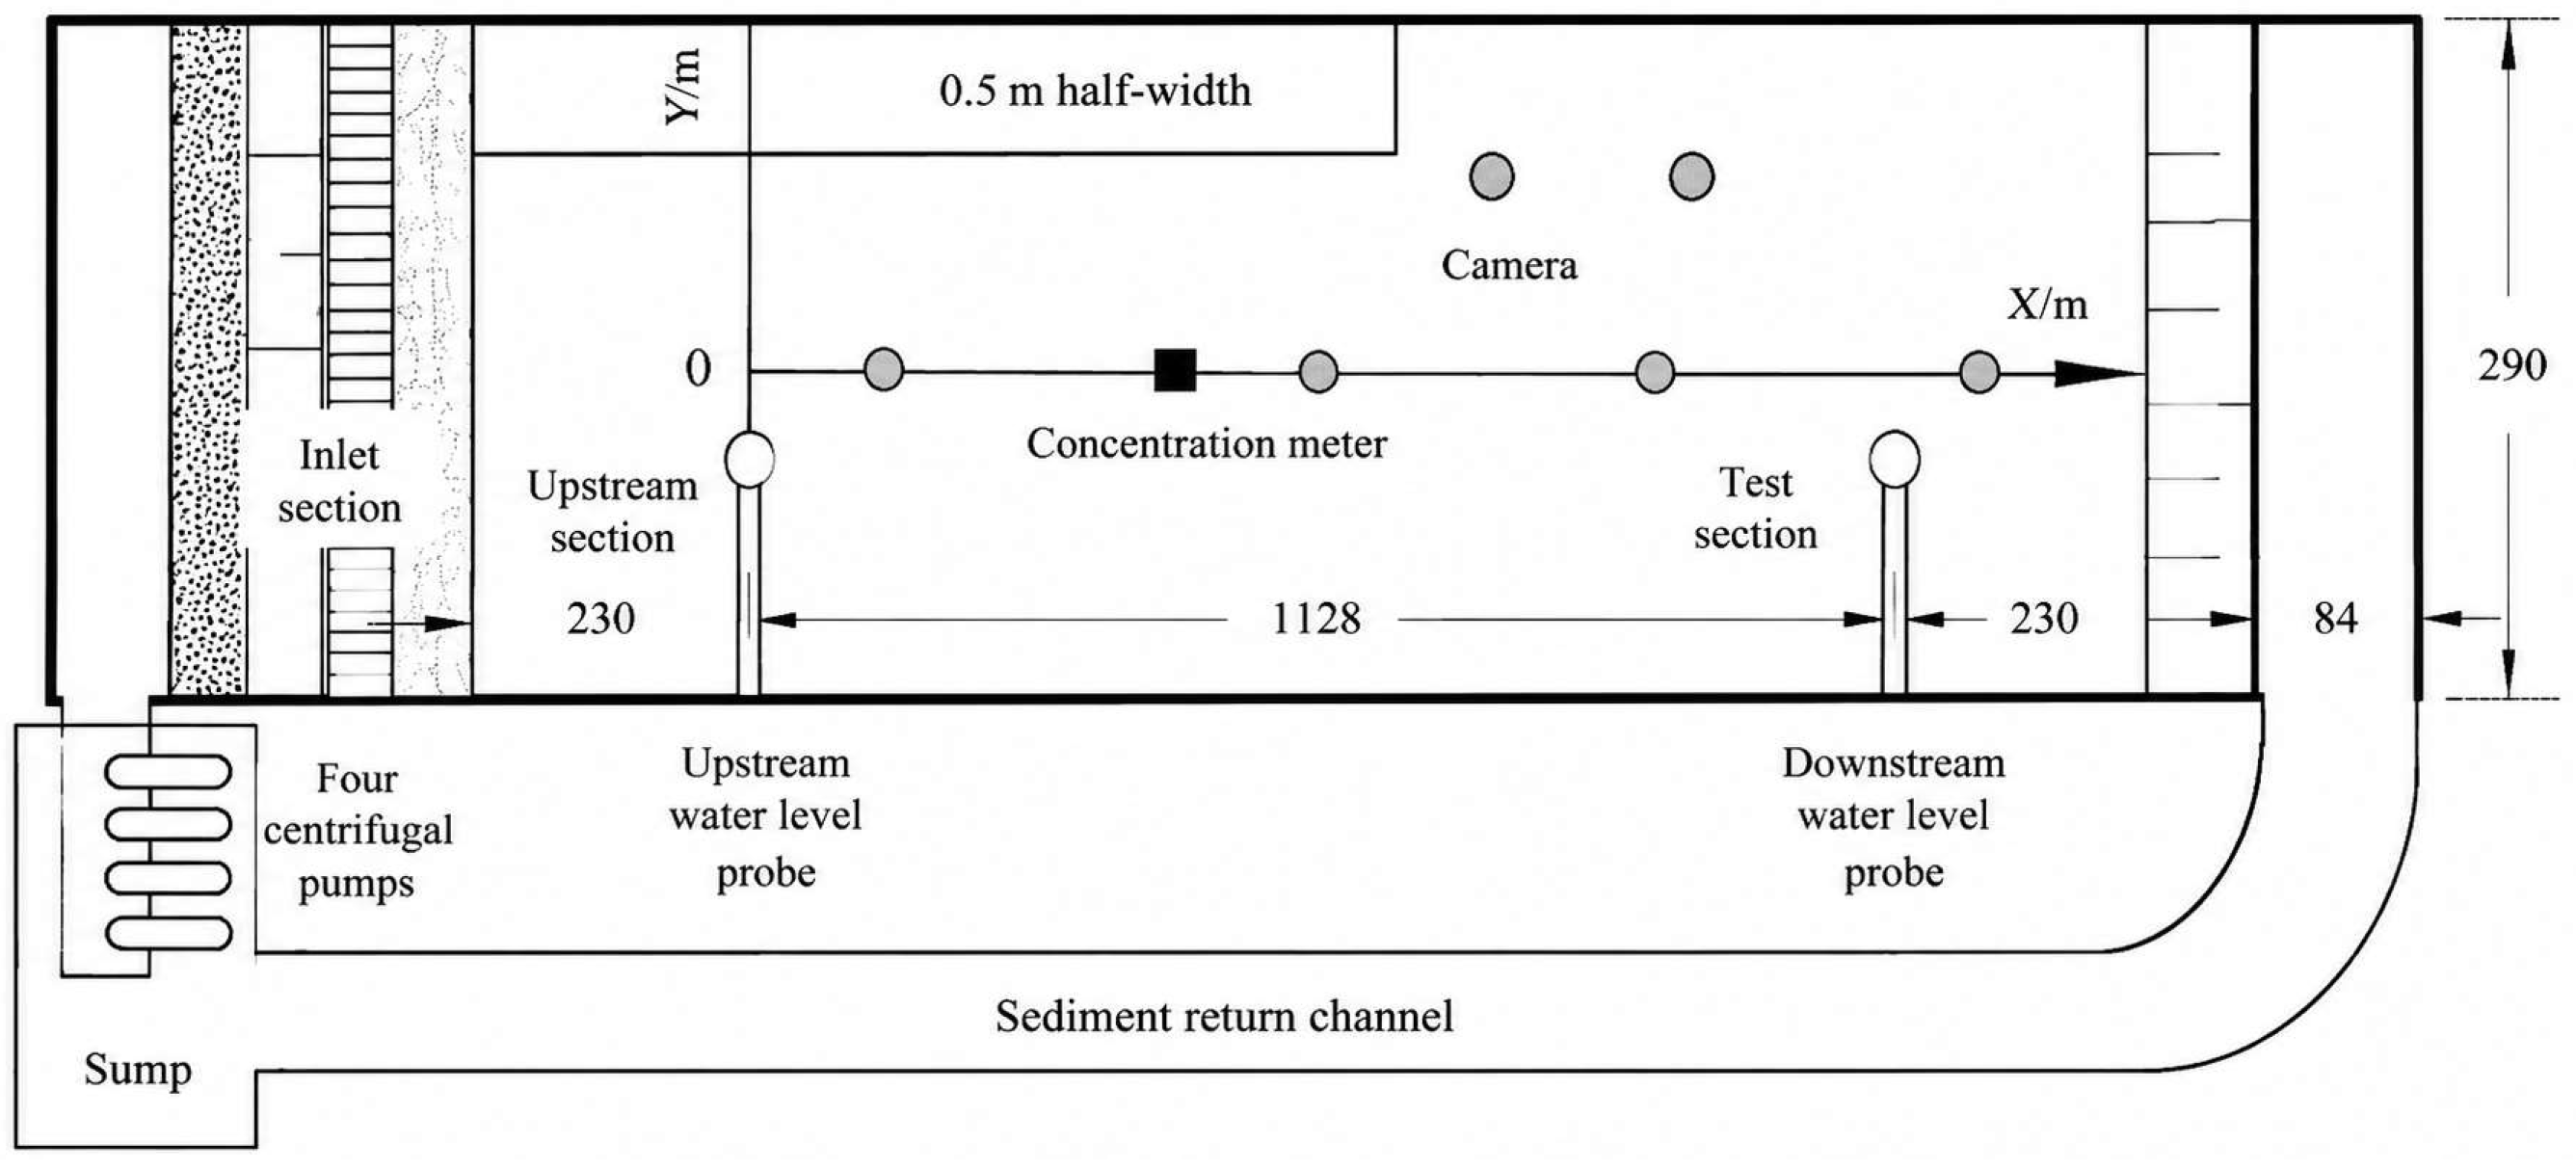
As shown in Figure 6, the experimental setup is an 18.9 m long rectangular open channel with a constant width, a bed slope of 0.0005, and a smooth concrete surface. The model is divided along the flow direction into an inlet section, a transition section, and a test section. A 50 cm wide side pier is installed in the upper-left area of the test section to induce a recirculation zone downstream of the pier, reproducing the flow regime of a pumping station forebay. Basic parameters for the No. 3 test group are listed in Table 1.
Figure 6.
Plan of Experimental Arrangement.
Table 1.
Basic parameters of the No. 3 test group.
3.3. Numerical Simulation Scheme
The downstream region of the side pier is selected for numerical computation, with water depth 0.0366 m, inlet velocity approximately 0.2 m/s, and bed slope 0.0005. The computational domain is spatially discretized using high-quality hexahedral meshes, with particular attention to maintaining y+ values within the allowable range of the turbulence model near walls and the bed.
Grid convergence analysis was performed following the GCI method recommended by the American Society of Mechanical Engineers (ASME) [26], with three mesh schemes, G1, G2, G3, determined in proportion, each with mesh refinement ratios r21 and r32 both approximately 1.3. The recirculation zone mean velocity Vu, recirculation zone length Lc, and bed friction velocity u* at 5 m downstream of the pier are used as evaluation indicators; results are presented in Table 2. This corresponds to a node count ratio of approximately 2.2 between adjacent mesh levels, consistent with the 1.3 grid refinement ratio. The total number of grid nodes for the three schemes are 1.63 million (G1, coarse mesh), 3.59 million (G2, medium mesh), and 7.89 million (G3, fine mesh), respectively. The calculated GCI values for all key variables (recirculation zone length, average deposition thickness, maximum deposition thickness) are below 5%, confirming mesh independence of the simulation results.
Table 2.
Grid convergence analysis results.
The relative extrapolation errors for all variables were below 1%, and the grid convergence index was controlled within 0.72–1.08%, demonstrating sufficient grid convergence and reliability. Considering the balance between computational accuracy and cost, Scheme G2 (with approximately 1.82 million hexahedral cells) was selected for subsequent simulations.
3.4. Flow Field Validation
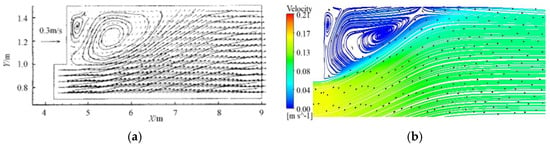
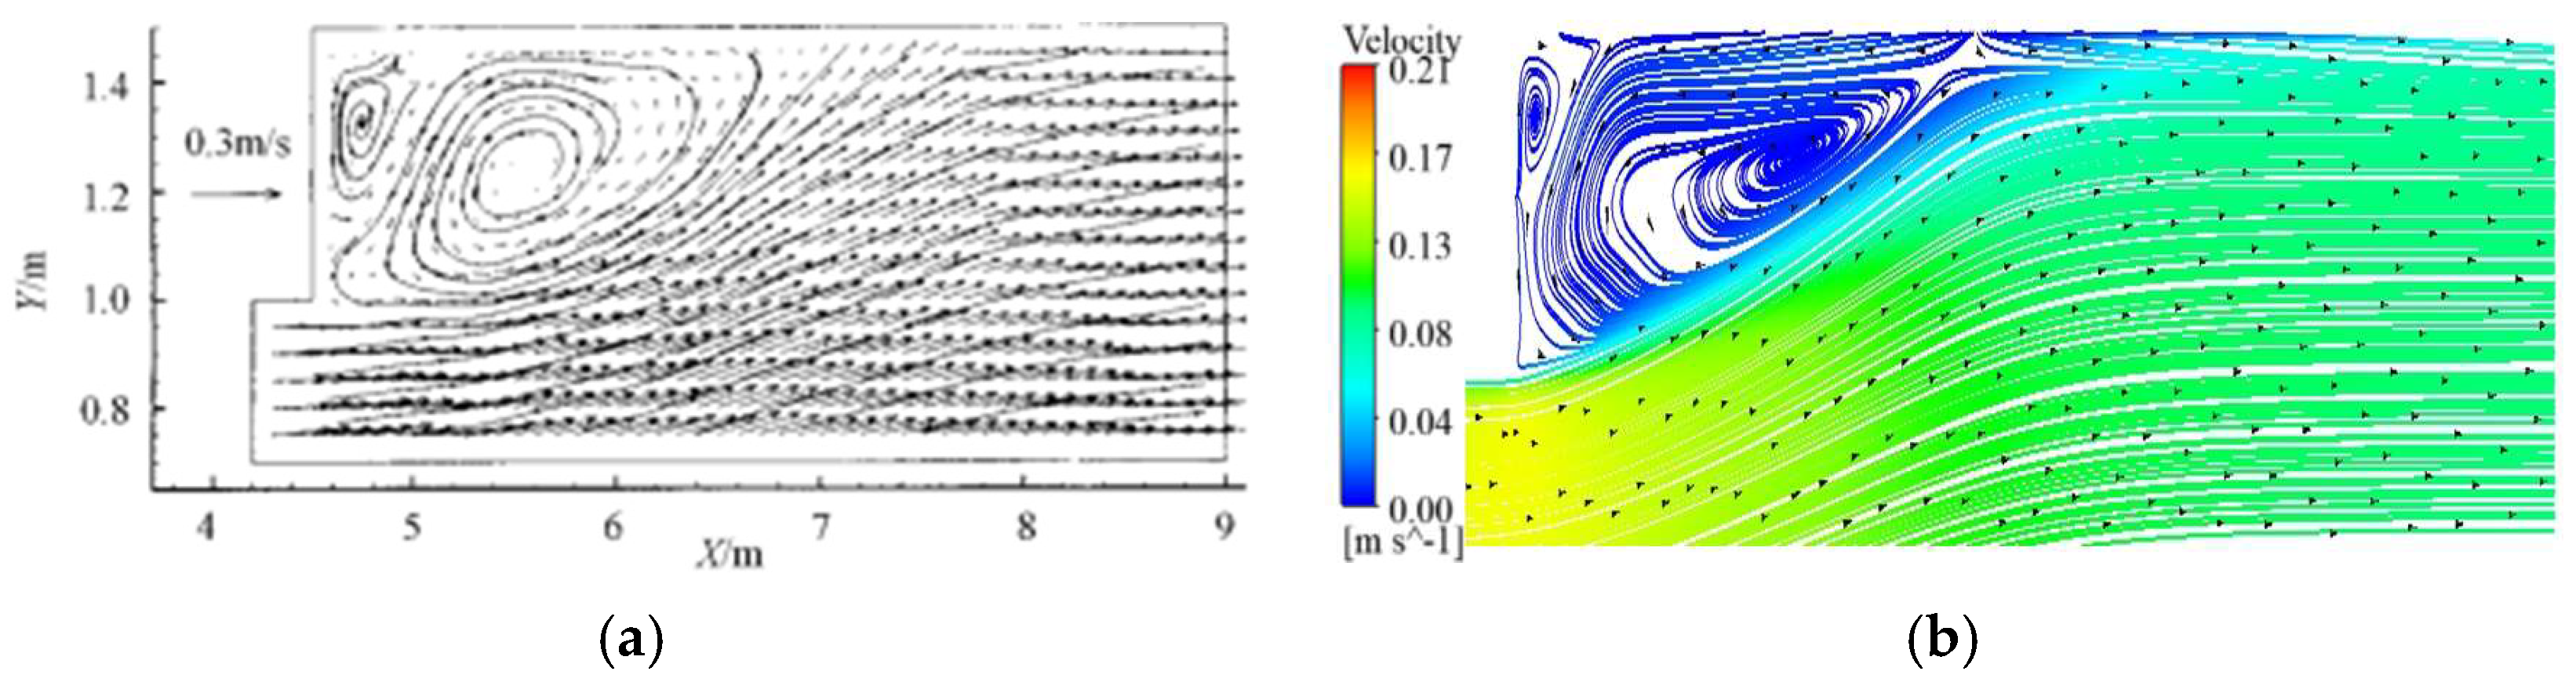
Full transient numerical simulations were carried out for the No. 3 test group using the above scheme. Numerical results were in excellent agreement with experimental measurements (Figure 7): (1) The numerical model accurately reproduces the position and extent of the large-scale counterclockwise recirculation vortex downstream of the side pier; the vortex core location (x ≈ 5.5 m, y ≈ 1.3 m) and the “centripetal convergence” streamline pattern are fully consistent with the experiment. (2) Velocities in the recirculation zone are concentrated in the 0.00–0.04 m/s range, and in the main stream zone in the 0.13–0.21 m/s range, with velocity zone boundaries and gradient transitions consistent with measurements, capturing spatial velocity heterogeneity accurately. (3) The gradual homogenization of main-stream velocity in the flow direction is also consistent with experimental observations. These results confirm that the simulation scheme not only reproduces the macro-scale flow structure but also matches experimental details at the local scale, meeting engineering and research accuracy requirements.
Figure 7.
Velocity distribution in open channel. (a) Experimental velocity distribution. (b) Numerically calculated velocity distribution.
3.5. Deposition Morphology Validation
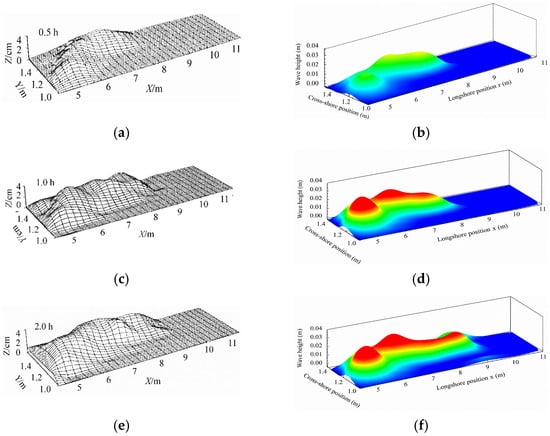
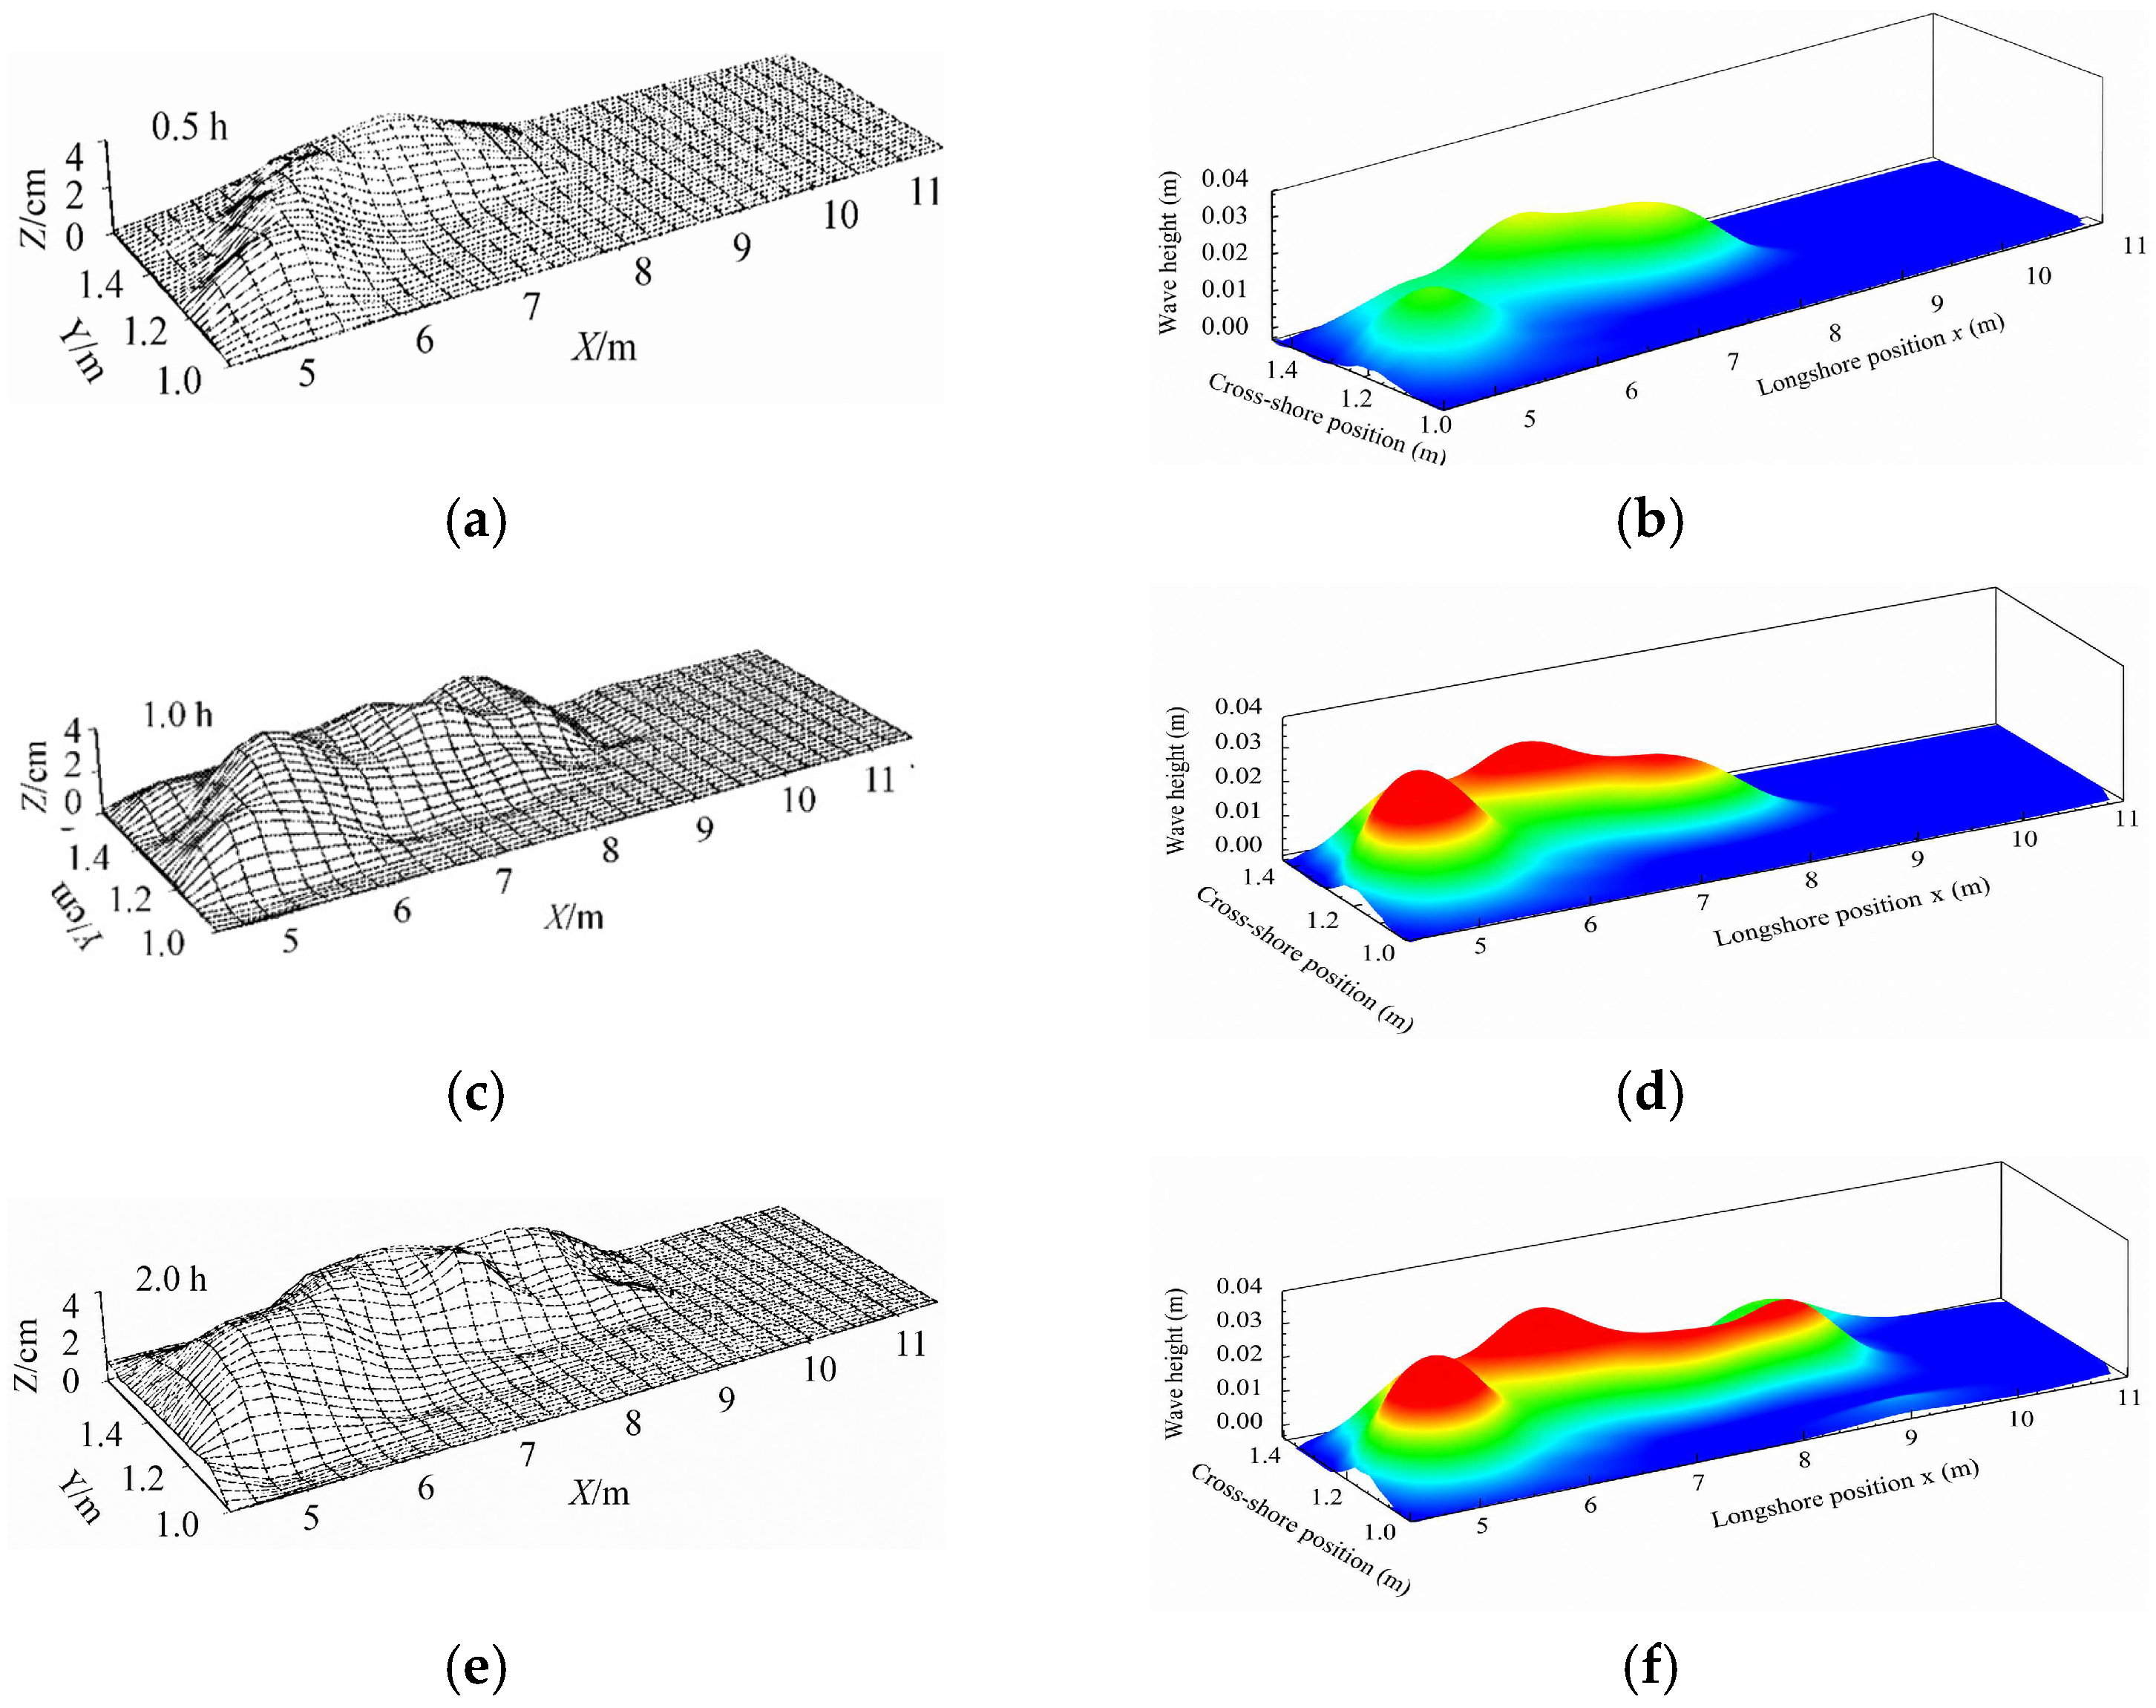
The dynamics-driven, boundary-responsive model is activated for transient numerical simulations, reproducing deposition evolution at 0.5 h, 1 h, and 2 h. Qualitative comparisons of deposition morphology at all time points showed excellent agreement with experimental observations (Figure 8):
Figure 8.
Sediment deposition results of open channel (color represents deposition thickness, unit: m). (a) 0.5 h sedimentation in test; (b) 0.5 h calculated sedimentation; (c) 1 h sedimentation in test; (d) 1 h calculated sedimentation; (e) 2 h sedimentation in test; (f) 2 h calculated sedimentation.
At 0.5 h (initial stage): In the experiment, sediment was mainly concentrated in the core zone of the recirculation zone at x = 5–6 m and y = 1.2–1.4 m, forming a narrow band-shaped initial deposit. The simulation accurately reproduces the spatial position of this deposition region; the band morphology and thickness distribution (maximum deposition thickness approximately 0.03 m) are fully consistent with the experiment.
At 1 h (development stage): In the experiment, the deposit expands upstream and downstream to x = 4.5–7 m, forming a “sand ridge” morphology extending along the vortex core of the recirculation zone. The simulation simultaneously reproduces this expansion trend; the direction and height of the sand ridge (maximum thickness approximately 0.04 m) are both in high agreement with the experiment.
At 2 h (equilibrium stage): Deposit morphology tends toward stability in the experiment, with only slight lateral widening at the outer edge of the sand bar. The simulation similarly shows “stable deposition extent with reduced thickness fluctuations”, with small deviations between the simulated and measured deposit boundaries.
3.6. Quantitative Validation of Deposition Thickness
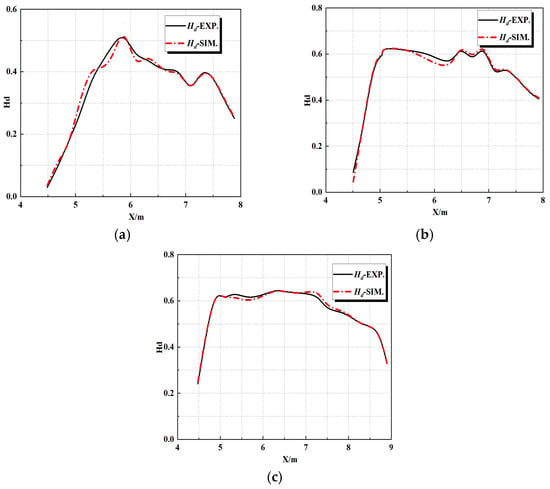
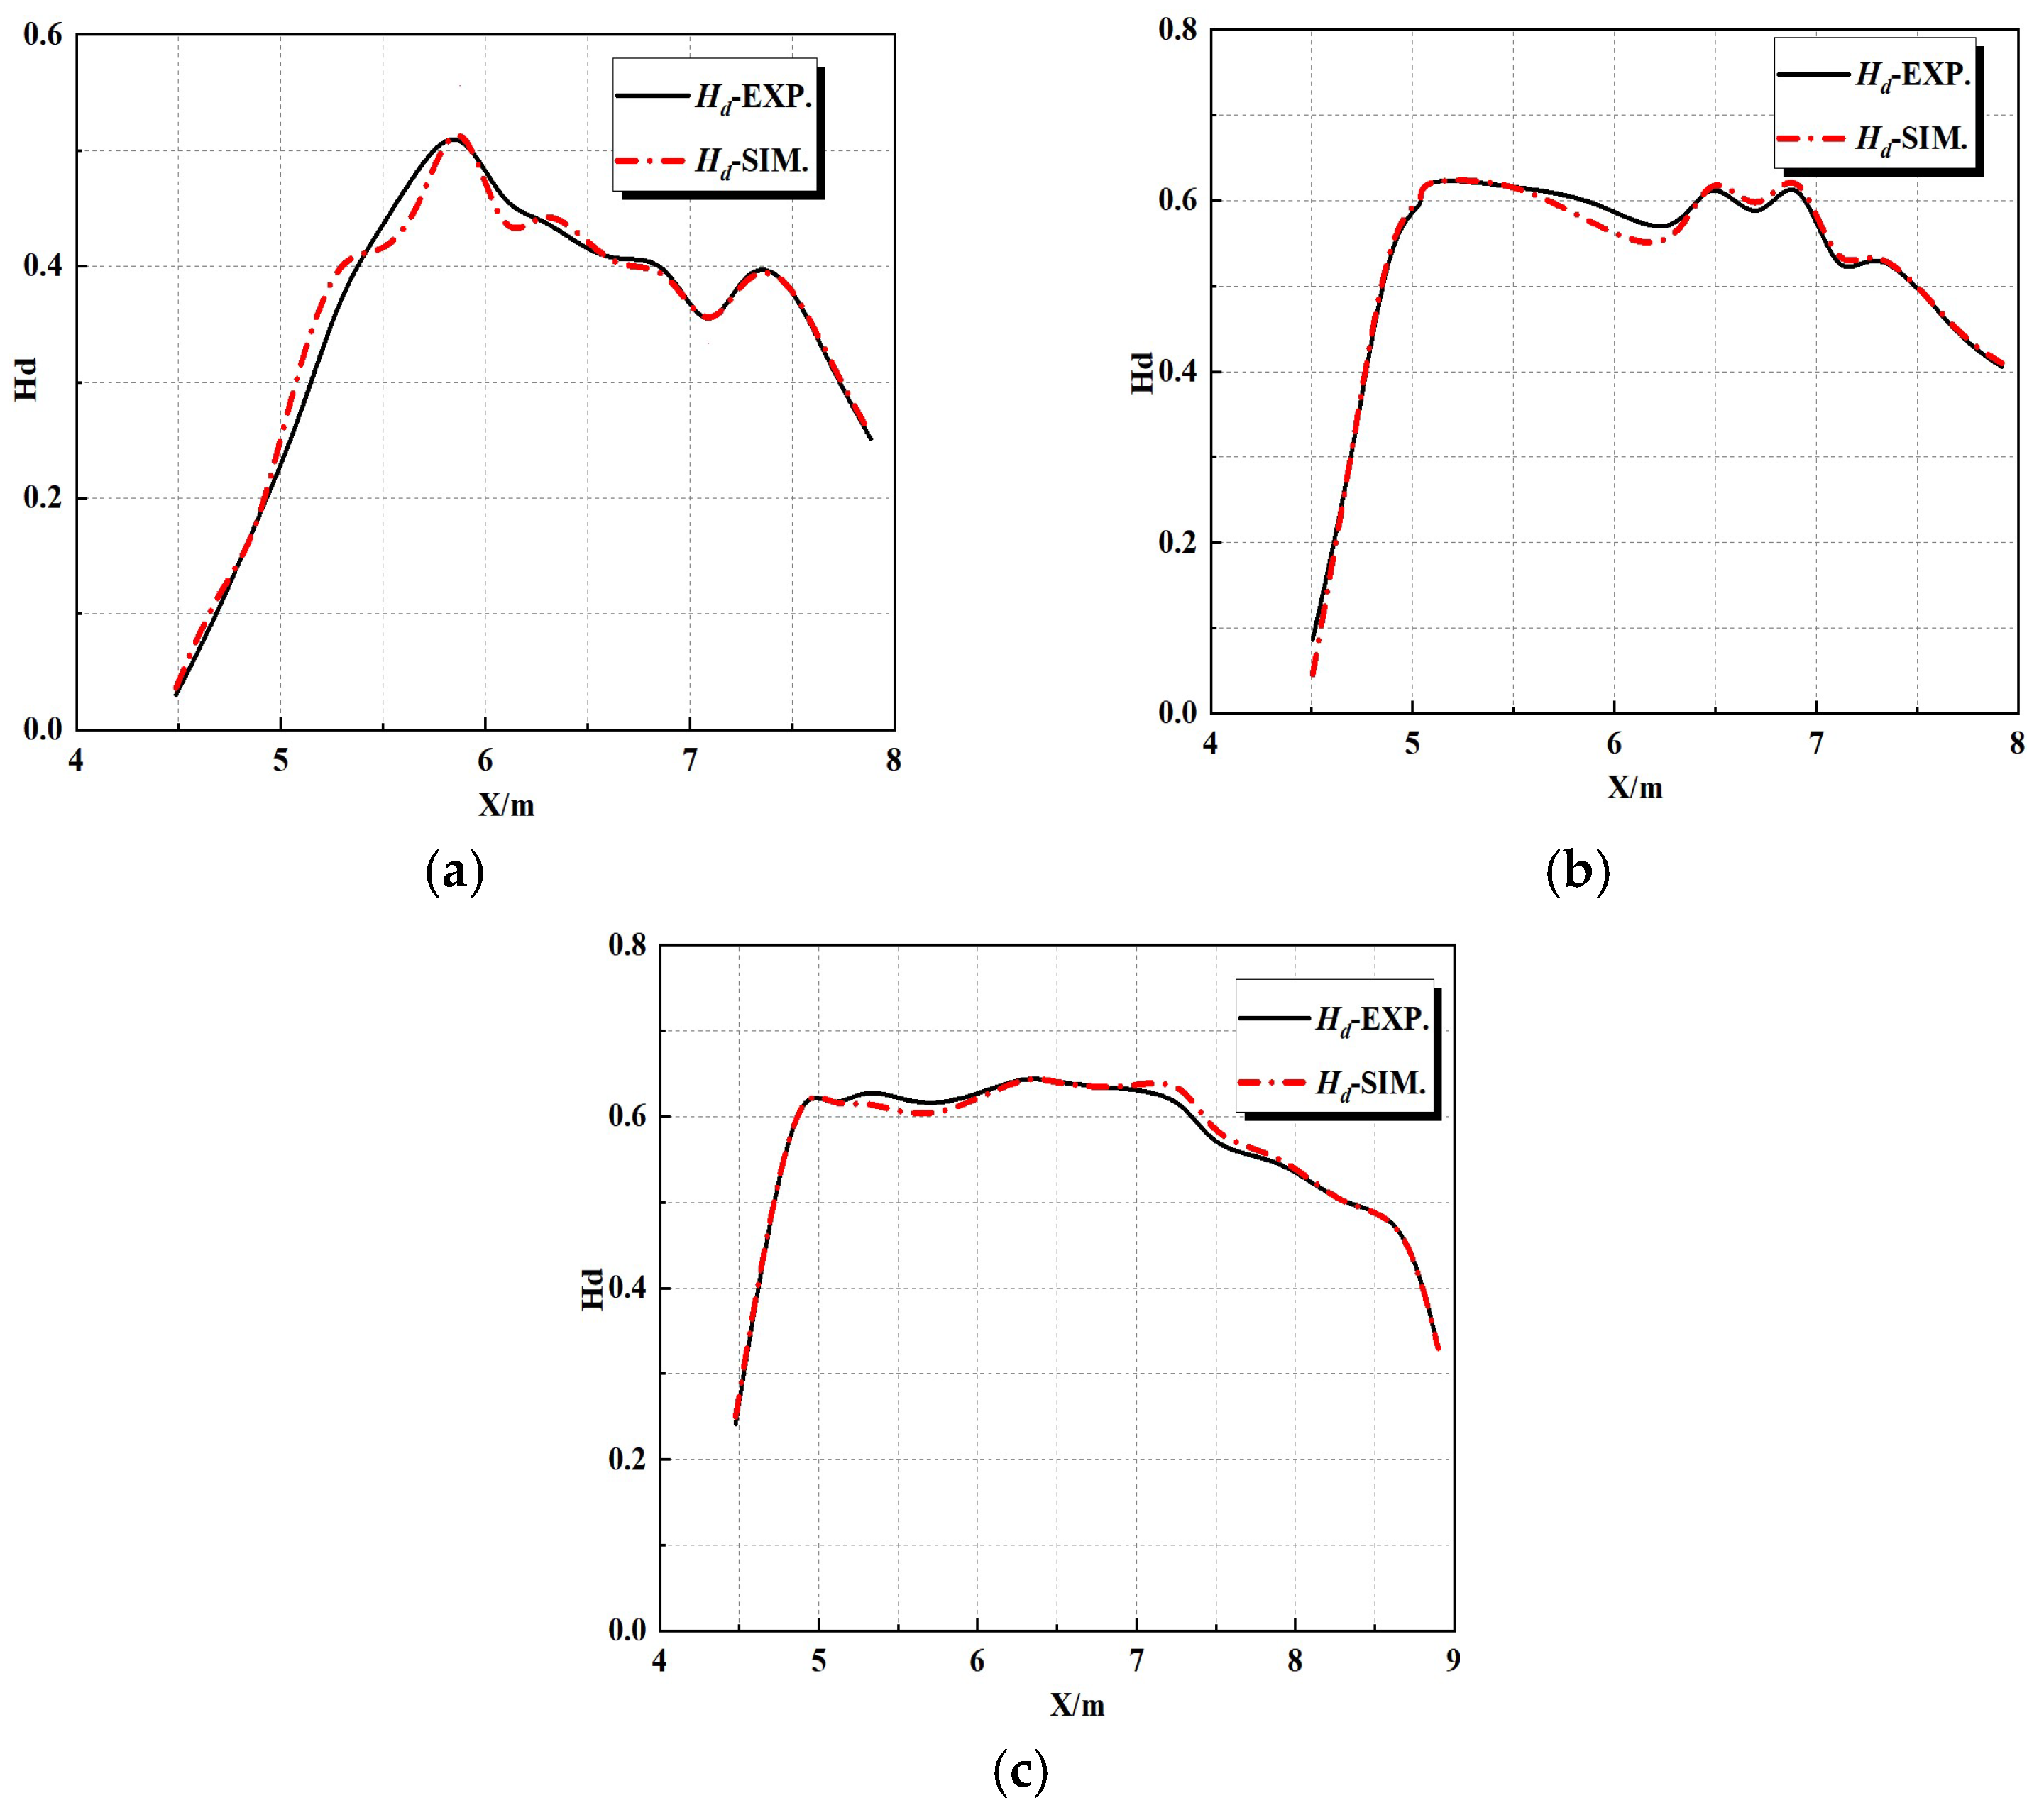
To further validate the model’s quantitative accuracy, spatially averaged deposition thickness along the flow direction (within the deposition core zone from x = 4.5 to 8 m) at 0.5 h, 1 h, and 2 h is compared (Figure 9).
Figure 9.
Comparison diagram of average thickness of open channel. (a) 0.5 h average thickness comparison; (b) 1 h average thickness comparison; (c) 2 h average thickness comparison.
At 0.5 h, the measured peak thickness occurs in the core segment of the recirculation zone (x = 5–6 m); the simulated peak location coincides exactly with the experiment, with highly consistent trend curves and local deviation below 4%. At 1 h, the measured average deposition thickness rises overall; the simulation reproduces this trend with matching curve oscillation characteristics, controlling the deviation within 4% throughout. At 2 h, the measured thickness approaches stability; the simulation similarly shows “stable peak, minor local fluctuations”, with further improved agreement. In terms of deposition rate evolution, both experiment and simulation show rapid growth from 0.5 h to 1 h, with the growth rate simultaneously slowing from 1 h to 2 h, fully conforming to the physical law of “initial rapid accumulation followed by equilibrium”.
3.7. Flow Field–Deposition Mechanism Analysis
By analyzing the flow field simulation results together with sediment deposition characteristics, we identify the “low-velocity, vortex-dominated” recirculation flow structure as the core factor driving deposition evolution: In the initial stage, the low-velocity environment of the recirculation zone allows the vertical settling rate of sediment particles to exceed the horizontal transport rate, triggering concentrated deposition at the interface between the recirculation and main stream zones. In the development stage, vortex entrainment transports surrounding sediment toward the vortex center, promoting deposit expansion and the formation of a sand ridge. In the equilibrium stage, the elevated bed surface alters the local flow structure, slightly increasing velocities in the recirculation zone, ultimately achieving a dynamic balance between particle settling and scour. This clearly demonstrates the coupling mechanism among flow field structure, sediment transport behavior, and deposition evolution and validates the physical rationality of using particle vertical velocity VZ as the deposition discrimination criterion in this model.
3.8. Field Validation and Engineering Application for Forebay Sediment Prediction
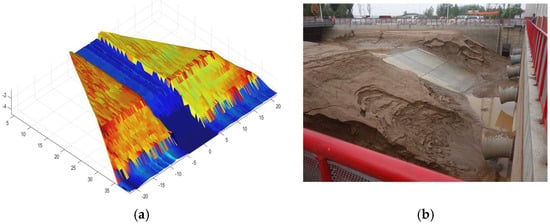
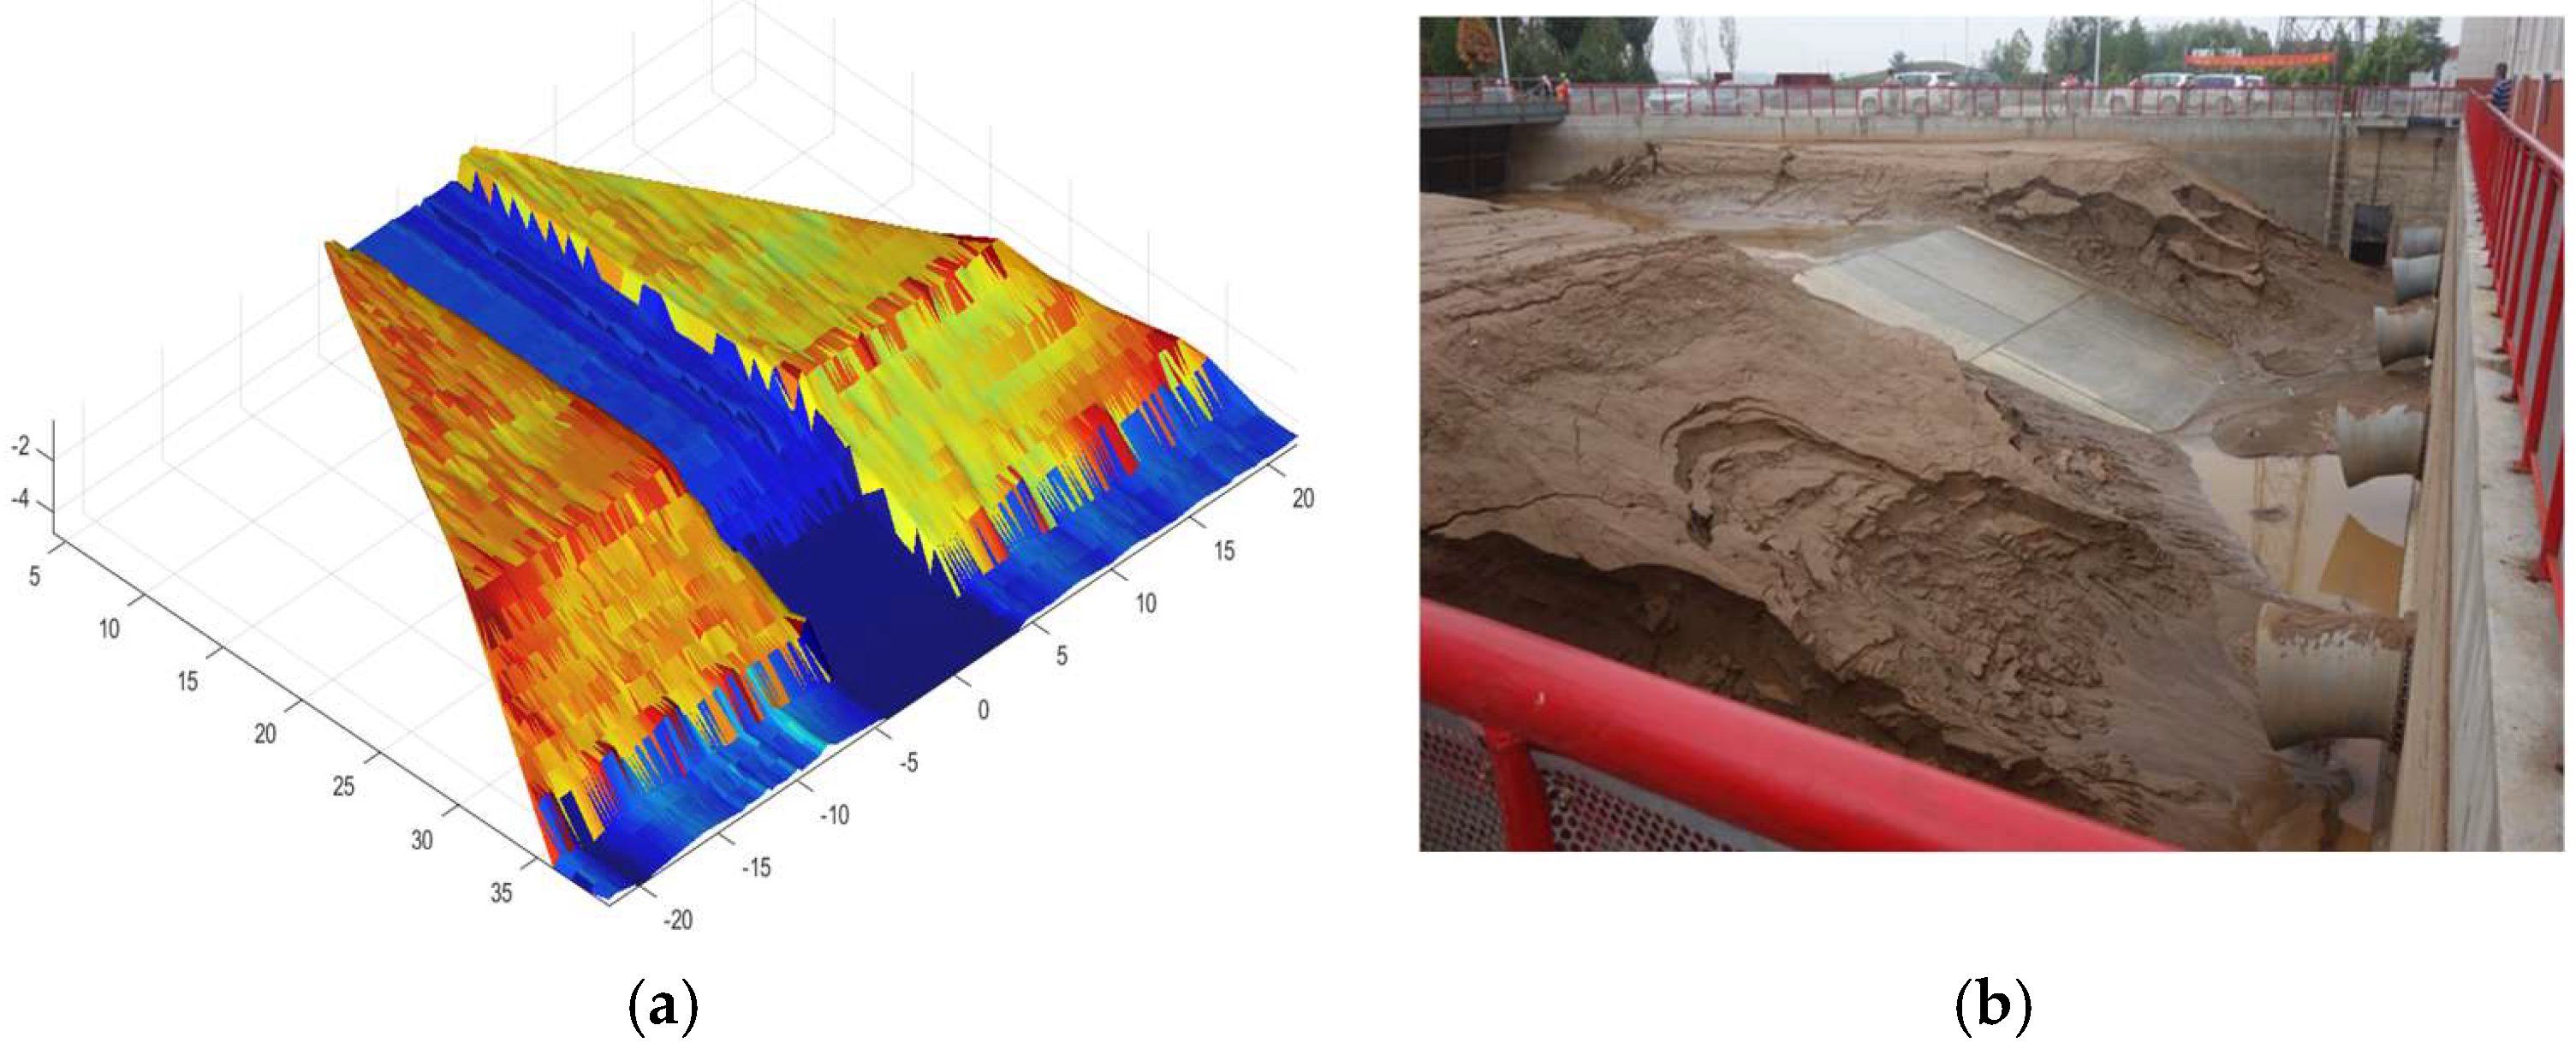
To further verify the practical engineering performance of the proposed dynamic boundary-responsive sediment deposition model, we applied the developed numerical framework to predict the June sediment deposition morphology inside a real-world pumping station forebay. Full-scale field siltation characteristics of Yellow River irrigation pumping station forebays were systematically summarized in the doctoral research of He [27]. The numerically predicted siltation distribution was compared with field photography obtained after the June irrigation cycle, as illustrated in Figure 10.
Figure 10.
Comparison of sediment deposition morphology in the pumping station forebay after June irrigation operation (color represents deposition elevation, unit: m). (a) Numerically calculated siltation topography predicted by the proposed dynamic boundary model. (b) Field photograph of actual on-site sediment accumulation.
Subplot (a) shows the three-dimensional sediment deposition topography calculated by the proposed model, whereas subplot (b) displays the actual in situ siltation morphology captured from field observation. Visually, the predicted deposition zone, spatial distribution range, and relative sediment thickness demonstrate strong consistency with the field observation results. The model accurately reproduces the prominent high-deposition zones formed within the recirculation regions at the forebay rear and side corners, and the magnitude of simulated siltation height matches the measured field accumulation levels with minor discrepancies.
For the field application case, the predicted main deposition area, siltation ridge position and overall deposition range are consistent with in situ observations, with a relative deviation of deposition range within 10%. As an engineering-oriented model, the proposed method focuses on predicting the location, range and development trend of sediment deposition, which provides sufficient accuracy for engineering desilting design and operation optimization. For the field application at Hongsibao No.4 pumping station, the measured deposition distribution is obtained from a 1:2000 topographic survey after desilting and field photo identification. The simulated deposition boundary is defined as the area with net deposition thickness over 0.1 m. The 10% relative error is calculated as the absolute difference between simulated and measured deposition area divided by the measured area. Specifically, the distribution pattern of thick deposition on both sides and thin deposition in the main flow zone is fully consistent with field survey results, and the strike of the longitudinal sand ridge along the flow direction matches the measured topographic distribution. The model also successfully captures the local deposition at the inlet corner and recirculation zone, which are the key areas for desilting design.
This favorable agreement between numerical predictions and field measurements validates the reliability and practical applicability of the proposed model for sediment deposition simulation in full-scale pumping station forebays.
From the perspective of energy-efficient pumping operation, reliable sediment prediction delivers two critical engineering benefits. First, precise forebay siltation forecasting enables targeted anti-sedimentation optimization, such as guide wall layout adjustment and periodic dredging schedule planning, which effectively mitigates uneven inflow distortion induced by sediment accumulation. Second, uniform intake flow conditions maintained by sediment control reduce hydraulic head losses and suppress vortex formation near pump suction pipes, directly lowering pump energy consumption and elevating the overall energy utilization efficiency of the pumping system.
In summary, the validated model acts as a robust numerical tool for pre-emptive sediment deposition prediction and anti-siltation design for sediment-laden pumping stations in Yellow River irrigation districts. It offers quantitative support for low-energy, long-term stable operation of large-scale water conveyance pumping infrastructure.
4. Discussion
This study developed a dynamics-driven boundary-responsive sediment deposition model to overcome the drawbacks of traditional sediment prediction methods for pumping station forebays. The validation results demonstrated that the model successfully reproduced both the flow-field structure and the temporal evolution of sediment deposition, with the average deviation of deposition thickness remaining within 4%. These results provide important insights into the mechanisms governing sediment deposition under complex three-dimensional flow conditions.
Compared with conventional velocity- or concentration-based sedimentation assessment methods, the proposed model adopts the vertical velocity of sediment particles as the direct criterion for deposition discrimination. Previous studies commonly identified deposition-prone regions according to low-flow-velocity zones or sediment concentration distributions [5,6,12]. Although such approaches can qualitatively indicate potential deposition areas, they cannot directly distinguish between suspended and depositing particles because neither velocity magnitude nor concentration explicitly reflects the vertical motion tendency of sediment particles. The present results show that the vertical particle velocity VZ provides a more physically meaningful indicator of sediment behavior. The accurate reproduction of deposition initiation, expansion, and equilibrium processes observed in the experimental case further confirms the validity of this hypothesis.
The simulated deposition evolution also supports the widely recognized relationship between flow-field structures and sediment accumulation. Previous investigations of pumping station forebays reported that large-scale recirculation zones and vortex structures create low-energy environments favorable for sediment settling and accumulation [2,4,17,18]. Similar phenomena were observed in the present study. Sediment deposition initially occurred within the core region of the recirculation zone, followed by progressive expansion along the vortex centerline. As deposition developed, the altered bed morphology gradually modified the local flow structure, resulting in reduced deposition growth rates and eventual dynamic equilibrium. This process demonstrates the strong two-way coupling between flow field evolution and bed deformation, which has been emphasized in sediment transport theory but is often neglected in traditional static-boundary simulations.
Another important contribution of this study is the proposal of the “virtual monitoring–physical updating” coupled boundary mechanism. Most existing CFD-based sediment transport simulations assume a fixed bed boundary throughout the calculation process, thereby neglecting the feedback effect of deposition on the flow field [18]. Such simplifications may be acceptable during the early stage of deposition but become increasingly inaccurate as bed deformation develops. By dynamically updating the computational boundary according to the accumulated deposition height, the proposed model captures the mutual interaction between sediment deposition and flow redistribution. The good agreement between simulated and measured deposition morphology suggests that incorporating boundary evolution is essential for accurately describing long-term sedimentation processes in pumping station forebays. Similar conclusions regarding the importance of flow–sediment interaction and sediment-control mechanisms were also reported by Wang et al. [6].
Different from existing dynamic bed updating methods that require mesh reconstruction at each time step or adopt fixed mesh with an immersed boundary, the proposed “virtual monitoring-physical updating” coupled mechanism achieves a balance between computational accuracy and efficiency. Existing methods often face challenges of numerical instability or high computational cost for long-term engineering-scale simulations, while our method is more suitable for rapid prediction of sediment deposition in large-scale pumping station forebays.
From the perspective of engineering application and energy management, the proposed model provides a practical numerical tool for improving the operational performance of pumping stations dealing with sediment-laden flow. Sediment accumulation in pumping station forebays not only deteriorates pump intake conditions but also increases hydraulic losses, reduces hydraulic efficiency, and consequently affects the long-term energy consumption and operational safety of pumping systems [2,3]. Recent investigations have demonstrated that optimizing forebay flow patterns and pump operating schemes can effectively suppress vortex development and mitigate sediment accumulation. By accurately predicting the spatial distribution and temporal evolution of sediment deposition, the proposed model provides quantitative support for optimizing forebay geometry, guide-wall configurations, pump operation strategies, and maintenance scheduling. Furthermore, because the proposed model is implemented through user-defined functions and can be readily integrated into existing CFD platforms, it provides a practical numerical framework for supporting energy-efficient operation and lifecycle management of sediment-laden pumping systems.
Despite the encouraging results, several limitations should be acknowledged. First, the model was validated using an open-channel recirculation experiment that reproduces the dominant hydraulic characteristics of pumping station forebays, but the geometry remains simpler than that of actual pumping stations. Second, sediment particles were treated as a continuum phase within the Euler–Euler framework, and particle size gradation, cohesive effects, and flocculation processes were not explicitly considered. These factors may influence deposition behavior under highly concentrated sediment conditions. Third, the present study focused primarily on steady hydraulic and sediment supply conditions, whereas actual pumping station operations often involve transient inflow discharge, fluctuating sediment concentration, and variable unit operation combinations. Fourth, the model currently adopts a uniform sediment particle size assumption, without considering the influence of sediment gradation and bed material armoring. Fifth, the model is validated for low sediment concentration conditions (less than 30 kg/m3) typical of Yellow River pumping stations, and its applicability to hyper-concentrated flows needs further verification. Finally, the current model focuses on suspended load deposition and does not include bed load transport. Sensitivity analysis shows that the simulation results are most sensitive to the deposition threshold and near-wall grid resolution, which should be calibrated according to specific engineering conditions in practical applications.
Future research should further integrate the proposed dynamic boundary-response framework with pump hydraulic performance evaluation and operational optimization. In particular, coupling sediment deposition prediction with hydraulic efficiency assessment, energy consumption analysis, and multi-unit operation scheduling would enable the development of intelligent sediment-aware operation strategies for pumping stations. Such developments will further enhance the engineering applicability of the proposed model in supporting low-energy, high-efficiency, and sustainable operation of sediment-laden pumping systems.
5. Conclusions
To address the coupled challenges of highly three-dimensional flow, dynamic bed deformation, and continuous flow–sediment interaction in forebays of pumping stations in the Yellow River irrigation districts, a particle-dynamics-driven boundary-responsive numerical model for sediment deposition was developed and validated. The principal conclusions are summarized as follows.
- (1)
- A particle-based deposition criterion was established using the vertical velocity of sediment particles adjacent to the bed as the direct indicator of deposition and resuspension. Compared with conventional approaches based on flow velocity or sediment concentration, the proposed method directly characterizes particle settling behavior, significantly improving the physical consistency and prediction accuracy of sediment deposition.
- (2)
- A dynamic bed evolution model based on sediment mass conservation was developed to quantitatively convert particle deposition and resuspension into real-time bed elevation variation. The proposed approach realistically reproduces the continuous evolution of sediment accumulation while maintaining strict mass conservation throughout the numerical simulation.
- (3)
- A coupled boundary-updating strategy integrating virtual monitoring with physical boundary reconstruction was proposed to achieve stable two-way coupling between flow evolution and bed deformation. This approach effectively captures the feedback of sediment deposition on the hydraulic field while avoiding numerical instability associated with frequent mesh updating.
- (4)
- The proposed model was validated against open-channel experimental data. The predicted flow structures, deposition morphology, and temporal evolution of deposition thickness showed good agreement with measurements, with the average deviation in deposition thickness remaining within 4% at 0.5 h, 1 h, and 2 h. These results demonstrate the reliability and engineering applicability of the proposed methodology for simulating sediment deposition in pumping station forebays.
Overall, the proposed numerical model provides a physically based and computationally efficient framework for predicting sediment deposition under complex hydraulic conditions in pumping station forebays. By accurately capturing the coupled evolution of sediment transport, bed deformation, and three-dimensional flow structures, the model provides a reliable basis for evaluating the hydraulic impacts of sediment accumulation and supports improved sediment management throughout the operational lifecycle of pumping stations.
Beyond sediment prediction, the proposed methodology offers practical value for improving pump intake conditions, reducing hydraulic losses, optimizing maintenance scheduling, and supporting energy-efficient operation of sediment-laden pumping systems. Future work will further integrate the present model with hydraulic performance evaluation, pump operating strategy optimization, and energy consumption assessment, thereby promoting the intelligent operation and sustainable management of large-scale pumping infrastructure.
Author Contributions
Conceptualization, C.H. and F.W.; methodology, C.H. and C.W.; software, C.H.; validation, C.H. and H.W.; formal analysis, C.H.; investigation, H.W.; resources, L.D.; data curation, H.W.; writing—original draft preparation, C.H.; writing—review and editing, D.Z., C.W. and F.W.; visualization, H.W.; supervision, D.Z., C.W. and F.W.; project administration, F.W. and L.D.; funding acquisition, F.W. and L.D. All authors have read and agreed to the published version of the manuscript.
Funding
This research was funded by the National Natural Science Foundation of China, grant number U22A20238. The APC was funded by the National Natural Science Foundation of China.
Data Availability Statement
The data supporting this study’s findings are available from the corresponding author upon reasonable request.
Conflicts of Interest
Author Liangliang Du was employed by the company Dongyang Water Investment Group Co., Ltd. The remaining authors declare that the research was conducted in the absence of any commercial or financial relationships that could be construed as a potential conflict of interest.
References
- Wu, J.; Tian, J.; Liu, J.; Feng, X.; Wang, Y.; Ya, Q.; Li, Z. Driving Factors and Trend Prediction for Annual Sediment Transport in the Upper and Middle Reaches of the Yellow River from 2001 to 2020. Water 2023, 15, 1107. [Google Scholar] [CrossRef] [Scilit]
- Wang, H.; Li, C.; Lu, S.; Wei, X. The Flow Patterns and Sediment Deposition in the Forebay of a Forward-Intake Pumping Station. Phys. Fluids 2022, 34, 083316. [Google Scholar] [CrossRef] [Scilit]
- Xu, C.; Tian, J.; Wang, G.; Lian, H.; Wang, R.; Hu, X. Numerical Analysis of Water–Sediment Flow Fields within the Intake Structure of Pumping Station under Different Hydraulic Conditions. Water 2024, 16, 779. [Google Scholar] [CrossRef] [Scilit]
- Tang, X.L.; Wang, W.C.; Wang, F.J.; Li, Y.J. Numerical simulation of sediment-laden flows in pumping station forebay. J. Drain. Irrig. Mach. Eng. 2011, 29, 411–417. [Google Scholar]
- Zhou, D.Q.; Mi, Z.H.; Mao, Y.T. 3-D numerical simulation of inlet structure flow in pumping station based on Eulerian solid-liquid two-phase flow model. Trans. Chin. Soc. Agric. Mach. 2013, 44, 48–52. [Google Scholar]
- Wang, H.; Liu, J.; Li, C.; Wei, X. Flow Pattern and Universal Sediment Control Mechanism in Pump Station Forebays. Phys. Fluids 2025, 37, 065110. [Google Scholar] [CrossRef] [Scilit]
- Oevermann, M.; Gerber, S. Eulerian Multiphase Modeling of Sediment-Laden Turbulent Flows. Powder Technol. 2010, 199, 193–202. [Google Scholar]
- Zhong, D.F.; Liu, P.; Wei, H.P. Model test study on mechanism of sedimentation in forebay of pumping station. J. Tongji Univ. Nat. Sci. 2001, 29, 879–882. [Google Scholar]
- Rahman, S.A.; Chakrabarty, D. Sediment transport modelling in an alluvial river with artificial neural network. J. Hydrol. 2020, 588, 125056. [Google Scholar] [CrossRef] [Scilit]
- Ansar, M.; Nakato, T. Effects of Cross Flow on Three-Dimensional Flow in a Pump Intake Basin. J. Hydraul. Eng. 2001, 127, 857–867. [Google Scholar]
- Lu, Y.J. Water-Sediment Mathematical Model and Its Application; China Water & Power Press: Beijing, China, 2002. [Google Scholar]
- Hu, D.C. Research Progress on Mathematical Models of River Sediment. Adv. Water Sci. 2009, 20, 431–438. [Google Scholar]
- Wen, C.Y.; Yu, Y.H. Mechanics of Fluidization. Chem. Eng. Prog. Symp. Ser. 1966, 62, 100–111. [Google Scholar]
- Kunii, D.; Levenspiel, O. Fluidization Engineering, 2nd ed.; Butterworth-Heinemann: Boston, MA, USA, 1991. [Google Scholar]
- Rodi, W. Turbulence Models and Their Application in Hydraulics; A.A. Balkema: Rotterdam, The Netherlands, 1993. [Google Scholar]
- Oberkampf, W.L.; Roy, C.J. Verification and Validation in Scientific Computing; Cambridge University Press: Cambridge, UK, 2010. [Google Scholar]
- Shields, A. Application of Similarity Principles and Turbulence Research to Bed-Load Movement; California Institute of Technology: Pasadena, CA, USA, 1936. [Google Scholar]
- Wu, W. Computational River Dynamics; CRC Press: Boca Raton, FL, USA, 2007. [Google Scholar]
- Sotiropoulos, F.; Yang, X. Immersed boundary methods for simulating fluid-structure interaction. Prog. Aerosp. Sci. 2014, 65, 1–21. [Google Scholar] [CrossRef] [Scilit]
- Constantinescu, G.; Patel, V.C. Role of Turbulence Model in Prediction of Pump-Intake Flow and Vortices. J. Hydraul. Eng. 1998, 124, 123–134. [Google Scholar]
- Ansar, M.; Nakato, T.; Constantinescu, G. Numerical Simulations of Flow in Pumping Station Forebays for Design Optimization. J. Hydraul. Res. 2002, 40, 61–72. [Google Scholar]
- Wang, F.J. Computational Fluid Dynamics Analysis: Principles and Applications of CFD Software; Tsinghua University Press: Beijing, China, 2004. [Google Scholar]
- Yang, L.; Yang, Z.; Liu, M.; Ai, Y.D.; Huai, W.X. Simulating stochastic transport: An efficient random displacement model for multi-domain applications in ecology, hydraulics, and environmental systems. J. Hydrodyn. 2025, 37, 421–436. [Google Scholar] [CrossRef] [Scilit]
- Gidaspow, D. Multiphase Flow and Fluidization: Continuum and Kinetic Theory Descriptions; Academic Press: San Diego, CA, USA, 1994. [Google Scholar]
- Wang, X.K.; Zou, Z.Y.; Qian, N. Experimental Study on Sediment Deposition Characteristics in Shallow-Water Recirculation Zones in Open Channels. J. Hydraul. Eng. 2009, 40, 695–701. [Google Scholar]
- Celik, I.B.; Ghia, U.; Roache, P.J.; Freitas, C.J. Procedure for Estimation and Reporting of Uncertainty Due to Discretization in CFD Applications. J. Fluids Eng. 2008, 130, 078001. [Google Scholar] [CrossRef] [Scilit]
- He, C.X. Study on Sediment Deposition Mechanism and Sediment Reduction Measures of Pump Station Forebay in Yellow River Irrigation Area. Doctoral Dissertation, China Agricultural University, Beijing, China, 2026. [Google Scholar]

Disclaimer/Publisher’s Note: The statements, opinions and data contained in all publications are solely those of the individual author(s) and contributor(s) and not of MDPI and/or the editor(s). MDPI and/or the editor(s) disclaim responsibility for any injury to people or property resulting from any ideas, methods, instructions or products referred to in the content. |
© 2026 by the authors. Licensee MDPI, Basel, Switzerland. This article is an open access article distributed under the terms and conditions of the Creative Commons Attribution (CC BY) license.