


Abstract
Particle Image Velocimetry (PIV) has recently evolved from a costly, specialized technique into an accessible method thanks to affordable hardware and open-source software. This work introduces a time calibration validation method tailored for low-cost or Do-It-Yourself (DIY) PIV systems. By utilizing inexpensive components such as light-dependent resistors (LDRs), basic resistors, and data acquisition devices or microcontrollers, the study enables accurate timing analysis of light pulses from synchronized lasers or LEDs. Experimental data obtained in real time using a National Instruments USB-6003 DAQ device confirm the system’s ability to detect light pulses with high temporal resolution. Through voltage signal interpretation, the synchronization accuracy of light sources is validated across different sampling rates. Moreover, the study demonstrates how the internal frequency settings of PIVlab, an open-source PIV software package, can be customized to enhance acquisition flexibility. Timing deviations of up to 20% were identified across selected default frequency settings. The proposed method ensures that low-cost systems maintain sufficient accuracy for phase-sensitive flow measurements, such as oscillatory flow or wave action, contributing to the broader adoption of PIV in resource-limited environments. It presents a low-cost method for validating timing accuracy in PIV systems, employs widely available components and is adaptable to multiple platforms, and enables precise synchronization checks critical for flow visualization.
1. Introduction
Flow visualization has been an essential aspect of fluid mechanics since its inception, tracing its roots back to the early qualitative methods developed by Hele-Shaw [1]. The field was further transformed by the groundbreaking contributions of other early pioneers such as Mach, Marey, Prandtl, and Ahlborn, who achieved monumental leaps in visualization techniques [2]. Besides these qualitative flow monitoring techniques, instruments capable of achieving the quantitative precision required to advance fluid mechanics have also been developed, paving the way for modern techniques like Particle Image Velocimetry (PIV).
PIV is rather distinct from techniques like Laser Doppler Velocimetry (LDV), which measures velocities at a single point bounded by a sampling volume using the Doppler effect. Instead, PIV calculates velocity vectors across a plane by analyzing particle displacement within a specified time interval. This innovation allows for a broader and more detailed understanding of flow fields. A typical PIV system comprises four essential components: (1) A laser for illumination, (2) a synchronizer for timing, (3) a high-speed camera for capturing images, and (4) a computer for processing data [2]. Open-source software such as PIVlab [3,4] and OpenPIV [5] has significantly widened the use of PIV among researchers by offering accessible tools for data analysis.
PIV has revolutionized the study of fluid mechanics, transitioning from a high-cost, specialized tool to a widely accessible technique, supported by open-source software and affordable hardware. Its capacity to deliver precise, detailed measurements ensures its continued relevance and potential for innovation in future research.
Today, PIV is utilized across a wide array of fields, from aerodynamics to biofluid mechanics, thanks to its ability to provide detailed, quantitative insights into complex flow phenomena. In phase-dependent flows, the synchronization of measurement timing with flow dynamics remains a critical area of focus, and innovative methods continue to emerge to enhance calibration and accuracy.
Accurate PIV measurements depend critically on determining particle displacement between two images. This necessitates precise control of the time interval between exposures, particularly for phase-dependent flows such as waves. Any timing error can lead to incorrect assessments of wave periods and, consequently, inaccurate velocity measurements. Westerweel [6] highlighted the importance of measurement precision in ensuring reliable PIV results.
Originally, PIV systems were high-cost and complicated experimental setups that were only accessible to well-funded laboratories. Recent advancements, however, have introduced cost-effective alternatives, such as do-it-yourself (DIY) PIV systems and versions utilizing low-cost pulse lasers. These developments, combined with open-source software, have significantly lowered the barriers to entry, enabling a broader range of researchers to adopt the technique.
The push towards accessibility has been particularly impactful in both educational settings and early-stage research, where low-cost PIV systems are increasingly implemented for undergraduate fluids laboratories [7,8]. By substituting expensive, specialized components like Nd:YAG lasers and scientific-grade CCD cameras with consumer-grade electronics—such as LEDs, continuous diode lasers, and even pulsed diode lasers controlled by microcontrollers [9], alongside accessible CMOS sensors—these budget-friendly alternatives allow institutions to integrate hands-on flow visualization into their curricula without prohibitive financial burdens [7,8,9]. This shift toward educational and low-cost research not only democratizes advanced fluid mechanics but also fosters active learning and undergraduate research opportunities previously limited to well-funded graduate facilities. While many of these low-cost PIV systems are typically utilized for low-speed educational purposes (e.g., ~0.25 m/s in water), recent studies have pushed these boundaries; for instance, Muriithi et al. [10] successfully utilized a particle streak method to measure mean velocities up to 0.8 m/s in air.
Furthermore, the democratization of optical measurement tools extends beyond traditional PIV. Similar low-cost adaptations have been successfully utilized in other engineering domains, such as Digital Image Correlation (DIC) for geotechnical strain measurements [11]. Within fluid dynamics, alternative imaging techniques like Particle Shadow Velocimetry (PSV) have also gained traction; PSV simplifies the illumination setup by relying on shadow casting rather than intense particle scattering, offering distinct advantages and specific limitations compared to conventional PIV under certain experimental constraints [12]. The continuous refinement of these diverse optical methods, supported by recent literature, highlights a growing consensus on the viability of DIY optical setups across a wide spectrum of scientific applications [13].
Despite these widespread advancements, transitioning these low-cost systems from steady-state educational demonstrations to rigorous, phase-dependent research environments introduces significant technical challenges. While commercial setups utilize highly precise hardware timing controllers to dictate image acquisition, budget-friendly alternatives often rely on generic microcontrollers or software-level triggers that can introduce microsecond-to-millisecond latencies [9,11]. Time calibration validation of these low-cost lasers and synchronizers is therefore essential. While turbulence quantities in steady flows are generally less sensitive to discrepancies in the interval between consecutive pulse pairs beyond the time correlation interval, unsteady flows such as oscillatory or wave-generated flows require rigorous absolute pulse pair time synchronization to avoid phase-related errors. Ensuring exact delays between image pairs is paramount; thus, standardizing and validating the synchronization accuracy of these DIY configurations remains a critical prerequisite before they can be reliably deployed for complex, unsteady flow measurements. Indeed, recent research has highlighted the necessity of experimental apparatuses designed to validate PIV setups through known displacements of synthetic particles to ensure highly reliable flow field characterizations. For instance, such validated setups have demonstrated the capability to accurately measure velocities of 0.7 m/s at 240 fps and 1.8 m/s at 960 fps using merely a smartphone camera and high-power fluorescent lighting [14].
However, achieving this level of timing control is generally less straightforward in low-cost DIY PIV systems than in commercial systems. To address this, the present study introduces a practical calibration validation method tailored for low-cost or Do-It-Yourself (DIY) PIV systems. By utilizing inexpensive components such as light-dependent resistors (LDRs), basic resistors, and data acquisition devices or microcontrollers, the method enables practical timing analysis of synchronized laser or LED pulses. In addition, the study demonstrates how internal frequency settings in open-source PIV software, such as PIVlab, can be customized to enhance acquisition flexibility. The proposed method is particularly valuable for experimental studies in coastal and ocean engineering, where low-cost PIV systems are increasingly used for phase-sensitive flow measurements. The novelty of this study lies in presenting a simple, reproducible, and low-cost method for validating timing synchronization in PIV systems using widely available components, together with practical implementation guidance and integration with open-source software.
2. Materials and Methods
This section outlines the detailed methodology for the proposed time calibration validation process and introduces the specific hardware components utilized. The core architecture of the validation method consists of three primary components: a light source, a Light-Dependent Resistor (LDR), and a Data Acquisition (DAQ) device. Throughout the fundamental validation procedures, an OPTOLUTION LD-PS/5 5 W double-pulsed laser was employed as the primary light source (OPTOLUTION Messtechnik GmbH, Lörrach, Germany).
Furthermore, a real-world application scenario is presented to demonstrate the method’s practical utility. Derived from a separate experimental study involving wave orbital velocity measurements, this scenario highlights a critical pulse-pair interval timing error encountered during physical testing. In this context, the process by which the proposed validation method successfully identified this synchronization error and subsequently enabled the adjustment of measurement frequencies to custom, intermediate values is detailed, successfully bypassing the rigid preset defaults of the software.
For this practical application, the experimental setup featured a comprehensive PIV system comprising the aforementioned OPTOLUTION laser paired with a pco.panda.26.DS camera (Excelitas®, Pittsburgh, PA, USA), while simultaneous wave surface elevation measurements were acquired utilizing Edinburgh Designs wave gauges (Loanhead, UK). It should be noted that across both the fundamental validation tests and the real-world application scenario, the frame straddling technique and double-pulse illumination were strictly employed for all image and data acquisition procedures [15,16].
2.1. Timing and Frame Straddling
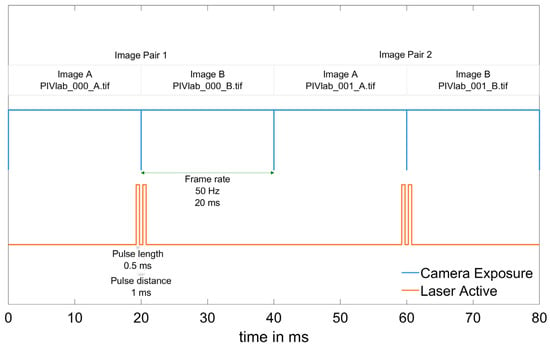
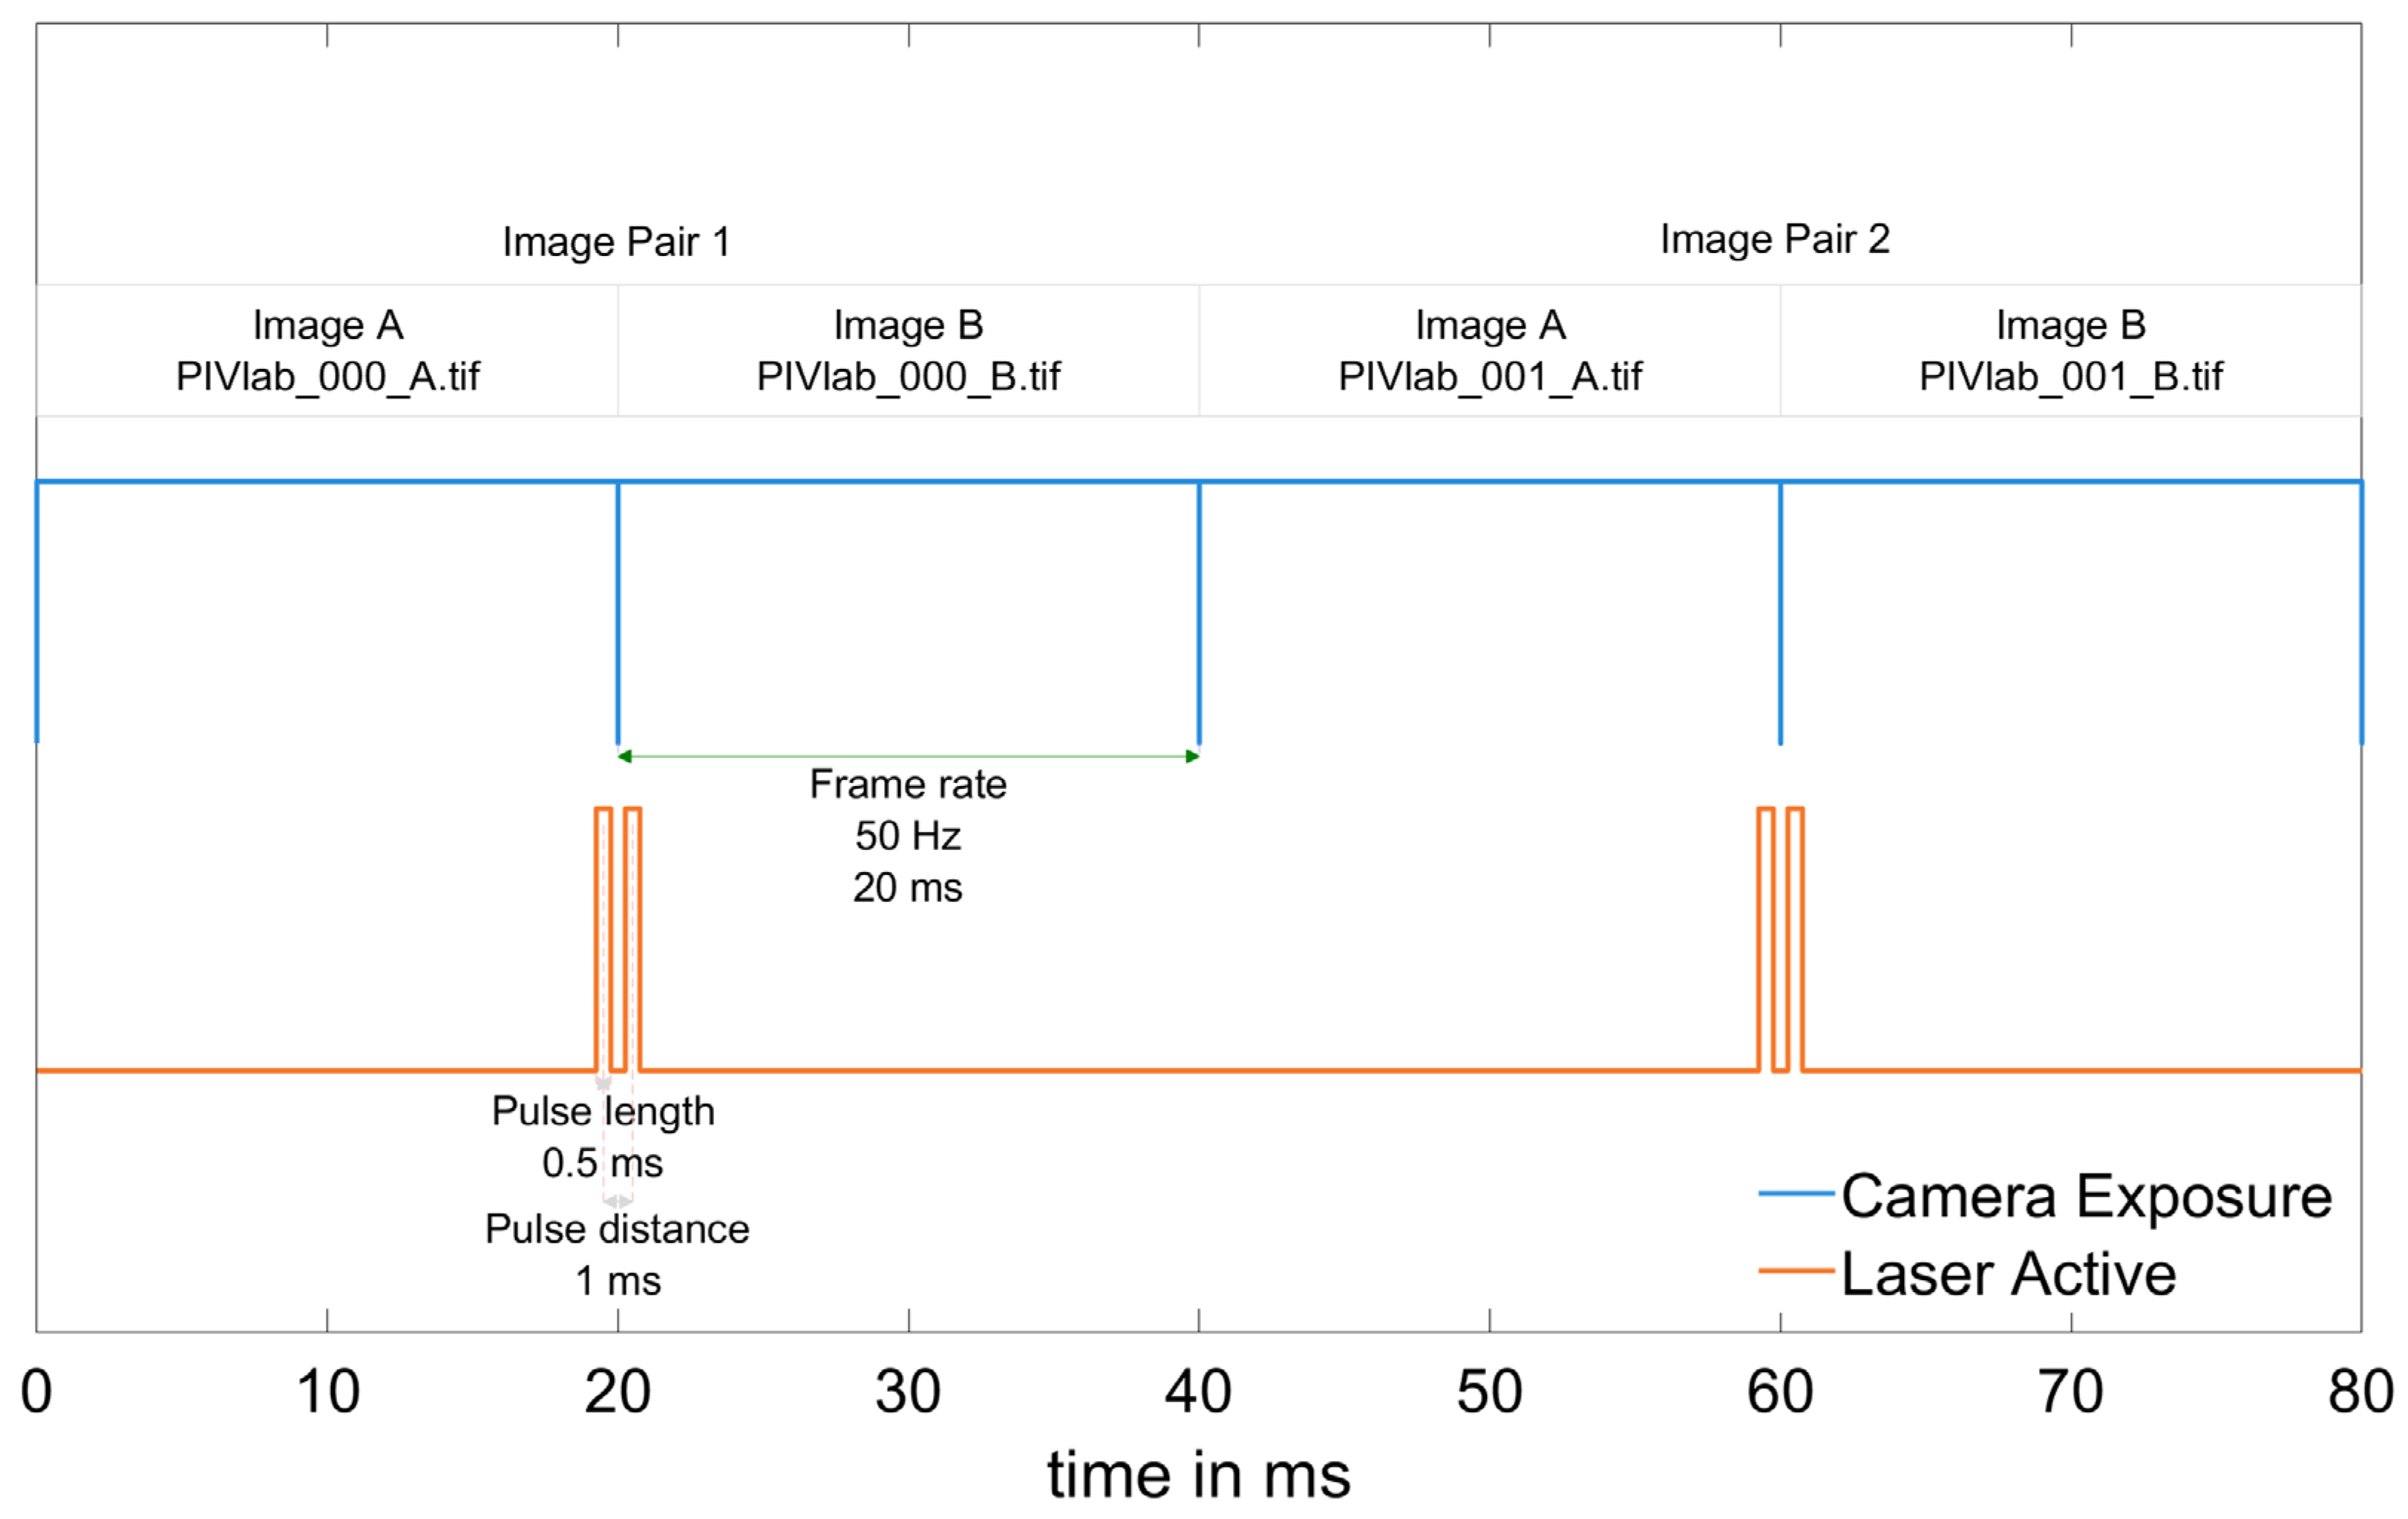
Since the proposed PIV Time Calibration Validation method relies on double-pulsed measurements, accurate adjustment of the interval between image pairs is essential. Detailed schematics of the frame straddling technique and the adopted terminology in PIV measurements for the aforementioned process are illustrated in Figure 1. Figure 1 presents a detailed schematic of the frame straddling technique, which is the standard synchronization method utilized in PIV measurements to capture image pairs for velocity evaluation. Specifically, the diagram illustrates the precise timing relationship between the camera exposure sequence and the laser diode pulses.
Figure 1.
Light pulse and exposure cycle for double-pulsed image pairing, i.e., the straddling technique.
In the frame straddling technique in Figure 1, the camera operates at a constant exposure rate, represented by the blue line in the figure (e.g., operating at 50 Hz with a 2 ms exposure time). The laser pulses, represented by the orange line, are synchronized to adapt to the camera’s timing. To minimize the time interval between two captured images, the first laser pulse is triggered near the end of the first frame’s exposure, while the second pulse is triggered at the very beginning of the second frame’s exposure.
Furthermore, the figure highlights two critical parameters of the pulsed laser behavior:
Pulse length: This refers to the duration the laser remains active for a single flash. It governs the total amount of illumination provided to the particles and directly affects the degree of motion blur.
Pulse distance (Δt): This defines the precise time interval between the two consecutive laser pulses. This temporal separation is the fundamental variable required for accurate velocity vector calculations.
The developed method can be easily applied for time step calibration and validation in low-cost or DIY PIV systems, thereby ensuring accurate measurements in phase-dependent flows. Furthermore, this study provides an opportunity to extend the capabilities of open-source systems in terms of temporal resolution. This research was applied specifically for the control and frequency validation of a low-cost OPTOLUTION PIV system.
2.2. Hardware and Circuit Configuration
The following stepwise procedure outlines the implementation of the proposed time calibration validation method:
- Step 1: Hardware Preparation
- −
- Components: Light-Dependent Resistor (LDR), 10 kΩ resistor, DC power source (5 V), DAQ or microcontroller, and light source.
- −
- Connect the LDR and resistor in series to form a voltage divider circuit. The midpoint between the LDR and resistor is linked to an analog input of the DAQ/microcontroller.
- Step 2: Circuit Configuration
- −
- Position the LDR near the laser or LED source to detect pulses.
- Step 3: Data Acquisition
- −
- Supply voltage and acquire voltage data via the DAQ (e.g., NI USB-6003, 100 kHz; Emerson, St. Louis, MO, USA). Save the data at 100 kHz as CSV for analysis.
- −
- The baseline voltage (~1.9 V) should increase distinctly (~4.7 V) when a pulse is detected.
- Step 4: Data Analysis
- −
- Process the CSV data (e.g., MATLAB R2024a or Python v3.14) to detect peaks and extract pulse timings.
- −
- Compare expected and measured intervals to evaluate synchronization accuracy.
- Step 5: PIVlab Software Customization
- −
- Modify ‘+acquisition\select_capture_config_Callback.m’ in PIVlab:
- −
- master_freq controls the synchronizer-camera frequency.
- −
- avail_freqs defines double-frame capture options.
- −
- Test system operation at 50 Hz and 60 Hz and confirm accuracy.
While designing the method, particular emphasis was placed on using affordable and readily available hardware. The primary objective is to validate the light source-synchronizer time calibration of low-cost pulsed lasers or LEDs. The hardware used in the present study is illustrated in Figure 2 and includes the following components:
- −
- A DC Power Source;
- −
- A Light-Dependent Resistor (LDR);
- −
- A Generic Resistor (Depends on lighting conditions and LDR specifications);
- −
- A Data Acquisition Device (DAQ) or any microcontroller capable of analog voltage acquisition;
- −
- A Light Source and Synchronizer.
Figure 2.
Experimental schematic of the time calibration validation method.
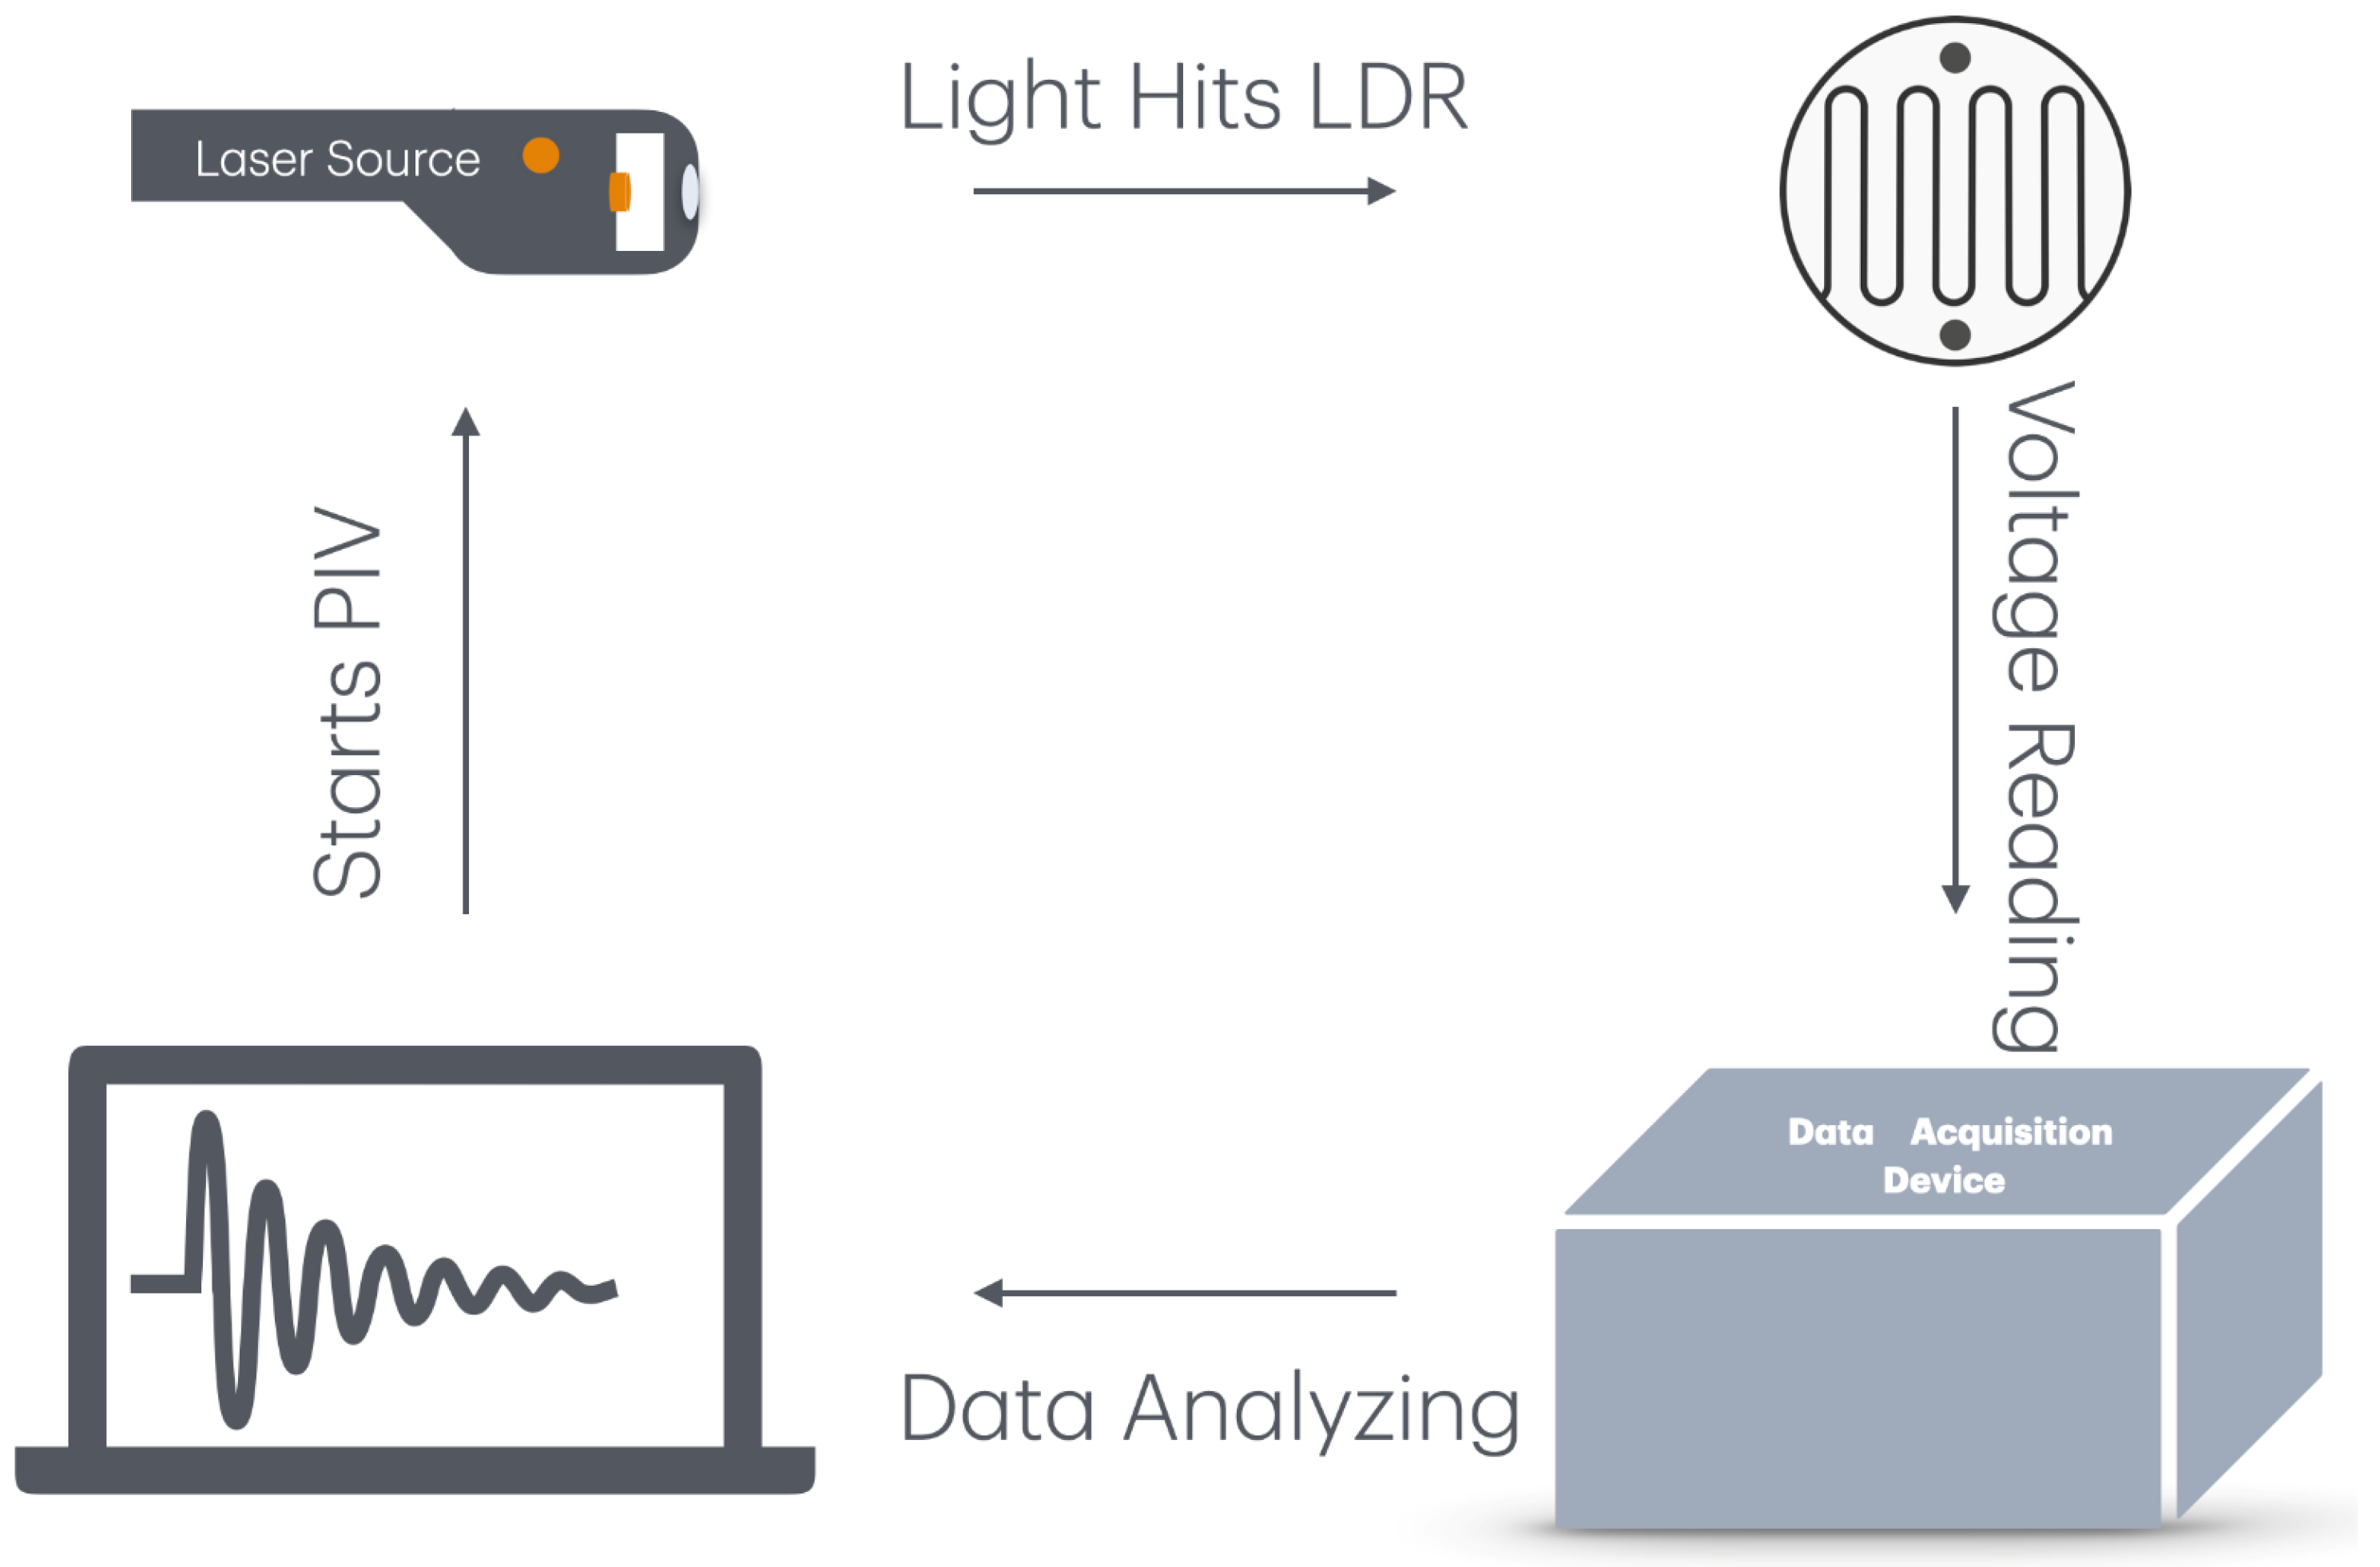
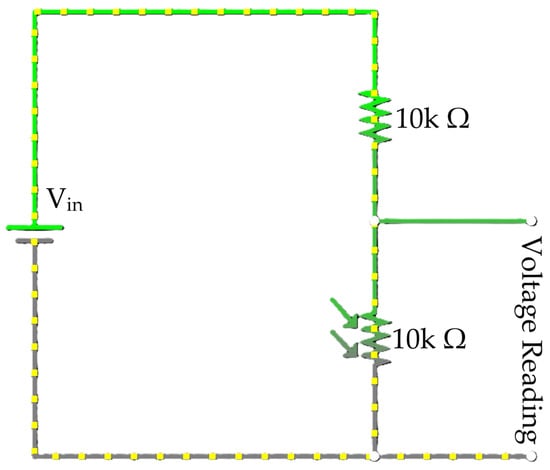
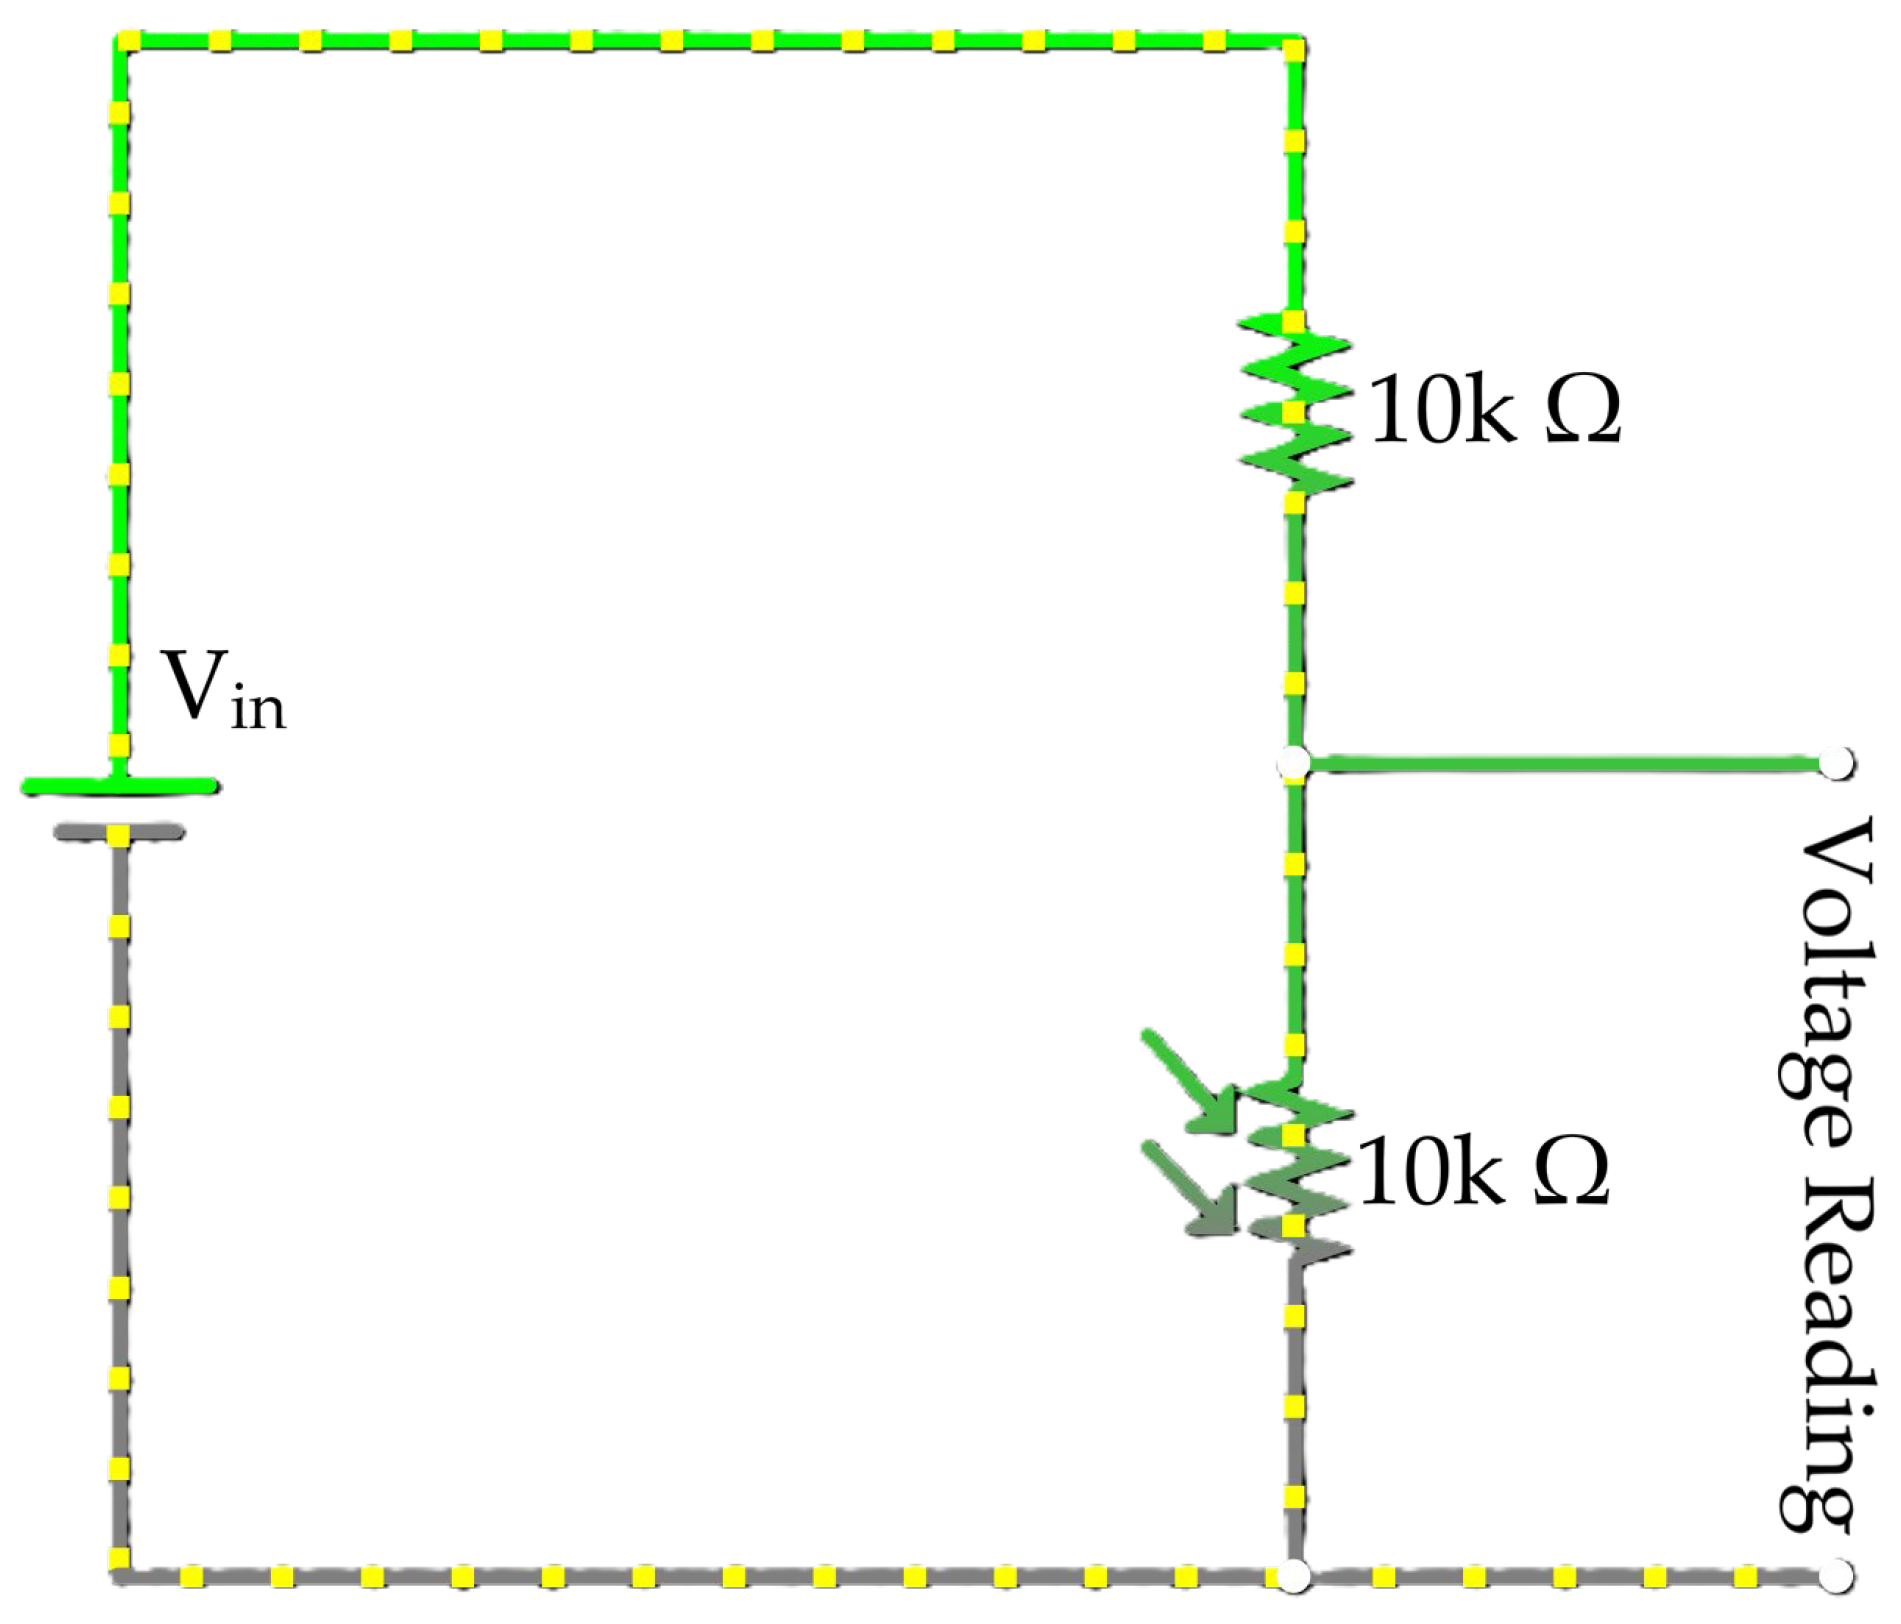
In the present application of the proposed methodology, a National Instruments DAQ USB-6003 [17] (max. 100 kHz sampling rate) and an OPTOLUTION LD-PS 5 W laser with built-in synchronizer were used. The data collected via the DAQ was analyzed, and the light source (laser sheet) was controlled by a computer. The experimental circuit used for this purpose is illustrated in Figure 3.
Figure 3.
Voltage reading circuit. Green lines represent high side input terminal, grey lines represent low side input terminal and, yellow dots represent the current.
The major mechanism of the novel method developed is as follows:
- The DC power source was provided by the NI DAQ 5 V DC output pin.
- The LDR (10 kΩ), connected in series with a generic resistor (10 kΩ), acts as a light-sensitive voltage divider.
- When the laser illuminates the LDR, its resistance decreases, resulting in an increase in output voltage.
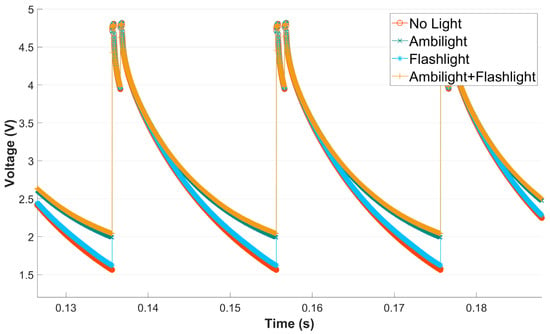
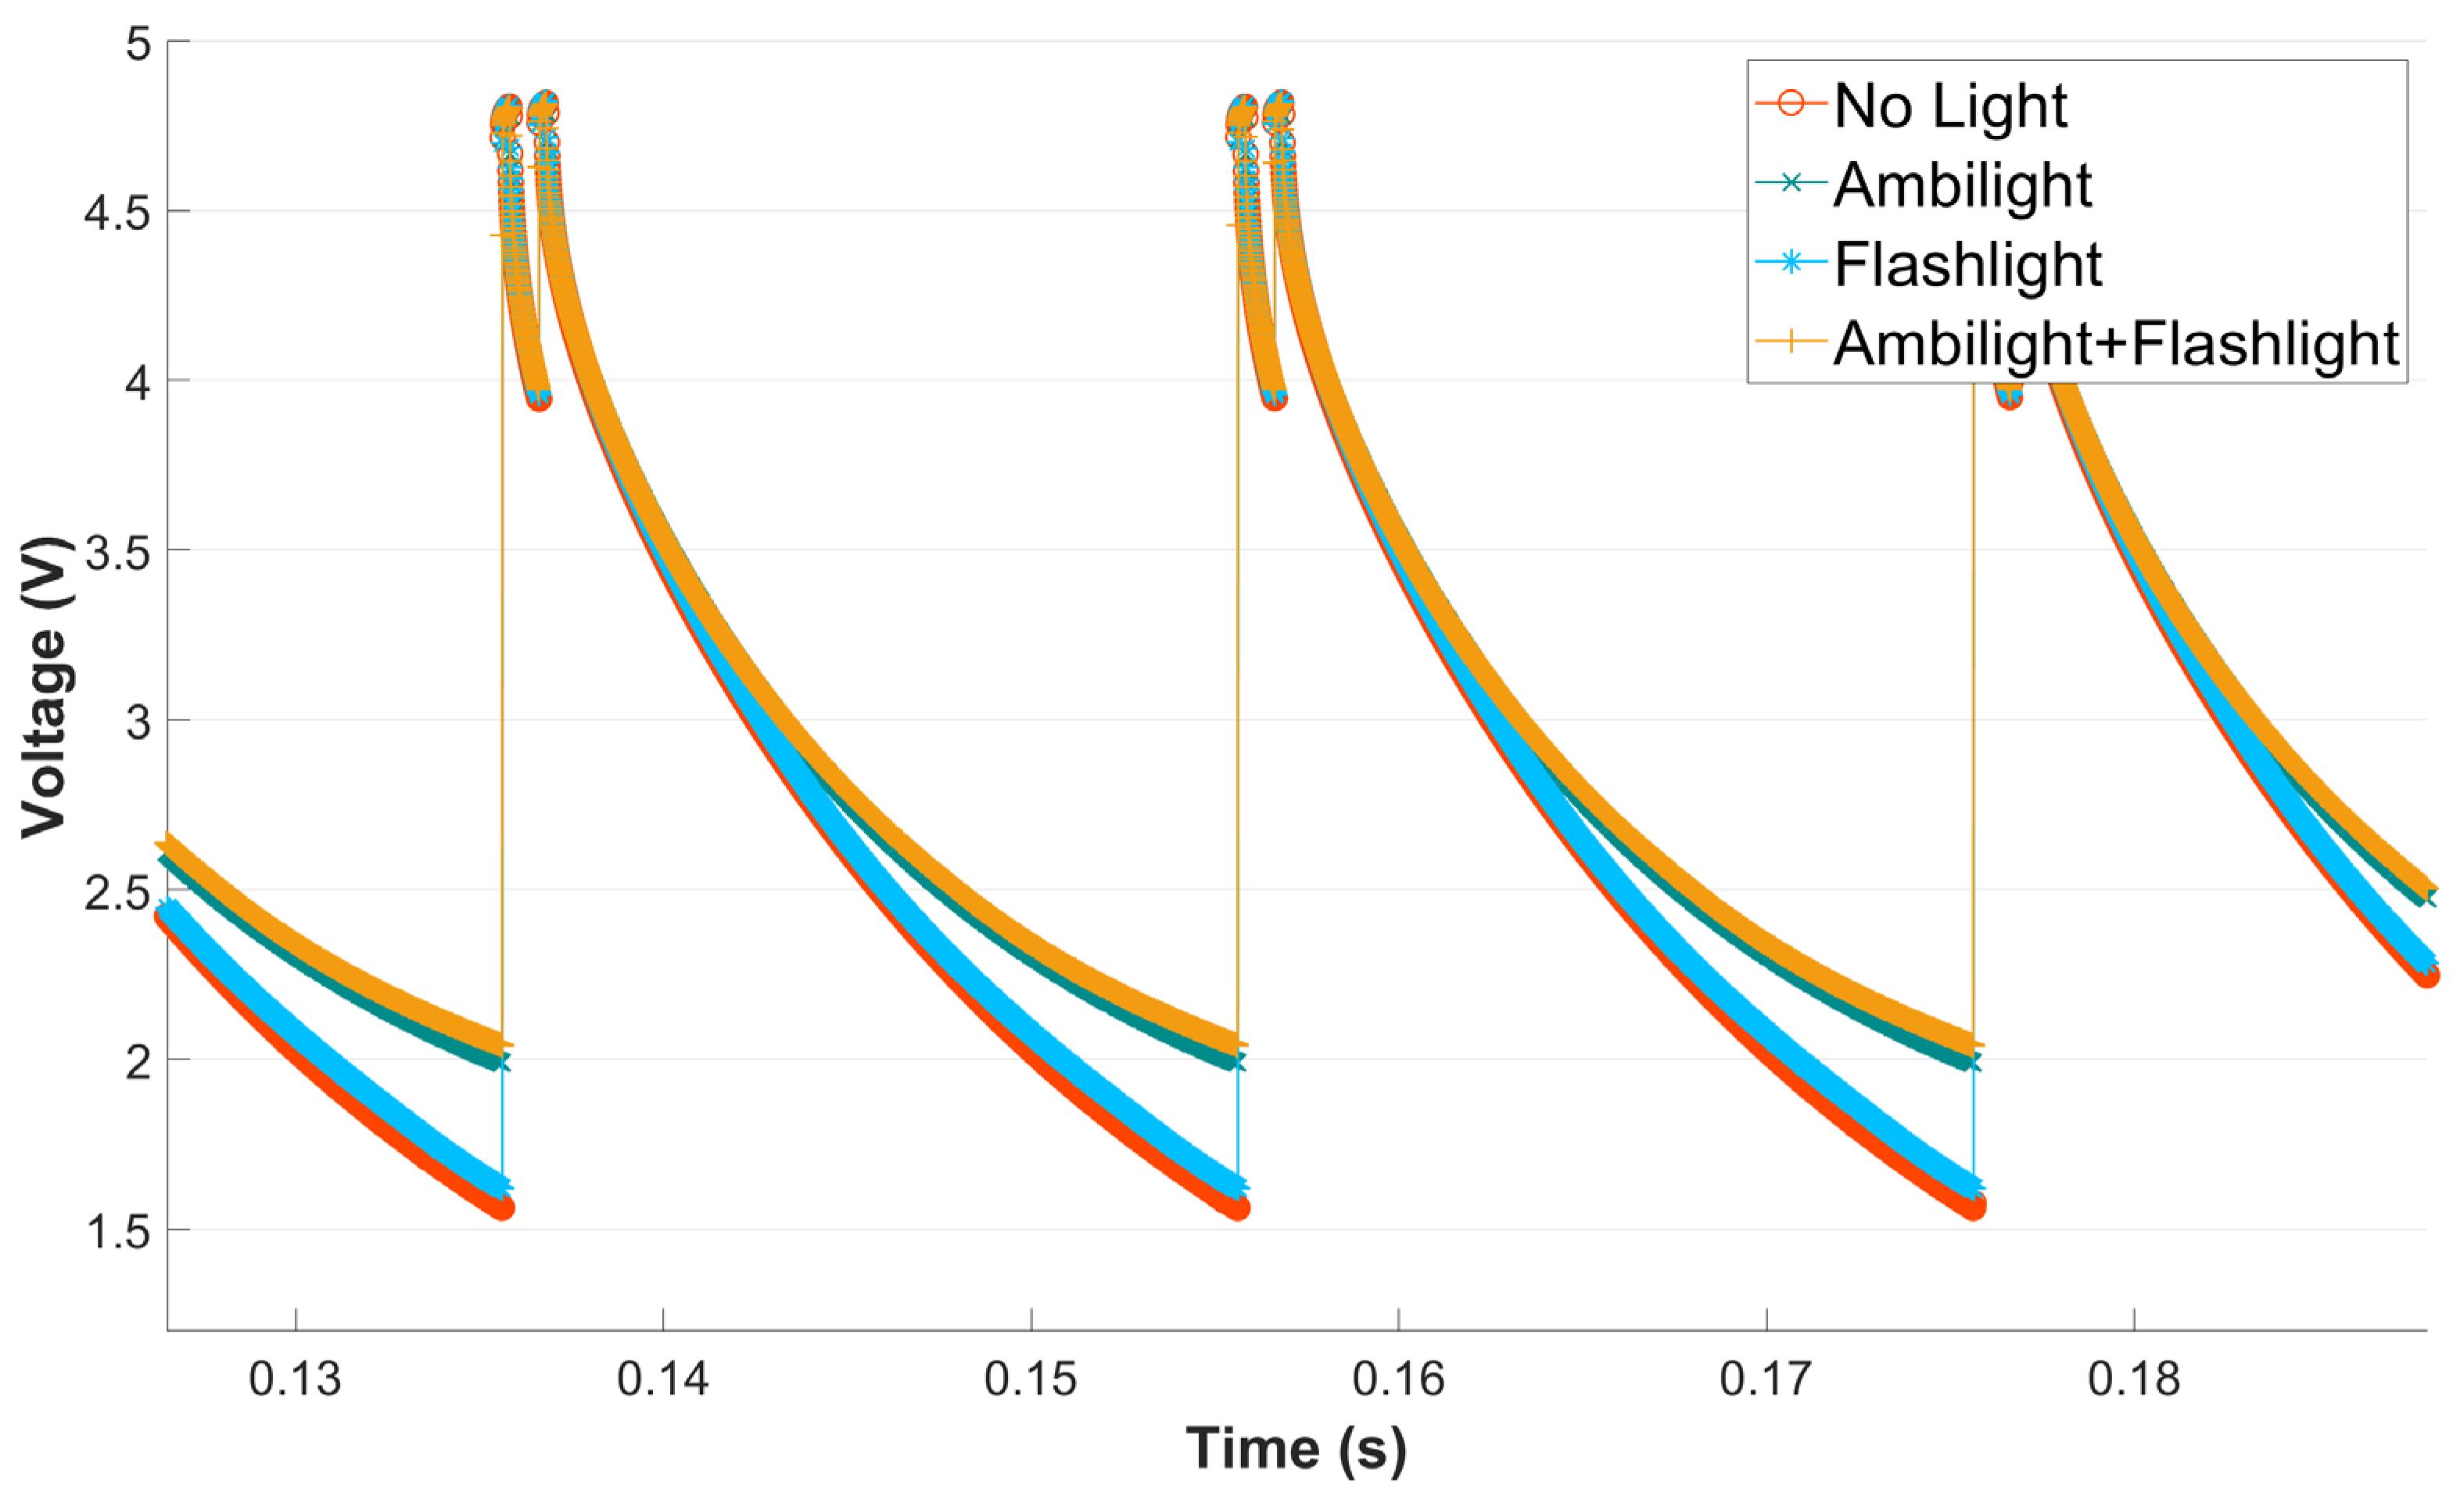
This increased voltage is then recorded by the DAQ. The voltage readings are saved as a CSV file at a rate of 100 kHz. Since the resistance of a light-dependent resistor (LDR) is inversely proportional to the intensity of incident light, the experiments were conducted under ambient lighting conditions, with the laser positioned in close proximity to the LDR and operated at high power to ensure a relatively strong optical signal from the source. Figure 4 presents a comparison illustrating the effect of ambient illumination. Ambient light influences only the baseline mean voltage, with higher ambient light levels resulting in an increased baseline voltage.
Figure 4.
Ambient light effect comparison.
The primary consideration in this setup is to avoid exposure to intentionally directed bright light sources—beyond the targeted measurement beam—particularly those exceeding the illumination limits specified in the sensor’s datasheet. Provided this condition is satisfied, ambient lighting does not adversely affect the integrity of the measurements. It should be noted that although there are many precise voltage measurement methods (e.g., instrumentation amplifier circuits), the LDR and voltage divider approach is specifically preferred in this study given that response time and voltage changes are more important for the present application than the exact voltage value.
The components were selected based on their availability in our laboratory. Data Acquisition (DAQ) devices are commonly utilized in fluid mechanics physical experiment laboratories; however, for the broader application of the method, various data loggers and digital oscilloscopes (with an external DC power source) or microcontrollers equipped with an Analog-to-Digital Converter (ADC) inputs can serve as suitable alternatives. It is worth noting that any external DC power source can be used with devices that require an external power source. However, the resistor must be selected according to the LDR and DC power specifications. Additionally, care must be exercised to ensure that the response time of the LDR is compatible with the intended sampling frequencies.
In microcontroller-based systems, the temporal accuracy of signal sampling—particularly timing jitter—is generally more critical than the resolution of the ADC itself. To ensure consistent and reliable acquisition of analog data, interrupt-driven sampling methods are recommended over delay-based approaches, which may introduce timing inconsistencies. Some microcontroller examples that can be utilized for the proposed method are presented in Table 1.
Table 1.
Microcontroller devices that can be used in low-cost PIV time calibration validation.
Different sensor types exhibit distinct responses to incident light. Table 2 shows the rise and fall times of various light sensor technologies. The rise time is defined as the duration required for the sensor output to transition from its baseline value to the maximum level achievable under illumination, whereas the fall time represents the time needed for the signal to return to its baseline after the removal of the light stimulus. Although the ramp-up and ramp-down durations may influence signal interpretation, the repeatability and consistency of these transitions within each pulse ensure that they do not introduce distortion into the measurements.
Table 2.
Sensor type comparison.
In this study, a light-dependent resistor (LDR) was employed as the sensing element; however, the use of a reverse-biased photodiode is also considered a suitable alternative. From the perspectives of cost and availability, the selection between an LDR and a photodiode introduces only a marginal difference, making both sensor types viable options for the intended application.
2.3. Software Customization and Troubleshooting
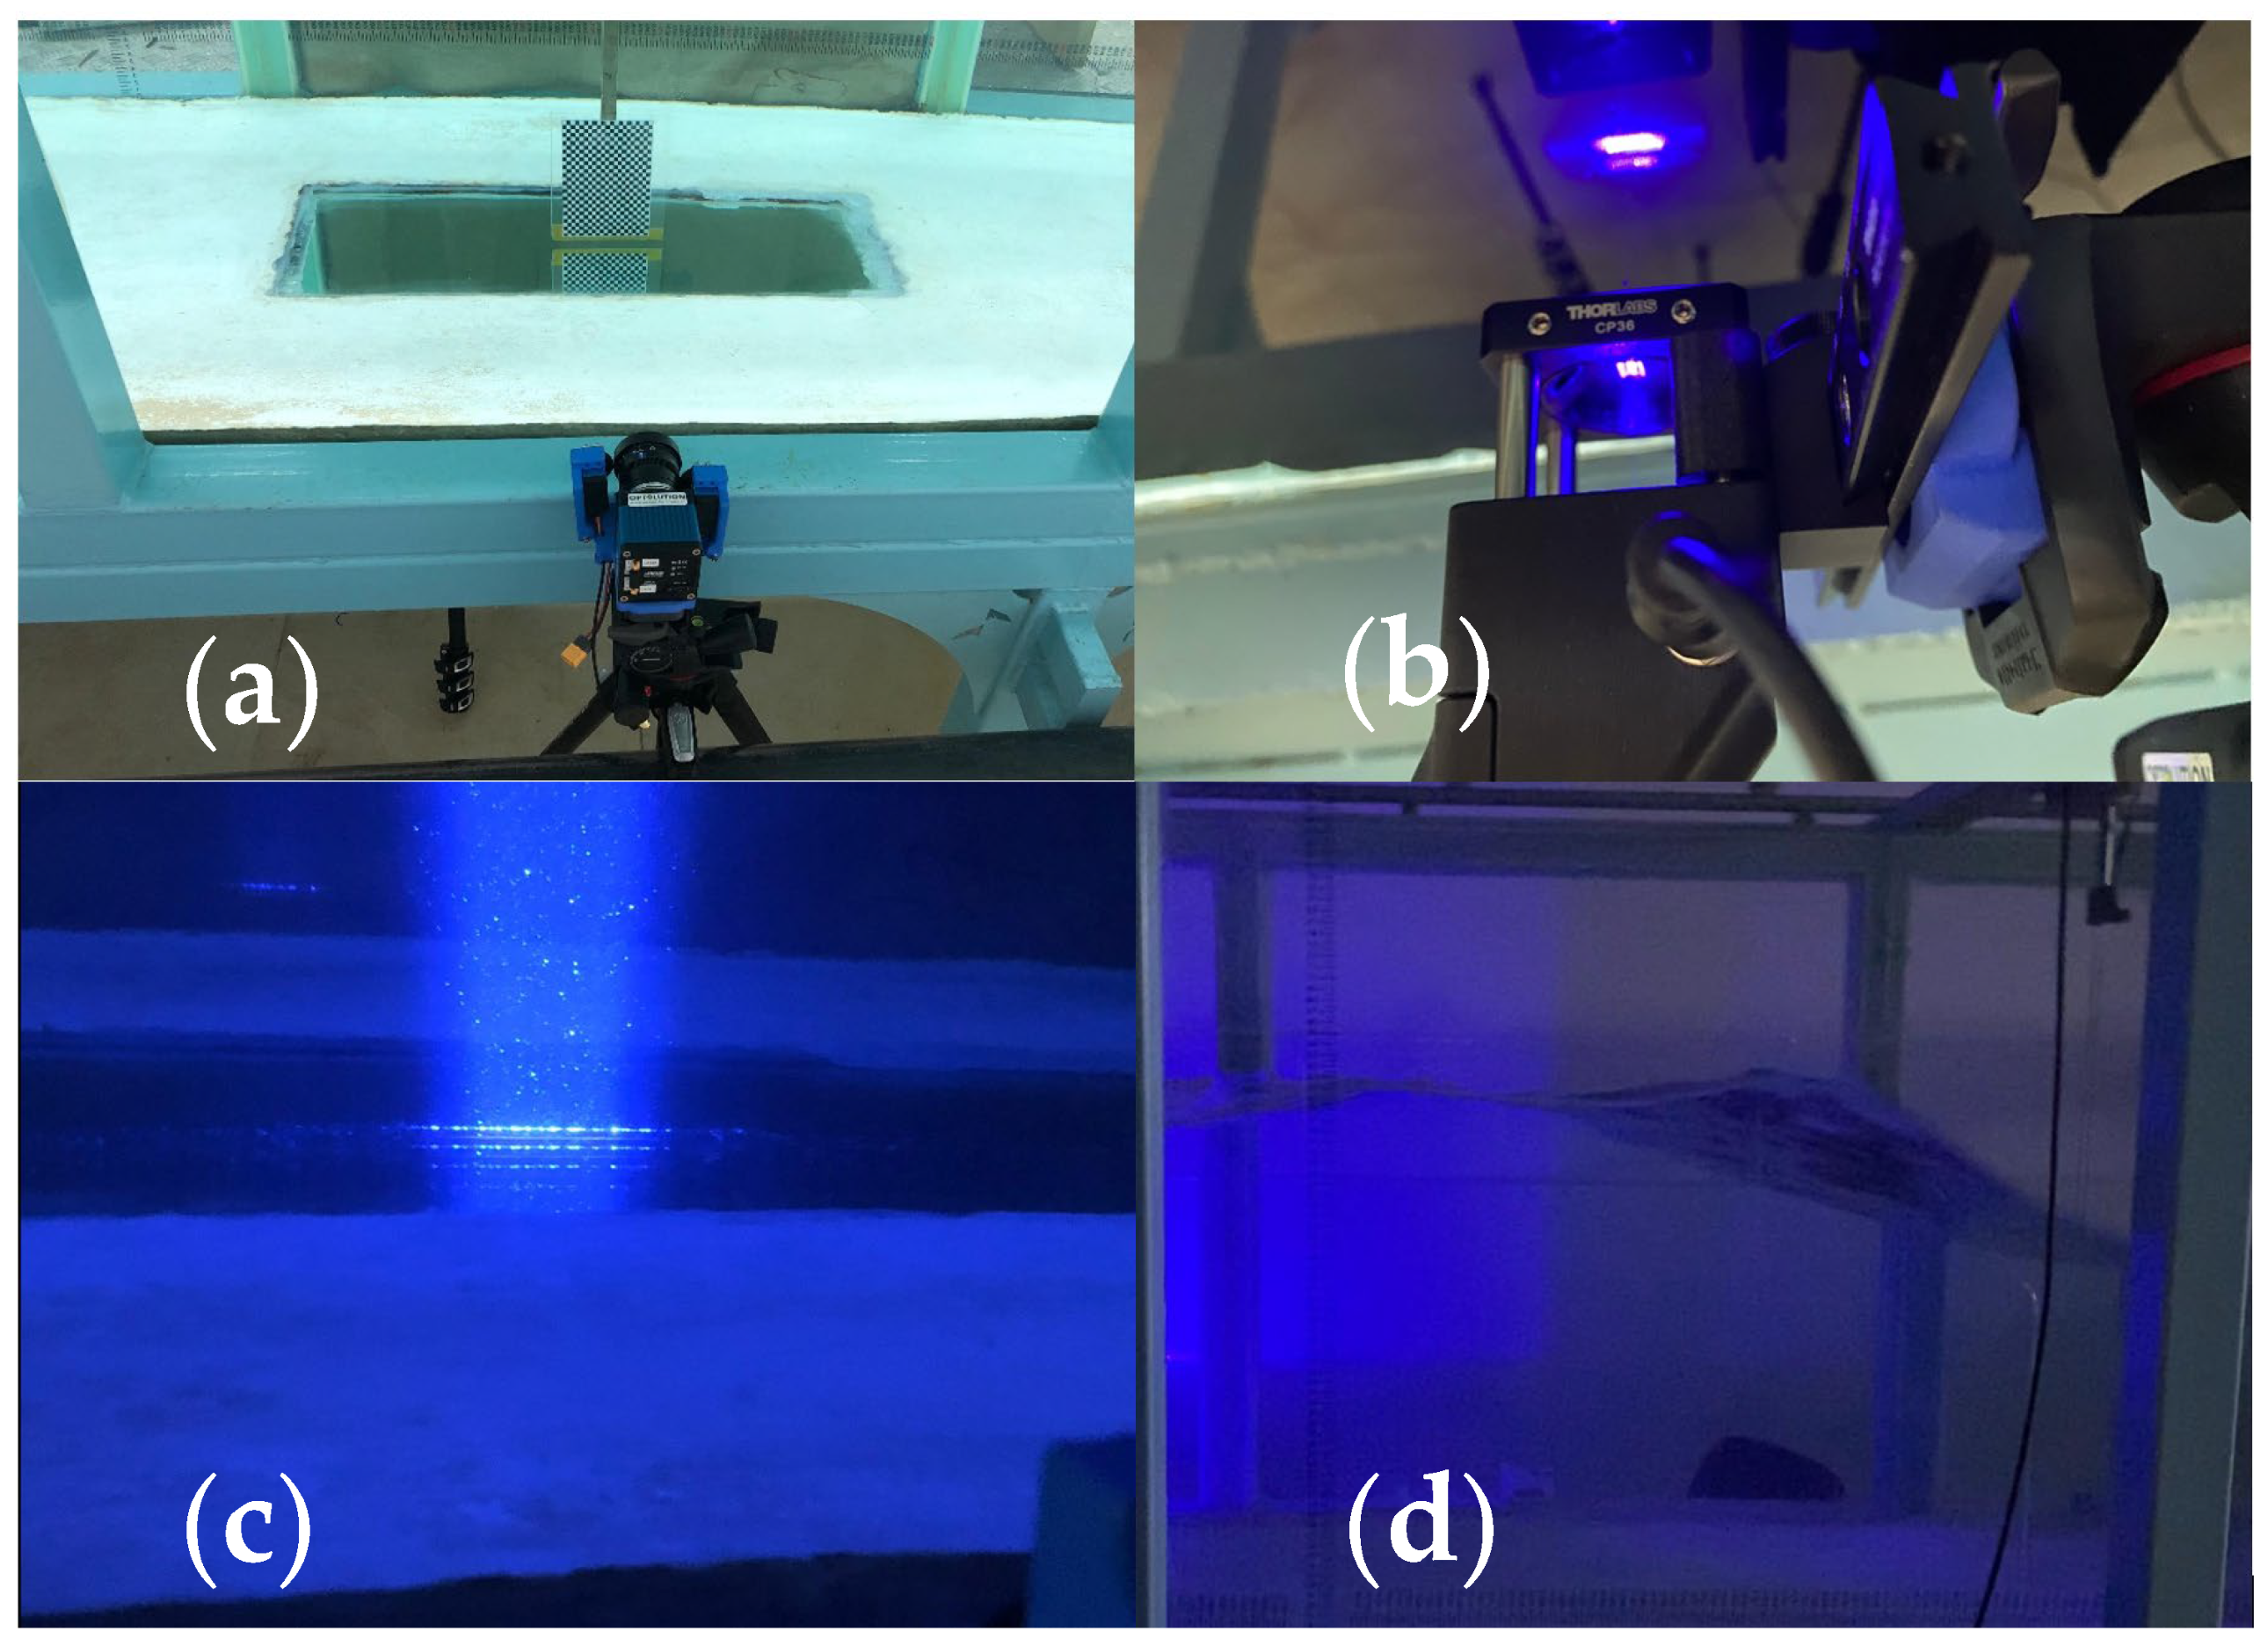
The proposed method was tested using an OPTOLUTION LD-PS 5 W laser equipped with a synchronizer and a pco.panda.26.DS camera, operated within PIVlab version 2.53. Extended time-calibration validation tests were conducted in the Dogus University (Istanbul) wave flume using Edinburgh Designs wave gauges. Views from the experimental setup, laser sheet, wave probe and laser pulse in the wave experiment can be seen in Figure 5. In Figure 5, the following components of the setup are shown:
- (a)
- The PIV camera positioned alongside a checkerboard calibration target for spatial calibration.
- (b)
- The laser unit mounted securely beneath the flume’s bottom observation window.
- (c)
- A side-profile view of the illuminated vertical laser sheet penetrating the water column inside the wave flume.
- (d)
- The active measurement phase, capturing the propagation of a generated wave through the laser sheet.
Figure 5.
Views from the experimental setup of wave flume experiments. (a) the camera and a checkerboard calibrator, (b) the laser source under the observation window, (c) the light sheet inside the wave flume, and (d) generated wave propagation.
During the wave flume experiments, initial measurements relied on the acquisition frequencies prescribed by the PIVlab software (v2.53), alongside the wave surface elevation parameters recorded via the Edinburgh Designs wave gauges. However, upon data analysis, a distinct inconsistency in the recorded wave periods was observed. From a physical standpoint, wave orbital velocity and wave surface elevation measurements must exhibit temporal harmony regarding their periods, allowing for the expected phase shifting within the boundary layer. To identify the root cause of this discrepancy, a systematic diagnostic procedure was implemented. First, manual verification was conducted by timing 40 consecutive wave crests to establish a baseline empirical wave period. This estimation confirmed the accuracy of the physical wave generation (~0.5 Hz), strongly indicating that the discrepancy originated from an underlying issue with the PIV system’s acquisition frequency, specifically the laser-camera synchronization. Consequently, the proposed sensor method was deployed to inspect the actual laser pulses emitted during the prescribed 15 Hz setting. This hardware inspection revealed a critical firmware behavior: although the timing within a pulse pair (the Δt utilized for velocity vector calculation) was precise, the time interval between consecutive pulse pairs, which dictates the overall acquisition frame rate, was inconsistent and deviated from the software-prescribed 15 Hz. This internal hardware delay systematically stretched the temporal axis, causing the initial PIV measurements to erroneously underestimate the wave frequency. To resolve this issue, a time correction was applied by recalculating the temporal axis of the data array using the true, hardware-verified acquisition frequencies (detailed in Table 3). Table 3 summarizes the selected PIV processing options together with the values obtained using the time-calibration validation method.
Table 3.
PIVlab (v2.53) vs. time calibration validation comparison.
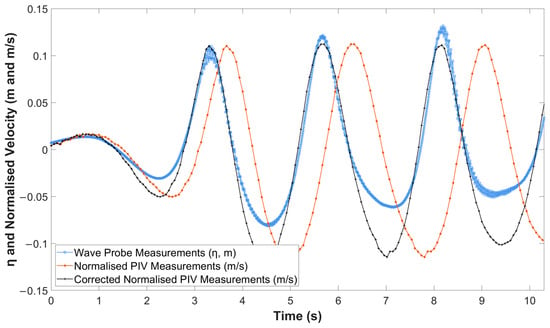
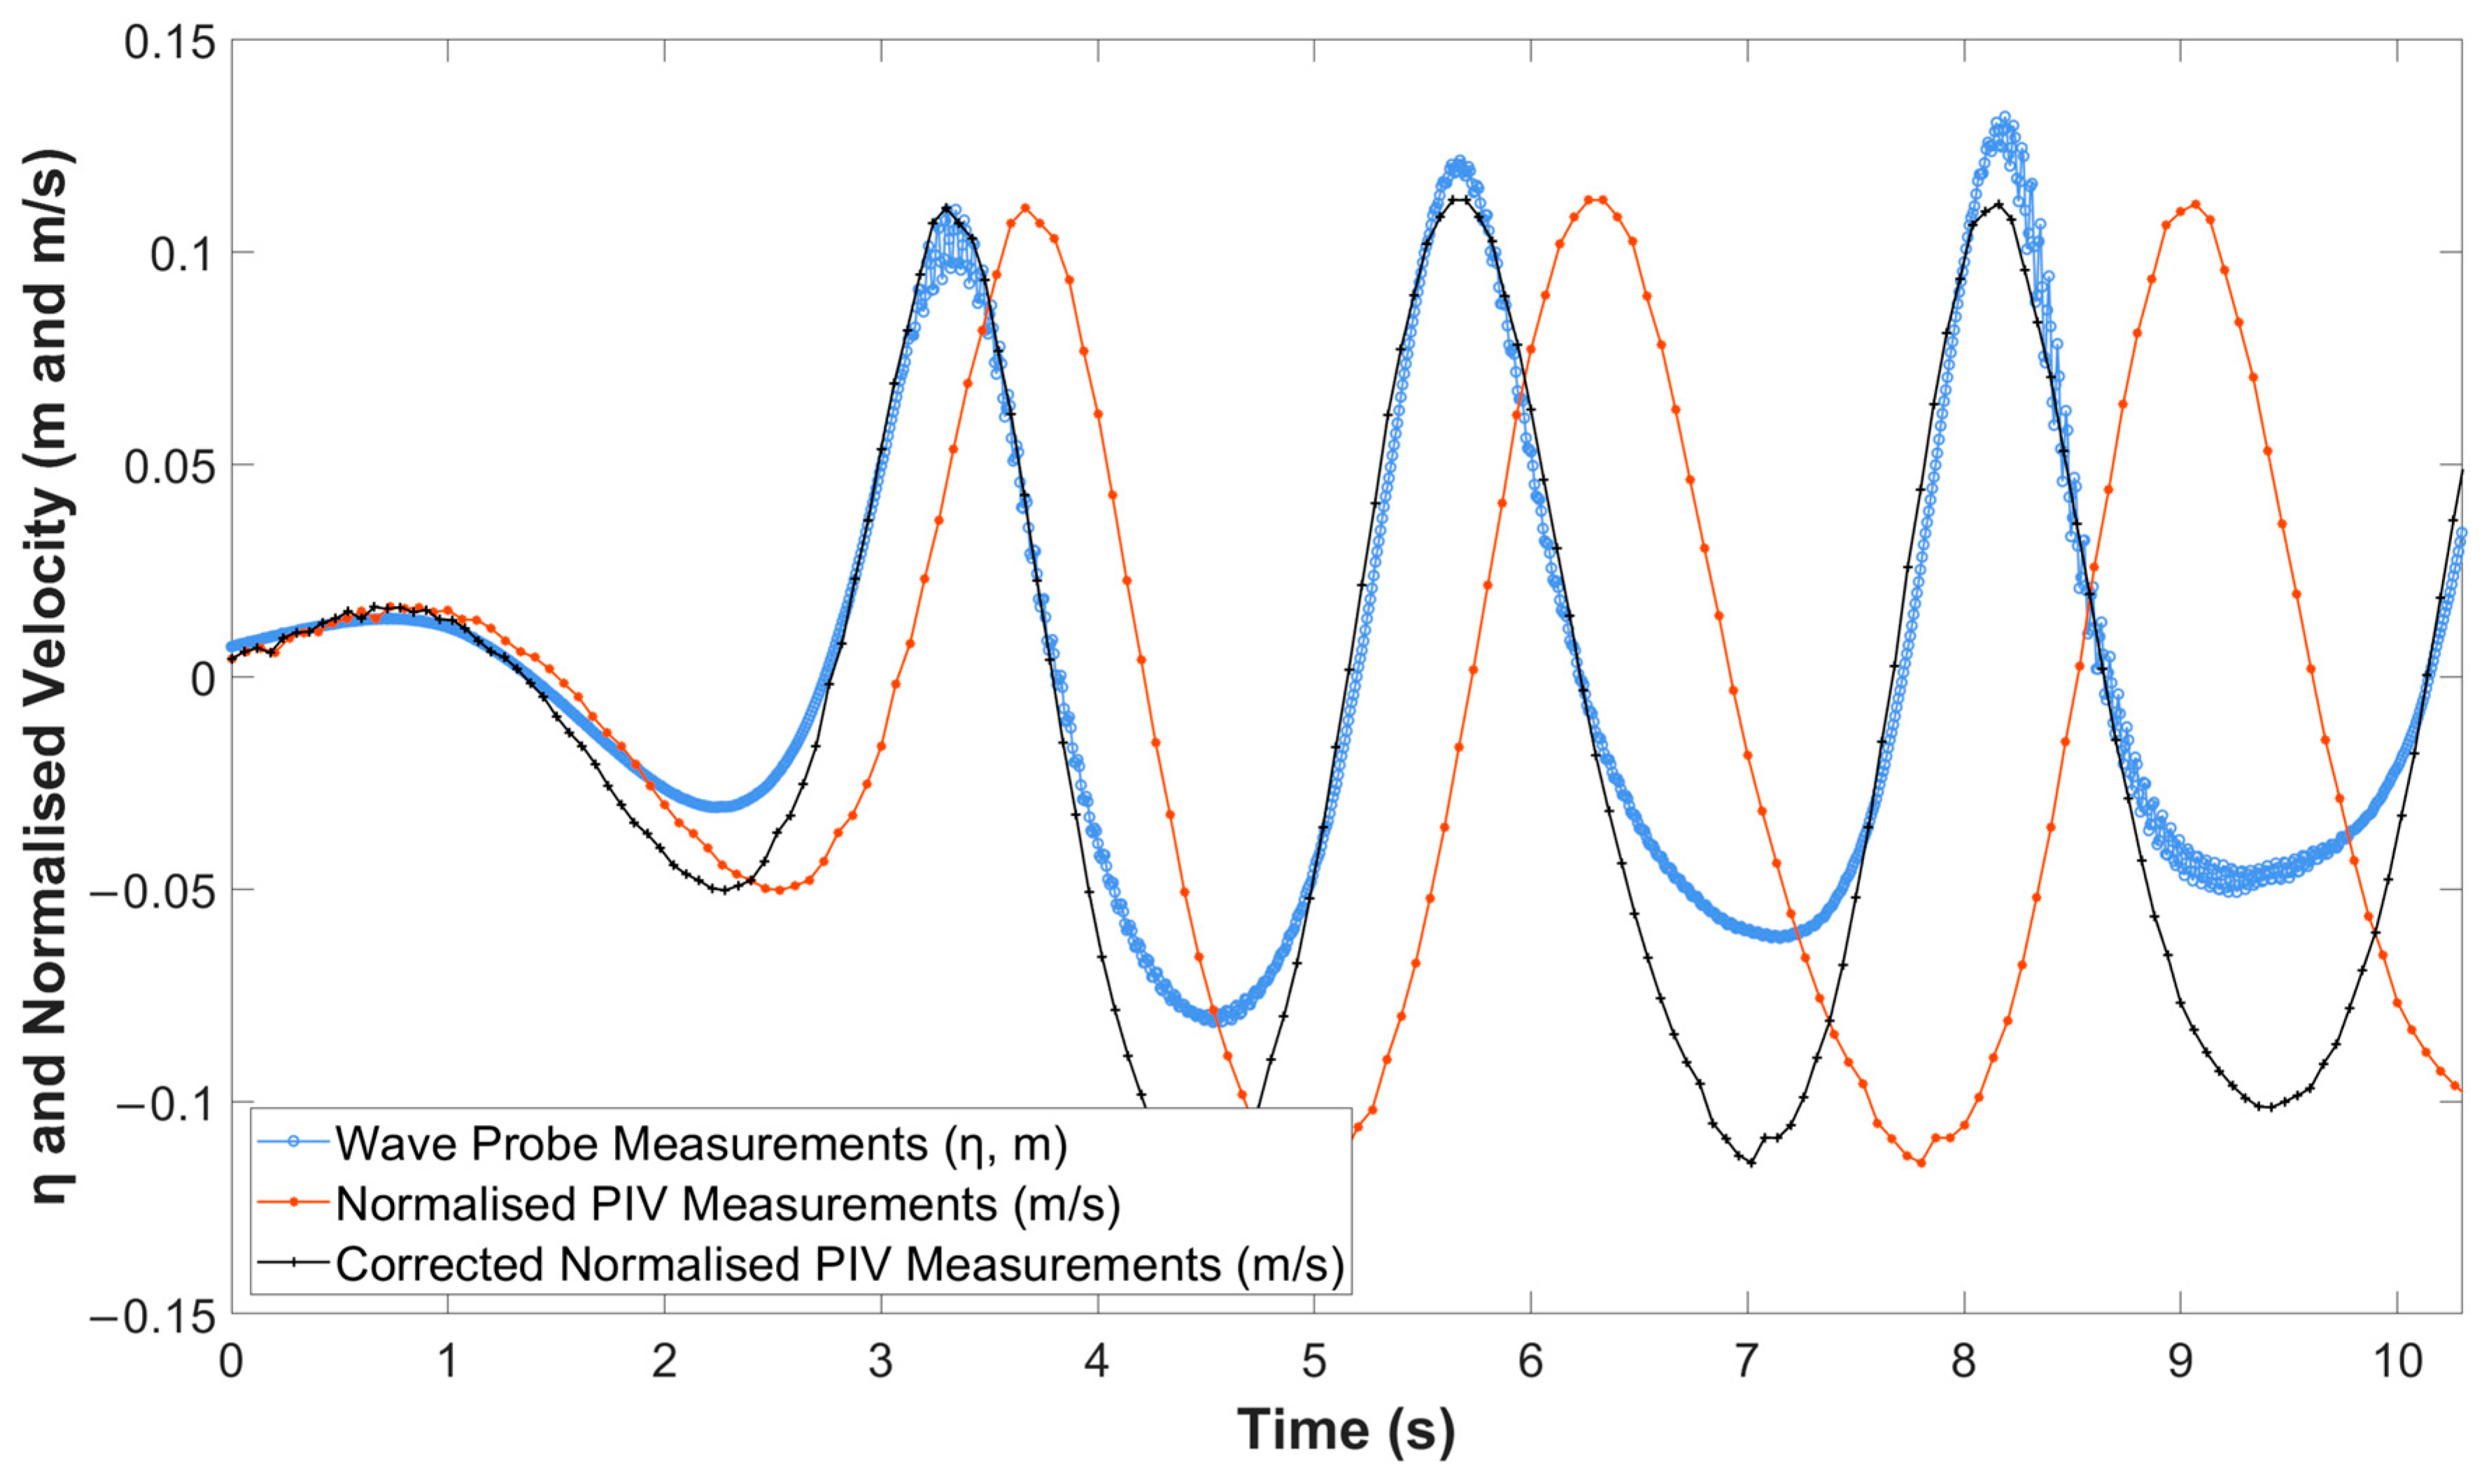
Finally, the measurement start times of the wave gauges and the PIV data were precisely synchronized, and the coherent results were plotted (Figure 6) using the corrected temporal axis. For repeatability purposes, the wave height and horizontal velocity of the first generated waves were analyzed. The wave probes operated at a sampling frequency of 128 Hz, whereas the PIV measurements were performed at 15 Hz using a double-pulse acquisition mode. The results indicate that the 15 Hz acquisition option in PIVlab (v2.53) slightly underestimates the wave period. As illustrated in Figure 6, the wave probe measurements, normalized PIV measurements, and time-corrected normalized PIV measurements are presented using distinct colors and markers for clarity.
Figure 6.
Wave experiment results (time series).
The default settings of the PIV software often lack flexibility, especially for the commercial options. However, these can be modified to suit custom requirements for the open-source options. In the present application, PIVlab was used with a pco.panda.26.DS scientific camera, which supports a maximum sampling frequency of 45 Hz (double-pulsed) in version 3.09. For PIV applications, selection of sampling frequency is generally a trade-off between temporal and spatial resolution.
Upon inspecting the source code of PIVlab (coded in MATLAB), it was discovered that the capture frequencies can be modified. In the file source file ‘+acquisition\select_capture_config_Callback.m’, parameters related to camera capture can be adjusted. These parameters are as follows:
- −
- master_freq—controls the synchronizer-camera operating frequency.
- −
- avail_freqs—determines the available double-frame capture options.
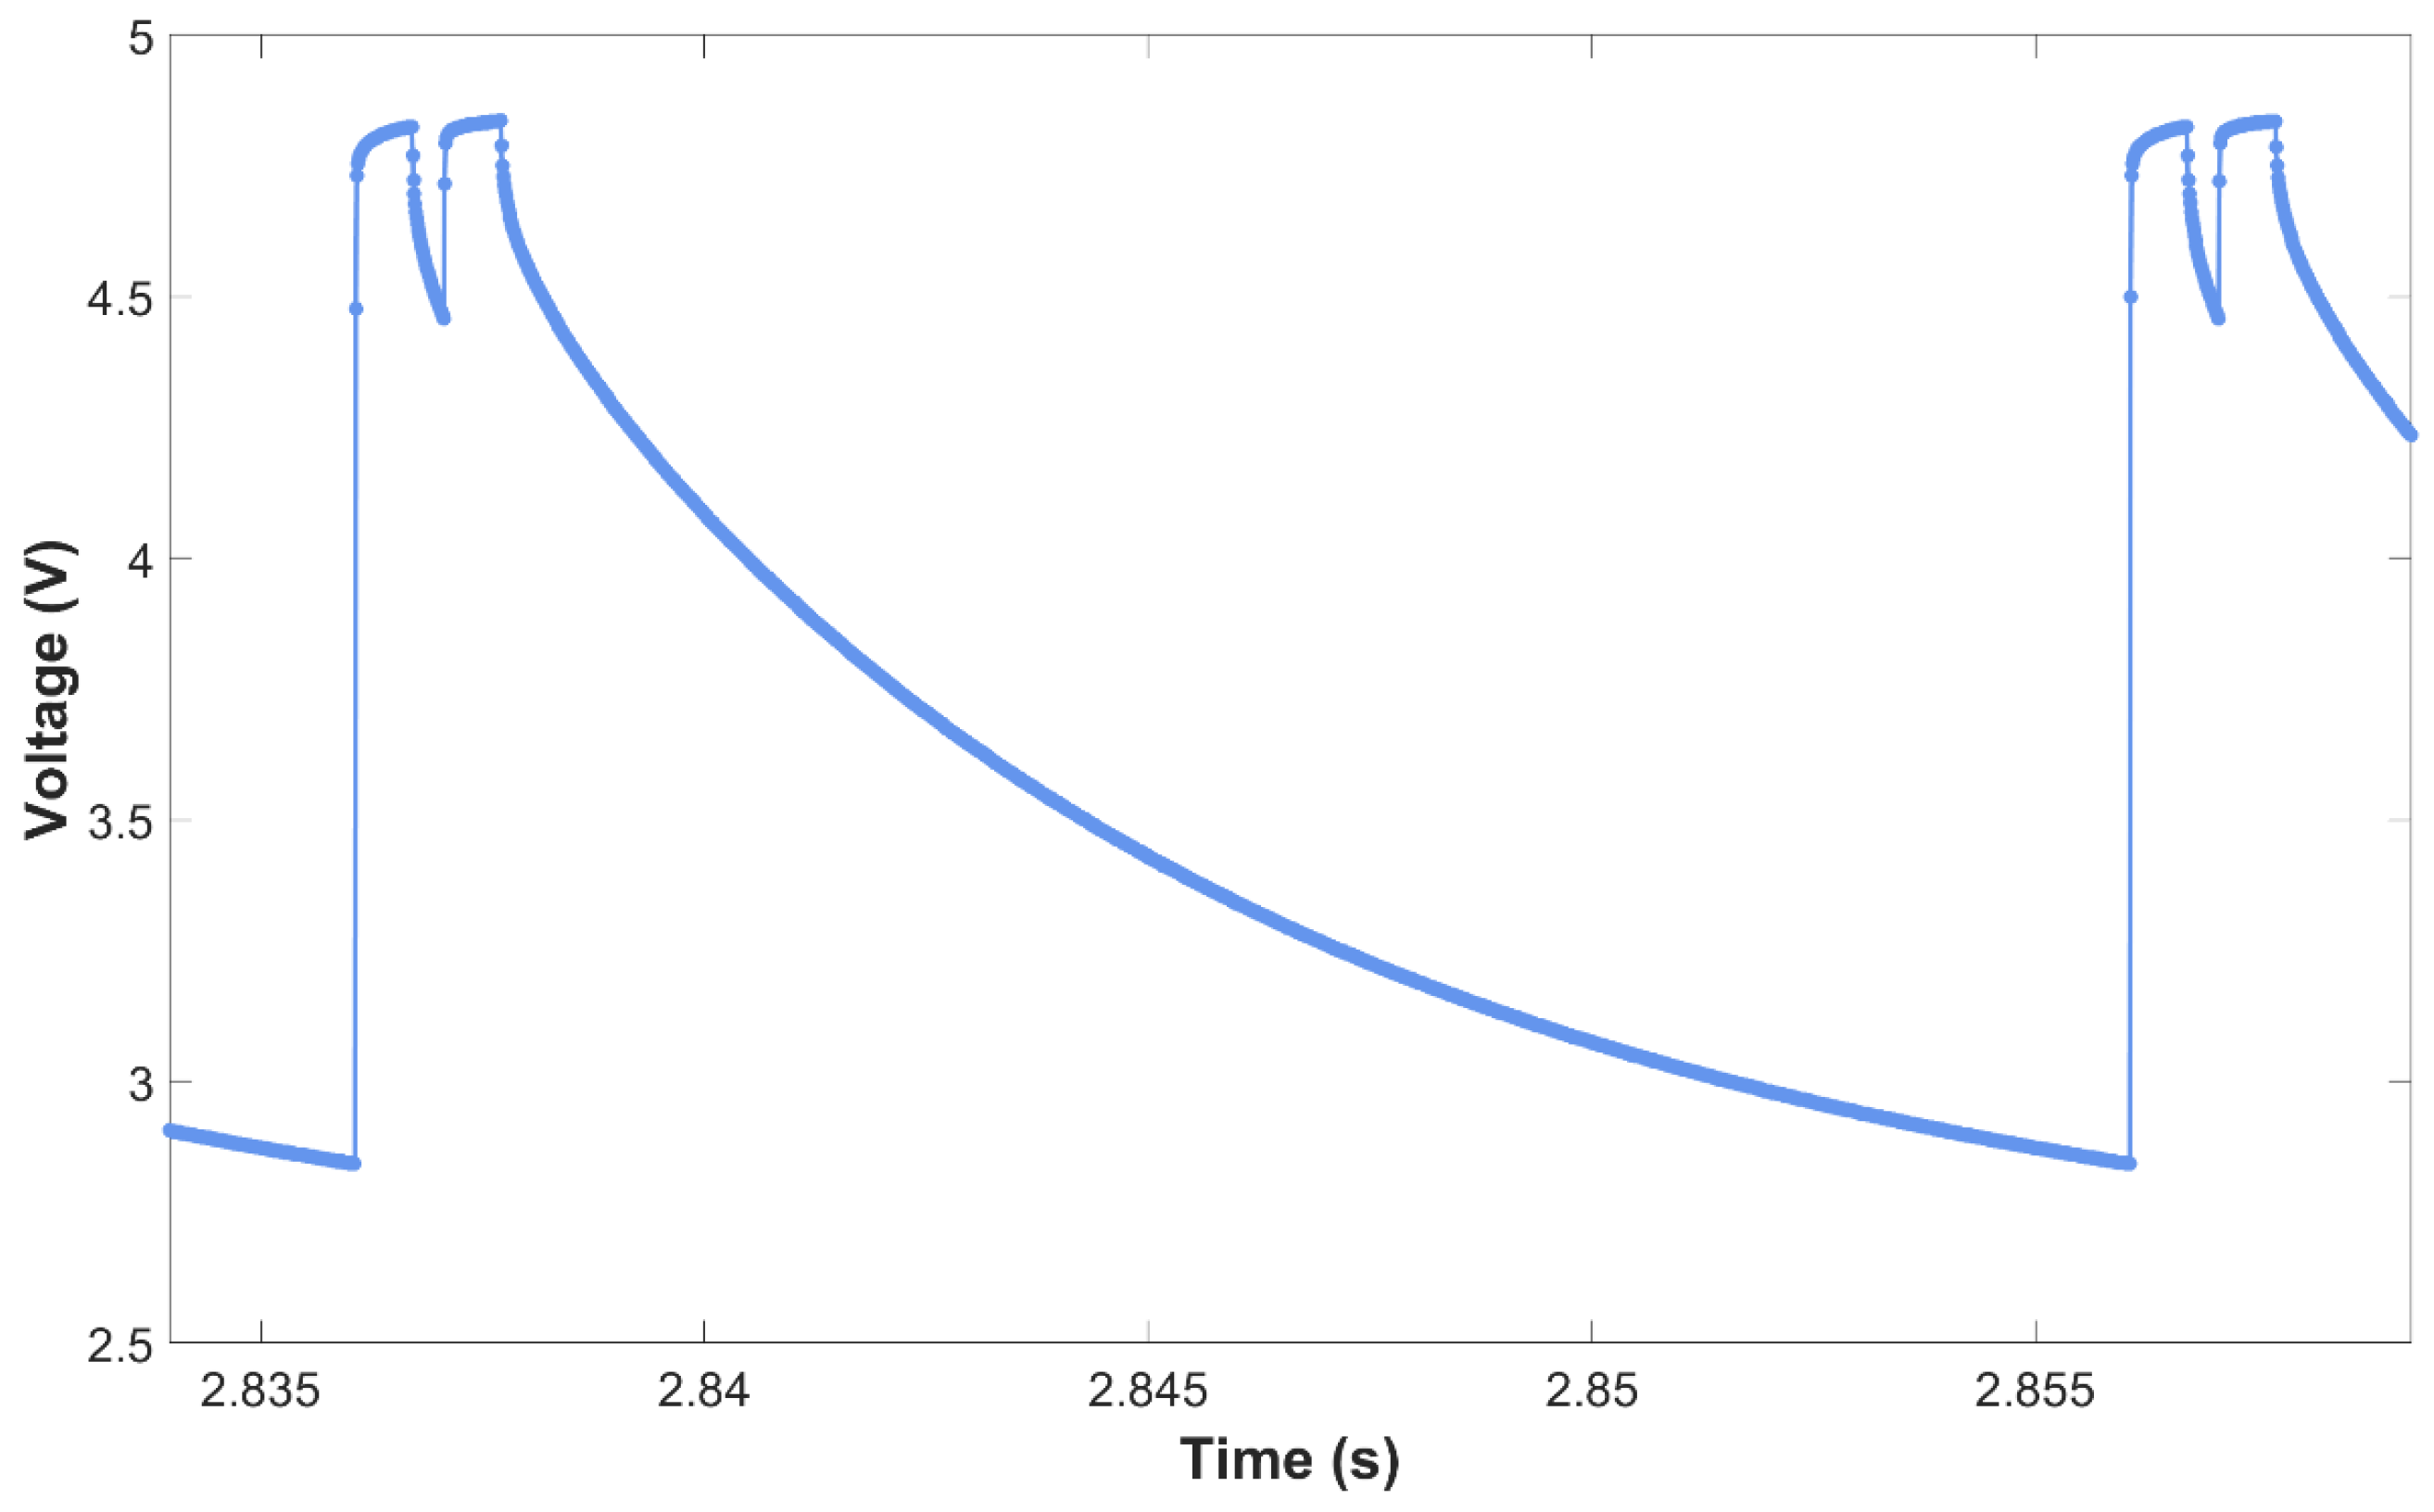
The tests in the present application of the proposed novel method were conducted with master frequencies of 50 Hz and 60 Hz, and the results confirmed that the system performed accurately as expected (see Figure 7). Additionally, it was observed that available frequencies are integer divisions (see Table 3) of the master frequency:
- −
- 50 Hz → 50/1 = 50, 50/2 = 25, 50/3 = 16.67 Hz.
- −
- 60 Hz → 60/1 = 60, 60/2 = 30, 60/3 = 20, 60/4 = 15 Hz.
Figure 7.
Voltage readings of the LDR at 50 Hz double-pulse frequency.
3. Results
Sensitivity Analysis and Experimental Validation
Following the implementation steps described above, the proposed method was validated through a sensitivity analysis conducted over a range of laser pulse frequencies. Table 4 details the specific PIV laser frequencies and their corresponding data acquisition sampling rates, where the symbol ‘+’ denotes the combinations at which the experiments were conducted. The lower limit of the measurement was selected to coincide with the laser frequency itself (for example, for a 50 Hz laser frequency, successful measurements began at a readout frequency of 50 Hz.)
Table 4.
Sensitivity analysis tests.
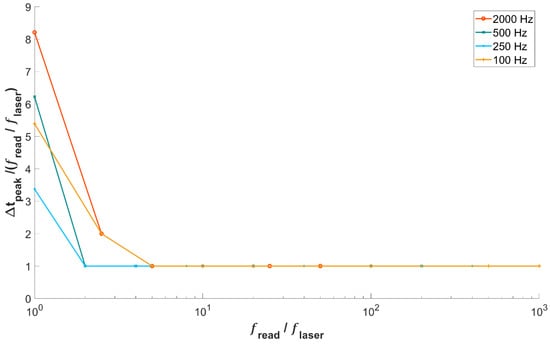
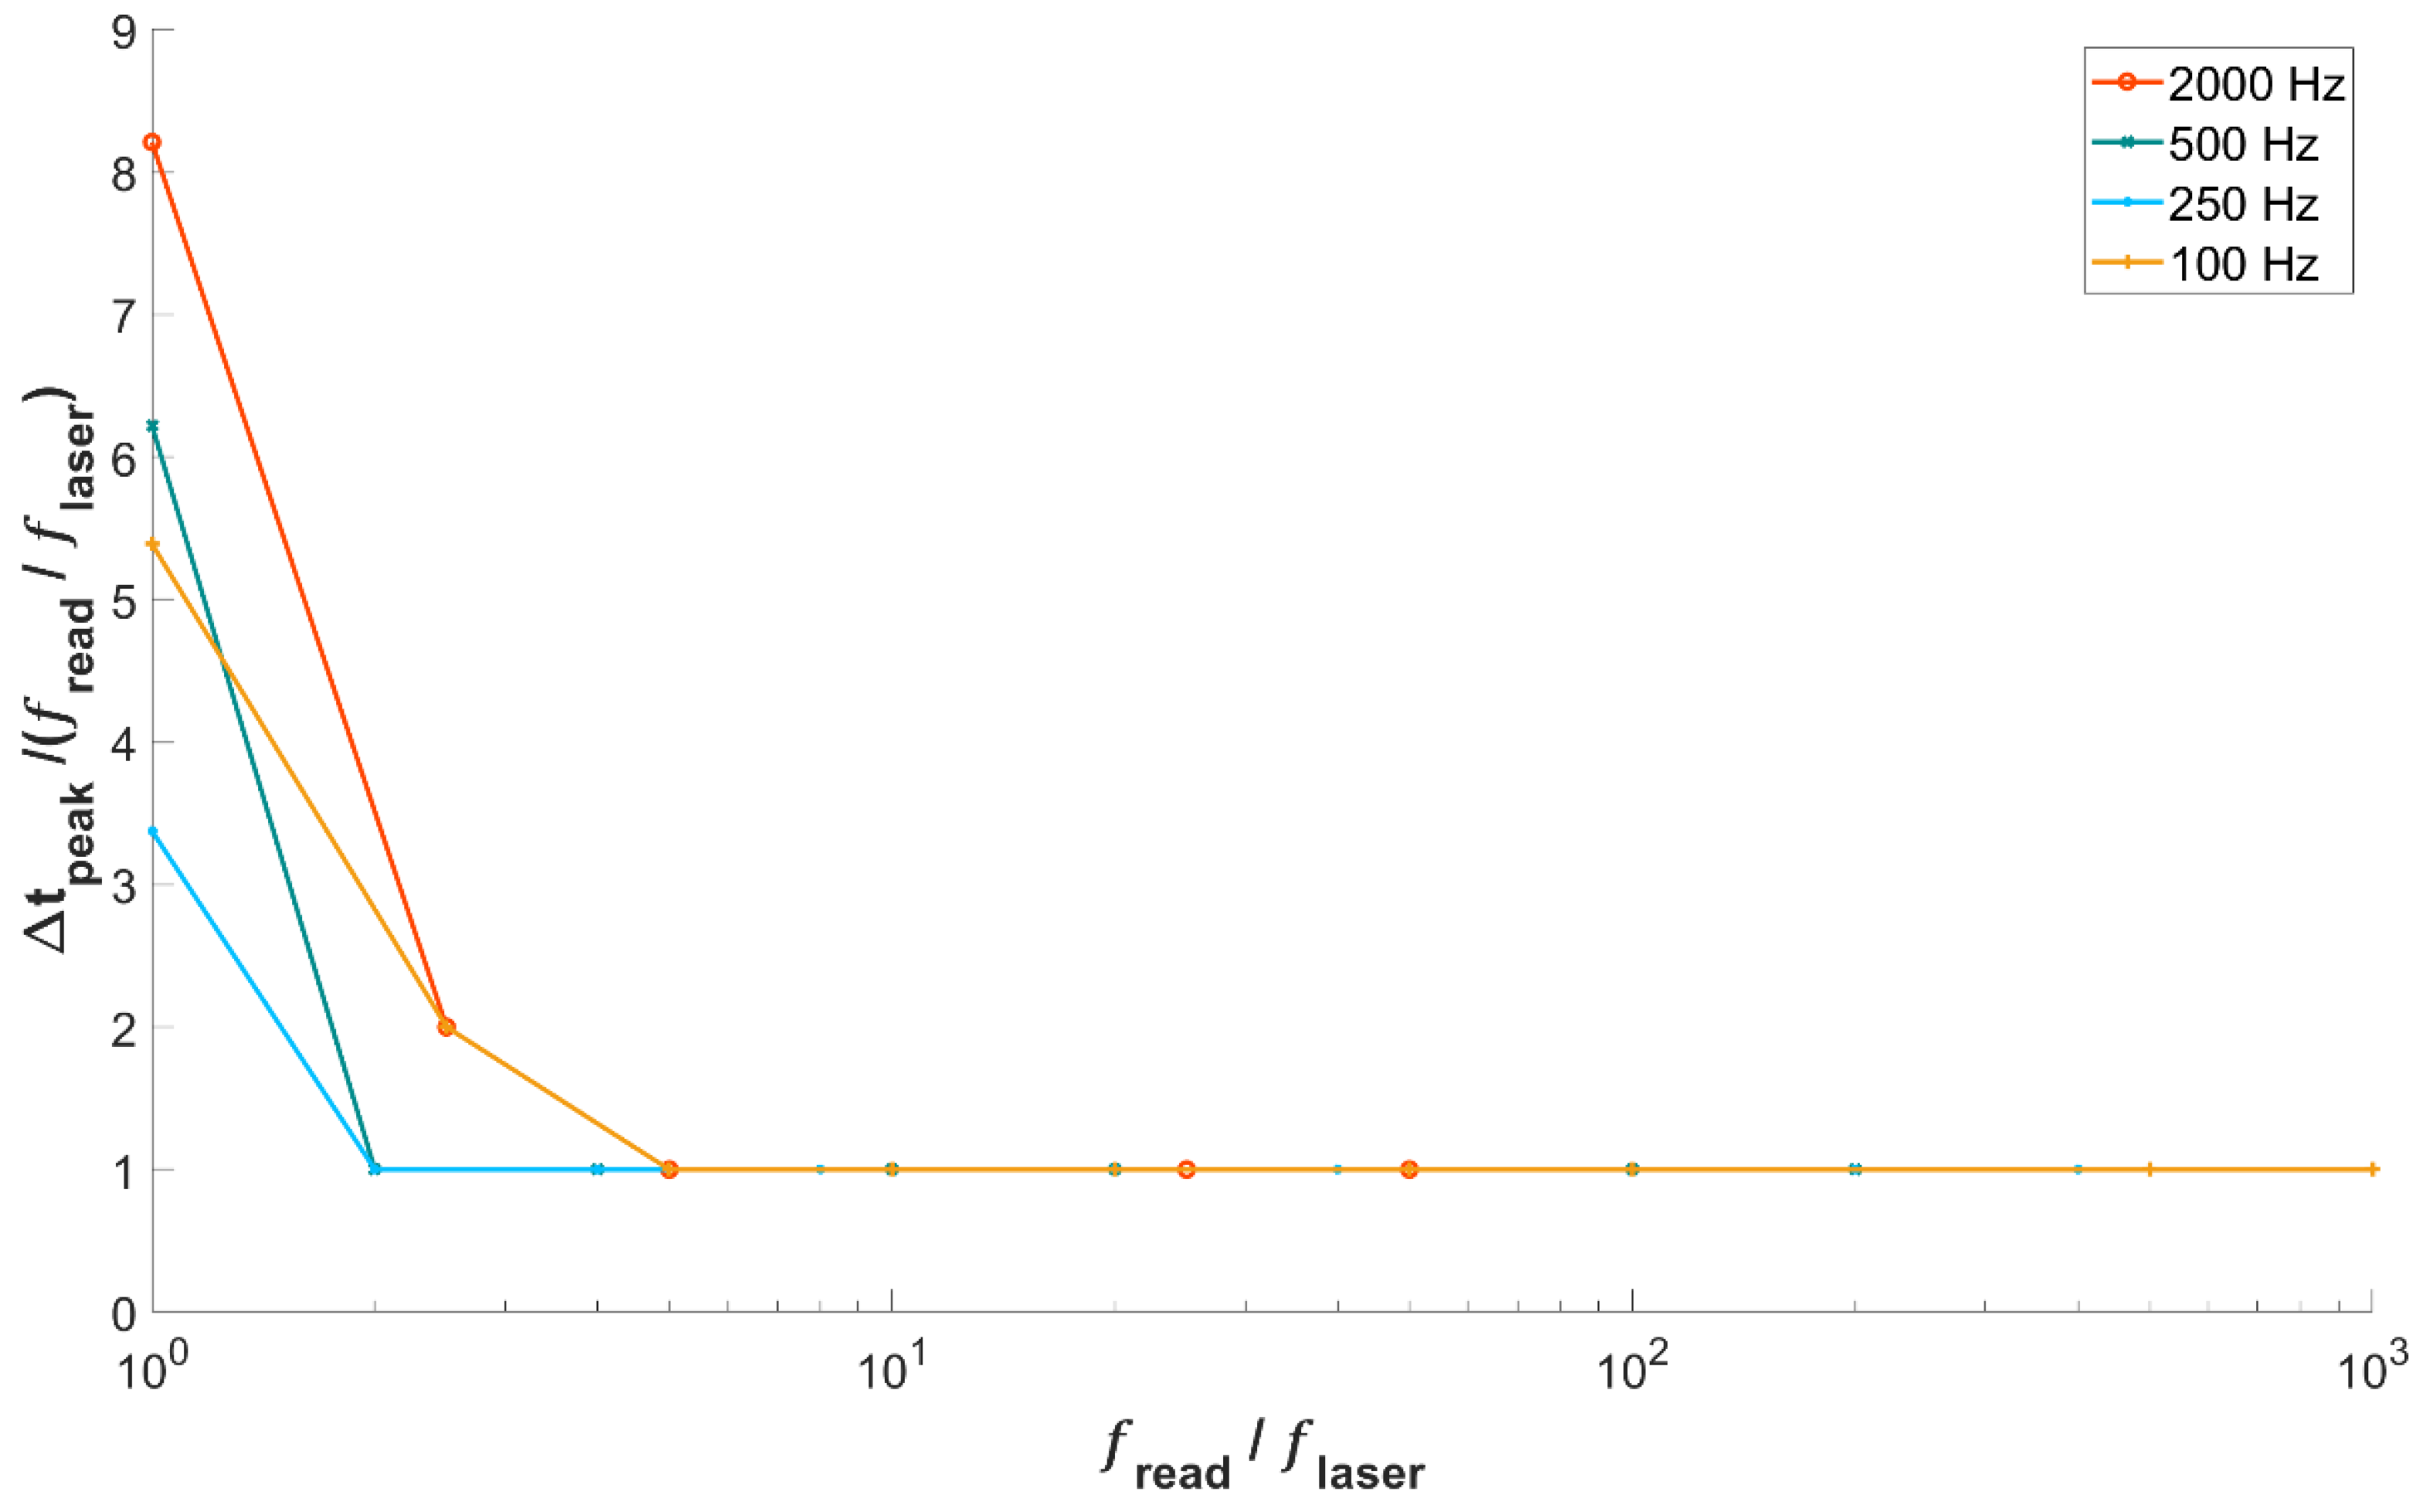
Figure 8 illustrates the sensitivity analysis results for laser pulse frequencies of 100 Hz, 250 Hz, 500 Hz, and 2000 Hz. For each case, the signal was analyzed to identify the local maxima corresponding to the second pulse of the double-pulse sequence. The temporal interval between successive peak points was then calculated.
Figure 8.
Sensitivity analysis of laser pulse frequencies.
The results indicate that any integer read-pulse frequency ratio (defined as the ratio of readout frequency to PIV laser frequency) equal to or greater than two enables accurate capture of the PIV laser frequency. In Figure 8, the read-pulse frequency ratio is represented on the horizontal axis using a logarithmic scale for visualization purposes, while the interval time step normalized by the read-pulse frequency ratio is shown on the vertical axis.
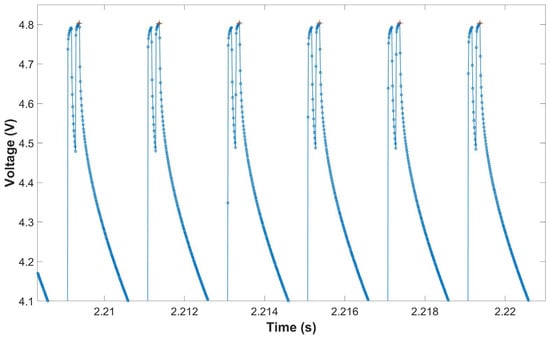
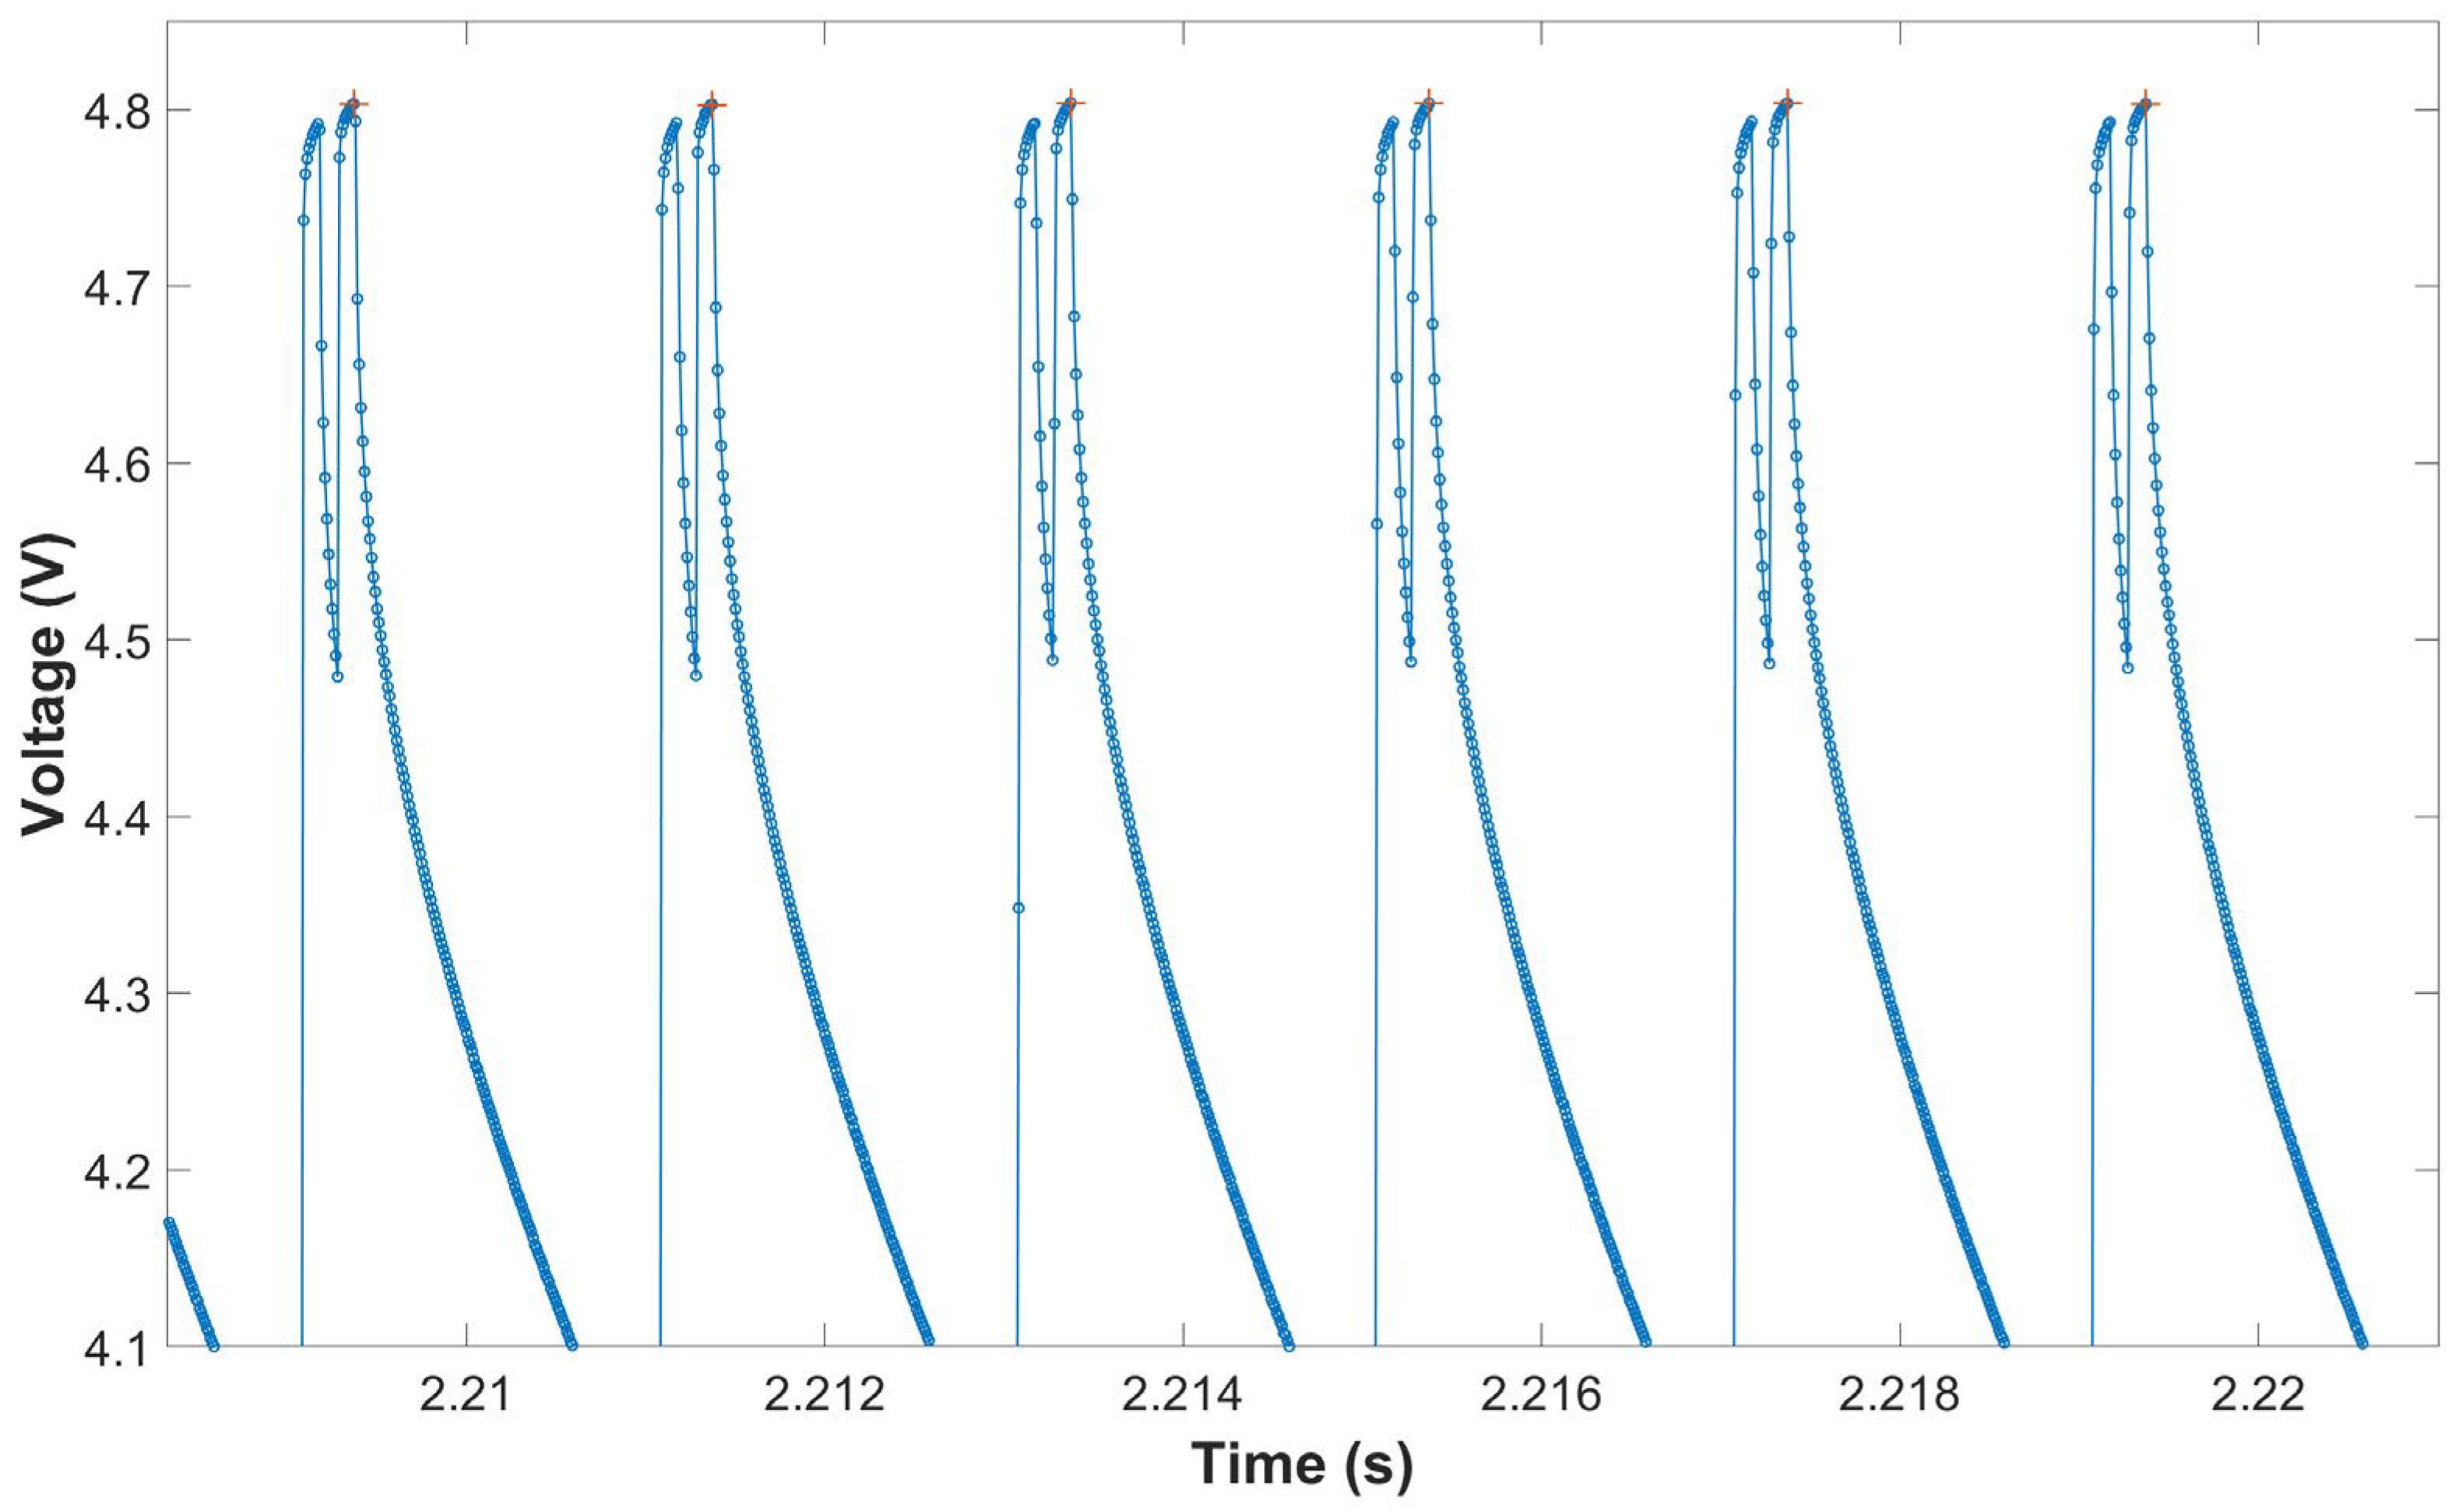
The measurements presented in Figure 9 were obtained using a double-pulse frequency of 500 Hz and a readout frequency of 100 kHz. In the figure, the plus symbols indicate the positions of the identified local maxima. It should be emphasized that the measurements performed using this method focus primarily on signal variations rather than absolute measurement values. An increase from the baseline level indicates the presence of the signal (i.e., incident light), whereas a return to and persistence at the baseline level signify the absence of the signal. Under the specified experimental conditions, the measurements yielded consistent and repeatable results, thereby confirming the validity of the proposed method. As explained by Shannon [18], the Nyquist sampling theorem requires at least two samples to reliably represent a signal. Hence, in practice, at least two samples are required to resolve the pulse plateau with sufficient confidence. When using LDRs in conjunction with a data acquisition (DAQ) system similar to that described in this method, it is therefore recommended that both the pulse duration and the temporal separation between consecutive pulses be no shorter than two time steps.
Figure 9.
The example of local maxima reading at 500 Hz double-pulse signal. Red plus signs (+): identified local maxima, blue lines with circles (ο): Voltage readings.
4. Conclusions
This study presents a practical and cost-effective approach for validating the time synchronization of light sources in DIY, low-cost or resource-limited PIV systems. By employing readily available components such as LDRs, simple resistive circuits, and commonly used data acquisition devices or microcontrollers, the method enables reliable detection and timing analysis of laser or LED pulses.
In the current experimental setup, accurate timing measurements were successfully obtained for minimum pulse intervals and lengths down to 0.2 ms at a 100 kHz sampling rate, which satisfies the minimum Nyquist sampling criterion for the utilized data acquisition device. As long as the system operates within these defined boundaries, no systematic measurement errors were encountered. The validation across different sampling rates not only confirms the robustness of the approach but also emphasizes the critical need to account for specific sampling constraints, such as minimum pulse duration and acquisition frequency, when working with low-cost sensing elements. Recognizing these constraints becomes increasingly vital when extending the method to higher-frequency or short-duration pulse systems.
The practical utility of the proposed methodology was explicitly demonstrated through experimental wave flume results, proving that the proposed method successfully mitigates structural phase measurement errors in real-world scenarios (see Figure 6). It is crucial to emphasize that, while such hardware-induced pulse-pair interval discrepancies may remain hidden and are easily overlooked in steady flows, they severely distort phase-dependent measurements in cases involving unsteady flows. By applying the proposed method, sufficient temporal accuracy can be satisfactorily achieved for oscillatory and other types of phase-dependent flow measurements even with inexpensive hardware, thereby broadening the accessibility of advanced PIV techniques to laboratories with limited resources.
Overall, the proposed approach offers a transparent and viable alternative to more complex and expensive commercial time calibration techniques. Consequently, it is highly recommended that researchers implement the time calibration validation method detailed in this study as a standard prerequisite prior to commencing low-cost PIV experimental measurements. Overall, this approach significantly improves the reliability of low-cost PIV measurements and supports the broader, more accurate use of accessible experimental tools in fluid mechanics research. Future work should explore the applicability of this method to high-frequency pulsed laser systems and faster photodetector technologies to further expand its operational limits.
Author Contributions
Conceptualization, T.B.; methodology, S.E.; software, S.E.; validation, S.E.; formal analysis, S.E.; investigation, S.E. and T.B.; resources, S.E. and T.B.; data curation, S.E.; writing—original draft preparation, S.E.; writing—review and editing, T.B. and V.S.O.K.; visualization, S.E.; supervision, V.S.O.K.; project administration, V.S.O.K.; funding acquisition, V.S.O.K. All authors have read and agreed to the published version of the manuscript.
Funding
This study was funded by the Scientific and Technological Research Council of Turkiye (TUBITAK) through the project titled “Qualitative and Quantitative Investigation of Laminar-to-Turbulent Transition in Steady and Unsteady Boundary Layers” under grant No. 122M024.
Data Availability Statement
The original contributions presented in this study are included in the article. Further inquiries can be directed to the corresponding author.
Acknowledgments
The authors would like to thank Dogus University and TUBITAK-MAG for their valuable support during the completion of this study.
Conflicts of Interest
The author V. S. Ozgur Kirca was employed by the company BM SUMER Consultancy & Research. The remaining authors declare that the work was conducted in the absence of any commercial or financial relationships that could be construed as a potential conflict of interest.
Abbreviations
The following abbreviations are used in this manuscript:
| PIV | Particle Image Velocimetry |
| Hz | Hertz |
| Ω | Ohm |
| V | Volt |
| DAQ | Data Acquisition Device |
| LED | Light-Emitting Diode |
| ADC | Analog-to-Digital Converter |
References
- Hele-Shaw, H.S. The Flow of Water. Nature 1898, 58, 520. [Google Scholar] [CrossRef] [Scilit]
- Raffel, M.; Willert, C.E.; Scarano, F.; Kähler, C.J.; Wereley, S.T.; Kompenhans, J. Particle Image Velocimetry: A Practical Guide; Springer: Cham, Switzerland, 2018. [Google Scholar]
- Stamhuis, E.; Thielicke, W. PIVlab—Towards User-friendly, Affordable and Accurate Digital Particle Image Velocimetry in MATLAB. J. Open Res. Softw. 2014, 2, e30. [Google Scholar] [CrossRef] [Scilit]
- Thielicke, W.; Sonntag, R. Particle Image Velocimetry for MATLAB: Accuracy and enhanced algorithms in PIVlab. J. Open Res. Softw. 2021, 9, 12. [Google Scholar] [CrossRef] [Scilit]
- Liberzon, A.; Käufer, T.; Bauer, A.; Vennemann, P.; Zimmer, E. OpenPIV/Openpiv-Python: OpenPIV-Python v0.23.6 (0.23.6); Zenodo: Geneva, Switzerland, 2021; Available online: https://zenodo.org/records/18304582 (accessed on 7 February 2026).
- Westerweel, J. Theoretical analysis of the measurement precision in particle image velocimetry. Exp. Fluids 2000, 29, S003–S012. [Google Scholar] [CrossRef] [Scilit]
- Budd, A.; Howison, J. A low-cost PIV system for undergraduate fluids laboratories. In Proceedings of the 2018 ASEE Annual Conference & Exposition, Salt Lake City, UT, USA, 23 June 2018. [Google Scholar] [CrossRef] [Scilit]
- Ring, B.P.; Lemley, E.C. Design and implementation of a low-cost particle image velocimetry system for undergraduate research and education. In Proceedings of the 2014 ASEE Annual Conference & Exposition, Indianapolis, Indiana, 15 June 2014. [Google Scholar] [CrossRef] [Scilit]
- Acquah, F.K.C.; Takyi, J.P.K.; Beem, H.R. Design and characterization of a low-cost particle image velocimetry system. HardwareX 2024, 19, e00563. [Google Scholar] [CrossRef] [Scilit] [PubMed]
- Muriithi, J.K.; Nachbur, F.; Tanui, J.K.; Gakingo, G.K. Enhancing the delivery of fluid mechanics education through the use of low-cost phone-based particle streak velocimetry. S. Afr. J. Chem. Eng. 2025, 54, 470–474. [Google Scholar] [CrossRef] [Scilit]
- Eichhorn, G.N.; Bowman, A.; Haigh, S.K.; Stanier, S. Low-cost digital image correlation and strain measurement for geotechnical applications. Strain 2020, 56, e12348. [Google Scholar] [CrossRef] [Scilit]
- Jassal, G.R.; Song, M.; Schmidt, B.E. Particle shadow velocimetry and its potential applications, limitations and advantages vis-à-vis particle image velocimetry. Exp. Fluids 2025, 66, 21. [Google Scholar] [CrossRef] [Scilit]
- Li, H.; Liu, Y.; Lin, M.; Chen, W.; Lu, J.; Feng, Z.; Li, X. Flow field characterization of reflective ultrasonic wind speed sensor based on PIV. J. Phys. Conf. Ser. 2025, 3032, 012038. [Google Scholar] [CrossRef] [Scilit]
- Girardi, A.G.; Júnior, S.K.; Fonseca, J.P.d.S.; Mariano, F.P. Experimental particle image velocimetry apparatus with known displacement of synthetic particles. Fluids 2025, 10, 68. [Google Scholar] [CrossRef] [Scilit]
- OPTOLUTION Flow Measurements. Particle Image Velocimetry. Available online: https://optolution.com/en/products/particle-image-velocimetry-piv/ (accessed on 19 May 2026).
- Edinburgh Designs. Wave Gauges. Available online: http://www4.edesign.co.uk/product/wavegauges/ (accessed on 19 May 2026).
- National Instruments. USB-6003 Multifunction I/O Device. Available online: https://www.ni.com/en-tr/shop/model/usb-6003.html (accessed on 25 June 2025).
- Shannon, C.E. Communication in the Presence of Noise. Proc. IRE 1949, 37, 10–21. [Google Scholar] [CrossRef] [Scilit]

Disclaimer/Publisher’s Note: The statements, opinions and data contained in all publications are solely those of the individual author(s) and contributor(s) and not of MDPI and/or the editor(s). MDPI and/or the editor(s) disclaim responsibility for any injury to people or property resulting from any ideas, methods, instructions or products referred to in the content. |
© 2026 by the authors. Licensee MDPI, Basel, Switzerland. This article is an open access article distributed under the terms and conditions of the Creative Commons Attribution (CC BY) license.