


Abstract
Surface orientation can influence the aerodynamic response of modern soccer balls, particularly in the drag crisis regime. This study quantified the orientation-dependent aerodynamic characteristics of the FIFA World Cup match ball Trionda using a single specimen and examined how these differences affect simulated flight at sea level and 1500 m altitude. Two reproducible reference orientations were defined: a red-panel-centered orientation (Series A) and a seam-junction-centered orientation (Series B). Each reference orientation was rotated by 0°, 90°, and 180°, resulting in six fixed-orientation conditions. Wind tunnel measurements were repeated three times per condition to obtain drag, lift, and side-force coefficients, and two-dimensional non-spinning flight simulations were performed for representative long-kick and free-kick conditions. All six orientations exhibited drag crisis behavior, but the transition response magnitude, subcritical drag level, and supercritical drag state differed among conditions. The representative transition region occurred at approximately Re = 2.0 × 10⁵ to 2.5 × 10⁵. Among the tested conditions, B-90 showed the lowest full-range mean drag coefficient (0.231), whereas A-90 showed the highest (0.266). In the simulations, lower drag orientations consistently produced longer flight ranges, and the B-90 > A-90 ordering was preserved across representative launch conditions and the expanded parametric comparison. These findings indicate that the aerodynamic response of Trionda cannot be represented adequately by a single mean drag coefficient and that surface orientation should be considered in aerodynamic characterization and flight prediction.
1. Introduction
The aerodynamic characteristics of a soccer ball are governed by the interaction among the Reynolds number, boundary layer transition, flow separation, surface roughness, and ball rotation. General biomechanical and aerodynamic aspects of soccer ball flight have been reviewed previously, providing a broader framework for interpreting how surface features and flow conditions influence ball behavior [1,2,3]. More broadly, the flight of sports projectiles has been interpreted from a fluid mechanical perspective, with drag, lift, spin, and wake instability identified as key factors governing the trajectories of spherical sports balls [4]. Among these factors, the critical Reynolds number and drag crisis are particularly important because changes in surface roughness and separation behavior directly influence drag, lateral force, and, ultimately, flight trajectory [1,2]. Classical studies on golf balls and dimpled spheres have further shown that distributed surface roughness can promote boundary layer transition and substantially modify drag and lift characteristics [5,6,7].
Modern official match balls differ substantially in panel configuration, seam geometry, and surface texture, making it increasingly difficult to explain their aerodynamic behavior solely in terms of overall shape [8]. Previous studies have shown that dimples and surface textures can alter both aerodynamic forces and flight trajectories [9,10], while seam characteristics are closely related to the critical Reynolds number [11]. Earlier experimental work on association footballs demonstrated that seams can influence boundary layer transition, drag behavior, and Magnus-related aerodynamic forces, indicating that seam geometry is a key factor in football-specific aerodynamics [12]. Seam geometry has also been reported to influence the range and lateral deviation of non-spinning kicks [13]. Numerical studies have also indicated that seam width and sharpness can substantially affect the aerodynamic behavior of soccer balls, further supporting the importance of seam geometry in ball-specific flow response [14]. Additional wind tunnel comparisons have demonstrated that changes in surface structure alone can modify the flow regime and drag coefficient of soccer balls, further emphasizing the aerodynamic importance of surface topology in modern ball design [15]. Because nominal diameter and panel count alone do not fully describe a soccer ball’s geometric quality, quantitative assessment of sphericity is also relevant when comparing ball designs and interpreting aerodynamic differences [16].
Even within a single ball model, the aerodynamic response may vary depending on which panel or seam arrangement faces the oncoming flow. Earlier studies using wind tunnel testing and particle image velocimetry reported that separation location and wake structure can vary with ball orientation, particularly in the critical Reynolds number regime, and that such differences may be reflected in-flight behavior [17,18]. Quantifying aerodynamic variation within a single ball model is therefore important for improving flight prediction beyond simple comparisons based on mean coefficients [19]. Complementary numerical work has also shown that surface geometry can modify predicted force coefficients and erratic trajectory behavior, indicating that ball flight sensitivity cannot be captured fully by overly simplified geometric averages [20]. In addition, trajectory-based and field measurement studies have shown that drag and lift parameters derived from actual flight can be used to model soccer ball trajectories, including direct free kicks, spinning ball flight, and surface-geometry-dependent deviations [21,22,23,24].
Goff et al. compared Trionda with previous FIFA World Cup match balls and reported a relatively low critical speed together with a somewhat higher post-critical drag level [25]. Related comparisons among official match balls have also shown that differences in critical speed and supercritical drag can translate into distinct non-spin trajectories, particularly in the intermediate speed range [26]. However, previous studies have focused primarily on comparisons between ball models and have not examined in detail how fixed surface orientation influences the aerodynamic response of Trionda itself. This gap is important because slowly spinning or nearly non-spinning soccer balls can exhibit irregular three-dimensional flight behavior associated with unsteady aerodynamic forces and wake dynamics [27], and football trajectories more generally can be classified according to the balance among inertia, gravity, drag, spin-induced lift, and wake instability [28]. Recent measurements on another modern low-panel football further suggest that contemporary surface design can substantially alter drag, side force, lift force, and critical Reynolds number, thereby motivating an orientation-sensitive analysis of Trionda [29].
The present study examines within-ball aerodynamic variability by testing how fixed surface orientation alters the drag, lift, and side-force responses of a single Trionda specimen. The aim was to quantify the orientation-dependent aerodynamic response of the tested specimen using six reproducible fixed-orientation conditions and to assess how these differences influence simulated flight range at two altitudes, together with exploratory fixed-orientation lateral bias under a representative long-kick condition. This perspective is important because a single representative aerodynamic coefficient may obscure orientation-dependent differences that emerge in the drag crisis regime.
2. Materials and Methods
2.1. Test Ball and Definition of Orientation Conditions
The test ball used in this study was Trionda, the official match ball of the 2026 FIFA World Cup. The ball consists of four irregular panels, with a mass of 431 g, a diameter of 0.22 m, and a reference cross-sectional area of 0.038 m2. Distinct groove structures are distributed over the panel surfaces. Because these features may affect boundary layer transition and flow separation, the aerodynamic response of the ball may depend not only on its mean geometry but also on the orientation of the exposed surface structures [9,13].
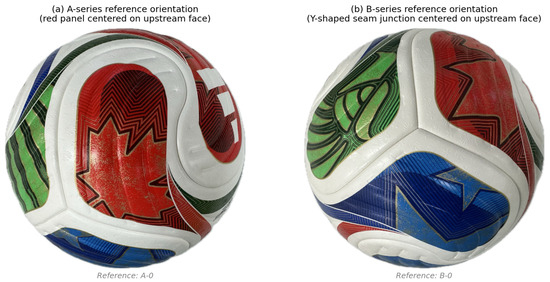
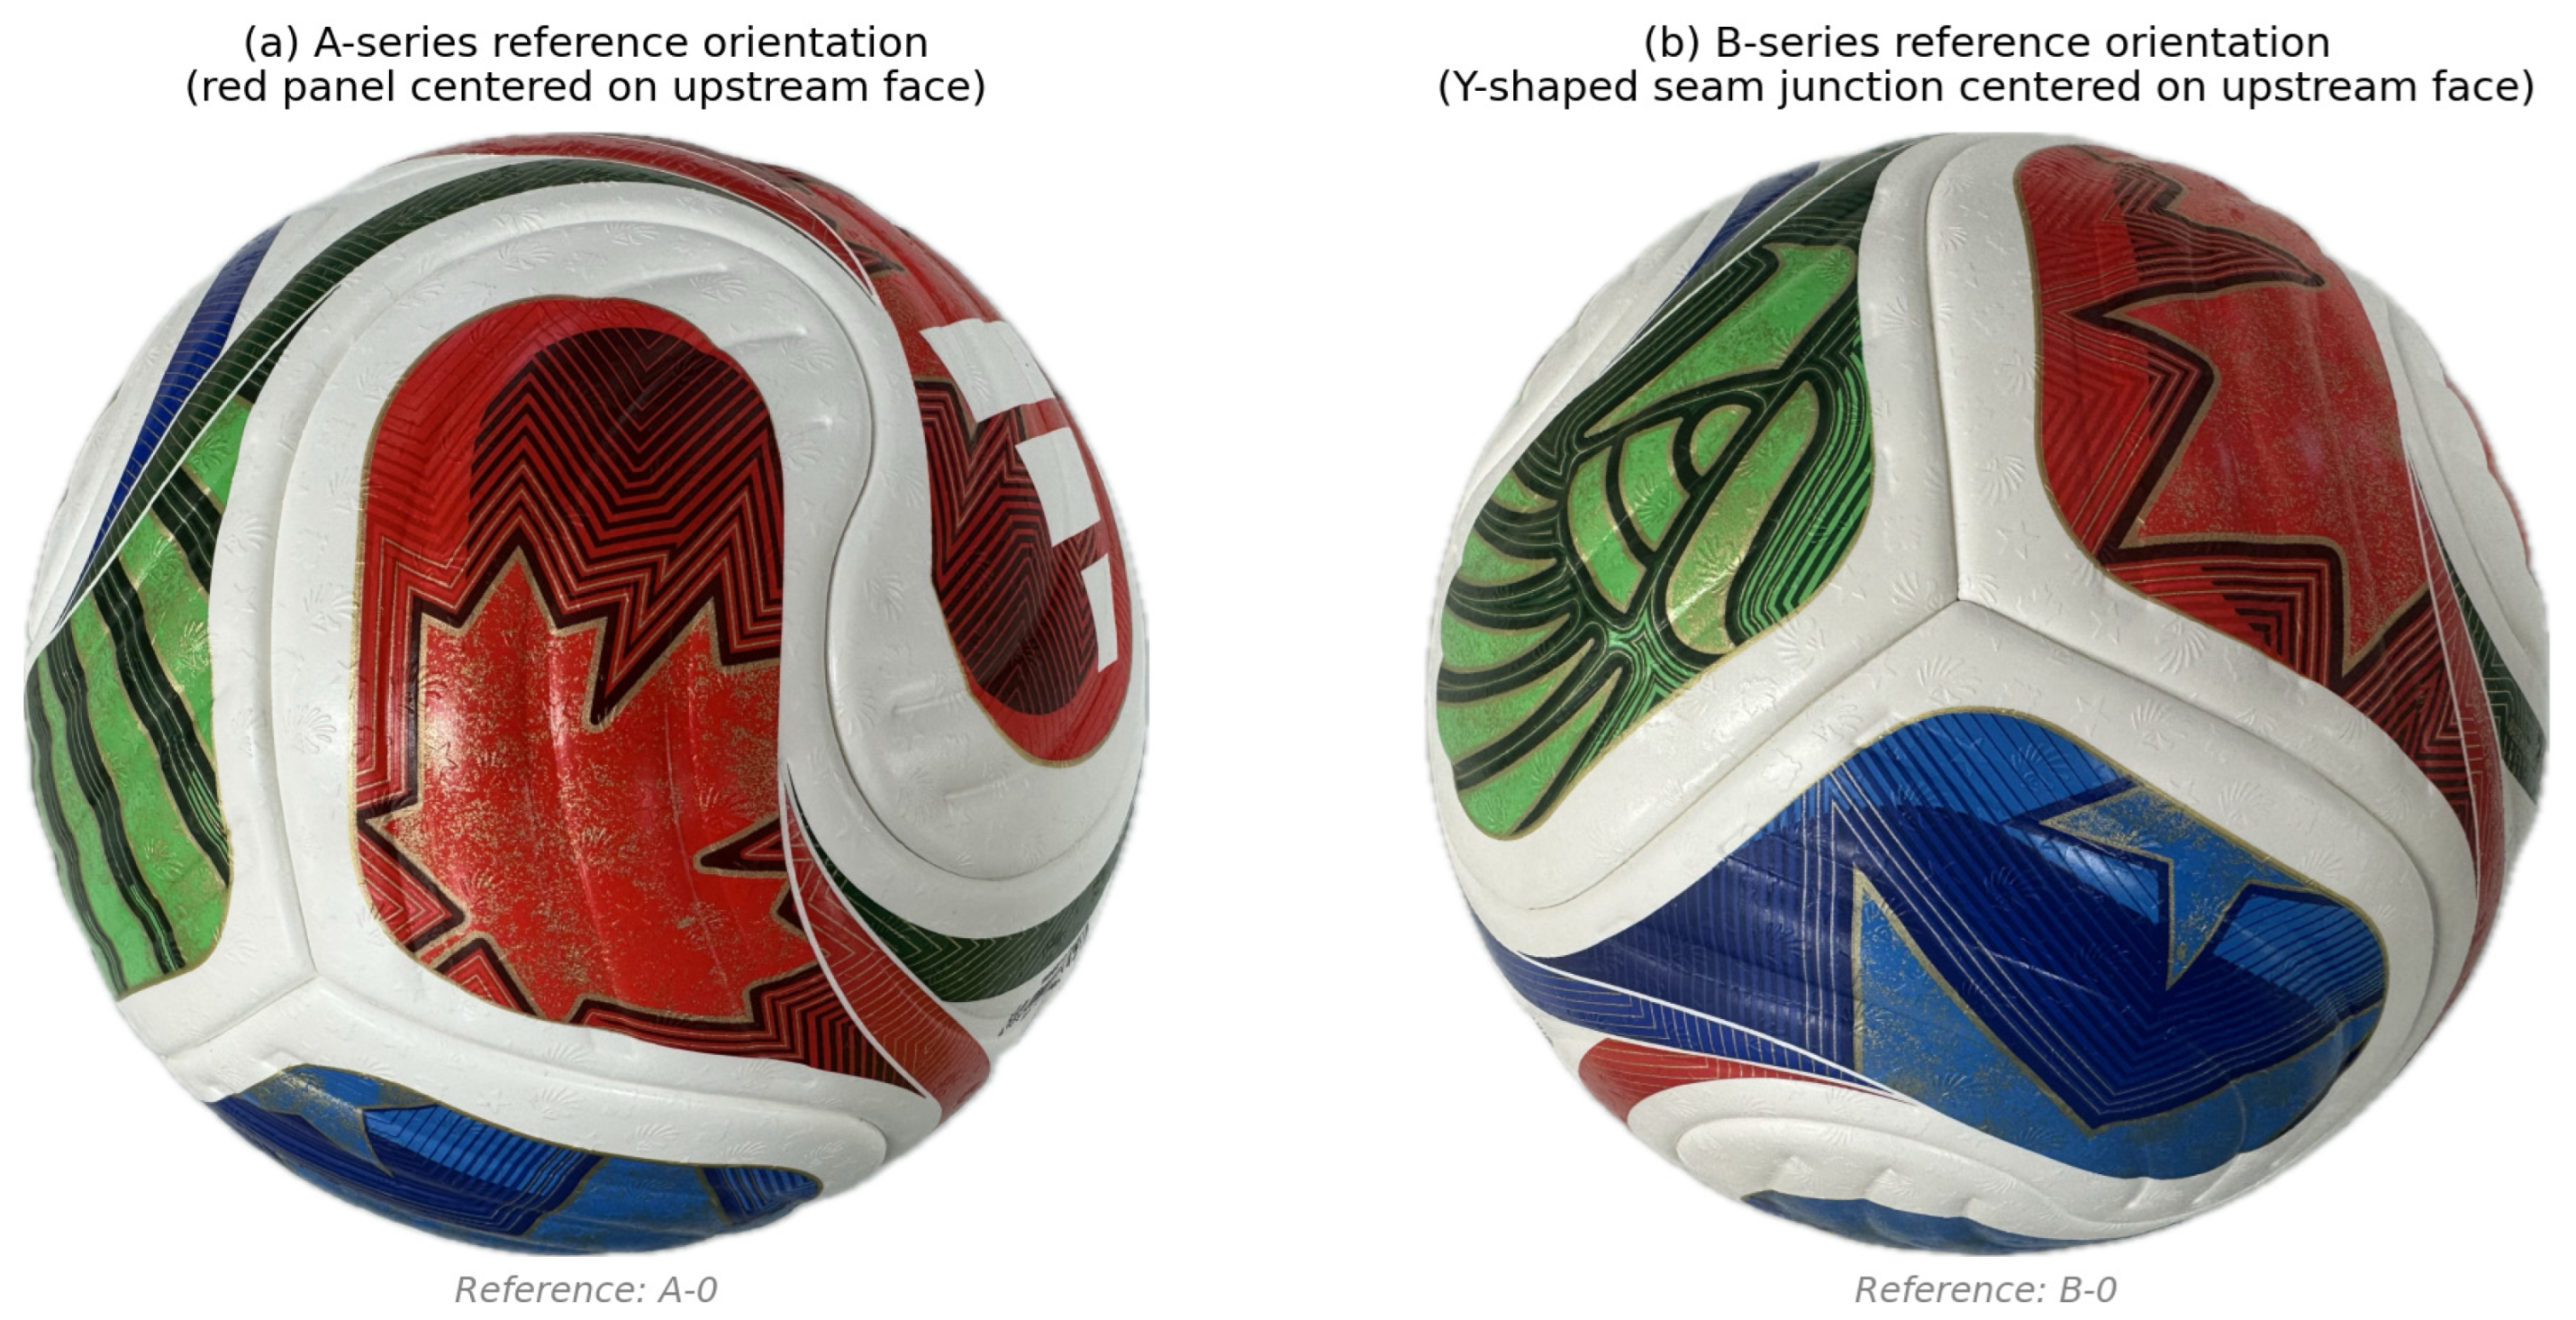
Two reference orientations were defined. In A-0, a red panel was positioned at the center of the upstream-facing surface. In B-0, a Y-shaped seam junction was positioned at the center of the upstream-facing surface. Each reference orientation was then rotated clockwise, as viewed from upstream, by 0°, 90°, and 180°, resulting in six conditions: A-0, A-90, A-180, B-0, B-90, and B-180. Aerodynamic measurements for each condition were repeated three times.
The 270° condition was not included because the aim of this study was not to exhaust all possible orientations, but to quantify orientation-dependent differences using a reproducible set of representative arrangements. The selected 0°, 90°, and 180° rotations were considered sufficient to capture major rearrangements of panels and seams, although the six tested conditions do not represent all possible in-flight orientations.
All measurements were performed on a single ball specimen; therefore, the present study quantified within-specimen orientation-dependent variability rather than ball-to-ball manufacturing variability. The six fixed-orientation conditions are illustrated in Figure 1.
Figure 1.
Definition of the two reference orientations of the Trionda ball. (a) A-series: red-panel-centered (A-0). (b) B-series: Y-shaped seam-junction-centered (B-0). Each reference orientation was rotated by 0°, 90°, and 180° to define the six fixed-orientation conditions.
2.2. Wind Tunnel Facility and Experimental Conditions
Wind tunnel experiments were conducted in the closed-circuit low-speed, low-turbulence wind tunnel at the University of Tsukuba (San Technologies Co., Ltd., Tochigi, Japan). The maximum wind speed of the facility is approximately 55 m/s, and the test section measures 1.5 m × 1.5 m. For a soccer ball of 0.22 m diameter, the blockage ratio is approximately 1.7%. The wind speed uniformity is within ±0.5%, and the turbulence intensity is below 0.1%.
The ball was mounted using a stainless steel sting support. The sting was attached to the rear side of the ball to minimize interference with the airflow, and a support structure with a bowl-shaped groove was used. Aerodynamic forces were measured using a six-component force balance (LMC-61256, Nissho Electric Works, Osaka, Japan). All wind tunnel data reported in the present study were acquired independently in a separate experimental session. Although the B-0 condition is nominally equivalent to the reference orientation used in Ref. [25], the corresponding measurements were obtained independently and do not constitute reused data.
The test velocity ranged from 7 to 35 m/s. At each flow speed, force data were sampled at 100 Hz for 10 s, yielding 1000 time series samples per speed condition. At each flow speed step, the tare-corrected force signals were converted into instantaneous aerodynamic coefficients. The mean drag coefficient at each speed step was then calculated as the arithmetic mean of the 1000 instantaneous Cd values acquired over the 10 s sampling period. No additional filtering or windowing was applied before averaging. The within-run temporal fluctuation was quantified using the standard deviation of the 1000 instantaneous Cd values. Across the six orientation conditions, the within-run standard deviation of Cd was generally small, ranging from 0.001 to 0.012 depending on orientation and the Reynolds number. The largest fluctuations occurred in the transition region, approximately Re = 2.0 × 10⁵ to 2.5 × 10⁵, where intermittent changes in boundary layer state and separation behavior are expected. In the subcritical and supercritical regimes, the temporal fluctuations were smaller, indicating more stable mean separation states.
For each speed step, the mean and temporal standard deviation of Cd were calculated as
and
The experiments were performed at temperatures of 18–23 °C and relative humidity of 35–50%. Reproducibility was assessed from the three repeated measurements, and the coefficient of variation in the full-range mean Cd was 0.20–1.31% across the six conditions. The full-range mean Cd values for the three repeated measurements are summarized in Table 1.
Table 1.
Full-range mean drag coefficient (Cd) for three independent repeated measurements under each fixed-orientation condition. SD = standard deviation; CV = coefficient of variation.
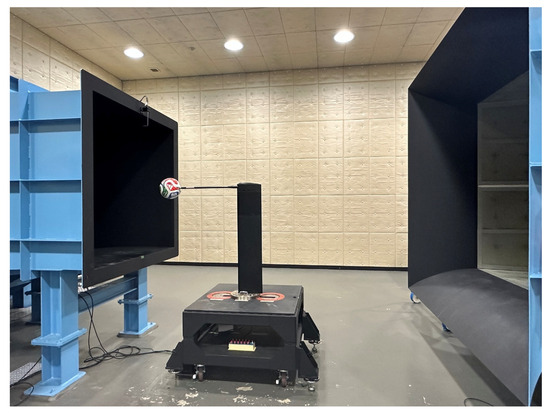
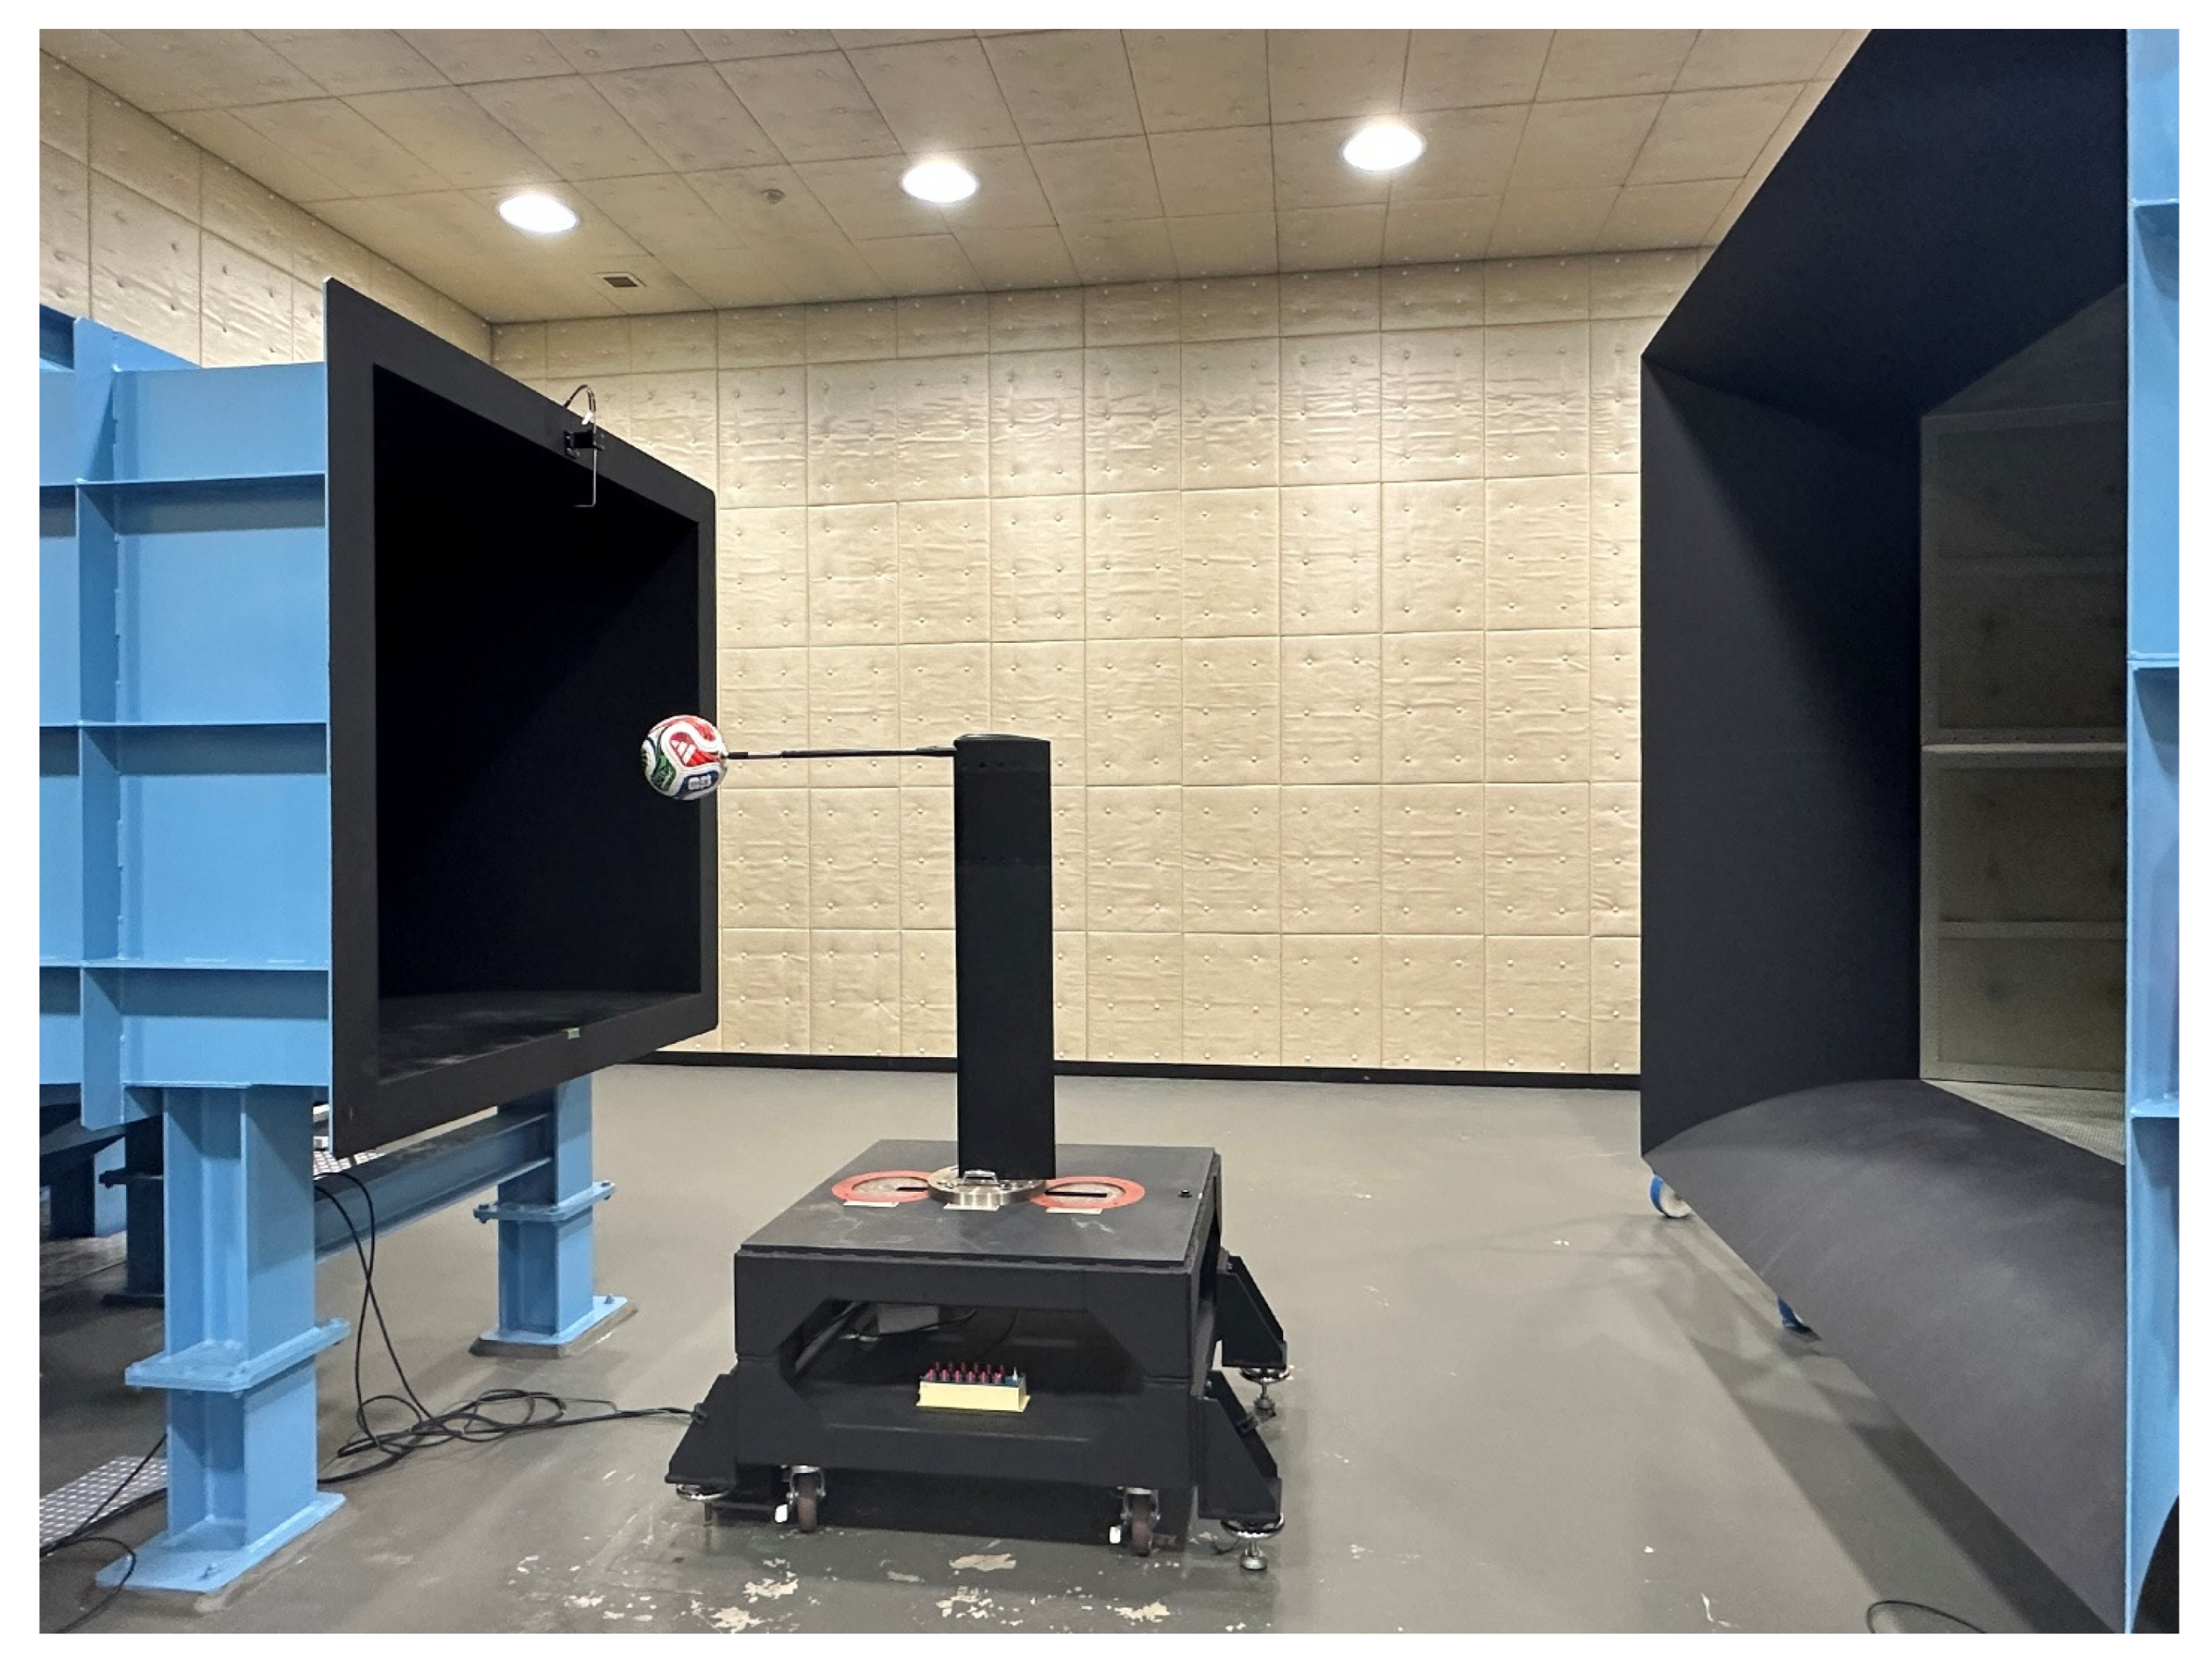
For each orientation condition, three independent repeated measurements were performed. The full-range mean Cd values were summarized as mean ± standard deviation, and the coefficient of variation was used as a descriptive indicator of repeatability. Because only three repeated measurements were available per condition, these statistics are interpreted descriptively rather than inferentially. Accordingly, the repeated measurements are used here to assess repeatability and the relative robustness of the orientation ranking, rather than to support formal statistical inference. The coefficient of variation in the full-range mean Cd ranged from 0.20% to 1.31%, indicating low repeat-to-repeat variability relative to the observed inter-orientation differences in the full-range mean Cd. The experimental arrangement is shown in Figure 2.
Figure 2.
Wind tunnel experimental arrangement at the University of Tsukuba.
2.3. Aerodynamic Coefficients and Flight Simulation
From the measured aerodynamic forces, the drag coefficient (Cd), lift coefficient (Cl), and side-force coefficient (Cs) were calculated as follows:
where ρ is air density, A is the reference area, and v is the incoming flow speed. The Reynolds number was defined as (Re = vD/ν). The primary variable of interest was Cd, while Cl and Cs were additionally evaluated to characterize orientation-related aerodynamic asymmetry.
Flight simulations were performed for two altitude conditions: sea level and 1500 m. Air density was set to 1.20 kg/m3 and 1.08 kg/m3, respectively. A non-spinning ball was assumed. For the long-kick condition, the initial speed and launch angle were set to 30 m/s and 30°, respectively. For the free-kick condition, they were set to 25 m/s and 20°. To assess how the orientation-dependent range difference varies with kick intensity, an additional parametric simulation was performed at sea level across six initial speeds (20, 25, 28, 30, 32, and 35 m/s) and six launch angles (15°, 20°, 25°, 30°, 35°, and 40°), yielding 36 launch condition combinations per orientation condition. In the expanded parametric analysis, all six orientations were evaluated at sea level, whereas at 1500 m altitude, the comparison was limited to B-90 and A-90 to test whether the extreme orientation ordering was preserved across the broader set of launch conditions.
The two-dimensional non-spinning flight simulation was based on a point-mass force balance including gravity and aerodynamic drag only. The equations of motion were
where x and z are the horizontal and vertical coordinates, vx and vz are the corresponding velocity components, m is the ball mass, A is the reference area, ρ is the air density, g is gravitational acceleration, and . The speed-dependent drag coefficient Cd(v) was obtained from the measured wind tunnel data. Lift, spin, attitude change, aerodynamic torque, and wind disturbance were not included in the two-dimensional model. The equations were integrated using a fourth-order Runge–Kutta method, and landing was defined as the instant at which the ball center reached z = 0.
In the two-dimensional flight model, the ball was treated as a point mass subjected only to gravity and drag. The instantaneous drag coefficient was obtained by linearly interpolating the speed-dependent Cd values measured in the wind tunnel. Linear interpolation was selected because it is a local reconstruction method that preserves the measured Cd values and does not impose a global functional form on the drag crisis curve. This is particularly important in the transition region, where Cd changes rapidly over a narrow Reynolds number range. To examine the influence of the reconstruction method, a leave-one-out comparison was performed between linear interpolation and third- and fifth-order polynomial curve fitting. For the leave-one-out comparison, only interior speed points were used so that the removed value could be reconstructed by interpolation without extrapolation. The mean absolute reconstruction error of Cd was 0.00111 for linear interpolation, 0.00297 for the third-order polynomial fit, and 0.00220 for the fifth-order polynomial fit. Thus, linear interpolation provided the lowest reconstruction error among the tested methods. Global polynomial fits can smooth the steep transition or introduce oscillatory deviations between measured points, particularly near the drag crisis region. Therefore, linear interpolation was retained for the flight simulations.
The x-axis was defined as the forward direction and the z-axis as the vertical direction. Gravitational acceleration was set to 9.81 m/s2. Time integration was performed using a fourth-order Runge–Kutta method, and landing was defined as the instant at which the ball center reached z = 0.
For the long-kick condition, an additional three-dimensional simulation was performed including both Cd and Cs. In this model, the x-axis denoted the forward direction, the y-axis the lateral direction, and the z-axis the vertical direction. Drag acted opposite to the instantaneous velocity vector, while side force was prescribed in the lateral direction. For the side force term, the speed-dependent Cs values measured in the wind tunnel were linearly interpolated at each time step, following the same procedure used for Cd in the two-dimensional model. Lift associated with Cl was not included. The three-dimensional simulation was intended as an exploratory analysis of fixed-orientation lateral bias and was not designed to reproduce realistic spinning ball trajectories.
Previous studies have suggested that orientation-dependent aerodynamic loading may remain relevant not only for non-spinning balls but also, to some extent, under spinning conditions [22,27]. However, the present three-dimensional model represents a simplified fixed-orientation case rather than realistic spinning flight. Spin, attitude change, aerodynamic torque, buoyancy, wind disturbance, and uncertainty propagation were not included; accordingly, the simulation outputs are interpreted as deterministic indicators of orientation-related lateral bias.
3. Results
3.1. Speed-Dependent Drag Characteristics
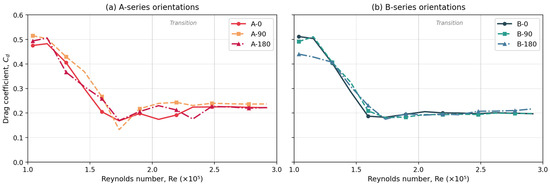
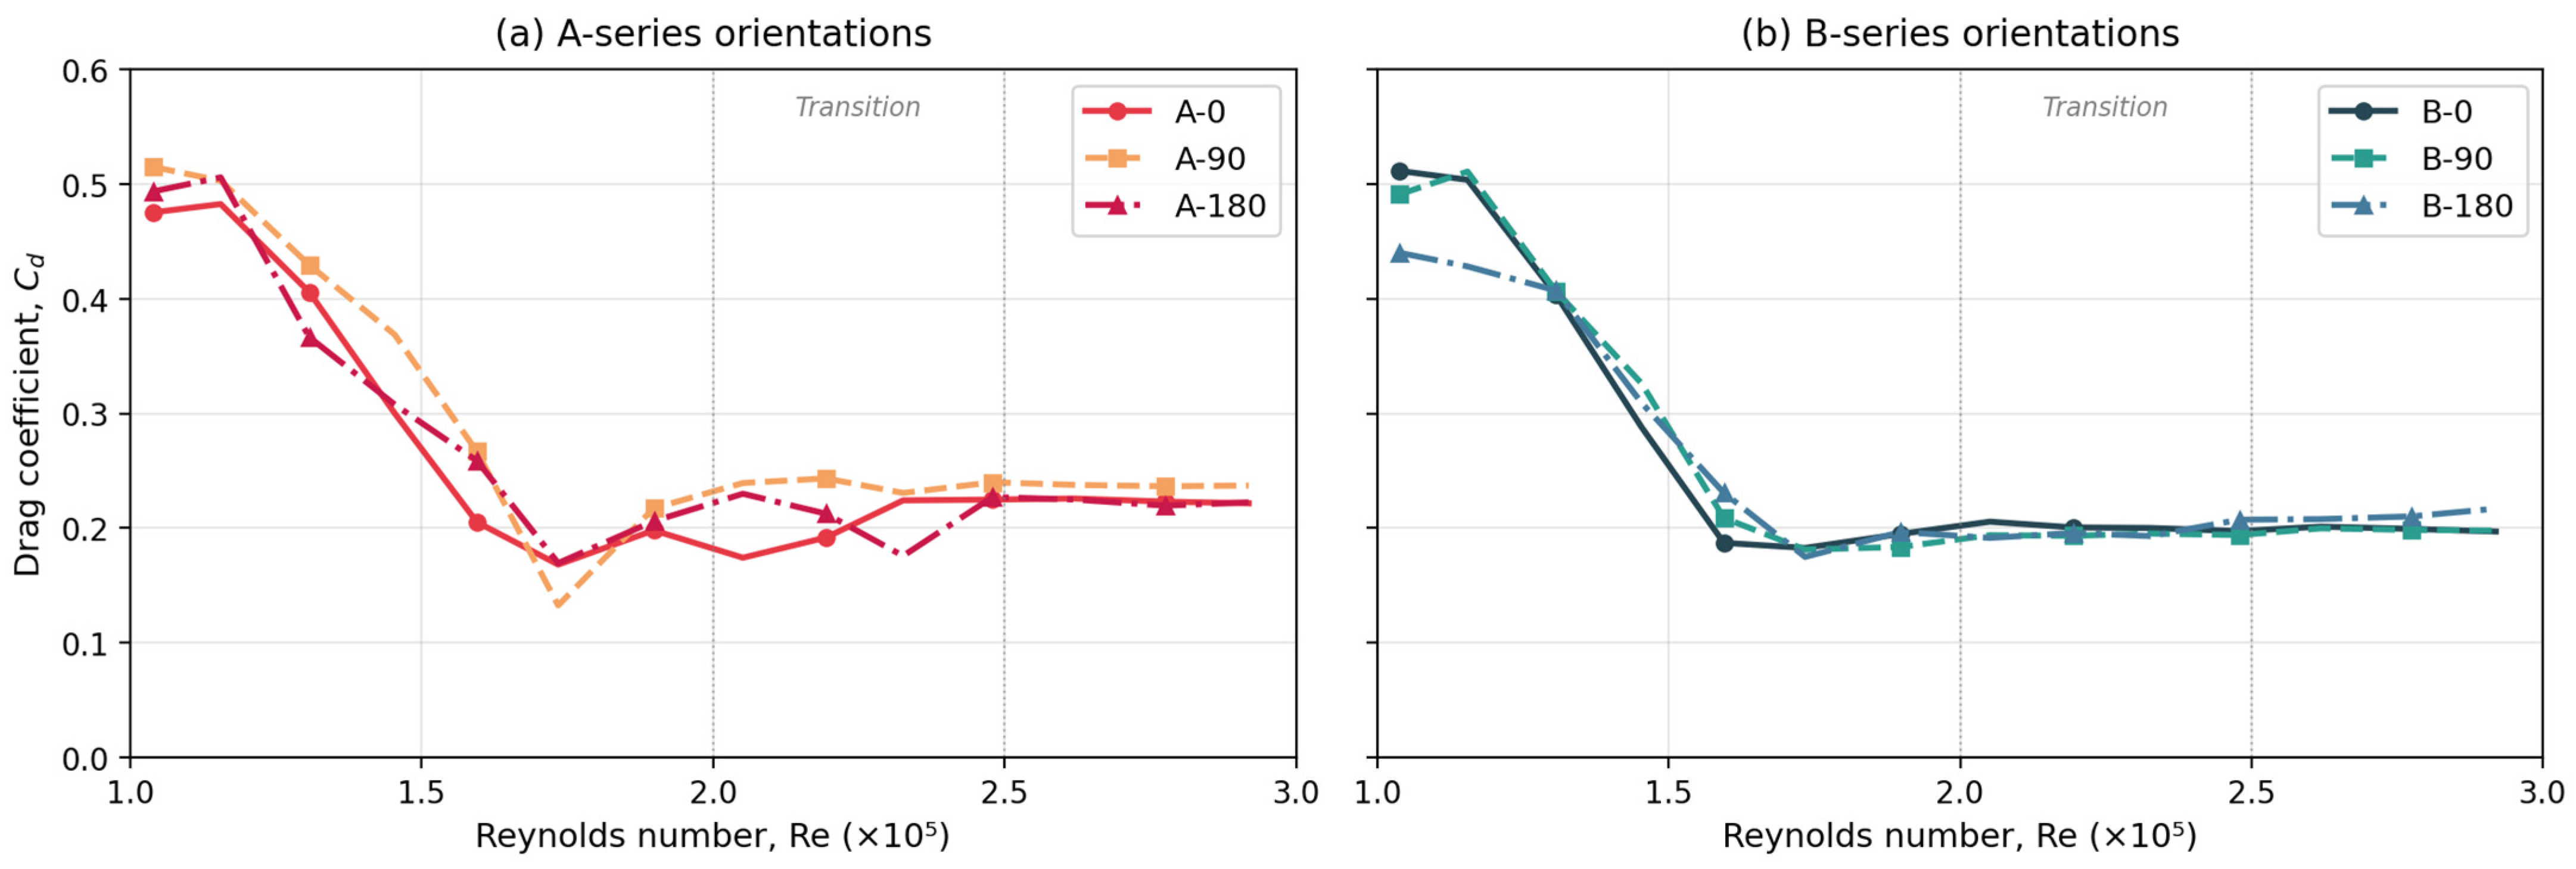
All six orientation conditions exhibited a typical drag crisis pattern, with Cd decreasing rapidly over a limited Reynolds number range and then approaching a more gradual variation at higher Reynolds numbers. However, the position of the transition region and the magnitude of the drag drop differed among the tested orientations, indicating that the arrangement of panel and seam structures exposed to the oncoming flow affected the aerodynamic response.
When interpreted in terms of Reynolds number, Cd showed relatively large variation below Re = 2.0 × 10⁵, whereas the coefficient became more stable above Re = 2.5 × 10⁵. Based on the rapid decrease in Cd together with the subsequent reduction in variability, the critical transition region was identified at approximately Re = 2.0 × 10⁵ to 2.5 × 10⁵. In this context, orientation-dependent differences are more appropriately discussed in terms of the position and intensity of the transition region than in terms of a single exact critical Reynolds number.
Among the six conditions, B-90 exhibited the largest drag crisis drop (ΔCd = 0.129) and the lowest supercritical mean Cd (0.201), whereas A-0 showed the smallest drag crisis drop (ΔCd = 0.093). B-180 also showed a relatively small drag crisis drop (0.096). These results indicate that the aerodynamic response of the tested Trionda ball in the transition region was sensitive to fixed surface orientation. For the regime-conditioned summary, subcritical Cd was defined as the arithmetic mean of the measured Cd values for Re < 2.0 × 10⁵, whereas supercritical Cd was defined as the arithmetic mean of the measured Cd values for Re > 2.5 × 10⁵. The intermediate range, Re = 2.0 × 10⁵ to 2.5 × 10⁵, was treated as the transition region and was excluded from both regime-conditioned averages to avoid mixing relatively stable and intermittent boundary layer states. The drag crisis drop, ΔCd, was calculated as the difference between the subcritical and supercritical mean Cd values.
As summarized in Table 2, fixed orientation affected not only the magnitude of the drag crisis drop but also the subcritical and supercritical drag levels, suggesting that the transition response depends on fixed surface orientation rather than following a single universal drag curve (Figure 3).
Table 2.
Summary of regime-conditioned drag metrics for the six fixed-orientation conditions. Subcritical Cd represents the arithmetic mean of measured Cd values for Re < 2.0 × 10⁵, and supercritical Cd represents the arithmetic mean for Re > 2.5 × 10⁵. The transition region, Re = 2.0 × 10⁵ to 2.5 × 10⁵, was excluded from both averages. ΔCd indicates the difference between the subcritical and supercritical mean Cd values.
Figure 3.
Reynolds-number-dependent drag coefficient (Cd) for the six fixed-orientation conditions. (a) A-series orientations: A-0, A-90, and A-180. (b) B-series orientations: B-0, B-90, and B-180.
3.2. Full-Range Mean Drag Coefficient as a Descriptive Summary
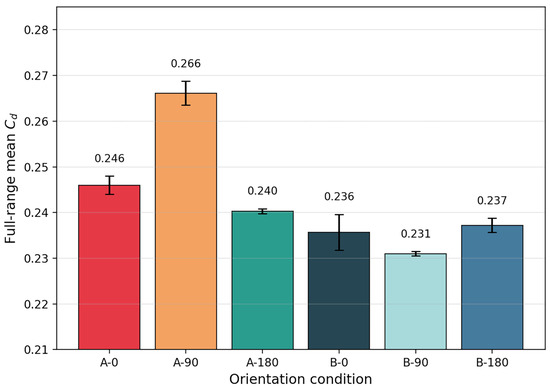
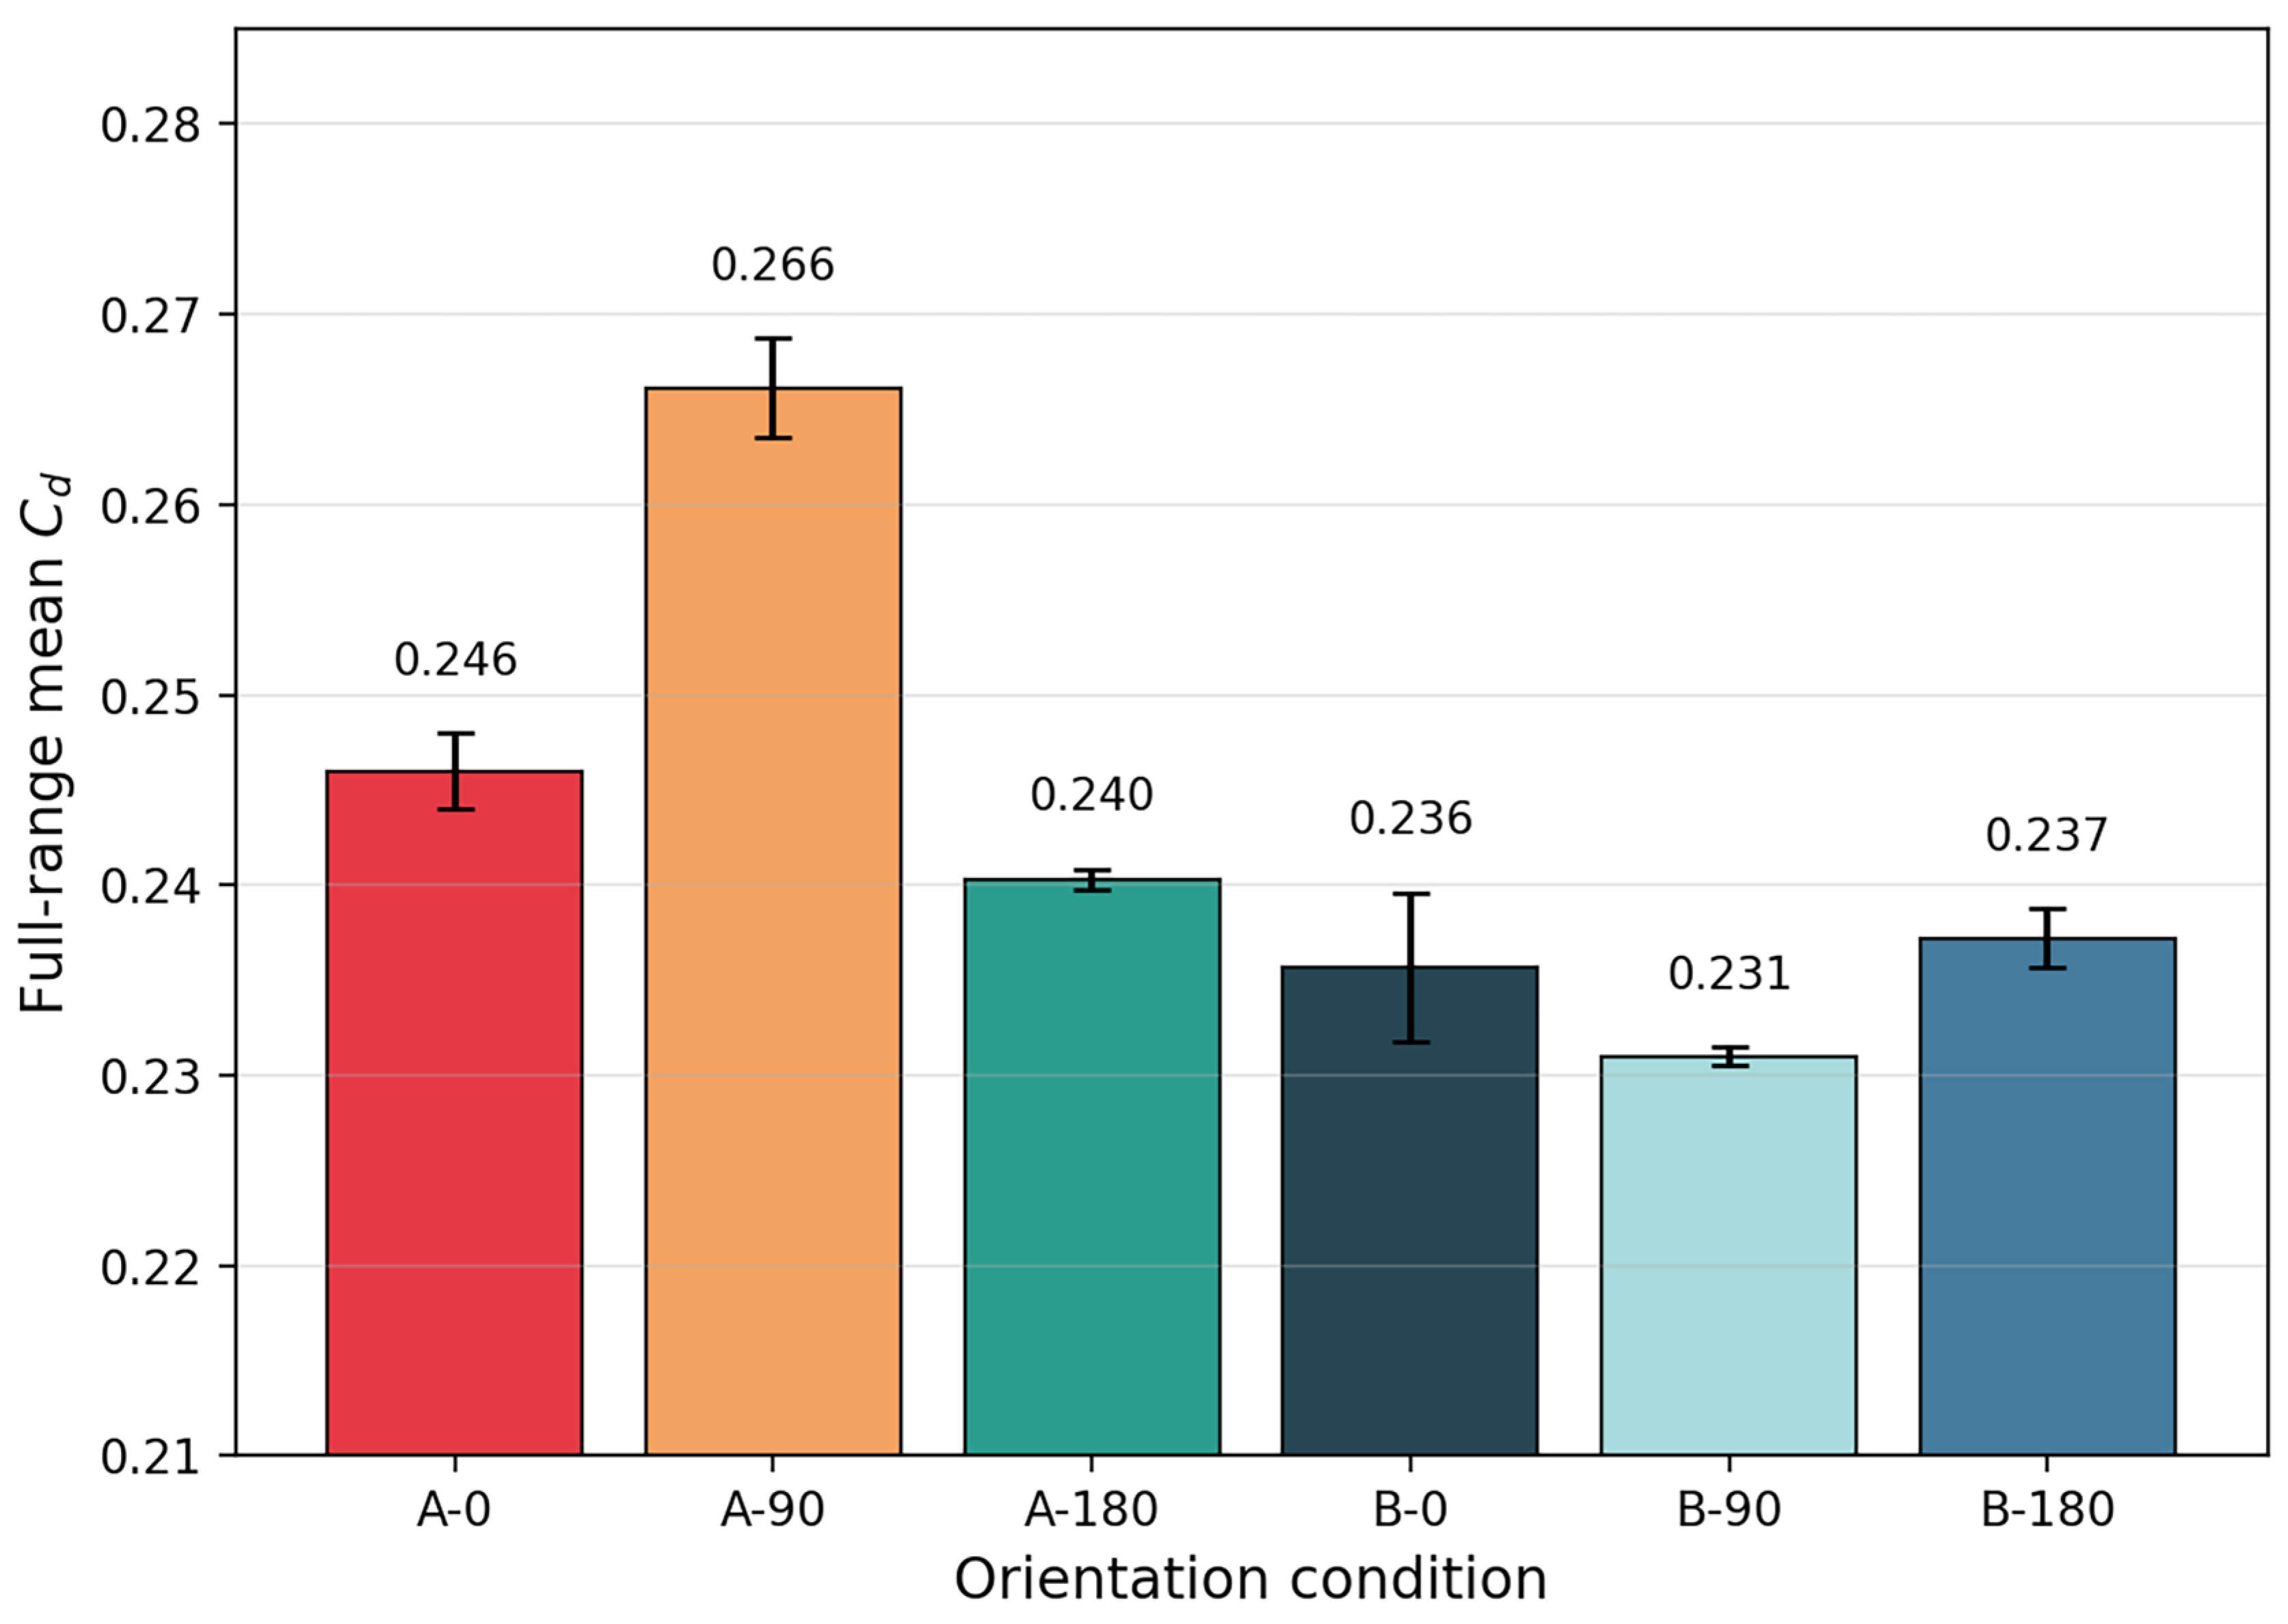
Although the primary aerodynamic differences were expressed through the drag crisis structure, the speed-dependent Cd curves were also summarized as full-range means to provide a compact comparative metric. In this summary, B-90 showed the lowest mean drag coefficient, whereas A-90 showed the highest. Because Cd varies substantially across the drag crisis regime, the full-range mean Cd is used here as a compact descriptive summary rather than as a standalone aerodynamic property. This distinction is important because the regime-conditioned mean values and the full-range mean Cd describe different aspects of the drag response. The regime-conditioned values compare the pre-critical and post-critical states separately, whereas the full-range mean Cd compresses the entire measured Reynolds number range into a single descriptive value. In the present dataset, B-90 showed lower Cd than A-90 in the subcritical regime (0.330 vs. 0.348), in the supercritical regime (0.201 vs. 0.241), and in the full-range mean Cd (0.231 vs. 0.266).
The spread in mean Cd was larger within the A-series than within the B-series, suggesting that the A-series reference orientation was more sensitive to rotational rearrangement. However, this interpretation should be considered together with the full Cd curves, because mean values compress the detailed Reynolds number dependence into a single metric. A compact comparison of the full-range means Cd values is shown in Figure 4.
Figure 4.
Full-range mean drag coefficient (Cd, ±SD, n = 3) for the six fixed-orientation conditions.
Because full-range mean Cd compresses the Reynolds-number-dependent behavior into a single value, it should be interpreted only as an aggregated descriptive metric. For this reason, orientation dependence is more appropriately understood by considering how each tested condition combines subcritical drag level, transition response magnitude, and supercritical drag state, rather than by relying on a single averaged coefficient alone.
3.3. Orientation-Related Variations in Lift and Side Force
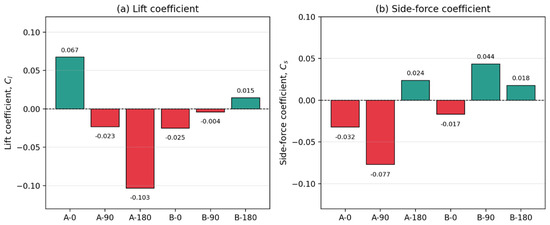
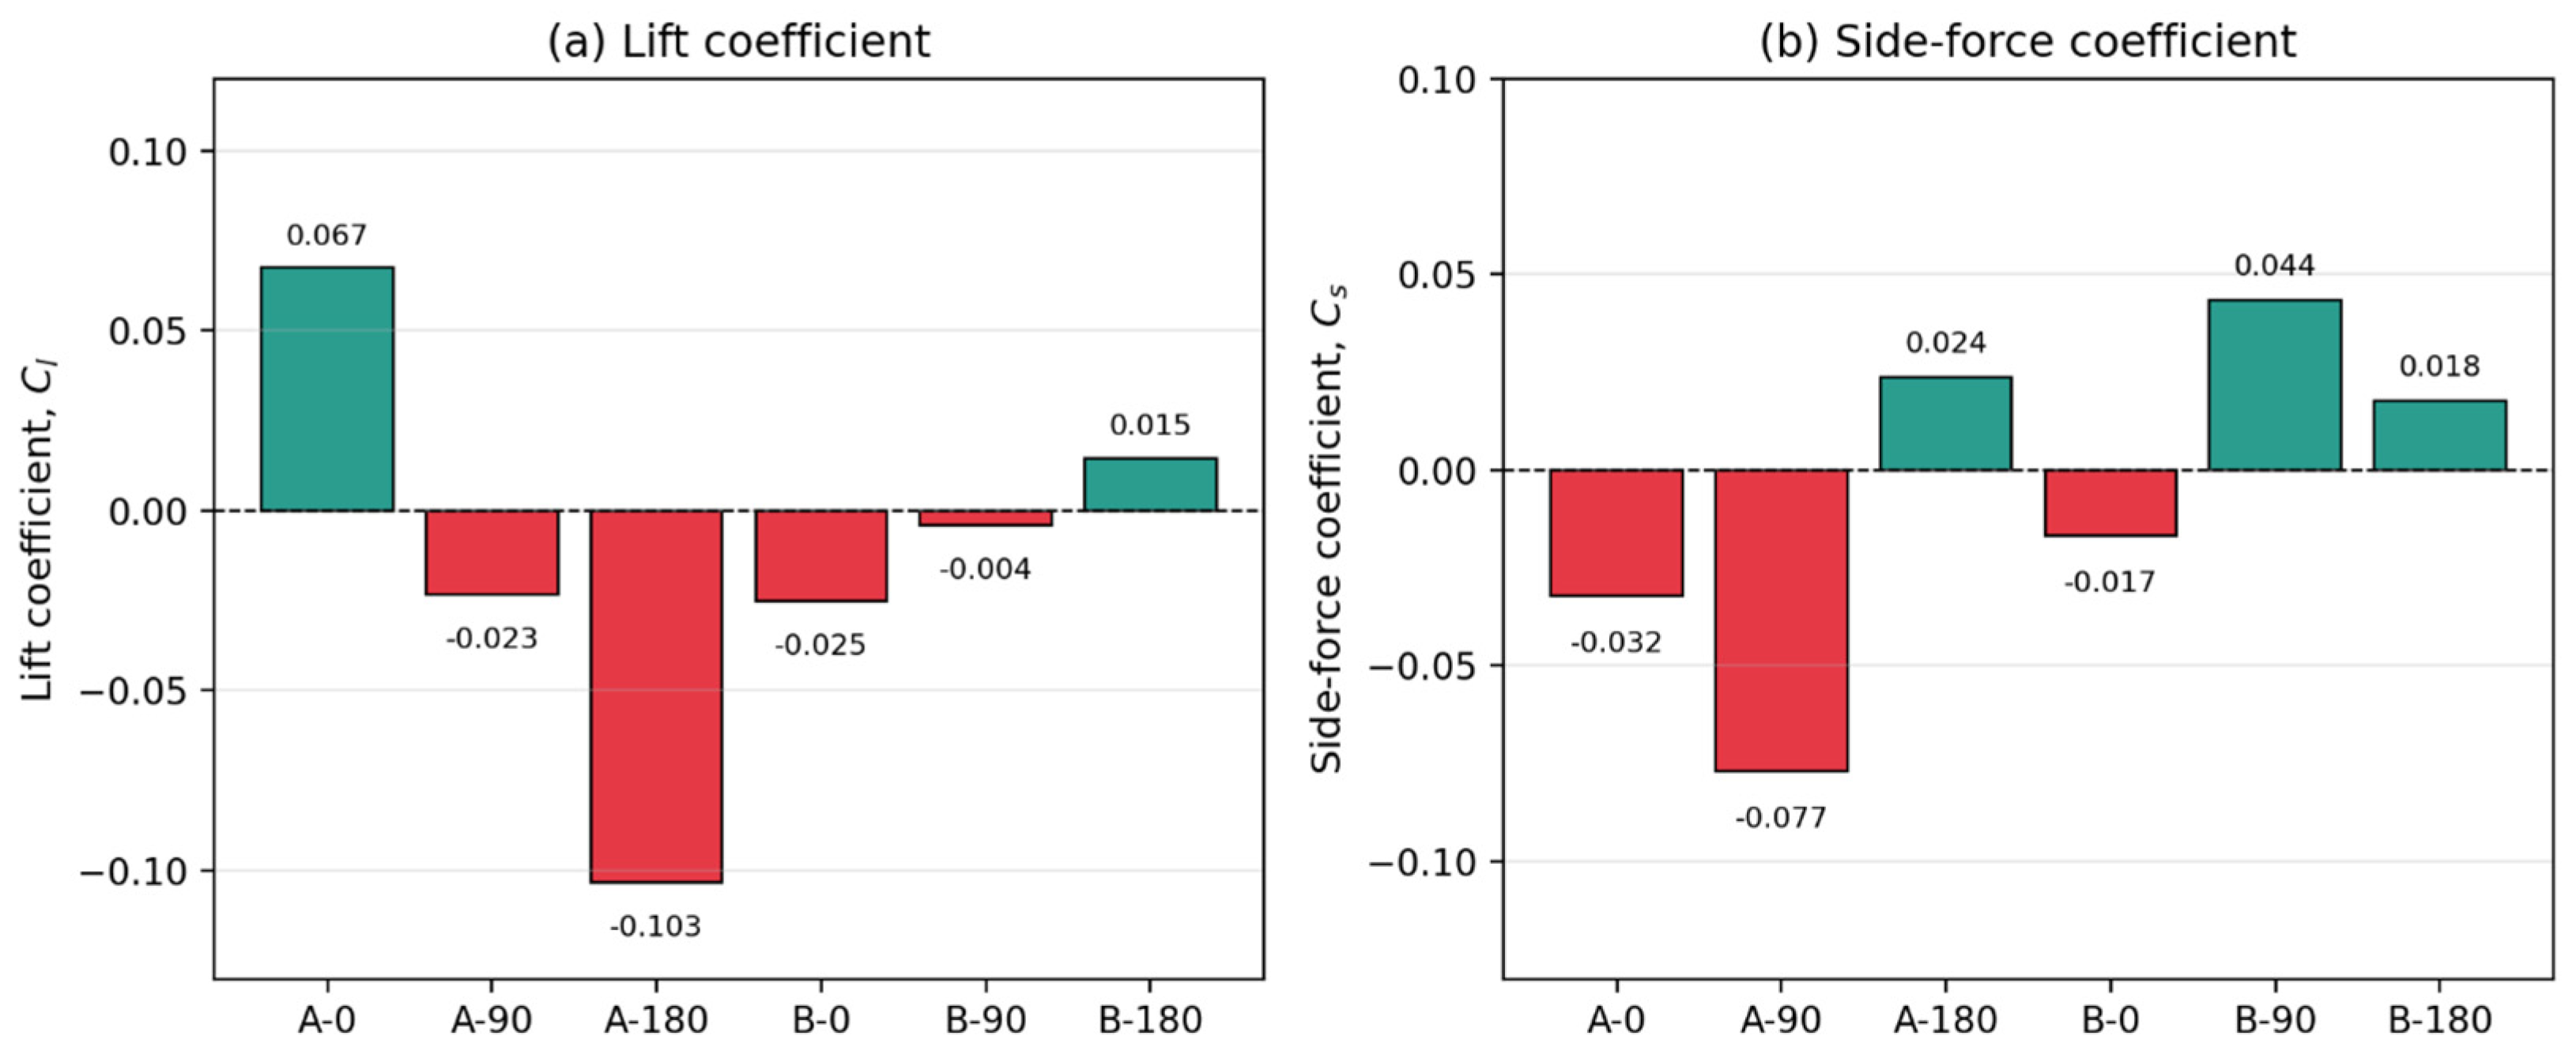
The mean values of Cl and Cs also differed among orientation conditions. A-180 showed the largest absolute lift coefficient, whereas A-90 exhibited the strongest negative side-force bias. In contrast, B-0 and B-180 showed Cl and Cs values closer to zero, whereas B-90 exhibited a distinct positive side-force bias (Figure 5).
Figure 5.
Full-range mean aerodynamic force coefficients for the six fixed-orientation conditions. (a) Lift coefficient (Cl); (b) side-force coefficient (Cs).
The sign reversal of Cl between A-0 and A-180 suggests that the upstream-facing surface arrangement of the tested Trionda ball may not be vertically symmetric with respect to the defined reference orientation. In addition, B-90 showed the clearest positive side-force bias. The Cl and Cs results should therefore be interpreted as supplementary indicators of orientation-related aerodynamic asymmetry rather than as complete descriptors of realistic football flight.
3.4. Altitude Effects on Long-Kick Flight Range
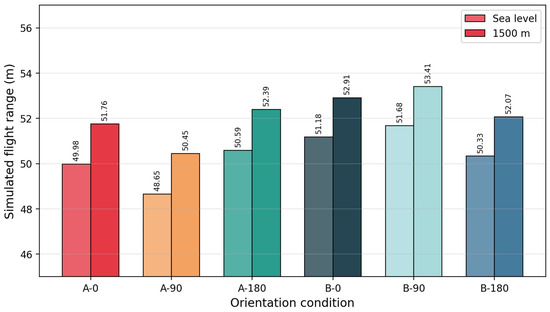
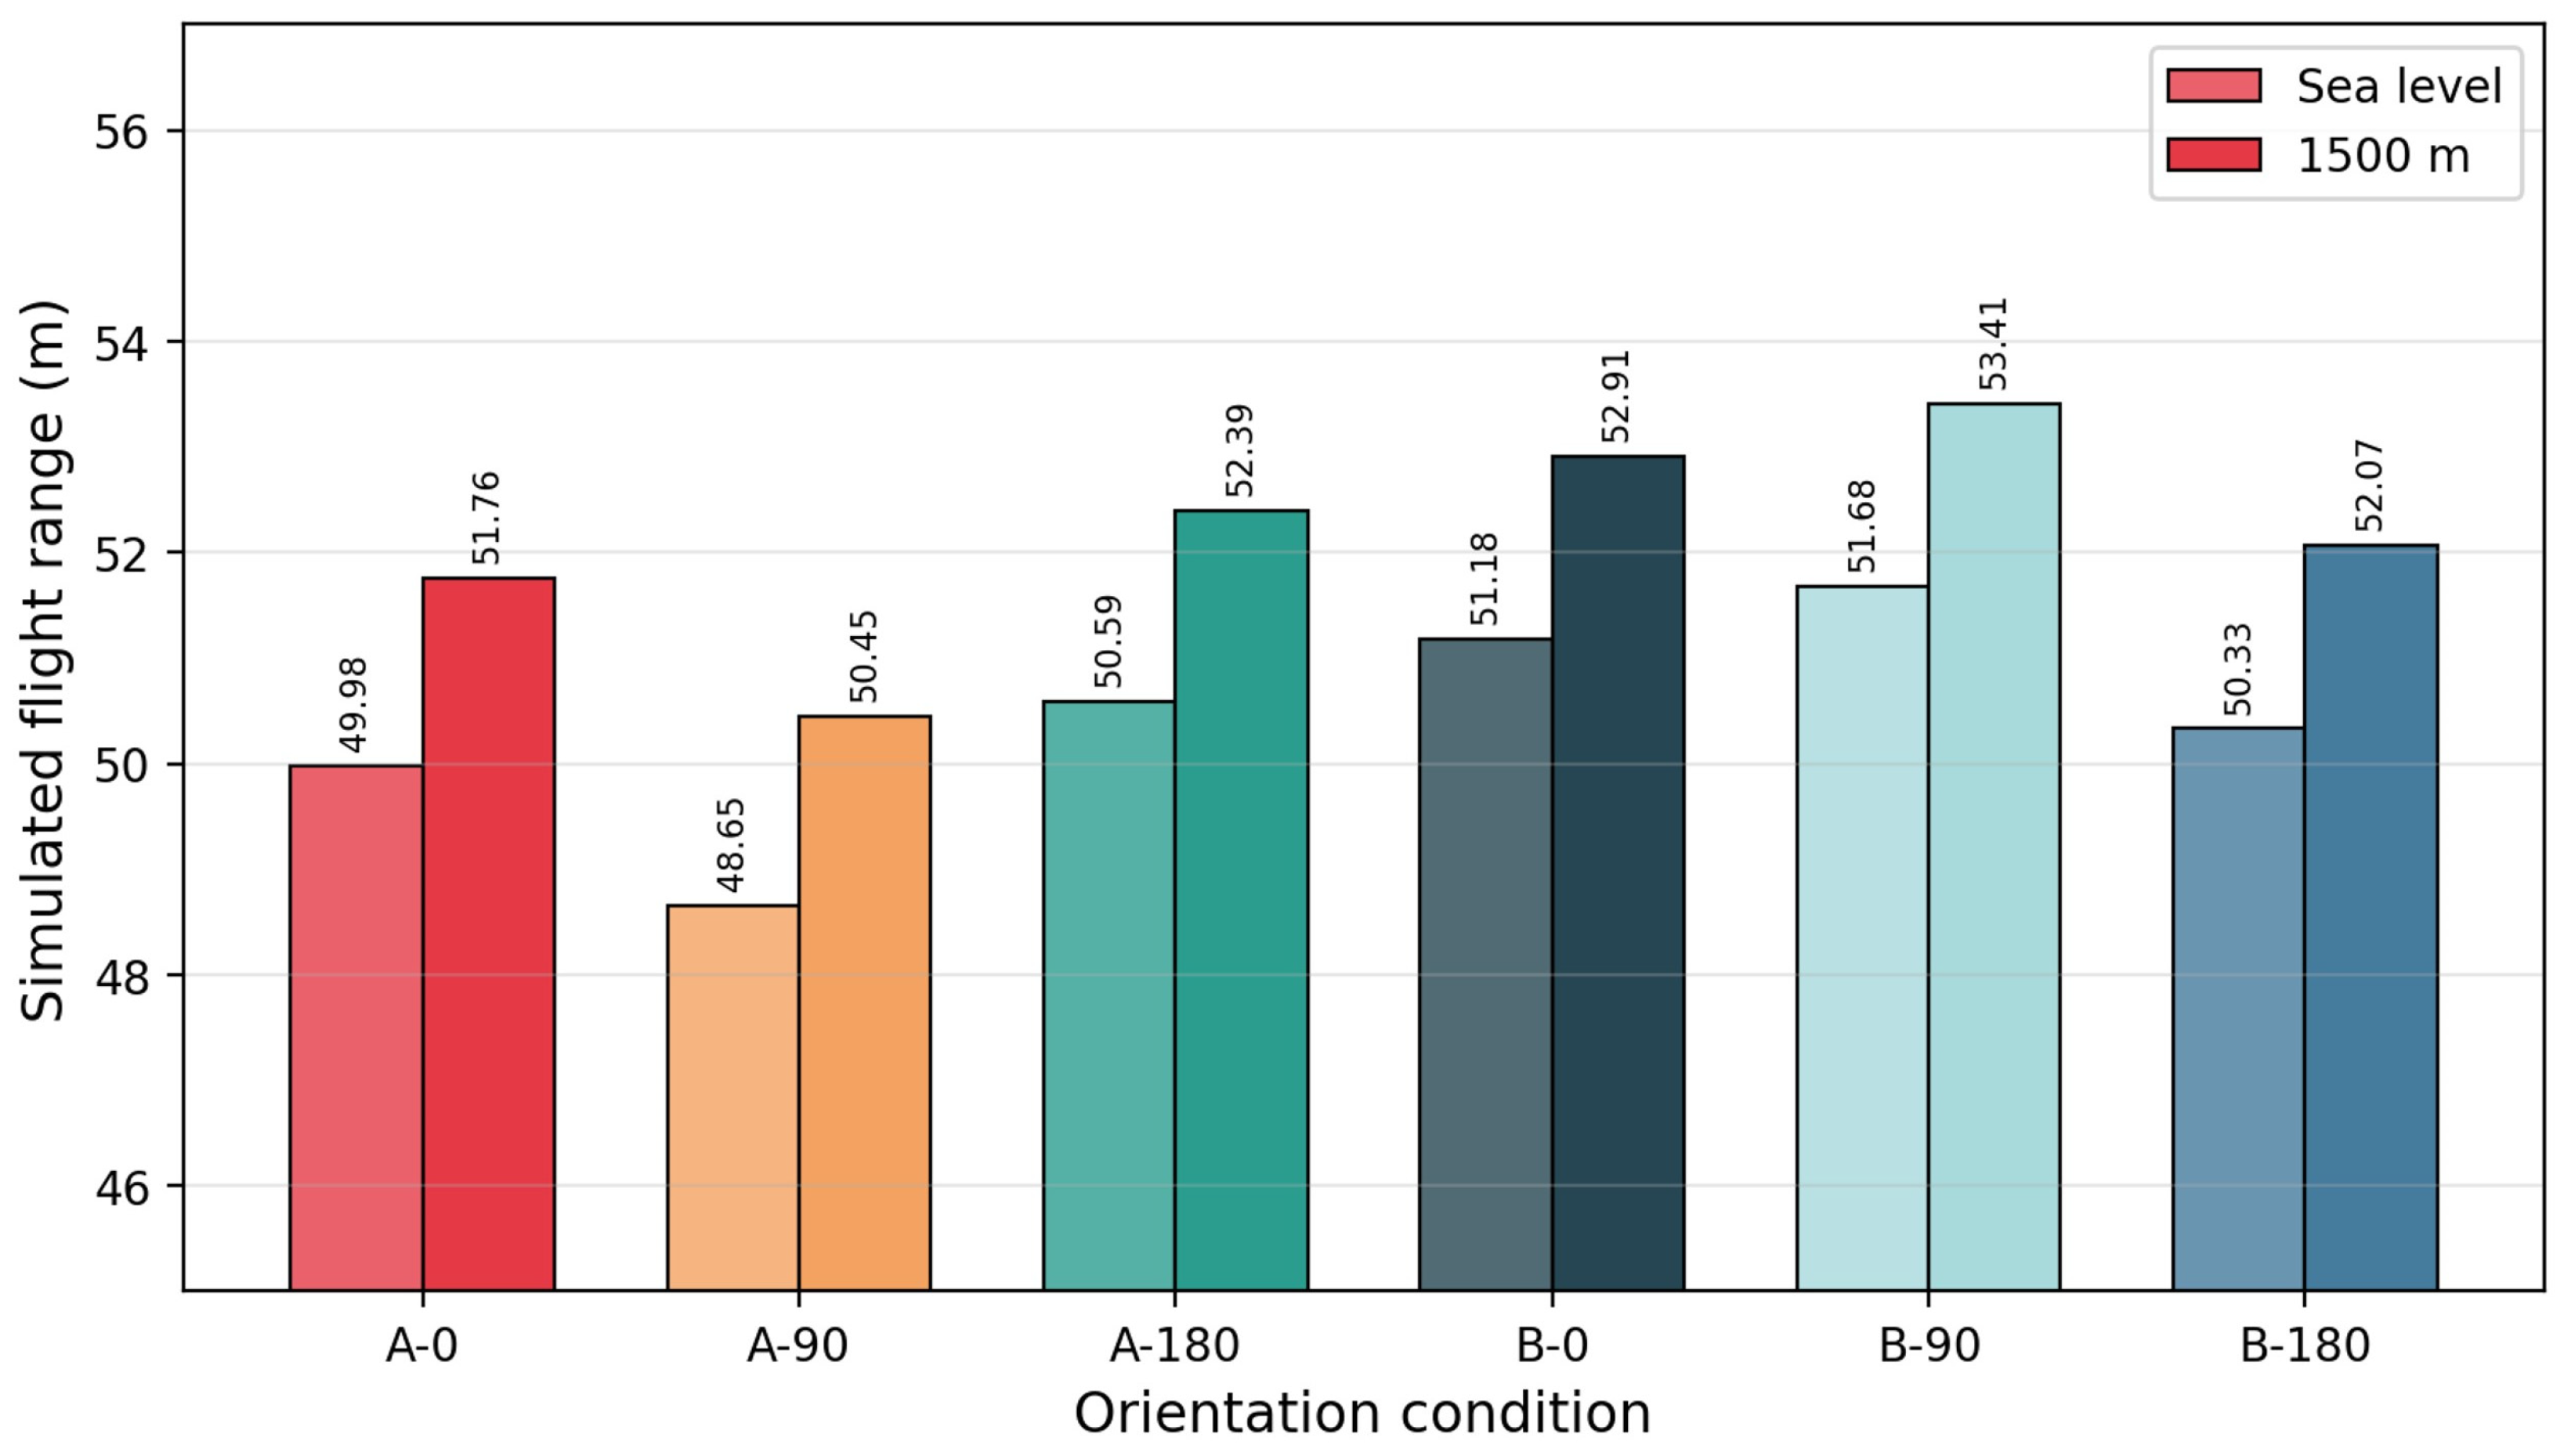
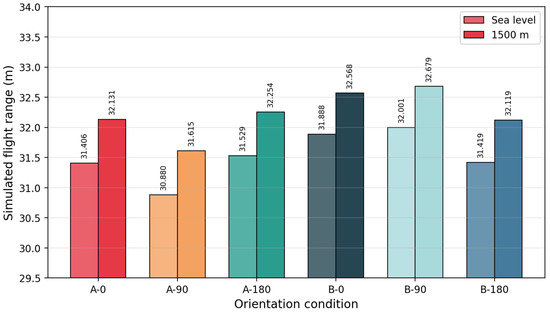
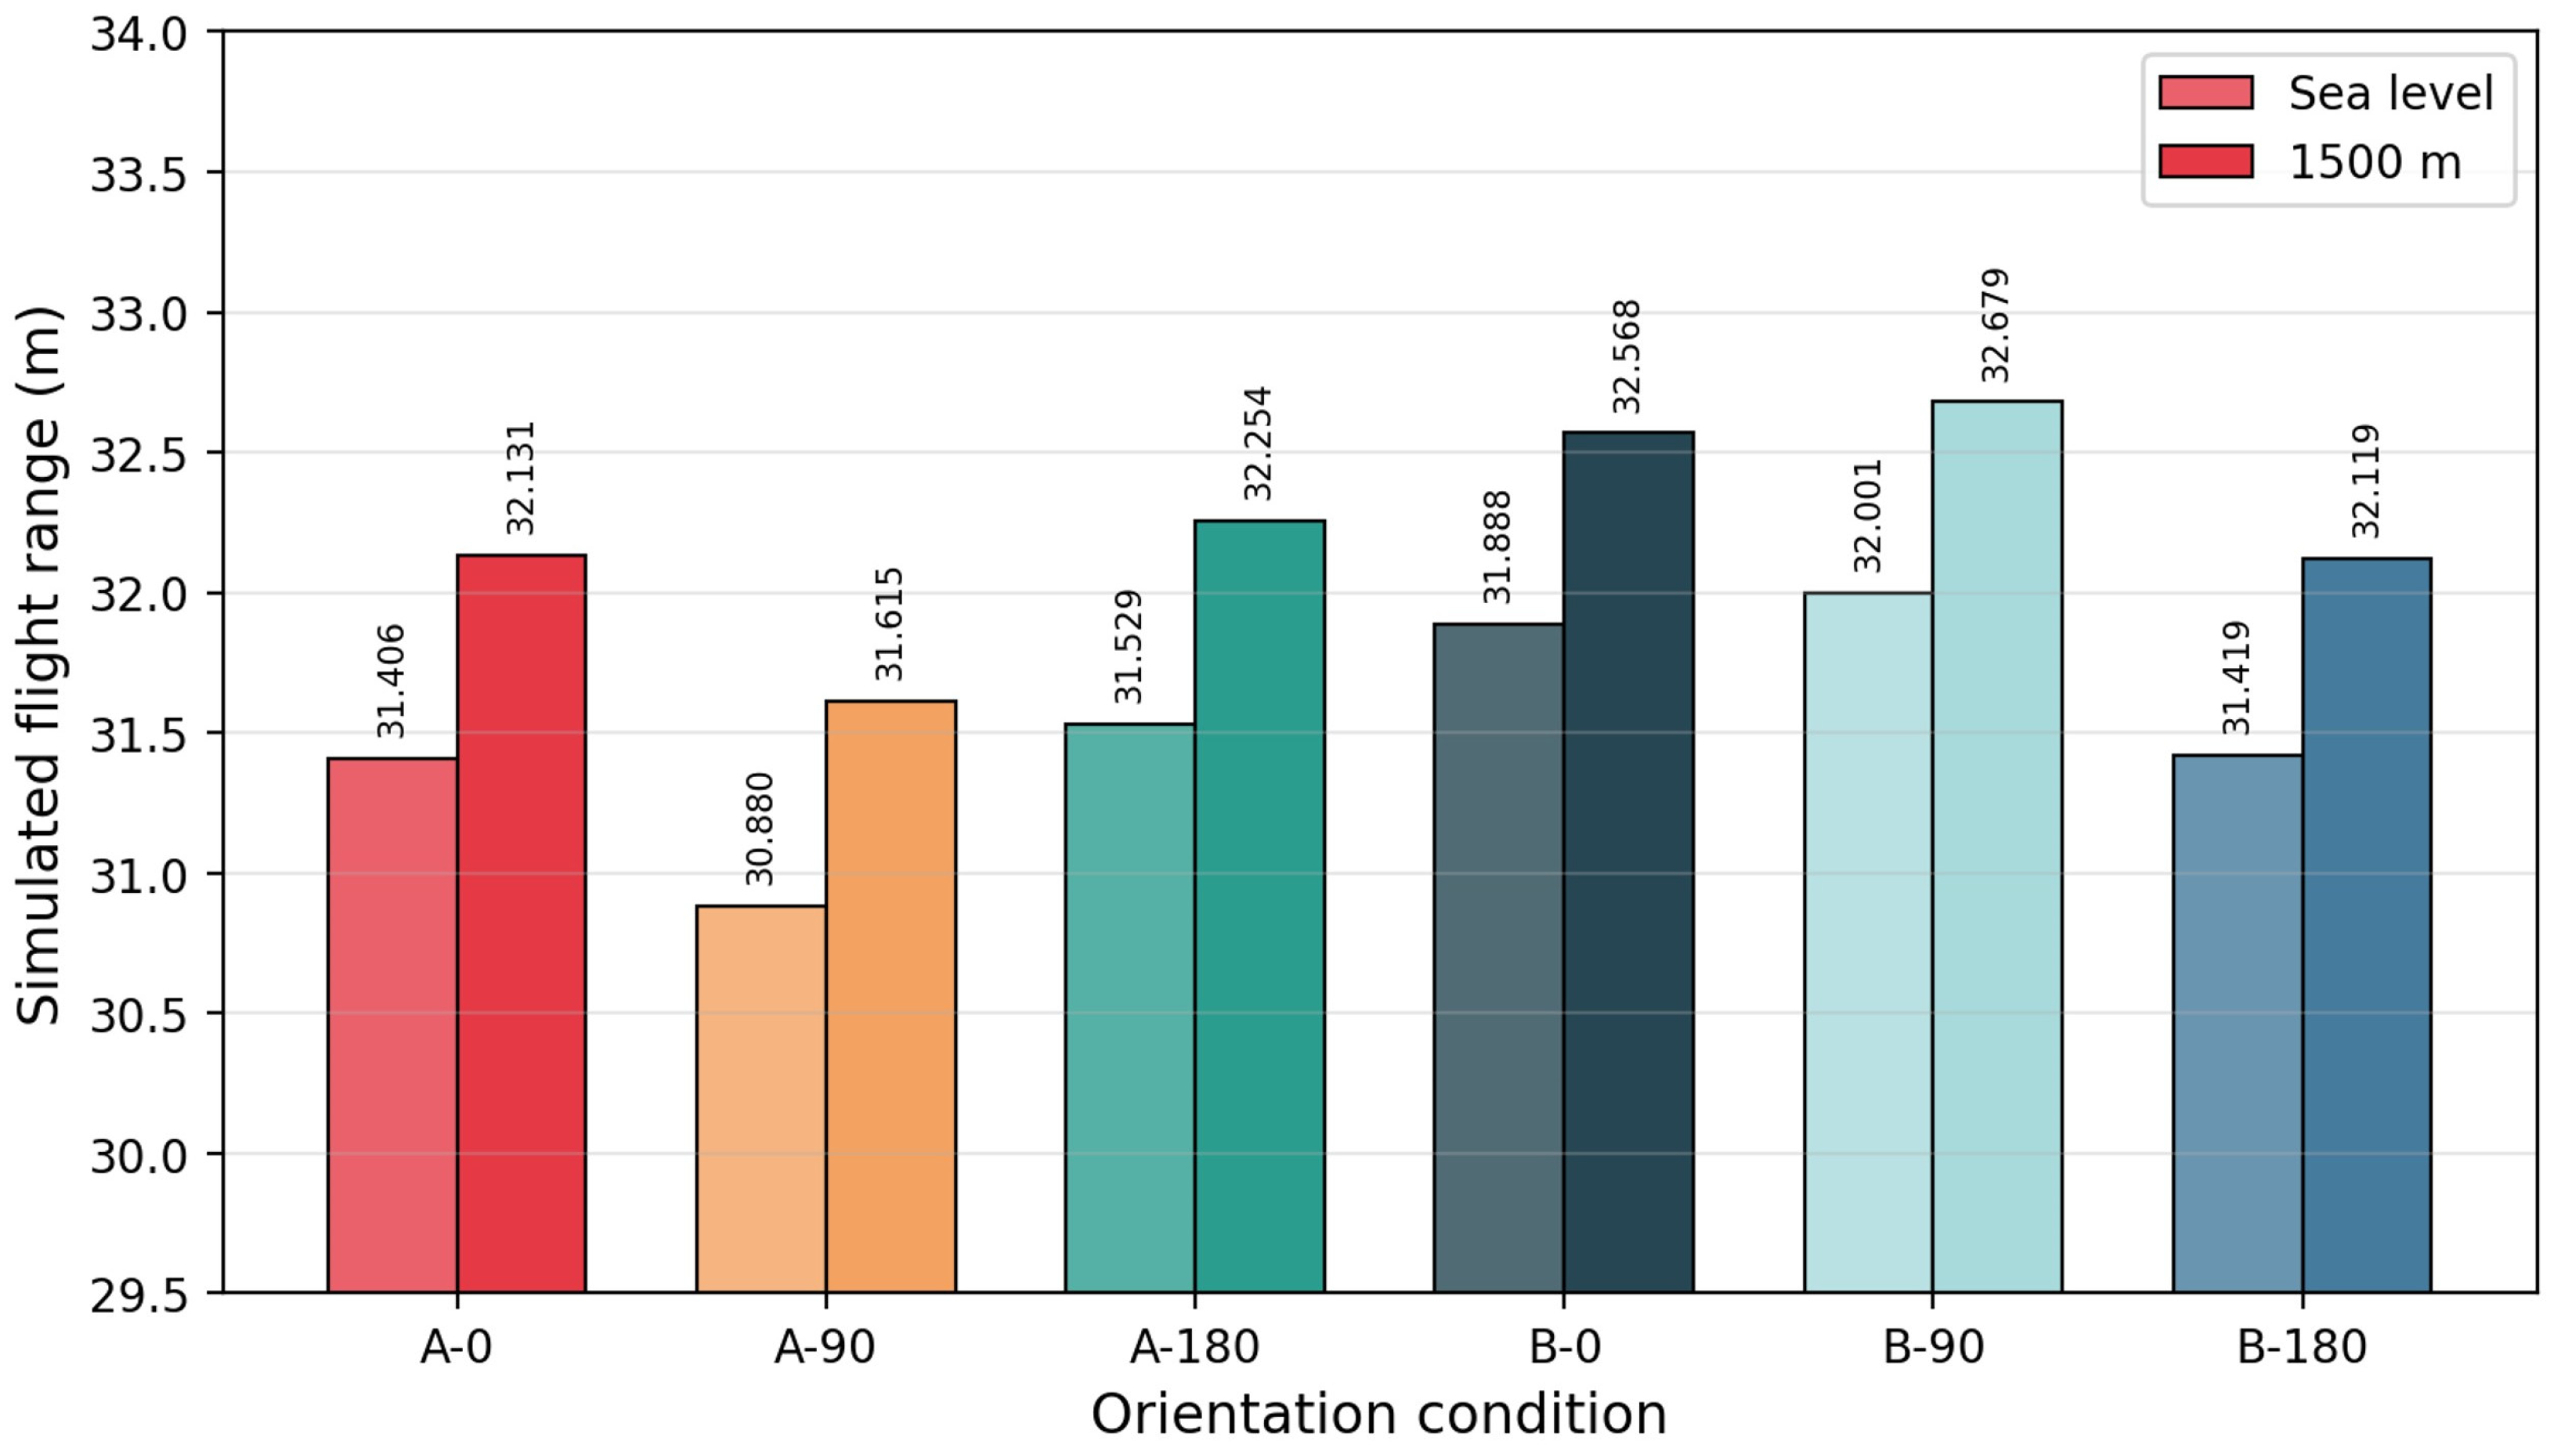
For the long-kick condition, the simulated range at sea level was greatest for B-90 (51.68 m) and shortest for A-90 (48.65 m). At 1500 m altitude, the range increased for all conditions, with values from 50.80 to 54.12 m. The increase in flight distance ranged from 2.46 to 2.66 m depending on the orientation.
An important result was that the relative ranking among orientations at sea level was preserved at 1500 m altitude. Reduced air density increased range for all cases but did not reverse the orientation-dependent hierarchy. As shown in Figure 6, altitude acted primarily as an upward shift in range across all six orientations. These range differences should be interpreted as deterministic responses of the adopted model based on the measured speed-dependent Cd data and their interpolation in the flight simulation, rather than as uncertainty-bounded trajectory predictions.
Figure 6.
Simulated long-kick range for the six fixed-orientation conditions at sea level and 1500 m altitude. Initial speed v0 = 30 m/s; launch angle θ = 30°.
The effect of the reconstruction method on the representative long-kick simulation was also examined using the A-90 and B-90 conditions, which showed the largest contrast in drag and flight range. For v0 = 30 m/s and θ = 30°, the absolute range difference between the linear interpolation and third-order polynomial approaches was less than 0.42 m. More importantly, the inter-orientation range difference, ΔR = B-90 − A-90, changed only from 3.031 m to 2.985 m, corresponding to a difference of 0.046 m, or approximately 1.5%. Therefore, the main conclusion regarding the B-90 > A-90 range ordering was not sensitive to the selected Cd reconstruction method.
3.5. Free-Kick Flight Characteristics
The free-kick condition showed the same overall orientation ranking as the long-kick condition, with B-90 producing the longest simulated range and A-90 the shortest. However, the absolute range differences among orientations were smaller than those in the long-kick case, consistent with the lower launch speed and the reduced cumulative effect of orientation-dependent drag differences (Figure 7).
Figure 7.
Simulated free-kick range for the six fixed-orientation conditions at sea level and 1500 m altitude. Initial speed v0 = 25 m/s; launch angle θ = 20°.
3.6. Parametric Analysis: Range Sensitivity to Initial Speed and Launch Angle
To assess how the orientation-dependent range difference varies with kicking conditions, a parametric two-dimensional flight simulation was conducted across 36 combinations of initial speed (20–35 m/s) and launch angle (15–40°) at sea level. The resulting inter-orientation range difference, defined as ΔR = B-90 minus A-90, is summarized in Table 3. The remaining four orientations also fell between these two extremes at all tested combinations.
Table 3.
Inter-orientation range difference (ΔR = B-90 − A-90, m) at sea level across six initial speeds and six launch angles.
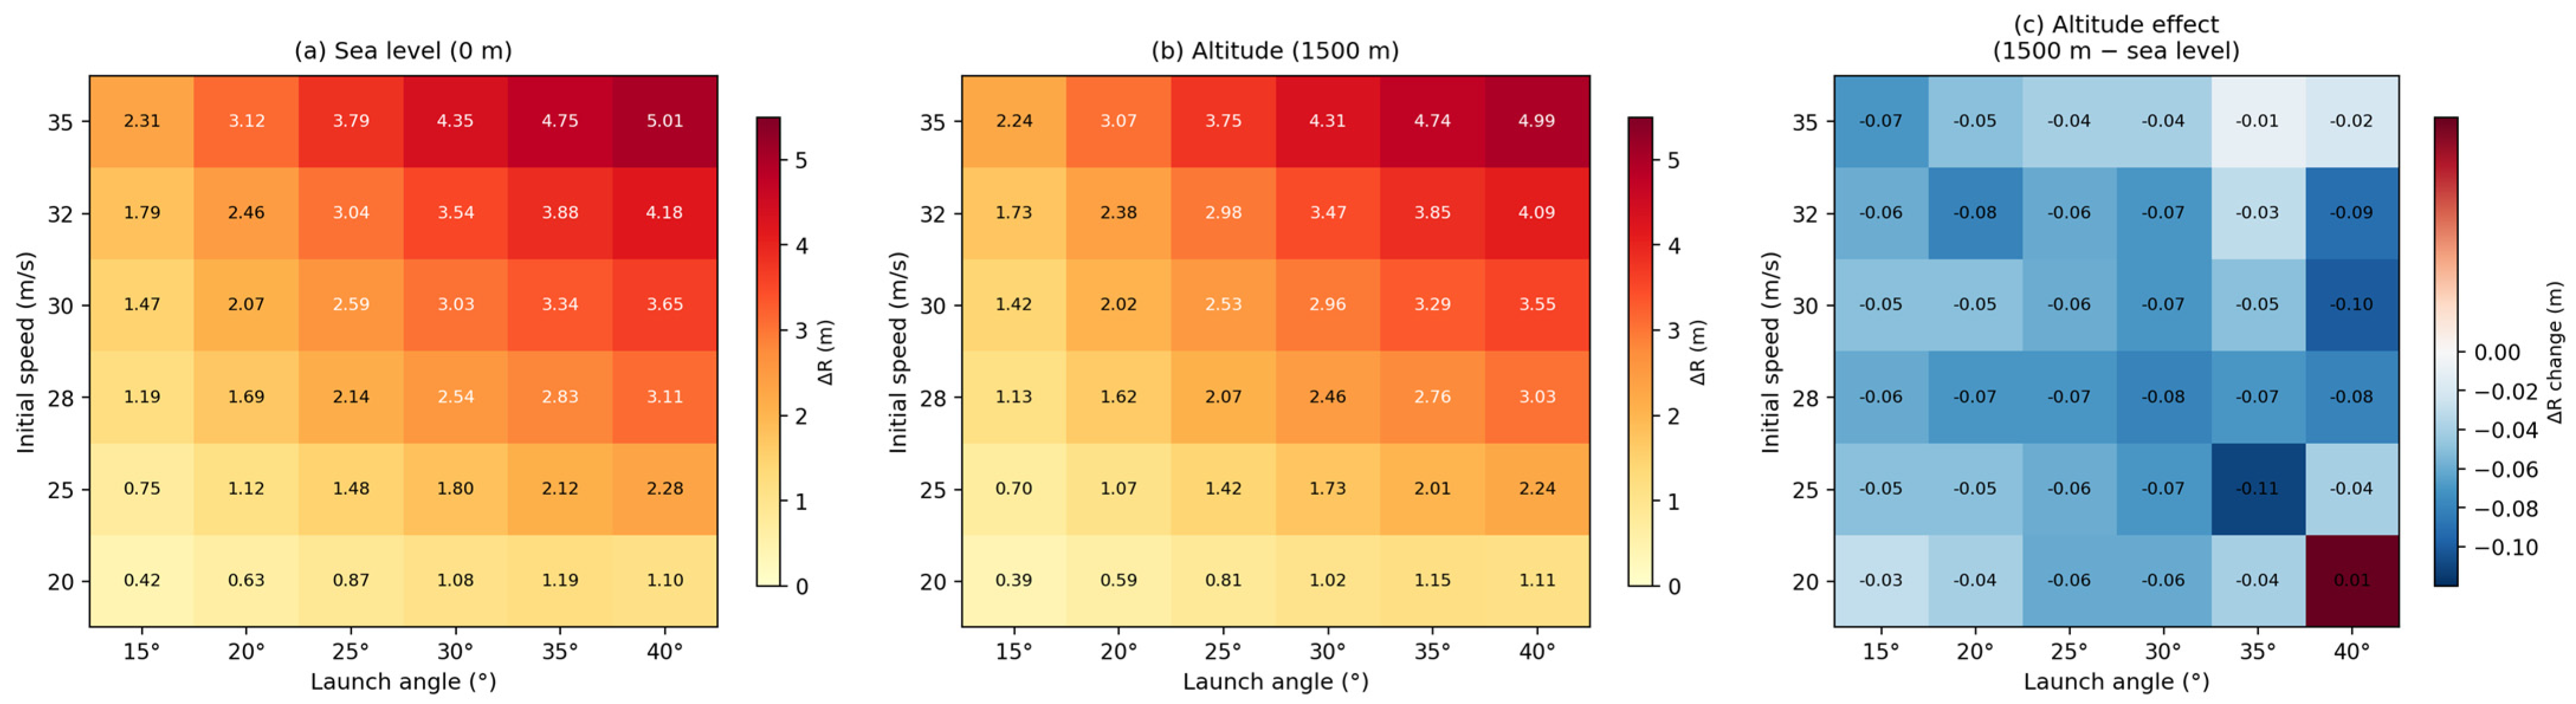
Table 3 shows that ΔR generally increased with initial speed and, in most cases, with launch angle, from 0.42 m at the lowest combination (20 m/s, 15°) to 5.01 m at the highest (35 m/s, 40°). Initial speed was the dominant variable: increasing v0 from 20 to 35 m/s increased ΔR by approximately a factor of 4~5 at any fixed angle, consistent with the quadratic dependence of drag on velocity. Launch angle had a secondary but meaningful effect, with steeper trajectories generally producing larger ΔR values. The combined effect of high speed and steep angle produced the greatest orientation sensitivity.
At 1500 m altitude, ΔR was slightly smaller than at sea level for most combinations, typically by less than 5%, and the B-90 > A-90 ordering was preserved across all 36 parameter combinations. This indicates that the extreme orientation contrast identified under the representative launch conditions remained robust over a broader launch condition space even at reduced air density. The parametric results therefore indicate the relative sensitivity of the model predictions to orientation, but do not quantify the full uncertainty of real flight outcomes.
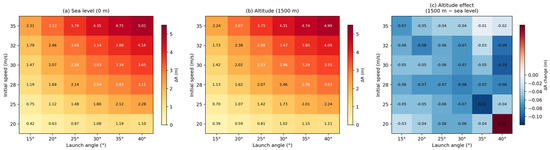
Figure 8 visualizes these trends over the tested parameter space. At both sea level and 1500 m altitude, the inter-orientation range difference increased toward combinations of higher initial speed and larger launch angle, confirming that orientation sensitivity becomes most pronounced for powerful and relatively steep long-range kicks. The altitude-induced change in ΔR remained comparatively small over most of the domain, indicating that altitude modified the absolute flight range more strongly than the relative separation between the two extreme orientations.
Figure 8.
Heat maps of the inter-orientation range difference, ΔR = B-90 − A-90, across initial speed and launch angle. (a) Sea level; (b) 1500 m altitude; (c) altitude-induced change in ΔR, defined as ΔR at 1500 m minus ΔR at sea level. Warmer colors indicate greater simulated orientation sensitivity.
3.7. Exploratory Fixed-Orientation Lateral Bias
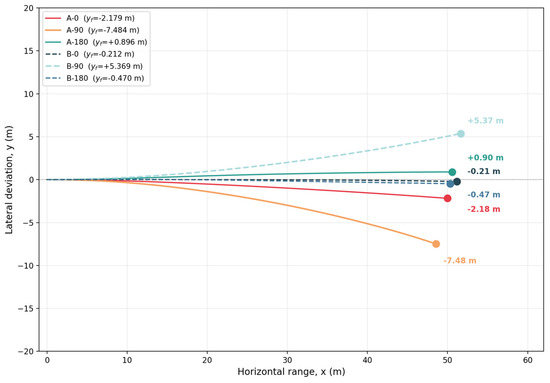
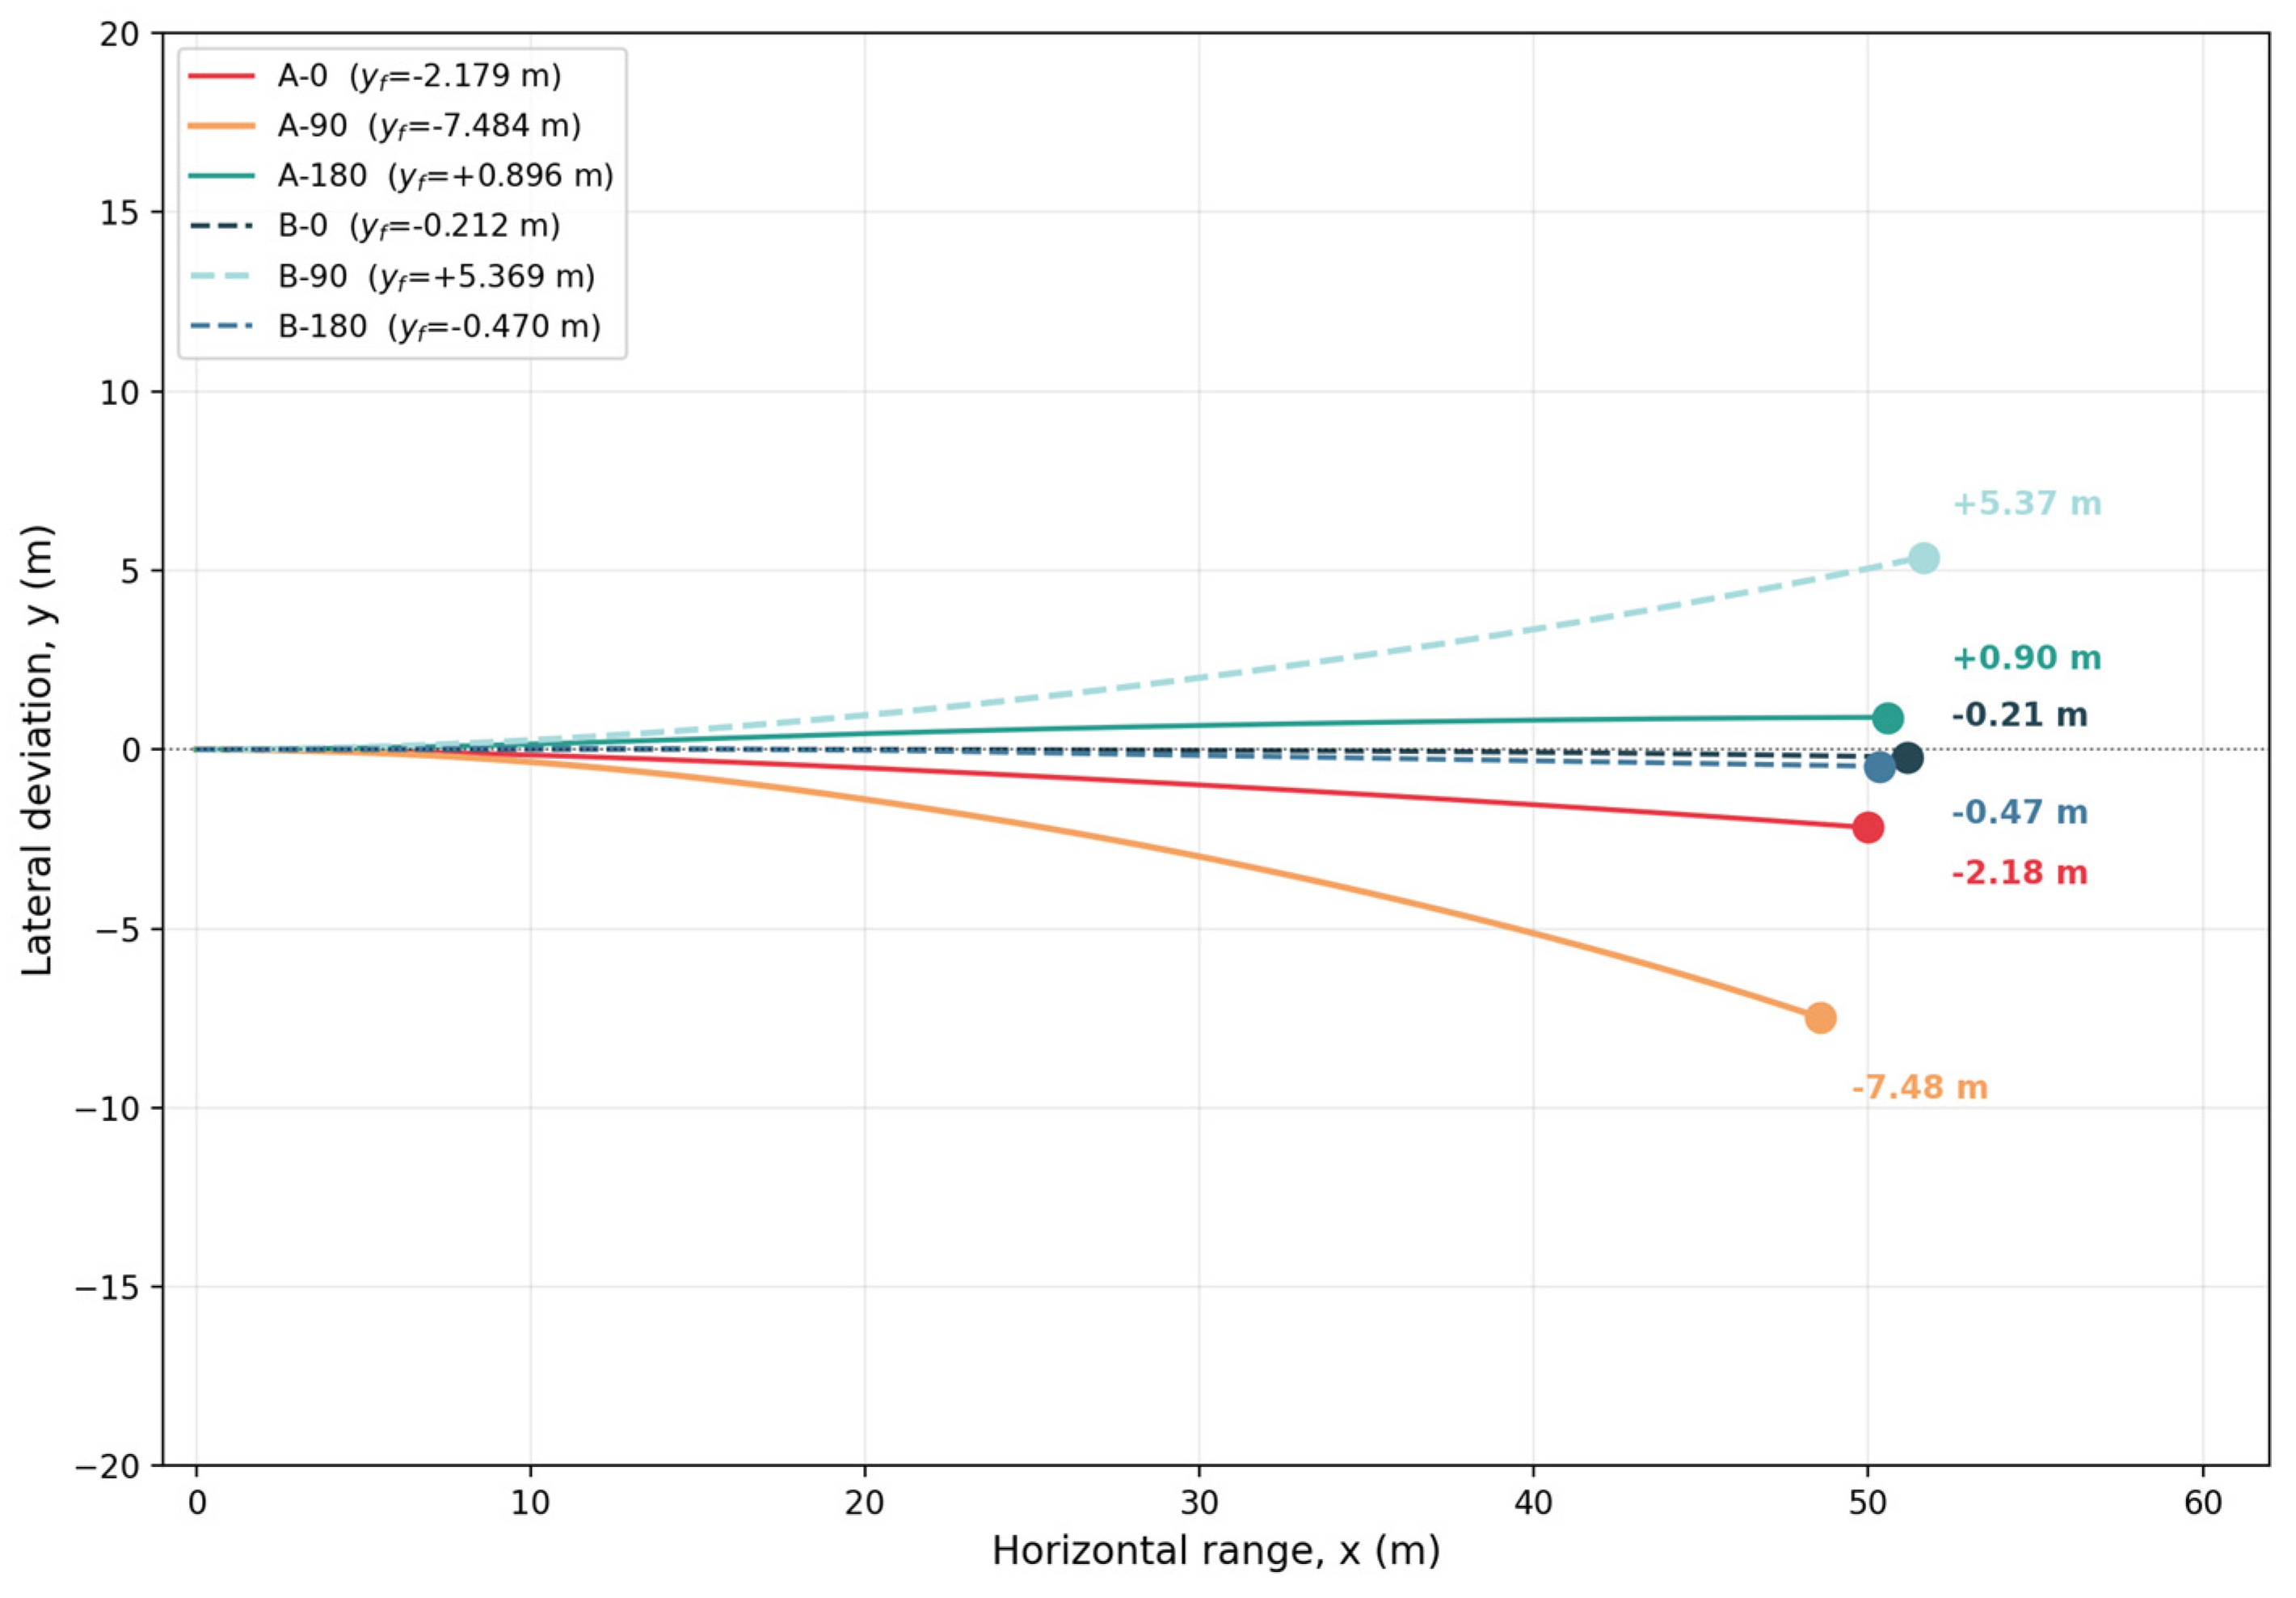
An exploratory three-dimensional simulation was used only as a supplementary illustration of how the measured side-force differences may translate into lateral bias under fixed-orientation assumptions. In this simplified model, the sign of the lateral deviation broadly followed the sign of the mean side-force coefficient for each orientation (Figure 9). Because lift, spin, attitude change, aerodynamic torque, and other unsteady effects were not included, these results are interpreted only as reduced-order indicators of orientation-related lateral bias rather than as realistic predictions of match play trajectory.
Figure 9.
Top-view (x–y plane) trajectories from the exploratory three-dimensional fixed-orientation simulation for the long-kick condition at sea level. Initial speed v0 = 30 m/s; launch angle θ = 30°. Circles indicate landing points; solid lines denote the A-series and dashed lines denote the B-series. Positive and negative y values indicate opposite directions of lateral bias within the adopted coordinate system.
3.8. Regime-Conditioned Cross-Orientation Summary of Drag Response
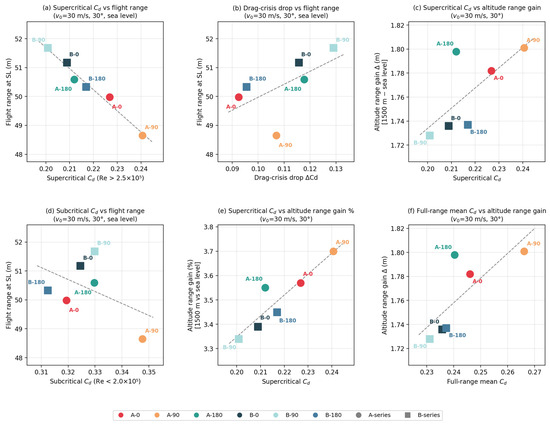
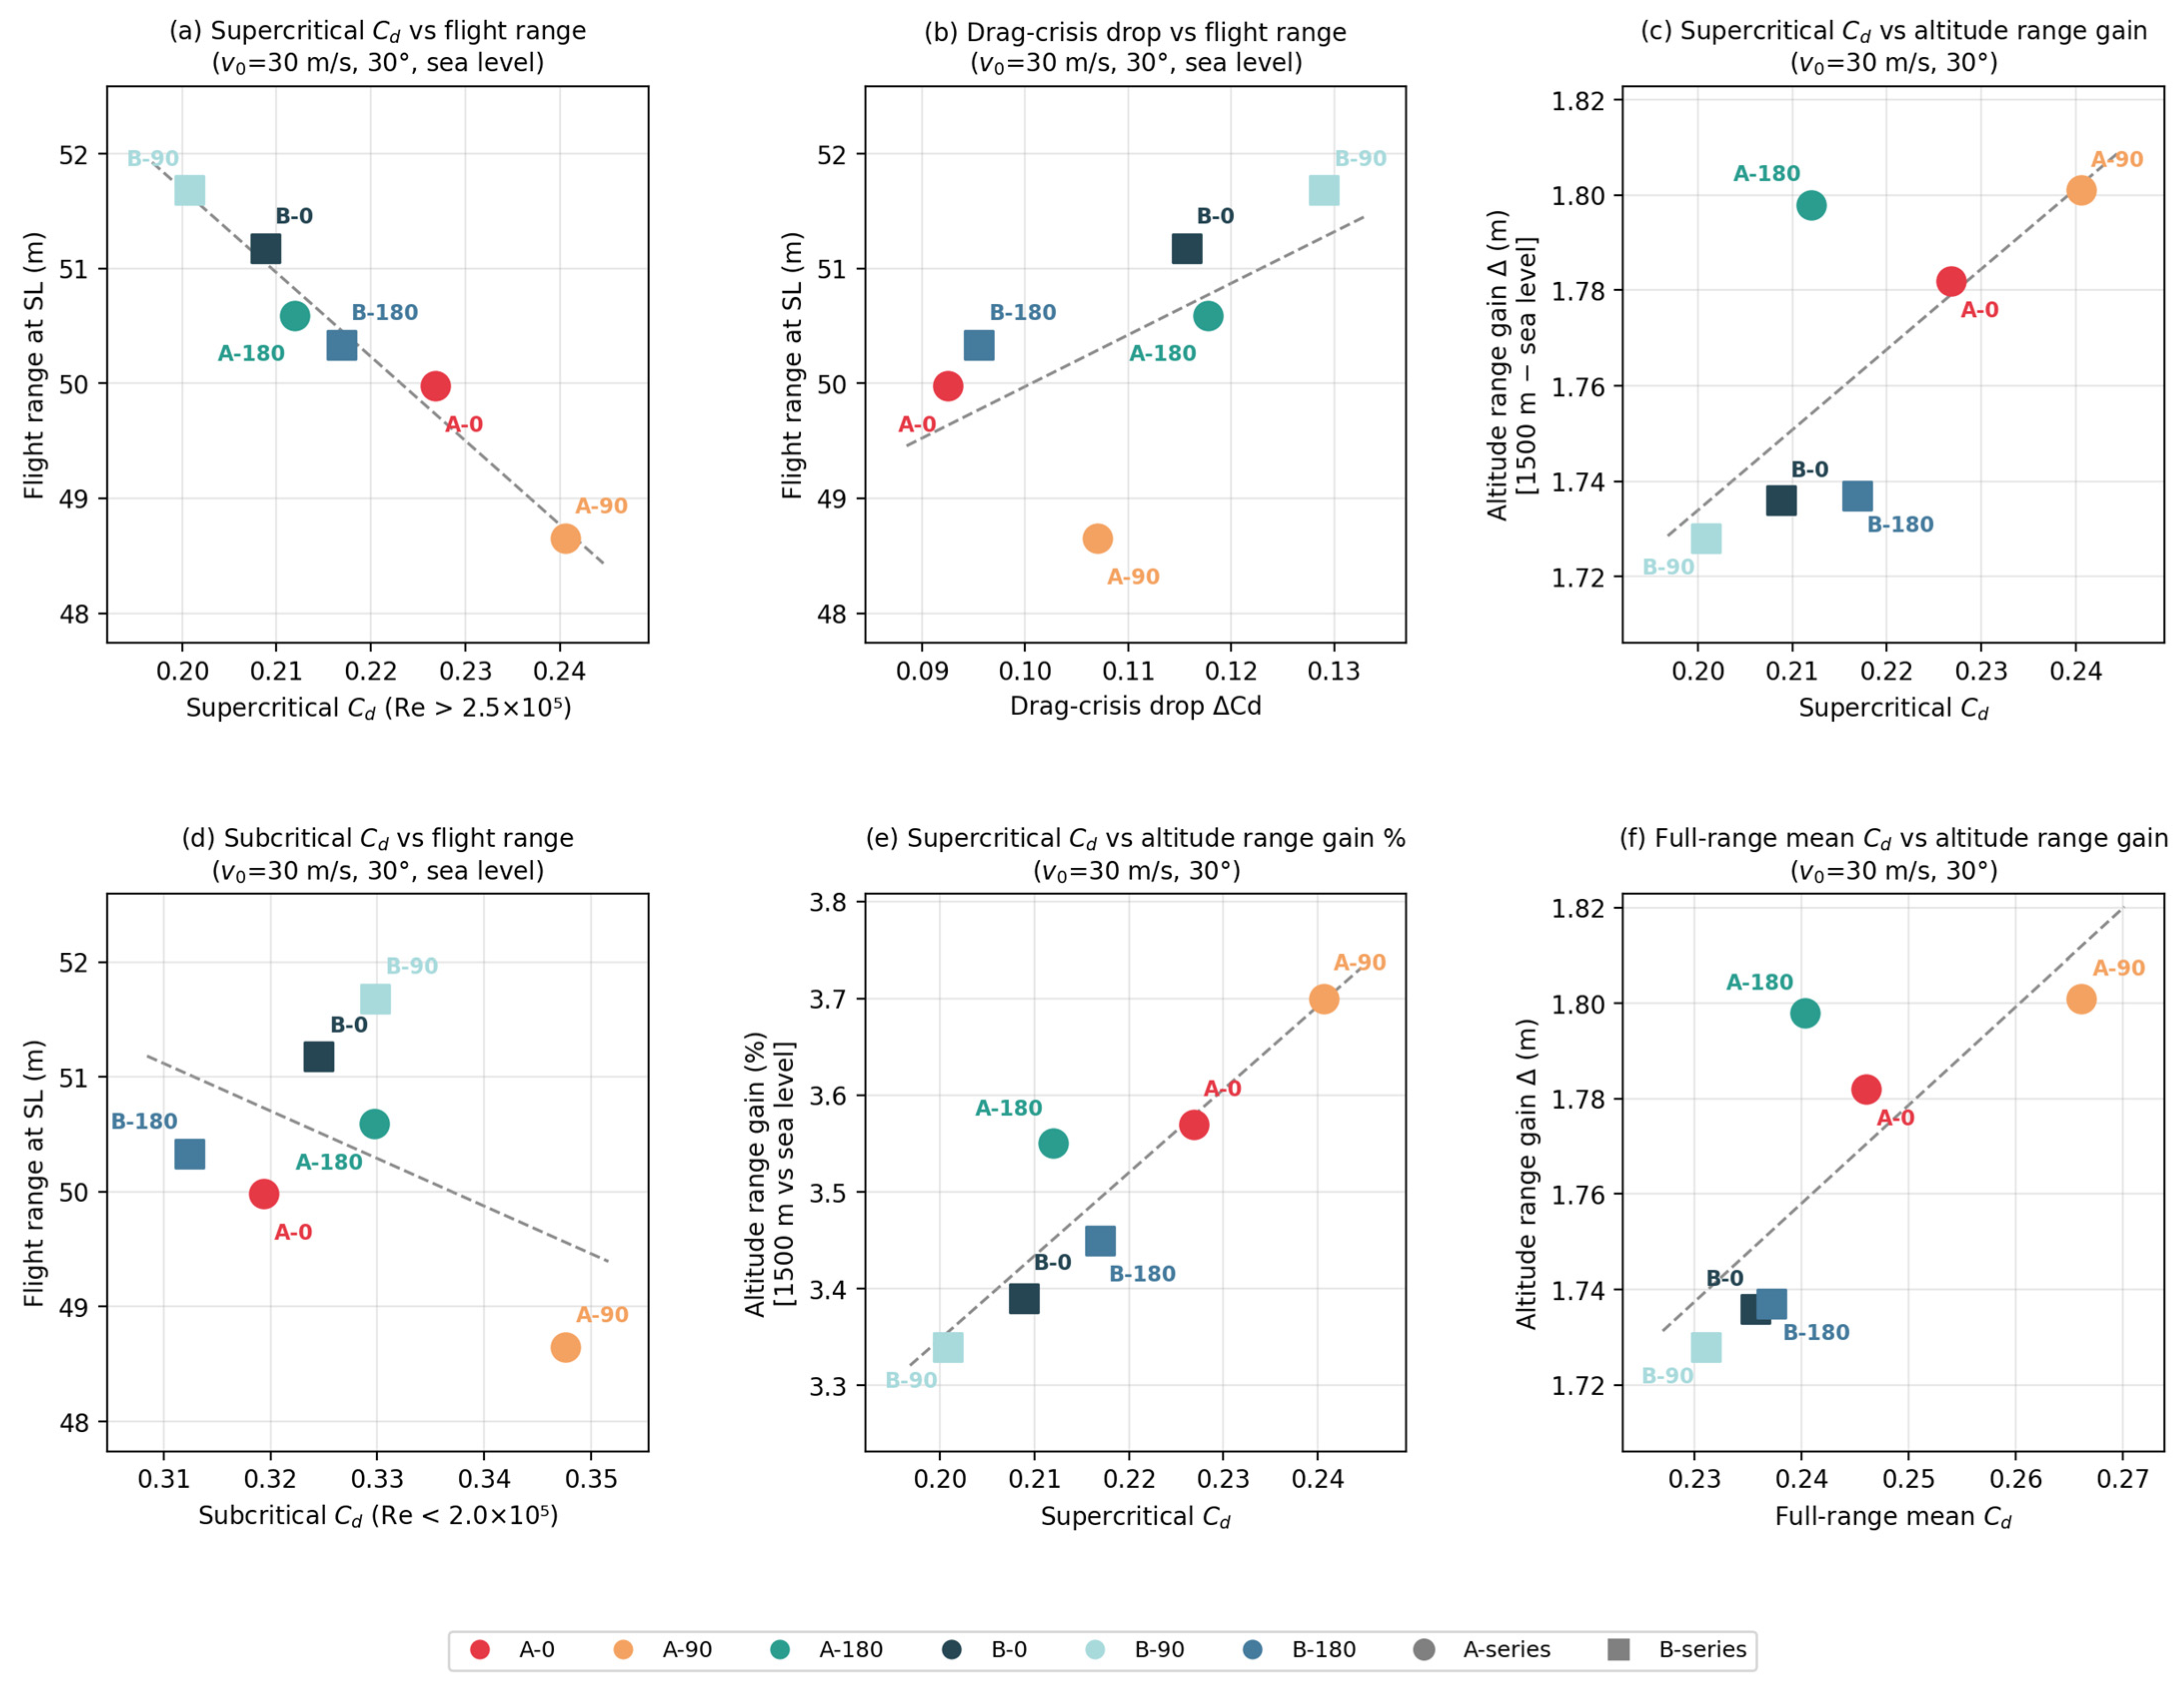
To provide a compact cross-regime summary of the drag response, the six fixed-orientation conditions were further organized into a regime-conditioned response map based on four descriptive metrics: subcritical mean drag, drag crisis drop, supercritical mean drag, and full-range mean drag (Figure 10). This summary showed that B-90 combined the largest drag crisis drop with the lowest supercritical and aggregated drag levels, whereas A-90 exhibited the highest subcritical, supercritical, and aggregated drag. By contrast, B-180 showed the lowest subcritical drag but only a modest drag crisis drop and a less favorable supercritical state than B-90. These comparisons indicate that the orientation effect cannot be reduced to a simple shift in the critical Reynolds number alone, because the relative aerodynamic ranking depended on the combined variation in pre-critical drag, transition response magnitude, and post-critical drag level.
Figure 10.
Relationships between aerodynamic characteristics and flight performance across orientation conditions and altitudes.
The regime-conditioned response map interpretation is not intended to replace the Reynolds-number-dependent drag curves or the numerical summary in Table 2. Rather, it provides an interpretive cross-regime synthesis showing how each tested orientation combines pre-critical drag level, transition response magnitude, post-critical drag level, and aggregated drag performance.
4. Discussion
The present results show that the tested Trionda ball exhibits measurable aerodynamic variability as a function of fixed surface orientation, particularly in the drag crisis regime. From a fluid mechanical perspective, this indicates that the upstream arrangement of seams and groove textures can modify boundary layer transition and flow separation even when the nominal ball geometry remains unchanged. Within the present single-specimen dataset, the aerodynamic response therefore cannot be represented adequately by a single drag coefficient alone, because orientation affected not only the magnitude of the drag crisis drop but also the subcritical drag level and the supercritical drag state. The observed orientation dependence of Cd can be interpreted in terms of surface topology presented to the incoming flow by each fixed orientation. In the drag crisis regime, small changes in surface roughness, seam exposure, groove arrangement, and panel edge distribution can modify the disturbance environment of the developing boundary layer. These local surface features may promote or delay laminar-to-turbulent transition, alter the separation location, and change the width and pressure distribution of the wake. If transition is promoted at an appropriate upstream location, the turbulent boundary layer can remain attached farther downstream, resulting in a narrower wake and reduced pressure drag. Conversely, if the exposed surface arrangement produces less favorable transition or promotes earlier separation, the wake may remain wider and the drag coefficient may increase. Therefore, even though the nominal ball diameter and global geometry are unchanged, rotating the ball can expose different distributions of seam junctions, grooves, and panel edges to the incoming flow, thereby producing different transition–separation responses.
The regime-conditioned response map provides a compact synthesis of the Reynolds-number-dependent drag behavior by combining subcritical drag, drag crisis drop, supercritical drag, and full-range mean drag. This representation shows that the orientation effect is not simply a shift in critical Reynolds number, but a coupled change in pre-critical drag level, transition response magnitude, and post-critical drag state.
Within this framework, B-90 showed the strongest transition-related response, the lowest supercritical drag, and the lowest aggregated full-range mean drag, whereas A-90 showed the highest subcritical drag, the highest supercritical drag, and the highest aggregated full-range mean drag. By contrast, B-180 exhibited the lowest subcritical drag, but its drag crisis drop was modest and its supercritical drag remained higher than that of B-90. This comparison is important because it indicates that the orientation effect is not explained sufficiently by a simple shift in critical Reynolds number alone. Rather, the aerodynamic hierarchy among the tested orientations appears to reflect a coupled reorganization of subcritical drag, crisis intensity, and post-critical drag, instead of a mere left–right displacement of a single canonical drag crisis curve. Compared with previous World Cup match balls, the orientation-dependent post-critical Cd range observed in the present study indicates that within-ball orientation variability in Trionda is sufficiently large to influence the deterministic flight predictions under the present fixed-orientation assumptions. The post-critical Cd values of the present Trionda orientations ranged from 0.201 for B-90 to 0.241 for A-90. Although direct numerical comparison should be made cautiously because of differences in test conditions, this span of 0.040 is comparable in magnitude to some reported differences among modern match ball designs [25,26]. Thus, the present findings suggest that a single representative drag coefficient may obscure not only the Reynolds number dependence but also orientation-dependent surface topology effects within the same ball model.
The regime-conditioned differences provide indirect clues regarding the underlying flow state. A-90 exhibited the highest subcritical Cd among the tested orientations, suggesting that this upstream-facing surface arrangement may be associated with a less favorable separation state before the drag crisis. In contrast, B-90 showed the largest drag crisis drop and the lowest supercritical Cd, which is consistent with a stronger transition-related reorganization of the boundary layer and a post-critical state with reduced pressure drag, possibly associated with delayed separation and a narrower wake.
A plausible physical interpretation is that different upstream seam and groove arrangements modify the local disturbance environment of the boundary layer, thereby altering the transition–separation sequence in the critical Reynolds number regime. This interpretation is consistent with previous soccer ball aerodynamics studies showing that panel shape, seam geometry, surface texture, and distributed roughness can affect critical Reynolds number, drag crisis behavior, separation, wake structure, and post-critical drag. The present study extends this framework from between-ball comparisons to within-ball orientation dependence by showing that Trionda presents different local seam and groove arrangements to the incoming flow depending on its fixed orientation. The observed differences among A-90, B-90, and the other orientations therefore suggest that the relevant aerodynamic input is not only the global roughness level, but also the spatial distribution of surface discontinuities relative to the stagnation region and developing boundary layer.
These interpretations should be regarded as force-based mechanistic inferences rather than direct flow field evidence. Direct verification of the proposed transition–separation mechanism would require orientation-resolved flow visualization, surface pressure measurements, or wake field diagnostics.
Despite these mechanistic limitations, the flight simulation results indicate that the measured orientation-dependent aerodynamic differences are large enough to produce meaningful differences in predicted trajectory outcomes under the adopted assumptions. In the two-dimensional simulations, lower drag orientations consistently produced longer ranges, and the B-90 > A-90 ranking was preserved across representative launch conditions as well as across the broader parametric analysis. This supports the view that the observed ranking is not an artifact of a single launch condition, but a stable consequence of the measured speed-dependent drag data within the present model framework. The increase in inter-orientation range difference with increasing initial speed and, more moderately, with increasing launch angle further suggests that orientation sensitivity becomes most relevant for powerful and relatively steep long-range kicks, for which drag losses accumulate more strongly.
The altitude results are also physically consistent within the adopted framework. Reduced air density increased the simulated flight range for all tested orientations, but it did not reverse the aerodynamic ranking among them. In this sense, altitude altered the absolute magnitude of drag-induced deceleration more strongly than the relative hierarchy of the tested orientation conditions. This distinction is useful because it indicates that, at least in the present deterministic simulations, the orientation-conditioned aerodynamic ordering remained robust even when the ambient density changed.
The lift- and side-force results provide additional evidence that the aerodynamic response of the tested ball is orientation-sensitive beyond drag alone, but these quantities should be interpreted more cautiously. The measured sign changes and biases in Cl and Cs indicate orientation-related aerodynamic asymmetry, and the exploratory three-dimensional simulation suggests that such differences may translate into lateral bias under fixed-orientation assumptions. However, realistic football flight also depends on spin, spin decay, attitude change, aerodynamic torque, and unsteady wake dynamics, none of which were included here. The three-dimensional results should therefore be viewed only as reduced-order indicators of orientation-related lateral bias rather than as realistic predictions of match play trajectories.
Several limitations constrain the scope of the present findings. Only six representative fixed orientations and a single ball specimen were tested, and the repeated measurements per condition were limited. The simulations assumed fixed orientation and neglected spin, attitude dynamics, environmental disturbances, and uncertainty propagation. In addition, the regime-conditioned response map introduced here is a discrete orientation-conditioned summary, not a continuous morphing-parameter response surface. It provides a structured comparison of the measured drag behavior across representative orientations, but it does not establish a generalized geometric model linking seam topology directly to aerodynamic coefficients. Such an extension would require broader orientation sampling, multiple specimens, denser Reynolds-number-resolved data, and quantitative descriptors of the upstream-facing surface topology. A principal mechanistic limitation of the present study is the absence of orientation-resolved flow field measurements. Without particle image velocimetry, surface oil-film visualization, smoke visualization, surface pressure measurements, or wake surveys for each of the six fixed-orientation conditions, the proposed mechanisms—such as seam-junction-induced boundary layer tripping, upstream-face roughness-distribution effects, and orientation-dependent separation behavior—remain inferential. Direct evidence of the separation-point location, wake width, and boundary layer state as a function of orientation would be required to verify these interpretations. Such measurements are therefore identified as an important direction for future work.
Despite these limitations, the present study provides a useful baseline description of within-ball aerodynamic variability in Trionda. The main contribution is not to redefine a single representative drag property of the ball, but to show that even within one specimen, fixed surface orientation can produce distinct and reproducible changes in the drag crisis structure and, consequently, in predicted trajectory behavior. For this reason, an orientation-conditioned interpretation appears more appropriate than a single mean coefficient description when discussing the aerodynamic response of the tested Trionda specimen under the present non-spinning and fixed-orientation conditions.
5. Conclusions
This study quantified the orientation-dependent aerodynamic response of the tested Trionda specimen using six reproducible fixed-orientation conditions. All six conditions exhibited drag crisis behavior, but the transition response magnitude, the subcritical drag level, and the supercritical drag state differed among orientations. Among the tested cases, B-90 showed the strongest drag crisis response together with the lowest supercritical and aggregated full-range mean drag, whereas A-90 showed the highest overall drag level across regimes. These results indicate that, within the present single-specimen and fixed-orientation framework, the aerodynamic response of Trionda cannot be represented adequately by a single mean drag coefficient alone.
Interpreted through a regime-conditioned response map, the present results suggest that the orientation effect is better understood as a coupled modification of pre-critical drag, transition response magnitude, and post-critical drag, rather than as a simple shift in critical Reynolds number alone. In this sense, the aerodynamic hierarchy among the tested orientations reflects differences in drag crisis structure, not merely differences in one averaged coefficient. This interpretation is consistent with the simulated flight results, in which the lower drag orientation B-90 consistently produced longer range than the higher-drag orientation A-90 across representative launch conditions and across the expanded parametric analysis at both sea level and 1500 m altitude.
From a mechanistic perspective, the findings are most consistent with an orientation-dependent modification of the transition–separation sequence in the critical Reynolds number regime, conditioned by the upstream-facing arrangement of seams and groove structures. However, because no orientation-resolved flow visualization, surface pressure measurement, or quantitative surface topology characterization was obtained, this interpretation should be regarded as physically grounded but not directly verified.
Because the study was limited to one specimen, six representative fixed orientations, and simplified non-spinning simulations, the findings should be interpreted as a baseline description of within-ball aerodynamic variability rather than as a complete model of realistic match play flight. The regime-conditioned response map introduced here is therefore intended as a discrete orientation-conditioned summary, not as a continuous morphing-parameter response surface. Future work should extend this framework to multiple specimens, broader orientation coverage, spinning conditions, denser Reynolds-number-resolved measurements, and quantitative characterization of upstream-facing surface topology to clarify how local surface arrangement modifies transition, separation, and the resulting aerodynamic force response.
Author Contributions
Conceptualization, S.H. and T.A.; methodology, S.H. and T.A.; software, S.H.; validation, S.H. and T.A.; formal analysis, T.A.; investigation, S.H.; resources, S.H. and T.A.; data curation, T.A.; writing—original draft preparation, S.H.; writing—review and editing, T.A.; funding acquisition, S.H. and T.A.; All authors have read and agreed to the published version of the manuscript.
Funding
This work was supported by a research grant from Seoul Women’s University (2026-0034).
Institutional Review Board Statement
Not applicable.
Informed Consent Statement
Not applicable.
Data Availability Statement
The original contributions presented in this study are included in the article.
Acknowledgments
The authors would like to thank the wind tunnel laboratory at the University of Tsukuba for technical support in the wind tunnel experiments.
Conflicts of Interest
The authors declare no conflicts of interest.
References
- Mehta, R.D. Aerodynamics of sports balls. Annu. Rev. Fluid Mech. 1985, 17, 151–189. [Google Scholar] [CrossRef]
- Asai, T.; Seo, K.; Kobayashi, O.; Sakashita, R. Fundamental aerodynamics of the soccer ball. Sports Eng. 2007, 10, 101–109. [Google Scholar] [CrossRef] [Scilit]
- Carré, M.; Asai, T. Biomechanics and Aerodynamics in Soccer. In Biomedical Engineering Principles in Sports; Hung, G.K., Pallis, J.M., Eds.; Springer: Boston, MA, USA, 2004; pp. 333–364. [Google Scholar] [CrossRef] [Scilit]
- Clanet, C. Sports ballistics. Annu. Rev. Fluid Mech. 2015, 47, 455–478. [Google Scholar] [CrossRef] [Scilit]
- Davies, J.M. The aerodynamics of golf balls. J. Appl. Phys. 1949, 20, 821–828. [Google Scholar] [CrossRef] [Scilit]
- Bearman, P.W.; Harvey, J.K. Golf ball aerodynamics. Aeronaut. Q. 1976, 27, 112–122. [Google Scholar] [CrossRef] [Scilit]
- Choi, J.; Jeon, W.P.; Choi, H. Mechanism of drag reduction by dimples on a sphere. Phys. Fluids 2006, 18, 041702. [Google Scholar] [CrossRef] [Scilit]
- Asai, T.; Seo, K. Aerodynamic drag of modern soccer balls. SpringerPlus 2013, 2, 171. [Google Scholar] [CrossRef] [Scilit]
- Hong, S.; Asai, T. Aerodynamic effects of dimples on soccer ball surfaces. Heliyon 2017, 3, e00432. [Google Scholar] [CrossRef] [Scilit]
- Hong, S.; Goff, J.E.; Asai, T. Effect of a soccer ball’s surface texture on its aerodynamics and trajectory. Proc. Inst. Mech. Eng. Part P J. Sports Eng. Technol. 2019, 233, 67–74. [Google Scholar] [CrossRef] [Scilit]
- Naito, K.; Hong, S.; Koido, M.; Nakayama, M.; Sakamoto, K.; Asai, T. Effect of seam characteristics on critical Reynolds number in footballs. Mech. Eng. J. 2018, 5, 17-00369. [Google Scholar] [CrossRef] [Scilit]
- Carré, M.J.; Goodwill, S.R.; Haake, S.J. Understanding the effect of seams on the aerodynamics of an association football. Proc. Inst. Mech. Eng. Part C J. Mech. Eng. Sci. 2005, 219, 657–666. [Google Scholar] [CrossRef] [Scilit]
- Goff, J.E.; Hong, S.; Asai, T. Effect of a soccer ball’s seam geometry on its aerodynamics and trajectory. Proc. Inst. Mech. Eng. Part P J. Sports Eng. Technol. 2020, 234, 19–29. [Google Scholar] [CrossRef] [Scilit]
- Barber, S.; Haake, S.J.; Carré, M.J. Using CFD to understand the effects of seam geometry on soccer ball aerodynamics. In The Engineering of Sport 6; Moritz, E.F., Haake, S.J., Eds.; Springer: New York, NY, USA, 2006; pp. 127–132. [Google Scholar] [CrossRef] [Scilit]
- Alam, F.; Chowdhury, H.; Stemmer, M.; Wang, Z.; Yang, J. Effects of surface structure on soccer ball aerodynamics. Procedia Eng. 2012, 34, 146–151. [Google Scholar] [CrossRef] [Scilit]
- Neilson, P.J.; Jones, R. An exact method for the sphericity measurement of soccer balls. Proc. Inst. Mech. Eng. Part B J. Eng. Manuf. 2003, 217, 715–719. [Google Scholar] [CrossRef] [Scilit]
- Hong, S.; Asai, T. Effect of panel shape of soccer ball on its flight characteristics. Sci. Rep. 2014, 4, 5068. [Google Scholar] [CrossRef] [Scilit]
- Hong, S.; Asai, T.; Seo, K. Visualization of air flow around soccer ball using particle image velocimetry. Sci. Rep. 2015, 5, 15108. [Google Scholar] [CrossRef] [Scilit]
- Ward, M.; Passmore, M.A.; Spencer, A.; Hanson, H.; Lucas, T. The effect of surface geometry on the aerodynamic behaviour of a football. Sports Eng. 2023, 26, 33. [Google Scholar] [CrossRef] [Scilit]
- Barber, S.; Chin, S.B.; Carré, M.J. Sports ball aerodynamics: A numerical study of the erratic motion of soccer balls. Comput. Fluids 2009, 38, 1091–1100. [Google Scholar] [CrossRef] [Scilit]
- Bray, K.; Kerwin, D.G. Modelling the flight of a soccer ball in a direct free kick. J. Sports Sci. 2003, 21, 75–85. [Google Scholar] [CrossRef] [Scilit] [PubMed]
- Griffiths, I.W.; Evans, C.J.; Griffiths, N. Tracking the flight of a spinning football in three dimensions. Meas. Sci. Technol. 2005, 16, 2056–2065. [Google Scholar] [CrossRef] [Scilit]
- Barber, S.; Carré, M.J. The effect of surface geometry on soccer ball trajectories. Sports Eng. 2010, 13, 47–55. [Google Scholar] [CrossRef] [Scilit]
- Goff, J.E.; Carré, M.J. Soccer ball lift coefficients via trajectory analysis. Eur. J. Phys. 2010, 31, 775–784. [Google Scholar] [CrossRef] [Scilit]
- Goff, J.E.; Hong, S.; Liu, R.; Asai, T. Trionda: Enhanced surface roughness relative to previous FIFA World Cup match balls. Appl. Sci. 2026, 16, 2808. [Google Scholar] [CrossRef] [Scilit]
- Goff, J.E.; Hong, S.; Asai, T. Aerodynamic comparisons between Al Rihla and recent World Cup soccer balls. Proc. Inst. Mech. Eng. Part P J. Sports Eng. Technol. 2025, 239, 403–411. [Google Scholar] [CrossRef] [Scilit]
- Mizota, T.; Kurogi, K.; Ohya, Y.; Okajima, A.; Naruo, T.; Kawamura, Y. The strange flight behaviour of slowly spinning soccer balls. Sci. Rep. 2013, 3, 1871. [Google Scholar] [CrossRef] [Scilit]
- Dupeux, G.; Cohen, C.; Le Goff, A.; Quéré, D.; Clanet, C. Football curves. J. Fluids Struct. 2011, 27, 659–667. [Google Scholar] [CrossRef] [Scilit]
- Asai, T.; Hong, S. Aerodynamics of the newly approved football for the English Premier League 2020–21 season. Sci. Rep. 2021, 11, 9578. [Google Scholar] [CrossRef] [Scilit]

Disclaimer/Publisher’s Note: The statements, opinions and data contained in all publications are solely those of the individual author(s) and contributor(s) and not of MDPI and/or the editor(s). MDPI and/or the editor(s) disclaim responsibility for any injury to people or property resulting from any ideas, methods, instructions or products referred to in the content. |
© 2026 by the authors. Licensee MDPI, Basel, Switzerland. This article is an open access article distributed under the terms and conditions of the Creative Commons Attribution (CC BY) license.