


Abstract
Two hydrogels made to the same recipe in two laboratories need not be the same material, and the descriptor sets in routine use do not explain why. We argue that machine learning for hydrogels is limited by representation, not architecture. Of the thirteen variables that set a gel’s stiffness, four reach the data table; and with composition fixed completely, 1728 measurement protocols remain, each returning a number published under one heading. Neither the inputs nor the targets are what their names suggest. We diagnose four compounding failure modes and propose a minimum reporting set and benchmark tasks defined by their splits.
1. Introduction
Two hydrogels can be prepared from the same table of ingredients, in the same proportions, by two competent groups, and not be the same material. No descriptor set currently published captures why. This is the main subject of this article, and it is a statement about representation rather than about modeling, which is a distinction the field has largely refused to make. Machine learning has arrived in biomaterials with the expected enthusiasm, and the surveys of the last few years read as a steady accumulation of successful applications across formulation, property prediction and design [1,2,3,4,5]. More recent overviews extend the same coverage to hydrogels specifically and to the regenerative applications that concern this series [6,7,8,9,10,11,12]. Read individually, each of these is encouraging. Read together, they raise a question that none of them asks: architectures have advanced enormously over the same period, and reported performance on hydrogel property prediction has not moved with them.
If a decade of architectural progress leaves the accuracy of hydrogel modulus prediction roughly where it was, then either the problem is irreducibly noisy or the models are not being given the information the property depends on. This article argues the second, and the argument is not rhetorical: the quantities that physically determine a hydrogel’s mechanics—crosslink density, network topology, strand length distribution, the state of hydration at which the measurement was taken—are precisely the quantities that are almost never recorded, while the quantities that are recorded, being polymer identity and concentration, underdetermine them. A model trained on the second set is being asked to invert a mapping that is not invertible. Figure 1 puts a count on it: of the thirteen variables that set the modulus of a cast gel, four reach the table.
Figure 1.
The formulation vector discards the variables that decide. Thirteen quantities set the modulus of a cast hydrogel. Four of them—polymer identity, polymer concentration, crosslink chemistry and cell density—are what a typical published table records; the remaining nine are not routinely reported. Two networks differing in any of those nine occupy the same row of the table and are, to any model trained on it, the same material. Which variables are routinely tabulated is the argument of Section 2; no measured quantity is asserted here.
The same failure occurs a second time, on the other side of the equation, and it is the less familiar half. Suppose the composition were fully specified, with all thirteen variables recorded. The target would still not be well defined, because the modulus is not a property of the gel alone but of the gel and the measurement together. Test mode, oscillation frequency, strain amplitude, geometry, gap, temperature, hydration state at test and the interval between cure and measurement are all free, all consequential, and all commonly omitted. Figure 2 enumerates them: fixing the composition completely still leaves 1728 distinct protocols in ordinary use, every one of which returns a number published under the same column heading. Neither the inputs nor the targets of the relevant literature works are the quantities their names suggest. Apart from the representation problem there is a data problem, and the two are usually discussed as though they were the same thing when they are not. A representation can be inadequate on a dataset of any size, and a dataset can be inadequate for a representation that is otherwise sound. This review treats them in sequence, because the remedies differ: better representation is a polymer-physics question, whereas better data are a question of reporting practice and of what the field is willing to publish. The structure follows this division. Section 2 enumerates what a hydrogel property depends on and marks, item by item, whether the field records it. Section 3 sets out the representation strategies as a ladder, from the formulation vector upward, and states for each rung what it is blind to; Table 1 collects details of the comparison. Section 4 describes how the available datasets were produced, which matters more than how large they are. Section 5 diagnoses four failure modes—truncated distributions, protocol heterogeneity, split leakage and domain shift—and shows that they compound rather than add. Section 6 delivers this article’s two artefacts: a minimum reporting set for AI-ready hydrogel data, and three benchmark tasks whose defining feature is not the model but the split. Section 7 matches model families to the data regimes actually available.
Figure 2.
One formulation, 1728 protocols. The mirror of Figure 1: there, the composition collapses into four columns; here, the measurement fans out beneath one. With the composition fixed completely, three test modes, three oscillation frequencies and three strain amplitudes are drawn explicitly, and six further binary choices—geometry, gap, temperature, hydration state, pre-shear and time after cure—are folded into the wedge. Their product is 1728 distinct protocols, each returning a number reported under the same heading. The count is arithmetic over the choices listed; it is not a survey result, and no modulus value is asserted.
Table 1.
Representation strategies for hydrogel systems: what each expresses, what it cannot, and the cost of obtaining it.
This article is not a survey of applications. The genre in which a group applies a random forest to its own dataset and reports a coefficient of determination is well populated already, and is not where the limitation lies. Everything below concerns what goes into the model, not what the model is.
2. What Must Be Represented
Before asking how a hydrogel should be encoded, one needs to write down what its properties actually depend on. The list is longer than the formulation table, and the gap between the two is the whole difficulty.
Composition comes first and is the only entry that is universally reported: which polymers, at what concentrations, with what fillers and what cargo. Polymer chemistry follows, and here the reporting thins immediately. Molar mass and its distribution move the mechanics of the resulting network substantially, yet are quoted perhaps as often as they are omitted. Degree of substitution belongs to the same category and is worse, since for methacrylated systems it is the single most consequential number after concentration and it follows from reaction stoichiometry, temperature and pH rather than from anything stated on the bottle [13].
Crosslinking is where the record breaks down entirely. Chemistry, density and topology are three separate things, and a formulation table gives none of them directly; what it gives is the reagents from which they were intended to result. Whether that intention was realized depends on the photo initiator, the irradiance and the exposure time, and the same nominal formulation crosslinked under two lamps is two materials [14]. Processing history carries the same weight and receives the same silence, meaning the mixing, the shear the material experienced on its way into the mold, the temperature at which it set and the time it was allowed.
Then there is the state in which the measurement was made. Swelling and hydration are not incidental to a hydrogel’s mechanics; they are its mechanics, and a modulus measured at equilibrium swelling and one measured as cast are different quantities that share a name. Test conditions belong here too: strain rate, confinement, specimen geometry, temperature. Where cells are present, their type, source, passage number and density enter the list, since an encapsulated population remodels the network it sits in within days. The environment closes it—pH, enzyme identity and activity, ionic strength—and is reported when it is the subject of the study and otherwise not at all.
The uncomfortable summary is that most published work records composition, something of the polymer chemistry, and the environment, and records nothing else. That is not a criticism of individual papers, which were written to answer questions that did not require the rest. It is an observation about what happens when such papers are aggregated into a dataset, which is that the aggregate is missing most of the variables that determine the target [15,16].
Gelatin methacryloyl is the worked example, and it is worth stating in full because it is the most used platform in the relevant literature. Two laboratories report ten percent GelMA. Behind this number sit a bloom strength that moves the mechanics independently of concentration [17], a degree of substitution set by a synthesis neither paper describes [13], and a crosslinked state determined by a light dose only one of them measured [14]. Their moduli differ by a factor of three. Both papers are correct. The dataset that contains both rows is not wrong either—it is simply underdetermined, and no model fitted to it can recover what was never written down.
3. Representation Strategies
3.1. Formulation Vectors
The formulation vector is the default representation and will remain so, because it costs nothing and reads directly off the methods section. Each component becomes a column, each concentration a value, and the process settings are appended where they were recorded. It is interpretable in the strong sense that a coefficient can be handed back to a formulator as an instruction.
Within one polymer family, sampled densely by one laboratory under one protocol, it works, and the demonstrations are real: composition-to-property models over gelatin systems, formulation optimization over a fixed chemistry, and model-assisted screening within a defined design space all perform well on their own terms [18,19,20,21].
It fails on transfer, and it fails for a structural reason rather than a statistical one. A column headed “alginate, 2% w/v” means something different in a dataset where alginate is the network and one where it is a sacrificial phase, and nothing in the vector distinguishes the two. Add a polymer and the vector gains a dimension that is zero for every previous row, so the model has no basis on which to analyze it. The representation carries no chemistry, so it cannot generalize along the axis chemistry varies.
Blind to: everything that is not a concentration—chemistry, topology, and the realized state of the network.
3.2. Repeat-Unit Chemistry: Fingerprints and Descriptors
Cheminformatics offers an obvious upgrade. Molecular fingerprints and descriptor sets encode the repeat unit as a structure rather than as a name, so two polymers that were unrelated columns become points at a measurable distance from one another, and a model gains a basis for extrapolating along chemistry [15,22,23].
What breaks is the object. A fingerprint describes a molecule, and a hydrogel is not one. It is a covalently or physically connected network whose properties are set at a length scale several orders above the repeat unit, so the descriptor is being computed on the wrong entity and the mismatch is not subtle: two networks built from an identical repeat unit at identical concentration differ in modulus by whatever their crosslink densities differ by, and the fingerprints are identical. The honest statement of the position is that repeat-unit descriptors buy chemical transfer and buy nothing about the network, which means they help exactly where the formulation vector fails and fail exactly where it does.
Blind to: crosslink density, topology, and every mesoscale feature.
3.3. Graph and Learned Representations
Graph representations are the state of the art for molecular property prediction and have been extended to polymers with encouraging results; where a repeat unit becomes a graph, message passing learns a representation rather than receiving one; and multitask training shares statistical strength across properties that are individually data-poor [24,25,26,27,28]. Transfer learning across property tasks has been shown to help in exactly the regime that characterizes this field, which is many targets each with few measurements [29,30,31,32].
It should be said plainly that essentially none of this has been applied to hydrogel networks. The polymer-graph literature works on linear polymers and their bulk properties; the hydrogel literature works on formulation vectors. The two have not met, and the reason is not neglect but representation: it is not obvious what the graph of a crosslinked, swollen, heterogeneous network should be. A repeat-unit graph discards the crosslinks, which are the point. A full network graph is not measurable.
Naming that gap is more useful than lamenting it, since it is well-posed research programmed rather than a vague aspiration: define a graph object that carries crosslink topology at a resolution that can actually be measured, and the polymer-graph machinery becomes available to this field immediately.
Blind to: mesoscale architecture and processing, and at present unavailable for any networks at all.
3.4. Network and Physical Descriptors
Network descriptors are the physically meaningful ones. Crosslink density, mesh size, swelling ratio and effective strand density stand between the formulation and the property in the causal sense, meaning that composition acts on modulus and on transport through them and not around them [33,34]. Where they are reported, the relationships that a formulation vector has to learn empirically become relationships that are already known analytically.
They are also the least often measured, and the inversion of importance and availability here is the most striking thing in the relevant literature. Mesh size is inferred rather than observed, through swelling interpreted by Flory–Rehner, through rubber elasticity read off rheology, or through pulsed-field-gradient nuclear magnetic resonance, and the three do not agree [35,36]. Crosslinking chemistry shifts what passes through a network independently of the spacing itself, so even a correct mesh size does not close the description [37]. Release behavior, which is governed by the same quantity, is likewise reported as an outcome rather than as a descriptor [38].
The practical claim of this subsection is small and, I think, correct: measuring three additional numbers per formulation—an equilibrium swelling ratio, a mesh estimate with its method stated, and water content at the moment of mechanical testing—would do more for predictive modeling in this field than any change of architecture that could be proposed. They are cheap. They are already within the competence of every laboratory publishing here.
This is also the natural point of contact with physics-informed and hybrid modeling, which the preceding argument makes more attractive rather than less. If crosslink density, mesh size and swelling ratio are the quantities that stand causally between formulation and property, then the relations that connect them are known and need not be learned from data at all. Rubber elasticity fixes the modulus of an ideal affine network from the elastically effective chain density; Flory–Rehner relates equilibrium swelling to crosslink density and polymer–solvent interaction; obstruction-scaling and hydrodynamic models relate solute diffusivity to mesh size and hydrodynamic radius [33,34,35,36]. Each is an equation with a small number of parameters, and each is routinely ignored in favor of fitting a black box to a formulation vector.
Three ways of using them are available and differ in how much they assume. The weakest is to use a physical relation as a feature: compute a predicted modulus from a network model and give it to the learner alongside the composition, so the model begins from the physics and learns the residual. The second is to constrain the hypothesis space, penalizing predictions that violate a known monotonicity—modulus rising with crosslink density, diffusivity falling as mesh narrows—which is where physics-informed neural networks and their constrained-regression analogues belong. The strongest is to fit the parameters of a constitutive model directly, so that what is learned is a small number of physically interpretable constants rather than an arbitrary function. In a regime of fewer than two hundred formulations the third is often the right choice and the one least often taken, and all three share the property that they degrade gracefully outside the training range, which purely empirical fits do not.
Blind to: spatial heterogeneity, since these are all bulk averages over a material that is frequently not homogeneous.
A comment on scope is warranted, since the properties discussed above are weighted toward stiffness, printability and degradation. This weighting reflects the literature rather than the biology: these three are cheap to measure and therefore modeled most. The argument of this article is indifferent to which property is on the left-hand side, and applies unchanged to fracture toughness and fatigue, where the relevant state variable is the network’s capacity to dissipate energy rather than its modulus; to viscoelasticity, where the target is a relaxation spectrum rather than a scalar; to wet adhesion, where the interface rather than the bulk network sets the outcome; to transport and permeability, which Section 3.4 treats directly; to electrical and ionic conductivity in conductive networks; and to long-term cell–material interaction, where the target is a trajectory over weeks rather than a value. Each of these is under-represented in the modeling literature and each is subject to the same representation failure, and in several the failure is worse: a relaxation spectrum or a fatigue curve reduced to a single reported number loses more information than a modulus does.
3.5. Image- and Signal-Derived Representations
Images sidestep the descriptor problem by declining to hand-craft anything. Micro-computed tomography carries pore architecture and its interconnection, microscopy carries heterogeneity and interface structure, and a rheological sweep is itself a high-dimensional signature of network dynamics. Segmentation and analysis of exactly these modalities are now routine, and the tooling developed for musculoskeletal and preclinical imaging transfers directly [39,40,41,42,43]. Deep methods for reconstruction and resolution enhancement extend what can be extracted from a given scan [44,45,46].
The most interesting variant inverts the usual direction. Rather than describing the material and predicting the cell response, one can read the morphology of the encapsulated cells and treat it as a measurement of the microenvironment as the cells themselves experience it, which is after all the quantity that matters [47,48]. This is an elegant move and it has an obvious limitation: it describes the effective environment without identifying the material that produced it, so it predicts well and designs nothing.
Blind to: chemistry. An image of a network does not say what it is made of.
3.6. Multimodal Fusion
The realistic near-term direction is not a better single descriptor but the combination of several channels, since the blind spots enumerated above are largely complementary: formulation carries composition, rheology carries network dynamics, imaging carries architecture, and cell or omics readouts carry the biological state [4,49]. A representation assembled from all four is not obviously worse than any hypothetical unified descriptor and is available now.
The obstacle is practical and it is worth stating before anyone attempts this, considering how much time it costs to discover late. The modalities are measured on different subsets of samples. Rheology is run on every formulation, micro-computed tomography on a handful, omics on fewer still, and the resulting data matrix is mostly empty. Multimodal fusion in this field is therefore a missing-data problem before it is a modeling problem, and a fusion architecture that assumes complete observations will simply discard the majority of the dataset in order to find rows it can use.
Blind to: nothing in principle, and to most of the dataset in practice.
4. Datasets: What Exists and What Is Missing
4.1. Sources, Scale, and Provenance
It is worth being precise about what the datasets behind published hydrogel machine learning are, because their shape matters a great deal more than their size. They are assembled within a single group, from a single polymer chemistry, measured on one instrument under one protocol, and evaluated by random splitting of these same rows. Each of them is a statement about provenance rather than about scale, and none of them is repaired by collecting more rows: a dataset ten times larger, produced the same way, is ten times more of the same measurement. This is why we do not open this section with a count. The quantity of data is the field’s usual diagnosis, and it is the one part of the problem that time alone will fix.
Comparison with the domains where materials informatics has genuinely succeeded is instructive rather than merely deflating. These fields moved when shared, curated, multi-source datasets became available, and the methodological literature explicitly indicates that the resource preceded the results [50,51]. Nothing of the kind exists for hydrogels. There is no repository, no agreed schema, and no mechanism by which one laboratory’s formulations become another’s training data, which means that every group begins from its own two hundred rows and the field’s effective sample size is not the sum of these but the largest of them.
Provenance deserves a separate remark. Where datasets are assembled from the literature they inherit the reporting gaps of Section 2 wholesale, and where they are generated in one laboratory, they are complete but narrow. Neither route currently produces what is wanted, which is a broad dataset with the network state recorded.
A systematic comparison of the resources available is instructive, and short. PoLyInfo, the polymer property database maintained by NIMS, holds on the order of hundreds of thousands of property records across synthetic polymer classes, is accessible on registration, and records the measurement condition for many entries; it contains almost nothing on hydrogel networks in the swollen state [52]. The Materials Project offers comparable scale, full programmatic access and rich metadata, but for inorganic crystals, its relevance here is methodological rather than direct [50]. Among hydrogel-specific resources, the dataset released by Liao and co-workers is the most complete of its kind—341 formulations, one polymer family, one measured property, complete composition vectors, deposited openly with the paper [53]. This is the state of the art in accessibility, and it is a single-laboratory, single-property set.
The comparison is therefore asymmetric in a way that is itself the finding. For synthetic polymers and inorganic materials one can tabulate size, coverage, accessibility and metadata completeness because curated resources exist to be tabulated. For hydrogels one cannot, because with the exception of a handful of deposited supplementary files, there is no resource to compare: the datasets are inside papers, in units chosen ad hoc, without the network state and usually without the measurement conditions. We resist supplying a table of estimated sizes for the hydrogel literature, because the numbers would be estimates of a corpus whose reporting is exactly what this article argues is unreliable, and a spuriously precise table would reproduce the error it describes.
What is missing is not merely a database but the conventions that make one possible, and these already exist in mature form. The FAIR principles—findable, accessible, interoperable, reusable—set out what a deposited dataset must satisfy to be usable by anyone who did not generate it, and they are directly applicable here [54]. A hydrogel dataset that satisfies FAIR would carry persistent identifiers, a declared schema, controlled units, and license terms; almost none currently does. The minimum reporting set of Section 6 should be read as a hydrogel-specific instantiation of those principles rather than as an alternative to them.
4.2. Literature Mining and LLM-Assisted Extraction
The published corpus is the largest hydrogel dataset in existence and it is written in prose. Extraction from it has become tractable, because large language models handle the parsing that defeated rule-based systems for two decades, and the materials science community has moved quickly on this [55,56,57,58]. Domain-adapted language models and the benchmarks built to evaluate them supply the infrastructure [59,60,61], and text-mined datasets in adjacent materials domains have already demonstrated the scale that is reachable [62,63].
Three failure modes need naming before anyone builds on this. Units are the shallowest and the most common, since a modulus quoted in kilopascals and one in megapascals differ by a factor a parser will happily ignore. Implicit conditions are worse: a paper that does not state its strain rate has not omitted a field, it has omitted a variable, and an extraction pipeline records the omission as a missing value rather than as the confound it is.
The third is the one that cannot be engineered around. The corpus is biased toward what was worth publishing, so a dataset mined from it inherits that bias exactly, and the more efficient the extraction, the more faithfully the bias is reproduced. A perfect extractor applied to censored research yields a censored dataset at scale, which is the subject of Section 5.1 and is not solved by better parsing.
A fourth consideration is reflexive, and this article is not exempt from it. Text mined from the literature enters model training corpora, and the outputs of these models re-enter the literature, so a figure asserted once can be recirculated until it acquires the standing of a measurement. The count of 1728 protocols given in Section 2 is a case in point: it is arithmetic over an enumerated list of settings in common use, it is stated as such here, and it is not a survey result. Read carelessly, or summarized by a model, it can become “the literature reports 1728 protocols”, which would be false. We therefore state the provenance of every quantitative claim at the point of use, and we recommend that reviews in this area adopt a line-level citation standard in which each number carries, in the sentence that contains it, whether it was measured, enumerated or estimated, and from what. The alternative is research in which derived quantities are indistinguishable from observed ones, which is the machine-readable version of the problem this article is about.
4.3. High-Throughput and Combinatorial Generation
The alternative to mining is generation. Combinatorial libraries and automated formulation can produce hundreds of compositions under one protocol with the process variables recorded by construction, which repairs at a stroke most of what Section 2 complained about [16,64]. Microgel fabrication in particular has reached throughputs that make libraries of the necessary size practical [65].
Making the formulations was never the constraint. Characterizing them is. A library of five hundred compositions can be produced in a week and cannot be put through unconfined compression, swelling equilibration, a four-week degradation series and a twenty-one-day osteogenic culture in anything under a year, so the throughput of the assay rather than the throughput of the synthesis sets the size of the dataset. This is the characterization bottleneck taken up properly in the third article of the series, and it is the reason that high-throughput generation has to date produced large formulation libraries with sparse property annotation rather than the dense datasets the modeling requires.
5. Data Quality, Leakage, and Domain Shift
A dataset is not a neutral record of a material system. It is the residue of the decisions that produced it, meaning which formulations were made, which were judged worth reporting, under what protocol they were measured, and how the resulting table was partitioned for evaluation. Each of these decisions leaves a signature in the data, and the four discussed below are the ones that matter most for this field.
They are treated separately for clarity and they do not occur separately. The closing subsection shows that they compound, which is the reason a reported coefficient of determination in the relevant literature should be read as an upper bound conditional on the evaluation protocol rather than as a property of the model.
5.1. Truncated Distributions and the Missing Negatives
Supervised learning assumes that the training data are drawn from the distribution on which the model will be used. Hydrogel datasets violate that assumption before a single row is written. The formulations that reach a table are the ones that gelled, held together long enough to be tested, and produced a number worth putting in a figure.
The formulations that did not gel, that fractured in the grips, that were cytotoxic, or that a student abandoned after two attempts do not appear anywhere. They are not recorded as failures; they are simply absent, and the distinction matters because an absent row cannot be down-weighted or modeled, whereas a recorded failure can. A model fitted to what remains learns the structure of the successful region and has no information whatsoever about the boundary of that region, which is precisely the information a formulator wants [15,16].
The consequence shows up as a specific and predictable pathology. Ask such a model to extrapolate slightly outside the sampled composition range and it will return a confident interpolation, because nothing in its training data indicated that a boundary was nearby. Optimization routines driven by that model walk cheerfully into regions where the material does not exist, and the campaign discovers this experimentally rather than computationally, which is the expensive order in which to discover it.
Sample size compounds it, though not in the way the field usually assumes. The difficulty is not that a few hundred formulations is a small number; it is that a few hundred formulations drawn from one design of experiments populate a region whose boundary was chosen before the data existed. A model fitted inside that region has neither the observations needed to locate the boundary nor the observations needed to show that it has failed to. Additional rows from the same design supply neither. Reviews of the area have begun to say as much, and the limitations are now acknowledged in print more often than they are addressed [66,67,68].
The remedy is unglamorous and entirely within the field’s control, which is that failed formulations should be reported with the successful ones. They are not negative results. They are the coordinates of the boundary, and a dataset that contains them is worth several times one that does not.
5.2. Protocol Heterogeneity: When the Measurement Varies More than the Material
The second failure mode arises before any model is fitted, and it is the one that most directly wastes the data that do exist. Consider gelatin methacryloyl at ten percent, which is the most reported single condition in the relevant literature. Across published studies the reported compressive modulus for this nominal formulation spans roughly an order of magnitude.
Very little of this spread is the material. Bloom strength of the source gelatin moves the mechanics independently of concentration [17]; degree of substitution follows from a synthesis that is frequently not described [13]; the crosslinked state actually reached depends on photoinitiator, irradiance and exposure rather than on the formulation [14]. On top of these sit the measurement conditions themselves, meaning strain rate, hydration state, specimen geometry, whether the test was confined, and the strain window over which the tangent was taken.
Aggregate such studies into a dataset and the column headed “modulus” contains a quantity whose variance is dominated by protocol rather than by composition. Figure 2 counts the freedom involved. Fix the composition completely—polymer, concentration, degree of substitution, light dose, cure time—and the measurement is still undetermined, because the test mode, the oscillation frequency, the strain amplitude, the geometry, the gap, the temperature, the hydration state, the shear history and the interval between cure and measurement all remain free. Enumerating only the settings in ordinary use gives 1728 distinct protocols, and every one of them returns a number that appears in the literature under the same column heading. A model fitted to this column is fitting a mixture over laboratory practice in which composition is one covariate among several, and no amount of additional data separates the two so long as the protocol goes unrecorded. This is what Table 2 is for.
Table 2.
The essential experimental parameters and metadata required to construct comprehensive, AI-ready hydrogel datasets. By explicitly recording variables across polymer identity, formulation, crosslinking, processing, and network state, this minimum reporting set ensures that machine learning models capture the true physical and chemical state of the material rather than fitting to undocumented protocol variations. Furthermore, mandatory fields for mechanical and biological test conditions, alongside strict provenance tracking, are introduced to mitigate protocol heterogeneity and enable robust, cross-laboratory validation.
One needs to be careful about what this does and does not imply. It does not imply that the individual studies are wrong; each is internally consistent and each answered the question it was asked. It implies that the aggregation is invalid without the conditions attached, and that the conditions are therefore not metadata but data. This is the argument the minimum reporting set of Table 2 is built on, and it is why the table lists a measurement condition beside almost every field.
5.3. Leakage: Why Random Splits Flatter Hydrogel Models
Hydrogel datasets are typically constructed by varying one or two parameters around a small number of base formulations, so a table of two hundred rows is frequently twenty compositions at ten conditions, or forty compositions measured in replicate. The rows are not independent, and the standard practice of random splitting therefore places near-duplicates of a training point into the test set.
What the model then demonstrates is that it can recognize a formulation it has already seen at a slightly different concentration. This is a real capability and it is not the one being claimed. The reported figure is an interpolation score presented as a generalization score, and the gap between the two is exactly the quantity a reader needs and is never given [53,69,70].
Grouped splitting is the remedy and it is not difficult. Partition by base formulation so that no composition appears on both sides; better, partition by polymer family so that the test set contains chemistries the model has not seen; better still, partition by laboratory, which additionally tests robustness to the protocol variation of the preceding subsection. Each is stricter than the last and each answers a different question, and a paper should state which question it answered.
Figure 3 shows the size of the effect on one published dataset with the model held fixed. The data are the 341 super-adhesive hydrogels of H. Liao et al. [71], whose formulations were released with the paper and whose four acquisition rounds permit grouped splits. Under random k-fold the coefficient of determination is 0.76. Holding out an entire acquisition round it falls to 0.46, and holding out a whole monomer family it falls to 0.38. Neither number is wrong. The first describes interpolation within a sampled design and the others describe transfer, and reporting only the first while claiming the second is the most common methodological error in the relevant literature. These measurements were all made in one laboratory, so the collapse cannot be attributed to inter-laboratory protocol variation. It is produced by the choice of split alone.
Figure 3.
Random splits overstate performance. One published dataset and one model, with only the split protocol changed. The data are the 341 super-adhesive hydrogels of H. Liao et al. [71]; the target is adhesion strength on glass and the features are the six monomer fractions. The splits are random k-fold, leave-one-acquisition-round-out, and grouped by dominant monomer, ordered by the strictness of the transfer each demands. Bars give pooled out-of-fold R2 with the individual folds beneath. Every measurement was made in one laboratory, so the fall from 0.76 to 0.38 is produced by the split protocol alone.
It follows that the improvement in reported metrics over the past five years cannot be attributed to modeling advances without controlling for how these metrics were obtained, since split protocol has not been held constant and its effect is larger than the differences between the architectures being compared.
5.4. Domain Shift: The Right Model in the Wrong Population
The fourth failure mode appears only at deployment, which is why it is the least discussed and the most damaging. A model trained on one population and applied to another can be entirely correct on its own data and useless on the new data, and nothing in the training metrics gives warning.
The shifts that matter here are specific and enumerable. Scale is the first: a model fitted to two-dimensional substrate data does not transfer to three-dimensional encapsulation, because the mechanical cue a cell receives differs in kind and not merely in magnitude. Species is the second, and rodent-derived relationships carry to human cells with a reliability that is rarely characterized. Time is a third and quieter one, since reagent sources, supplier formulations and even the definition of a standard assay drift over the decade a literature-mined dataset span.
Cell source belongs on the list as well. Models built on immortalized lines and models built on primary stromal cells are fitted to different biology, and the osteogenic literature moves between the two more freely than the statistics permit [49,72,73]. Printing work carries an equivalent problem across machines, where a printability model learned on one extrusion system encodes the system’s nozzle geometry and pressure response as though they were properties of the ink [74,75].
What makes shift more dangerous than noise is that it is silent. Training error, validation error and cross-validated error are all computed within the source population and are all unaffected, so a model can pass every internal check and fail entirely on arrival. The only detection is an external test set drawn from the target population, which is precisely what almost no study in this field reports [76,77].
5.5. How the Four Failures Compound
These four are not independent and they do not simply add. Truncation narrows the range over which anything can be learned. Protocol heterogeneity inflates the noise within the narrowed range. Leakage then conceals both: a random split evaluates the model inside the same narrow, noisy region it was trained on and returns a figure that looks healthy. Domain shift finishes the sequence by ensuring that the one number which was measured honestly does not describe the setting in which the model will be used.
The compounding is what makes the aggregate picture worse than any single diagnosis suggests. A study can be individually reasonable at every step—sensible formulations, careful measurements, a standard cross-validation, an appropriate model—and still produce a reported performance that carries almost no information about behavior on a new formulation in a new laboratory. No change of architecture is likely to repair this, since none of the four failures is a property of the model.
The three that follow from reporting practice can be repaired by reporting practice, which is the subject of the next section, and repairing them would do more for this field at present than any change of architecture. The fourth, domain shift, requires external test sets and therefore requires the field to agree on what an external test set is—which is one of the reasons the benchmark proposal of Section 6 matters more than it appears to.
6. Toward Standards: Reporting and Benchmarks
The preceding sections are a diagnosis, and a diagnosis without a remedy is of limited use. Two artefacts follow, and neither requires a method that does not already exist.
(a) A minimum reporting set. Table 2 lists the fields an AI-ready hydrogel study should record, organized by block: polymer identity down to lot and degree of substitution with its assay; the full formulation with units, solvent, pH and ionic strength; the crosslinking chemistry with initiator, dose and time; the processing history; the network state at the moment of test; the mechanical protocol with its conditions and its n; the degradation medium with enzyme identity and activity; the biology with cell source, passage and timepoint; and the provenance, meaning laboratory, operator, date and a digital object identifier for the raw data.
Three features of this table are deliberate. Every mechanical and biological entry carries its measurement condition, considering the argument in Section 5.2 that conditions are data rather than metadata. Provenance is a block rather than a footnote, because leave-one-laboratory-out evaluation is impossible without it. And raw-data deposition is listed as a field, since a summary statistic cannot be re-analyzed under a different protocol and a raw curve can none of this is burdensome. Every item is already known to the group that ran the experiment at the moment they ran it, and the cost is one of recording rather than of measurement.
(b) Three benchmark tasks. A reporting standard describes data that do not yet exist; a benchmark can be run on data that do. Figure 4 specifies three. The first is modulus regression under a grouped-by-polymer-family split, which tests chemical transfer rather than interpolation. The second is printability classification across two printers, with training on one machine and testing on the other, which makes the process-dependence of Section 5.4 measurable rather than arguable. The third is degradation half-life regression under leave-one-laboratory-out splitting, which is the strictest of the three and the closest to the question a formulator actually asks.
Figure 4.
The split protocol is the benchmark. The same pool of forty hydrogels drawn from five polymer families, cut two ways. Under random splitting every held-out gel has a near-twin in training, and the reported score measures interpolation among families the model has already seen. Under grouped splitting a whole family is withheld, and the same score measures transfer. The three proposed tasks are this one cut applied to polymer family, to printer and to laboratory. The panels depict two sampling procedures; no score is asserted for either.
The three differ only in what is held out. This is the point: the grouping variable is the specification, and a task is fully defined once its inputs, its grouping variable, its metric and a baseline to beat are named, so that a group can adopt one directly and report a number comparable with another group’s.
Finally, a reporting standard expressed only as a table will be implemented inconsistently, and the remedy is to publish it in a form a machine can check. We therefore specify the minimum reporting set as a versioned JSON Schema, in which each field of Table 2 becomes a typed property with an explicit unit, a required-or-recommended flag, and where appropriate an enumerated value list—crosslinking mechanism drawn from a closed vocabulary rather than free text, test geometry likewise, units declared in a controlled vocabulary rather than implied by the number. A dataset can then be validated automatically before deposition, and a repository can reject an incomplete record rather than discovering the gap when someone tries to model it. An example instance, populated for a single GelMA formulation, is provided in Data Availability Statement section, so that the standard can be adopted by copying a file rather than by re-reading this section.
The remaining obstacle to publishing negative data is not technical and will not yield to an appeal to virtue. Authors do not withhold failed formulations because they misunderstand their value; they withhold them because a paper reporting what did not work invites a judgement about competence, and this fear is not irrational. Exhortation has been tried for two decades and has not worked. What would work is a structural change on the journal side: a defined article section—a Design Space Boundaries section—in which formulations that failed to gel, failed to print, or failed a viability threshold are reported as findings, with the same expectation of completeness applied to them as to a successful result. Framed as the boundary of an explored region rather than as a record of failure, the same data become something an author has an incentive to publish. This is a change journals can make unilaterally and cheaply, and we make it as a recommendation to editors rather than to authors.
It follows that curation cannot be fully automated, and the field should stop implying that it can. Between data collection and model training there should sit a formal inspection step in which a person with domain expertise reviews the assembled table and flags entries that are physically implausible, internally inconsistent, or inconsistent with the stated protocol—a modulus quoted with a mesh size that could not produce it, a degradation half-life incompatible with the chemistry, a viability figure at a light dose that would not permit it. Such a reviewer catches what no schema validator can, because the errors are not violations of format. We suggest that this step be named in the methods of any dataset paper, together with who performed it, in the same way that a reporting standard names who performed the measurements.
Raw-data deposition warrants a stronger statement than a table row. Publication bias, discussed in Section 5.1, is the visible half of the problem; the quieter half is selective processing within a study—an outlier removed on inspection, a replicate that failed and was not repeated, a curve fitted over a window chosen after seeing the data. None of this is usually misconduct, and none of it is detectable by any algorithm applied to the summary values, because by the time a number reaches a table the decision has already been made and is invisible. The only remedy is that raw and validated data be deposited alongside the processed summaries, with the exclusion criteria stated in advance where possible and stated explicitly where not. We accordingly treat raw-data deposition as a required field of the minimum reporting set rather than an encouraged one.
The second objection concerns knowledge that never reaches a numeric field at all. Experienced formulators read a preparation through observations that no column captures—the color shift as a reaction proceeds, the change in texture at the point of gelation, the warmth of the vessel, whether the material strings or breaks when a spatula is lifted. This knowledge is real, it is used, and it is lost at the moment of tabulation. We therefore add a Qualitative Descriptors block to Table 2: a small number of free-text fields in which the person who made the material records what they observed, in prose, without being forced into a scale. Such fields are not directly usable by a regression model, and this is not their purpose. They are usable by the next person, they can be read by a language model when the corpus is large enough, and they preserve information that would otherwise exist only in a laboratory notebook.
Two objections to this table deserve direct answers, because both are reasonable and neither is fatal. The first is industrial. Full disclosure of process history—shear rates, transient mixing temperatures, reagent lots and supplier identities—is not something a commercial group can always carry out, and a reporting standard that demands it will be ignored by exactly the laboratories with the largest datasets. The resolution is that the process variables are not the target; they are a proxy for the network state they produce. A formulation characterized by its crosslink density, mesh estimate, equilibrium swelling ratio and water content at test discloses what a model needs while disclosing nothing about how the material was made. We therefore designate the network-state block of Table 2 as the mandatory core and the process-history block as recommended, so that a proprietary formulation can be reported completely at the level that matters physically and withheld at the level that matters commercially.
Grouped splits and external test sets are non-negotiable in all three, for the reasons set out in Section 5.3 and Section 5.4: a benchmark that permits random splitting measures the same thing the current literature measures, and would therefore change nothing.
That benchmarks rather than architectures move a field is not a speculative claim. Molecular property prediction was reorganized by the arrival of shared tasks with fixed splits [22,23], and materials discovery progressed when curated resources made comparison possible [50].
7. Matching Model Families to Data Regimes
This section is short and corrective. Given the data regimes actually available—fewer than two hundred formulations, grouped splits, and features numbering in the tens—tree ensembles, regularized regression and Gaussian processes are the honest default, and a deep architecture is usually unjustified.
The evidence supports the plain statement. Designed experiments and regression baselines perform well on hydrogel formulation problems and remain interpretable enough to be acted on [18,19,20,78,79,80], and where interpretation has been made explicit the models have returned formulation guidance rather than only predictions [81,82].
Neural methods earn their place in two situations and it is worth being precise about which. The first is as a surrogate for an expensive simulation, where training data can be generated in quantity and the mapping is deterministic [83,84,85]. The second is where the input is genuinely high-dimensional, such as an image or a full rheological trace, and hand-crafted features would discard most of it [86,87,88]. Neither condition describes a two-hundred-row formulation table.
Interpretability deserves a remark that is more than decorative. In a small-data regime it is not a nicety appended for the reviewers; it is the principal defense against fitting the protocol rather than the material. A model whose important features turn out to be laboratory identity or measurement year has told you something valuable about your dataset that a performance metric would have concealed [89,90,91,92,93,94,95].
Predictive Uncertainty and Knowing When the Model Is out of Its Depth
One consequence of the data regimes described above deserves separate treatment, because it is where small heterogeneous datasets differ most sharply from the settings in which these methods were developed. A model fitted to fewer than two hundred formulations drawn from a narrow region will be asked, in use, about formulations outside this region, and a point prediction gives the user no way to tell the two situations apart. Predictive uncertainty is therefore not an optional refinement here; it is the difference between a model that can be acted on and one that cannot.
Three requirements follow. The first is calibration: an interval quoted at ninety percent should contain the truth about ninety percent of the time, and this is testable on held-out data rather than a matter of assertion. Gaussian processes supply a posterior variance directly, tree ensembles admit quantile or jackknife intervals, and conformal prediction offers distribution-free intervals with finite-sample coverage guarantees that are attractive precisely because the sample is small. The second is out-of-distribution detection, which is a different question from uncertainty and is frequently confused with it: a model can be confidently wrong about a formulation whose chemistry it has never seen, and the practical safeguard is a distance-to-training-set measure reported alongside the prediction, so that extrapolation is visible as extrapolation. The third is that uncertainty being propagated into whatever decision follows. Where a model is used to rank candidates for synthesis, the ranking should reflect the intervals and not only the means, which is the point at which uncertainty quantification and experimental design become the same subject.
Crucially, the failure modes of Section 5 corrupt uncertainty estimates as thoroughly as they corrupt point predictions. An interval calibrated under a random split inherits the optimism of the split, so a model can be well calibrated in theory and badly calibrated in use. Calibration must therefore be assessed under the same grouped split used to assess accuracy, and reported with it.
8. Challenges and Outlook
Three claims close this article, and they are stated as claims because each is actionable rather than aspirational. The first is that a shared benchmark would advance this field further than any architecture. The reasoning is set out in Section 6 and the precedent is available in two adjacent domains, but the practical point is simply that no group can currently demonstrate that its model is better than another’s, since no two groups evaluate on comparable splits. Until this changes, methodological progress is unmeasurable and therefore, in an important sense, is not occurring.
The second is that network-level descriptors are the open scientific problem here, and that solving them is a contribution to polymer physics rather than to machine learning. What is wanted is a description of a crosslinked, swollen, heterogeneous network that is both predictive of the properties and measurable in a laboratory that is not equipped for scattering. That object does not exist. Whoever defines it will have achieved more for AI-guided hydrogel design than a decade of model development, and they will not have trained a model to do it [33,35].
The third concerns what the field is willing to publish. The distribution problem of Section 5.1 is not repairable by any analytical technique, because the missing rows are absent from the literature and not merely from a particular table. It is repairable by a change in norms, in which failed and rejected formulations are reported alongside successful ones and are understood as the boundary of the design space rather than as the absence of a result. This is a decision for editors and authors, and it is the cheapest of the three to implement and the least likely to happen without being asked for explicitly.
9. Conclusions
Machine learning for hydrogels is limited by what goes into the model rather than by the model. A hydrogel has no canonical machine-readable form, and the ladder of available representations—formulation vector, repeat-unit fingerprint, polymer graph, network descriptors, image and signal features, multimodal fusion—is a sequence of partial views, each blind to something the properties depend on, with the physically meaningful rung being the one least often measured. The datasets are small, single-source and censored toward success; the measurement conditions that dominate the variance are treated as metadata when they are data; random splitting conceals the resulting weakness; and domain shift ensures that the concealment is not discovered until deployment. These four failures compound rather than add, which is why a reported coefficient of determination in the relevant literature describes an evaluation protocol at least as much as it describes a model. The remedies are not architectural. Record the conditions, record the network state, report the formulations that failed, split by group and test externally, and adopt a shared benchmark so that the next five years of methodological work can be measured against something. The companion articles take the design problem from here; none of it will be worth much until the representation is fixed.
Author Contributions
U.K.Ö.: Conceptualization, Investigation, Methodology, Writing—Original Draft. H.İ.Y.: Conceptualization, Methodology, Supervision, Writing—Review and Editing. All authors have read and agreed to the published version of the manuscript.
Funding
This research received no external funding.
Institutional Review Board Statement
Not applicable. This manuscript is a review article analyzing the existing literature, material platforms, and theoretical physical limits. No new animal or human subject experiments were conducted by the authors for this specific work.
Informed Consent Statement
Not applicable.
Data Availability Statement
The repository containing the data can be found here: https://github.com/uzobas22/GelMA (accessed on 8 September 2026).
Conflicts of Interest
The authors declare no conflicts of interest.
References
- McDonald, S.M.; Augustine, E.K.; Lanners, Q.; Rudin, C.; Brinson, L.C.; Becker, M.L. Applied machine learning as a driver for polymeric biomaterials design. Nat. Commun. 2023, 14, 4838. [Google Scholar] [CrossRef] [Scilit]
- Suwardi, A.; Wang, F.; Xue, K.; Han, M.Y.; Teo, P.; Wang, P.; Wang, S.; Liu, Y.; Ye, E.; Li, Z.; et al. Machine Learning-Driven Biomaterials Evolution. Adv. Mater. 2022, 34, 2102703. [Google Scholar] [CrossRef] [Scilit]
- Guo, J.L.; Januszyk, M.; Longaker, M.T. Machine Learning in Tissue Engineering. Tissue Eng. Part A Res. Adv. 2023, 29, 2–19. [Google Scholar] [CrossRef] [Scilit]
- Rickert, C.A.; Lieleg, O. Machine learning approaches for biomolecular, biophysical, and biomaterials research. Biophys. Rev. 2022, 3, 021306. [Google Scholar] [CrossRef] [Scilit]
- Meyer, T.A.; Ramirez, C.; Tamasi, M.J.; Gormley, A.J. A User’s Guide to Machine Learning for Polymeric Biomaterials. ACS Polym. Au 2023, 3, 141–157. [Google Scholar] [CrossRef] [Scilit]
- Hetherington, K.; Premjit, Y.; Rohra, N.; Lawrence, M.; Ganguly, P. Hydrogels and artificial intelligence (AI) in tissue engineering and regenerative medicine (TERM): An update on ‘skin and bones’. Front. Biomater. Sci. 2026, 5, 1886858. [Google Scholar] [CrossRef] [Scilit]
- Aboti, I.; Dhoble, N.; Padole, N.; Dhapake, P.; Baheti, J. Artificial intelligence & machine learning in hydrogel: Revolutionizing design and optimization—Detailed review. Next Res. 2026, 5, 101335. [Google Scholar] [CrossRef] [Scilit]
- Gharibshahian, M.; Torkashvand, M.; Bavisi, M.; Aldaghi, N.; Alizadeh, A. Recent advances in artificial intelligent strategies for tissue engineering and regenerative medicine. Skin. Res. Technol. 2024, 30, e70016. [Google Scholar] [CrossRef] [Scilit]
- Nosrati, H.; Nosrati, M. Artificial Intelligence in Regenerative Medicine: Applications and Implications. Biomimetics 2023, 8, 442. [Google Scholar] [CrossRef] [Scilit]
- Finster, R.; Sankaran, P.; Bihar, E. Computational and AI-Driven Design of Hydrogels for Bioelectronic Applications. Adv. Electron. Mater. 2025, 11, 2400763. [Google Scholar] [CrossRef] [Scilit]
- Hosseini, F.S.; Whitfield, T.; Mitchell, J.; Li, Y.; Lo, K.W.-H. Leveraging artificial intelligence in tissue regenerative engineering via small-molecule libraries. Drug Discov. Today 2026, 31, 104623. [Google Scholar] [CrossRef] [Scilit]
- Wei, D.; Wang, Z.; Lin, H.; Yin, X.P.; Wang, Y. Research Progress in Artificial Intelligence-Assisted Preparation of High-Quality Biomaterials. ACS Omega 2026, 11, 10971–11000. [Google Scholar] [CrossRef] [Scilit]
- Shirahama, H.; Lee, B.H.; Tan, L.P.; Cho, N.-J. Precise Tuning of Facile One-Pot Gelatin Methacryloyl (GelMA) Synthesis. Sci. Rep. 2016, 6, 31036. [Google Scholar] [CrossRef] [Scilit]
- Sharifi, S.; Sharifi, H.; Akbari, A.; Chodosh, J. Systematic optimization of visible light-induced crosslinking conditions of gelatin methacryloyl (GelMA). Sci. Rep. 2021, 11, 23276. [Google Scholar] [CrossRef] [Scilit]
- Stuart, S.; Watchorn, J.; Gu, F.X. Sizing up feature descriptors for macromolecular machine learning with polymeric biomaterials. npj Comput. Mater. 2023, 9, 102. [Google Scholar] [CrossRef] [Scilit]
- Patel, R.A.; Webb, M.A. Data-Driven Design of Polymer-Based Biomaterials: High-throughput Simulation, Experimentation, and Machine Learning. ACS Appl. Bio Mater. 2024, 7, 510–527. [Google Scholar] [CrossRef] [Scilit]
- Zambuto, S.G.; Kolluru, S.S.; Ferchichi, E.; Rudewick, H.F.; Fodera, D.M.; Myers, K.M.; Zustiak, S.P.; Oyen, M.L. Evaluation of gelatin bloom strength on gelatin methacryloyl hydrogel properties. J. Mech. Behav. Biomed. Mater. 2024, 154, 106509, Correction in J. Mech. Behav. Biomed. Mater. 2024, 155, 106558. [Google Scholar] [CrossRef] [Scilit]
- Peyret, C.; Elkhoury, K.; Bouguet-Bonnet, S.; Poinsignon, S.; Boulogne, C.; Giraud, T.; Stefan, L.; Tahri, Y.; Sanchez-Gonzalez, L.; Linder, M.; et al. Gelatin Methacryloyl (GelMA) Hydrogel Scaffolds: Predicting Physical Properties Using an Experimental Design Approach. Int. J. Mol. Sci. 2023, 24, 13359. [Google Scholar] [CrossRef] [Scilit]
- Li, M.; Zhao, L.; Ren, Y.; Zuo, L.; Shen, Z.; Wu, J. The Optimization of Culture Conditions for Injectable Recombinant Collagen Hydrogel Preparation Using Machine Learning. Gels 2025, 11, 141. [Google Scholar] [CrossRef] [Scilit]
- Xu, S.; Chen, X.; Wang, S.; Chen, Z.; Pan, P.; Huang, Q. Integrating machine learning for the optimization of polyacrylamide/alginate hydrogel. Regen. Biomater. 2024, 11, rbae109. [Google Scholar] [CrossRef] [Scilit]
- Yin, P.; Wang, X.; Liu, S.; Huang, Y.; Huang, M.; Zhang, Y.; Peng, R.; Sun, J.; Wu, Y.; Wang, L. Model-Assisted Prioritization of Gelatin Methacryloyl (GelMA) Hydrogel Formulations for Three-Dimensional Cell Culture. ACS Appl. Mater. Interfaces 2026, 18, 40536–40553. [Google Scholar] [CrossRef] [Scilit]
- Li, Z.; Jiang, M.; Wang, S.; Zhang, S. Deep learning methods for molecular representation and property prediction. Drug Discov. Today 2022, 27, 103373. [Google Scholar] [CrossRef] [Scilit]
- Pang, C.; Tong, H.H.Y.; Wei, L. Advanced deep learning methods for molecular property prediction. Quant. Biol. 2023, 11, 395–404. [Google Scholar] [CrossRef] [Scilit]
- Queen, O.; McCarver, G.A.; Thatigotla, S.; Abolins, B.P.; Brown, C.L.; Maroulas, V.; Vogiatzis, K.D. Polymer graph neural networks for multitask property learning. npj Comput. Mater. 2023, 9, 90. [Google Scholar] [CrossRef]
- Gurnani, R.; Kuenneth, C.; Toland, A.; Ramprasad, R. Polymer Informatics at Scale with Multitask Graph Neural Networks. Chem. Mater. 2023, 35, 1560–1567. [Google Scholar] [CrossRef] [Scilit]
- Park, J.; Shim, Y.; Lee, F.; Rammohan, A.; Goyal, S.; Shim, M.; Jeong, C.; Kim, D.S. Prediction and Interpretation of Polymer Properties Using the Graph Convolutional Network. ACS Polym. Au 2022, 2, 213–222. [Google Scholar] [CrossRef] [Scilit]
- Shen, C.; Zhang, Y.; Er, T.K.G.; Han, F.; Goto, A.; Xia, K. Molecular Topological Deep Learning for Polymer Property Prediction. ACS Nano 2026, 20, 288–299. [Google Scholar] [CrossRef] [Scilit]
- Malashin, I.P.; Martysyuk, D.; Nelyub, V.; Borodulin, A.; Gantimurov, A.; Tynchenko, V. Deep learning for property prediction of natural fiber polymer composites. Sci. Rep. 2025, 15, 27837. [Google Scholar] [CrossRef] [Scilit]
- Jha, D.; Choudhary, K.; Tavazza, F.; Liao, W.-K.; Choudhary, A.; Agrawal, A. Enhancing materials property prediction by leveraging computational and experimental data using deep transfer learning. Nat. Commun. 2019, 10, 5316, Correction in Nat. Commun. 2020, 11, 3643. [Google Scholar] [CrossRef] [Scilit]
- Kong, S.; Guevarra, D.; Gomes, C.P.; Gregoire, J.M. Materials representation and transfer learning for multi-property prediction. Appl. Phys. Rev. 2021, 8, 021409. [Google Scholar] [CrossRef] [Scilit]
- Kazemi-Khasragh, E.; González, C.; Haranczyk, M. Toward diverse polymer property prediction using transfer learning. Comput. Mater. Sci. 2024, 244, 113206. [Google Scholar] [CrossRef] [Scilit]
- Li, M.; Yuan, H.; Luo, Y.; Ma, X.; Liu, H.; Jiang, W.; Fang, Y. Accelerated Discovery of Advanced Thermoelectric Materials via Transfer Learning. Adv. Energy Mater. 2023, 13, 2300049. [Google Scholar] [CrossRef] [Scilit]
- Amsden, B.G. Hydrogel Mesh Size and Its Impact on Predictions of Mathematical Models of the Solute Diffusion Coefficient. Macromolecules 2022, 55, 8399–8408. [Google Scholar] [CrossRef] [Scilit]
- Moncure, P.J.; Simon, Z.C.; Millstone, J.E.; Laaser, J.E. Relationship between Gel Mesh and Particle Size in Determining Nanoparticle Diffusion in Hydrogel Nanocomposites. J. Phys. Chem. B 2022, 126, 4132–4142. [Google Scholar] [CrossRef] [Scilit]
- Wallace, M.; Adams, D.J.; Iggo, J.A. Analysis of the mesh size in a supramolecular hydrogel by PFG-NMR spectroscopy. Soft Matter 2013, 9, 5483–5491. [Google Scholar] [CrossRef] [Scilit]
- Walta, S.; Di Lorenzo, F.; Ma, K.; Wiesner, U.; Richtering, W.; Seiffert, S. Diffusion of rigid nanoparticles in crowded polymer-network hydrogels: Dominance of segmental density over crosslinking density. Colloid Polym. Sci. 2017, 295, 1371–1381. [Google Scholar] [CrossRef] [Scilit]
- Lee, S.; Tong, X.; Yang, F. The effects of varying poly(ethylene glycol) hydrogel crosslinking density and the crosslinking mechanism on protein accumulation in three-dimensional hydrogels. Acta Biomater. 2014, 10, 4167–4174. [Google Scholar] [CrossRef] [Scilit]
- Gao, J.; Tang, C.; Elsawy, M.A.; Smith, A.M.; Miller, A.F.; Saiani, A. Controlling Self-Assembling Peptide Hydrogel Properties through Network Topology. Biomacromolecules 2017, 18, 826–834. [Google Scholar] [CrossRef] [Scilit]
- Frondelius, T.; Tiulpin, A.; Lehenkari, P.; Nieminen, H.J.; Saarakkala, S. Fully automatic deep learning based segmentation of bone-cartilage interface from micro-CT images of human osteochondral samples. Osteoarthr. Cartil. 2018, 26, S469. [Google Scholar] [CrossRef] [Scilit]
- Malimban, J.; Lathouwers, D.; Qian, H.; Verhaegen, F.; Wiedemann, J.; Brandenburg, S.; Staring, M. Deep learning-based segmentation of the thorax in mouse micro-CT scans. Sci. Rep. 2022, 12, 1822. [Google Scholar] [CrossRef] [Scilit]
- Zwijnen, A.-W.; Watzema, L.; Ridwan, Y.; van Der Pluijm, I.; Smal, I.; Essers, J. Self-adaptive deep learning-based segmentation for universal and functional clinical and preclinical CT image analysis. Comput. Biol. Med. 2024, 179, 108853. [Google Scholar] [CrossRef] [Scilit]
- Toulkeridou, E.; Gutierrez, C.E.; Baum, D.; Doya, K.; Economo, E.P. Automated segmentation of insect anatomy from micro-CT images using deep learning. Nat. Sci. 2023, 3, e20230010. [Google Scholar] [CrossRef] [Scilit]
- Wang, S.; Yang, D.M.; Rong, R.; Zhan, X.; Xiao, G. Pathology Image Analysis Using Segmentation Deep Learning Algorithms. Am. J. Pathol. 2019, 189, 1686–1698. [Google Scholar] [CrossRef] [Scilit]
- Alrfou, K.; Zhao, T.; Kordijazi, A. Deep Learning Methods for Microstructural Image Analysis: The State-of-the-Art and Future Perspectives. Integr. Mater. Manuf. Innov. 2024, 13, 703–731. [Google Scholar] [CrossRef] [Scilit]
- Jung, J.; Na, J.; Park, H.K.; Park, J.M.; Kim, G.; Lee, S.; Kim, H.S. Super-resolving material microstructure image via deep learning for microstructure characterization and mechanical behavior analysis. npj Comput. Mater. 2021, 7, 96. [Google Scholar] [CrossRef] [Scilit]
- Ercetin, A.; Arpaci, I.; Memiş, S.; Akagic, A.; Özgün, Ö. AI-Driven Image Processing for Microstructure and Surface Characterization: A Systematic Review of Methods, Materials, and Applications. Arch. Comput. Methods Eng. 2026. [Google Scholar] [CrossRef] [Scilit]
- Lan, Y.; Huang, N.; Fu, Y.; Liu, K.; Zhang, H.; Li, Y.; Yang, S. Morphology-Based Deep Learning Approach for Predicting Osteogenic Differentiation. Front. Bioeng. Biotechnol. 2022, 9, 802794. [Google Scholar] [CrossRef] [Scilit]
- Mai, M.; Luo, S.; Fasciano, S.; Oluwole, T.E.; Ortiz, J.; Pang, Y.; Wang, S. Morphology-based deep learning approach for predicting adipogenic and osteogenic differentiation of human mesenchymal stem cells (hMSCs). Front. Cell Dev. Biol. 2023, 11, 1329840. [Google Scholar] [CrossRef] [Scilit]
- Klontzas, M.E.; Vernardis, S.I.; Batsali, A.; Papadogiannis, F.; Panoskaltsis, N.; Mantalaris, A. Machine Learning and Metabolomics Predict Mesenchymal Stem Cell Osteogenic Differentiation in 2D and 3D Cultures. J. Funct. Biomater. 2024, 15, 367. [Google Scholar] [CrossRef] [Scilit]
- Ye, W.; Chen, C.; Dwaraknath, S.; Jain, A.; Ong, S.P.; Persson, K.A. Harnessing the Materials Project for machine-learning and accelerated discovery. MRS Bull. 2018, 43, 664–669. [Google Scholar] [CrossRef] [Scilit]
- Vasudevan, R.; Pilania, G.; Balachandran, P.V. Machine learning for materials design and discovery. J. Appl. Phys. 2021, 129, 070401. [Google Scholar] [CrossRef] [Scilit]
- Otsuka, S.; Kuwajima, I.; Hosoya, J.; Xu, Y.; Yamazaki, M. PoLyInfo: Polymer Database for Polymeric Materials Design. In 2011 International Conference on Emerging Intelligent Data and Web Technologies; IEEE: Piscataway, NJ, USA, 2011; pp. 22–29. [Google Scholar] [CrossRef] [Scilit]
- Zhang, Z.; Jin, Y.; Yin, J.; Xu, C.; Xiong, R.; Christensen, K.; Ringeisen, B.R.; Chrisey, D.B.; Huang, Y. Evaluation of bioink printability for bioprinting applications. Appl. Phys. Rev. 2018, 5, 041304. [Google Scholar] [CrossRef] [Scilit]
- Wilkinson, M.D.; Dumontier, M.; Aalbersberg, I.J.; Appleton, G.; Axton, M.; Baak, A.; Blomberg, N.; Boiten, J.W.; da Silva Santos, L.B.; Bourne, P.E.; et al. The FAIR Guiding Principles for scientific data management and stewardship. Sci. Data 2016, 3, 160018. [Google Scholar] [CrossRef] [Scilit]
- Li, S.; Wei, S.; Huang, C.; Zhang, Y.; Zhang, G.; Sun, S. Extracting and reconstructing knowledge in materials science literature using large language models. Commun. Mater. 2026, 7, 31. [Google Scholar] [CrossRef] [Scilit]
- Jiang, X.; Wang, W.; Tian, S.; Wang, H.; Lookman, T.; Su, Y. Applications of natural language processing and large language models in materials discovery. npj Comput. Mater. 2025, 11, 79. [Google Scholar] [CrossRef] [Scilit]
- Miret, S.; Krishnan, N.M.A. Enabling large language models for real-world materials discovery. Nat. Mach. Intell. 2025, 7, 991–998. [Google Scholar] [CrossRef] [Scilit]
- Lei, G.; Docherty, R.; Cooper, S.J. Materials science in the era of large language models: A perspective. Digit. Discov. 2024, 3, 1257–1272. [Google Scholar] [CrossRef] [Scilit]
- Gupta, T.; Zaki, M.; Krishnan, N.M.A.; Mausam. MatSciBERT: A materials domain language model for text mining and information extraction. npj Comput. Mater. 2022, 8, 102. [Google Scholar] [CrossRef] [Scilit]
- Zaki, M.; Jayadeva; Mausam; Krishnan, N.M.A. MaScQA: Investigating materials science knowledge of large language models. Digit. Discov. 2024, 3, 313–327. [Google Scholar] [CrossRef] [Scilit]
- Bran, A.M.; Cox, S.; Schilter, O.; Baldassari, C.; White, A.D.; Schwaller, P. Augmenting large language models with chemistry tools. Nat. Mach. Intell. 2024, 6, 525–535. [Google Scholar] [CrossRef] [Scilit]
- Kononova, O.; Huo, H.; He, T.; Rong, Z.; Botari, T.; Sun, W.; Tshitoyan, V.; Ceder, G. Text-mined dataset of inorganic materials synthesis recipes. Sci. Data 2019, 6, 203, Correction in Sci. Data 2019, 6, 273. [Google Scholar] [CrossRef] [Scilit]
- Wang, Z.; Kononova, O.; Cruse, K.; He, T.; Huo, H.; Fei, Y.; Zeng, Y.; Sun, Y.; Cai, Z.; Sun, W.; et al. Dataset of solution-based inorganic materials synthesis procedures extracted from the scientific literature. Sci. Data 2022, 9, 231. [Google Scholar] [CrossRef] [Scilit]
- Greenaway, R.L.; Jelfs, K.E. Integrating Computational and Experimental Workflows for Accelerated Organic Materials Discovery. Adv. Mater. 2021, 33, 2004831. [Google Scholar] [CrossRef] [Scilit]
- Ataie, Z.; Jaberi, A.; Kheirabadi, S.; Risbud, A.; Sheikhi, A. Gelatin Methacryloyl Granular Hydrogel Scaffolds: High-throughput Microgel Fabrication, Lyophilization, Chemical Assembly, and 3D Bioprinting. J. Vis. Exp. 2022, 190, e64829. [Google Scholar] [CrossRef] [Scilit]
- Klabukov, I. Limitations of artificial intelligence in tissue engineering and regenerative medicine. Biomed. Res. Ther. 2026, 13, 8193–8202. [Google Scholar] [CrossRef] [Scilit]
- Lee, J.S.; Cha, J.H.; Kim, B.S. Focus on AI-powered Biofabrication. Biofabrication 2026, 18, 032003. [Google Scholar] [CrossRef] [Scilit]
- Krishna, D.V.; Sankar, M.R. Persuasive factors on the bioink printability and cell viability in the extrusion-based 3D bioprinting for tissue regeneration applications. Eng. Regen. 2023, 4, 396–410. [Google Scholar] [CrossRef] [Scilit]
- Lee, J.; Oh, S.J.; An, S.H.; Kim, W.D.; Kim, S.H. Machine learning-based design and optimization of 3D cell-printing process. Biofabrication 2020, 12, 035018. [Google Scholar] [CrossRef] [Scilit]
- Li, Z. Predicting bone regeneration from machine learning. Nat. Comput. Sci. 2021, 1, 509–510. [Google Scholar] [CrossRef] [Scilit]
- Liao, H.; Hu, S.; Yang, H.; Wang, L.; Tanaka, S.; Takigawa, I.; Li, W.; Fan, H.; Gong, J.P. Data-driven de novo design of super-adhesive hydrogels. Nature 2025, 644, 89–95. [Google Scholar] [CrossRef] [Scilit]
- Mao, H.; Zhou, Z.; Yang, Y.; Lin, K.; Zhou, C.; Wang, X. Application of Machine Learning in Predicting Osteogenic Differentiation of Mesenchymal Stem Cells. Bioengineering 2025, 12, 1089. [Google Scholar] [CrossRef] [Scilit]
- Lin, S.; Zhuang, Y.; Chen, K.; Lu, J.; Wang, K.; Han, L.; Li, M.; Li, X.; Zhu, X.; Yang, M.; et al. Osteoinductive biomaterials: Machine learning for prediction and interpretation. Acta Biomater. 2024, 187, 422–433. [Google Scholar] [CrossRef] [Scilit]
- Malekpour, A.; Chen, X. Printability and Cell Viability in Extrusion-Based Bioprinting from Experimental, Computational, and Machine Learning Views. J. Funct. Biomater. 2022, 13, 40. [Google Scholar] [CrossRef] [Scilit]
- Oh, D.; Kim, D.; Nam, S.Y. Predicting printability in suspended bioprinting using a rheology-informed hierarchical machine learning approach. Bioprinting 2025, 50, e00427. [Google Scholar] [CrossRef] [Scilit]
- Yu, J.; Yao, D.; Wang, L.; Xu, M. Machine Learning in Predicting and Optimizing Polymer Printability for 3D Bioprinting. Polymers 2025, 17, 1873. [Google Scholar] [CrossRef] [Scilit]
- Wu, C.; Entezari, A.; Zheng, K.; Fang, J.; Zreiqat, H.; Steven, G.P.; Swain, M.V.; Li, Q. A machine learning-based multiscale model to predict bone formation in scaffolds. Nat. Comput. Sci. 2021, 1, 532–541. [Google Scholar] [CrossRef] [Scilit]
- Wang, Y.; Wallmersperger, T.; Ehrenhofer, A. Prediction of hydrogel swelling states using machine learning methods. Eng. Rep. 2024, 6, e12893. [Google Scholar] [CrossRef] [Scilit]
- Wei, J.; Chu, X.; Sun, X.Y.; Xu, K.; Deng, H.X.; Chen, J.; Wei, Z.; Lei, M. Machine learning in materials science. InfoMat 2019, 1, 338–358. [Google Scholar] [CrossRef] [Scilit]
- Donmazov, S.; Saruhan, E.N.; Pekkan, K.; Piskin, S. Review of Machine Learning Techniques in Soft Tissue Biomechanics and Biomaterials. Cardiovasc. Eng. Technol. 2024, 15, 522–549. [Google Scholar] [CrossRef] [Scilit]
- Xu, L.; Liu, S.; Lin, A.; Su, Z.; Liang, D. Interpretable Prediction and Analysis of PVA Hydrogel Mechanical Behavior Using Machine Learning. Gels 2025, 11, 550. [Google Scholar] [CrossRef] [Scilit]
- Xu, L.; Liu, S.; Hu, D.; Liu, J.; Zhang, Y.; Li, Z.; Su, Z.; Liang, D. Interpretable Machine Learning Analysis of Design Factors in Hydrogel Supercapacitors. Gels 2025, 11, 464. [Google Scholar] [CrossRef] [Scilit]
- Shokrollahi, Y.; Dong, P.; Gamage, P.T.; Patrawalla, N.; Kishore, V.; Mozafari, H.; Gu, L. Finite Element-Based Machine Learning Model for Predicting the Mechanical Properties of Composite Hydrogels. Appl. Sci. 2022, 12, 10835. [Google Scholar] [CrossRef] [Scilit]
- Gholami, K.; Ege, F.; Barzegar, R. Prediction of Composite Mechanical Properties: Integration of Deep Neural Network Methods and Finite Element Analysis. J. Compos. Sci. 2023, 7, 54. [Google Scholar] [CrossRef] [Scilit]
- Zheng, S.; You, H.; Lam, K.Y.; Li, H. Fracture Prediction of Hydrogel Using Machine Learning and Inhomogeneous Multiscale Network. Adv. Theory Simul. 2024, 7, 2300776. [Google Scholar] [CrossRef] [Scilit]
- Faraji, M.A.; Askari-Sedeh, M.; Zolfagharian, A.; Baghani, M. Enhancing hydrogel predictive modeling: An augmented neural network approach for swelling dynamics in pH-responsive hydrogels. Appl. Math. Mech. Engl. Ed. 2025, 46, 1787–1808. [Google Scholar] [CrossRef] [Scilit]
- Ibrahimi, S.; D’Andrea, L.; Gastaldi, D.; Rivolta, M.W.; Vena, P. Machine Learning approaches for the design of biomechanically compatible bone tissue engineering scaffolds. Comput. Methods Appl. Mech. Eng. 2024, 423, 116842. [Google Scholar] [CrossRef] [Scilit]
- Wang, S.; Chen, L.; Yang, K.; Cheng, B.; Wan, Y.; Wang, B.; Sun, T.; Hao, X.; Yang, J.; Zhang, H.; et al. Machine Learning Assisted Prediction of Degradation Behavior of Poly(Lactic-Co-Glycolic Acid). Mater. Genome Eng. Adv. 2026, 4, e70062. [Google Scholar] [CrossRef] [Scilit]
- Oviedo, F.; Ferres, J.L.; Buonassisi, T.; Butler, K.T. Interpretable and Explainable Machine Learning for Materials Science and Chemistry. Acc. Mater. Res. 2022, 3, 597–607. [Google Scholar] [CrossRef] [Scilit]
- Zhong, X.; Gallagher, B.; Liu, S.; Kailkhura, B.; Hiszpanski, A.M.; Han, T.Y.J. Explainable machine learning in materials science. npj Comput. Mater. 2022, 8, 204. [Google Scholar] [CrossRef] [Scilit]
- Dean, J.; Scheffler, M.; Purcell, T.A.R.; Barabash, S.V.; Bhowmik, R.; Bazhirov, T. Interpretable machine learning for materials design. J. Mater. Res. 2023, 38, 4477–4496. [Google Scholar] [CrossRef] [Scilit]
- Mikulskis, P.; Alexander, M.R.; Winkler, D.A. Toward Interpretable Machine Learning Models for Materials Discovery. Adv. Intell. Syst. 2019, 1, 1900045. [Google Scholar] [CrossRef] [Scilit]
- Pilania, G. Machine learning in materials science: From explainable predictions to autonomous design. Comput. Mater. Sci. 2021, 193, 110360. [Google Scholar] [CrossRef] [Scilit]
- Liu, B.; Liu, P.; Lu, W.; Olofsson, T. Explainable Artificial Intelligence (XAI) for Material Design and Engineering Applications: A Quantitative Computational Framework. Int. J. Mech. Syst. Dyn. 2025, 5, 236–265. [Google Scholar] [CrossRef] [Scilit]
- Medina-Ortiz, D.; Khalifeh, A.; Anvari-Kazemabad, H.; Davari, M.D. Interpretable and explainable predictive machine learning models for data-driven protein engineering. Biotechnol. Adv. 2025, 79, 108495. [Google Scholar] [CrossRef] [Scilit]
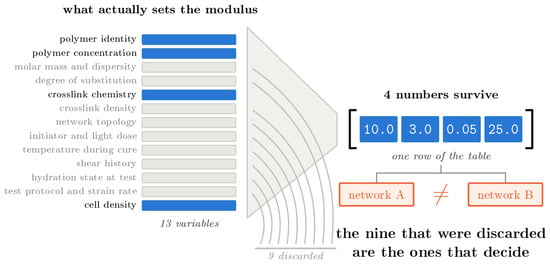
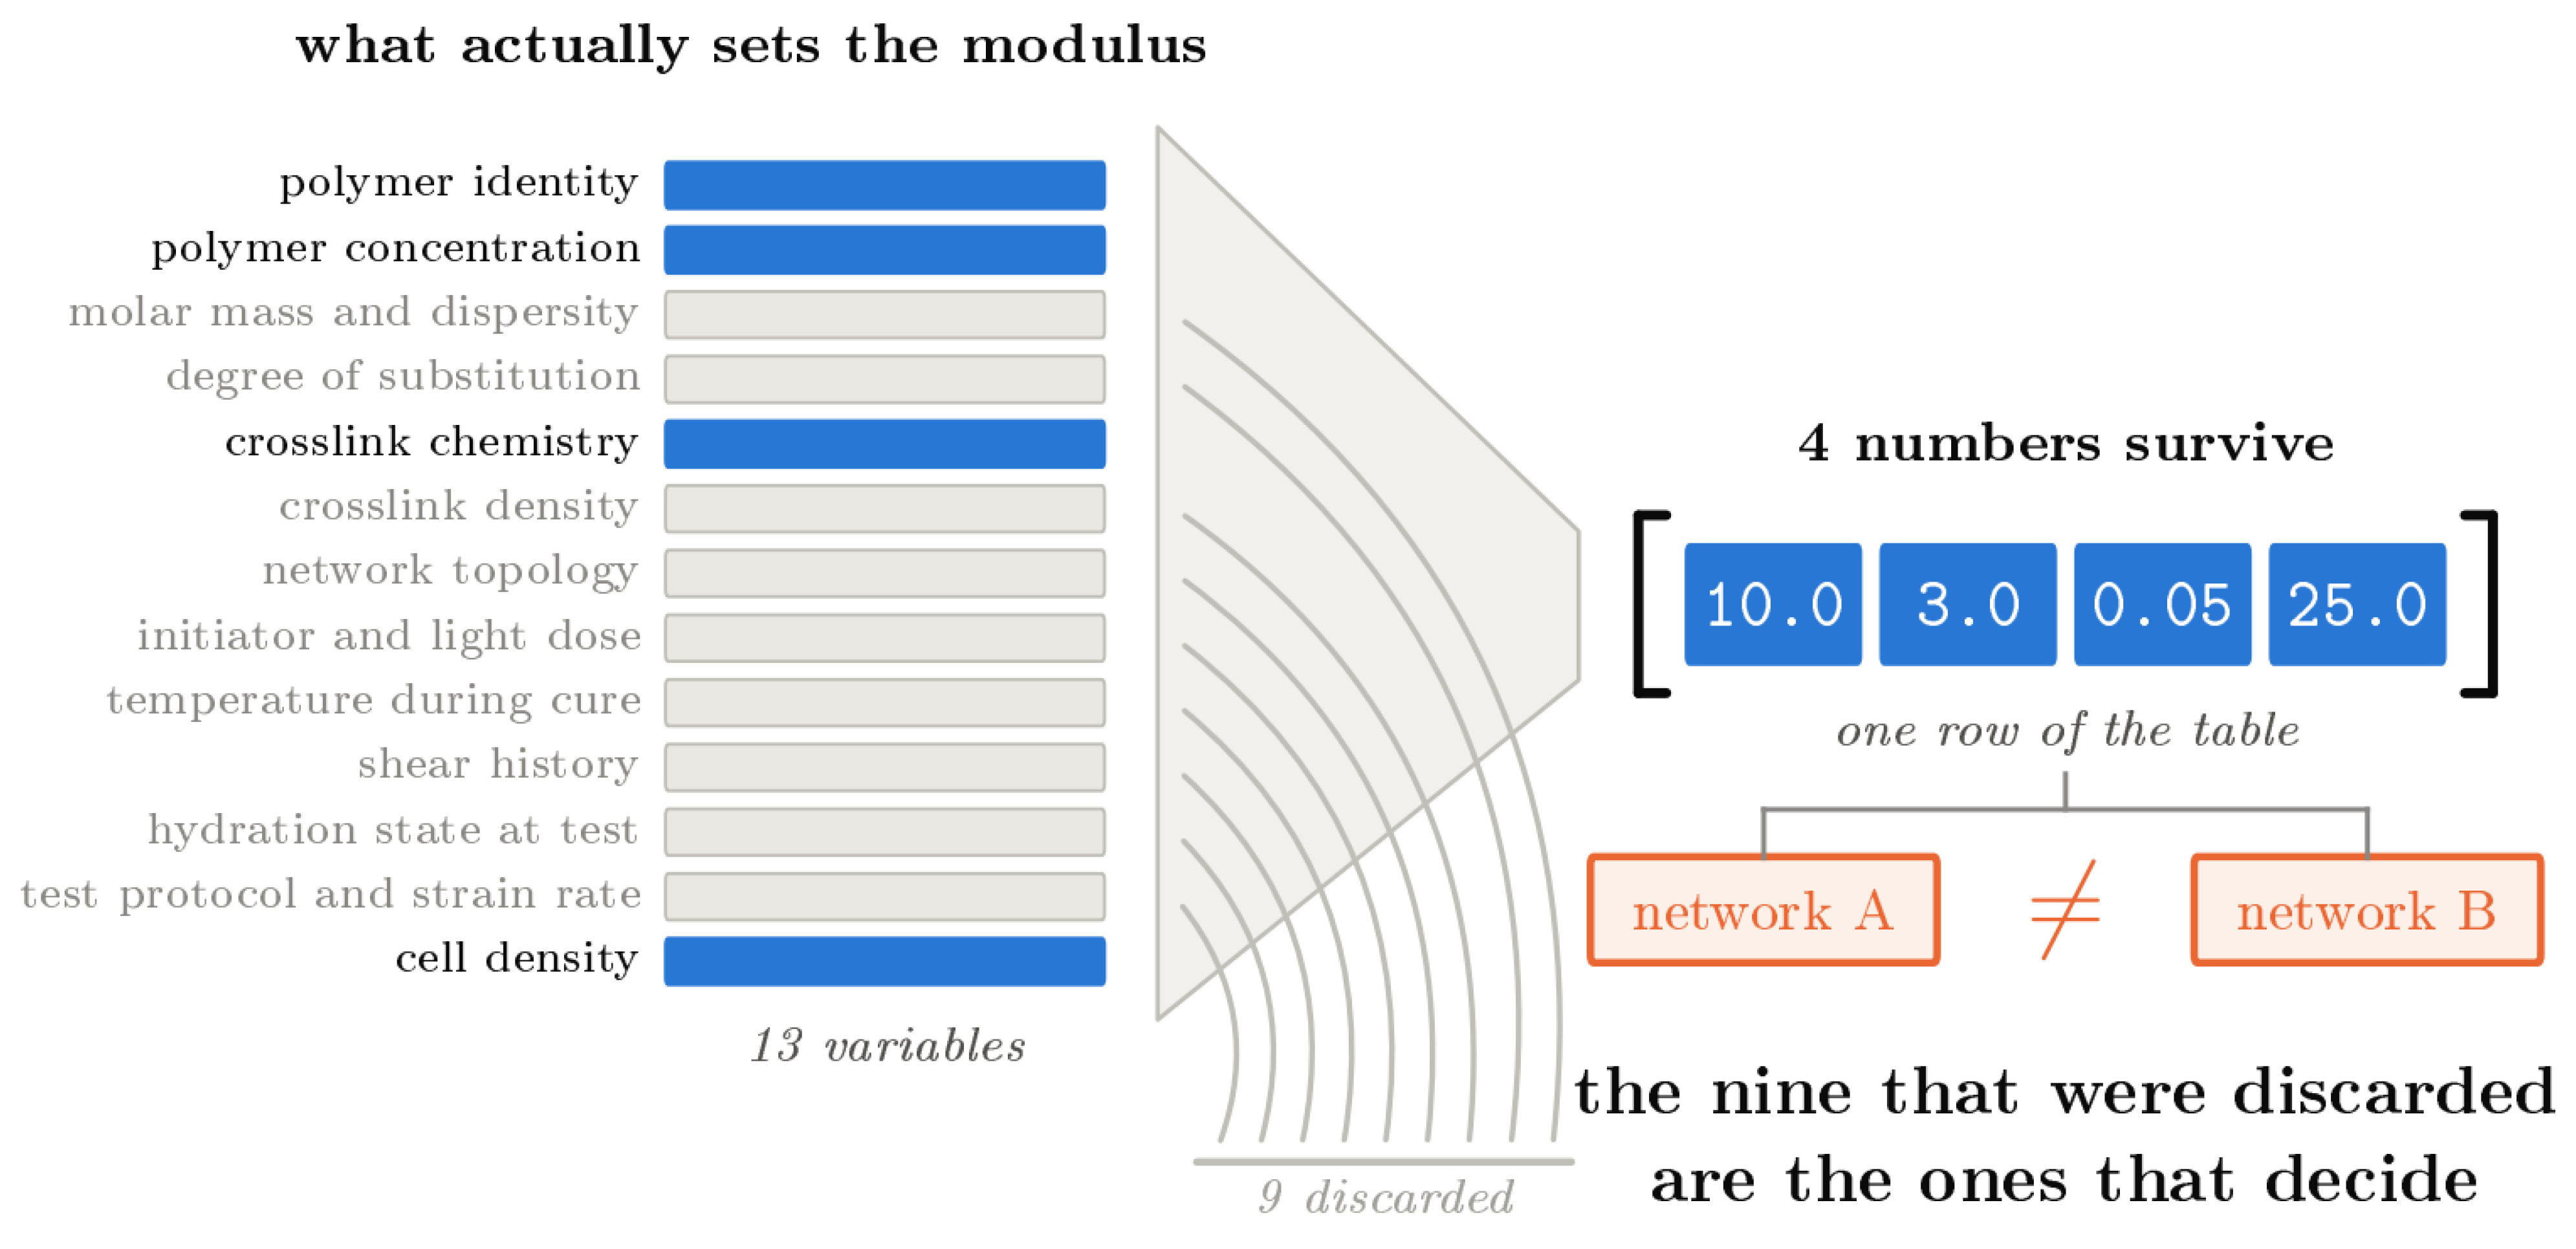
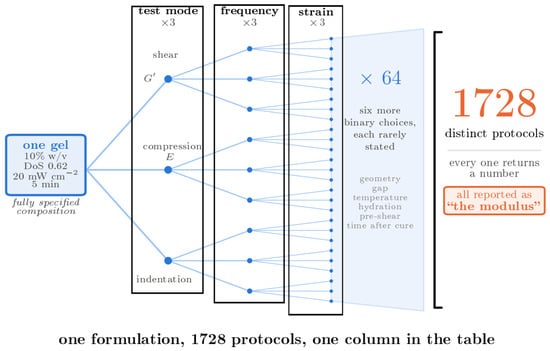
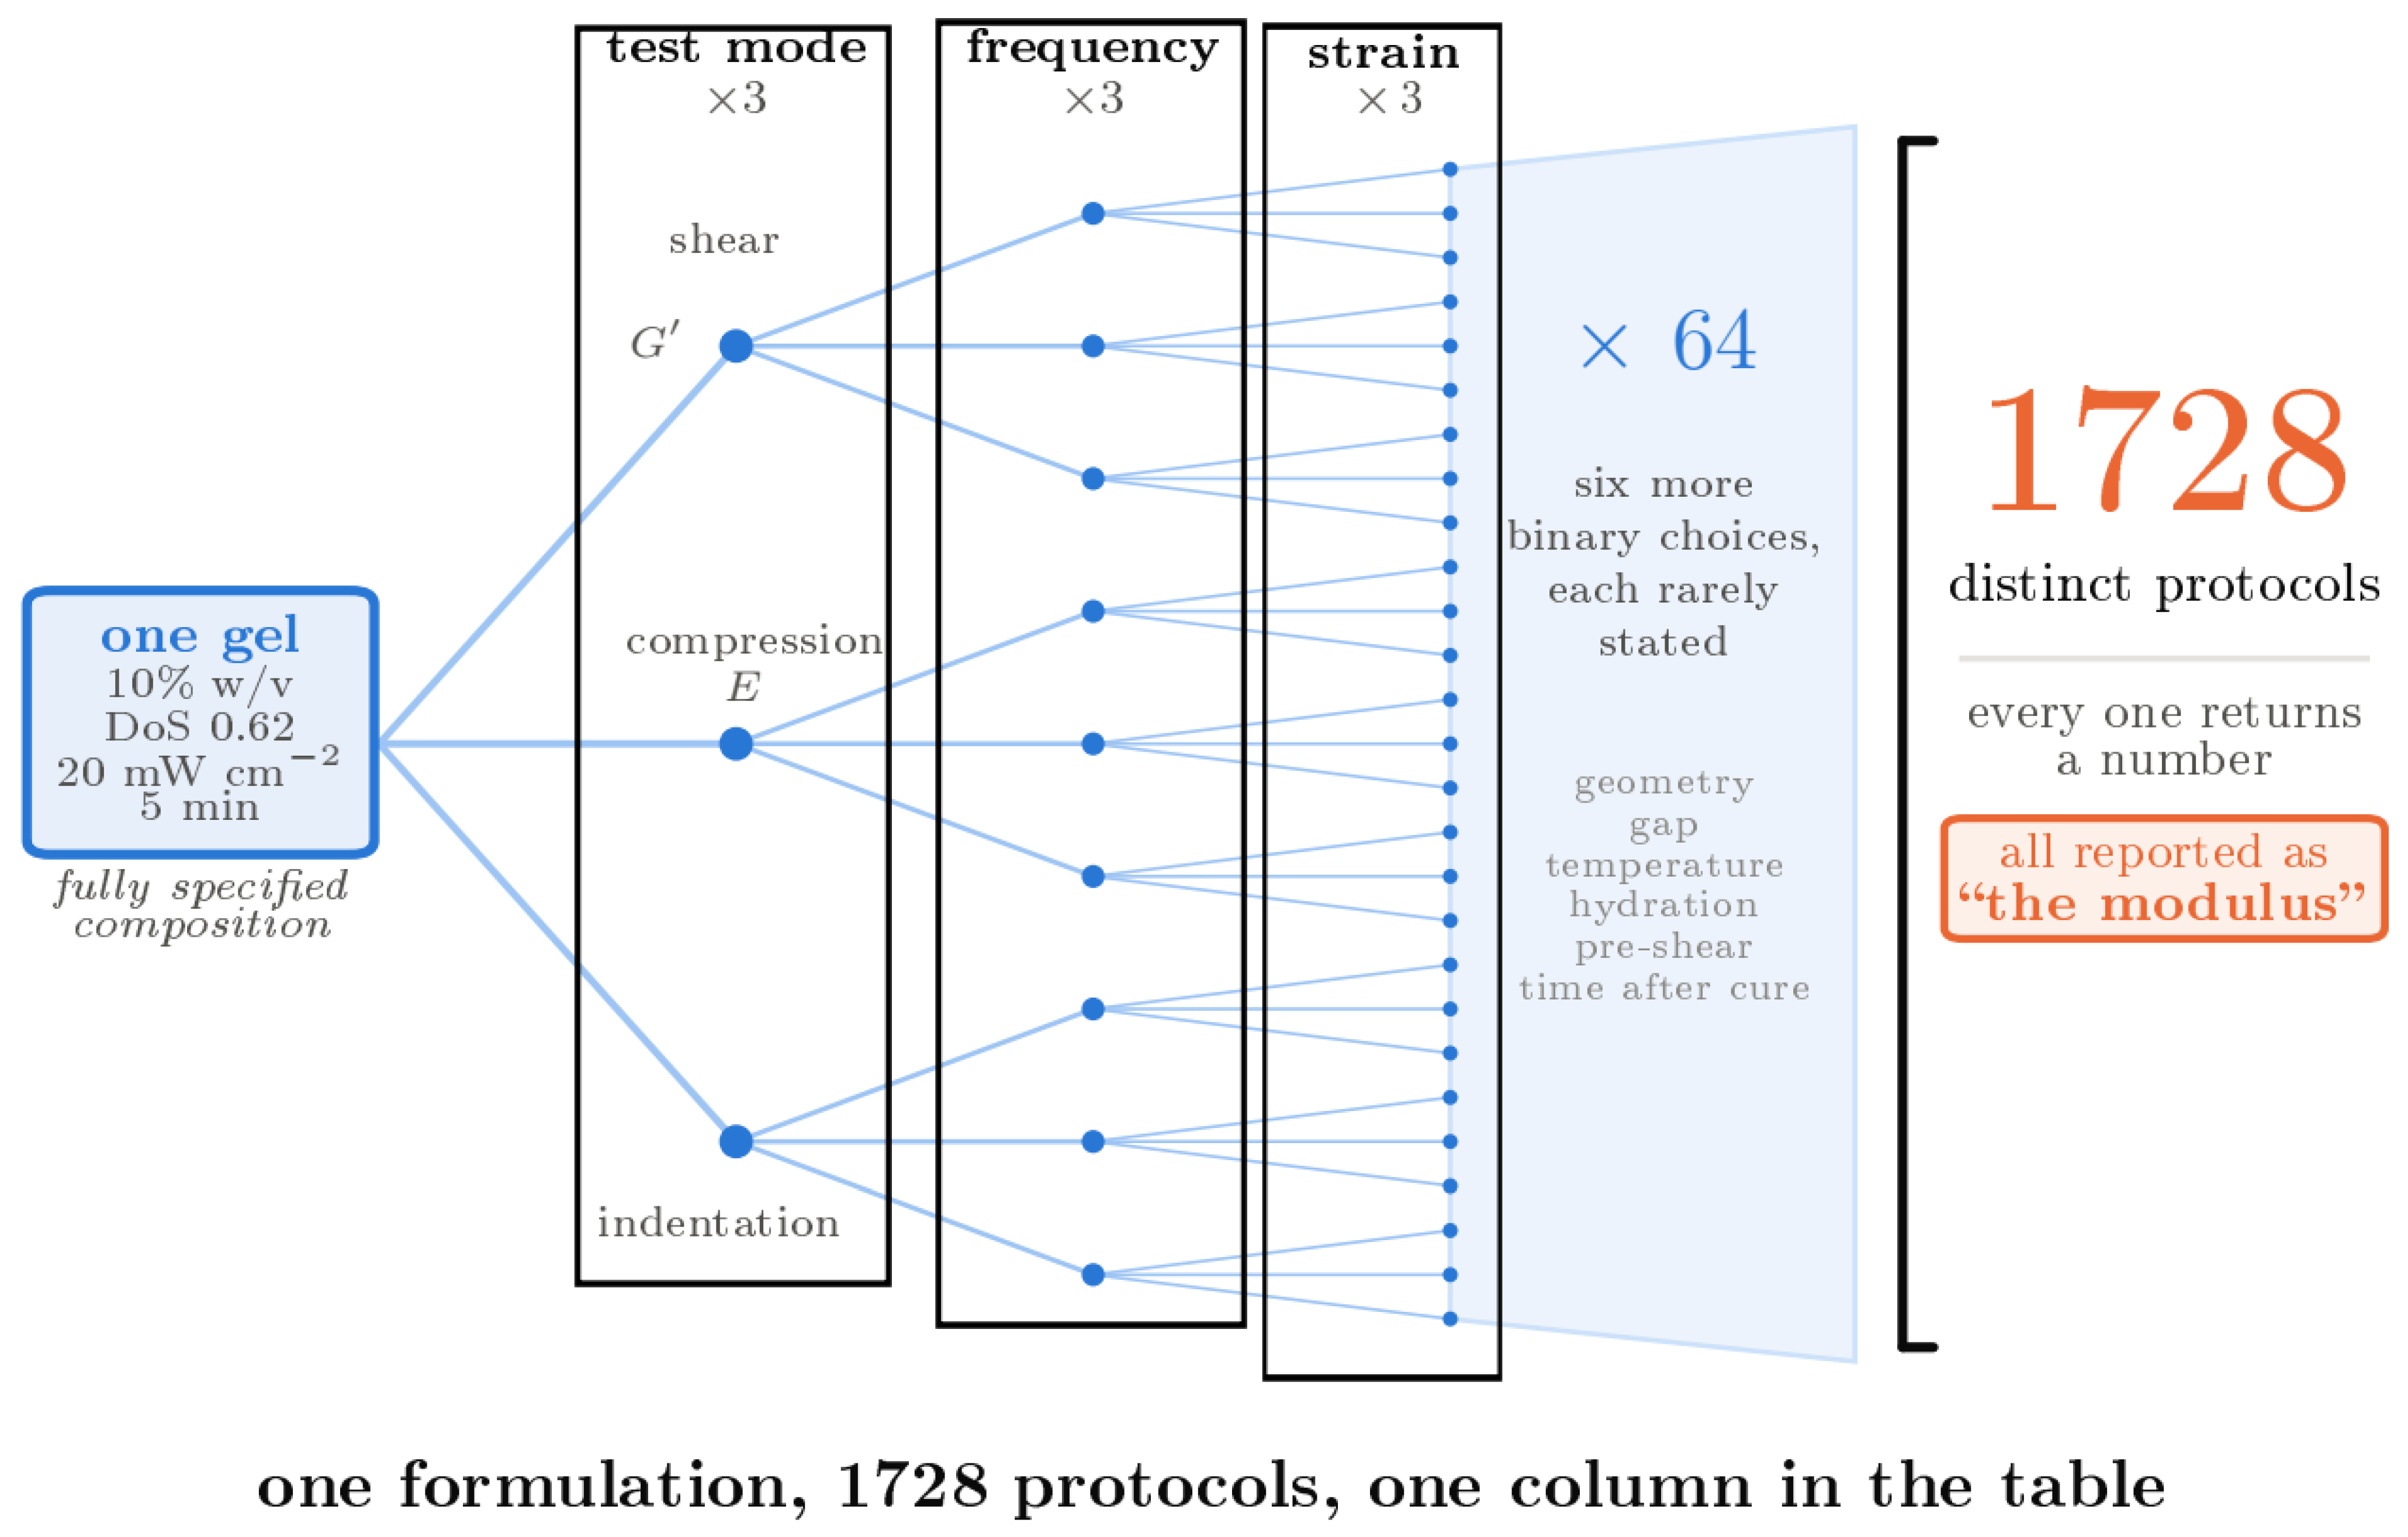
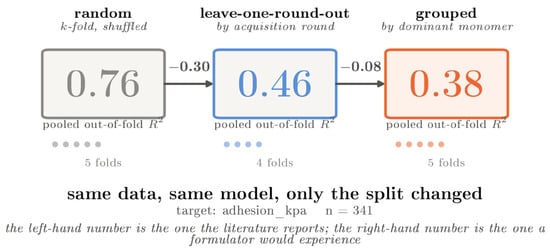
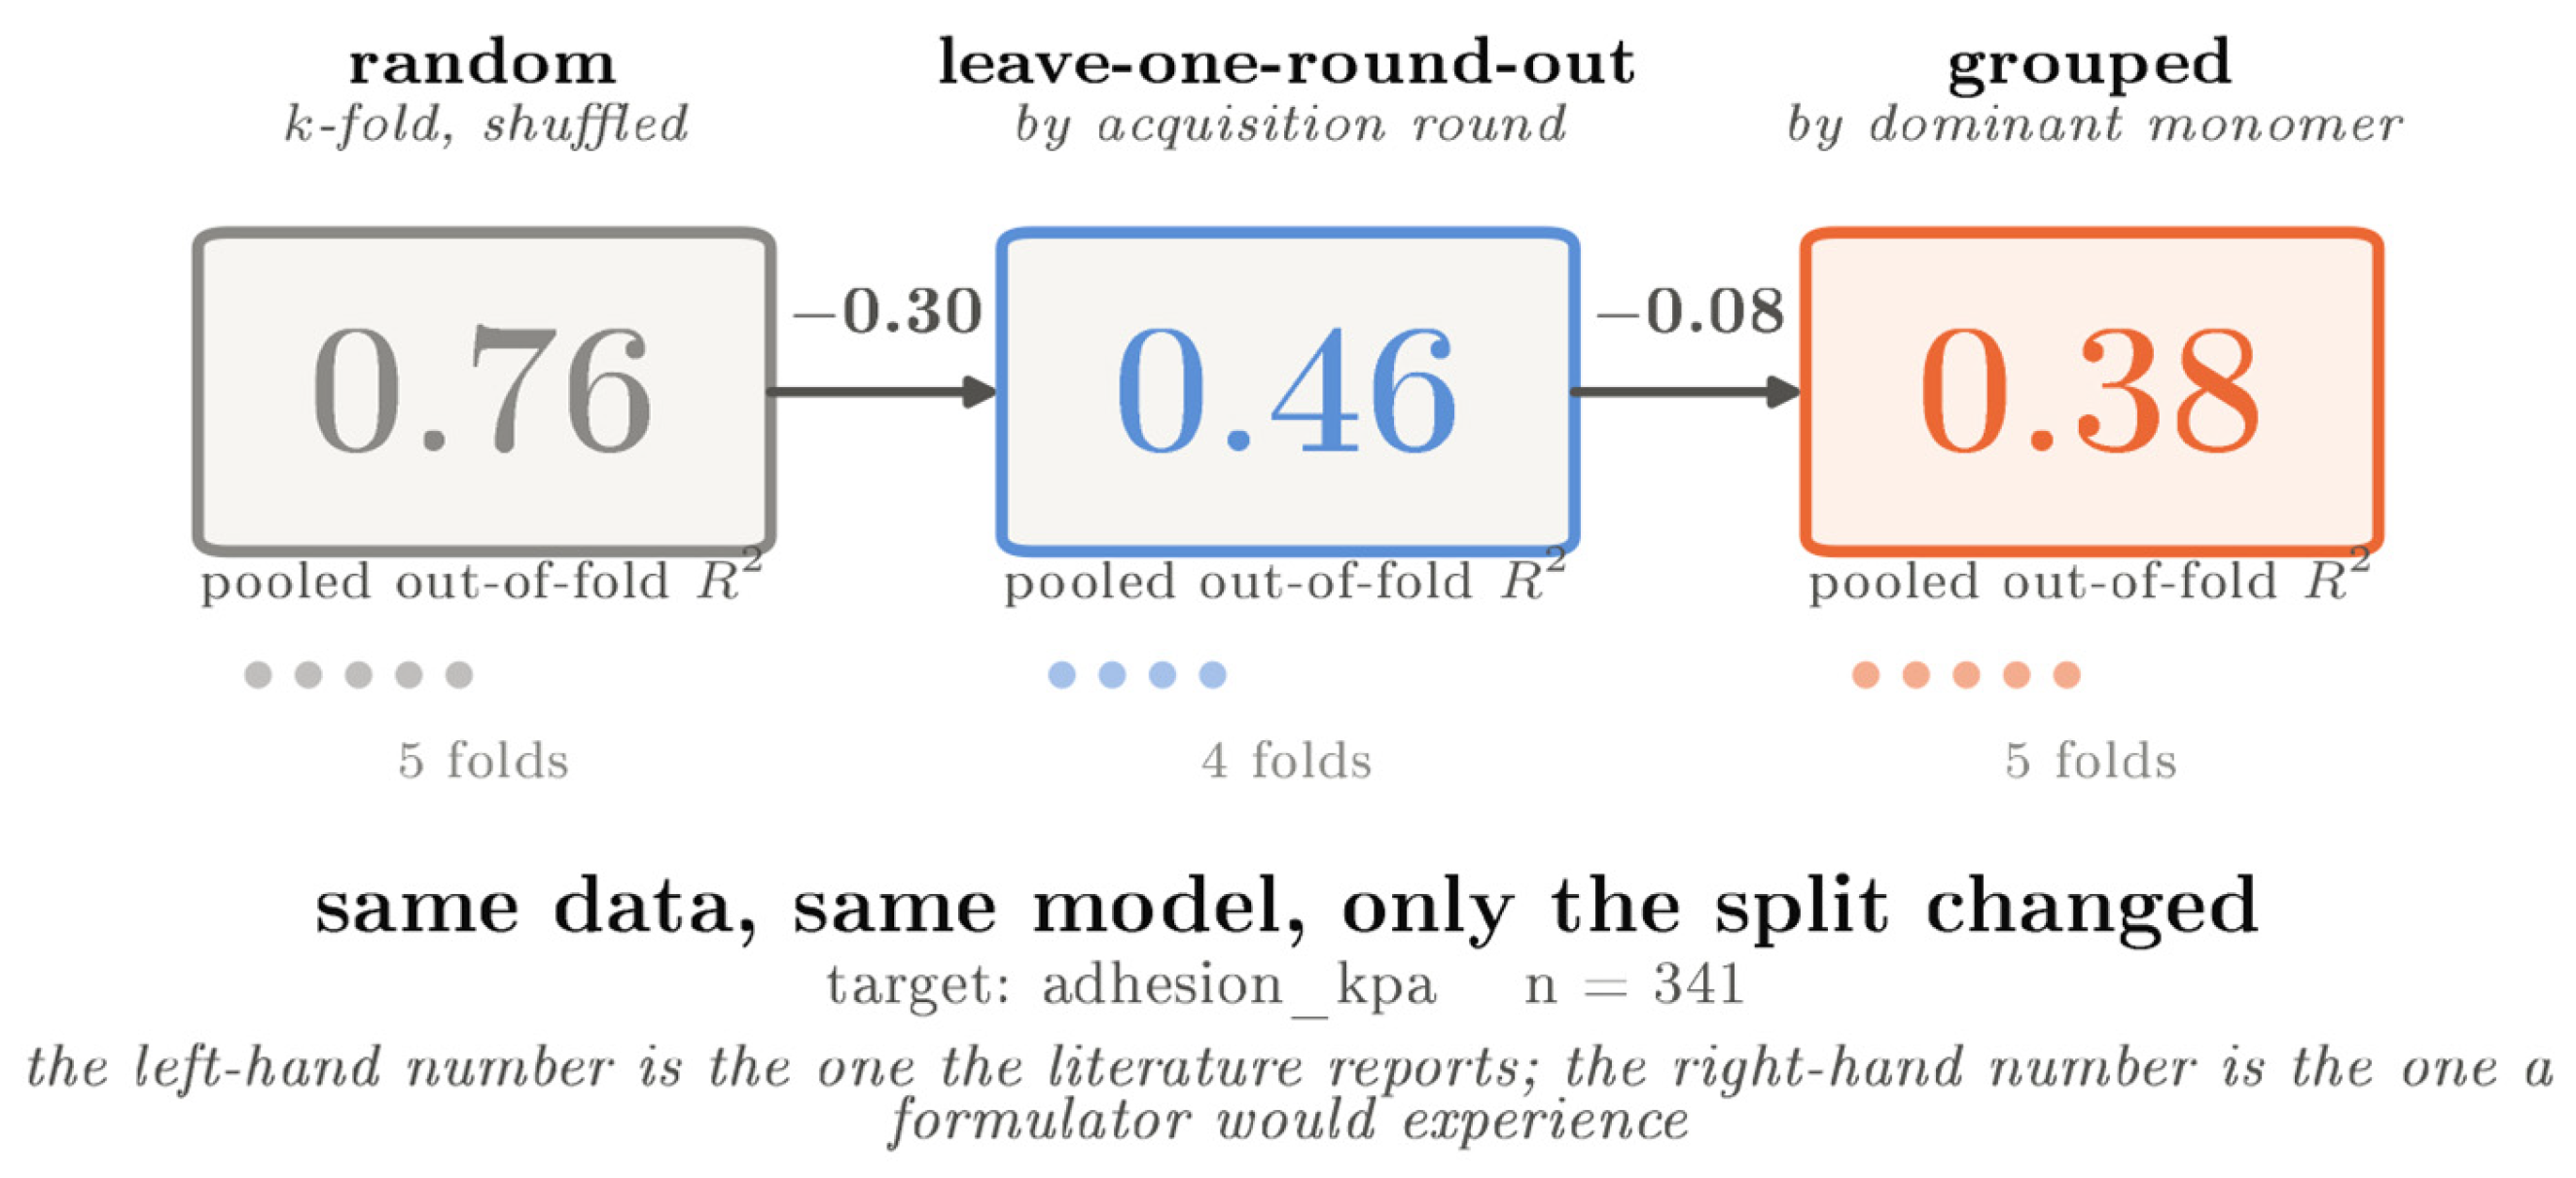
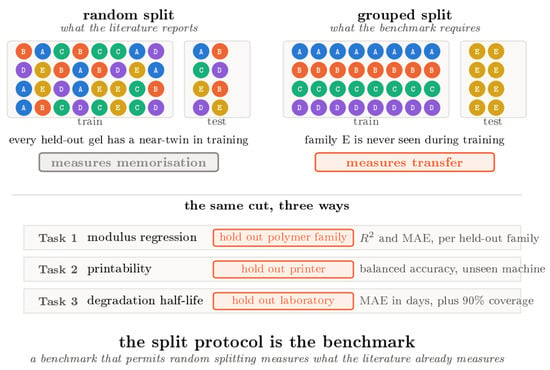
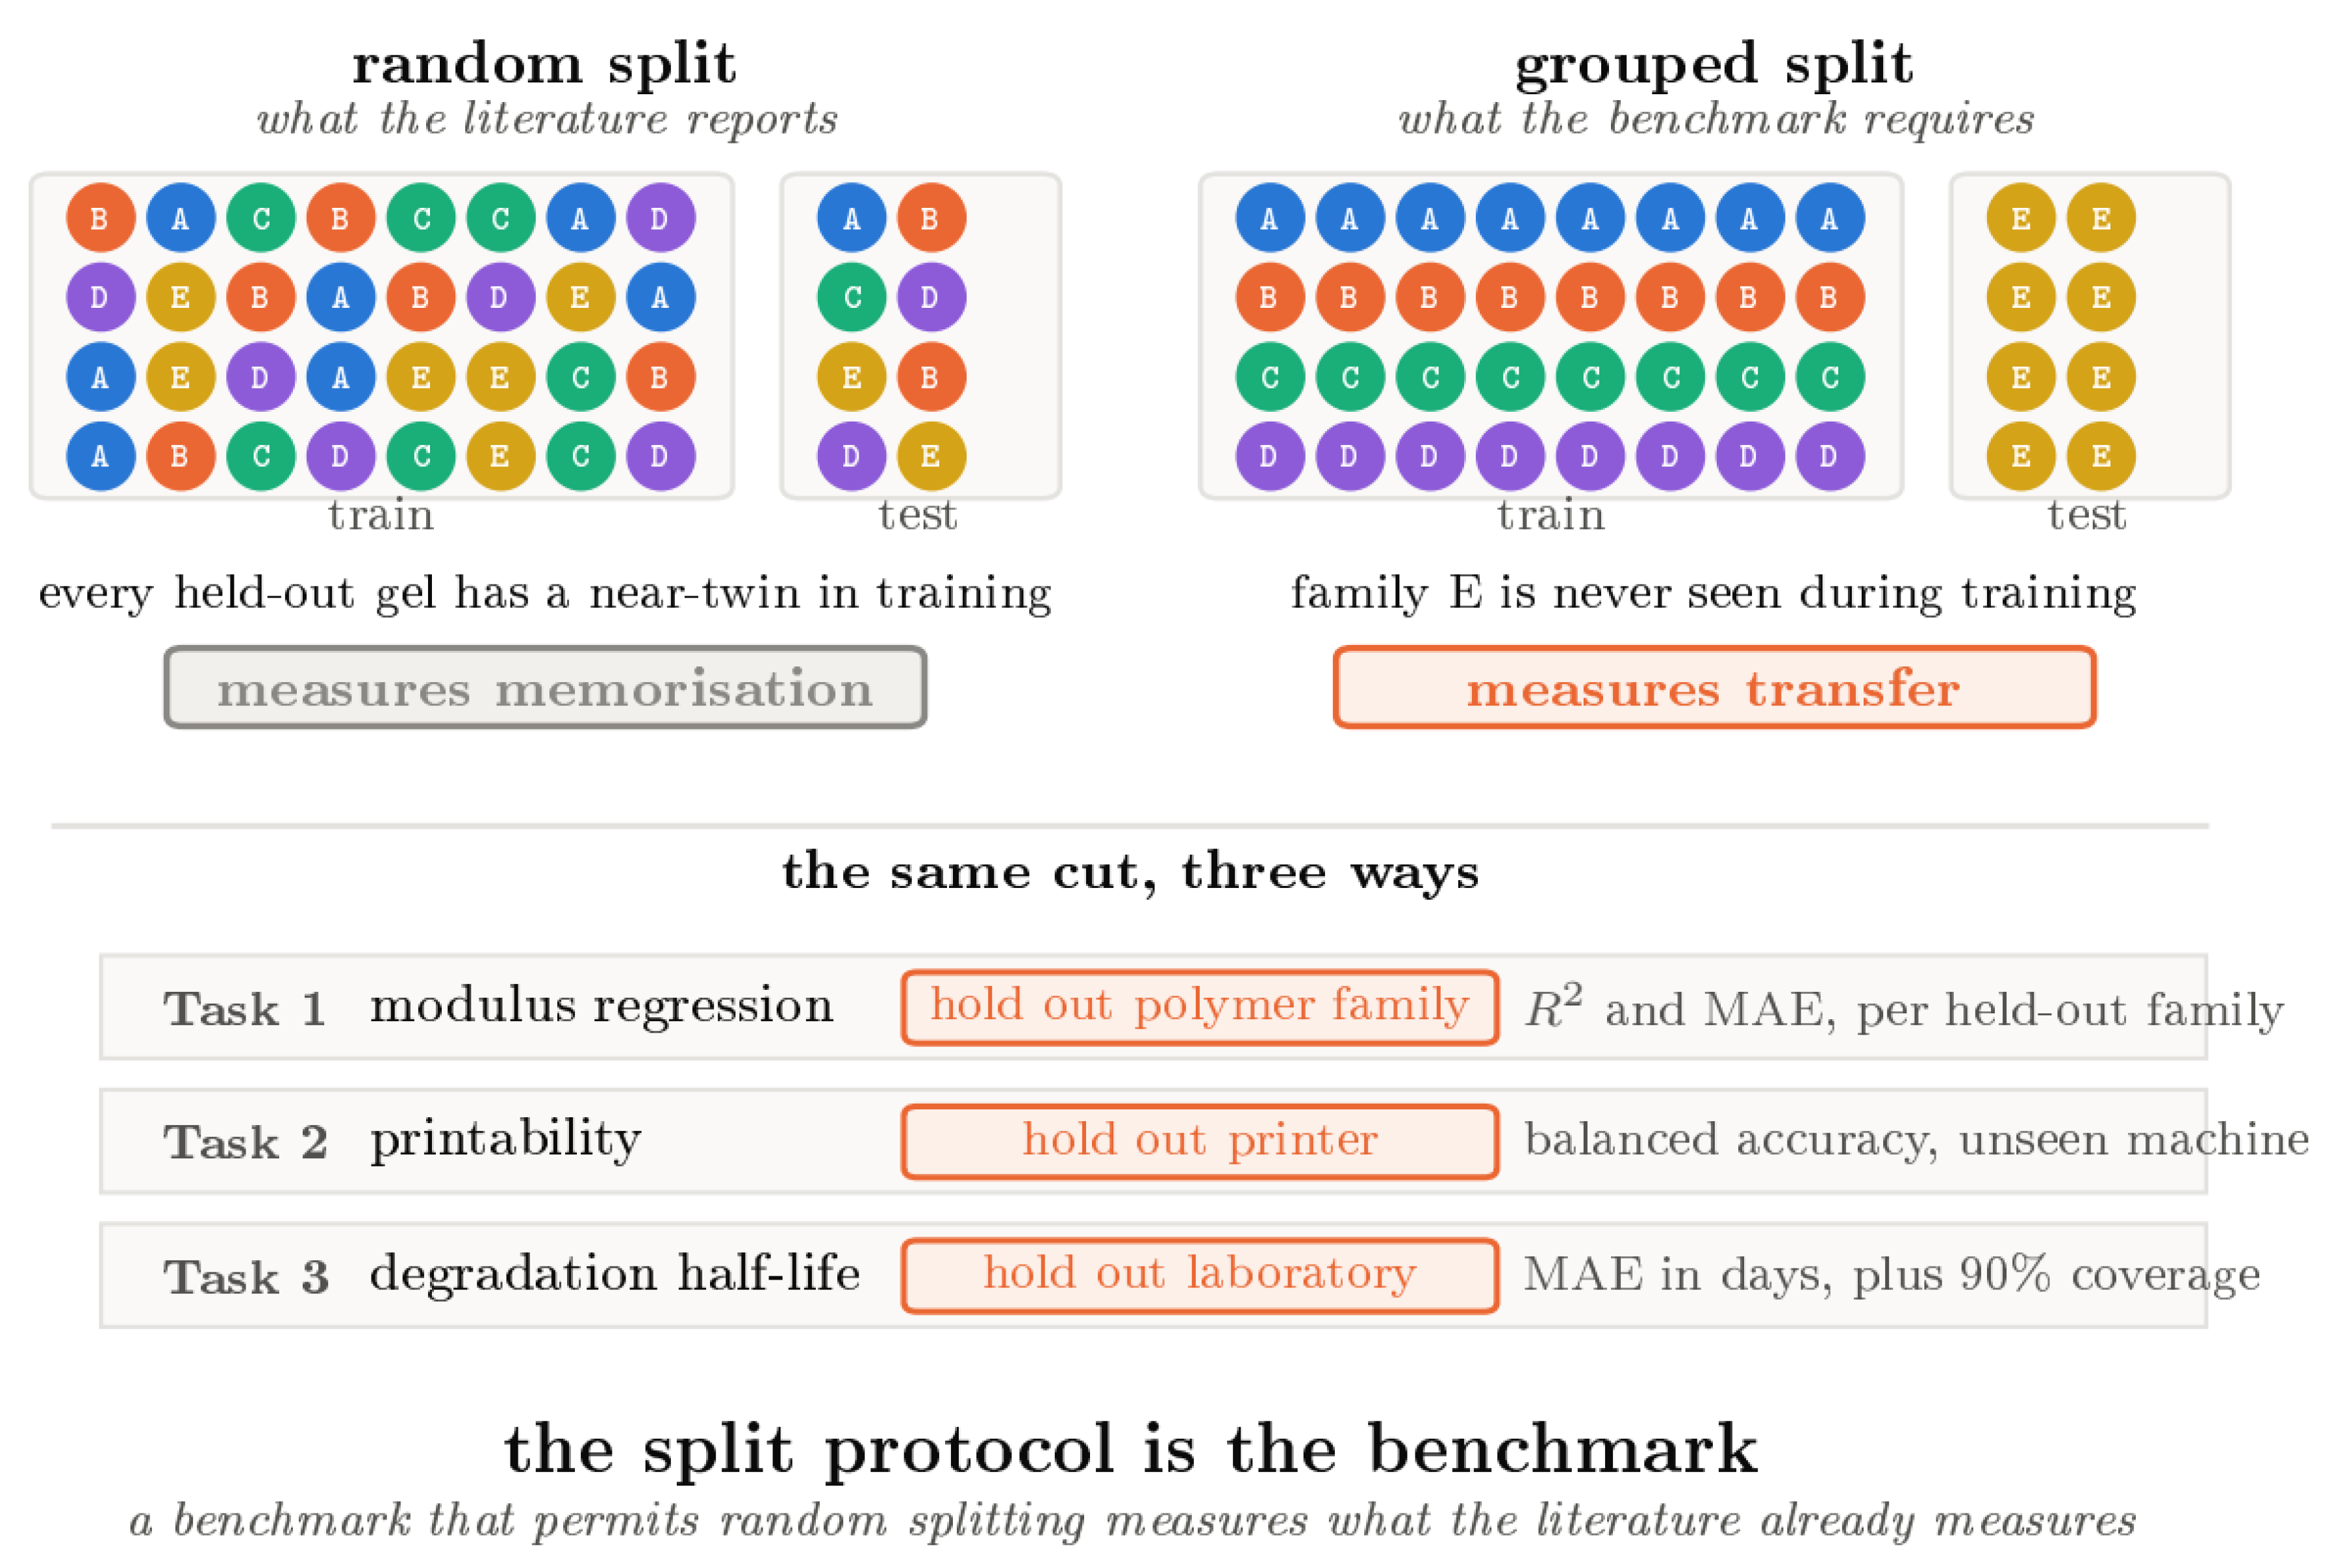

Disclaimer/Publisher’s Note: The statements, opinions and data contained in all publications are solely those of the individual author(s) and contributor(s) and not of MDPI and/or the editor(s). MDPI and/or the editor(s) disclaim responsibility for any injury to people or property resulting from any ideas, methods, instructions or products referred to in the content. |
© 2026 by the authors. Licensee MDPI, Basel, Switzerland. This article is an open access article distributed under the terms and conditions of the Creative Commons Attribution (CC BY) license.