


Abstract
Codon usage bias (CUB) in mitochondrial genomes reflects evolutionary forces such as mutation, selection, and genetic drift, yet its dynamics in early-diverging fungal lineages like Conidiobolus (Zoopagomycota) remain unclear. This study systematically analyzed mitochondrial core protein-coding genes (PCGs) from eight Conidiobolus species to elucidate the drivers of CUB and phylogenomic patterns. Nucleotide composition revealed pronounced AT richness (73.32% ± 3.38%) and low GC3 (13.40% ± 5.11%), indicating a preference for A/T-ending codons. Neutrality and ENC-GC3s plots demonstrated that natural selection, rather than mutation pressure, predominantly shaped codon bias, supported by weak GC12-GC3 correlations (slopes: 0.037–0.335) and significant ENC deviations from mutation-driven expectations. PR2-bias analysis further highlighted a strong bias toward A over T and C over G. Correspondence analysis linked major codon usage variations to GC3s, CAI, and FOP indices. Phylogenetic reconstructions based on relative synonymous codon usage (RSCU) and concatenated mitochondrial sequences revealed discordant topologies, particularly in the placement of C. polytocus and C. polyspermus, suggesting divergent evolutionary trajectories. Optimal codon analysis identified species-specific preferences dominated by A/T termini. These findings underscore natural selection as the primary force driving AT-biased mitochondrial CUB in Conidiobolus, while phylogenomic discordance highlights complex evolutionary pressures in this ecologically diverse fungal genus. This study provides foundational insights into mitochondrial genome evolution and codon adaptation mechanisms in early-diverging fungi.
1. Introduction
The genetic information encoded in DNA undergoes transcription to produce a sequence of 20 amino acids by the central dogma [1]. Among the 64 codons in DNA, 61 code for standard amino acids, while the remaining three function as termination signals for translation [2]. Most amino acids are specified by multiple synonymous codons, except for tryptophan and methionine, each represented by a single codon [3]. The redundancy in codon usage, termed degeneracy, allows for variability in the frequency of synonymous codons used by different organisms and genes, a phenomenon known as codon usage bias (CUB) [4]. The alteration of a synonymous codon does not affect the amino acid sequence due to mutations occurring in the gene’s coding region, particularly in the second or third nucleotide of the codon [5]. These synonymous mutations, referred to as ‘silent mutations,’ do not impact protein function but contribute to variations in codon usage across organisms [6]. Codon bias is influenced by mutation patterns, with certain codons being more prone to mutations [7], thereby being preserved by selection pressure [8]. Factors such as GC heterogeneity [9] and GC-biased gene conversion also play a role in shaping codon bias through local recombination rates [10]. The evolution of synonymous codons is governed by mutations, natural selection, and genetic drift [11,12], ultimately impacting gene translation efficiency and genome evolution [13]. Codon bias is ascribed to nucleotide bias [14] and the rate of point mutations [15], elucidating differences in codon usage among different species [16]. The theory of natural selection posits that synonymous mutations affecting organismal adaptability are the driving force behind variations in codon usage during genome or gene evolution [17,18].
Codon bias impacts various cellular processes, including mRNA stability, transcription, translation efficiency, accuracy, protein expression, structure, function, and cotranslational folding [19,20]. It can affect transcription levels through its influence on chromatin structure and mRNA folding, as well as regulate translation efficiency by controlling the translation elongation rate [21,22,23]. Codon bias reflects genome adaptations to transcription and translation mechanisms and is essential for studying gene molecular evolution, enabling the selection of gene sequences without changing amino acids [24,25,26]. Similar codon usage among closely related organisms may suggest horizontal gene transfer and evolutionary relationships [27,28]. Genes encoding highly expressed proteins typically use optimal codons, highlighting the value of codon optimization in genetic engineering and recombinant DNA technology to enhance protein expression [29,30]. The comprehensive analysis of codon bias, facilitated by high-throughput sequencing technology, contributes to understanding species evolution, environmental adaptation, and genetics [31,32,33]. However, the genetic characteristics of codon bias in fungal species from Zoopagomycota remain unknown.
The mitochondrial genome plays a pivotal role in cellular energy production and evolutionary studies, showcasing distinct patterns of codon usage bias (CUB) influenced by mutational pressure, natural selection, and genetic drift [34,35]. Mitochondrial genomes offer valuable insights into evolutionary processes due to their elevated mutation rates, lack of recombination, and potential co-evolution with nuclear genomes [36,37,38]. Fungi, characterized by compact genomes and uniparental inheritance, present an intriguing subject for investigating mitochondrial CUB, particularly in Zoopagomycota fungi [39]. Among the Zoopagomycota, the Conidiobolus genus, a core taxon of the Ancylistaceae family, stands out. Conidiobolus species are widely distributed in various habitats, from soils to plant residues, across temperate to tropical regions [40,41,42,43]. For instance, C. mycophagus is an obligate nematode parasite, C. polytocus infects a broad range of hosts, C. taihushanensis has a GC-rich genome and is saprophytic, and C. polyspermus is a lignin-degrading fungus [44,45,46]. Moreover, C. rhodosporus and C. chloridiosporus exhibit strong adaptability to adverse conditions, while C. lichenicola is a unique lichen symbiont. The diverse morphology, life history, and ecological roles of Conidiobolus fungi encompass various survival strategies, including pathogen parasitism, saprophytic decomposition, symbiotic relationships, and stress adaptation, offering a comprehensive research model for unraveling the evolutionary mechanisms underlying codon usage preferences [44,45,46]. However, the exploration of mitochondrial CUB in Conidiobolus and even Zoopagomycota remains insufficient [39,47].
In this study, we systematically analyzed and compared the codon usage characteristics in the mitochondrial core protein-coding genes of eight Conidiobolus species: C. heterosporus, C. taihushanensis, C. rhysosporus, C. polytocus, C. lichenicola, C. polyspermus, C. mycophagus, and C. chlamydosporus. A phylogenetic tree of Conidiobolus species was constructed based on the relative synonymous codon usage of mitochondrial core genes and compared with a tree constructed using core protein-encoding gene sequences. This study presents the first comprehensive analysis of mitochondrial CUB in Conidiobolus, utilizing mitochondrial genome sequences from diverse species to elucidate the roles of mutational bias, natural selection, and phylogenetic inertia.
2. Materials and Methods
2.1. Sequence Processing
Eight complete mitochondrial genomes from the Conidiobolus genus are accessible in the National Center for Biotechnology Information (NCBI) database (https://www.ncbi.nlm.nih.gov/nuccore/, accessed on 1 April 2025). The core protein-coding genes were extracted using the following accession numbers: NC_040967, MZ436173, MZ286627, MZ436172, MZ436169, MZ436171, MZ436170, and MZ436168. To minimize stochastic effects in codon usage analysis, genes shorter than 100 codons (300 nucleotides) were excluded, resulting in 11 common core protein-coding genes for subsequent analysis in each Conidiobolus mitochondrial genome: atp6, cob, cox1, cox2, cox3, nad1, nad2, nad3, nad4, nad5, and nad6 [48].
2.2. Codon Usage Indices
The GC3s parameter determines the proportion of codons containing guanine and cytosine at the third synonymous positions, excluding methionine, tryptophan, and termination codons [49]. The codon adaptation index (CAI) is a widely used metric for assessing bias towards codons favored in highly expressed genes, with a range of 0 to 1.0 indicating the frequency of synonymous codon usage. The codon bias index (CBI) is a standard for evaluating gene expression, reflecting the prevalence of optimal codons in highly expressed genes. The frequency of optimal codons (FOP) is determined by the ratio of optimal codons to total synonymous codons in a gene. The effective number of codons (ENC) indicates the diversity of codons used in a gene, ranging from 20 to 61. An ENC value of 20 implies the use of only one codon per amino acid, while 61 suggests equal usage of all codons. ENC values below 35 indicate strong codon usage bias, whereas values above 35 indicate a weak preference for codon usage. The Relative Synonymous Codon Usage (RSCU) was determined by analyzing the amino acids encoded by the same codons and their respective probabilities. RSCU values >1 indicate positive codon bias, <1 indicate negative bias, and =1 indicate random usage. The general average hydropathicity (GRAVY) values were calculated by summing the hydropathy values of all amino acids in polymerase gene sequences and multiplying by the number of residues, ranging from −2 to 2, where positive values represent hydrophobic and negative values represent hydrophilic proteins. The aromaticity (AROMO) value reflects the frequency of aromatic amino acids (Phe, Tyr, Trp). These values were all computed using CodonW 1.4.2 [50].
2.3. Neutrality Plot Analysis
The neutrality plot (GC12 vs. GC3) elucidates the equilibrium between mutation and selection in codon bias formation. GC12 represents the average GC content at the first and second codon positions (GC1 and GC2), while GC3 indicates the GC content at the third position. A strong statistical correlation between GC12 and GC3 implies that mutation pressure is the primary evolutionary force, whereas the absence of correlation suggests that natural selection is the predominant driving force in the species being studied.
2.4. ENC-GC3s Plot Analysis
The ENC-GC3s plot, commonly used to evaluate the influence of mutation versus other factors like natural selection on codon usage in a gene, displays ENC values on the y-axis and GC3s values on the x-axis. A specific formula was employed to derive the expected curve on this plot. Clustering of data points around this curve suggests mutation pressure as the main determinant of codon bias. Conversely, significant deviation from the expected curve indicates the involvement of additional factors, such as natural selection, in shaping codon bias.
Further analysis was conducted on the discrepancies between the anticipated and observed values of ENC, indicated by the ENCRatio index, which quantifies the degree of deviation between these values.
2.5. PR2-Bias Plot Analysis
We performed the Parity Rule 2 bias (PR2-Bias) plot analysis by comparing the ratio of A3/(A3 + U3) to G3/(G3 + C3). The central point of the plot signifies A=T and C=G, denoting the absence of usage bias in the codon, with the vectors emanating from this point illustrating the extent and direction of the gene bias.
2.6. Correspondence Analysis
Correspondence analysis (COA) is a prevalent multivariate statistical technique for studying codon usage patterns. By projecting all genes into a 59-dimensional hyperspace (excluding Met and Trp out of the total 61 codons), this method facilitates the examination of primary trends in codon usage variability within the core CDS of Conidiobolus. Codons are then positioned along the axes according to their RSCU values.
2.7. Determination of Optimal Codons
Genes were arranged based on their Effective Number of Codons (ENC) values, with 10% of genes selected from both extremes to establish high and low expression gene pools. High expression codons were distinguished by computing the Difference value (D-value) between the Relative Synonymous Codon Usage (RSCU) of the two pools (ΔRSCU), with codons having a ΔRSCU > 0.08 identified as high expression. Codons surpassing an RSCU of 1 were deemed high-frequency, while the optimal codon was characterized by meeting the criteria of ΔRSCU > 0.08 and RSCU > 1.
2.8. Phylogenetic Analysis
Phylogenetic relationships among Conidiobolus species were assessed through the comparison of codon usage and mitochondrial sequence-based methods. RSCU values of eight Conidiobolus species were analyzed using SPSS v19.0 software, employing hierarchical clustering to construct a relationship tree. Specifically, RSCU values for each species (an 11 genes × 59 synonymous codons matrix) were standardized by converting to Z-scores across genes to minimize scale effects. A Euclidean distance matrix was then calculated to quantify pairwise dissimilarity in codon usage patterns. Finally, a dendrogram was generated using the unweighted pair group method with arithmetic mean (UPGMA) clustering algorithm in SPSS v19.0. Phylogenetic trees were generated from combined mitochondrial gene datasets following established protocols [51,52]. Mitochondrial genes were aligned using MAFFT v7.037 [53], concatenated with Sequence Matrix v1.7.8 [54], and evaluated for conflicts through a partition homogeneity test. Partition Finder 2.1.1 determined the optimal model for partitioning and evolution [55]. Bayesian inference analysis was conducted using MrBayes v3.2.6 [56], with two independent 2 × 10⁶ generation chains and sampling every 100 generations. Stationarity was considered achieved when the sample size exceeded 100, and the scale reduction factor approached 1.0. The initial 25% of samples were discarded as burn-in, and the remaining trees were used to calculate Bayesian posterior probabilities in a 50% majority-rule consensus tree.
3. Results
3.1. Nucleotide Composition of Conidiobolus Core PCGs
Eleven mitochondrial core protein-coding genes (PCGs) were chosen from eight Conidiobolus species for codon usage analysis. The average length of these core PCGs ranged from 354 bp to 1966 bp, with nad3 being the shortest and nad5 being the longest. Among the 11 core PCGs, nine showed variations in sequence length across the Conidiobolus species, while cox3 and nad3 maintained consistent lengths across all species. The nad2 gene displayed the most significant length difference, with a 294 bp gap between the longest and shortest sequences. Analysis of base composition in the 11 core PCGs revealed a predominance of A bases at 37.06%, followed by T bases at 36.26%. G and C bases were less abundant, averaging 14.70% and 11.98%, respectively. The GC content of the 11 core PCGs ranged from 20.09% to 32.27%, with nad3 having the lowest GC content and cox1 having the highest.
3.2. Codon Usage Analysis
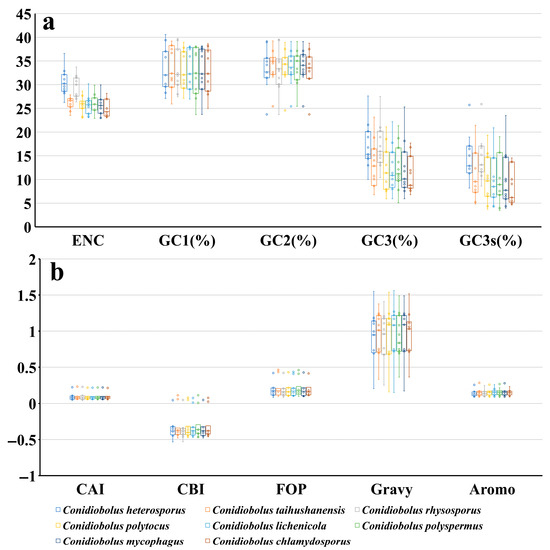
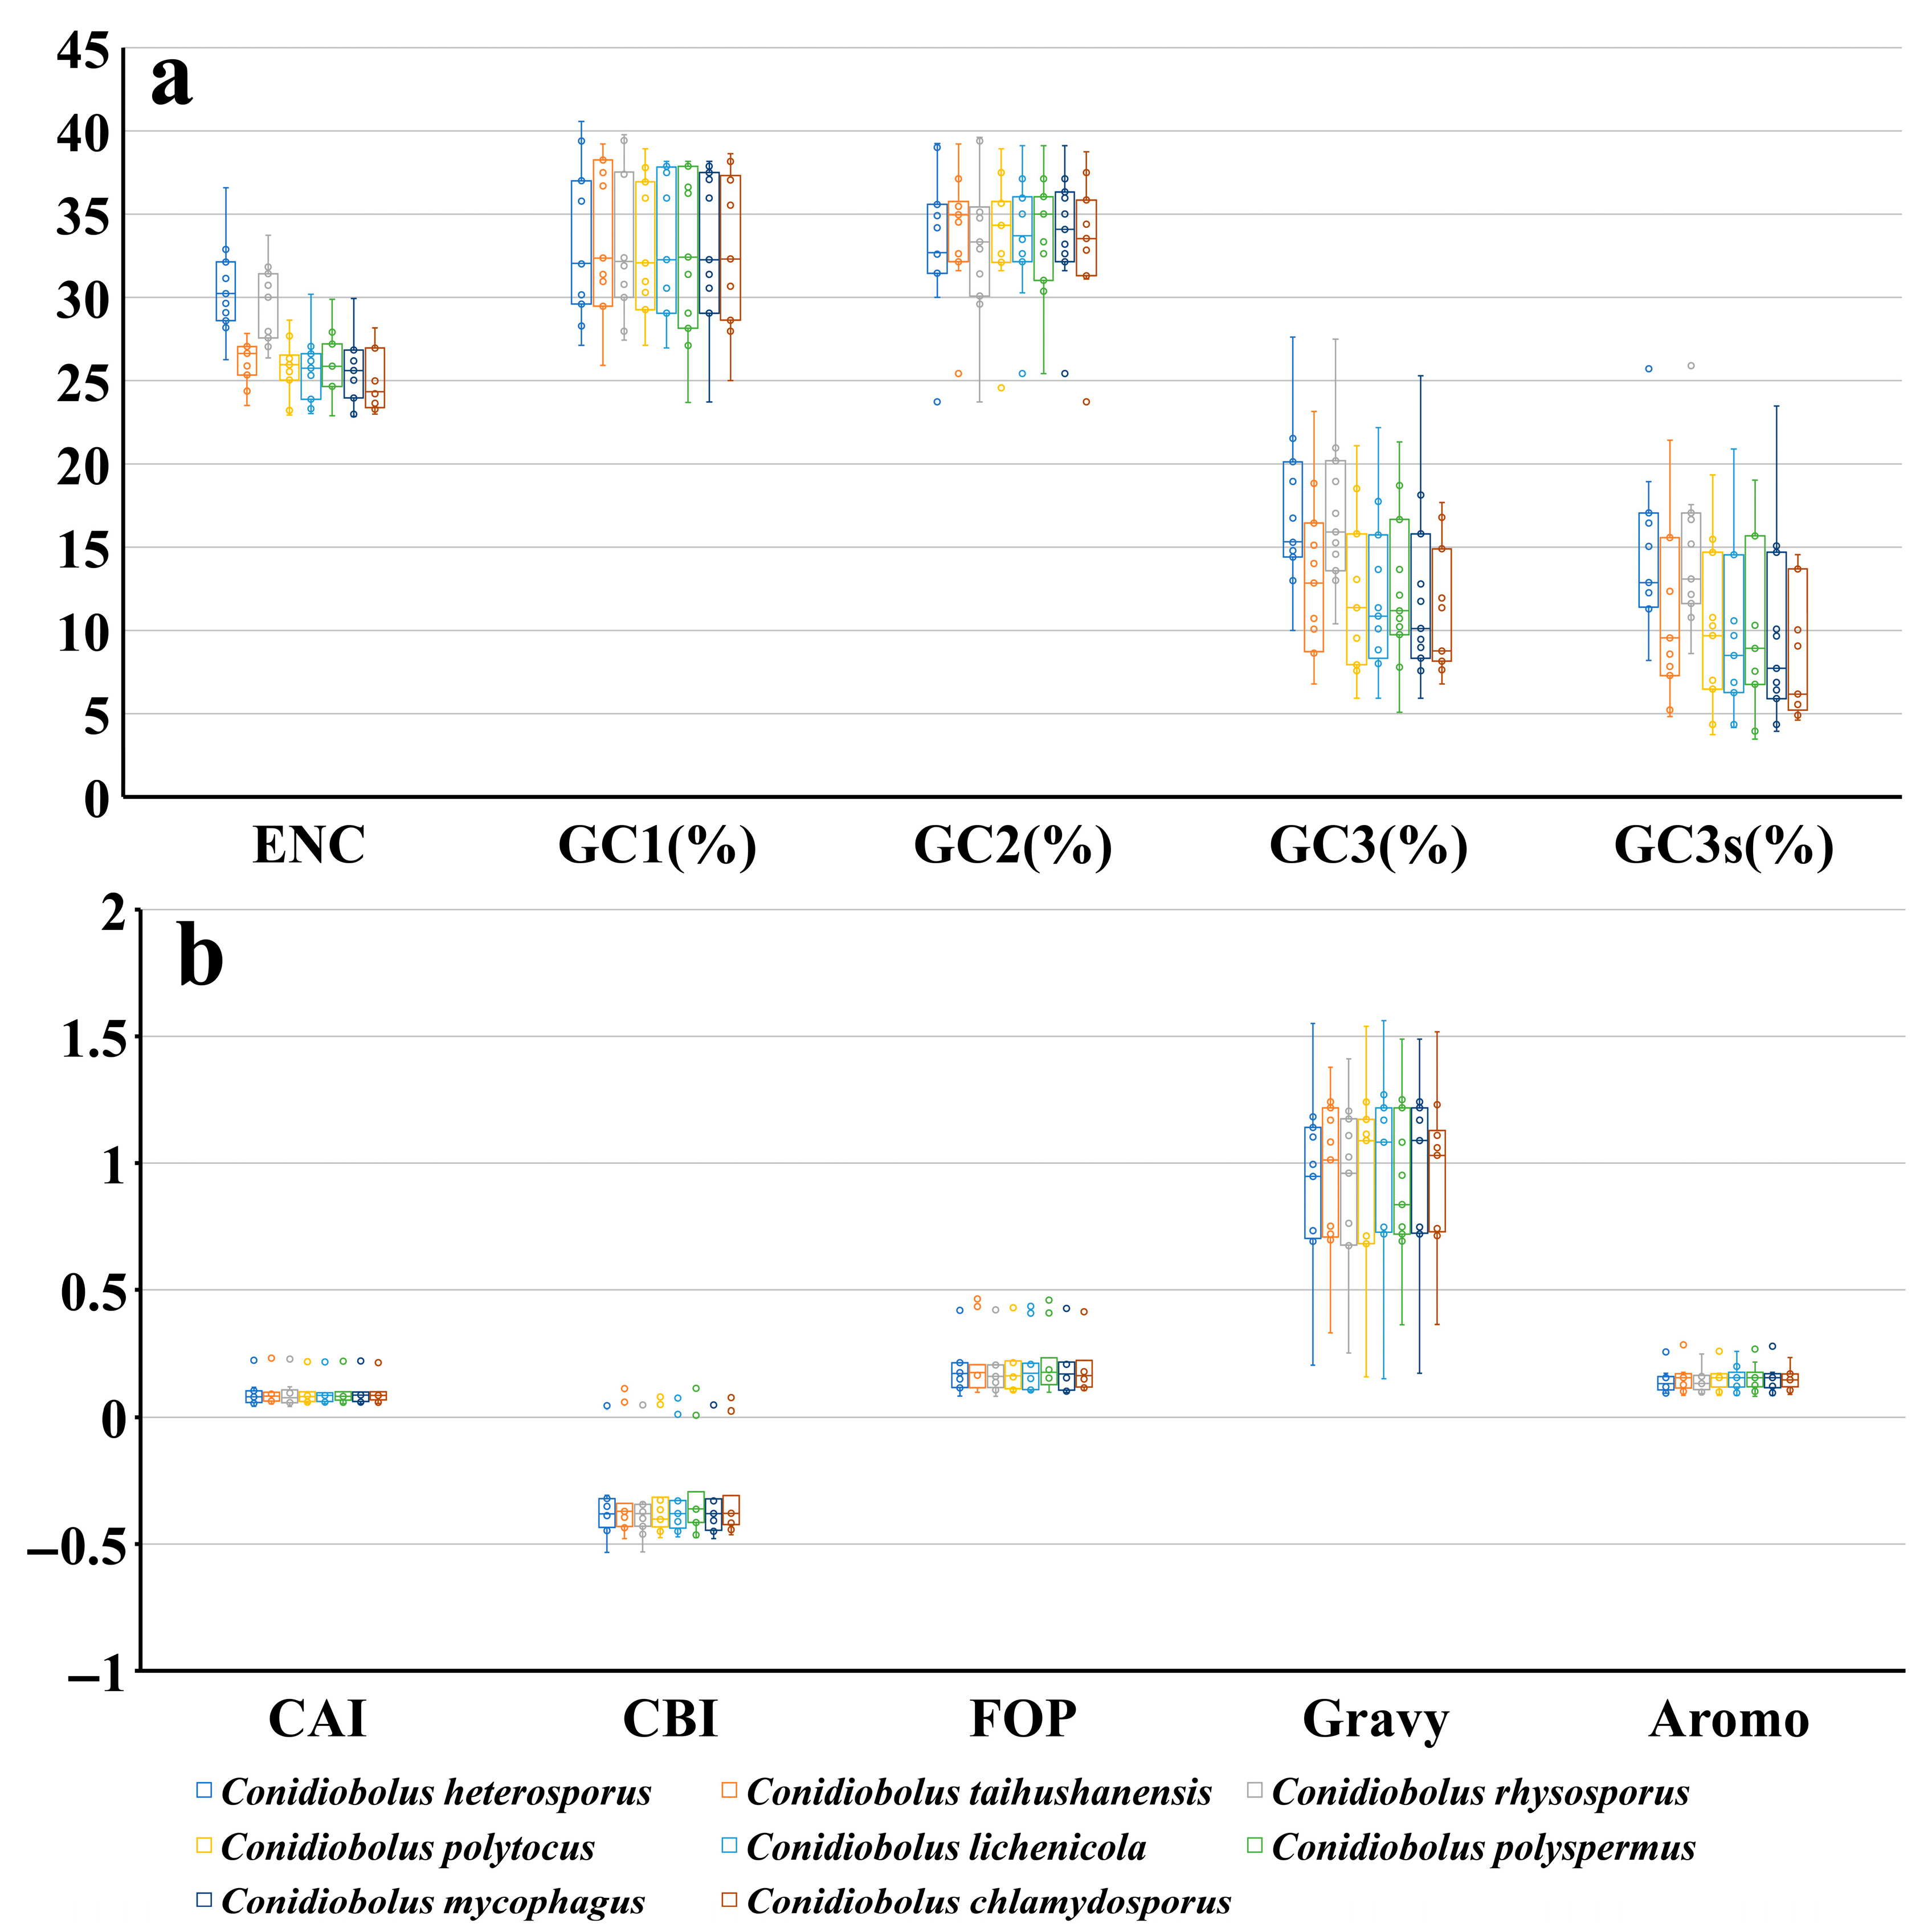
The GC contents of GC1, GC2, and GC3 in the 11 core protein-coding genes (PCGs) of 8 Conidiobolus species were 34.06%, 33.58%, and 13.40%, respectively (Figure 1a). The average GC3 value of the 11 PCGs in these species was 13.40%, indicating a preference for A or T bases at the end of mitochondrial core PCG codons in Conidiobolus. Analysis of the A3, T3, G3, and C3 indexes of the 11 core PCGs revealed a higher tendency for codons to end with A, followed by T, G, and C, with values of 57.78%, 28.82%, 6.76%, and 6.64%, respectively. Calculation of the Codon Adaptation Index (CAI) values for the 11 core PCGs in the 8 Conidiobolus species showed a range from 0.052 to 0.226 (Figure 1b). Notably, nad4 exhibited the lowest CAI value, whereas nad6 displayed the highest, indicating a pronounced codon bias in the nad4 gene. CAI values were uniformly low across all species, ranging from 0.052 to 0.226 (Figure 1b). C. taihushanensis and C. polyspermus tended to have relatively higher CAI values, while C. heterosporus has low CAI value, indicating significant codon bias in its mitochondrial core PCGs. The Codon Bias Index (CBI) values of the 11 core PCGs range from −0.469 to 0.076, with nad4 displaying the lowest and nad6 the highest values. Within Conidiobolus species, CBI values range from −0.359 to −0.305, with C. rhysosporus having the lowest and C. polyspermus the highest values. The Frequency of Optimal Codons (FOP) values among the 11 core PCGs range from 0.101 to 0.438, with nad4 having the lowest and nad6 the highest values. C. rhysosporus exhibits the lowest FOP value among Conidiobolus species, while C. polyspermus has the highest. The Grand Average of Hydropathicity (GRAVY) values for the 11 core PCGs in Conidiobolus species indicate that all are hydrophobic. The Average Range of Molecular Orientation (AROMO) values range from 0.087 to 0.260, with nad6 having the highest and atp6 the lowest value. AROMO values exhibit minimal variation among different Conidiobolus species, with an average of 0.146.
Figure 1.
Codon usage indicators of 11 mitochondrial core protein coding genes in different Conidiobolus strains. (a) and (b) respectively express different indicators. Horizontal representation of median in box plot.
3.3. Codon Usage Correlation Analysis
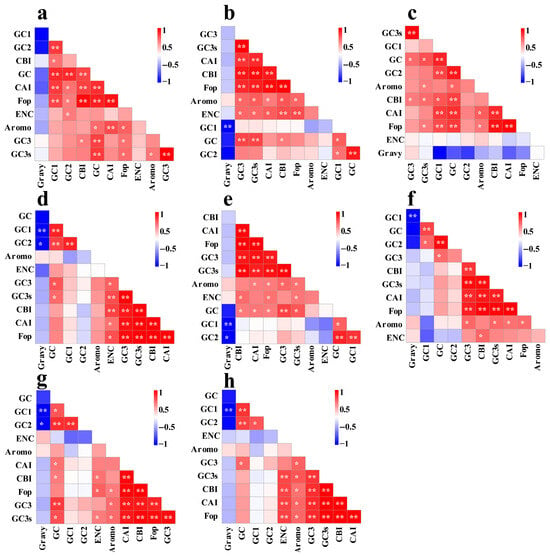
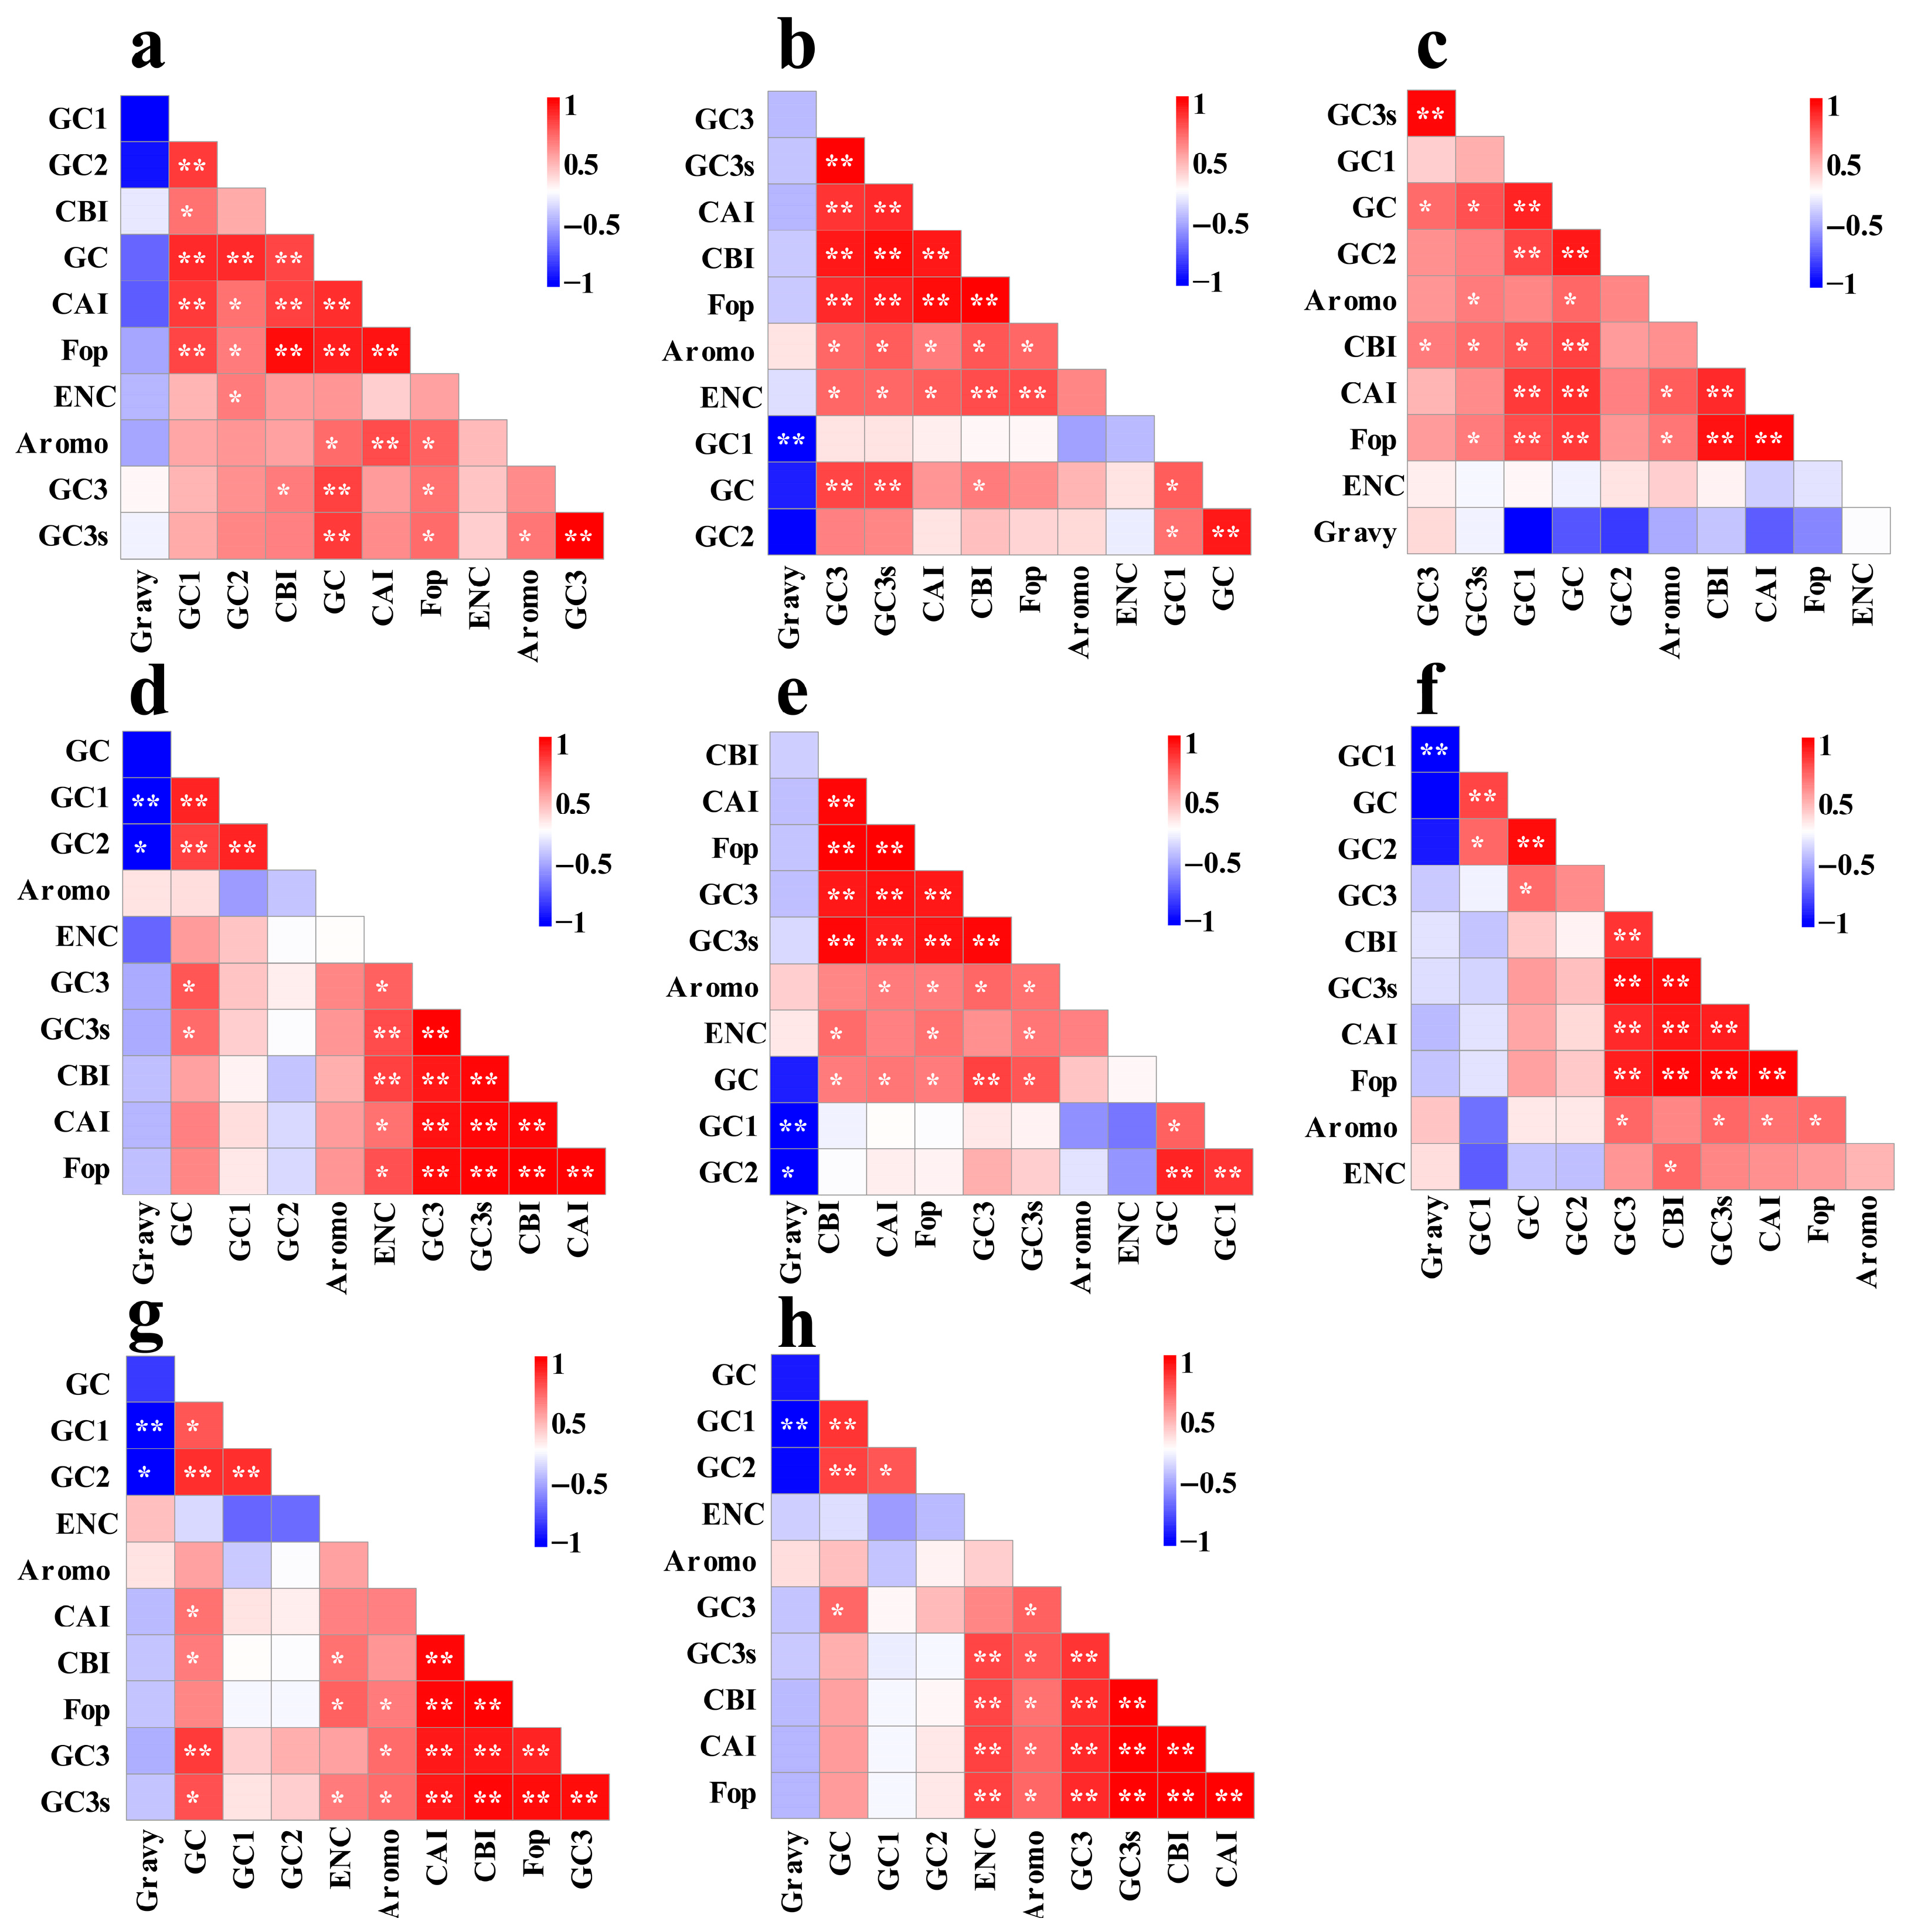
The GC1 content in mitochondrial codons exhibited a significant correlation with GC2 and overall GC content across all eight Conidiobolus species, indicating its influence on codon usage in Conidiobolus mitochondrial protein-coding genes (PCGs) (Figure 2). Additionally, a significant negative correlation was observed between GC1 content and Gravy values in six out of eight Conidiobolus species. The GC2 content was significantly associated with the species’ overall GC content, suggesting its impact on the species’ GC composition. Furthermore, GC3 content showed significant associations with the Codon Bias Index (CBI), GC, and GC3s indices in the eight Conidiobolus species. The GC content of mitochondrial codons was significantly correlated with the Codon Adaptation Index (CAI), CBI, and Fop index in four out of the eight Conidiobolus species (p < 0.05). Moreover, significant correlations were found between the CAI index and the CBI and FOP indices in all eight Conidiobolus species (p < 0.05).
Figure 2.
Pearson’s correlation analysis heatmap of different codon usage indicators of 8 Conidiobolus strains. The color of the color block changes from blue to red, indicating that the correlation index is increasing. One asterisk indicates a significant correlation between different indicators at the p < 0.05 level, while two asterisks indicate a significant correlation between different indicators at the p < 0.01 level. The 8 Conidiobolus species are C. heterosporus, C. taihushanensis, C. rhysosporus, C. polytocus, C. lichenicola, C. polyspermus, C. mycophagus, and C. chlamydosporus from (a–h).
3.4. Neutrality Plot Results
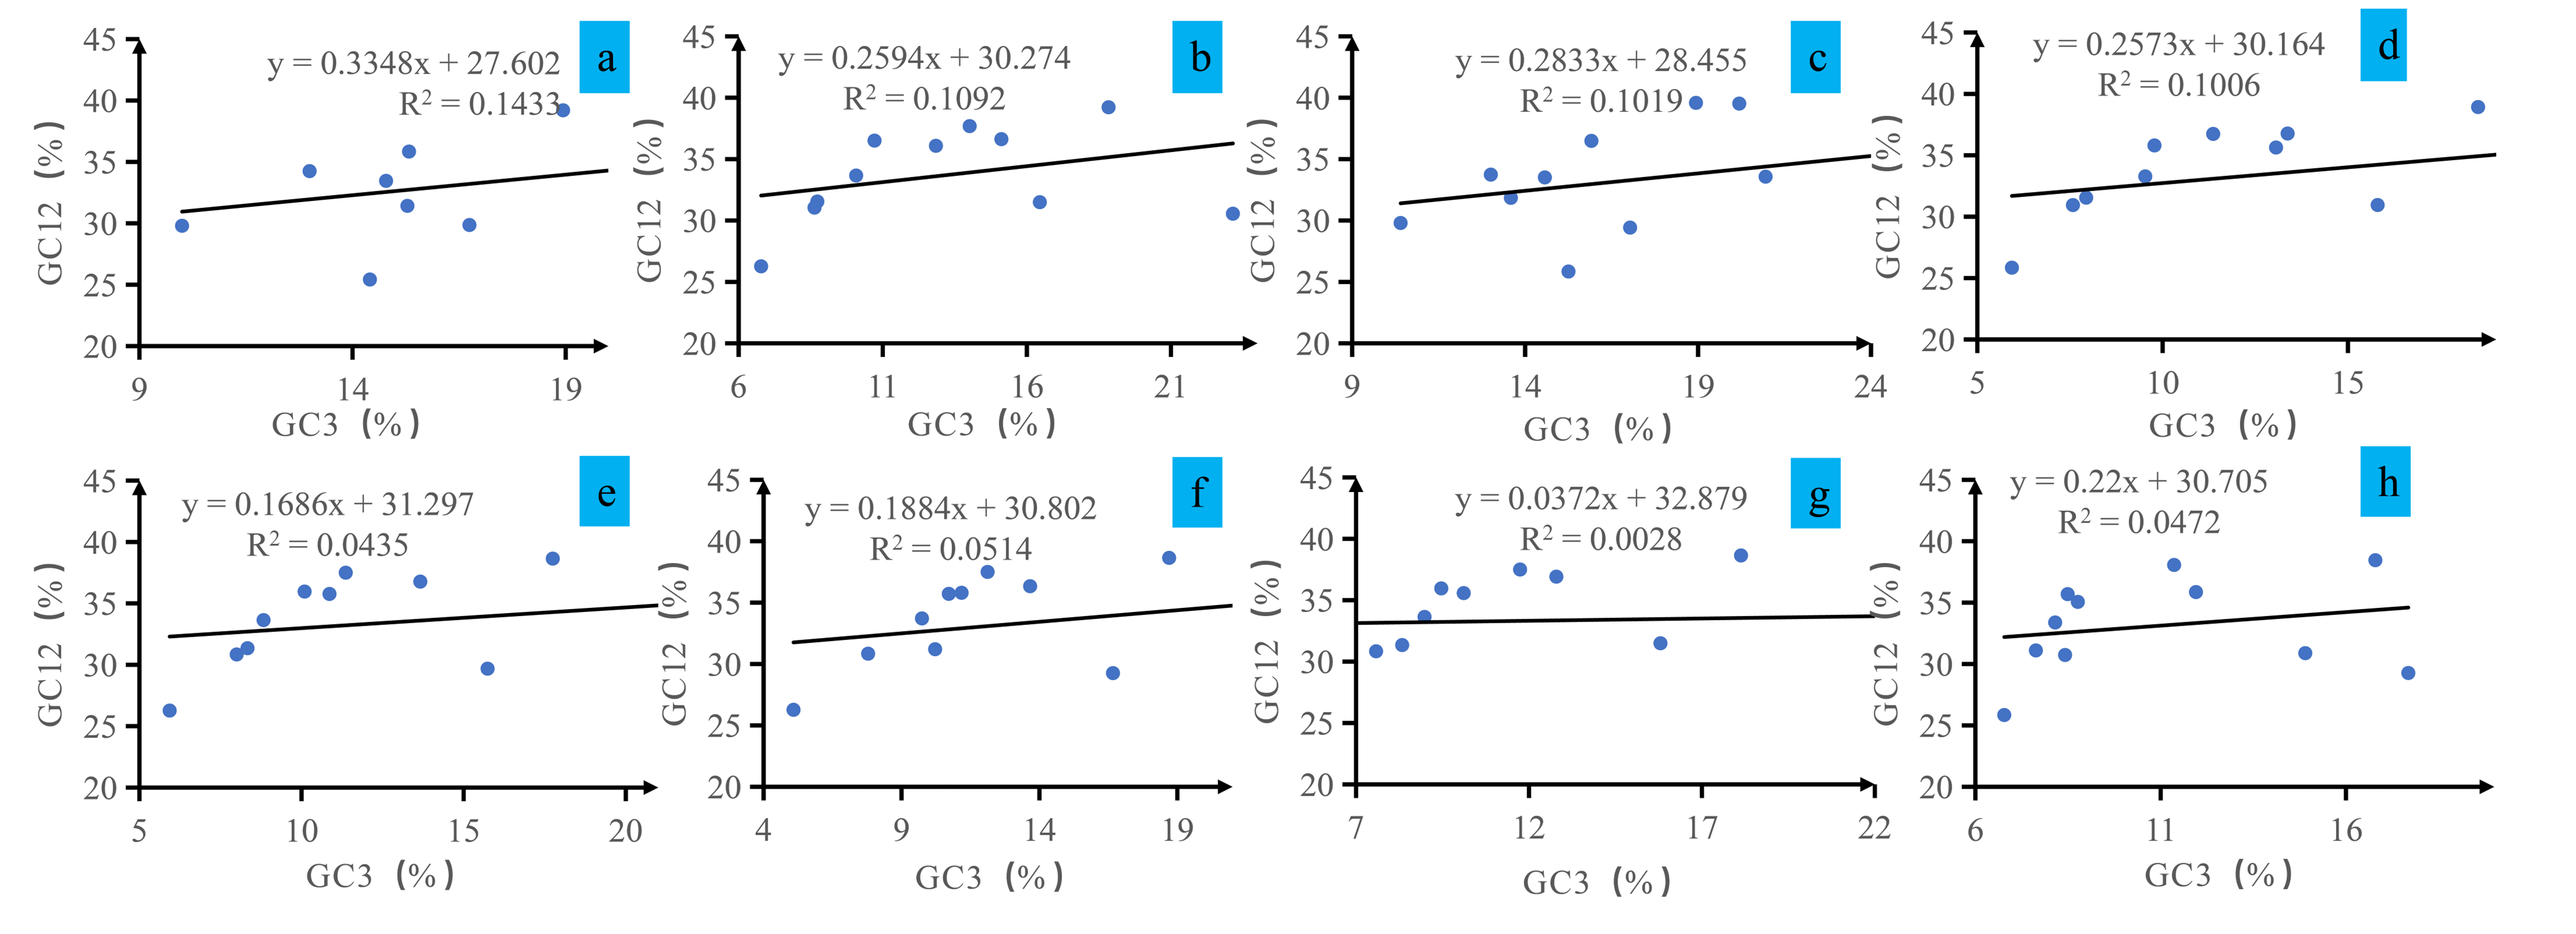
The relationship between GC12 and GC3 in Conidiobolus mitochondrial codons was examined through neutrality plot analysis (Figure 3). The GC12 content varied from 25.42% to 39.90%, while the GC3 content ranged from 5.08% to 27.62%, demonstrating significant variability. Regression analysis indicated slopes between 0.037 and 0.335, suggesting a weak positive association between GC12 and GC3 content. The R2 values of the regression lines fell within the range of 0.0028 to 0.1433. The weak correlation between GC12 and GC3 indicates that variation in codon usage cannot be explained by GC3-driven mutational pressure alone. This deviation from neutral expectations is consistent with the influence of additional factors, such as natural selection on synonymous codons or functional constraints linked to amino acid composition in the highly AT-rich mitochondrial background.
Figure 3.
Neutrality plot analysis of GC12 and the third codon position (GC3) for the entire coding DNA sequence of 8 Conidiobolus strains. The 8 Conidiobolus species are C. heterosporus, C. taihushanensis, C. rhysosporus, C. polytocus, C. lichenicola, C. polyspermus, C. mycophagus, and C. chlamydosporus from (a–h).
3.5. ENC-GC3s Plot Results
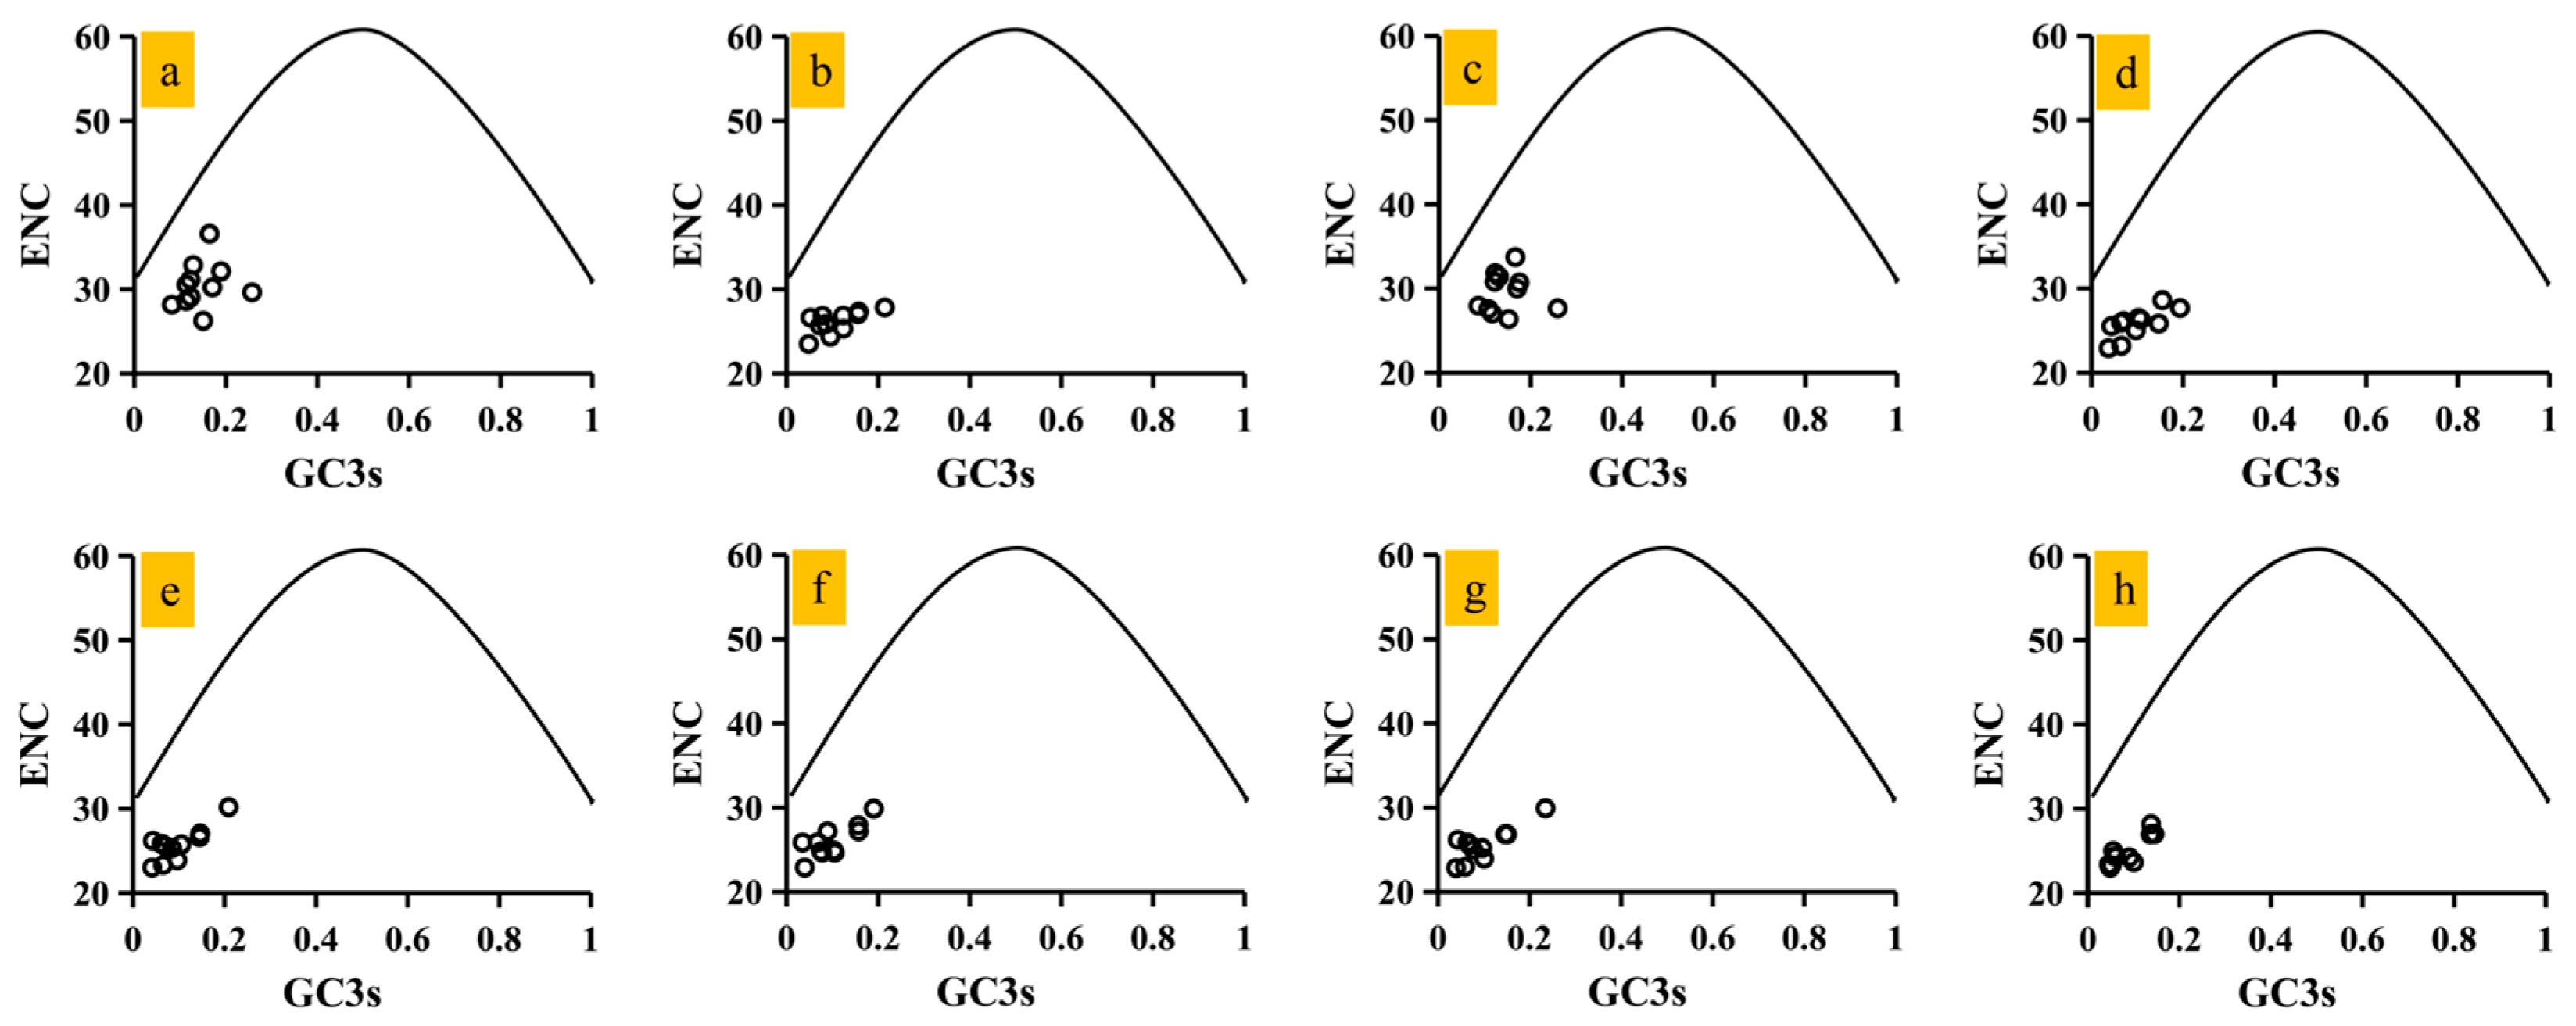
The mean effective number of codons (ENC) for the 11 core protein-coding genes (PCGs) detected fell within the range of 24.83 to 30.32, with an average ENC value of 26.80 (Figure 1a). All core PCGs exhibited ENC values below 35, indicating significant codon usage bias. Notably, the ENC values for the eight Conidiobolus species varied from 24.85 to 30.48, highlighting a distinct preference for codon usage in Conidiobolus mitochondrial genes. An ENC plot was constructed to evaluate the impact of GC3s on codon bias in Conidiobolus (Figure 4). The observation that all data points fall below the expected curve suggests that mutational pressure (as reflected by GC3s) is not the sole determinant of codon bias. The significant deviation (ENC~Ratio~: 13.13–43.92%) could be attributed to the combined effects of natural selection, amino acid conservation, and/or strand-specific mutation biases that are characteristic of AT-rich mitochondrial genomes. The ENCRatio was calculated for mitochondrial core genes in Conidiobolus to measure the difference between observed and expected ENC values. The average ENCRatio values for all core PCGs ranged from 13.13% to 43.92% (Figure S1), indicating lower observed values compared to the expected values, with GC3s values influencing the expected ENC values.
Figure 4.
ENC-GC3 plot analysis of 11 core PCGs in 8 Conidiobolus strains. The solid line represents the expected curve when codon usage bias is affected only by mutation pressure. Circles represent the data points of 11 PCGs. The 8 Conidiobolus species are C. heterosporus, C. taihushanensis, C. rhysosporus, C. polytocus, C. lichenicola, C. polyspermus, C. mycophagus, and C. chlamydosporus from (a–h).
3.6. PR2-Bias Plot Results
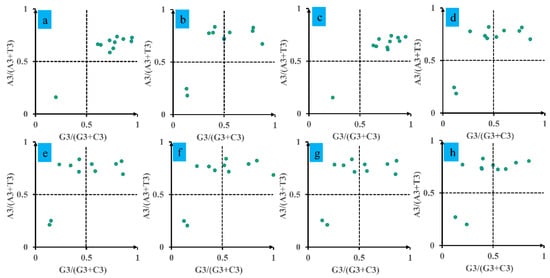
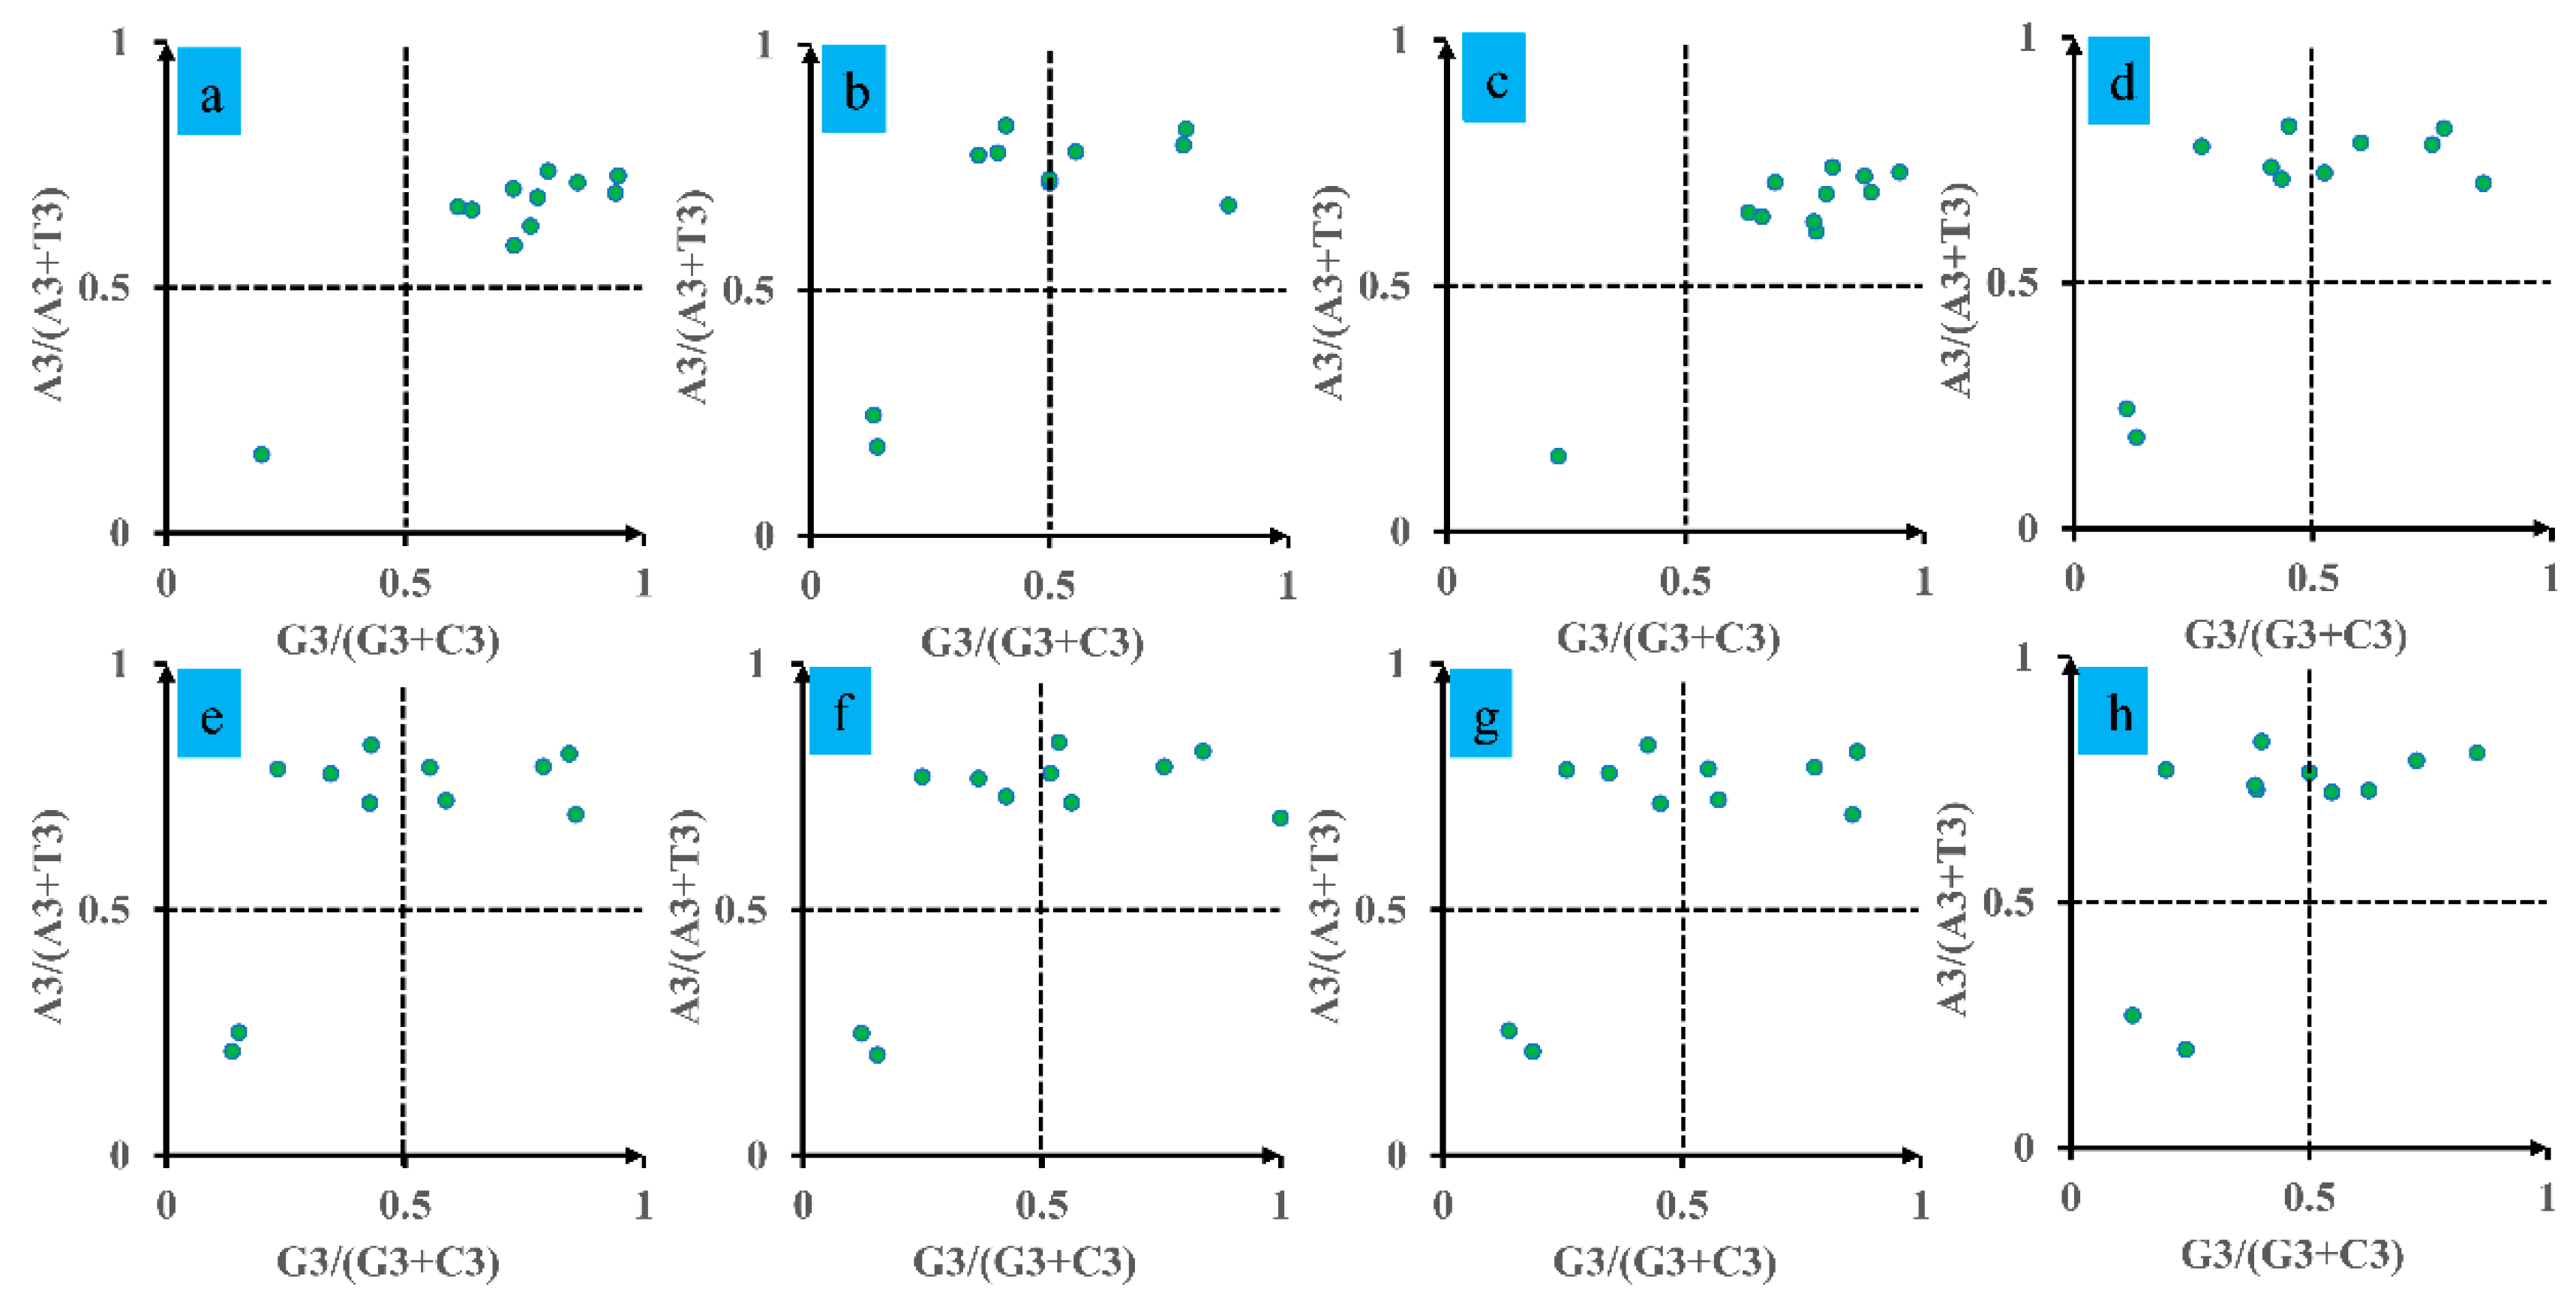
An analysis using a Parity Rule 2 (PR2) plot was performed to evaluate biases in Conidiobolus mitochondrial genes (Figure 5). The plot, divided into four quadrants with axes centered on 0.5, showed a predominant clustering of data points for the eight Conidiobolus species in the first and second quadrants, indicating a pronounced preference for A over T. Notably, no data points were observed in the fourth quadrant, which signifies a bias towards T over A and G over C. These results suggest that factors such as natural selection play a significant role in shaping codon bias in Conidiobolus species.
Figure 5.
Parity Rule 2 (PR2) plot analysis of 11 core PCGs in 8 Conidiobolus strains. The 8 Conidiobolus species are C. heterosporus, C. taihushanensis, C. rhysosporus, C. polytocus, C. lichenicola, C. polyspermus, C. mycophagus, and C. chlamydosporus from (a–h).
3.7. Correspondence Analysis Results
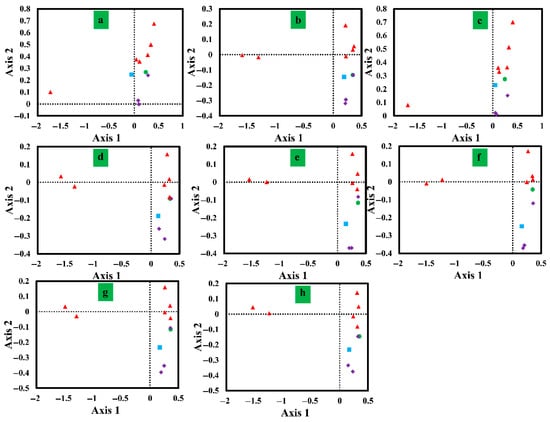
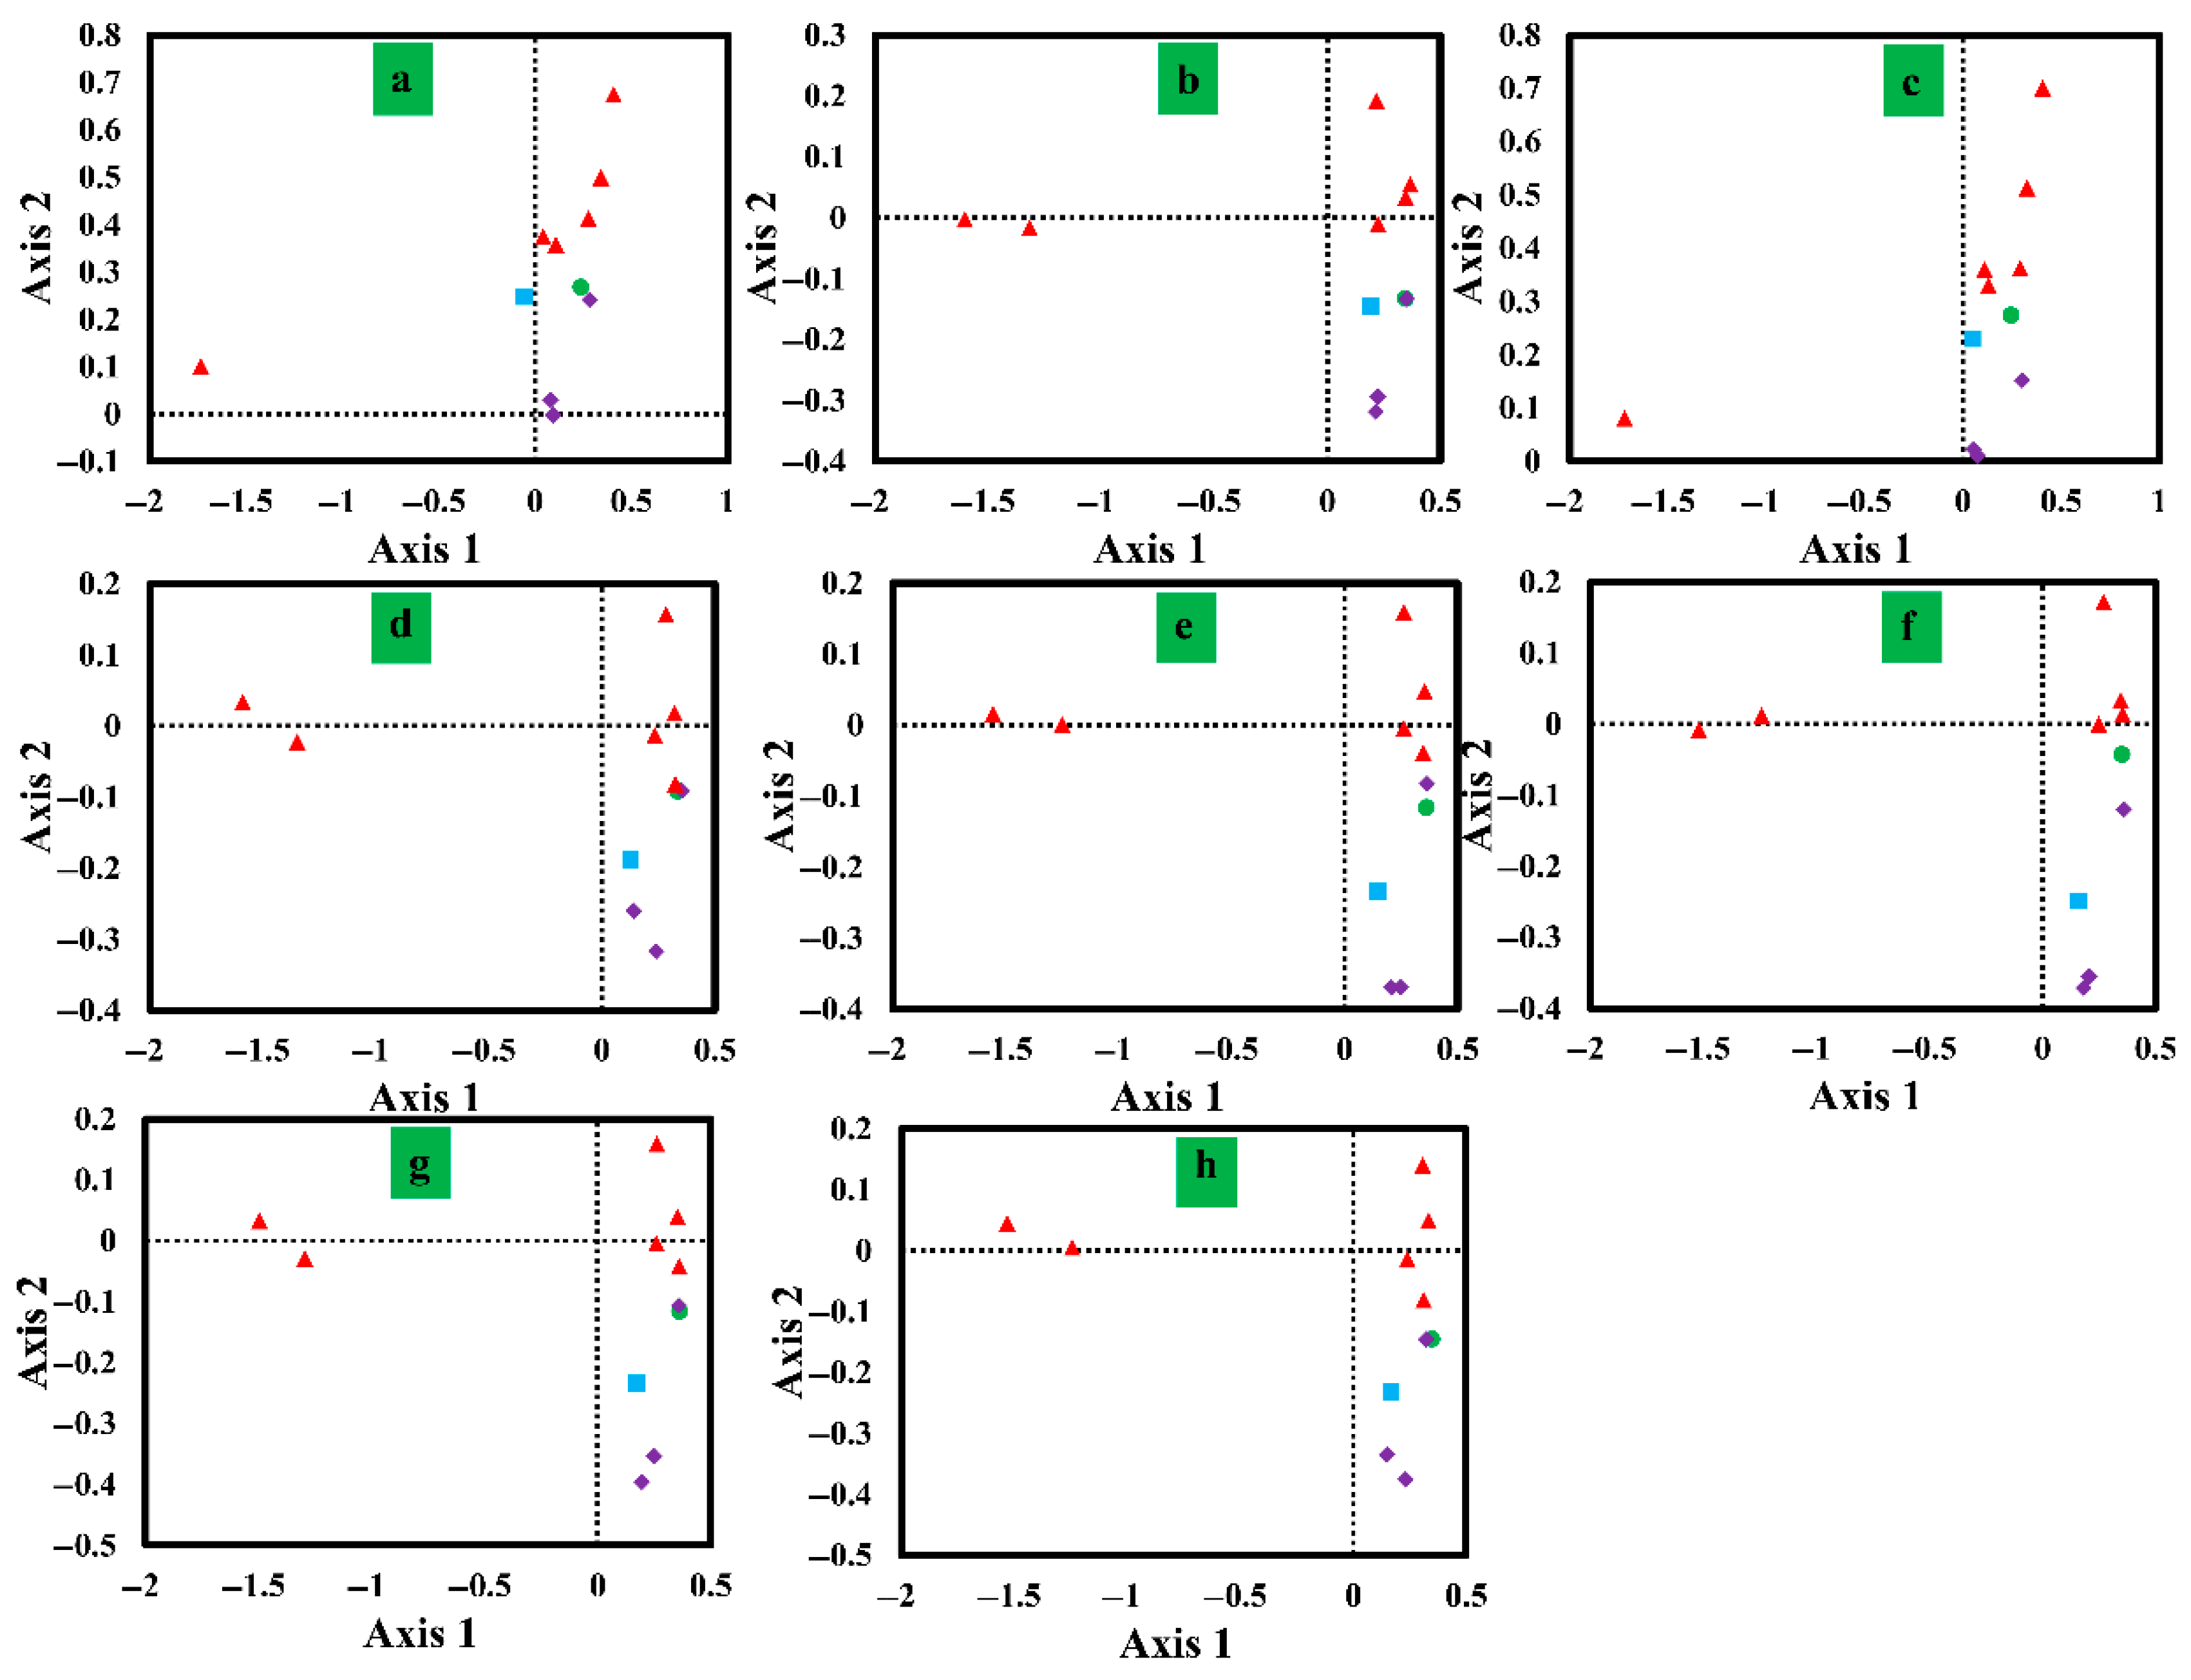
Correspondence analysis was performed on the Relative Synonymous Codon Usage (RSCU) values of mitochondrial genes in eight Conidiobolus species (Figure 6). Axis 1 was the primary source of variance, explaining 58.06% of the variance, followed by axis 2 (8.99%), axis 3 (7.38%), and axis 4 (3.89%). Axis 1 showed the highest variance contribution. The relationship between Axis 1 and GC, GC3s, ENC, CAI, CBI, and FOP was then evaluated. Significant correlations were found between axis 1 and CAI, CBI, FOP, GC, and GC3s across the eight Conidiobolus species, indicating a collective impact on the base bias of Conidiobolus. Additionally, notable distinctions were observed between the nad2 and nad6 genes and other core PCGs, suggesting differences in codon usage among core PCGs.
Figure 6.
Correspondence analysis (COA) based on the relative synonymous codon usage (RSCU) values of 11 mitochondrial genes from 8 Conidiobolus strains. Purple represents the cox gene, red represents the nad gene, green represents the atp6 gene, and blue represents the cob gene. The 8 Conidiobolus species are C. heterosporus, C. taihushanensis, C. rhysosporus, C. polytocus, C. lichenicola, C. polyspermus, C. mycophagus, and C. chlamydosporus from (a–h).
3.8. Optimal Codon Analysis
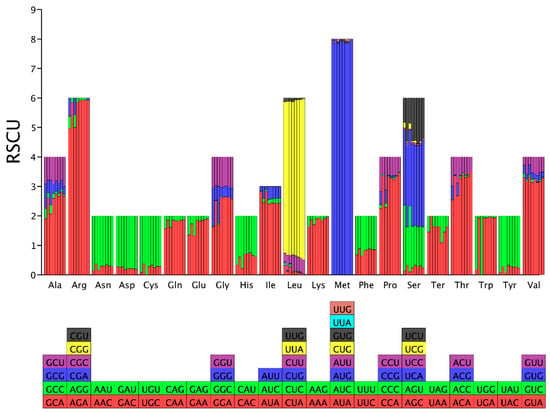
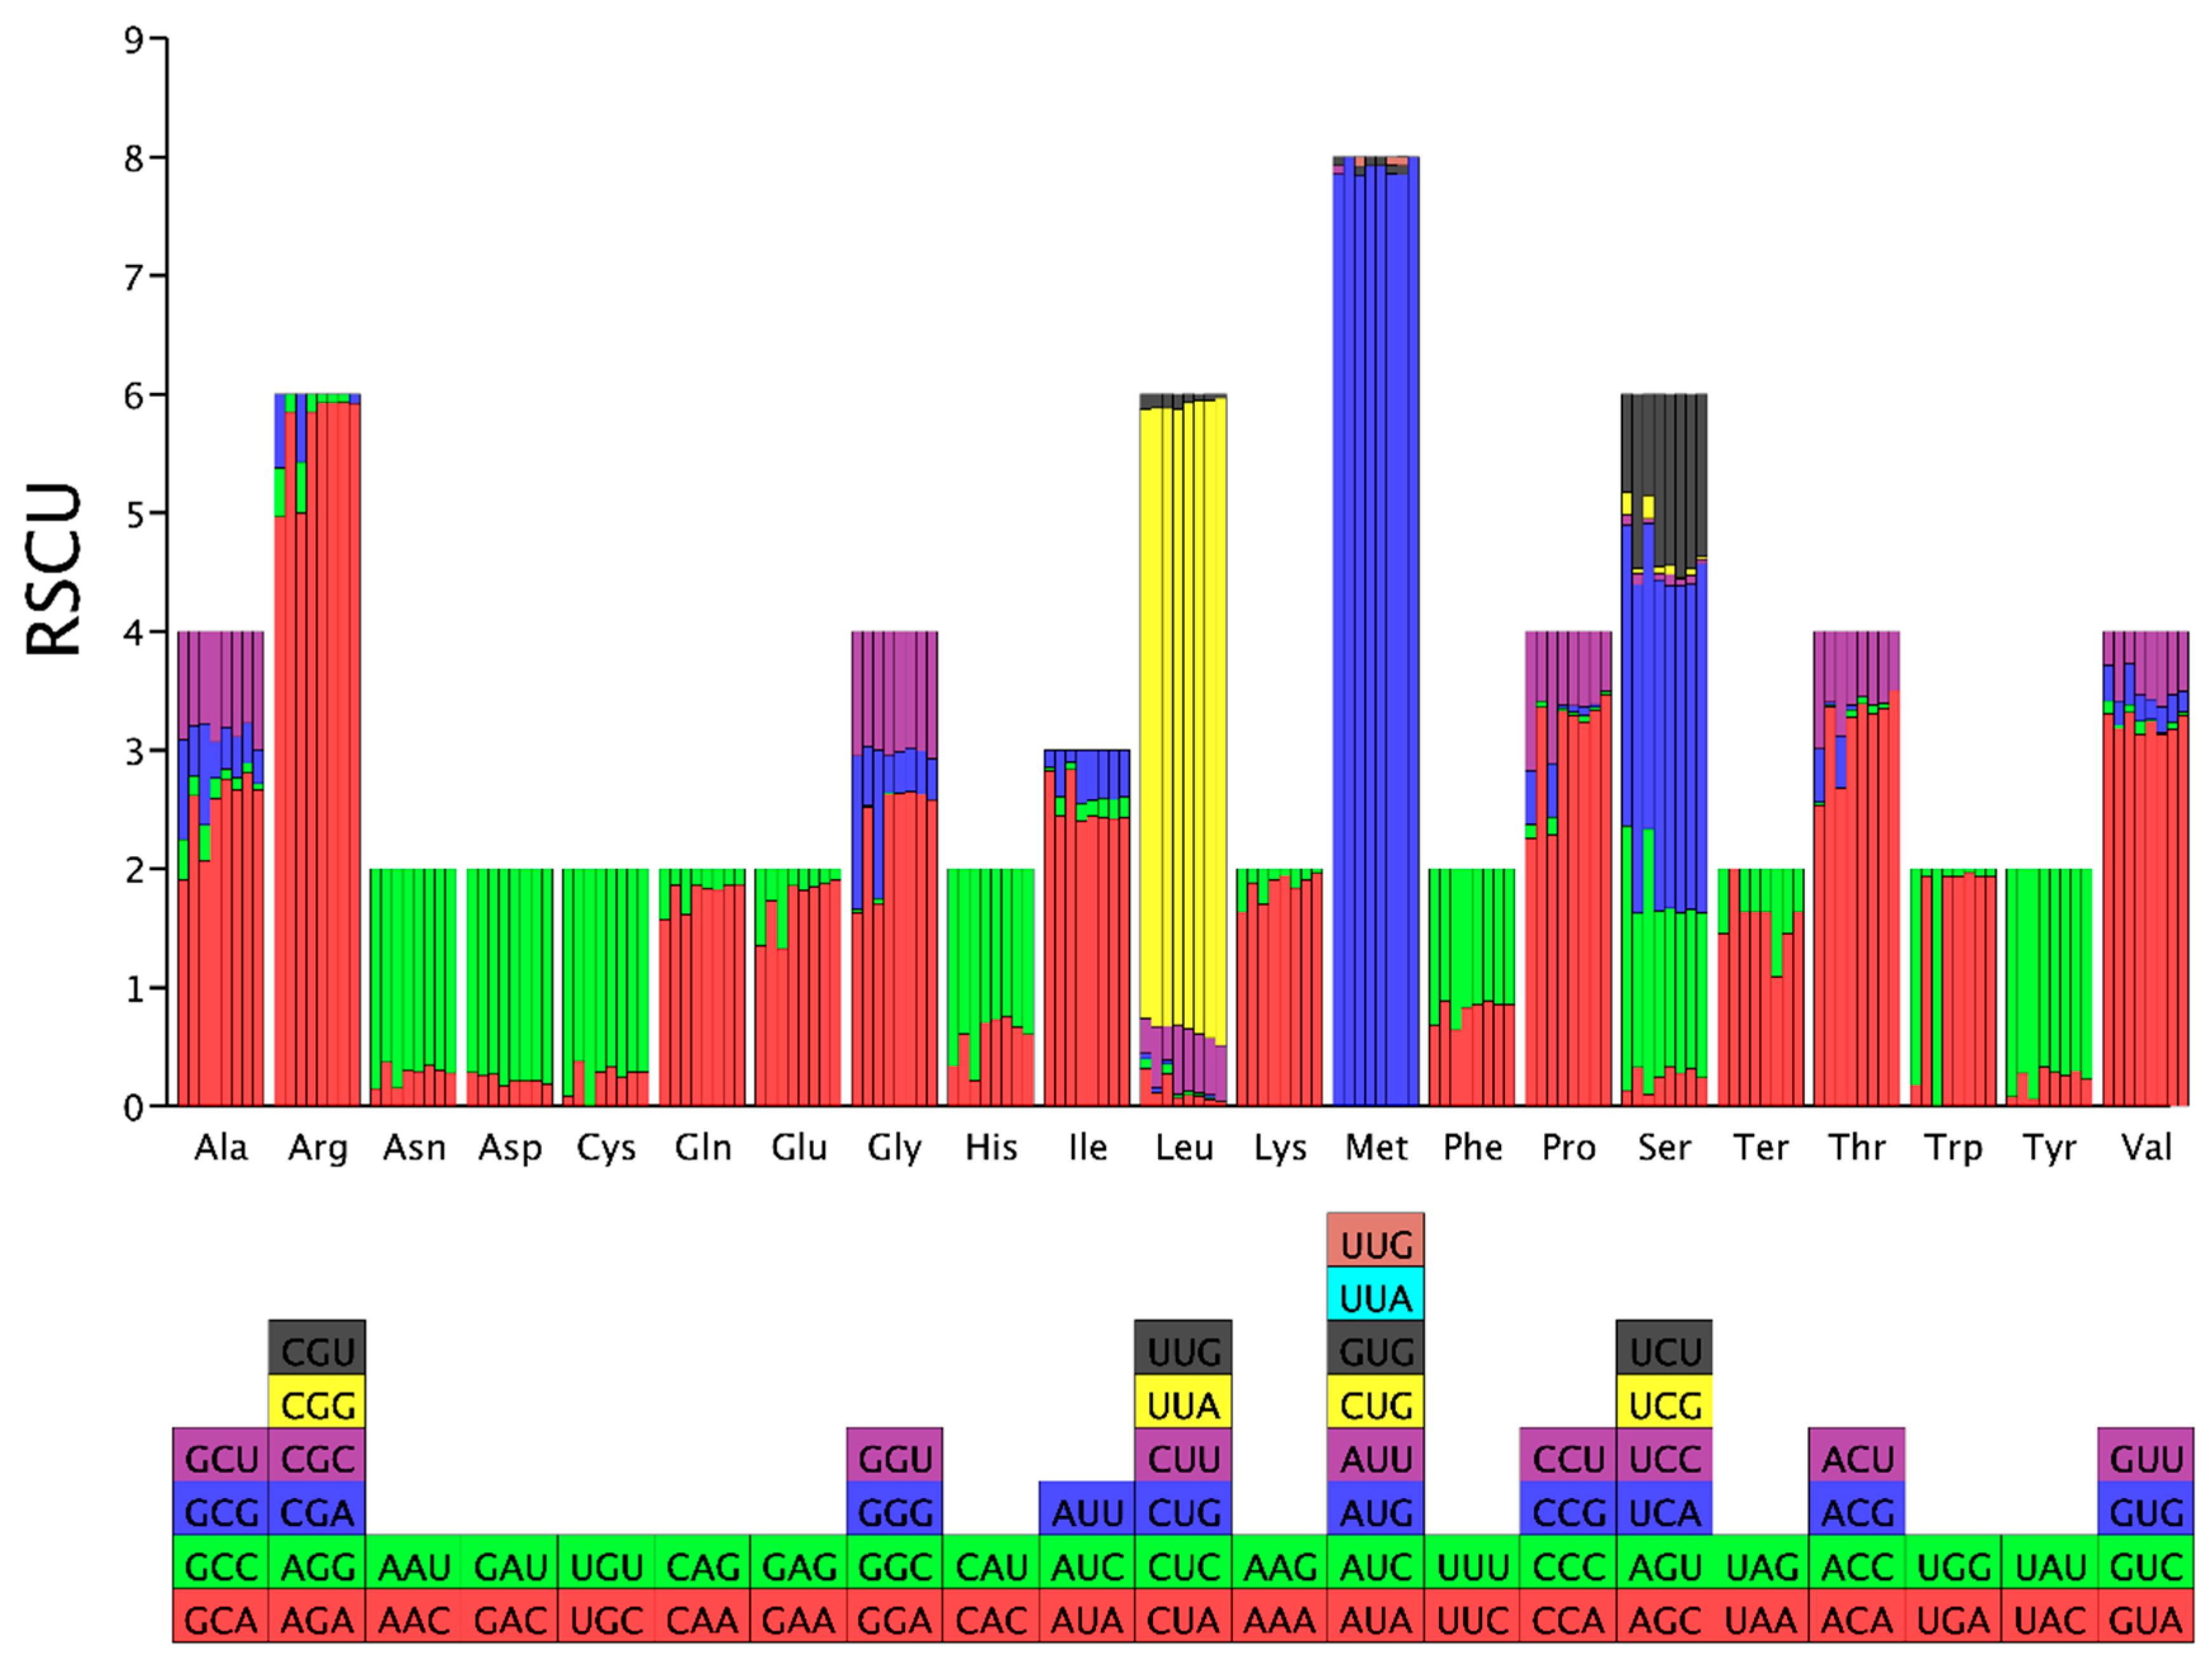
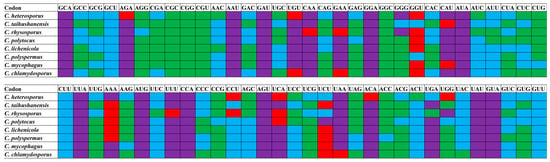
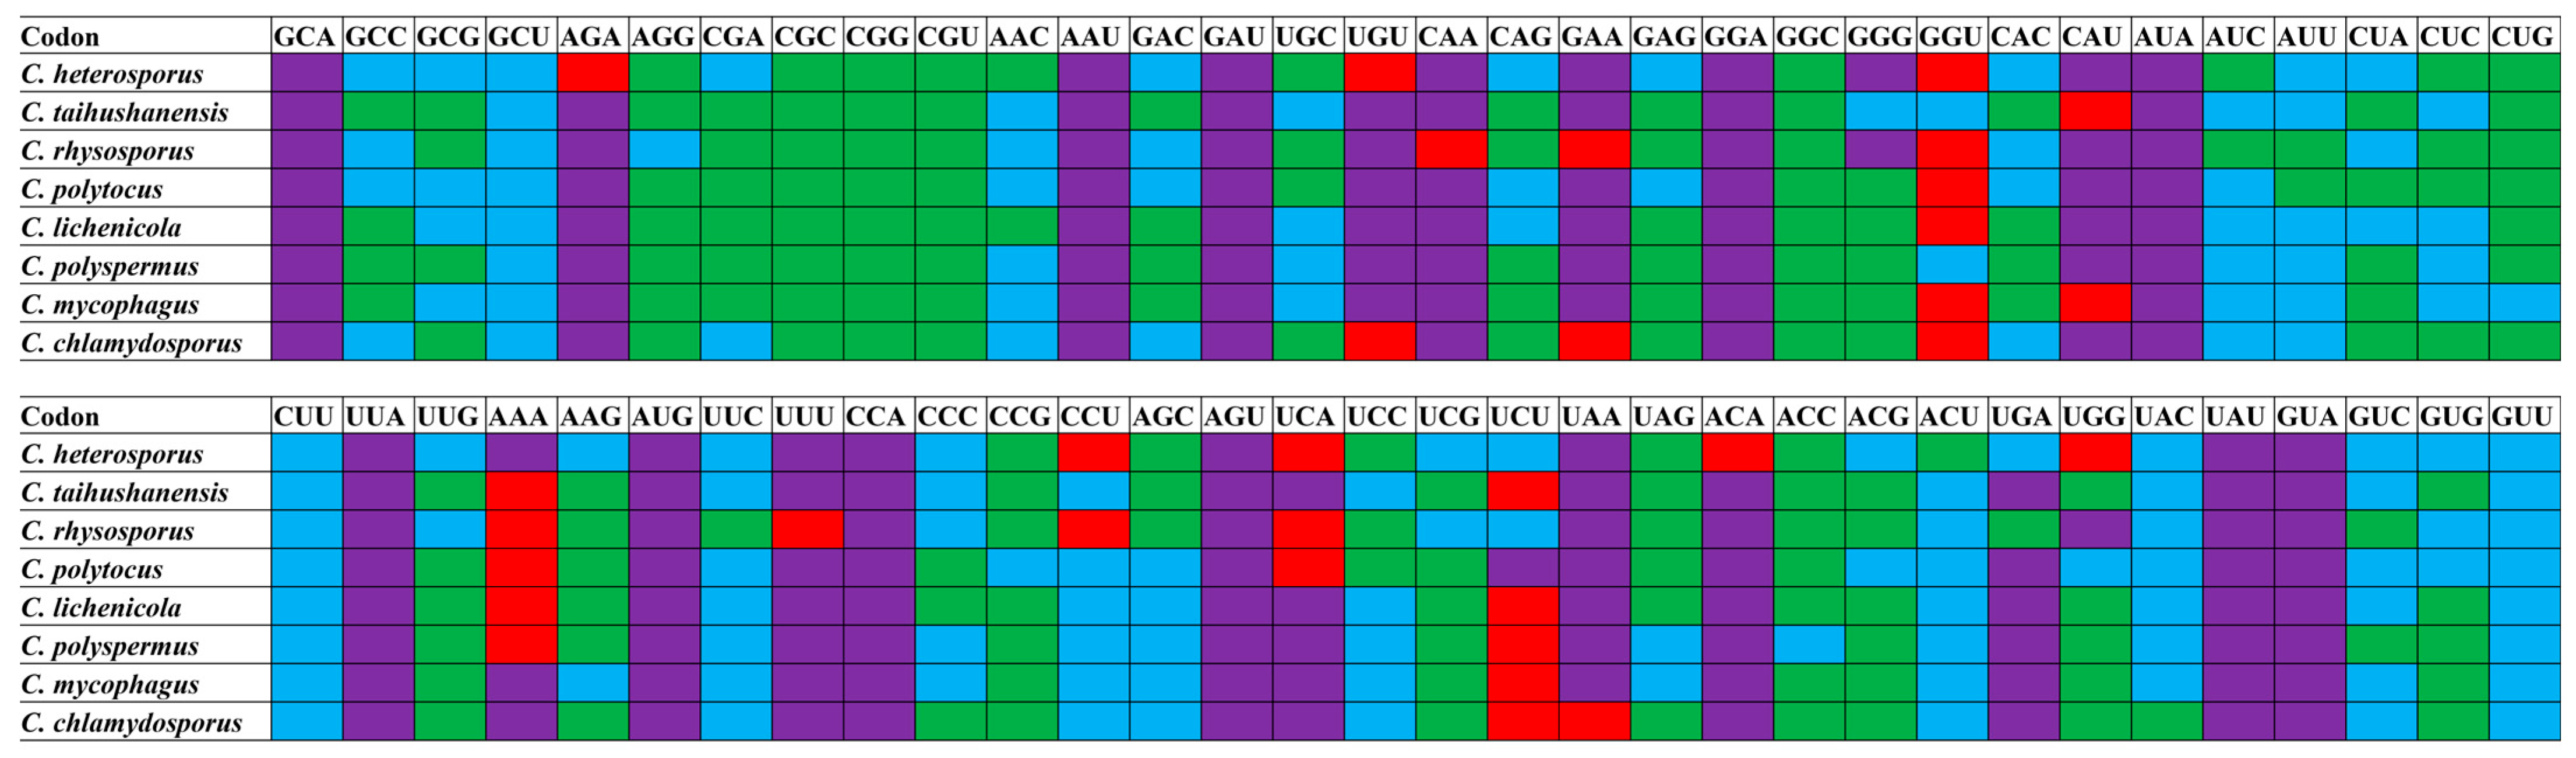
RSCU analysis revealed variations in the number of high-frequency codons (RSCU values > 1) among the eight Conidiobolus species, ranging from 18 to 25. Among these species, C. heterosporus had the fewest high-frequency codons, while C. rhodosporus had the highest. The codons GGG, CCU, and UGG were exclusively high-frequency in C. heterosporus and C. rhodosporus, suggesting differential codon usage in these species compared to others within the Conidiobolus genus. Examination of the 25 frequently used codons in Conidiobolus indicated that 9 ended with T, 13 with A, and only 3 with G, indicating a preference for A/T endings in Conidiobolus mitochondrial codons (Figure 7). Additionally, species-specific highly expressed codons (ΔRSCU > 0.08) were observed across the eight Conidiobolus species, highlighting distinct patterns in C. heterosporus, C. taihushanensis, C. rhysosporus, C. polytocus, C. lichenicola, C. polyspermus, C. mycophagus, and C. chlamydosporus (Figure 8). A comparative analysis identified optimal codons (ΔRSCU > 0.08 and RSCU > 1) in various species, predominantly A/T-ending codons. GGU was the most frequently utilized optimal codon in 6 Conidiobolus species, with AAA being the second most common in 5 species. Moreover, specific species exhibited unique optimal codons, including CAA, UUU, UAA, AGA, ACA, and UGG.
Figure 7.
Relative synonymous codon usage (RSCU) analysis of 12 mitochondrial genes from 8 Conidiobolus strains. The color blocks with different colors on the bottom vertical axis represent different codons in the image above. The different letters in the horizontal axis represent abbreviations for different amino acids. The bar chart from left to right represents 8 Conidiobolus species, including C. heterosporus, C. taihushanensis, C. rhysosporus, C. polytocus, C. lichenicola, C. polyspermus, C. mycophagus, and C. chlamydosporus.
Figure 8.
Optimal codons of 8 Conidiobolus strains (ΔRSCU > 0.08 and RSCU > 1), which are marked in red. Highly expressed codons (ΔRSCU > 0.08) were marked in blue and high-frequency codons (RSCU > 1) were marked in purple. Green represents general codons.
3.9. Phylogenetic Analysis Results
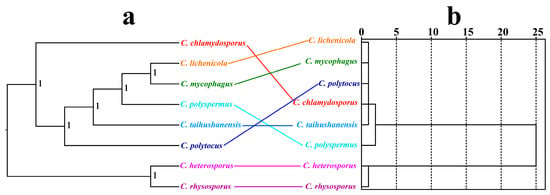
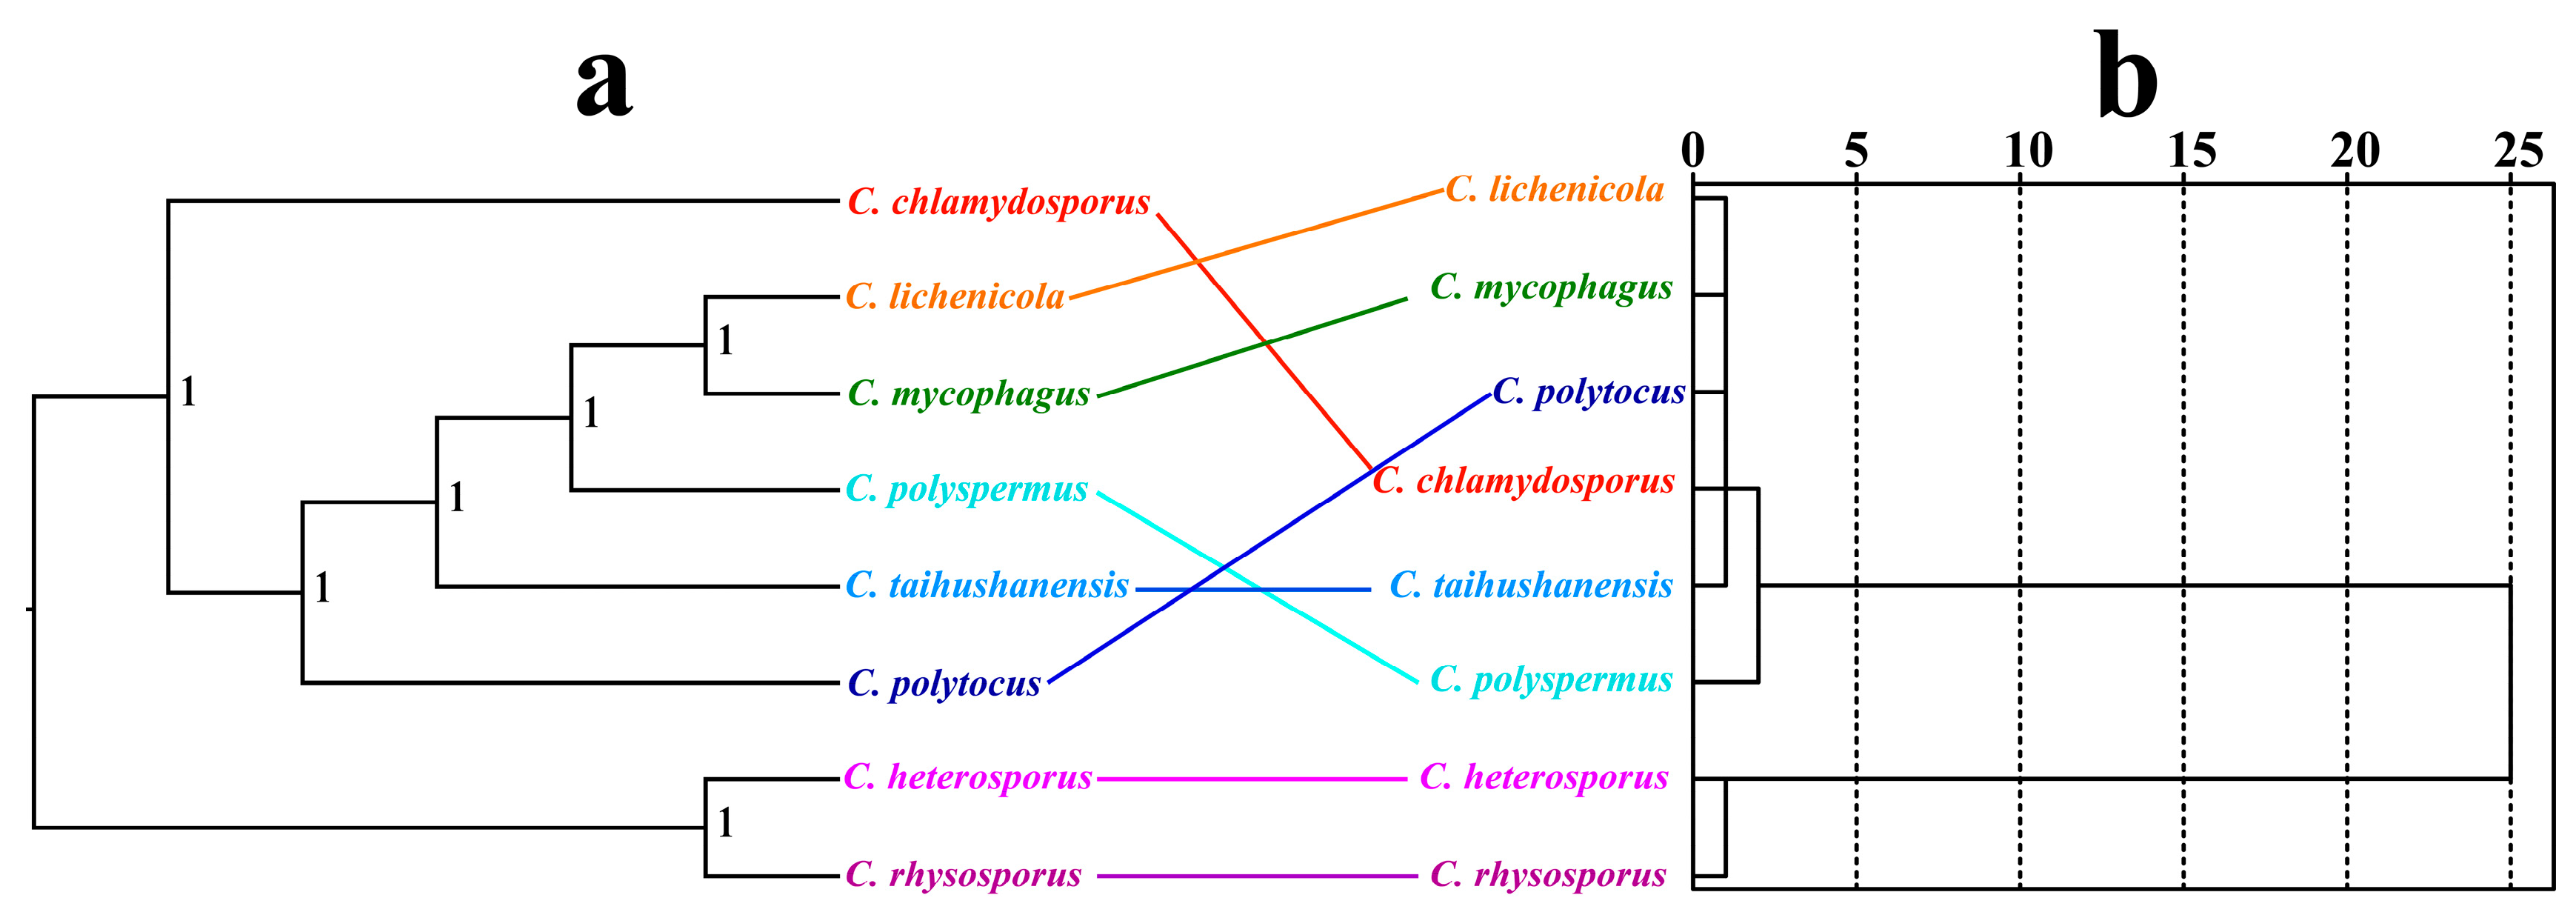
We compared the topology of the sequence-based phylogenetic tree (Figure 9a) with the RSCU similarity dendrogram (Figure 9b) to assess whether long-term evolutionary divergence correlates with contemporary patterns of codon usage, and to identify lineages where codon bias may have been shaped by distinct selective pressures. Bayesian inference (BI) was utilized to construct phylogenetic trees for eight Conidiobolus species based on a combined mitochondrial gene set. The analysis revealed two main evolutionary clades within the Conidiobolus species: one comprising C. rhysosporus and C. heterosporus, and the other including the remaining species (Figure 9a). Discrepancies in species relationships were observed when comparing phylogenetic relationships based on sequences with those based on Relative Synonymous Codon Usage (RSCU) (Figure 9b), particularly in the positioning of C. polytocus, C. polyspermus, and C. chlamydosporus. Nonetheless, the RSCU-based species relationships highlighted a distinct association among C. rhysosporus, C. heterosporus, C. taihushanensis, C. mycophagus, and C. lichenicola.
Figure 9.
Relationship inference of different Conidiobolus strains based on the Bayesian inference (BI) (a) method and relative synonymous codon usage (RSCU) hierarchical clustering (b).
4. Discussion
The mitochondrial codon usage bias (CUB) in Conidiobolus species highlights natural selection as the primary evolutionary force shaping AT-biased synonymous codon preferences, which is consistent with the pattern of other fungal lineages [48,49,57]. Basidiomycota fungi like Ganoderma and Amanita exhibit moderate GC3 content (20–35%) and a stronger influence from mutational bias, as shown in recent comparative mitogenomic studies [48]. In contrast, Conidiobolus mitogenomes have high AT content (73.32%) and low GC3 content (13.40%), which represents the mitochondrial genetic characteristics of early-diverging fungi. This pronounced AT bias parallels observations in plant and animal mitochondrial genomes, where AT-rich environments favor translational efficiency of codons ending with A/T [58,59,60].
The weak correlation between GC12 and GC3 (slopes: 0.037–0.335) and the deviation of the effective number of codons (ENC) values from mutation-driven expectations in Conidiobolus stand in contrast to Candida mitogenomes, where mutation pressure predominantly shapes codon usage bias (CUB) [61]. This discrepancy underscores niche-specific selective pressures in Zoopagomycota, possibly associated with their diverse ecological roles—from obligate parasitism (C. mycophagus) to saprophytic decomposition (C. polyspermus). The phylogenomic incongruence between relative synonymous codon usage (RSCU)-based and sequence-based trees mirrors observations in Ganoderma and Amanita (Basidiomycota), where distinct selection pressures, rather than horizontal gene transfer (HGT), account for the discordant tree topologies [48].
PR2-bias analysis identified a consistent A > T and C > G bias in Conidiobolus. This bias is attributed to constraints on oxidative phosphorylation, promoting nucleotide asymmetry [62]. The presence of species-specific optimal codons, such as GGU (Gly) in six Conidiobolus species, mirrors findings in Chlamydomonas reinhardtii chloroplasts, where codon optimization improves translational accuracy during environmental stress [63]. Unlike Candida mitochondria, Conidiobolus does not exhibit GC3 heterogeneity, a feature attributed to tRNA modification systems that mitigate codon-anticodon mismatches [64], highlighting its distinct evolutionary path among fungi. Bryophyte mitogenomes with similar AT content display weak selection and mutation-driven Codon Usage Bias (CUB) [65], contrasting with Conidiobolus which shows strong selective pressures likely linked to ecological specialization. This parallels observations in Laccaria bicolor, where co-evolution between nuclear and mitochondrial genomes optimizes codon usage to enhance symbiotic efficiency [66]. However, Conidiobolus’ diverse ecological niche, including parasitism, saprophytism, and stress adaptation, may alleviate co-evolutionary constraints, leading to the promotion of lineage-specific codon usage strategies. The observed ENCratio (13.13–43.92%) and neutrality plot slopes are consistent with patterns observed in Rhopalosiphum nymphaeae (Aphididae), where selection predominates over mutation in highly expressed mitochondrial genes [67]. In Conidiobolus, the notable codon usage bias (CUB) in nad4 (CAI: 0.052) and nad6 (CAI: 0.226) may indicate differential expression or functional specialization, similar to findings in Ophioglossum vulgatum mitochondrial genes [68]. In summary, this paper analyzes the codon usage bias of early-diverging fungal mitochondrial genomes, providing a reference for understanding the genetic and evolutionary characteristics of the early-diverging fungal group.
5. Conclusions
While the weak GC12-GC3 correlation and the pronounced PR2 bias (A > T, C > G) are often interpreted as signatures of natural selection, caution is warranted in highly AT-rich systems like the Conidiobolus mitogenomes. The inherent amino acid composition of core mitochondrial proteins imposes strong constraints on GC12, potentially decoupling it from GC3 independently of selection on synonymous sites. Furthermore, strand-asymmetric mutation pressures common in mitochondrial DNA replication and transcription could generate the observed nucleotide biases (A/T and C/G asymmetry). Therefore, our results do not exclusively prove the dominance of selection but rather demonstrate that codon usage patterns are complex and likely shaped by an interplay of mutational biases, structural/functional constraints, and potential selective optimization for translational efficiency or accuracy. The phylogenomic incongruence and species-specific codon optimization observed highlight the intricate interplay of evolutionary pressures in ecologically diverse fungi. Future investigations should prioritize the examination of nuclear-mitochondrial interactions, variation in tRNA gene copy numbers, and adaptations in translational machinery to comprehensively elucidate the mechanisms of codon optimization in early-diverging fungi.
Supplementary Materials
The following supporting information can be downloaded at: https://www.mdpi.com/article/10.3390/jof12040231/s1, Figure S1: Variability of expected and actual ENC values of 11 mitochondrial genes from 8 Conidiobulus species.
Author Contributions
Conceived and designed experiments: Y.C., Q.L. and Z.L. Analyzed the data: X.Y., Y.X., X.G. and J.Y. Wrote and reviewed the paper: Y.C., Z.L. and Q.L. Project management: Q.L. All authors have read and agreed to the published version of the manuscript.
Funding
This work was supported by Sichuan Provincial Natural Science Foundation General Project (2026NSFSC0177).
Institutional Review Board Statement
Not applicable.
Informed Consent Statement
Not applicable.
Data Availability Statement
The original contributions presented in this study are included in the article/Supplementary Material. Further inquiries can be directed to the corresponding authors.
Conflicts of Interest
The authors declare no conflicts of interest.
References
- Dixit, A.; Barhoosh, H.; Paegel, B. Translating the Genome into Drugs. Acc. Chem. Res. 2023, 56, 489–499. [Google Scholar] [CrossRef] [Scilit]
- Embree, C.; Abu-Alhasan, R.; Singh, G. Features and factors that dictate if terminating ribosomes cause or counteract nonsense-mediated mRNA decay. J. Biol. Chem. 2022, 298, 102592. [Google Scholar] [CrossRef] [Scilit]
- Grome, M.; Nguyen, M.; Moonan, D.; Mohler, K.; Gurara, K.; Wang, S.; Hemez, C.; Stenton, B.; Cao, Y.; Radford, F.; et al. Engineering a genomically recoded organism with one stop codon. Nature 2025, 639, 512–521. [Google Scholar] [CrossRef] [Scilit]
- Parvathy, S.; Udayasuriyan, V.; Bhadana, V. Codon usage bias. Mol. Biol. Rep. 2021, 49, 539–565. [Google Scholar] [CrossRef] [Scilit]
- McLure, R.; Radford, S.; Brockwell, D. High-throughput directed evolution: A golden era for protein science. Trends Chem. 2022, 4, 378–391. [Google Scholar] [CrossRef] [Scilit]
- Sanders, M.; Toret, C.; Guillotin, A.; Antkowiak, A.; Vannier, T.; Robinson, R.; Michelot, A. Specialization of actin isoforms derived from the loss of key interactions with regulatory factors. EMBO J. 2022, 41, EMBJ2021107982. [Google Scholar] [CrossRef] [Scilit] [PubMed]
- Bailey, S.; Morales, L.; Kassen, R. Effects of Synonymous Mutations beyond Codon Bias: The Evidence for Adaptive Synonymous Substitutions from Microbial Evolution Experiments. Genome Biol. Evol. 2021, 13, evab141. [Google Scholar] [CrossRef] [Scilit] [PubMed]
- Desingu, P.; Rubeni, T.; Sundaresan, N. Evolution of monkeypox virus from 2017 to 2022: In the light of point mutations. Front. Microbiol. 2022, 13, 1037598. [Google Scholar] [CrossRef] [Scilit]
- Christmas, M.; Dong, M.; Meadows, J.; Kozyrev, S.; Lindblad-Toh, K. Interpreting mammalian synonymous site conservation in light of the unwanted transcript hypothesis. Nat. Commun. 2025, 16, 2007. [Google Scholar] [CrossRef] [Scilit]
- Carpentier, F.; Vega, R.; Jay, P.; Duhamel, M.; Shykoff, J.; Perlin, M.; Wallen, M.; Hood, M.; Giraud, T. Tempo of Degeneration Across Independently Evolved Nonrecombining Regions. Mol. Biol. Evol. 2022, 39, msac060. [Google Scholar] [CrossRef] [Scilit]
- Steffen, R.; Ogoniak, L.; Grundmann, N.; Pawluchin, A.; Soehnlein, O.; Schmitz, J. paPAML: An Improved Computational Tool to Explore Selection Pressure on Protein-Coding Sequences. Genes 2022, 13, 1090. [Google Scholar] [CrossRef] [Scilit]
- Kanyema, M.; Cheng, M.; Luo, J.; Lu, M.; Xing, X.; Sun, Y.; Wang, J.; Lu, Y.; Shi, C.; Zeng, Y.; et al. Comprehensive codon usage analysis of the African Swine Fever Virus. Acta Virol. 2023, 67, 11562. [Google Scholar] [CrossRef] [Scilit]
- Robertson, W.; Funke, L.; Torre, D.; Fredens, J.; Elliott, T.; Spinck, M.; Christova, Y.; Cervettini, D.; Böge, F.; Liu, K.; et al. Sense codon reassignment enables viral resistance and encoded polymer synthesis. Science 2021, 372, 1057–1062. [Google Scholar] [CrossRef] [Scilit]
- Pu, F.; Wang, R.; Yang, X.; Hu, X.; Wang, J.; Zhang, L.; Zhao, Y.; Zhang, D.; Liu, Z.; Liu, J. Nucleotide and codon usage biases involved in the evolution of African swine fever virus: A comparative genomics analysis. J. Basic Microbiol. 2023, 63, 499–518. [Google Scholar] [CrossRef] [Scilit] [PubMed]
- Gendron, E.; Qing, X.; Sevigny, J.; Li, H.; Liu, Z.; Blaxter, M.; Powers, T.; Thomas, W.; Porazinska, D. Comparative mitochondrial genomics in Nematoda reveal astonishing variation in compositional biases and substitution rates indicative of multi-level selection. BMC Genom. 2024, 25, 615. [Google Scholar] [CrossRef] [Scilit] [PubMed]
- Li, Q.; Luo, Y.; Sha, A.; Xiao, W.; Xiong, Z.; Chen, X.; He, J.; Peng, L.; Zou, L. Analysis of synonymous codon usage patterns in mitochondrial genomes of nine Amanita species. Front. Microbiol. 2023, 14, 1134228. [Google Scholar] [CrossRef] [Scilit]
- Kaushik, R.; Kumar, N.; Yadav, P.; Sircar, S.; Shete, A.; Singh, A.; Tomar, S.; Launey, T.; Malik, Y. Comprehensive Genomics Investigation of Neboviruses Reveals Distinct Codon Usage Patterns and Host Specificity. Microorganisms 2024, 12, 696. [Google Scholar] [CrossRef] [Scilit] [PubMed]
- Bhanja, E.; Das, R.; Begum, Y.; Mondal, S. Study of Pyrroloquinoline Quinine From Phosphate-Solubilizing Microbes Responsible for Plant Growth: In silico Approach. Front. Agron. 2021, 3, 667339. [Google Scholar] [CrossRef] [Scilit]
- Hia, F.; Takeuchi, O. The effects of codon bias and optimality on mRNA and protein regulation. Cell. Mol. Life Sci. 2021, 78, 1909–1928. [Google Scholar] [CrossRef] [Scilit]
- Quax, T.E.; Claassens, N.J.; Söll, D.; van der Oost, J. Codon Bias as a Means to Fine-Tune Gene Expression. Mol. Cell 2015, 59, 149–161. [Google Scholar] [CrossRef] [Scilit]
- Barrington, C.L.; Galindo, G.; Koch, A.L.; Horton, E.R.; Morrison, E.J.; Tisa, S.; Stasevich, T.J.; Rissland, O.S. Synonymous codon usage regulates translation initiation. Cell Rep. 2023, 42, 113413. [Google Scholar] [CrossRef] [Scilit] [PubMed]
- Forster, A.C. Synthetic biology challenges long-held hypotheses in translation, codon bias and transcription. Biotechnol. J. 2012, 7, 835–845. [Google Scholar] [CrossRef] [Scilit] [PubMed]
- Hanson, G.; Coller, J. Codon optimality, bias and usage in translation and mRNA decay. Nat. Rev. Mol. Cell Biol. 2018, 19, 20–30. [Google Scholar] [CrossRef] [Scilit]
- Krasovec, M.; Filatov, D.A. Evolution of Codon Usage Bias in Diatoms. Genes 2019, 10, 894. [Google Scholar] [CrossRef] [Scilit] [PubMed]
- Kumar, N.; Kulkarni, D.D.; Lee, B.; Kaushik, R.; Bhatia, S.; Sood, R.; Pateriya, A.K.; Bhat, S.; Singh, V.P. Evolution of Codon Usage Bias in Henipaviruses Is Governed by Natural Selection and Is Host-Specific. Viruses 2018, 10, 604. [Google Scholar] [CrossRef] [Scilit]
- Shan, K.J.; Wu, C.; Tang, X.; Lu, R.; Hu, Y.; Tan, W.; Lu, J. Molecular Evolution of Protein Sequences and Codon Usage in Monkeypox Viruses. Genom. Proteom. Bioinform. 2024, 22, qzad003. [Google Scholar] [CrossRef] [Scilit]
- Friedman, R.; Ely, B. Codon usage methods for horizontal gene transfer detection generate an abundance of false positive and false negative results. Curr. Microbiol. 2012, 65, 639–642. [Google Scholar] [CrossRef] [Scilit]
- Tuller, T. Codon bias, tRNA pools and horizontal gene transfer. Mob. Genet. Elem. 2011, 1, 75–77. [Google Scholar] [CrossRef] [Scilit]
- Frumkin, I.; Lajoie, M.J.; Gregg, C.J.; Hornung, G.; Church, G.M.; Pilpel, Y. Codon usage of highly expressed genes affects proteome-wide translation efficiency. Proc. Natl. Acad. Sci. USA 2018, 115, E4940–E4949. [Google Scholar] [CrossRef] [Scilit]
- Sharp, P.M.; Tuohy, T.M.; Mosurski, K.R. Codon usage in yeast: Cluster analysis clearly differentiates highly and lowly expressed genes. Nucleic Acids Res. 1986, 14, 5125–5143. [Google Scholar] [CrossRef] [Scilit]
- Arella, D.; Dilucca, M.; Giansanti, A. Codon usage bias and environmental adaptation in microbial organisms. Mol. Genet. Genom. 2021, 296, 751–762. [Google Scholar] [CrossRef] [Scilit] [PubMed]
- Lal, D.; Verma, M.; Behura, S.K.; Lal, R. Codon usage bias in phylum Actinobacteria: Relevance to environmental adaptation and host pathogenicity. Res. Microbiol. 2016, 167, 669–677. [Google Scholar] [CrossRef] [Scilit] [PubMed]
- Xu, Q.; Cao, J.; Rai, K.R.; Zhu, B.; Liu, D.; Wan, C. Codon usage bias of goose circovirus and its adaptation to host. Poult. Sci. 2024, 103, 103775. [Google Scholar] [CrossRef] [Scilit]
- Li, J.; Chen, Y.; Liu, Y.; Wang, C.; Li, L.; Chao, Y. Complete mitochondrial genome of Agrostis stolonifera: Insights into structure, Codon usage, repeats, and RNA editing. BMC Genom. 2023, 24, 466. [Google Scholar] [CrossRef] [Scilit]
- Wei, L.; He, J.; Jia, X.; Qi, Q.; Liang, Z.; Zheng, H.; Ping, Y.; Liu, S.; Sun, J. Analysis of codon usage bias of mitochondrial genome in Bombyx mori and its relation to evolution. BMC Evol. Biol. 2014, 14, 262. [Google Scholar] [CrossRef] [Scilit]
- Camus, M.F.; Dhawanjewar, A.S. Multilevel selection on mitochondrial genomes. Curr. Opin. Genet. Dev. 2023, 80, 102050. [Google Scholar] [CrossRef] [Scilit]
- Hogan, R.I.; Hopkins, K.; Wheeler, A.J.; Yesson, C.; Allcock, A.L. Evolution of mitochondrial and nuclear genomes in Pennatulacea. Mol. Phylogenet. Evol. 2023, 178, 107630. [Google Scholar] [CrossRef] [Scilit] [PubMed]
- Zeb, U.; Aziz, T.; Azizullah, A.; Zan, X.Y.; Khan, A.A.; Bacha, S.A.S.; Cui, F.J. Complete mitochondrial genomes of edible mushrooms: Features, evolution, and phylogeny. Physiol. Plant. 2024, 176, e14363. [Google Scholar] [CrossRef] [Scilit]
- Nie, Y.; Wang, L.; Cai, Y.; Tao, W.; Zhang, Y.J.; Huang, B. Mitochondrial genome of the entomophthoroid fungus Conidiobolus heterosporus provides insights into evolution of basal fungi. Appl. Microbiol. Biotechnol. 2019, 103, 1379–1391. [Google Scholar] [CrossRef] [Scilit]
- Vilela, R.; Mendoza, L. Human Pathogenic Entomophthorales. Clin. Microbiol. Rev. 2018, 31, 10–1128. [Google Scholar] [CrossRef] [Scilit]
- Gryganskyi, A.P.; Nie, Y.; Hajek, A.E.; Hodge, K.T.; Liu, X.Y.; Aadland, K.; Voigt, K.; Anishchenko, I.M.; Kutovenko, V.B.; Kava, L.; et al. The Early Terrestrial Fungal Lineage of Conidiobolus-Transition from Saprotroph to Parasitic Lifestyle. J. Fungi 2022, 8, 789. [Google Scholar] [CrossRef] [Scilit]
- Gugnani, H.C. Entomophthoromycosis due to Conidiobolus. Eur. J. Epidemiol. 1992, 8, 391–396. [Google Scholar] [CrossRef] [Scilit]
- Stavropoulou, E.; Coste, A.T.; Beigelman-Aubry, C.; Letovanec, I.; Spertini, O.; Lovis, A.; Krueger, T.; Burger, R.; Bochud, P.Y.; Lamoth, F. Conidiobolus pachyzygosporus invasive pulmonary infection in a patient with acute myeloid leukemia: Case report and review of the literature. BMC Infect. Dis. 2020, 20, 527. [Google Scholar] [CrossRef] [Scilit]
- Manning, R.J.; Waters, S.D.; Callaghan, A.A. Saprotrophy of Conidiobolus and Basidiobolus in leaf litter. Mycol. Res. 2007, 111, 1437–1449. [Google Scholar] [CrossRef] [Scilit] [PubMed]
- Nie, Y.; Yin, Y.; Zhao, H.; Liu, X.; Huang, B. Unveiling species diversity within the family Conidiobolaceae (Entomophthorales) in China: Descriptions of two new species and reassessment of the taxonomic position of Conidiobolus polyspermus. MycoKeys 2024, 105, 203–216. [Google Scholar] [CrossRef] [Scilit]
- Yang, T.; Wang, X.; Zhou, X. Microbiome Analysis of the Bamboo Aphid Melanaphis bambusae Infected with the Aphid Obligate Pathogen Conidiobolus obscurus (Entomophthoromycotina). Insects 2022, 13, 1040. [Google Scholar] [CrossRef] [Scilit]
- Sun, X.; Su, D.; Gui, W.; Luo, F.; Chen, Y. Characterization and phylogenetic analysis of the complete mitochondrial genome of Conidiobolus sp. (Entomophthorales: Ancylistaceae). Mitochondrial DNA B Resour. 2019, 5, 121–122. [Google Scholar] [CrossRef] [Scilit]
- Wu, P.; Xiao, W.; Luo, Y.; Xiong, Z.; Chen, X.; He, J.; Sha, A.; Gui, M.; Li, Q. Comprehensive analysis of codon bias in 13 Ganoderma mitochondrial genomes. Front. Microbiol. 2023, 14, 1170790. [Google Scholar] [CrossRef] [Scilit]
- Gao, W.; Chen, X.; He, J.; Sha, A.; Luo, Y.; Xiao, W.; Xiong, Z.; Li, Q. Intraspecific and interspecific variations in the synonymous codon usage in mitochondrial genomes of 8 pleurotus strains. BMC Genom. 2024, 25, 456. [Google Scholar] [CrossRef] [Scilit] [PubMed]
- Peden, J.F. Analysis of Codon Usage. Ph.D. Thesis, University of Nottingham, Nottingham, UK, 1999. [Google Scholar]
- Li, Q.; Bao, Z.; Tang, K.; Feng, H.; Tu, W.; Li, L.; Han, Y.; Cao, M.; Zhao, C. First two mitochondrial genomes for the order Filobasidiales reveal novel gene rearrangements and intron dynamics of Tremellomycetes. IMA Fungus 2022, 13, 7. [Google Scholar] [CrossRef] [Scilit] [PubMed]
- Li, Q.; Li, L.; Zhang, T.; Xiang, P.; Wu, Q.; Tu, W.; Bao, Z.; Zou, L.; Chen, C. The first two mitochondrial genomes for the genus Ramaria reveal mitochondrial genome evolution of Ramaria and phylogeny of Basidiomycota. IMA Fungus 2022, 13, 16. [Google Scholar] [CrossRef] [Scilit]
- Katoh, K.; Rozewicki, J.; Yamada, K.D. MAFFT online service: Multiple sequence alignment, interactive sequence choice and visualization. Brief. Bioinform. 2017, 20, 1160–1166. [Google Scholar] [CrossRef] [Scilit]
- Vaidya, G.; Lohman, D.L.; Meier, R. SequenceMatrix: Concatenation software for the fast assembly of multi-gene datasets with character set and codon information. Cladistics 2011, 27, 171–180. [Google Scholar] [CrossRef] [Scilit] [PubMed]
- Lanfear, R.; Frandsen, P.B.; Wright, A.M.; Senfeld, T.; Calcott, B. PartitionFinder 2: New Methods for Selecting Partitioned Models of Evolution for Molecular and Morphological Phylogenetic Analyses. Mol. Biol. Evol. 2017, 34, 772–773. [Google Scholar] [CrossRef] [Scilit] [PubMed]
- Ronquist, F.; Teslenko, M.; van der Mark, P.; Ayres, D.L.; Darling, A.; Hohna, S.; Larget, B.; Liu, L.; Suchard, M.A.; Huelsenbeck, J.P. MrBayes 3.2: Efficient Bayesian phylogenetic inference and model choice across a large model space. Syst. Biol. 2012, 61, 539–542. [Google Scholar] [CrossRef] [Scilit] [PubMed]
- Hugaboom, M.; Hatmaker, E.A.; LaBella, A.L.; Rokas, A. Evolution and codon usage bias of mitochondrial and nuclear genomes in Aspergillus section Flavi. G3 2023, 13, jkac285. [Google Scholar] [CrossRef] [Scilit]
- Wu, X.; Xu, M.; Yang, J.R.; Lu, J. Genome-wide impact of codon usage bias on translation optimization in Drosophila melanogaster. Nat. Commun. 2024, 15, 8329. [Google Scholar] [CrossRef] [Scilit]
- Tuller, T.; Waldman, Y.Y.; Kupiec, M.; Ruppin, E. Translation efficiency is determined by both codon bias and folding energy. Proc. Natl. Acad. Sci. USA 2010, 107, 3645–3650. [Google Scholar] [CrossRef] [Scilit]
- Shah, P.; Gilchrist, M.A. Explaining complex codon usage patterns with selection for translational efficiency, mutation bias, and genetic drift. Proc. Natl. Acad. Sci. USA 2011, 108, 10231–10236. [Google Scholar] [CrossRef] [Scilit]
- Wang, F.; Zhang, N.; Zhao, C.; Song, Z.; Caiyan, X. Codon usage bias analysis of mitochondrial protein-coding genes in 12 species of Candida. J. Genet. 2023, 102, 36. [Google Scholar] [CrossRef] [Scilit]
- Sebastian, W.; Sukumaran, S.; Gopalakrishnan, A. Comparative mitogenomics of Clupeoid fish provides insights into the adaptive evolution of mitochondrial oxidative phosphorylation (OXPHOS) genes and codon usage in the heterogeneous habitats. Heredity 2022, 128, 236–249. [Google Scholar] [CrossRef] [Scilit] [PubMed]
- Fages-Lartaud, M.; Hundvin, K.; Hohmann-Marriott, M.F. Mechanisms governing codon usage bias and the implications for protein expression in the chloroplast of Chlamydomonas reinhardtii. Plant J. Cell Mol. Biol. 2022, 112, 919–945. [Google Scholar] [CrossRef] [Scilit] [PubMed]
- Kamatani, T.; Yamamoto, T. Comparison of codon usage and tRNAs in mitochondrial genomes of Candida species. Biosystems 2007, 90, 362–370. [Google Scholar] [CrossRef] [Scilit]
- Wang, B.; Liu, J.; Jin, L.; Feng, X.Y.; Chen, J.Q. Complex mutation and weak selection together determined the codon usage bias in bryophyte mitochondrial genomes. J. Integr. Plant Biol. 2010, 52, 1100–1108. [Google Scholar] [CrossRef] [Scilit]
- Martin, F.; Aerts, A.; Ahrén, D.; Brun, A.; Danchin, E.G.; Duchaussoy, F.; Gibon, J.; Kohler, A.; Lindquist, E.; Pereda, V.; et al. The genome of Laccaria bicolor provides insights into mycorrhizal symbiosis. Nature 2008, 452, 88–92. [Google Scholar] [CrossRef] [Scilit]
- Shi, A.; Li, C.; Farhan, M.; Xu, C.; Zhang, Y.; Qian, H.; Zhang, S.; Jing, T. Characterization, Codon Usage Pattern and Phylogenetic Implications of the Waterlily Aphid Rhopalosiphum nymphaeae (Hemiptera: Aphididae) Mitochondrial Genome. Int. J. Mol. Sci. 2024, 25, 11336. [Google Scholar] [CrossRef] [Scilit] [PubMed]
- Hao, J.; Liang, Y.; Wang, T.; Su, Y. Correlations of gene expression, codon usage bias, and evolutionary rates of the mitochondrial genome show tissue differentiation in Ophioglossum vulgatum. BMC Plant Biol. 2025, 25, 134. [Google Scholar] [CrossRef] [Scilit]
Disclaimer/Publisher’s Note: The statements, opinions and data contained in all publications are solely those of the individual author(s) and contributor(s) and not of MDPI and/or the editor(s). MDPI and/or the editor(s) disclaim responsibility for any injury to people or property resulting from any ideas, methods, instructions or products referred to in the content. |
© 2026 by the authors. Licensee MDPI, Basel, Switzerland. This article is an open access article distributed under the terms and conditions of the Creative Commons Attribution (CC BY) license.