


Abstract
Lactarius vividus is a wild edible ectomycorrhizal mushroom widely distributed in southern China, where it forms an obligate symbiotic relationship with Pinus species. However, its genetic diversity and population differentiation remain poorly understood. We collected 95 basidiomata from ten geographic populations spanning seven provinces across an east–west transect of southern China and developed seven SSR primer pairs at the genomic level to investigate its genetic diversity, population differentiation and spatial genetic structure. Genetic diversity showed a clear east-to-west declining trend, being highest in population AQ (Anhui Province) and lowest in KM (Yunnan Province). Observed heterozygosity (Ho) was lower than expected heterozygosity (He) in most population-locus combinations, and many tests showed significant departures from Hardy–Weinberg equilibrium (HWE), indicating a pronounced heterozygote deficit. Analysis of molecular variance (AMOVA) showed substantial population differentiation, with 63% of the total genetic variation occurring among populations. A Mantel test detected a significant positive association between genetic and geographic distances (r = 0.322, p = 0.032), consistent with isolation by distance (IBD). STRUCTURE identified three genetic clusters, while DAPC and UPGMA analyses further revealed geographic differentiation and admixture or genetic overlap among some samples. These findings provide a basis for prioritising geographically distinct populations in the conservation and sustainable management of this wild edible mushroom.
1. Introduction
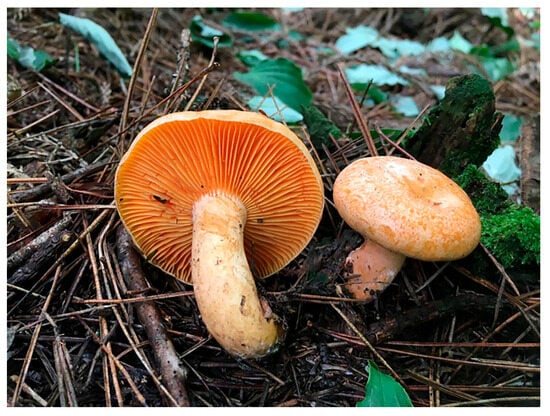
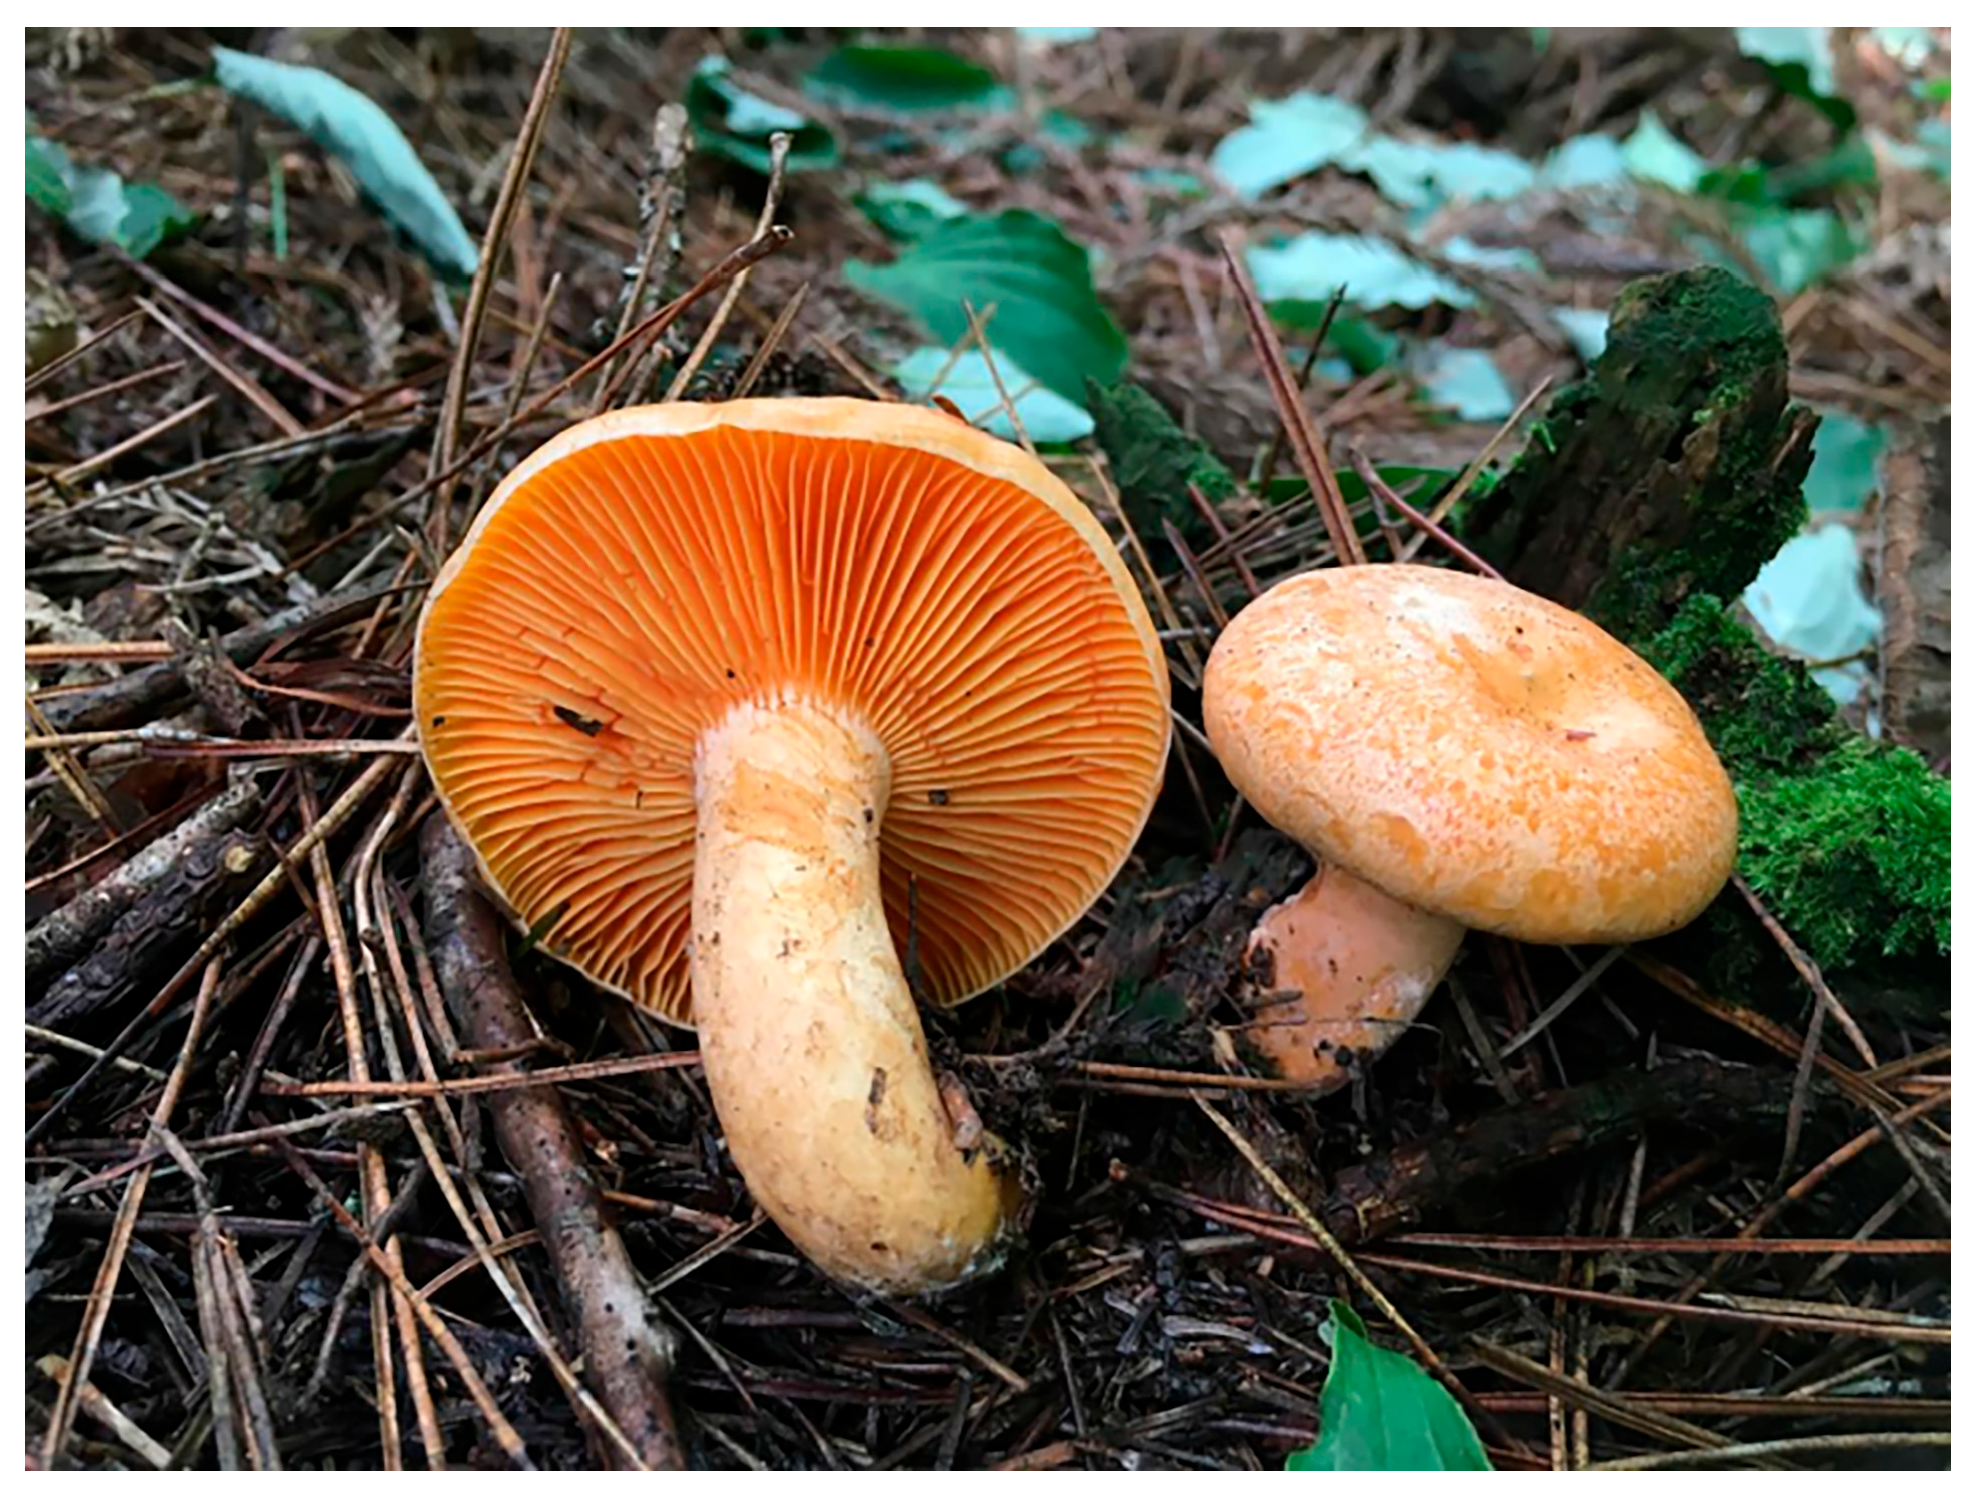
Lactarius vividus X.H. Wang, Nuytinck & Verbeken, an edible mushroom of the genus Lactarius in the family Russulaceae, is widely distributed in central and southern China [1]. As a member of Lactarius sect. Deliciosi, it is an ectomycorrhizal basidiomycete associated with Pinus species [2,3]. The basidiomata of L. vividus in its natural habitat are shown in Figure 1.
Figure 1.
The basidiocarps of Lactarius vividus in its natural habitat.
Previous work on L. vividus has focused mainly on its identification and taxonomic records; relevant studies on genetic diversity and population-level genetic structure have not been reported so far [1,4]. However, the congener L. hatsudake Nobuj. Tanaka is more extensively studied genetically than L. vividus [5,6,7]. Population genetic and phylogeographic approaches have become important tools for understanding genetic diversity, population structure and evolutionary history in wild mushrooms [8]. Whether L. vividus shows isolation by distance (IBD), and how its spatial genetic pattern compares with that of L. hatsudake, remains unresolved.
Host identity and forest structure are important determinants of ectomycorrhizal fungal communities [9]. Population genetic studies of ectomycorrhizal fungi have shown that habitat fragmentation and spatial isolation may increase genetic differentiation, although the extent of these effects may depend on propagule dispersal ability and other ecological factors [10,11]. For instance, microsatellite analyses of Tricholoma matsutake (S. Ito & S. Imai) Singer (Basidiomycota, Tricholomataceae) have revealed significant genetic structure and high genotypic diversity among populations, indicating that geographic barriers and host distribution play critical roles in shaping its genetic architecture [12,13]. In contrast, genetic analyses of Boletus edulis Bull. (Basidiomycota, Boletaceae) suggest that intraspecific competition may reduce local genetic diversity as woodland matures, with little population structure detected over several kilometres, highlighting species-specific responses to environmental pressures [14]. However, different fungal taxa exhibit markedly different response patterns to the same environmental pressures, and the evolutionary patterns of L. hatsudake cannot be directly extrapolated to L. vividus owing to their distinct ecological niches and life-history traits [15]. Large-scale, multi-site sampling and codominant molecular markers are, therefore, required to fully elucidate the population dynamics and conservation requirements of L. vividus.
Among various molecular markers, simple sequence repeat (SSR) markers offer the advantages of codominant inheritance, high polymorphism information content (PIC) and high mutation rates [16]. They permit accurate estimation of observed and expected heterozygosity and are widely used in analyses of genetic diversity, population differentiation, population structure, and gene flow in fungi [17,18,19,20]. Despite previous studies on the identification and taxonomy of L. vividus, its population-level genetic diversity and spatial genetic structure remain poorly understood. Consequently, the extent of genetic differentiation among geographic populations and the relationship between genetic and geographic distances remain unclear, limiting the genetic information available for conservation planning. In this study, we used standardised sampling and seven SSR loci to investigate genetic diversity and population differentiation across ten geographic populations of L. vividus. We examined genetic diversity and deviations from Hardy–Weinberg equilibrium (HWE), quantified genetic differentiation using analysis of molecular variance (AMOVA), tested for isolation by distance (IBD) using a Mantel test, and explored genetic clustering using STRUCTURE, discriminant analysis of principal components (DAPC) and the unweighted pair-group method with arithmetic means (UPGMA). We expected genetic differentiation among geographic populations and a positive association between genetic and geographic distances. The resulting population genetic information provides a basis for understanding the spatial genetic structure of L. vividus and informing its conservation.
2. Materials and Methods
2.1. Sample Collection, Identification and DNA Extraction
This sampling campaign covered an east–west span of approximately 1400 km across southern China, encompassing ten populations from Anqing (AQ), Nanchang (NC), Yongxin (YX), Yifeng (YF), Shaoguan (SG), Huaihua (HH), Pingtang (PT), Shizhu (SZ), Dazhou (DZ) and Kunming (KM). The populations were selected to represent the geographic distribution of L. vividus across the study area, with KM extending the western coverage of the sampling range. Nine populations were associated with Pinus massoniana Lamb. (Pinaceae) whereas KM was associated with P. yunnanensis Franch. The sampling sites varied in topography and forest configuration, ranging from lowland and upland pine forests to more dissected mountainous habitats.
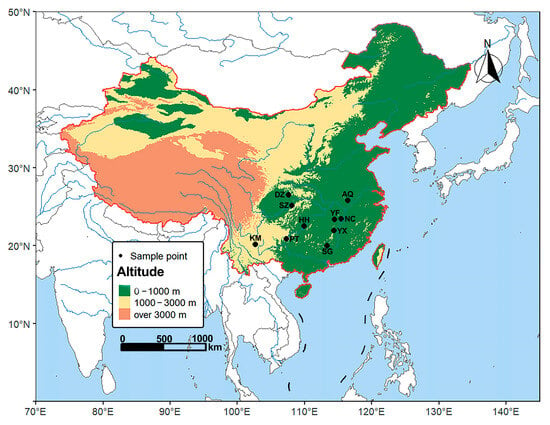
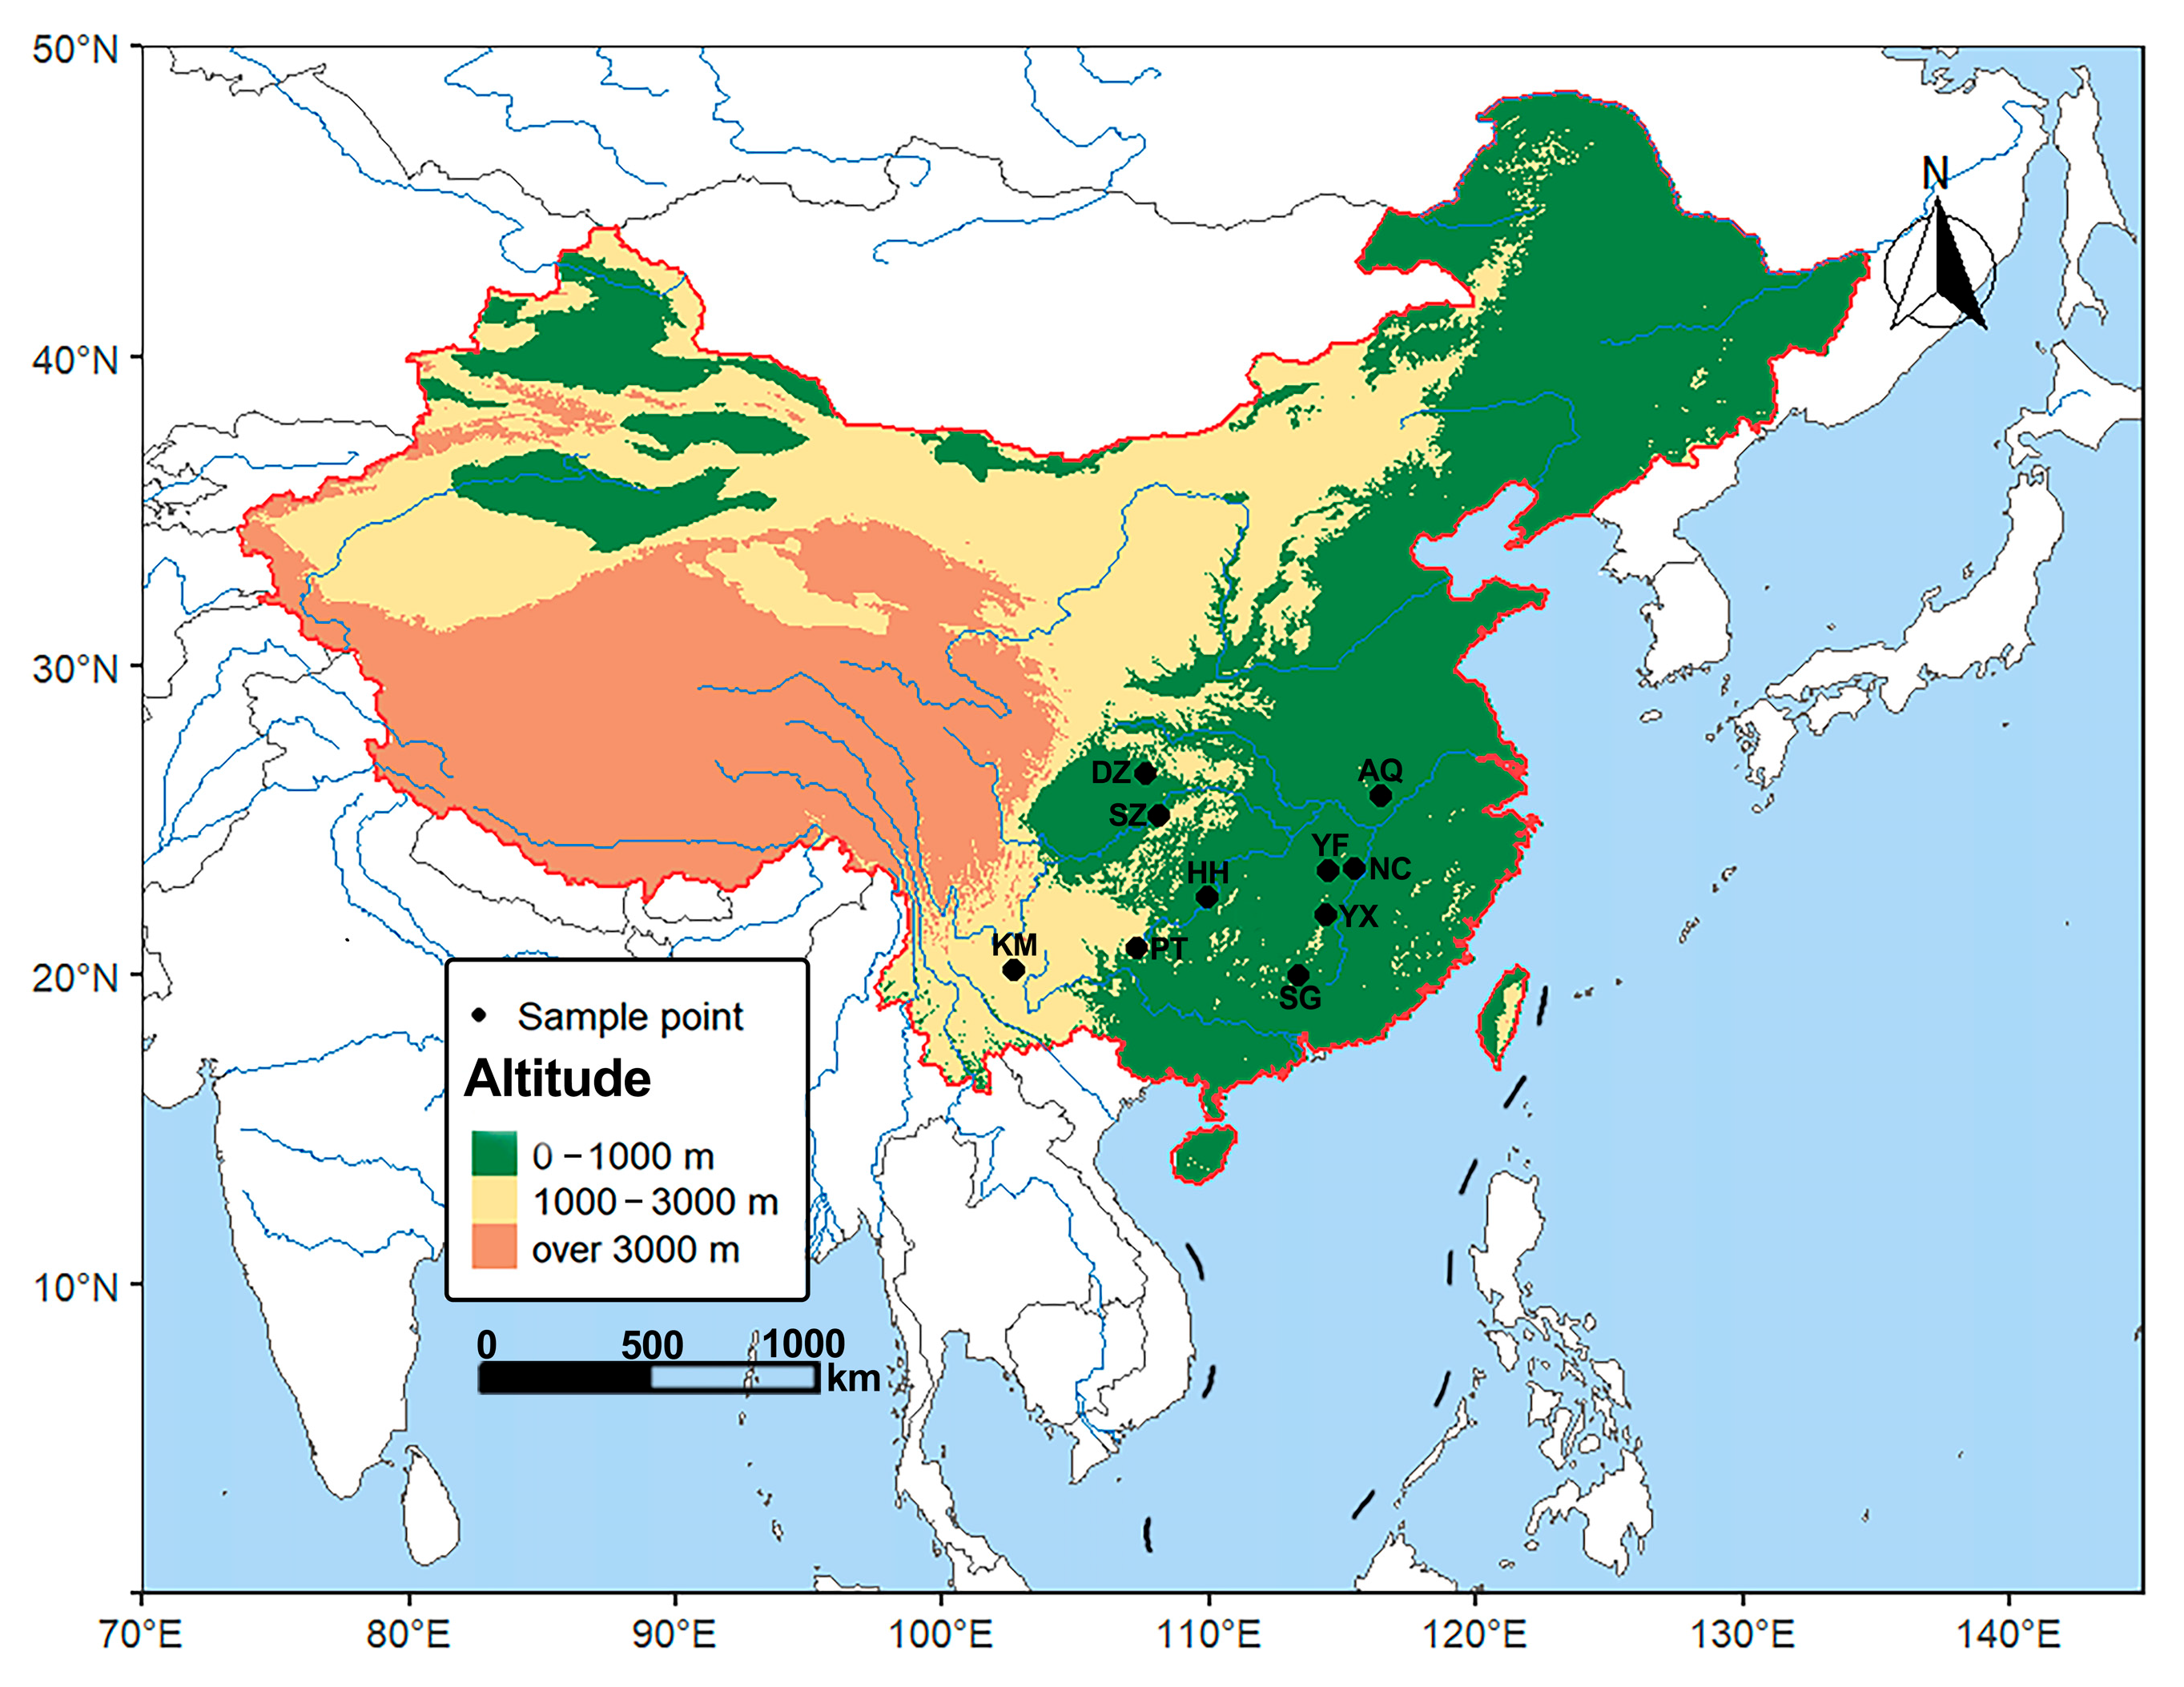
Wild specimens were preferentially collected from native pine forests. Basidiocarps collected within the same forest stand were spaced at least 50 m apart to reduce the likelihood of repeatedly sampling the same below-ground genet; this spacing cannot eliminate clonal sampling completely. We collected 95 basidiocarps, with 7–10 specimens per population. Specimens were identified using morphological and microscopic characters, then dried and preserved in silica gel. The site information is provided in Table 1 and sampling distribution is shown in Figure 2 (map generated with the ggplot2, ggspatial, terra, and sf packages in R, https://cran.r-project.org/package=ggplot2, https://cran.r-project.org/package=ggspatial, https://cran.r-project.org/package=terra, https://cran.r-project.org/package=sf, accessed on 28 July 2026).
Table 1.
Geographic information and sampling characteristics of ten Lactarius vividus populations in southern China.
Figure 2.
Geographic distributions of the ten collection sites of Lactarius vividus populations in southern China. The sampling sites are represented by black dots, and details of their abbreviated codes are shown in Table 1.
Genomic DNA was extracted from individual basidiocarps using a modified cetyltrimethylammonium bromide (CTAB) method [21]. DNA quality was assessed by 1% agarose gel electrophoresis, and samples exhibiting clear bands and intact structure were stored at −20 °C.
2.2. Development and Screening of SSR Markers
The whole-genome assembly of L. vividus strain 141, previously reported by Lebreton et al. [22], was downloaded from GenBank (https://www.ncbi.nlm.nih.gov/datasets/genome/GCA_021527035.1/; accessed on 30 September 2025). Dinucleotide and trinucleotide repeats were identified with the MIcroSAtellite v2.1 identification tool (MISA), and primers were designed with Primer3 [23,24]. Candidate primers were screened for a length of 18–22 nt, a melting temperature of approximately 59–61 °C, an expected product of 100–350 bp and a GC content of 50–60%. After preliminary testing of amplification stability, seven loci (Lv5, Lv6, Lv10, Lv15, Lv33, Lv34 and Lv61) were selected. The 5′end of each forward primer was labelled with 6-FAM. Primer and repeat information is given in Table 2.
Table 2.
Simple sequence repeat markers developed and used for genotyping basidiocarps of Lactarius vividus from southern China.
PCR amplification was performed in a 25 μL reaction containing 1 μL template DNA, 1 μL each of forward and reverse primers (10 μmol/L), 6.25 μL of 2 × Taq Master Mix (Sangon Biotech, Shanghai, China) and 15.75 μL ddH2O. The programme comprised an initial denaturation at 94 °C for 4 min; 35 cycles of 94 °C for 30 s, 56 °C for 30 s and 72 °C for 20 s; and a final extension at 72 °C for 10 min. Products were separated by capillary electrophoresis (Sangon), and fragment sizes were scored with GeneMarker v2.9.0 [25]. PIC values were calculated with Cervus v3.0.7 [26].
2.3. Data Analysis Software and Parameter Settings
GenAlEx 6.5 was used to calculate the number of alleles (Na), effective number of alleles (Ne), unbiased allelic diversity (uH), observed heterozygosity (Ho) and expected heterozygosity (He) [27,28]. Chi-square tests were used to evaluate departures from Hardy–Weinberg equilibrium for each locus and population. AMOVA partitioned variation among populations, among individuals within populations and within individuals; significance was assessed with 9999 permutations [29]. HWE results were plotted in R with dplyr, tidyr, stringr and ggplot2 (https://cran.r-project.org/package=dplyr, https://cran.r-project.org/package=tidyr, https://cran.r-project.org/package=stringr, https://cran.r-project.org/package=ggplot2, accessed on 17 September 2026). Mantel test was conducted in R with vegan (https://cran.r-project.org/web/packages/vegan/, accessed on 28 July 2026) [30,31]. To visualise the geographic pattern of genetic diversity across the sampled range, the relationship between longitude and uH, with point size representing Na, was plotted in R using ggplot2 and ggrepel (https://cran.r-project.org/package=ggplot2, https://cran.r-project.org/package=ggrepel, accessed on 24 September 2026). Geographic distances were calculated from sampling coordinates, and linearised genetic distances were correlated with log-transformed geographic distances. STRUCTURE 2.3.4 was run for K = 1–10 with ten independent runs per K, a burn-in of 200,000 iterations and 1,200,000 MCMC iterations [32,33,34]. ΔK was calculated using the Evanno method [35]. DAPC was performed in R with adegenet (http://adegenet.r-forge.r-project.org/, accessed on 27 July 2026) [36,37]. A UPGMA tree based on Nei’s genetic distance was generated in MEGA X 10.2.6 and visualised with iTOL (https://itol.embl.de/, accessed on 26 July 2026) [38,39].
3. Results
3.1. Allelic and Genetic Diversity Across Different Geographic Populations
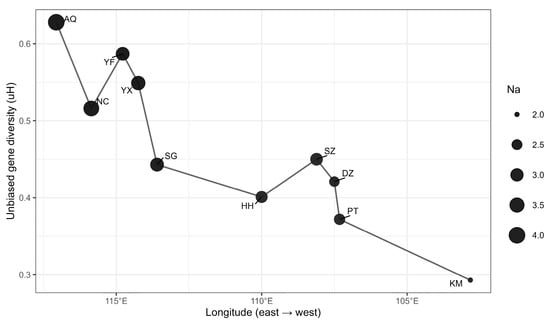
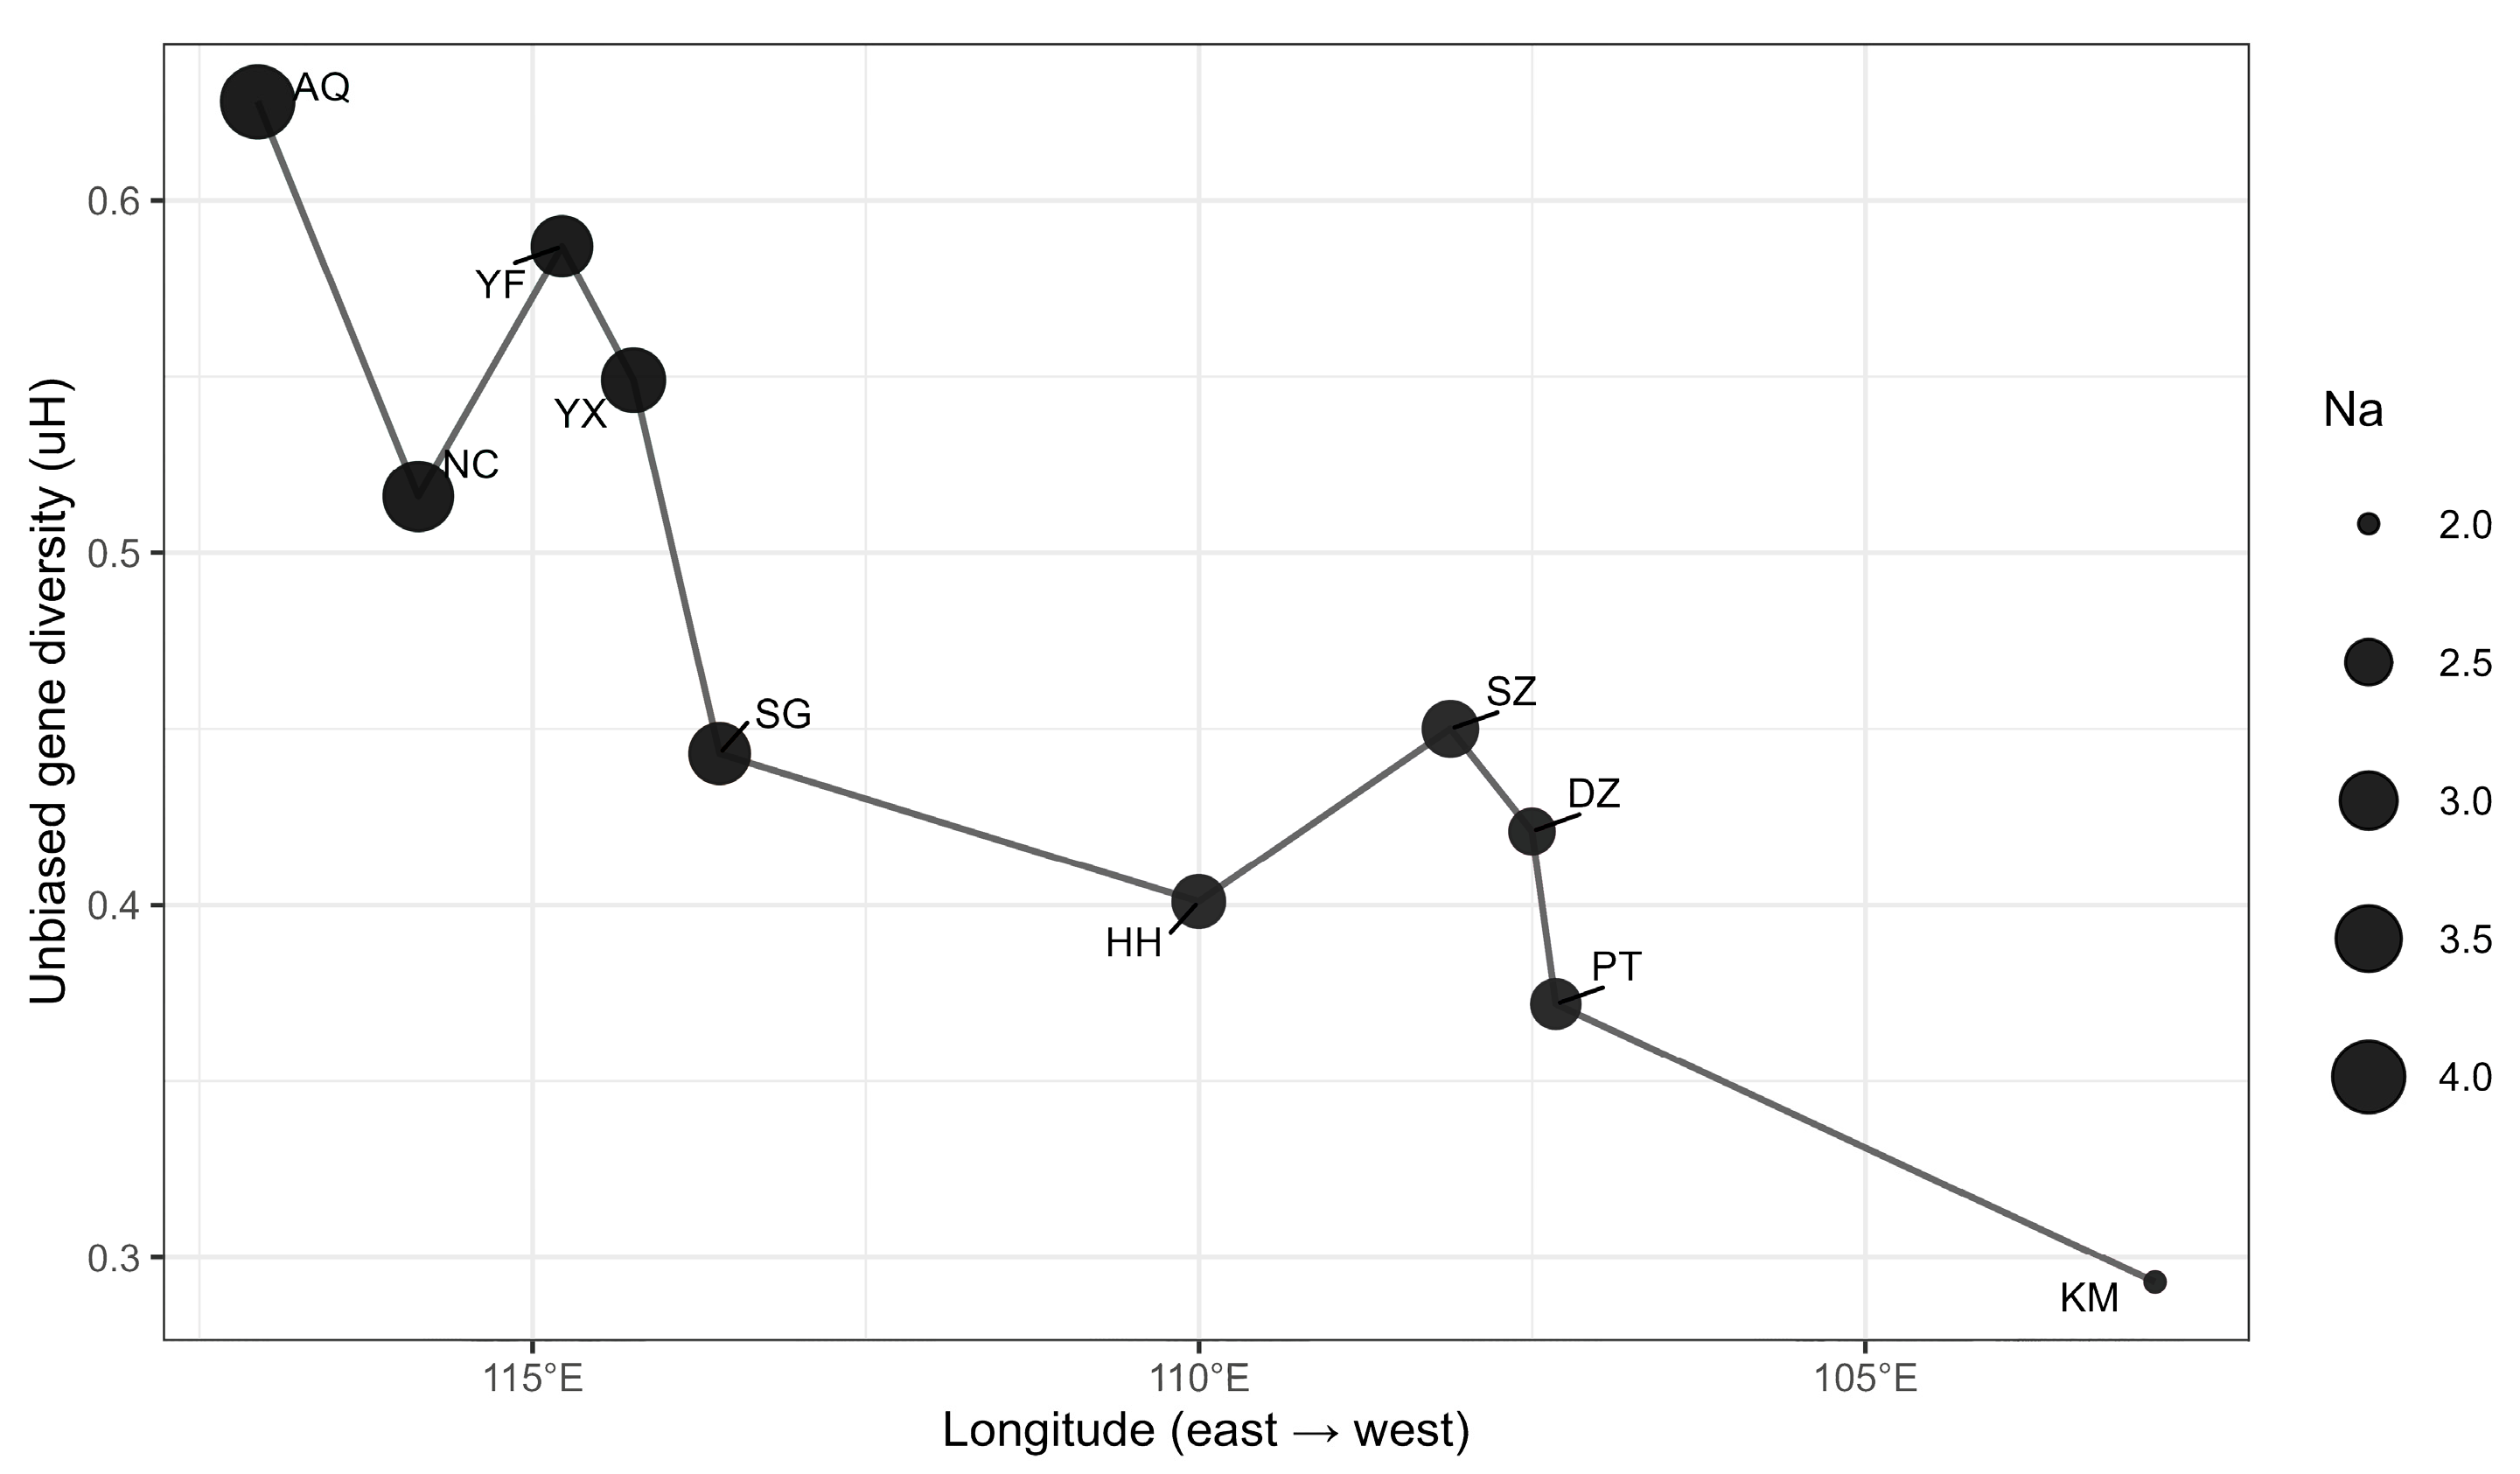
Genotypes were obtained for all 95 samples at seven SSR loci; detailed allele and genotype information for each sample is provided in Supplementary Table S1. PIC values were 0.288, 0.846, 0.401, 0.575, 0.807, 0.530 and 0.380 (mean = 0.547). Across populations, mean Na was 2.986, mean Ne was 2.232, mean He was 0.441 and mean uH was 0.466. AQ had the highest Na (4.000) and Ne (2.902), whereas KM had the lowest Na (2.000) and Ne (1.518). AQ also had the highest uH (0.628), followed by YF (0.587) and YX (0.549); KM had the lowest uH (0.293). The values, therefore, indicate higher allelic and genetic diversity in AQ and lower diversity in KM. Diversity parameters for all populations are shown in Table 3, with comparisons with other macrofungi summarised in Table 4, and the geographic patterns of Na and uH are illustrated in Figure 3.
Table 3.
Mean number of alleles and allelic diversity (±standard error) at the seven SSR loci within ten local populations of Lactarius vividus in southern China.
Table 4.
Comparison of genetic diversity parameters between Lactarius vividus and other macrofungi.
Figure 3.
Genetic diversity of Lactarius vividus across an east-to-west transect encompassing ten different locations in China, as determined by SSR. The x-axis represents longitude, the y-axis represents unbiased gene diversity (uH), and point size indicates the number of alleles (Na). Population codes are defined in Table 1.
3.2. Hardy–Weinberg Equilibrium Tests
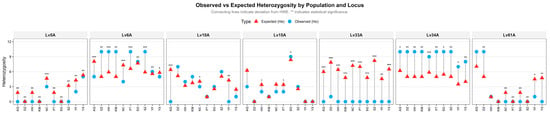
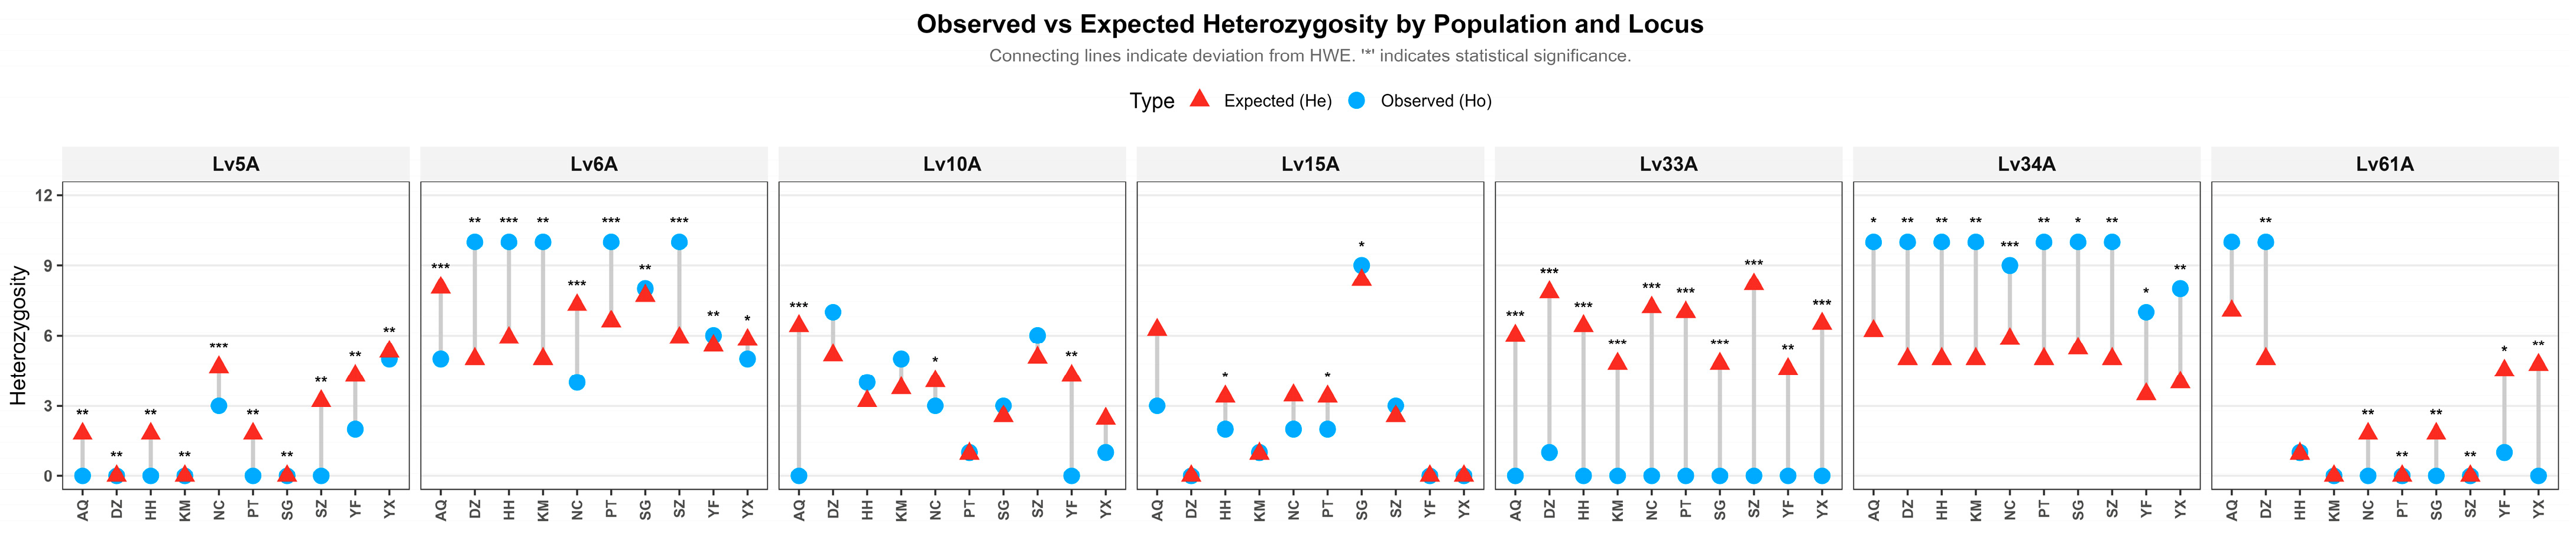
Results of HWE tests (Figure 4) revealed that Ho was markedly lower than He for the majority of population-locus combinations. At certain loci (e.g., Lv5 and Lv33), Ho was extremely low across the entire study range. Of the 70 population-locus combinations tested, 53 showed significant deviation from HWE, of which 35 were towards heterozygote deficiency. However, the statistical results for each locus across these ten local populations showed a mixed pattern, indicating that the overall heterozygote deficiency was not uniform across loci or populations.
Figure 4.
Deviations from Hardy–Weinberg equilibrium among ten populations of Lactarius vividus in southern China based on chi-square tests. *, ** and *** indicate significant deviations from Hardy–Weinberg equilibrium at p < 0.05, p < 0.01 and p < 0.001, respectively.
3.3. Population Genetic Differentiation and Spatial Genetic Structure
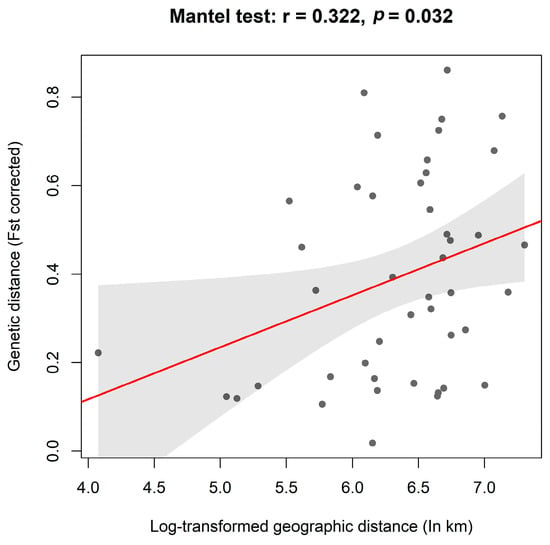
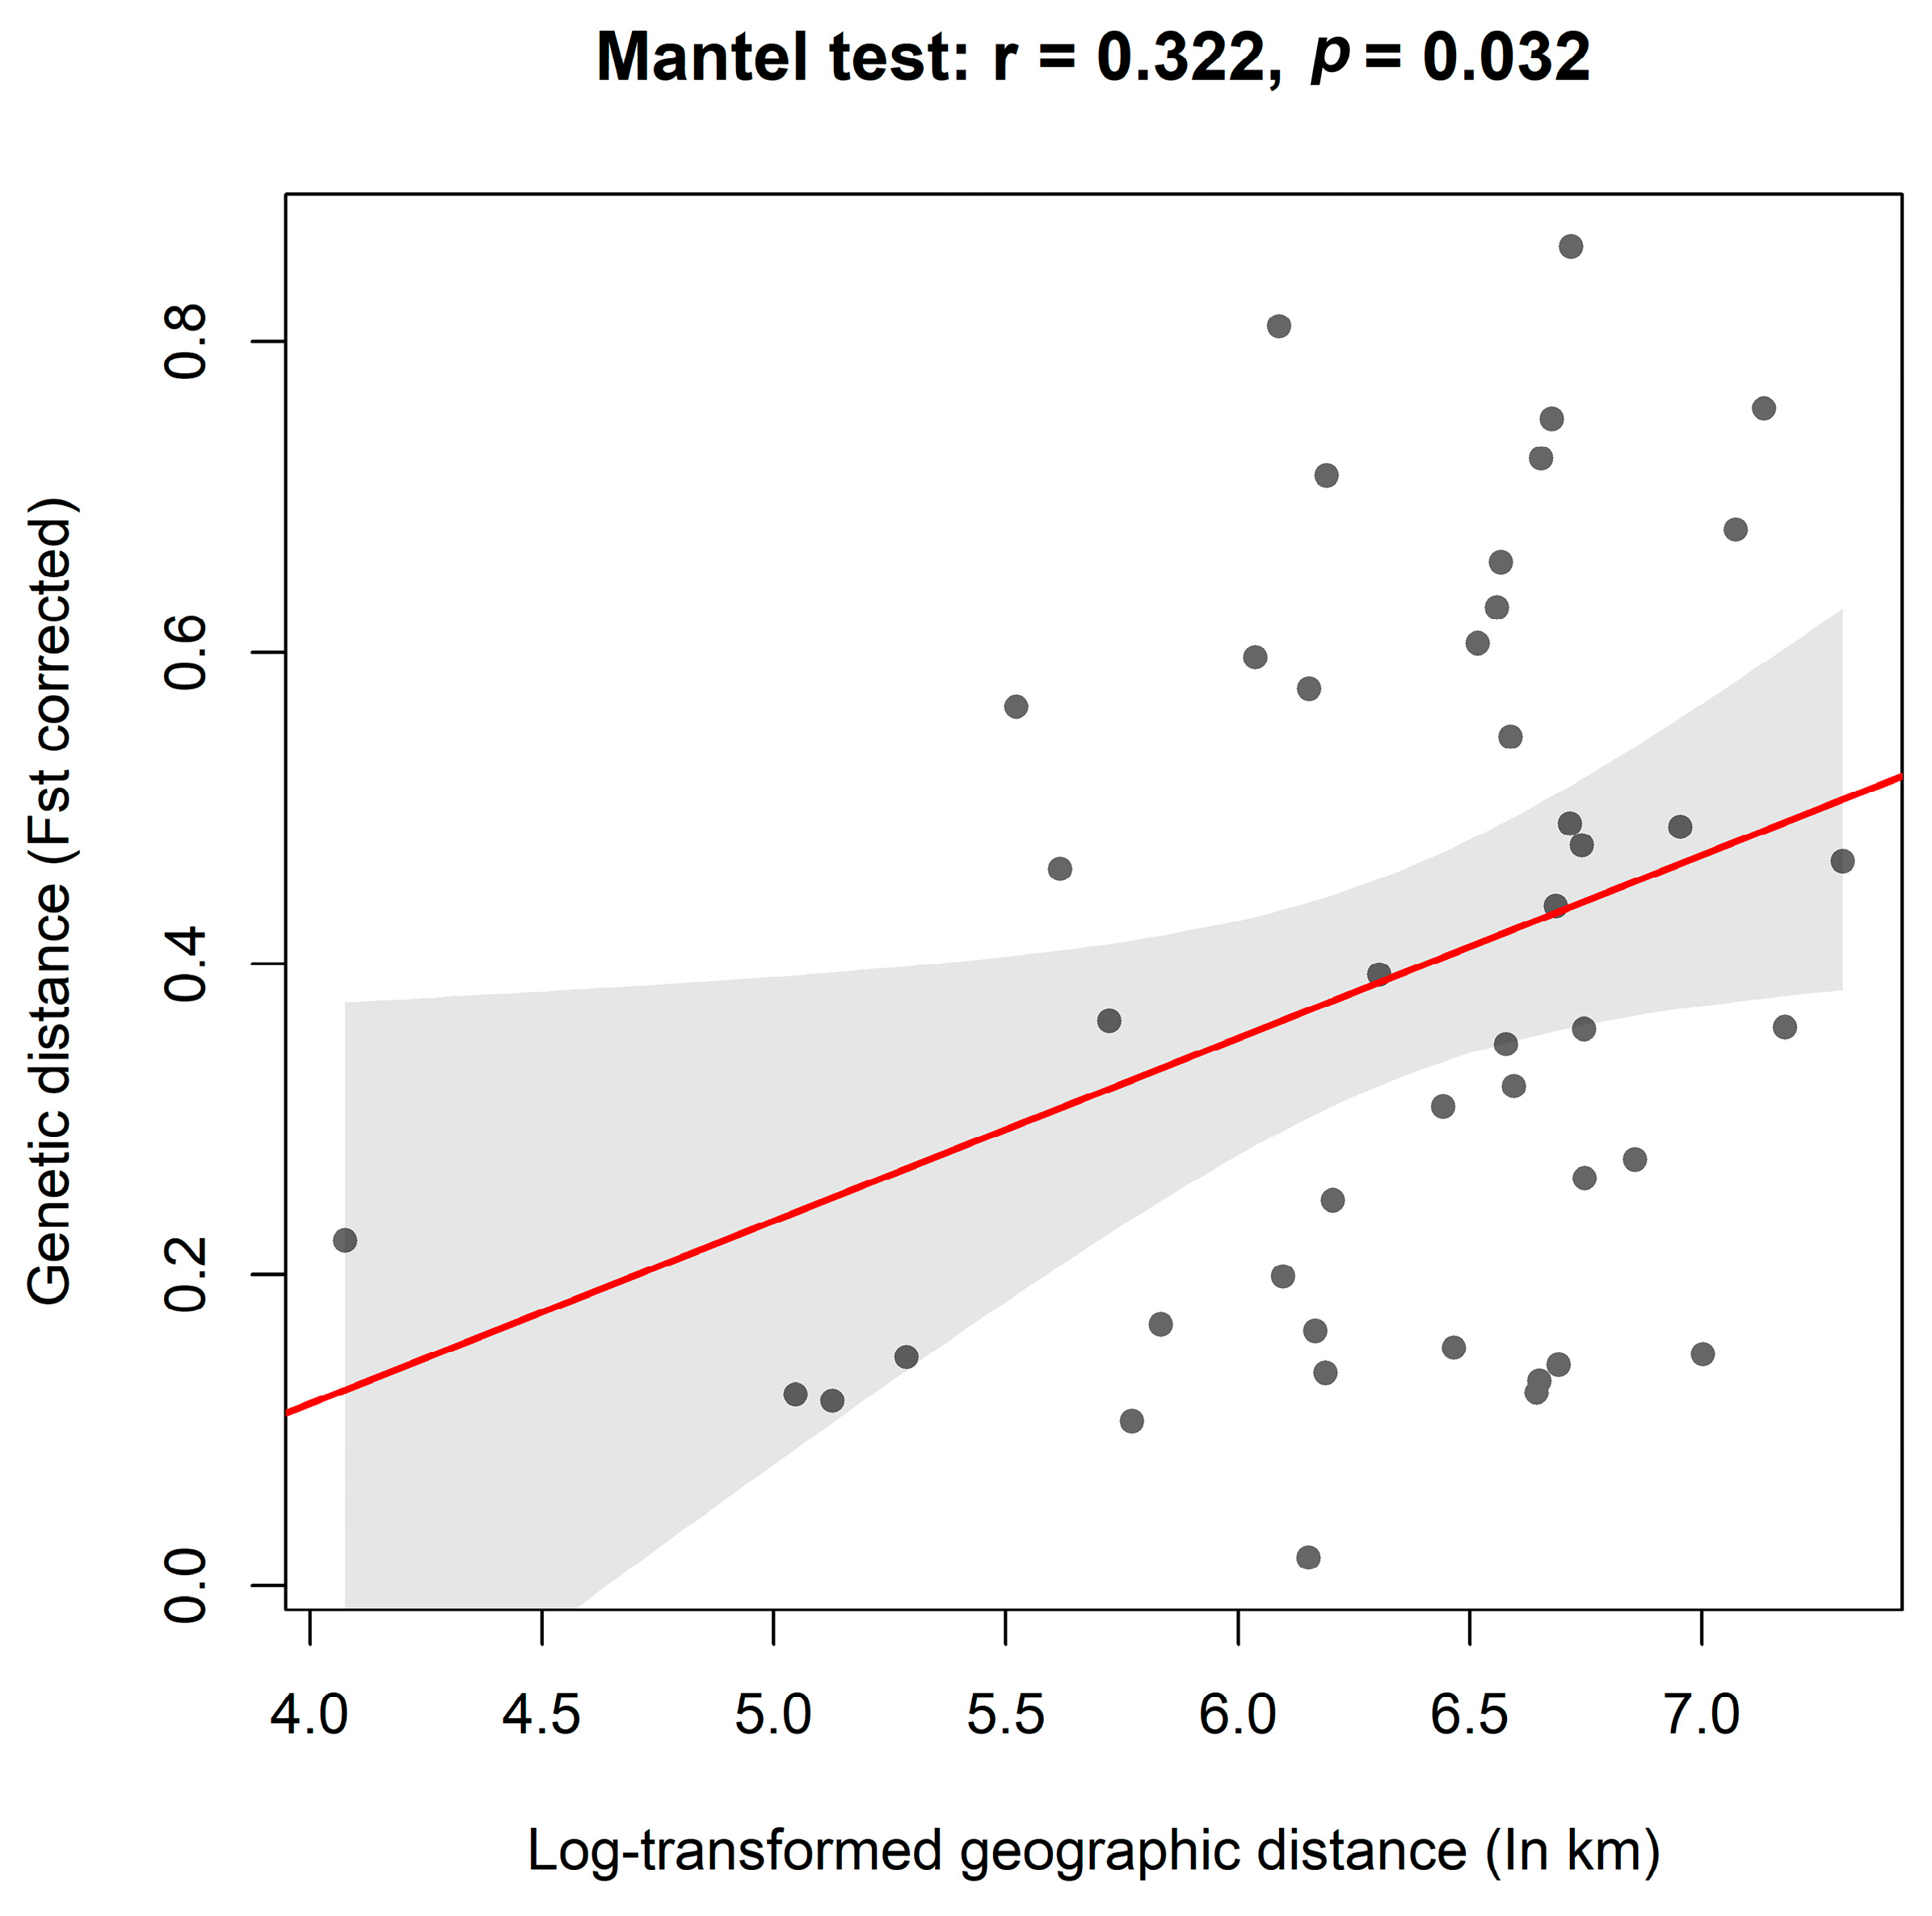
AMOVA results (Table 5) showed that among-population variation accounted for 63% of the total genetic variation, among-individual variation for 34%, and within-individual variation for 3%. These results indicate that most genetic variation was partitioned among geographic populations. To further assess whether this population differentiation was spatially structured, the Mantel test (Figure 5) was used to examine the relationship between genetic and geographic distances. The analysis detected a significant positive correlation between genetic distance and log-transformed geographic distance (r = 0.322, p = 0.032), supporting an IBD pattern across the sampled range.
Table 5.
Two-level hierarchical AMOVA of Lactarius vividus genetic variability in southern China.
Figure 5.
Relationship between genetic and geographic distances among ten populations of Lactarius vividus in southern China based on seven SSR loci, as assessed by a Mantel test. The red line indicates the fitted linear trend, and the grey area represents the 95% confidence interval.
3.4. Genetic Clustering Analysis
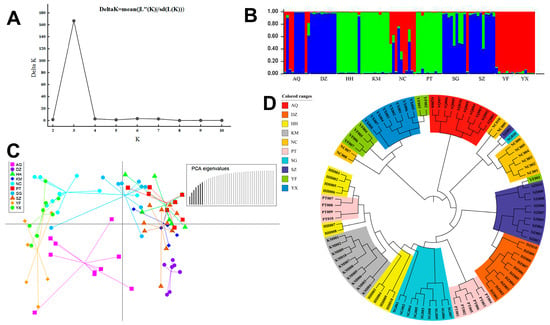
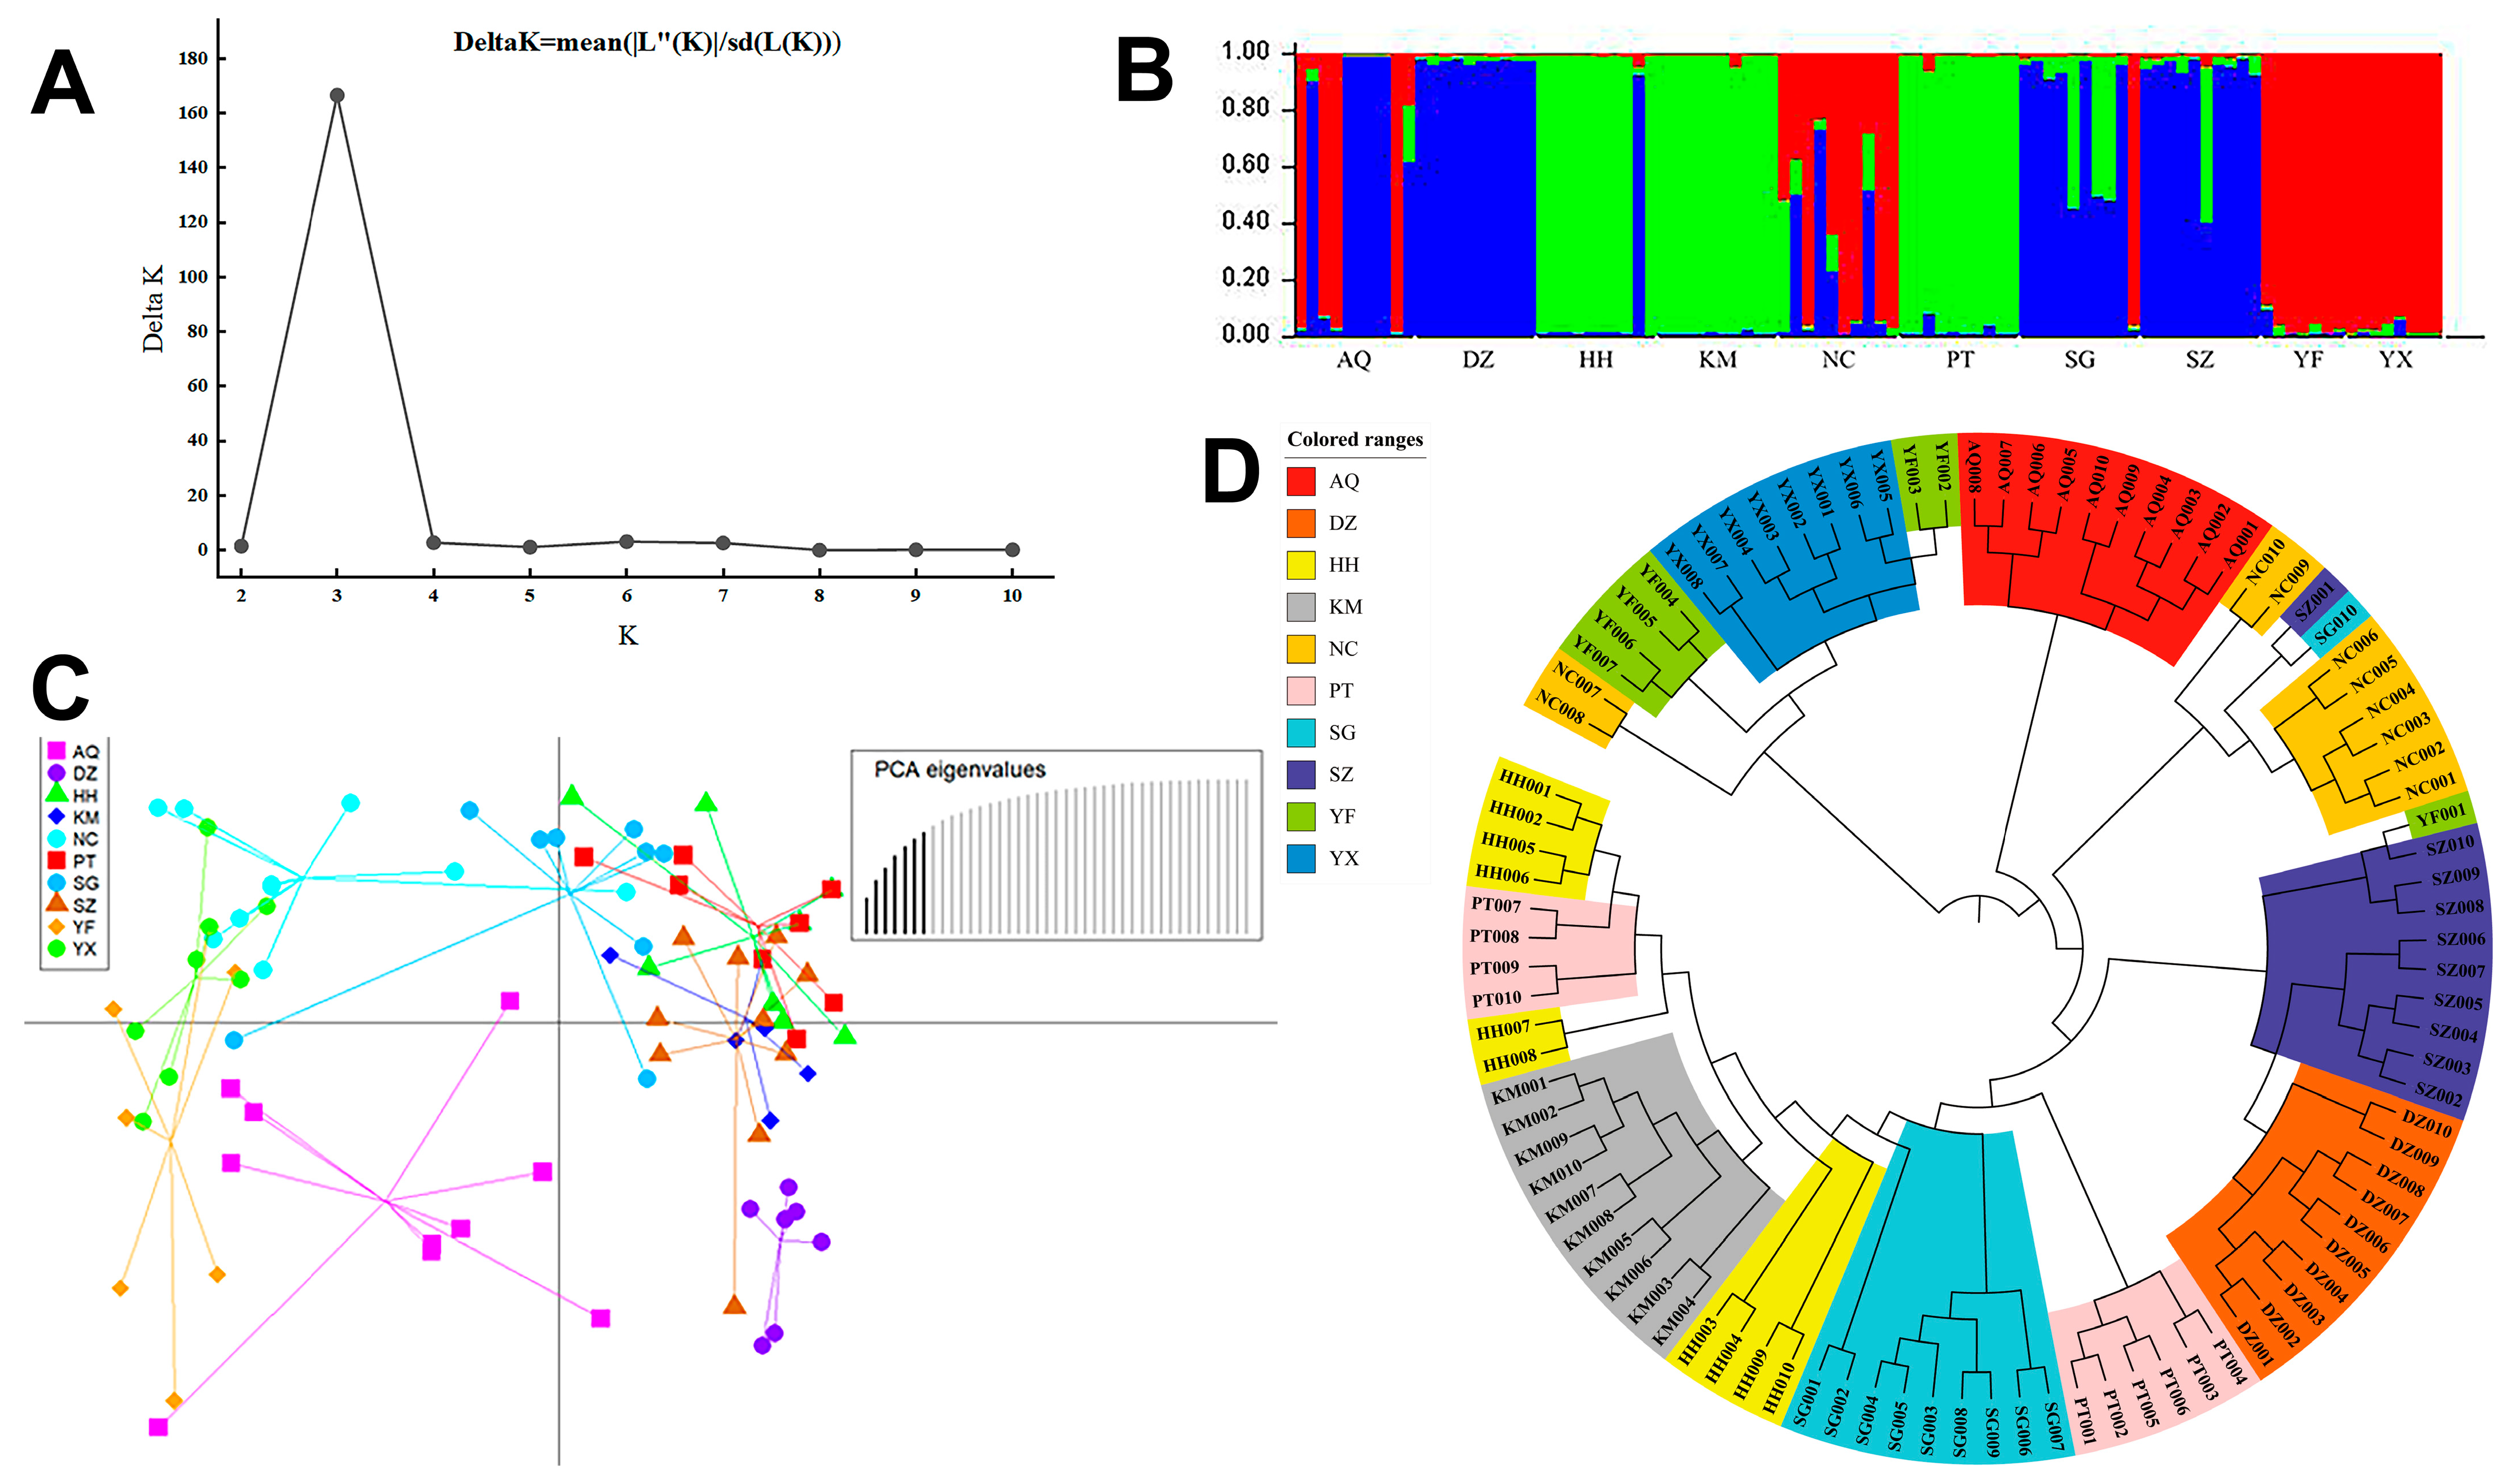
In the STRUCTURE analysis, the ΔK statistic peaked at K = 3 (Figure 6A), indicating that K = 3 is the optimal number of genetic clusters. In the STRUCTURE bar plot (Figure 6B), the distribution of populations corresponding to each colour exhibited a clear pattern: Jiangxi populations YX and YF were composed almost entirely of the red ancestral component, with only trace contributions from other components; Anhui AQ and Jiangxi NC populations displayed complex bar patterns and harboured multiple ancestral signals, representing a transitional zone where lineages intersect; Sichuan DZ, Chongqing SZ and Guangdong SG populations were dominated by the blue ancestral component; and Hunan HH, Guizhou PT and Yunnan KM populations were dominated by the green ancestral component. DAPC (Figure 6C) projected all samples into a multidimensional space, revealing that samples formed discrete clusters, with some individuals situated in transitional regions between clusters. Geographically adjacent populations exhibited greater spatial overlap. The UPGMA circular tree (Figure 6D) revealed a tendency for individuals of different geographic origins to cluster together, while individuals from different populations were also admixed in some cases, consistent with historical or ongoing gene flow.
Figure 6.
Genetic clusters of Lactarius vividus samples and their geographic distributions. (A) Delta K was calculated to estimate the optimal genetic population number K. (B) STRUCTURE ver.2.3.4 was used to assign each of the 95 samples to a genetic subpopulation and visualize the probability of belonging to each subpopulation (K = 3). Samples are arranged in a row and grouped by geographic subpopulation within the whole sample. Each color represents the isolate belonging to a different genetic subpopulation. (C) Genetic clustering using discriminant analysis of principal components (DAPC) of 95 samples from ten L. vividus geographic populations. (D) UPGMA dendrogram of ten geographic populations of L. vividus based on Nei’s genetic distance at seven SSR loci.
4. Discussion
The seven SSR loci had a mean PIC value of 0.547 and resolved genetic variation among the sampled basidiocarps. Across the sampling range, mean Na, Ne, and He were 2.986, 2.232, and 0.441, respectively. Although differences in marker systems and sample sizes limit direct comparisons, these diversity estimates were similar in magnitude to those reported for other macrofungi, including O. sinensis, L. edodes, and T. matsutake [13,40,41], as summarised in Table 4.
Genetic diversity was highest in the eastern population AQ and lowest in the western population KM (Table 3). The population-level estimates of Na and uH (Figure 3) suggested a general tendency towards higher genetic diversity in some eastern populations and lower diversity in western populations. However, this pattern was not consistent across all ten populations and does not indicate a clear longitudinal gradient. The observed geographic variation may reflect the combined effects of habitat distribution, topography, host distribution, geographic separation and spore dispersal. Reduced connectivity, smaller effective population sizes and stronger genetic drift may contribute to lower diversity in some western populations [42]. The distribution of P. massoniana across the eastern sampling regions provides additional ecological context [43]. Although the sampling populations occurred across regions with different topographic elevations (Figure 2; Table 1), these values represent regional elevation estimates rather than measurements at the actual collection sites. Therefore, the contribution of elevation to the observed geographic variation in genetic diversity cannot be directly assessed. Nevertheless, the relatively small sample sizes (7–10 individuals per population) may have limited the detection of rare alleles. Overall, the observed pattern should be interpreted as a preliminary geographic tendency rather than a definitive east–west gradient.
Fragmentation may reduce host-forest connectivity. However, its effect may depend strongly on dispersal mode. For example, in Rhizopogon alpinus T. Koizumi & K. Nara (Rhizopogonaceae), long-term fragmentation was associated with limited gene flow and elevated inbreeding, whereas the wind-dispersed Suillus spraguei (Berk. & M.A. Curtis) Kuntze (Suillaceae) showed weaker geographic differentiation across the same broader landscape [11]. By contrast, a Russula virescens (Schaeff.) Fr. (Russulaceae) ally in southwestern China showed frequent gene flow among populations despite mountainous terrain [44]. Taken together, these comparisons suggest that habitat fragmentation alone does not determine genetic structure; its effects are also influenced by dispersal mode, host dependence, population size, and historical habitat connectivity. In the present study, forest fragmentation was not quantitatively assessed at the individual sampling sites. Therefore, its contribution to the observed genetic differentiation among L. vividus populations remains uncertain, and the comparisons above should be regarded as ecological context rather than direct evidence of fragmentation effects in this species. In addition to geographic and landscape differences, variation in host-forest composition is another ecological aspect worth considering when interpreting the genetic patterns observed among populations. In the present study, the inclusion of KM extended the western coverage of the sampling range and represented a population sampled from a different pine-forest setting. KM was the only population associated with P. yunnanensis, a widely distributed and locally dominant pine in Kunming [45]. This observation is consistent with laboratory evidence that L. vividus can form ectomycorrhizae with P. yunnanensis [46]. Furthermore, the significant isolation-by-distance pattern detected in this study suggests that geographic separation may contribute to genetic differentiation between populations. However, because only one population was sampled from P. yunnanensis forests and mycorrhizal root tips were not examined, the effects of host identity cannot be independently evaluated, nor can direct mycorrhizal formation at KM be confirmed. Therefore, the lower genetic diversity observed in KM may reflect the combined effects of geographic separation, population history, and host-forest conditions, rather than any single factor.
Heterozygous genotypes occurred in every sampled population, indicating that the samples were not uniformly homozygous; however, this observation does not establish heterothallism, homothallism, or a particular selfing mechanism. Determining the mating system of L. vividus would require mating-type gene analyses, controlled crosses, or other direct evidence of compatibility. Heterothallism has been widely reported in basidiomycetes, including Flammulina velutipes (Curtis) Singer (Physalacriaceae), L. edodes and Pleurotus ostreatus (Jacq.) P. Kumm. (Pleurotaceae) [47,48,49], but the mating system of L. vividus cannot be inferred from SSR data alone. Similarly, in related Lactarius species, inbreeding has been associated with excess homozygosity and pronounced heterozygote deficiency [7], which may partly explain the pattern observed in L. vividus. However, heterozygote deficiency may also arise from the Wahlund effect and null alleles [50,51]. The Wahlund effect occurs when genetically differentiated subpopulations are pooled, thereby reducing observed heterozygosity and producing an apparent heterozygote deficit [52]. Null alleles at SSR loci may similarly contribute to heterozygote deficiency because mutations in primer-binding regions can prevent allele amplification, causing true heterozygotes to be scored as homozygotes and biasing estimates of genetic diversity and population differentiation [53,54]. A comparable combination of heterozygote deficiency, departures from HWE, and geographic differentiation was reported in Trogia venenata Zhu L. Yang, Yan C. Li & L.P. Tang (Marasmiaceae) from southwestern China, where the pattern was interpreted as consistent with prevalent inbreeding and limited gene flow [55].
AMOVA showed that genetic differentiation among populations accounted for 63% of the total genetic variation, compared with 34% among individuals within populations and only 3% within individuals. This large among-population component indicates substantial differences in allele frequencies among populations and suggests that gene exchange is insufficient to homogenise their genetic variation. Several processes may have contributed to this structure. Geographic barriers may limit propagule exchange among populations, while local genetic drift may alter allele frequencies when effective population sizes are small. Habitat fragmentation could also contribute to restricted propagule exchange, although its effects were not directly evaluated in this study. Moreover, the obligate ectomycorrhizal association of L. vividus with Pinus may restrict establishment to suitable host patches, thereby linking fungal distribution to the distribution and continuity of compatible pine forests. The 63% among-population component is considerably higher than the approximately 17% reported for L. hatsudake in southern China using the same marker type [7], suggesting that the two congeners may differ in dispersal, host association, demographic history, or sensitivity to landscape structure.
The Mantel test detected a significant positive correlation between genetic and geographic distances (r = 0.322, p = 0.032), supporting an IBD pattern across the sampled range. The moderate correlation suggests that geographic distance explains part, but not all, of the observed genetic differentiation. One plausible explanation is that dispersal follows a stepping-stone pattern, in which neighbouring populations exchange propagules more frequently than distant populations, while genetic drift gradually increases divergence with geographic distance. STRUCTURE identified three genetic clusters; DAPC and UPGMA analyses further revealed geographic differentiation with admixture or genetic overlap among some samples. These patterns suggest that the populations are neither completely isolated nor genetically homogeneous. Mixed ancestry may reflect shared ancestral variation, incomplete lineage sorting, or occasional gene exchange; however, the present analyses cannot distinguish among these processes. Notably, the significant IBD pattern in L. vividus contrasts with the weak or absent IBD reported for L. hatsudake [7], suggesting that closely related ectomycorrhizal mushrooms may respond differently to similar mountain landscapes.
5. Conclusions
We developed seven SSR markers for L. vividus and used them to characterise genetic diversity and population differentiation in ten wild populations across seven provinces in China. AMOVA revealed substantial differentiation among populations, with 63% of the total genetic variation partitioned among populations. The Mantel test detected a significant positive correlation between genetic and geographic distances (r = 0.322, p = 0.032), consistent with an IBD pattern across the sampled range. Genetic diversity was highest in AQ and lowest in KM, with population-level estimates suggesting a general geographic tendency towards higher diversity in some eastern populations and lower diversity in western populations. STRUCTURE, DAPC and UPGMA analyses revealed geographic differentiation, together with admixture or genetic overlap among some samples. Most population-locus combinations showed a heterozygote deficiency. These findings provide the first population-level SSR-based assessment of genetic diversity and spatial genetic structure in L. vividus, offering a molecular basis for understanding its geographic genetic variation and informing conservation planning. From a conservation perspective, populations with relatively high genetic diversity, such as AQ, YF and YX, represent important reservoirs of genetic variation, while genetically differentiated populations such as KM should also be considered to maintain the overall genetic representation of the species. Protecting their associated pine-forest habitats may help preserve the genetic diversity and population structure of L. vividus. Further studies incorporating broader population sampling, genome-wide markers and ecological data will help clarify the factors shaping population genetic structure and refine conservation priorities.
Supplementary Materials
The following supporting information can be downloaded at: https://www.mdpi.com/article/10.3390/jof12110843/s1, Table S1: Multilocus genotypes of Lactarius vividus from southern China.
Author Contributions
Conceptualization, K.Z.; methodology, Z.-K.Z. and S.-T.Y.; validation, Z.-K.Z. and S.-T.Y.; formal analysis, Z.-K.Z. and L.L.; investigation, Z.-K.Z. and L.L.; resources, K.Z.; data curation, Z.-K.Z. and S.-T.Y.; writing—original draft preparation, Z.-K.Z.; writing—review and editing, K.Z.; visualization, Z.-K.Z. and S.-T.Y.; supervision, K.Z.; project administration, K.Z.; funding acquisition, K.Z., Z.-K.Z. and S.-T.Y. All authors have read and agreed to the published version of the manuscript.
Funding
This work was supported by the National Natural Science Foundation of China [32360153] and the Innovation Training Programs for Graduates in Jiangxi Science and Technology Normal University [YC2026-X25, YC2026-X60].
Institutional Review Board Statement
Not applicable.
Informed Consent Statement
Not applicable.
Data Availability Statement
The original contributions presented in this study are included in the article/Supplementary Materials. Further inquiries can be directed to the corresponding authors.
Acknowledgments
The authors acknowledge Jieyu Huang, Xinxin Liang, and Yuting Zheng from Jiangxi Science and Technology Normal University for their assistance in sample collection.
Conflicts of Interest
The authors declare no conflicts of interest.
References
- Wang, X.; Nuytinck, J.; Verbeken, A. Lactarius vividus sp. nov. (Russulaceae, Russulales), a widely distributed edible mushroom in central and southern China. Phytotaxa 2015, 231, 63–72. [Google Scholar] [CrossRef] [Scilit]
- Han, Y.; Liang, C.Z.; Liu, P.G.; Nuytinck, J.; Wang, X.H. Lactarius guangdongensis sp. nov. (Russulaceae, Russulales), a species of Lactarius sect. Deliciosi growing with a vulnerable five-needle pine, Pinus kwangtungensis. Phytotaxa 2019, 393, 278–286. [Google Scholar] [CrossRef] [Scilit]
- Wang, R.; Guerin-Laguette, A.; Huang, L.L.; Wang, X.H.; Butler, R.; Wang, Y.; Yu, F.Q. Mycorrhizal syntheses between Lactarius spp. section Deliciosi and Pinus spp. and the effects of grazing insects in Yunnan, China. Can. J. For. Res. 2019, 49, 616–627. [Google Scholar] [CrossRef] [Scilit]
- Wang, J.; Liu, Z.; Pan, M.; Yang, Y. One new host records of Apiospora arundinis from Lactarius vividus. J. Agric. Sci. 2024, 16, 54. [Google Scholar] [CrossRef] [Scilit]
- Xue, Z.; Liang, J.; Ying, G.; Lv, M.; Li, L.; Gao, F.; Ye, H. Molecular identification and genetic distance analysis on Lactarius hatsudake and its close species. Chin. Edible Fungi. 2013, 32, 36–37. [Google Scholar] [CrossRef]
- Zhao, K.; Mao, M.; Wang, X.; Xu, J. Inbreeding and genetic differentiation among geographic populations of Lactarius hatsudake in southwest China. J. Fungi 2025, 11, 438. [Google Scholar] [CrossRef] [Scilit] [PubMed]
- Yang, S.; Mao, M.; Huang, J.; Gu, B.; Zhao, K. Genetic diversity and gene flow of the ectomycorrhizal mushroom Lactarius hatsudake in Southern China: Evidence from SSR markers. J. Fungi 2026, 12, 280. [Google Scholar] [CrossRef] [Scilit] [PubMed]
- Xu, J.; Cai, L. Diversity, population genetics, and phylogeography of selected wild mushrooms. Mycology 2015, 6, 77. [Google Scholar] [CrossRef] [Scilit][Green Version]
- Morris, M.H.; Smith, M.E.; Rizzo, D.M.; Rejmanek, M.; Bledsoe, C.S. Contrasting ectomycorrhizal fungal communities on the roots of co-occurring oaks (Quercus spp.) in a California woodland. New Phytol. 2008, 178, 167–176. [Google Scholar] [CrossRef] [Scilit] [PubMed]
- Peay, K.G.; Schubert, M.G.; Nguyen, N.H.; Bruns, T.D. Measuring ectomycorrhizal fungal dispersal: Macroecological patterns driven by microscopic propagules. Mol. Ecol. 2012, 21, 4122–4136. [Google Scholar] [CrossRef] [Scilit] [PubMed]
- Koizumi, T.; Nara, K. Population genetic consequences of habitat fragmentation in ectomycorrhizal fungi with different dispersal mechanisms: Implications from ice-aged relict forests across the Japanese archipelago. BMC Ecol. Evol. 2025, 26, 1. [Google Scholar] [CrossRef] [Scilit] [PubMed]
- Kurokochi, H.; Zhang, S.; Takeuchi, Y.; Tan, E.; Asakawa, S.; Lian, C. Local-level genetic diversity and structure of matsutake mushroom (Tricholoma matsutake) populations in Nagano Prefecture, Japan, revealed by 15 microsatellite markers. J. Fungi 2017, 3, 23. [Google Scholar] [CrossRef] [Scilit] [PubMed]
- Li, J.; Yin, X.; Zhao, Y.; Yang, S.; Vaario, L.; Yang, X. Microsatellite markers for the prized matsutake mushroom (Tricholoma matsutake, Tricholomataceae). Appl. Plant Sci. 2018, 6, e01202. [Google Scholar] [CrossRef] [Scilit] [PubMed]
- Hoffman, J.I.; Nagel, R.; Litzke, V.; Wells, D.A.; Amos, W. Genetic analysis of Boletus edulis suggests that intra-specific competition may reduce local genetic diversity as a woodland ages. R. Soc. Open Sci. 2020, 7, 200419. [Google Scholar] [CrossRef] [Scilit] [PubMed]
- Zhu, H.; Chen, Z.; Hu, Y.; Li, G.; Yao, X.; Cao, L. Nutritional value, elemental bioaccumulation and antioxidant activity of fruiting bodies and mycelial cultures of an unrecorded wild Lactarius hatsudake from Nanyue mountainous region in China. Food Res. Int. 2023, 173, 113358. [Google Scholar] [CrossRef] [Scilit] [PubMed]
- Oliveira, M.; Azevedo, L. Molecular markers: An overview of data published for fungi over the last ten years. J. Fungi 2022, 8, 803. [Google Scholar] [CrossRef] [Scilit] [PubMed]
- Selkoe, K.A.; Toonen, R.J. Microsatellites for ecologists: A practical guide to using and evaluating microsatellite markers. Ecol. Lett. 2006, 9, 615–629. [Google Scholar] [CrossRef] [Scilit] [PubMed]
- Tang, X.; Mi, F.; Zhang, Y.; He, X.; Cao, Y.; Wang, P.; Liu, C.; Yang, D.; Dong, J.; Zhang, K.; et al. Diversity, population genetics, and evolution of macrofungi associated with animals. Mycology 2015, 6, 94–109. [Google Scholar] [CrossRef] [Scilit] [PubMed][Green Version]
- Carneiro, V.M.L.; Luciane, S.; Lima, D.A.; Freitas, M.C.D. Microsatellite markers: What they mean and why they are so useful. Genet. Mol. Biol. 2016, 39, 312–328. [Google Scholar] [CrossRef] [Scilit] [PubMed]
- Li, Y.; Zhou, H.; Shang, J.; Zhou, C.; Wan, J.; Li, J.; Li, W.; Bao, D.; Wu, Y. Genome-Wide SSR markers reveal genetic diversity and establish a core collection for commercial Hypsizygus marmoreus germplasm. J. Fungi 2025, 11, 842. [Google Scholar] [CrossRef] [Scilit] [PubMed]
- Xu, J.; Yoell, H.J.; Anderson, J.B. An efficient protocol for isolating DNA from higher fungi. Trends Genet. 1994, 10, 26–27. [Google Scholar] [CrossRef] [Scilit] [PubMed]
- Lebreton, A.; Tang, N.; Kuo, A.; LaButti, K.; Andreopoulos, W.; Drula, E.; Miyauchi, S.; Barry, K.; Clum, A.; Lipzen, A.; et al. Comparative genomics reveals a dynamic genome evolution in the ectomycorrhizal milk-cap (Lactarius) mushrooms. New Phytol. 2022, 235, 306–319. [Google Scholar] [CrossRef] [Scilit] [PubMed]
- Rozen, S.; Skaletsky, H. Primer3 on the WWW for general users and for biologist programmers. In Bioinformatics Methods and Protocols; Misener, S., Krawetz, S.A., Eds.; Humana Press: Totowa, NJ, USA, 2000; Volume 132, pp. 365–386. [Google Scholar]
- Thiel, T.; Michalek, W.; Varshney, R.; Graner, A. Exploiting EST databases for the development and characterization of genederived SSR-markers in barley (Hordeum vulgare L.). Theor. Appl. Genet. 2003, 106, 411–422. [Google Scholar] [CrossRef] [Scilit] [PubMed]
- Holland, M.M.; Parson, W. GeneMarker® HID: A reliable software tool for the analysis of forensic STR data. J. Forensic Sci. 2011, 56, 29–35. [Google Scholar] [CrossRef] [Scilit] [PubMed]
- Kalinowski, S.T.; Taper, M.L.; Marshall, T.C. Revising how the computer program CERVUS accommodates genotyping error increases success in paternity assignment. Mol. Ecol. 2007, 16, 1099–1106. [Google Scholar] [CrossRef] [Scilit] [PubMed]
- Peakall, R.; Smouse, P.E. GenAlEx 6: Genetic analysis in Excel. Population genetic software for teaching and research. Mol. Ecol. Notes 2006, 6, 288–295. [Google Scholar] [CrossRef] [Scilit]
- Peakall, R.; Smouse, P.E. GenAlEx 6.5: Genetic analysis in Excel. Population genetic software for teaching and research-An update. Bioinformatics 2012, 28, 2537–2539. [Google Scholar] [CrossRef] [Scilit] [PubMed]
- Excoffier, L.; Smouse, P.E.; Quattro, J.M. Analysis of molecular variance inferred from metric distances among DNA haplotypes: Application to human mitochondrial DNA restriction data. Genetics 1992, 131, 479–491. [Google Scholar] [CrossRef] [Scilit] [PubMed]
- Mantel, N. The detection of disease clustering and a generalized regression approach. Cancer Res. 1967, 27, 209–220. [Google Scholar] [PubMed]
- Diniz-Filho, J.A.F.; Soares, T.N.; Lima, J.S.; Dobrovolski, R.; Landeiro, V.L.; Telles, M.P.d.C.; Rangel, T.F.; Bini, L.M. Mantel test in population genetics. Genet. Mol. Biol. 2013, 36, 475–485. [Google Scholar] [CrossRef] [Scilit] [PubMed]
- Rosenberg, N.A. DISTRUCT: A program for the graphical display of population structure. Mol. Ecol. Notes 2004, 4, 137–138. [Google Scholar] [CrossRef] [Scilit]
- Jakobsson, M.; Rosenberg, N.A. CLUMPP: A cluster matching and permutation program for dealing with label switching and multimodality in analysis of population structure. Bioinformatics 2007, 23, 1801–1806. [Google Scholar] [CrossRef] [Scilit] [PubMed]
- Earl, D.A.; VonHoldt, B.M. STRUCTURE HARVESTER: A website and program for visualizing STRUCTURE output and implementing the Evanno method. Conserv. Genet. Resour. 2012, 4, 359–361. [Google Scholar] [CrossRef] [Scilit]
- Evanno, G.; Regnaut, S.; Goudet, J. Detecting the number of clusters of individuals using the software STRUCTURE: A simulation study. Mol. Ecol. 2005, 14, 2611–2620. [Google Scholar] [CrossRef] [Scilit] [PubMed]
- Thibaut, J. adegenet: A R package for the multivariate analysis of genetic markers. Bioinformatics 2008, 24, 1403–1405. [Google Scholar] [CrossRef] [Scilit] [PubMed]
- Babayi, N.; Rafat, A.; Moradi, M.H.; Feizi Derakhshi, M.R. Comparison of principal component analysis (PCA) and discriminant analysis of principal component (DAPC) methods for analysis of population structure in Akhal-Take, Arabian and Caspian horse breeds using genomic data. Iran. J. Anim. Sci. Res. 2021, 13, 453–462. [Google Scholar] [CrossRef] [Scilit]
- Backeljau, T.; De Bruyn, L.; De Wolf, H.; Jordaens, K.; Van Dongen, S.; Winnepennincks, B. Multiple UPGMA and neighborjoining trees and the performance of some computer packages. Mol. Biol. Evol. 1996, 13, 309–313. [Google Scholar] [CrossRef] [Scilit]
- Letunic, I.; Bork, P. Interactive Tree of Life (iTOL) v6: Recent updates to the phylogenetic tree display and annotation tool. Nucleic Acids Res. 2024, 52, W78–W82. [Google Scholar] [CrossRef] [Scilit] [PubMed]
- Wang, X.L.; Yang, R.H.; Yao, Y.J. Development of microsatellite markers for Ophiocordyceps sinensis (Ophiocordycipitaceae) using an ISSR-TAIL-PCR method. Am. J. Bot. 2011, 98, e391–e394. [Google Scholar] [CrossRef] [Scilit] [PubMed]
- Li, C.; Gong, W.; Zhang, L.; Yang, Z.; Nong, W.; Bian, Y.; Kwan, H.S.; Cheung, M.K.; Xiao, Y. Association mapping reveals genetic loci associated with important agronomic traits in Lentinula edodes, shiitake mushroom. Front. Microbiol. 2017, 8, 237. [Google Scholar] [CrossRef] [Scilit] [PubMed][Green Version]
- Abe, H.; Gan, L.; Murata, M.; Nara, K. Habitat fragmentation strongly restricts gene flow in endangered ectomycorrhizal fungal populations: Evidence from Rhizopogon togasawarius. Mol. Ecol. 2024, 33, e17533. [Google Scholar] [CrossRef] [Scilit] [PubMed]
- Ling, Y.; Zhao, J.; Wang, H.; Liu, Y. Diagnosis of potential geographical distribution of Pinus massoniana under climate change. Chin. J. Agrometeorol. 2023, 44, 144–153. [Google Scholar] [CrossRef]
- Cao, Y.; Zhang, Y.; Yu, Z.; Mi, F.; Liu, C.; Tang, X.; Long, Y.; He, X.; Wang, P.; Xu, J. Structure, gene flow, and recombination among geographic populations of a Russula virescens ally from southwestern China. PLoS ONE 2013, 8, e73174. [Google Scholar] [CrossRef] [Scilit] [PubMed]
- Zhang, J.; Wang, C.; Wang, J.; Huang, X.; Zhou, Z.; Zhou, Z.; Cheng, F. Study on forest growing stock volume in Kunming city considering the relationship between stand density and allometry. Forests 2025, 16, 891. [Google Scholar] [CrossRef] [Scilit]
- Wang, R.; Guerin-Laguette, A.; Yu, F.Q. Optimum media for hyphal growth and mycorrhizal synthesis of two Lactarius species. Mycosystema 2020, 39, 1346–1355. [Google Scholar] [CrossRef]
- Van Peer, A.F.; Park, S.Y.; Shin, P.G.; Jang, K.Y.; Yoo, Y.B.; Park, Y.J.; Lee, B.M.; Sung, G.H.; James, T.Y.; Kong, W.S. Comparative genomics of the mating-type loci of the mushroom Flammulina velutipes reveals widespread synteny and recent inversions. PLoS ONE 2011, 6, e22249. [Google Scholar] [CrossRef] [Scilit] [PubMed]
- Byeongsuk, H.; Sinil, K.; Minseek, K.; Jung, M.Y.; Yelin, S.; Jae-San, R.; Hojin, R.; Hyeon-Su, R. Diversity of a mating type in Lentinula edodes and mating type preference in the cultivated strains. J. Microbiol. 2018, 56, 416–425. [Google Scholar] [CrossRef] [Scilit] [PubMed]
- Shnyreva, A.V.; Shnyreva, A.A. Structure analysis of the MatA locus of sexual compatibility in the edible mushroom Pleurotus ostreatus. Dokl. Biochem. Biophys. 2023, 511, 203–211. [Google Scholar] [CrossRef] [Scilit] [PubMed]
- Dharmarajan, G.; Beatty, W.S.; Rhodes, O.E. Heterozygote deficiencies caused by a Wahlund effect: Dispelling unfounded expectations. J. Wildl. Manag. 2012, 77, 226–234. [Google Scholar] [CrossRef] [Scilit]
- De Meeûs, T. Revisiting FIS, FST, Wahlund Effects, and Null Alleles. J. Hered. 2017, 109, 446–456. [Google Scholar] [CrossRef] [Scilit] [PubMed]
- Zhivotovsky, L.A. Relationships between Wright’s FST and FIS statistics in a context of Wahlund Effect. J. Hered. 2015, 106, 306–309. [Google Scholar] [CrossRef] [Scilit] [PubMed]
- Chapuis, M.P.; Estoup, A. Microsatellite null alleles and estimation of population differentiation. Mol. Biol. Evol. 2007, 24, 621–631. [Google Scholar] [CrossRef] [Scilit] [PubMed]
- Waples, R.S. Null Alleles and FIS × FST correlations. J. Hered. 2018, 109, 457–461. [Google Scholar] [CrossRef] [Scilit] [PubMed]
- Mi, F.; Zhang, Y.; Yang, D.; Tang, X.; Wang, P.; He, X.; Zhang, Y.; Dong, J.; Cao, Y.; Liu, C.; et al. Evidence for inbreeding and genetic differentiation among geographic populations of the saprophytic mushroom Trogia venenata from southwestern China. PLoS ONE 2016, 11, e0149507. [Google Scholar] [CrossRef] [Scilit] [PubMed][Green Version]

Disclaimer/Publisher’s Note: The statements, opinions and data contained in all publications are solely those of the individual author(s) and contributor(s) and not of MDPI and/or the editor(s). MDPI and/or the editor(s) disclaim responsibility for any injury to people or property resulting from any ideas, methods, instructions or products referred to in the content. |
© 2026 by the authors. Licensee MDPI, Basel, Switzerland. This article is an open access article distributed under the terms and conditions of the Creative Commons Attribution (CC BY) license.