


Abstract
Background: This study aimed to investigate the predictive value of the multi-parameter combined application of cadmium–zinc–telluride single-photon emission computed tomography (CZT-SPECT) and coronary computed tomography angiography (CCTA) for short-term myocardial ischemic events in patients with chronic coronary syndromes (CCS). Methods: A total of 205 CCS patients who underwent both CZT-SPECT and concurrent CCTA were retrospectively enrolled. A reversible ischemia indicator (summed difference score, SDS) from CZT-SPECT and an inflammatory marker (fat attenuation index, FAI) from CCTA were obtained. Short-term myocardial ischemic major adverse cardiovascular events (MACEs) were recorded. Cox regression assessed independent predictive value, while net reclassification improvement (NRI), integrated discrimination improvement (IDI), and Kaplan–Meier curves evaluated incremental predictive and risk stratification ability. Results: 19 myocardial ischemic MACEs occurred. SDS was an independent predictor (HR: 1.386; 95%CI: 1.032–1.861; p = 0.030). Adding FAI to the combination of clinical factors and SDS significantly improved prediction (NRI = 0.215, p = 0.037; IDI = 0.043, p = 0.017). The high-SDS plus high-FAI group had the highest event rates (20.0%, all p < 0.05). Conclusions: SDS appears to be an independent predictor of short-term ischemic MACE. FAI may further stratify risk among patients with high SDS, with those exhibiting both high SDS and high FAI having the highest event rates. These findings should be considered hypothesis-generating and warrant confirmation in larger prospective cohorts.
1. Introduction
Currently, cardiovascular disease (CVD) remains the leading cause of death worldwide. The Global Burden of CVD Study [1] reported that in 2022, approximately 9.23 million patients died from ischemic heart disease (IHD), with an age-standardized disability-adjusted life years (DALYs) rate of 2275.9 per 100,000 population, ranking first among all CVDs. IHD, also known as coronary artery disease (CAD), is generally defined as a clinical syndrome characterized by myocardial ischemia, hypoxia, or even infarction resulting from coronary atherosclerosis (leading to luminal stenosis or plaque formation) and/or functional alterations (such as vasospasm and microvascular dysfunction), and it is classified into acute coronary syndromes (ACS) and chronic coronary syndromes (CCS) [2,3]. Among CAD types, CCS is the most common. It can lead to major adverse cardiovascular events (MACEs), such as recurrent angina, repeat revascularization, heart attack, or even sudden death [4,5].
Single-photon emission computed tomography (SPECT) myocardial perfusion imaging (MPI) and coronary computed tomography angiography (CCTA) play important roles in the diagnosis, guidance of treatment decisions, and prognostic evaluation of CCS, and have been widely recognized [6,7,8,9]. Among these, the new generation of cardiac-dedicated SPECT based on cadmium–zinc–telluride solid-state semiconductor detector technology (CZT-SPECT) not only significantly improves acquisition sensitivity, shortens acquisition time, and reduces patient radiation dose, but also enables non-invasive quantitative assessment of myocardial blood flow through dynamic MPI (DMPI). Its clinical application is growing increasingly [10,11]. As a convenient non-invasive imaging technique for the screening and diagnosis of CCS, CCTA can clearly visualize the coronary artery lumen and atherosclerotic plaques. Furthermore, with the aid of artificial intelligence (AI)-derived coronary parameters, it further deepens the understanding of cardiovascular risk prediction in patients with CCS [12,13].
With the increasing clinical use of both modalities and the growing number of patients undergoing simultaneous assessment, it is particularly important to integrate their multiparametric information and leverage their respective advantages to improve diagnostic and prognostic accuracy in CCS patients. However, research in this area is currently lacking. Therefore, this study aims to predict short-term myocardial ischemic events in CCS patients through the combined application of cardiac-dedicated CZT-SPECT DMPI and CCTA, and to explore the incremental predictive and risk stratification value of their combined use, thereby providing a more accurate non-invasive risk assessment tool for clinical practice.
2. Materials and Methods
2.1. Study Design
Clinical and imaging data of patients with suspected or known CCS who successfully underwent cardiac-dedicated CZT-SPECT DMPI and CCTA examinations at our hospital from January 2024 to April 2025 were retrospectively collected. Following the 2019 ESC guidelines, CCS encompasses a spectrum of clinical scenarios, including patients with stable anginal symptoms and/or dyspnea, and asymptomatic individuals with known CAD [14]. Inclusion criteria were age ≥ 18 years; interval between CCTA and CZT-SPECT < 3 months, with no revascularization during this period; complete clinical and imaging data. Exclusion criteria included: prior revascularization; history of heart failure or myocardial infarction; severe arrhythmia (defined as sustained ventricular tachycardia or atrial fibrillation with uncontrolled ventricular rate) or cardiomyopathy; poor image quality or missing data; and loss to follow-up.
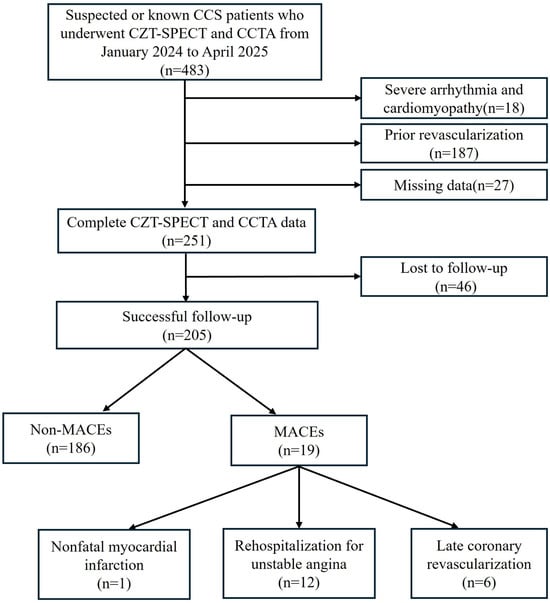
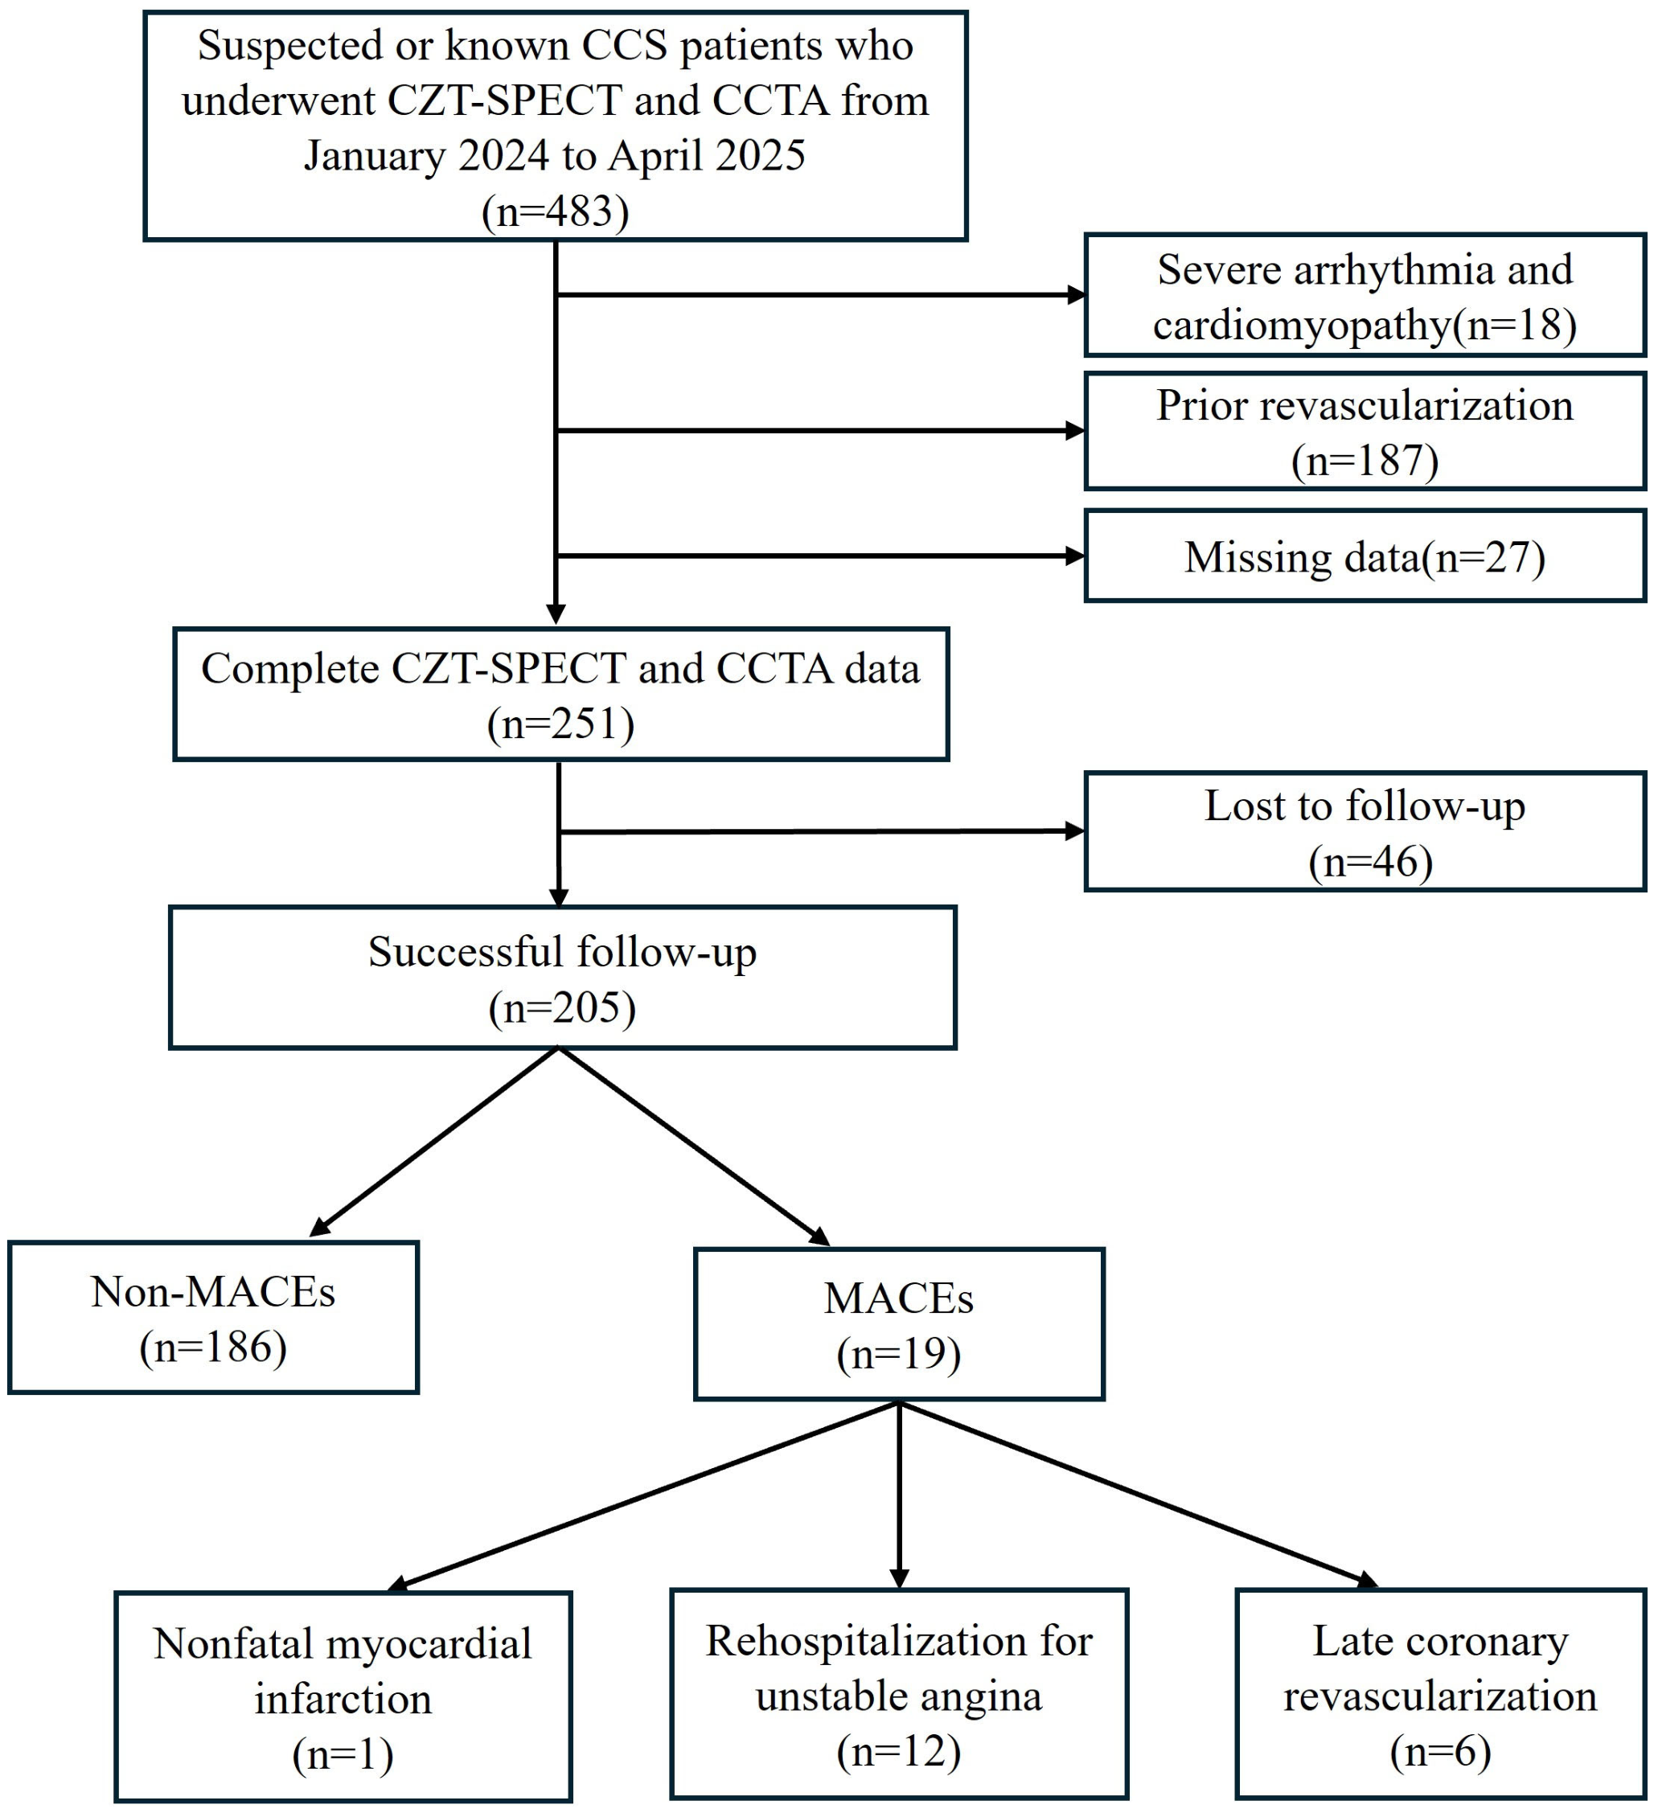
Short-term follow-up was conducted via telephone or review of electronic medical records to document myocardial ischemic MACEs. The median follow-up time was 19 months (interquartile range (IQR) [16, 23]). Myocardial ischemic MACEs included at least one of the following: non-fatal myocardial infarction, rehospitalization for unstable angina, or late coronary revascularization (percutaneous coronary intervention or coronary artery bypass grafting) [15]. Rehospitalization for unstable angina included: typical anginal symptoms at rest or with minimal exertion, new ECG changes (ST depression ≥ 0.1 mV or T wave inversion), normal cardiac enzymes, and consensus reached by two independent cardiologists after medical record review. The screening and follow-up process is shown in Figure 1. All participants provided written informed consent prior to the examination. The study adhered to the Helsinki Declaration and was approved by our hospital ethics committee (Ethics Number: 2026-0109-3).
Figure 1.
Flowchart of screening and follow-up procedures. CCS: chronic coronary syndromes; CZT-SPECT: cadmium–zinc–telluride single-photon emission computed tomography; CCTA: coronary computed tomography angiography; MACEs: major adverse cardiovascular events.
2.2. Imaging Methods
2.2.1. CZT-SPECT DMPI
CZT-SPECT (NM530c, GE Healthcare, Haifa, Israel) imaging was performed using 99mTc-sestamibi or 99mTc-tetrofosmin. Patients were instructed to abstain from caffeine/theophylline-containing products for 24 h, to withhold cardiovascular medications (e.g., beta-blockers, calcium channel blockers, vasodilators) for 24 h, and to refrain from smoking on the day of the examination [16].
All patients underwent a one-day imaging protocol (rest first, then stress). Pharmacological stress was induced with adenosine (0.14 mg/kg/min for 6 min). At peak stress (3 min), the radiotracer dose was approximately 3–4 times that of the rest dose (185–370 MBq) [17]. Low-dose CT (NM690, GE Healthcare, Milwaukee, WI, USA) was used for attenuation correction. Raw data were transferred to Xeleris 3.0 (GE Healthcare, Milwaukee, WI, USA) and MyoFlowQ 1.0.2 (Beijing Larkcloud Biomedical, Beijing, China) workstations for dynamic SPECT reconstruction and myocardial blood flow quantification. Regions of interest for the input function and left ventricular basal segments were adjusted automatically or manually. Finally, global and vessel-specific stress/rest myocardial blood flow (sMBF/rMBF) and coronary flow reserve (CFR) were calculated.
Gated images were reconstructed using an iterative method, and tomographic images were obtained using quantitative perfusion SPECT (QPS) and quantitative gated SPECT (QGS) software (Version: Cardiac Suite 2013) (Cedars-Sinai Medical Center, Los Angeles, CA, USA). The reconstructed tomographic images included short-axis, vertical long-axis, and horizontal long-axis views of the left ventricle, along with a 17-segment bullseye map according to the American Heart Association (AHA) standards. Semi-quantitative parameters of MPI were calculated using QPS software (Version: Cardiac Suite 2013) [17], including summed stress score (SSS), summed rest score (SRS), and summed difference score (SDS), where SDS = SSS − SRS.
2.2.2. CCTA
Scanning was performed using a GE 256-slice spiral CT scanner (Revolution, GE Healthcare, Chicago, IL, USA) with prospective ECG gating. The contrast agent (Ioversol, 350 mgI/mL, 60–70 mL) was injected at a flow rate of 4.5–5 mL/s. Scanning parameters were 100 or 120 kV and Smart mA (300–740 mA) [18]. The image data were analyzed using AI-assisted software (uAI Discover-CCTA version 1.5, CTA Coronary Intelligence Analysis System, United Imaging Healthcare, Shanghai, China). Plaque segmentation and centerline extraction were manually corrected when necessary.
Statistical parameters included: (a) Coronary artery calcium score (CACS), defined using the Agatston calcification score in Agatston units (AU), with severity levels of 0 (normal), 1–99 (mild), 100–400 (moderate), and >400 (severe). (b) Perivascular fat attenuation index (FAI), defined as the mean CT attenuation (−190 to −30 HU) of perivascular adipose tissue. (c) High-risk plaque features: positive remodeling (remodeling index ≥ 1.1); low-attenuation plaque (mean CT density < 30 HU); napkin-ring sign (ring-like peripheral enhancement around a hypodense core); spotty calcification (<3 mm length and peak density > 130 HU). (d) Plaque burden by type: calcified (>350 HU), lipid (−30 to 30 HU), fibrous fatty (30 to 130 HU), and fibrous plaque (130 to 350 HU). The definitions of the above parameters are provided in [19,20].
2.3. Statistical Analysis
Continuous data were first tested for normality. Normally distributed data were expressed as mean ± standard deviation, analyzed using Pearson correlation, and compared between groups using t-test or one-way analysis of variance (ANOVA). Non-normally distributed data were expressed as median (IQR), analyzed using Spearman rank correlation, and compared between groups using the Mann–Whitney U test. Categorical data were expressed as count (percentage) and compared using the chi-square test or Fisher’s exact test when appropriate.
Univariate Cox regression was first used to evaluate all variables. Clinically relevant variables or those with univariate association with the outcome were entered into the multivariate Cox regression model. Cumulative incidence of MACEs was estimated using the Kaplan–Meier method and compared by the log-rank test. The combined risk stratification ability of SDS and FAI was evaluated using the area under the curve (AUC) from receiver operating characteristic (ROC) curves, net reclassification improvement (NRI), integrated discrimination improvement (IDI), Kaplan–Meier curves, and the log-rank test. Inverse probability weighting (IPW) sensitivity analysis was used to assess the impact of loss-to-follow-up bias. A sensitivity analysis stratified by the interval between CZT-SPECT and CCTA (≤5 days vs. >5 days) was performed to assess the potential influence of the time interval on the results. Collinearity among covariates was assessed using the variance inflation factor (VIF), with a threshold of VIF < 5 indicating no significant collinearity.
Statistical analysis was performed using SPSS 27.0 (IBM Corp., Armonk, NY, USA) and R software version 4.5.1 (R Foundation for Statistical Computing, Vienna, Austria) with the packages pROC (version 1.19.0.1), PredictABEL (version 1.2-4), nricens (version 1.6), survival (version 3.8-3), and survminer (version 0.5.2). A two-tailed p-value < 0.05 was considered statistically significant.
3. Results
3.1. Clinical Baseline Characteristics
A total of 205 patients with suspected or known CCS who underwent both CZT-SPECT and CCTA were enrolled in this study. The median age was 60 years (IQR [52, 68]), with 89 females (43.4%) and 116 males (56.6%). The follow-up results showed that myocardial ischemic MACEs occurred in 19 patients (9.3%), including non-fatal myocardial infarction in 1 patient (0.5%), rehospitalization for unstable angina in 12 patients (5.9%), and late revascularization in 6 patients (2.9%).
Patients were divided into two groups based on follow-up outcomes: the non-MACEs group and the MACEs group. The clinical baseline characteristics of the two groups are summarized in Table 1. The results showed that the MACEs group had significantly higher rates of hypertension (78.9% vs. 51.6%, p = 0.023) and smoking history (52.6% vs. 28.5%, p = 0.030) compared with the non-MACEs group. No statistically significant differences were observed in other baseline characteristics (all p > 0.05).
Table 1.
Baseline clinical characteristics:
3.2. Comparison of aCZT-SPECT and CCTA Parameters Between Groups
The comparison of parameters between the two groups showed that among CZT-SPECT parameters, the MACEs group had significantly higher SSS (median 3.51 vs. 2.00, p = 0.016) and SDS (median 3.00 vs. 2.00, p = 0.010) than the non-MACEs group. Among CCTA coronary parameters, the MACEs group had significantly higher FAI (−75.50 ± 6.99 HU vs. −79.74 ± 6.67 HU, p = 0.009), various types of plaque burden (all p < 0.05), napkin-ring sign (73.7% vs. 47.8%, p = 0.032), and spotty calcification (89.5% vs. 66.1%, p = 0.037) compared to the non-MACEs group. No statistically significant differences were observed in other characteristic parameters (all p > 0.05), as detailed in Table 2.
Table 2.
Comparison of CZT-SPECT and CCTA parameters between the groups.
3.3. Cox Regression Analysis of the Association Between Different Parameters and MACEs
Univariate Cox regression analysis showed that hypertension, smoking history, SDS, FAI, various plaque burdens, and the napkin-ring sign were all significantly associated with MACEs (all p < 0.05), as detailed in Table 3.
Table 3.
Univariate Cox regression analysis: association between various parameters and MACEs.
Three multivariate Cox regression models were further constructed. In Model 1, after adjustment for clinical factors (age and hypertension), SDS showed borderline significance (p = 0.062), whereas FAI was significantly associated with MACEs (HR: 1.100, 95%CI: 1.020–1.187, p = 0.014). In Model 2, adjusted for other imaging parameters (total plaque burden, napkin-ring sign, and SSS), SDS became a significant predictor (HR: 1.418, 95%CI: 1.094–1.839, p = 0.008), while FAI showed borderline significance (p = 0.069). In Model 3, adjusted for both clinical factors and imaging parameters, SDS remained an independent predictor of MACEs (HR: 1.386, 95%CI: 1.032–1.861, p = 0.030), whereas FAI was no longer significant. See Table 4 for details.
Table 4.
Multivariate Cox regression analysis: association between SDS and FAI of MACEs.
3.4. Predictive Value of SDS and FAI for MACE
ROC analysis showed that SDS had a higher AUC (0.678) than FAI (0.659), but the combined model did not improve AUC (0.677). The DeLong test revealed no significant differences among the three (all p > 0.05). Based on the Youden index, the cutoff values for SDS and FAI were 1.5 and −78.79 HU, respectively, as detailed in Supplementary Figure S1 and Supplementary Table S1.
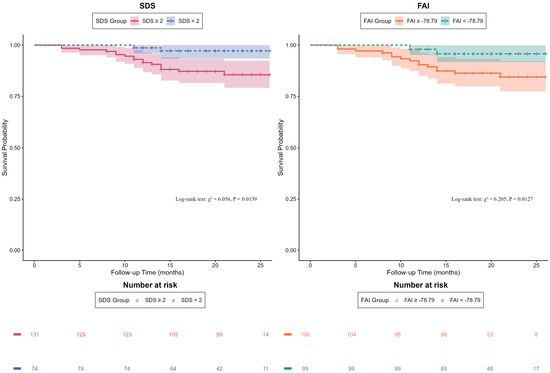
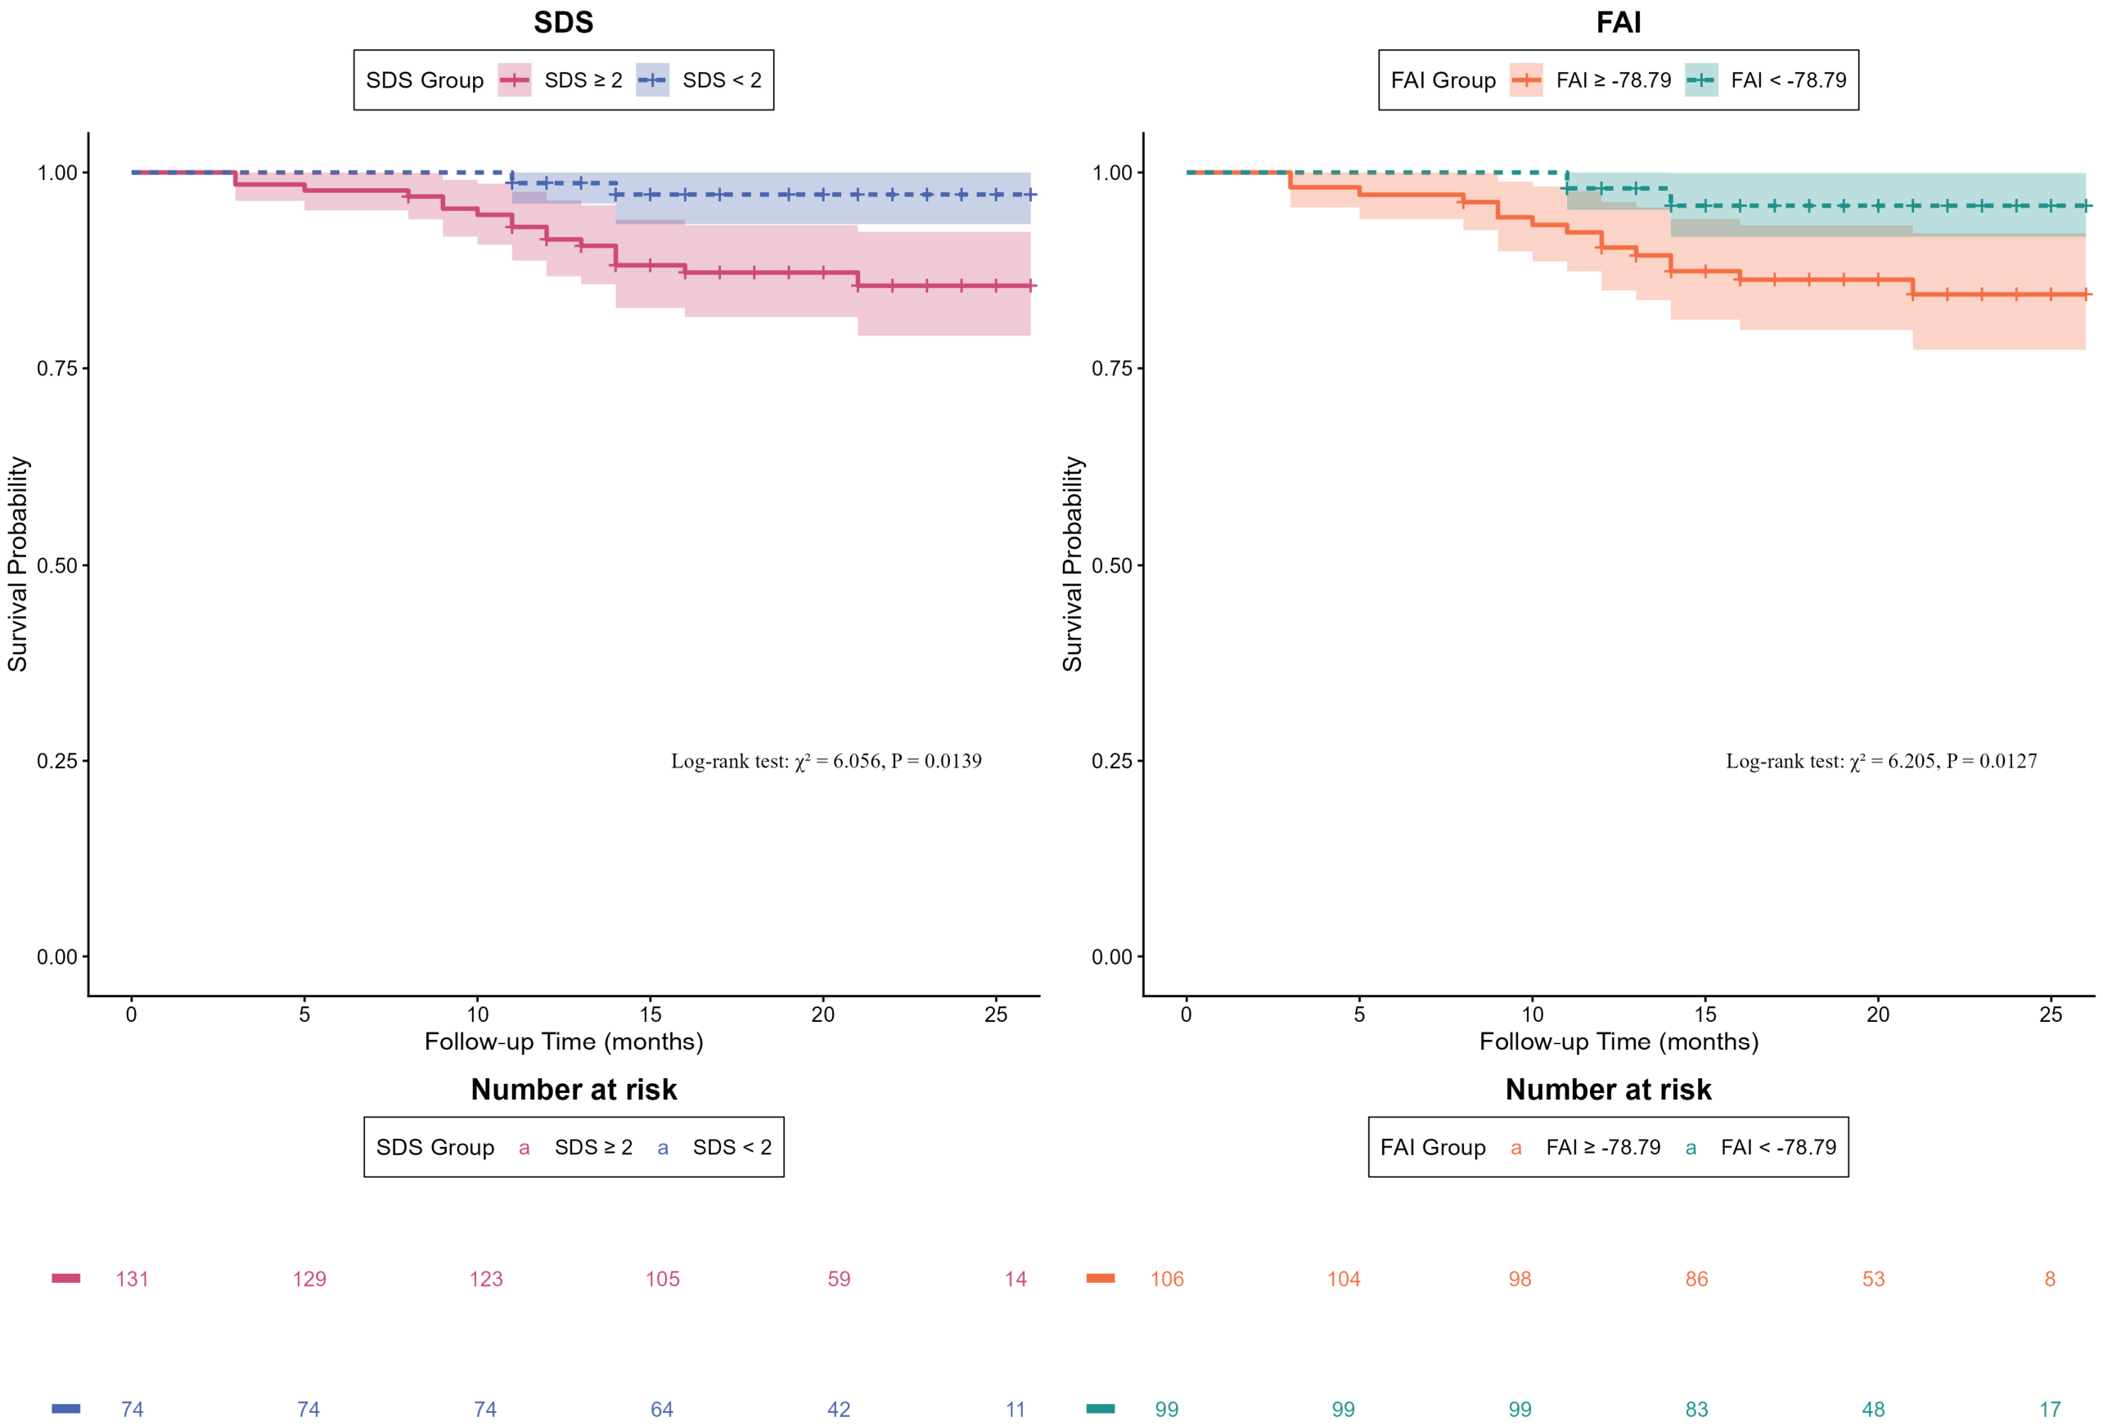
After grouping by cutoff values (an SDS cutoff of 2 was used, as it is an integer score), Kaplan–Meier curves and log-rank tests showed that patients in the high-value groups for both SDS (p = 0.014) and FAI (p = 0.013) had significantly worse prognosis than those in the low-value groups, as shown in Figure 2.
Figure 2.
Kaplan–Meier survival curves for SDS and FAI in predicting MACEs. SDS: summed difference score; FAI: perivascular fat attenuation index.
To evaluate the incremental predictive value of SDS and FAI, four Cox regression models were constructed, and NRI/IDI were calculated. Adding FAI to clinical factors significantly improved risk reclassification (NRI = 0.262, p = 0.016) and discrimination (IDI = 0.052, p = 0.023), whereas adding SDS did not (all p > 0.05). Adding FAI to clinical factors plus SDS still significantly improved prediction (NRI = 0.215, p = 0.037; IDI = 0.043, p = 0.017), but adding SDS to clinical factors plus FAI did not (all p > 0.05), as detailed in Table 5.
Table 5.
NRI and IDI analyses: incremental predictive value of SDS and FAI.
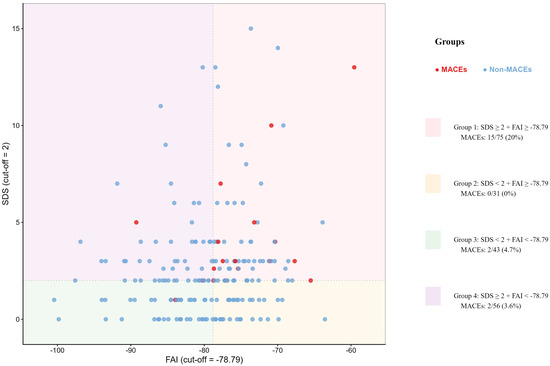
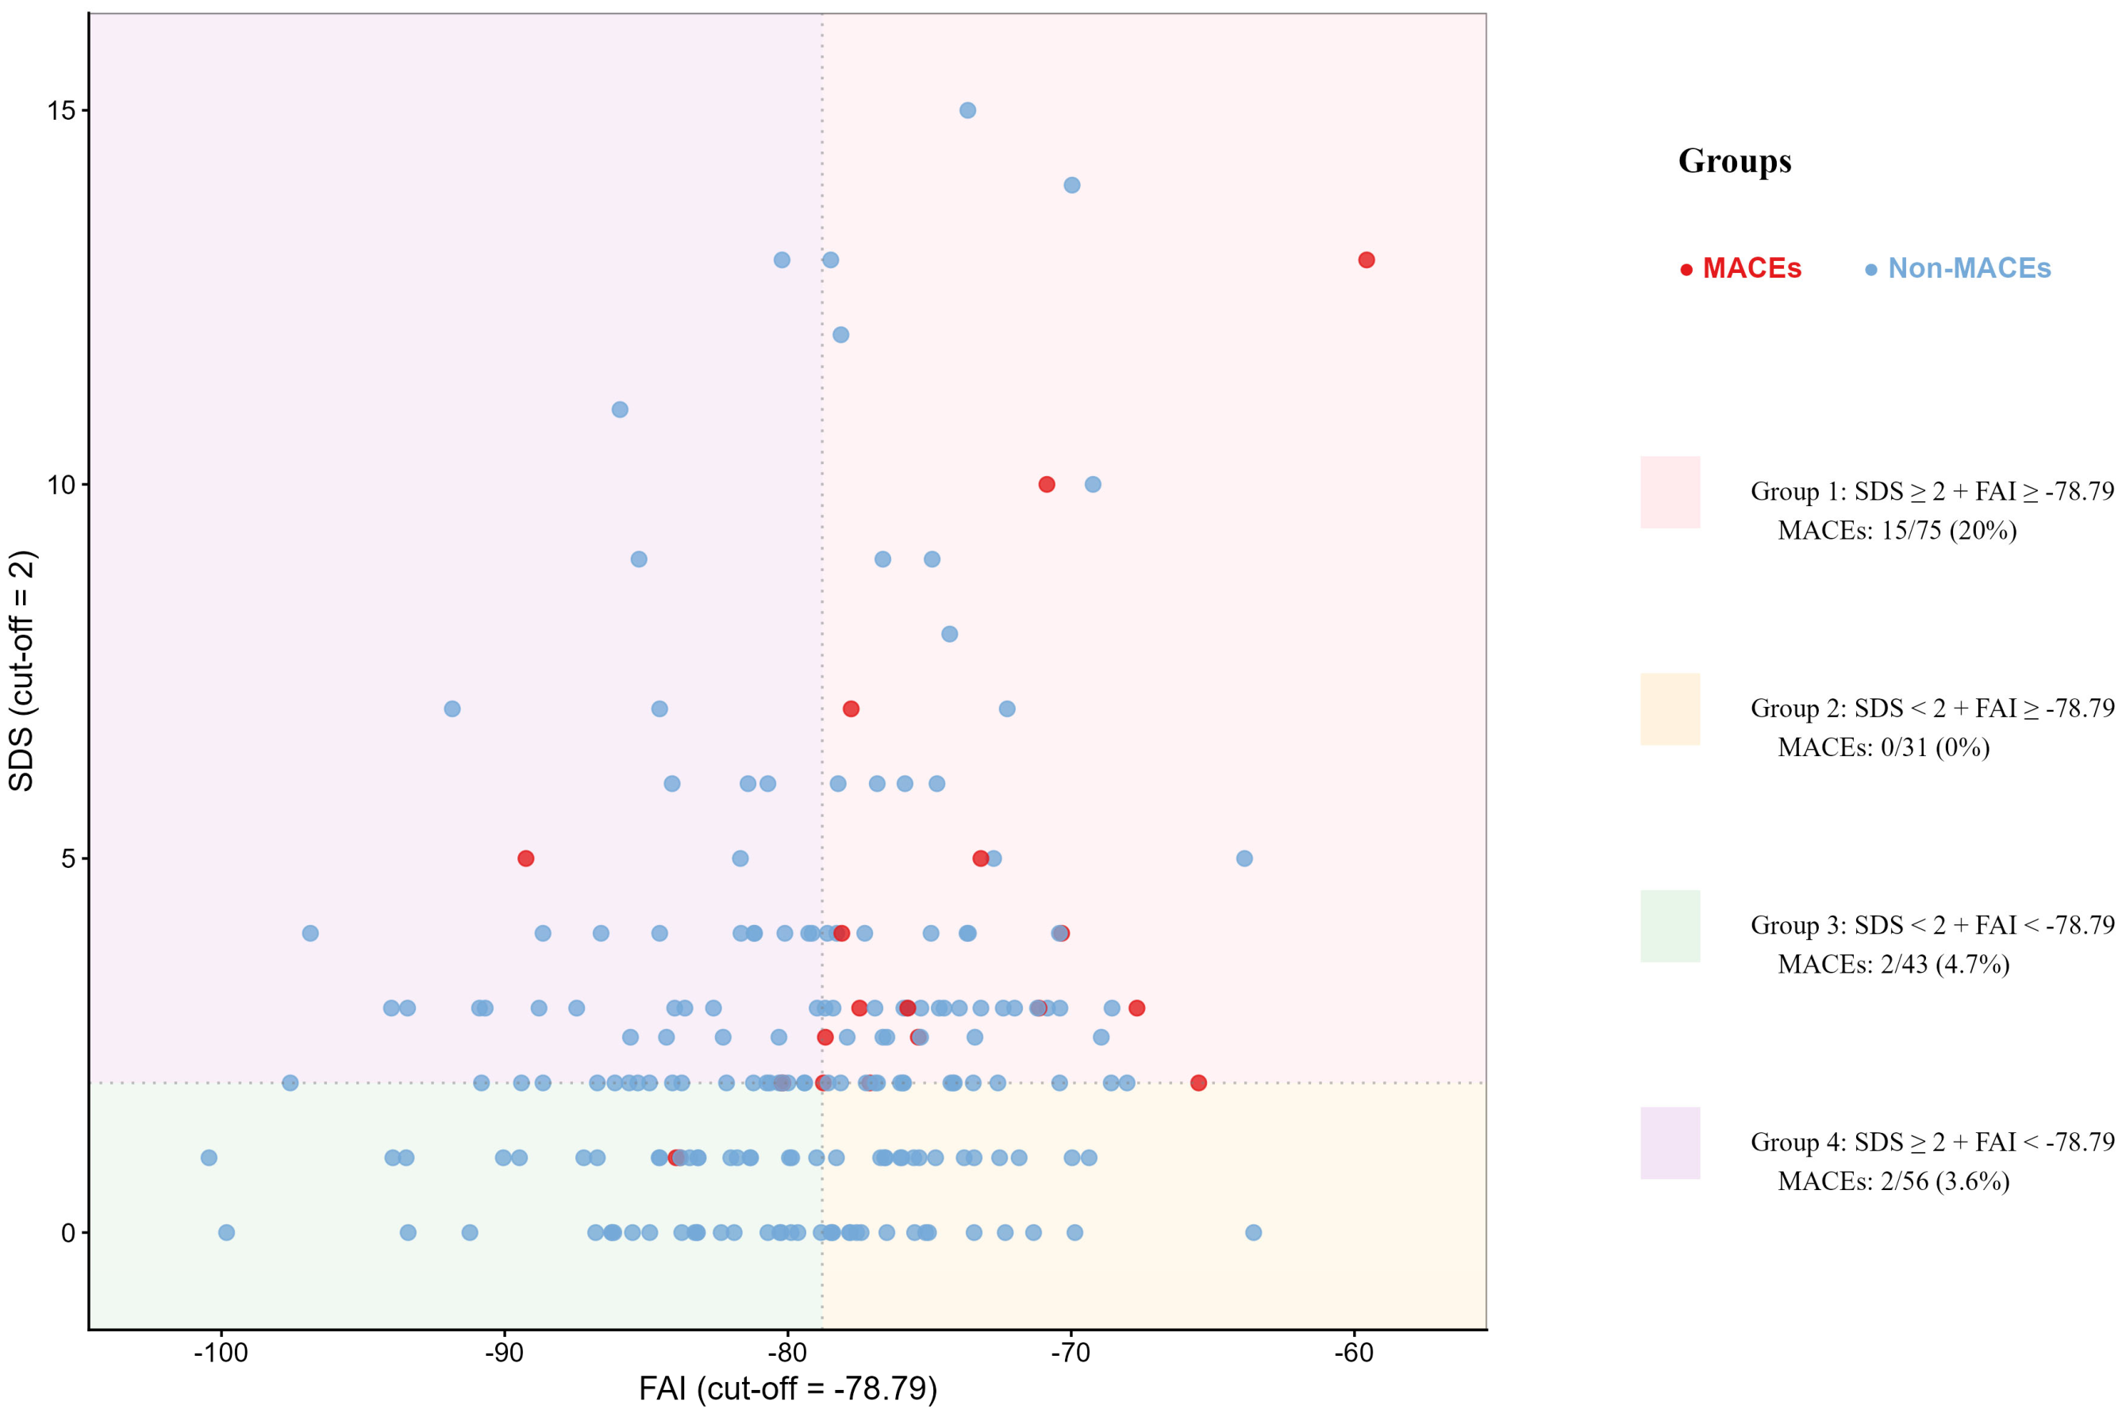
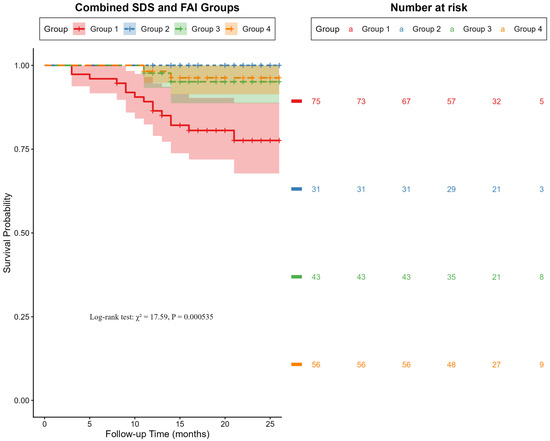
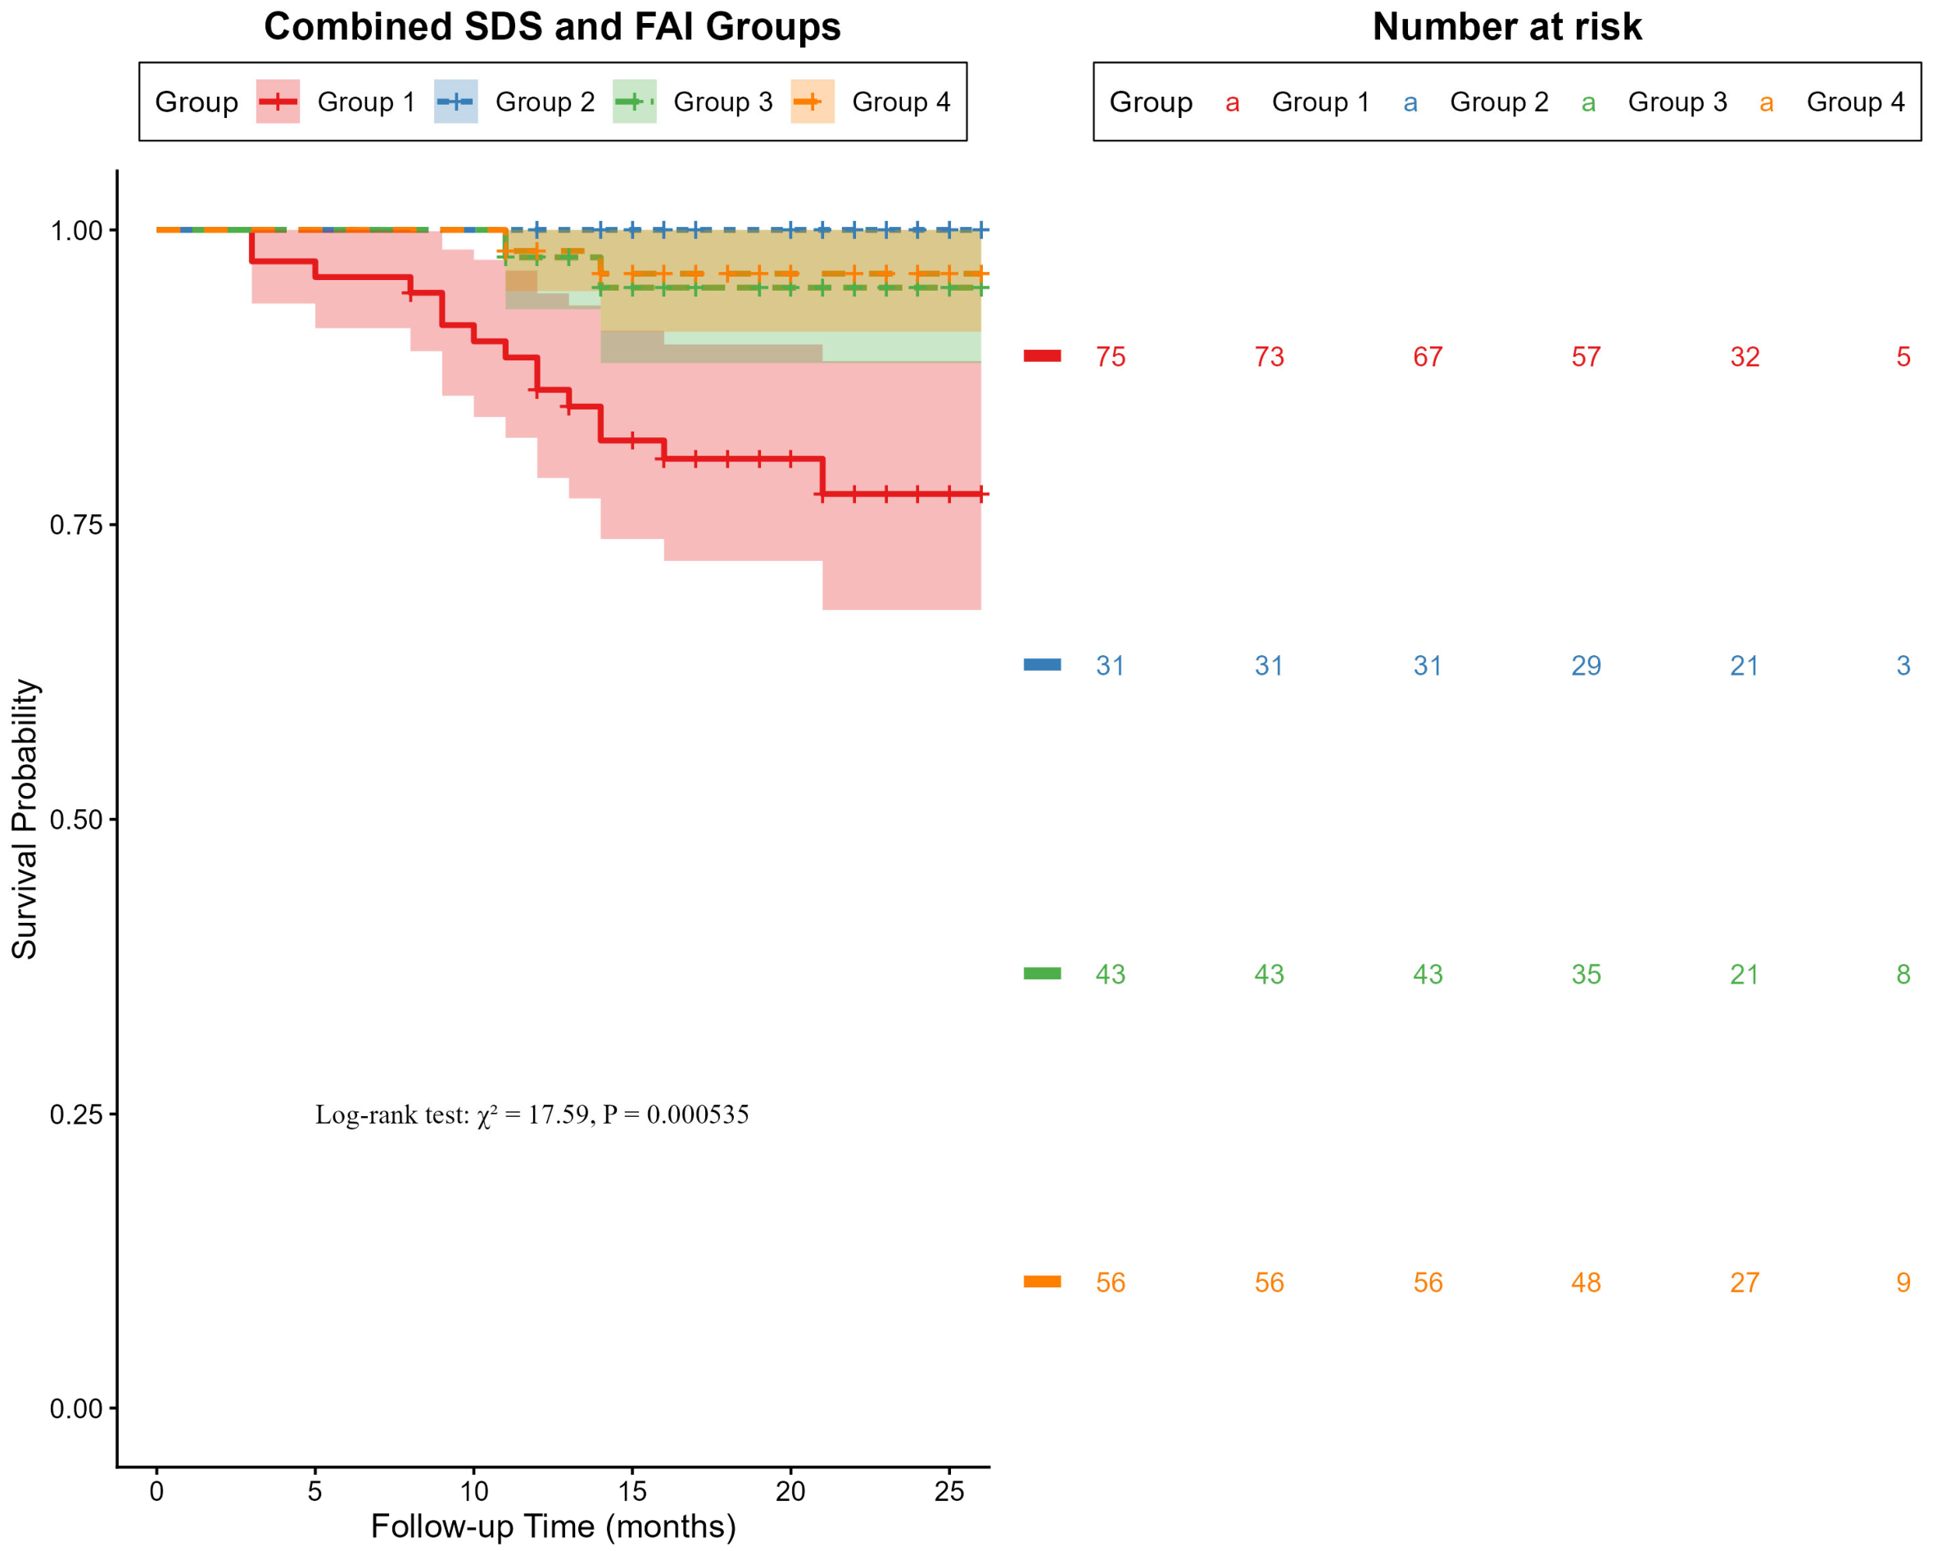
Based on the cutoff values, SDS and FAI were combined into four strata. The corresponding Kaplan–Meier survival curves and log-rank tests showed that the event rate in Group 1 (SDS ≥ 2 + FAI ≥ −78.79) was as high as 20.0%, which was significantly higher than that in the other groups (all p < 0.05), as detailed in Figure 3 and Figure 4 and Supplementary Tables S2 and S3.
Figure 3.
Scatter plot based on the SDS and FAI. SDS: summed difference score; FAI: perivascular fat attenuation index; MACEs: major adverse cardiovascular events.
Figure 4.
Kaplan–Meier survival curves for combined SDS and FAI stratification in predicting MACEs. Group 1: SDS ≥ 2 + FAI ≥ −78.79; Group 2: SDS < 2 + FAI ≥ −78.79; Group 3: SDS < 2 + FAI < −78.79; Group 4: SDS ≥ 2 + FAI < −78.79. SDS: summed difference score; FAI: perivascular fat attenuation index.
3.5. Correlation Analysis Between SDS and CFR
Spearman correlation analysis revealed a weak negative correlation between the two parameters (r = −0.215, p = 0.002), as shown in Supplementary Figure S2.
3.6. Assessment of Loss-to-Follow-Up Bias
A comparison between the lost-to-follow-up group and the follow-up group showed that the lost-to-follow-up group had significantly lower rates of family history (2.2% vs. 16.1%, p = 0.013) and lower CFR (median 1.91 vs. 2.42, p = 0.034). No significant differences were observed for other variables (all p > 0.05). See Supplementary Table S4 for details.
IPW sensitivity analysis showed that SDS was not significant (HR = 1.102, p = 0.099), whereas FAI was significantly associated with MACEs (HR = 1.100, p = 0.015) in the unweighted Cox regression analysis. After IPW adjustment, both weighted models demonstrated that SDS (HR: 1.103–1.110, p < 0.05) and FAI (HR: 1.094–1.096, p < 0.05) were significantly associated with MACEs. See Supplementary Table S5 for details.
3.7. Sensitivity Analysis Stratified by Examination Interval
The median interval between CZT-SPECT and CCTA was 3 days (IQR: 1–5 days), with 97.6% within 30 days. The sensitivity analysis showed no significant differences in core imaging parameters (SDS, FAI, plaque burden) or MACE (all p > 0.05), except for age (p = 0.014). See Supplementary Table S6 for details.
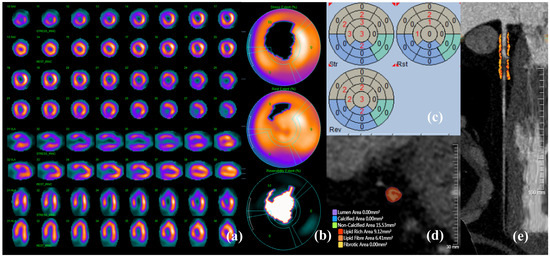
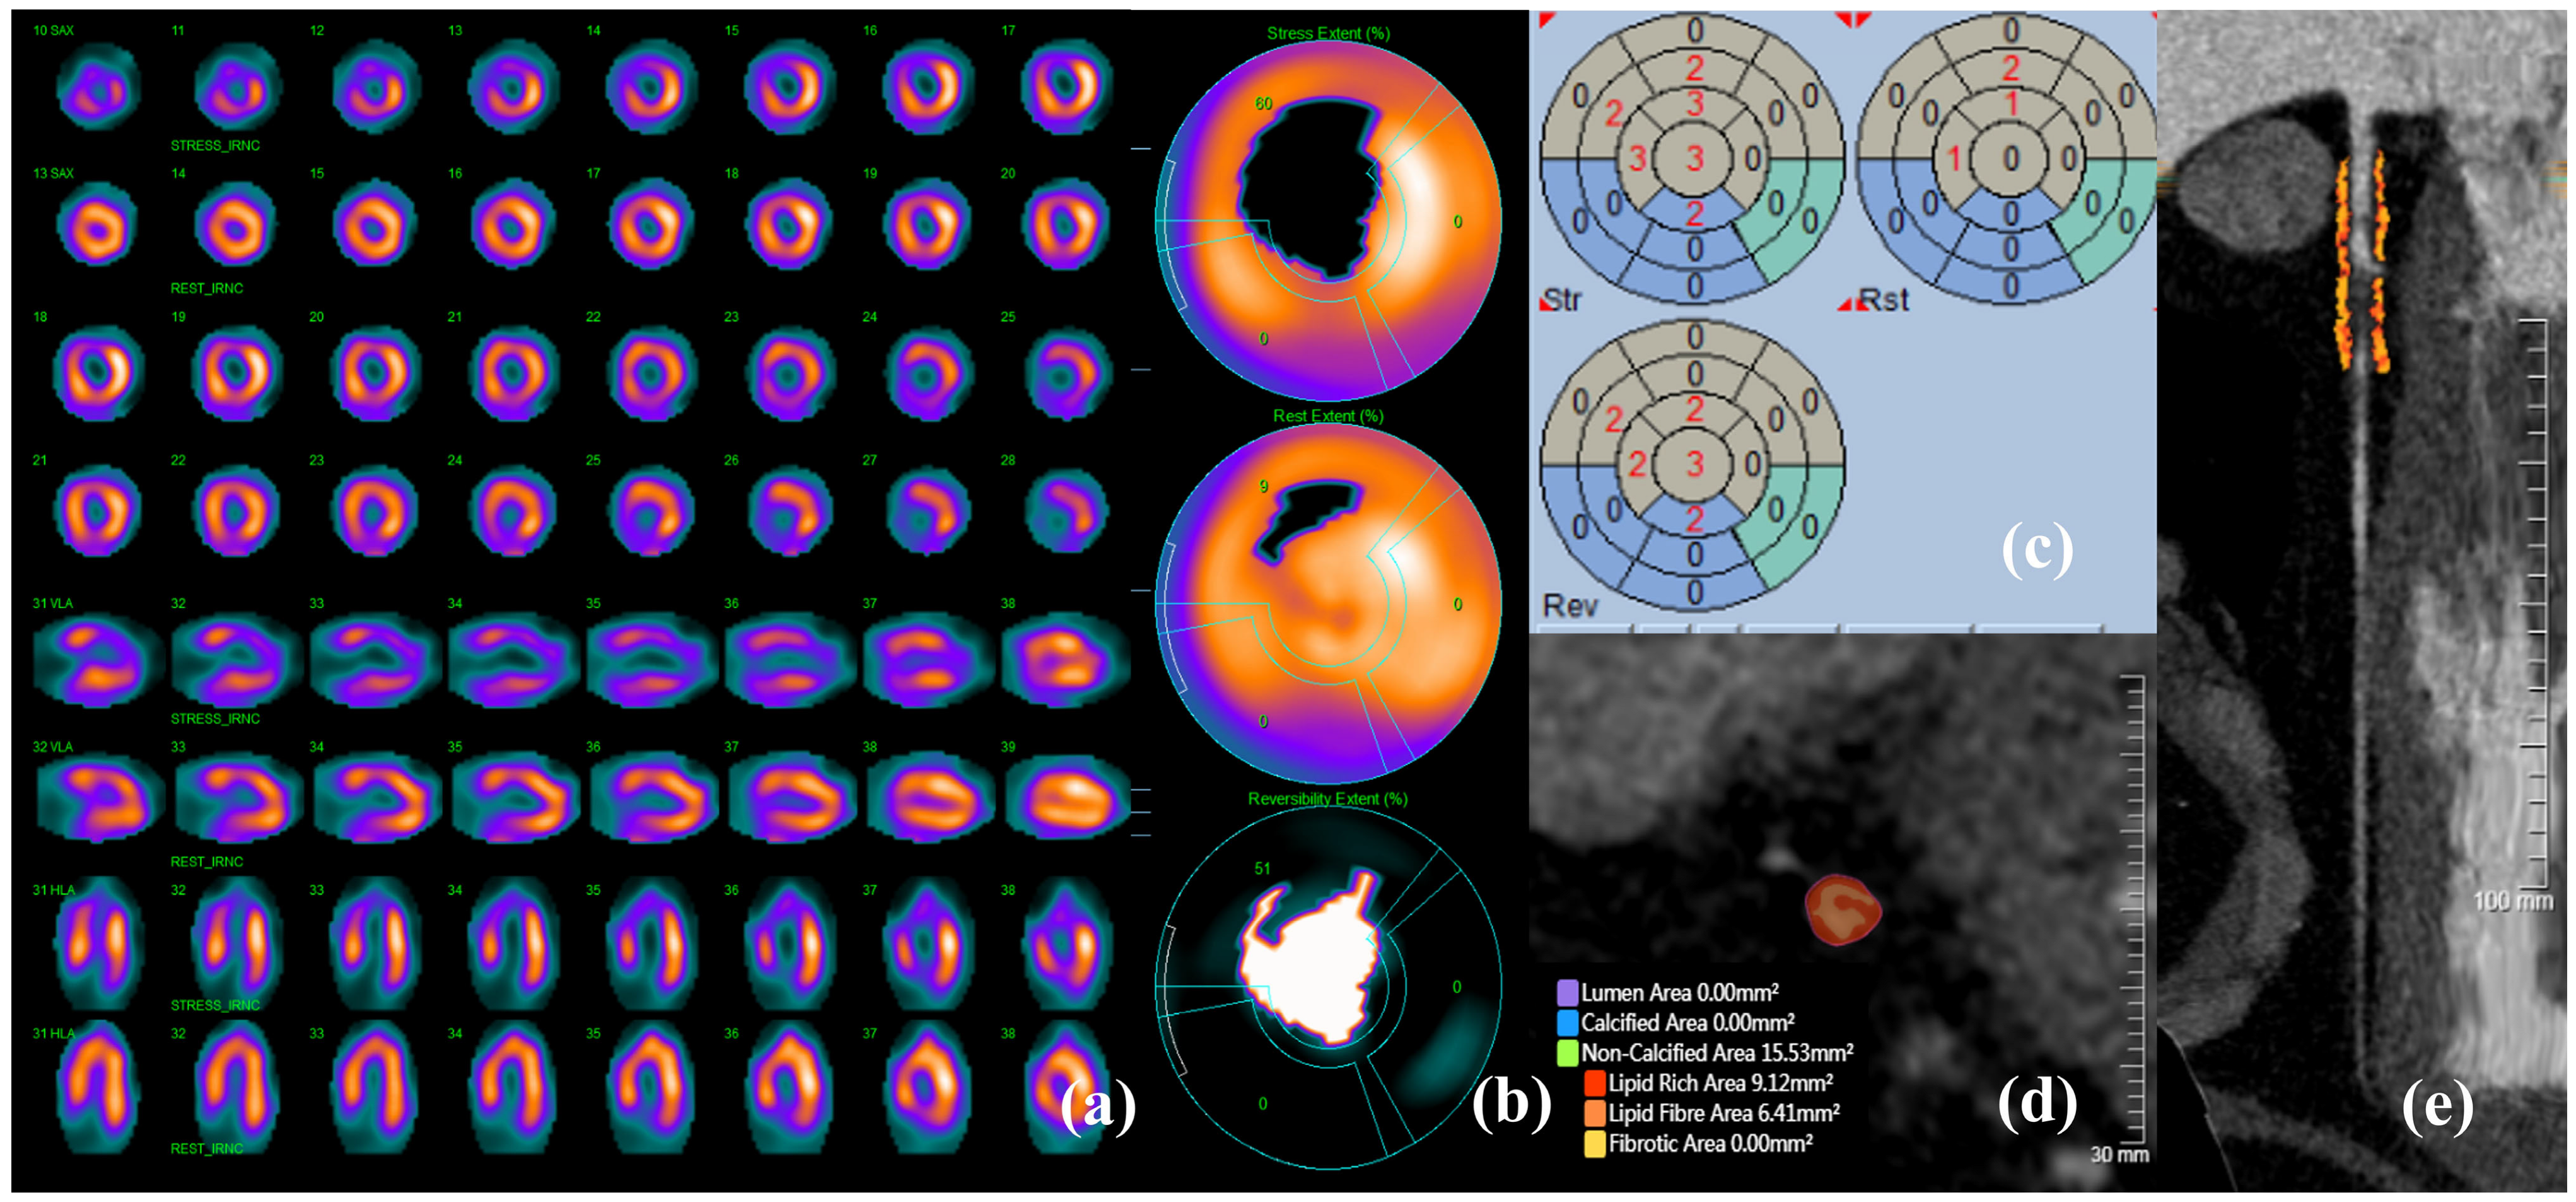
A typical case is shown in Figure 5.
Figure 5.
A typical case example. A 37-year-old male patient was admitted with intermittent precordial pain lasting six months. (a) Myocardial perfusion tomographic images (odd rows: stress images; even rows: rest images; rows 1–4: short-axis images; rows 5–6: vertical long-axis images; rows 7–8: horizontal long-axis images). (b) Myocardial perfusion polar map showing extensive reversible changes in radioactive distribution involving the left ventricular apex, part of the anterior wall, and anteroseptal wall (accounting for approximately 25% of the left ventricular wall area), along with a small area of fixed sparse radioactivity in the mid-anterior wall (accounting for approximately 5% of the left ventricular wall area). (c) QPS/QGS quantitative analysis results: SSS = 15, SRS = 4, SDS = 11. (d) AI-based quantitative analysis of the plaque in the mid-segment of the LAD, showing that the plaque is a non-calcified plaque with two high-risk plaque features: positive remodeling and low-attenuation plaque. (e) AI-automated measurement of FAI around the LAD: −87.13 HU.
4. Discussion
This study suggests that SDS may serve as an independent predictor of short-term ischemic MACEs in CCS patients, while FAI may offer incremental predictive value and enable finer risk stratification in patients with elevated SDS. Patients with both high SDS and high FAI appear to be at the highest risk in this cohort. Notably, the predictive values of SDS and FAI remained consistent before and after adjusting for loss-to-follow-up bias, supporting the robustness of our findings. Of particular note, the relatively short follow-up period (median 19 months) in this study allowed us to focus primarily on short-term risk prediction. Moreover, all MACEs were ischemia-related events, which avoids confounding from non-ischemic events such as heart failure and stroke. For example, myocardial infarction indicated acute myocardial injury with concurrent acute ischemia [21], whereas unstable angina and late revascularization were driven by symptoms or progression of myocardial ischemia.
Kaplan–Meier analysis showed that the high-SDS group had a significantly lower event-free survival rate, indicating good univariable stratification ability of SDS. In multivariate Cox regression, SDS was borderline significant after adjusting for clinical factors, but remained significant after adjusting for other imaging parameters. IPW sensitivity analysis confirmed the robustness of SDS. After adjusting for loss-to-follow-up probability, the HR direction remained consistent with the primary analysis, and significance increased from p = 0.099 to p < 0.05, suggesting that loss-to-follow-up bias may have underestimated its predictive value. These findings indicate that SDS, as a semi-quantitative measure of reversible myocardial ischemia burden, provides independent predictive value and serves as a stable predictor of short-term ischemic events in CCS patients. Conventional SPECT MPI is the most widely used technique for assessing CAD. It detects reduced tracer uptake in myocardial regions relative to normal areas, reflecting relative myocardial perfusion, to diagnose ischemia and stratify risk [22]. Borren et al. showed [23] that semi-quantitative assessment (SDS ≥ 2 and SSS ≥ 4) detected ischemia more frequently than visual assessment, and SDS < 4 with low/intermediate pretest probability effectively ruled out ischemia. A long-term study of 717 women with abnormal SDS (≥1) found [24] that different SDS strata corresponded to different MACE prediction models, indicating that SDS is a continuous risk marker with hierarchical predictive value; as SDS severity increased, the prediction models simplified, suggesting SDS stratification enables more accurate and streamlined risk assessment.
Meanwhile, patients in the high FAI group had significantly lower event-free survival than the low FAI group (log-rank p = 0.013). Univariate Cox regression confirmed that FAI was significantly associated with MACEs, indicating that FAI also has good univariate predictive ability. However, in multivariate Cox regression, FAI remained significant after adjustment for clinical factors but lost significance after further adjustment for other imaging parameters or after full adjustment. This result suggests that the predictive information of FAI may overlap with that of other imaging parameters (such as plaque burden and SSS). As a marker of perivascular inflammation, FAI reflects endothelial dysfunction and subsequent “functional stenosis” [25]. Thus, its independent contribution is attenuated when these parameters are included together in the model. Previous studies have confirmed [26,27,28] that as a quantitative marker of coronary inflammation, FAI not only predicts CAD prognosis and improves risk stratification but also guides early targeted prevention. A recent study of 503 young patients with suspected CAD showed [29] that over a median follow-up of 72.7 months, the high FAI group (FAI ≥ −75.2 HU) had a significantly higher risk of MACEs (HR = 19.257, p = 0.004), demonstrating potential risk stratification value in this population. Moreover, studies have shown that in patients after coronary artery bypass grafting, FAI is an independent predictor of graft occlusion (HR = 5.205, p = 0.001) [30]; in patients after stent implantation, FAI independently predicts in-stent restenosis (OR = 1.403, p < 0.001) [31].
NRI and IDI analyses showed that adding FAI to clinical factors significantly improved risk prediction, whereas adding SDS did not; adding FAI to clinical factors plus SDS also significantly improved risk reclassification, while adding SDS to clinical factors plus FAI did not. This indicates that, even though FAI’s effect was partially absorbed by correlated covariates in the multivariable Cox model, it still provides incremental predictive information beyond SDS. Biologically, FAI represents an upstream inflammatory signal, while SDS reflects a downstream ischemic consequence—they are related but not completely overlapping. Notably, in patients with high SDS, FAI further identifies those with superimposed inflammatory activity. The four-group Kaplan–Meier curves further support this: only patients with both high SDS and high FAI were at the highest risk (event rate 20.0%), whereas those with high SDS but low FAI had a risk comparable to those with low SDS. Although SDS was independently significant in multivariate Cox regression, its NRI and IDI based on clinical factors were not significant, likely because clinical factors (age, hypertension) already explained most risk variation, and the limited number of MACEs reduced the statistical power to detect the modest incremental effect of SDS. Nevertheless, the independent predictive value of SDS was supported by the multivariate analysis, while the NRI and IDI results further suggested the complementary value of FAI beyond SDS. This is consistent with previous studies. Zheng et al. showed [32] that FAI provided incremental predictive value beyond clinical variables and CCTA features in 1614 patients with non-obstructive CAD. Similarly, another study demonstrated [33] that FAI added incremental prognostic value regarding CAD extent and severity beyond conventional CCTA parameters.
This study found that while combining SDS and FAI did not significantly improve overall predictive performance (AUC = 0.677, all p > 0.05), this does not represent a contradiction. Cox regression addresses independent prognostic value, NRI/IDI evaluate improvement in individual risk classification and integrated discrimination, and ROC assesses overall discrimination—these methods are complementary rather than conflicting. Together, they indicate that FAI’s value lies not in improving overall AUC, but in refining risk stratification within the SDS-high subgroup. Thus, these findings raise the hypothesis that a two-step risk assessment strategy—SDS-based screening followed by FAI assessment in high-SDS patients—might help identify individuals at particularly high risk (high SDS + high FAI). This hypothesis warrants prospective validation before clinical application.
Notably, in the four-group analysis, Group 2 (SDS < 2 + FAI ≥ −78.79) had an event rate of 0.0%. This may be explained by the small sample size (31 cases) potentially leading to sampling error, the relatively short median follow-up of 19 months, and the pathophysiological state of “active inflammation without ischemia”, which may indeed confer low short-term risk. On the other hand, the quantitative parameters CFR and MBF showed no significant predictive value, whereas the semi-quantitative parameter SDS effectively distinguished MACE risk. Spearman correlation analysis revealed a weak negative correlation between CFR and SDS (r = −0.215, p = 0.002). We believe this indicates that the two parameters measure related but different biological dimensions. It is well known that CFR reflects global coronary flow reserve (including epicardial vessels and microcirculation) [34], whereas SDS is a semi-quantitative 17-segment model-based score that captures regional segmental ischemia [22], potentially being more sensitive to plaque-driven ischemic events. Moreover, possible explanations include the limited number of events (19 cases), which may be insufficient to detect a weak predictive signal from CFR, and the relatively small variability of CFR in a stable population, further limiting its discriminative ability. In addition, the sensitivity analysis stratified by the examination interval showed that the two groups were largely comparable. The minor age difference does not appear to have influenced the main conclusions, as age was included as a covariate in all multivariable models, and the core imaging parameters as well as MACEs were balanced between groups. Taken together, these findings suggest that the time interval between the two examinations does not materially affect the primary results.
In a recent study, Fogante et al. demonstrated [35] the feasibility of a combined CCTA and stress dynamic CT myocardial perfusion imaging protocol for integrated anatomical and functional assessment of moderate CAD, which supports the value of multiparametric non-invasive imaging in CAD. In line with this concept, our study extends the multiparametric approach to prognosis, showing that a cross-modality combination of CZT-SPECT (perfusion) and CCTA (inflammation) identifies a high-risk CCS subgroup, further reinforcing the role of multimodality imaging in CCS management. Additionally, the 2024 ESC guidelines [3] explicitly acknowledge that combined anatomical and functional imaging (e.g., CCTA with PET) may improve prognostication in CCS patients, and that sequential testing may be needed in intermediate-likelihood populations to avoid false positives. Our findings align with this recommendation by providing prognostic evidence that adding CCTA-derived FAI to CZT-SPECT-derived SDS further identifies a high-risk subgroup (event rate 20.0%) among CCS patients. This supports the potential role of combined imaging beyond diagnostic evaluation, extending to risk stratification and therapeutic decision-making.
Future studies may further explore the role of emerging imaging techniques in enhancing the prognostic framework for CCS patients. Cardiac magnetic resonance (CMR) [36] allows for assessment of the non-infarcted myocardium after acute myocardial infarction, providing prognostic information beyond traditional parameters. Photon-counting CT (PCCT) [37], with its improved spatial and contrast resolution and multi-energy quantitative imaging capabilities, holds promise for more precise characterization of coronary plaques and myocardial tissues. Integrating these advanced tools into the multiparametric prognostic framework may further improve risk stratification in CCS patients.
This study has several limitations. First, it was a single-center, retrospective study, which may introduce selection bias. Second, the limited number of MACEs (n = 19) may have reduced statistical power and increased the risk of overfitting in the multivariable analyses. Although we restricted the number of covariates in each model and confirmed that all VIF values were < 5 to minimize this risk, some degree of residual overfitting cannot be excluded. Furthermore, this restriction also meant that some parameters—such as plaque burden subtypes—although associated with MACEs in univariable analyses, could not be included due to collinearity or event number constraints; their additional predictive value warrants further evaluation in larger cohorts. Accordingly, the present findings should be interpreted as exploratory and hypothesis-generating, requiring confirmation in prospective studies with larger sample sizes. Third, the loss to follow-up rate was 18.3% (46/251); although IPW sensitivity analysis suggested limited impact, unmeasured confounding may still exist. Fourth, the FAI cutoff value (−78.79 HU) was determined based on ROC analysis in this cohort and requires further validation for generalizability.
5. Conclusions
This study suggests that SDS may independently predict short-term myocardial ischemic events, and that FAI may provide incremental predictive value. Patients with both high SDS and high FAI are the highest-risk population, and their combination is valuable for clinical risk stratification. A two-step approach may be considered as a hypothesis-generating strategy: first, SDS from CZT-SPECT MPI to screen for reversible ischemia; second, FAI from CCTA for refined risk stratification. Leveraging multi-parameter information from both modalities may improve risk stratification accuracy in CCS patients. However, these findings require validation in multicenter studies with larger samples and longer follow-up.
Supplementary Materials
The following supporting information can be downloaded at: https://www.mdpi.com/article/10.3390/jcdd13090421/s1, Figure S1: ROC curves of SDS, FAI, and their combination for predicting MACEs; Figure S2: Correlation Analysis between CFR and SDS; Table S1: ROC curve analysis and DeLong test of SDS, FAI, and their combination for predicting MACEs; Table S2: Distribution of MACEs across groups after combined SDS and FAI stratification; Table S3: Log-rank test for combined SDS and FAI stratification; Table S4: Comparison between the lost-to-follow-up group and the follow-up group; Table S5: IPW sensitivity analysis for loss to follow-up bias; Table S6: Sensitivity analysis stratified by the examination interval.
Author Contributions
The concept of this study was designed by J.L.; J.N. conducted the data analysis and drafted the manuscript; Y.C. and J.W. revised the manuscript and were responsible for supervising the study. Z.P., H.G., A.K.C. and F.Z. contributed to the literature search and critical revision of the manuscript. All authors have read and agreed to the published version of the manuscript.
Funding
This study was supported by the Tianjin Key Medical Discipline (Specialty) Construction Project (Grant No. TJYXZDXK-3-035C) and the Tianjin Binhai New Area Science and Technology Project (Grant No. 2023BWKZ004).
Institutional Review Board Statement
The study was conducted in accordance with the Declaration of Helsinki and was approved by the TEDA International Cardiovascular Hospital Ethics Committee (Ethics Number: 2026-0109-3, approval date: 9 January 2026).
Informed Consent Statement
Informed consent was obtained from all participants involved in the study.
Data Availability Statement
The data presented in this study are available on request from the corresponding author due to ethical restrictions and patient privacy protection.
Conflicts of Interest
The authors declare no conflicts of interest.
Abbreviations
The following abbreviations are used in this manuscript.
| CVD | cardiovascular disease |
| IHD | ischemic heart disease |
| DALYs | disability-adjusted life years |
| CAD | coronary artery disease |
| ACS | acute coronary syndromes |
| CCS | chronic coronary syndromes |
| MACEs | major adverse cardiovascular events |
| SPECT | single-photon emission computed tomography |
| MPI | myocardial perfusion imaging |
| CZT | cadmium–zinc–telluride |
| CCTA | coronary computed tomography angiography |
| AI | artificial intelligence |
| IQR | interquartile range |
| sMBF | stress myocardial blood flow |
| rMBF | rest myocardial blood flow |
| CFR | coronary flow reserve |
| QPS | quantitative perfusion SPECT |
| QGS | quantitative gated SPECT |
| AHA | American Heart Association |
| SSS | summed stress score |
| SRS | summed rest score |
| SDS | summed difference score |
| CACS | coronary artery calcium scores |
| FAI | perivascular fat attenuation index |
| AUC | area under the curve |
| ROC | receiver operating characteristic |
| NRI | net reclassification improvement |
| IDI | integrated discrimination improvement |
| IPW | inverse probability weighting |
| VIF | variance inflation factor |
| CMR | cardiac magnetic resonance |
| PCCT | Photon-counting CT |
References
- Mensah, G.A.; Fuster, V.; Murray, C.J.L.; Roth, G.A.; Mensah, G.A.; Abate, Y.H.; Abbasian, M.; Abd-Allah, F.; Abdollahi, A.; Abdollahi, M.; et al. Global Burden of Cardiovascular Diseases and Risks, 1990–2022. J. Am. Coll. Cardiol. 2023, 82, 2350–2473. [Google Scholar] [CrossRef] [Scilit] [PubMed]
- Florek, K.; Kübler, M.; Górka, M.; Kübler, P. New Modifiable Risk Factors Influencing Coronary Artery Disease Severity. Int. J. Mol. Sci. 2024, 25, 7766. [Google Scholar] [CrossRef] [Scilit] [PubMed]
- Vrints, C.; Andreotti, F.; Koskinas, K.C.; Rossello, X.; Adamo, M.; Ainslie, J.; Banning, A.P.; Budaj, A.; Buechel, R.R.; Chiariello, G.A.; et al. 2024 ESC Guidelines for the Management of Chronic Coronary Syndromes. Eur. Heart J. 2024, 45, 3415–3537. [Google Scholar] [CrossRef] [Scilit] [PubMed]
- Schindler, T.H.; Arai, A.E.; Berry, C.; Sykes, R.; Nieman, K.; Kitagawa, K.; Chandrashekhar, Y.; Li, S.; Xie, F.; Porter, T.R.; et al. Myocardial Blood Flow Assessment and Reporting for Ischemic Heart Disease. JACC Cardiovasc. Imaging 2025, 19, S1936878X25005388. [Google Scholar] [CrossRef] [Scilit] [PubMed]
- Boden, W.E.; Caterina, R.D.; Kaski, J.C.; Merz, N.B.; Berry, C.; Marzilli, M.; Pepine, C.J.; Barbato, E.; Stefanini, G.; Prescott, E.; et al. Myocardial Ischaemic Syndromes: A New Nomenclature to Harmonize Evolving International Clinical Practice Guidelines. Eur. Heart J. 2024, 45, 3701–3706. [Google Scholar] [CrossRef] [Scilit] [PubMed]
- Li, L.; Pang, Z.; Wang, J.; Chen, Y.; Chu, H.; He, Z.; Li, J. Prognostic Value of Myocardial Flow Reserve Measured with CZT Cardiac-Dedicated SPECT Low-Dose Dynamic Myocardial Perfusion Imaging in Patients with INOCA. J. Nucl. Cardiol. 2023, 30, 2578–2592. [Google Scholar] [CrossRef] [Scilit] [PubMed]
- Zhang, H.; Caobelli, F.; Che, W.; Huang, Y.; Zhang, Y.; Fan, X.; Hu, X.; Xu, C.; Fei, M.; Zhang, J.; et al. The Prognostic Value of CZT SPECT Myocardial Blood Flow (MBF) Quantification in Patients with Ischemia and No Obstructive Coronary Artery Disease (INOCA): A Pilot Study. Eur. J. Nucl. Med. Mol. Imaging 2023, 50, 1940–1953. [Google Scholar] [CrossRef] [Scilit] [PubMed]
- Javaid, A.; Ahmed, A.I.; Han, Y.; Al Rifai, M.; Saad, J.M.; Alfawara, M.S.; Alahdab, F.; El Nihum, L.; Jimenez, Y.; Newstorm, E.; et al. Incremental Prognostic Value of Spect over CCTA. Int. J. Cardiol. 2022, 358, 120–127. [Google Scholar] [CrossRef] [Scilit] [PubMed]
- Maaniitty, T.; Bär, S.; Nabeta, T.; Bax, J.J.; Saraste, A.; Knuuti, J. Prognostic Value of a Coronary Computed Tomography Angiography–Derived Ischemia Algorithm: Comparison against Hybrid Coronary Computed Tomography Angiography/Positron Emission Tomography Imaging. JAHA 2025, 14, e040726. [Google Scholar] [CrossRef] [Scilit] [PubMed]
- Panjer, M.; Dobrolinska, M.; Wagenaar, N.R.L.; Slart, R.H.J.A. Diagnostic Accuracy of Dynamic CZT-SPECT in Coronary Artery Disease. A Systematic Review and Meta-Analysis. J. Nucl. Cardiol. 2022, 29, 1686–1697. [Google Scholar] [CrossRef] [Scilit] [PubMed]
- D’Antonio, A.; Assante, R.; Zampella, E.; Mannarino, T.; Buongiorno, P.; Cuocolo, A.; Acampa, W. Myocardial Blood Flow Evaluation with Dynamic Cadmium-Zinc-Telluride Single-Photon Emission Computed Tomography: Bright and Dark Sides. Diagn. Interv. Imaging 2023, 104, 323–329. [Google Scholar] [CrossRef] [Scilit] [PubMed]
- Williams, M.C.; Kwiecinski, J.; Doris, M.; McElhinney, P.; D’Souza, M.S.; Cadet, S.; Adamson, P.D.; Moss, A.J.; Alam, S.; Hunter, A.; et al. Low-Attenuation Noncalcified Plaque on Coronary Computed Tomography Angiography Predicts Myocardial Infarction: Results from the Multicenter SCOT-HEART Trial (Scottish Computed Tomography of the HEART). Circulation 2020, 141, 1452–1462. [Google Scholar] [CrossRef] [Scilit] [PubMed]
- Du, M.; He, S.; Liu, J.; Yuan, L. Artificial Intelligence in CT Angiography for the Detection of Coronary Artery Stenosis and Calcified Plaque: A Systematic Review and Meta-Analysis. Acad. Radiol. 2025, 32, 3776–3787. [Google Scholar] [CrossRef] [Scilit] [PubMed]
- Knuuti, J. 2019 ESC Guidelines for the Diagnosis and Management of Chronic Coronary Syndromes the Task Force for the Diagnosis and Management of Chronic Coronary Syndromes of the European Society of Cardiology (ESC). Russ. J. Cardiol. 2020, 25, 119–180. [Google Scholar] [CrossRef] [Scilit]
- Bosco, E.; Hsueh, L.; McConeghy, K.W.; Gravenstein, S.; Saade, E. Major Adverse Cardiovascular Event Definitions Used in Observational Analysis of Administrative Databases: A Systematic Review. BMC Med. Res. Methodol. 2021, 21, 241. [Google Scholar] [CrossRef] [Scilit] [PubMed]
- Wang, J.; Chen, Y.; Chu, H.; Pang, Z.; Hsu, B.; Li, J. Feasibility of Myocardial Blood Flow Quantification to Detect Flow-Limited Coronary Artery Disease with a One-Day Rest/Stress Continuous Rapid Imaging Protocol on Cardiac-Dedicated Cadmium Zinc Telluride Single Photon Emission Computed Tomography. J. Nucl. Cardiol. 2024, 34, 101825. [Google Scholar] [CrossRef] [Scilit] [PubMed]
- Wang, J.; Li, S.; Chen, W.; Chen, Y.; Pang, Z.; Li, J. Diagnostic Efficiency of Quantification of Myocardial Blood Flow and Coronary Flow Reserve with CZT Dynamic SPECT Imaging for Patients with Suspected Coronary Artery Disease: A Comparative Study with Traditional Semi-Quantitative Evaluation. Cardiovasc. Diagn. Ther. 2021, 11, 567. [Google Scholar] [CrossRef] [Scilit] [PubMed]
- Chen, M.; Liu, B.; Li, X.; Li, D.; Fan, L. Relationship between Peri-Coronary Inflammation and Coronary Vascular Function in Patients with Suspected Coronary Artery Disease. Front. Cardiovasc. Med. 2024, 11, 1303529. [Google Scholar] [CrossRef] [Scilit] [PubMed]
- Dell’Aversana, S.; Ascione, R.; Vitale, R.A.; Cavaliere, F.; Porcaro, P.; Basile, L.; Napolitano, G.; Boccalatte, M.; Sibilio, G.; Esposito, G.; et al. CT Coronary Angiography: Technical Approach and Atherosclerotic Plaque Characterization. J. Clin. Med. 2023, 12, 7615. [Google Scholar] [CrossRef] [Scilit] [PubMed]
- Sun, J.T.; Sheng, X.C.; Feng, Q.; Yin, Y.; Li, Z.; Ding, S.; Pu, J. Pericoronary Fat Attenuation Index Is Associated with Vulnerable Plaque Components and Local Immune-inflammatory Activation in Patients with non-ST Elevation Acute Coronary Syndrome. JAHA 2022, 11, e022879. [Google Scholar] [CrossRef] [Scilit] [PubMed]
- Thygesen, K.; Alpert, J.S.; Jaffe, A.S.; Chaitman, B.R.; Bax, J.J.; Morrow, D.A.; White, H.D. Fourth Universal Definition of Myocardial Infarction (2018). J. Am. Coll. Cardiol. 2018, 72, 2231–2264. [Google Scholar] [CrossRef] [Scilit] [PubMed]
- Sharir, T.; Kovalski, G. Absolute Myocardial Blood Flow vs Relative Myocardial Perfusion: Which One Is Better? J. Nucl. Cardiol. 2018, 25, 1629–1632. [Google Scholar] [CrossRef] [Scilit] [PubMed]
- Borren, N.M.; Gerritse, T.J.; Ottervanger, J.P.; Mouden, M.; Timmer, J.R.; van Dalen, J.A.; Jager, P.L.; van Dijk, J.D. Semi-Quantitative Assessment of Ischemia with Rubidium-82 PET Myocardial Perfusion Imaging. J. Nucl. Cardiol. 2022, 29, 3155–3162. [Google Scholar] [CrossRef] [Scilit] [PubMed]
- Romero-Farina, G.; Aguadé-Bruix, S.; Ferreira-González, I. Different Degrees of Summed Difference Perfusion Score in Women: Influence on the Prognostic Variables Associated with Cardiac Events. Nucl. Med. Commun. 2025, 46, 28. [Google Scholar] [CrossRef] [Scilit] [PubMed]
- Yan, H.; Zhao, N.; Geng, W.; Hou, Z.; Gao, Y.; Lu, B. Pericoronary Fat Attenuation Index and Coronary Plaque Quantified from Coronary Computed Tomography Angiography Identify Ischemia-Causing Lesions. Int. J. Cardiol. 2022, 357, 8–13. [Google Scholar] [CrossRef] [Scilit] [PubMed]
- Oikonomou, E.K.; Marwan, M.; Desai, M.Y.; Mancio, J.; Alashi, A.; Centeno, E.H.; Thomas, S.; Herdman, L.; Kotanidis, C.P.; Thomas, K.E.; et al. Non-Invasive Detection of Coronary Inflammation Using Computed Tomography and Prediction of Residual Cardiovascular Risk (the CRISP CT Study): A Post-Hoc Analysis of Prospective Outcome Data. Lancet 2018, 392, 929–939. [Google Scholar] [CrossRef] [Scilit] [PubMed]
- Tan, N.; Marwick, T.H.; Dey, D.; Chan, W.; Nerlekar, N. Association of Pericoronary Adipose Attenuation with Major Adverse Cardiovascular Events and High-Risk Plaque. JACC Cardiovasc. Imaging 2025, 18, 884–894. [Google Scholar] [CrossRef] [Scilit] [PubMed]
- Yu, X.; Botezatu, S.; Tzolos, E.; Dey, D.; Kwiecinski, J. Pericoronary Adipose Tissue CT Attenuation in Coronary Artery Plaque Inflammation. Heart 2023, 109, 485–493. [Google Scholar] [CrossRef] [Scilit] [PubMed]
- Yu, Y.; Shan, D.; Wang, X.; Liu, Z.; Dou, G.; Yang, J.; Liu, Y.; Chen, Y. Predictive Value of the Perivascular Fat Attenuation Index for MACE in Young People Suspected of CAD. BMC Cardiovasc. Disord. 2025, 25, 80. [Google Scholar] [CrossRef] [Scilit] [PubMed]
- Huang, S.; Yu, X.; Yang, B.; Xu, T.; Gu, H.; Wang, X. Predictive Value of Pericoronary Fat Attenuation Index for Graft Occlusion after Coronary Artery Bypass Grafting. Jpn. J. Radiol. 2025, 43, 612–621. [Google Scholar] [CrossRef] [Scilit] [PubMed]
- Qin, B.; Li, Z.; Zhou, H.; Liu, Y.; Wu, H.; Wang, Z. The Predictive Value of the Perivascular Adipose Tissue CT Fat Attenuation Index for Coronary In-Stent Restenosis. Front. Cardiovasc. Med. 2022, 9, 822308. [Google Scholar] [CrossRef] [Scilit] [PubMed]
- Zheng, N.; Liu, Z.; Ding, Y.; Wang, X.; Li, J.; Dou, G.; Xin, R.; Guo, Z.; Chen, G.; Jing, J.; et al. Incremental Prognostic Value of Pericoronary Adipose Tissue Attenuation beyond Conventional Features in Patients with Nonobstructive Coronary Artery Disease. Atherosclerosis 2025, 402, 119075. [Google Scholar] [CrossRef] [Scilit] [PubMed]
- Van Diemen, P.A.; Bom, M.J.; Driessen, R.S.; Everaars, H.; Schumacher, S.P.; De Winter, R.W.; Van De Ven, P.M.; Freiman, M.; Goshen, L.; Heitel, D.; et al. Incremental Prognostic Value of Pericoronary Adipose Tissue Attenuation on Top of Comprehensive CCTA Assessment. Eur. Heart J. 2020, 41, ehaa946.0150. [Google Scholar] [CrossRef] [Scilit]
- Del Buono, M.G.; Montone, R.A.; Camilli, M.; Carbone, S.; Narula, J.; Lavie, C.J.; Niccoli, G.; Crea, F. Coronary Microvascular Dysfunction across the Spectrum of Cardiovascular Diseases. J. Am. Coll. Cardiol. 2021, 78, 1352–1371. [Google Scholar] [CrossRef] [Scilit] [PubMed]
- Fogante, M.; Paolini, E.; Cela, F.; Esposto Pirani, P.; Balardi, L.; Perna, G.P.; Schicchi, N. Feasibility, Added Value, and Radiation Dose of Combined Coronary CT Angiography and Stress Dynamic CT Myocardial Perfusion Imaging in Moderate Coronary Artery Disease: A Real-World Study. J. Cardiovasc. Dev. Dis. 2025, 12, 241. [Google Scholar] [CrossRef] [Scilit] [PubMed]
- Pavon, A.G.; Bergamaschi, L.; Guglielmo, M.; Angeli, F.; Armillotta, M.; Fedele, D.; Barile, L.; Cassotta, A.; di Taranto, P.; Costantini, P.; et al. Multiparametric Cardiac Magnetic Resonance Characterization of the Noninfarcted Myocardium: Definition, Assessment, and Clinical Significance. JACC Cardiovasc. Imaging 2026, in press. [Google Scholar] [CrossRef] [Scilit] [PubMed]
- Meloni, A.; Frijia, F.; Panetta, D.; Degiorgi, G.; De Gori, C.; Maffei, E.; Clemente, A.; Positano, V.; Cademartiri, F. Photon-Counting Computed Tomography (PCCT): Technical Background and Cardio-Vascular Applications. Diagnostics 2023, 13, 645. [Google Scholar] [CrossRef] [Scilit] [PubMed]

Disclaimer/Publisher’s Note: The statements, opinions and data contained in all publications are solely those of the individual author(s) and contributor(s) and not of MDPI and/or the editor(s). MDPI and/or the editor(s) disclaim responsibility for any injury to people or property resulting from any ideas, methods, instructions or products referred to in the content. |
© 2026 by the authors. Licensee MDPI, Basel, Switzerland. This article is an open access article distributed under the terms and conditions of the Creative Commons Attribution (CC BY) license.