


Simple Summary
Herd-level seropositivity for Neospora caninum, Toxoplasma gondii, and Coxiella burnetii was evaluated in relation to environmental conditions. A total of 737 serum samples collected from 42 Greek dairy herds were analyzed. At least one seropositive animal was detected in 64.29%, 50.00%, and 57.14% of the herds, respectively. To reduce overlapping information, related environmental variables were combined into a smaller set of broader factors. Their relationships with herd-level seropositivity were then evaluated separately for each pathogen. Contrasting associations of temperature with seropositivity for N. caninum and T. gondii were observed, while vegetation activity, dry-season rainfall, and elevation were also associated with pathogen-specific patterns. At the herd level, a tendency for N. caninum seropositivity not to coincide with seropositivity for either of the other pathogens was observed, whereas a tendency for T. gondii and C. burnetii seropositivity to occur together was also observed. The resulting environmental suitability maps revealed distinct geographical patterns and distinguished model predictions from areas requiring extrapolation. Overall, a different environmental and spatial profile was identified for each pathogen, providing a basis for further field investigation and pathogen-specific surveillance. Areas with different levels of environmental suitability were presented in the maps; however, pathogen prevalence and disease risk were not directly estimated.
Abstract
Associations between environmental and demographic predictors and herd-level seropositivity for Neospora caninum, Toxoplasma gondii, and Coxiella burnetii were evaluated using ELISA results from 737 cattle in 42 Greek dairy herds (2018–2019). At the individual level, apparent seropositivity was 24.56% (95% CI: 11.53–37.58) for N. caninum, 15.74% (95% CI: 7.69–23.79) for T. gondii, and 21.17% (95% CI: 14.38–27.95) for C. burnetii. Herd-level seropositivity was 64.29% (95% CI: 49.17–77.01) for N. caninum, 50.00% (95% CI: 35.53–64.47) for T. gondii, and 57.14% (95% CI: 42.21–70.88) for C. burnetii. Factor analyses were used to summarize correlated environmental predictors. Factor scores and additional variables were evaluated in pathogen-specific multivariable logistic models. A temperature-related factor was negatively associated with N. caninum seropositivity (OR = 0.21, 95% CI: 0.07; 0.67, p = 0.008) but positively with T. gondii seropositivity (OR = 170.2; 95% CI: 5.74–5042.8, p = 0.003). A vegetation-related factor was positively associated with seropositivity for T. gondii (OR = 6.25; 95% CI: 1.63–23.97, p = 0.008) and C. burnetii (OR = 3.23; 95% CI: 1.18–8.82, p = 0.022). Elevation was positively associated with T. gondii seropositivity (OR = 1.015; 95% CI: 1.0016–1.029, p = 0.029). A precipitation-related factor was negatively associated with C. burnetii seropositivity (OR = 0.34; 95% CI: 0.13–0.87, p = 0.024). Tetrachoric correlations were −0.786 for N. caninum–T. gondii, −0.688 for N. caninum–C. burnetii, and 0.880 for T. gondii–C. burnetii. Pathogen-specific suitability areas and areas requiring extrapolation were mapped; prevalence and disease risk were not estimated.
1. Introduction
Neospora caninum, Toxoplasma gondii and Coxiella burnetii are pathogens that can infect cattle, resulting in a variety of outcomes ranging from asymptomatic infections to reproductive disorders. N. caninum has a widespread distribution and causes significant economic losses to cattle farmers, whereas T. gondii and C. burnetii are zoonotic pathogens of public health importance.
N. caninum is an obligate intracellular apicomplexan protozoan parasite with a wide host range that includes domestic livestock, namely cattle [1,2], sheep [3,4], and goats [4,5], companion animals such as dogs [6] and cats [7,8,9], and several wildlife species including grey wolves [10], coyotes [11], red foxes [12], and wild birds [13,14]. Canids are the definitive hosts and become infected by consuming infected tissues of cattle or wildlife species which serve as intermediate hosts. They also excrete oocysts into the environment, which can be ingested by intermediate hosts. Cattle can become infected horizontally through the consumption of water or feed contaminated with oocysts, or vertically through transplacental transmission of tachyzoites from the mother to the fetus. Although abortion is the prominent clinical manifestation [4], calves can also be born healthy and remain asymptomatic lifelong carriers.
T. gondii is a zoonotic obligate intracellular apicomplexan protozoan parasite with a broad host range that includes livestock [15,16], poultry [17], wild animals such as birds [18,19] and rodents [20], and humans [21]. Domestic cats and other members of the family Felidae are the definitive hosts and can shed unsporulated oocysts in their feces, thereby contaminating the environment [22,23]. Farmed animals, such as pigs [24], sheep [25], goats [25] and cattle [26,27], serve as intermediate hosts and become infected by ingestion of feed, water or soil contaminated with viable oocysts. Bovine infection is usually subclinical and rarely results in abortions, given that T. gondii exhibits low pathogenicity in this host, which possesses a high natural resistance [16].
C. burnetii is an obligate intracellular Gram-negative bacterium of zoonotic concern. It has a wide host range including ruminants, such as cattle, sheep and goats [28], companion animals like cats [29] and dogs [30], rodents [31], wildlife species, birds, ticks [32], and humans [33]. The pathogen exhibits environmental resistance and can persist in soil, straw, and dust for months or even years because of its highly resistant small-cell variant. Cattle can become infected primarily by inhaling aerosols generated by infected animals or airborne dust. Infected animals can also shed the microorganism through their milk, vaginal and birth fluids, placenta, feces and urine, leading to the contamination of the environment and equipment. A secondary route of transmission involves ticks harboring the bacterium. Bovine infections are typically subclinical, rarely manifesting clinical signs of systemic illness, such as anorexia or hyperthermia, and sporadically causing reproductive disorders, mainly subfertility and less frequently late-term abortions [34].
N. caninum and T. gondii are closely related, but differ in important biological and epidemiological characteristics, and these differences may be reflected in their relationships with environmental conditions [35]. T. gondii is of limited clinical importance in cattle; however, it was included because of its zoonotic relevance and the opportunity to compare its environmental associations with those of N. caninum. The environmental persistence of T. gondii oocysts was shown by experimental studies to be influenced by temperature and to differ between dry and damp soil conditions [36,37]. In Portuguese cattle, Köppen climate area, precipitation-related bioclimatic variables, and human population density were associated with animal-level seropositivity for both N. caninum and T. gondii in univariable analyses, although none of these factors remained significant in the final multivariable models [38]. Furthermore, altitude, land use/land cover, and temperature- and precipitation-related variables were identified as relevant to the spatial distribution of N. caninum-positive dairy herds [39]. Regarding C. burnetii, herd-level seropositivity in Swedish dairy herds was associated with high wind speed, open landscapes, high animal densities, high temperature, and low cumulative precipitation [40]. In an ecological niche modelling analysis based on PCR-positive farms in Greece, the precipitation of the wettest quarter and the minimum temperature of the coldest month were identified as the most informative environmental variables, whereas a mild climate and low precipitation were found to favor pathogen presence [41].
Overall, environmental relationships were found to vary among pathogens and across geographical settings. Although several seroepidemiological studies of N. caninum, T. gondii, and C. burnetii had previously been conducted in Greek cattle, their herd-level seropositivity had been investigated only to a limited extent within a common environmental and spatial framework. Therefore, the present study was designed to assess associations between herd-level seropositivity for each of the three pathogens and a set of environmental and demographic variables. Factor analyses were used to address multicollinearity among correlated environmental variables by identifying environmental gradients, which were subsequently evaluated in pathogen-specific multivariable logistic regression models. Pairwise associations between the herd-level serostatus of each pair of pathogens were assessed using tetrachoric correlation analysis. Finally, pathogen-specific environmental suitability maps were produced based on the associations identified in the final models.
2. Materials and Methods
2.1. Sample Collection
During 2018–2019, a total of 737 blood samples were collected from 42 Greek dairy cattle herds as part of routine diagnostic investigations or investigations of pre-existing herd health problems. The present study was based on a retrospective analysis of these samples, and the integrated statistical and spatial analyses were subsequently conducted. No experimental procedures were performed on animals for the purposes of this study. Before sample collection, farm owners were fully informed and written consent was obtained from them for the collection of samples for diagnostic purposes and for the subsequent use of the samples and resulting data for research purposes.
Farms were located in Western (n = 1), Central (n = 25) and Northern Greece (n = 16) (Figure 1) and were designated using the codes H1 to H42). Vaccinations against infectious bovine rhinotracheitis virus (IBRV) and bovine viral diarrhea virus (BVDV) were routinely performed in all herds.
Figure 1.
Geographical distribution of the 42 serologically tested Greek dairy cattle herds. Herd locations were depicted as pink dots.
2.2. ELISA
Blood samples were submitted to the Laboratory of Microbiology and Parasitology, Faculty of Veterinary Science, University of Thessaly, for serological testing and were centrifuged at 2000× g for 10 min. Supernatants were collected and stored at 2–4 °C until analysis, which was performed within 48 h. Commercial ELISA tests were performed to detect antibodies against N. caninum (ID Screen Neospora caninum Indirect, IDvet Grabels, France), T. gondii (ID Screen Toxoplasmosis Indirect Multi-Species, IDvet Grabels, France), and C. burnetii (ID Screen Q Fever Indirect Multi-species, IDvet Grabels, France) according to the manufacturer’s instructions. The optical densities were read and recorded at 450 nm using a microplate photometer (HiPo MPP-96, BioSan, Riga, Latvia).
A herd was considered seropositive for each pathogen when a seropositive result was obtained for at least one tested animal. Conversely, a herd was considered seronegative when antibodies were not detected in any of the tested animals. Individual-level apparent seropositivity was calculated as the proportion of seropositive animals among the tested cattle. The corresponding 95% confidence intervals were based on cluster-robust standard errors, with herd specified as the clustering unit [42]. Herd-level seropositivity was estimated as the proportion of seropositive herds, and the corresponding 95% confidence intervals were calculated using the Wilson score method [43].
2.3. Candidate Predictors and Data Sources
Thirty-three environmental and demographic variables were used in the present study as described in Table 1. Climate indices (BIO1-BIO19) were derived from the WorldClim version 1.4. [44] and Normalized Difference Vegetation Index (NDVI) was extracted from the Copernicus European Earth Monitoring Program [45]. Forty-four categories of land uses (landcorine) as well as human population density (popden) were downloaded from the European Environment Agency [45,46]. The Digital Elevation Model (dem) was extracted from the CGIAR-CSI GeoPortal [47] and hydrological data (waterdis) were retrieved from HydroSHEDS [48]. Livestock density (goatsden) and wind speed (wind) were retrieved from the FAO [49] and the RAE [50], respectively.
Table 1.
Environmental and demographic variables evaluated in the study.
2.4. Factor Analyses
A major challenge was posed by multicollinearity among environmental variables—namely, temperature, vegetation, and precipitation (e.g., maximum, minimum, and mean temperatures followed identical seasonal fluctuations) [51]. As described by Dohoo et al. (1997) [52], the number of independent variables could be reduced before their associations with the outcome were investigated. This reduction could be achieved either by creating scores or indices combining data from several variables or by using multivariate methods (e.g., principal component analysis [PCA] or factor analysis [FA]) to summarize the information contained in the original predictors into a smaller set of variables [52].
PCA and FA are both dimensionality-reduction techniques based on different theoretical frameworks. PCA summarizes the total variance of observed variables into orthogonal components, whereas FA assumes that relationships among observed variables are explained by latent factors and that the original variables can be represented as linear combinations of the factors, weighted by their factor loadings, together with an error term [52]. FA was selected not only to mitigate multicollinearity but also to identify latent environmental gradients that might reflect underlying ecological processes influencing pathogen survival, transmission, and occurrence. Although PCA might have yielded a similar dimensional structure given the strong inter-variable correlations, FA allowed the extracted factors to be interpreted as latent constructs rather than simple linear combinations of correlated variables. Accordingly, the corresponding factor scores were used as predictors in the pathogen-specific multivariable logistic regression models of herd-level seropositivity.
Hybrid factors representing environmental gradients (e.g., a hot–dry to cold–wet gradient) could be produced by including disparate environmental variables, such as temperature, vegetation, and precipitation, in a single FA. Although statistically valid, such factors might be difficult to interpret biologically. From an ecological perspective, the multidimensionality of the data could be addressed by dividing explanatory variables into separate thematic groups before modelling. Each group could be considered to represent an underlying construct or ecological dimension [53]. In particular, metabolic rates, thermal tolerance, reproductive processes and growing-season intervals could be affected by temperature; habitat structure, food availability, and microclimate buffering could be influenced by vegetation; and water availability, soil moisture, and plant growth could be regulated by precipitation. Therefore, the information contained in the original variables was consolidated into three smaller sets of factors through separate FAs conducted for temperature (factor analysis A), vegetation (factor analysis B), and precipitation (factor analysis C) [54]. The retained factors, together with the additional variables, were used as predictors in pathogen-specific regression analyses.
In all analyses, the iterated principal-factor method was used for extraction [55,56]. The suitability of each group of variables was assessed using the Kaiser–Meyer–Olkin measure of sampling adequacy and Bartlett’s test of sphericity. The number of factors retained was determined by balancing parsimony, interpretability, and the total amount of variation in the original variables explained by the factors [55]. Kaiser’s criterion (initial eigenvalues ≥ 1), the scree plots, and the number of factors required to account for a given proportion of the variance observed in the original variables were evaluated [57]. Orthogonal (Varimax) rotation was applied in the final analyses to obtain a relatively simple and interpretable factor structure [53]. Absolute factor loadings > 0.40 were used to interpret the rotated factors [53].
2.5. Multivariable Logistic Regression Models
Following factor extraction, the regression method was used to produce standardized factor scores for the corresponding retained factors [55] representing environmental gradients or latent dimensions associated with (i) temperature, (ii) vegetation, and (iii) precipitation patterns. Variables with cross-loadings were retained and contributed to the factor scores according to their corresponding scoring coefficients. A panel of additional candidate variables, distinct from the groups of closely related environmental predictors, was offered for inclusion in multivariable analyses: (i) elevation, (ii) livestock density, (iii) land use, (iv) human population density, (v) distance to water bodies, and (vi) wind speed.
Specifically, three separate logistic regression models were used to evaluate the potential associations of the above factors and additional variables with herd-level seropositivity for N. caninum, T. gondii, and C. burnetii. All candidate predictors were screened using a univariable approach, with p < 0.25 set as the inclusion criterion [58]. The initial full models, which included all factor scores and variables that met the p < 0.25 screening criterion, were subsequently reduced in a stepwise fashion until all retained variables were significant at the 5% significance level (p < 0.05) [59]. A stepwise forward selection process was performed by offering the previously excluded factor scores and/or variables to the models one at a time. This procedure was used to ensure that any omitted predictors that could significantly contribute to the final models were included. All possible two-way interactions were tested for significance one by one.
2.6. Model Performance Assessment
The performance of the final models was evaluated in terms of calibration and goodness-of-fit, discrimination, and classification performance.
Pearson’s goodness-of-fit test was used to assess the fit of each model. Calibration was visually examined using calibration plots comparing observed and predicted probabilities. The plots were generated using the pmcalplot module in Stata (version 17.0) [60]. Calibration-in-the-large (CITL), the observed-to-expected (O:E) ratio, and the calibration slope were also assessed.
Model discrimination was evaluated using receiver operating characteristic (ROC) curves and quantified by the area under the curve (AUC), with corresponding 95% confidence intervals (CIs).
A post-estimation threshold analysis was conducted using the lsens command in Stata to evaluate changes in classification performance across predicted-probability thresholds. Sensitivity (Se) and specificity (Sp) were estimated across the range of probability cut-offs to evaluate their trade-off and inform the selection of an appropriate threshold for each model. Farms with predicted probabilities equal to or greater than a specified cut-off were classified as positive, and those below the cut-off as negative.
The reported measures were considered estimates of apparent model performance because they were derived from the development dataset. Internal validation was performed using 2000 bootstrap resamples to assess potential model overfitting and quantify optimism. Optimism-corrected estimates of the AUC and calibration slope were calculated for each model using the bsvalidation module in Stata [61].
2.7. Pairwise Associations and Tetrachoric Correlations of Pathogen Serostatus
The pairwise associations among the herd-level serostatus for N. caninum, T. gondii, and C. burnetii were assessed using Pearson’s χ2 tests. Additionally, the tetrachoric correlation coefficients were estimated between the binary variables representing herd-level serostatus (positive/negative) for each pathogen. A latent bivariate normal distribution was assumed for each pair of variables (v1, v2, v3), with a threshold model for the manifest variables, vi = 1 if and only if Xi > 0, and the respective pairwise correlation matrix was returned as r(Rho). Two-sided Fisher’s exact tests were also performed for the three pairwise comparisons, with Bonferroni adjustment.
2.8. Residual Spatial Dependence
Global Moran’s I was used to assess residual spatial dependence based on the standardized Pearson residuals of the final logistic regression models. Its calculation was based on a one-nearest-neighbour (k = 1) spatial weights structure using farm latitude and longitude, with distances calculated in kilometres using the Vincenty formula. Statistical significance was assessed using the normal approximation under the null hypothesis of spatial randomness.
Statistical analyses described in Section 2.2, Section 2.4, Section 2.5, Section 2.6, Section 2.7 and Section 2.8. were performed using Stata 17.0 (StataCorp LLC, College Station, TX, USA), with the significance level set at 5% [62].
2.9. Spatial Implementation of the Final Logistic Regression Models
The predictors retained in the final logistic regression models for herd-level seropositivity for N. caninum, T. gondii, and C. burnetii were implemented within a raster-based framework to generate maps of pathogen-specific environmental suitability across Greece [63]. Before spatial projection, candidate logistic regression models were compared using the small-sample corrected Akaike information criterion (AICc) [64]. Models were ranked by their AICc values, and ΔAICc values and Akaike weights were calculated.
Raster layers were generated using the standardization parameters, factor loadings, and scoring coefficients estimated in the statistical analyses to ensure consistency between the herd-level models and their raster implementation. For each raster cell, the corresponding fitted logistic regression model was applied to the predictor values, and predicted probabilities were obtained using the inverse-logit function. These probabilities were interpreted as continuous measures of environmental suitability associated with herd-level seropositivity rather than estimates of pathogen prevalence, environmental contamination, or disease risk.
Model-based uncertainty was quantified from the variance–covariance matrix of the fitted regression coefficients. The resulting 95% confidence intervals were expressed on the probability scale and represented uncertainty in the estimated mean probability rather than prediction uncertainty for individual herds.
Environmental support was assessed by comparing raster predictor values with the corresponding ranges observed among the sampled herds. Raster cells in which all predictor values were within their respective ranges were classified as environmentally supported, whereas cells with at least one predictor value outside these ranges were classified as requiring environmental extrapolation. A binary extrapolation mask was generated to distinguish the two categories [65,66].
The numerical implementation of each spatial model was verified by comparing raster-derived predicted probabilities, extracted at the sampled herd locations, with the corresponding fitted probabilities obtained directly from the logistic regression models. Agreement was assessed using Pearson’s correlation coefficient, root mean squared error (RMSE), mean absolute difference (MAD), and maximum absolute difference. This comparison was used to verify numerical implementation rather than assess predictive performance.
For each pathogen, an unrestricted suitability map containing raster cells with complete predictor information and an environmentally supported map restricted to supported areas were produced. Seropositive and seronegative herds were overlaid using distinct point symbols, whereas environmentally unsupported areas were displayed separately. A common probability scale (0–1), standardized layouts, and consistent cartographic elements were used to facilitate comparison among pathogens.
Environmental raster layers were obtained from the sources described in Section 2.3 and administrative-boundary data were accessed using geodata version 0.6.9 [67]. Spatial processing and raster-based analyses were conducted in R version 4.5.1 (R Core Team, 2025). Raster operations were performed using terra version 1.9.34 [67], whereas vector-data processing and cartographic production were conducted using sf version 1.1.2 [68], ggplot2 version 4.0.3 [69], tidyterra version 1.2.0 [70], and ggspatial version 1.1.10 [71]. Data manipulation was performed using dplyr version 1.2.1 [72].
3. Results
3.1. Individual- and Herd-Level Serological Results
Serological testing for the detection of antibodies against N. caninum, T. gondii, and C. burnetii was performed on 737 blood samples collected from 42 dairy cattle herds. At the individual level, apparent seropositivity was 24.56% (181/737; 95% CI: 11.53–37.58) for N. caninum, 15.74% (116/737; 95% CI: 7.69–23.79) for T. gondii, and 21.17% (156/737; 95% CI: 14.38–27.95) for C. burnetii. Herd-level seropositivity was 64.29% (27/42; 95% CI: 49.17–77.01) for N. caninum, 50.00% (21/42; 95% CI: 35.53–64.47) for T. gondii, and 57.14% (24/42; 95% CI: 42.21–70.88) for C. burnetii. The results are summarized in Table 2.
Table 2.
Geographic distribution of the 42 Greek dairy cattle herds and individual-level apparent seropositivity and herd-level seropositivity for N. caninum, T. gondii, and C. burnetii.
3.2. Retained Factors
Overall Kaiser–Meyer–Olkin (KMO) measures of sampling adequacy were (i) 0.72 for factor analysis A, (ii) 0.57 for factor analysis B, and (iii) 0.62 for factor analysis C. All three values exceeded the commonly used minimum threshold of 0.50, although the KMO value for factor analysis B was comparatively low. Bartlett’s test of sphericity was statistically significant across all three analyses (all p < 0.001), indicating that variables were sufficiently correlated within each dataset. Two of the initial variables (i) BIO1; annual mean temperature, and (ii) BIO6; minimum temperature of the coldest month, were excluded at the beginning of the process due to collinearity. According to Kaiser’s criterion, factors with eigenvalues ≥ 1 were retained across all three analyses, and their retention was further supported by visual inspection of the scree plots (Figure S1). The retained factors and their constituent variables with absolute factor loadings > 0.4 following orthogonal (Varimax) rotation were presented in Table 3.
Three factors (A1, A2, and A3) were retained in factor analysis A (temperature) (Table S1), cumulatively accounting for 98.95% of the variance in the original variables. As presented in Table 3, factor A1 (47.18%) represented overall thermal conditions, whereas A2 (27.11%) and A3 (25.71%) reflected thermal variability and thermal seasonality, respectively. The mean temperature of the wettest quarter (BIO8) cross-loaded on both A1 and A3. Mean diurnal range (BIO2) and annual temperature range (BIO7) cross-loaded on both A2 and A3.
Two factors (B1 and B2) were extracted in factor analysis B (vegetation) (Table S1), accounting for 79.47% of the total variance in the original variables. As detailed in Table 3, factor B1 (72.44%) represented warm-season vegetation activity, whereas B2 (27.56%) described transitional-season vegetation activity. April and October NDVI cross-loaded on both factors, reflecting transitions into and out of the warm season.
Two factors (C1 and C2) were retained in factor analysis C (precipitation) (Table S1), explaining 98.19% of the total variance in the original variables. As shown in Table 3, factor C1 (57.03%) represented overall precipitation conditions, and C2 (42.97%) described dry-season precipitation. Precipitation seasonality (BIO15) cross-loaded on both factors.
Table 3.
Retained factors and proportions of explained variance (%), constituent variables and factor interpretations from factor analyses of temperature, vegetation, and precipitation data.
3.3. Factor Scores and Additional Variables Associated with Herd-Level Seropositivity
The full logistic regression model for herd-level seropositivity for N. caninum included a temperature-related factor score (A1), a precipitation-related factor score (C2), and elevation; however, only factor score A1 remained statistically significant and was retained in the final model (Table 4). For every one-unit increase in factor score A1, the odds of a herd being positive for N. caninum decreased by 79% (OR = 0.21, 95% CI: 0.07; 0.67, p = 0.008) (Figure 2).
Figure 2.
Marginal model-predicted probabilities of herd-level seropositivity for N. caninum across factor score A1 (overall thermal conditions). Model-adjusted predictions were represented by the solid line, and 95% confidence intervals (CIs) were denoted by error bars.
The full logistic regression model for herd-level seropositivity for T. gondii included temperature-related factor scores (A1 and A2), a vegetation-related factor score (B1), and a precipitation-related factor score (C2), together with elevation, livestock density, and human population density. Factor scores A1 and B1, as well as elevation, remained statistically significant and were retained in the final model (Table 4). For each unit increase in factor scores A1 and B1, a farm was 170.2 (OR = 170.2, 95% CI: 5.74; 5042.8, p = 0.003) and 6.25 (OR = 6.25, 95% CI: 1.63; 23.97, p = 0.008) times more likely to be seropositive, respectively. The wide confidence interval of factor score A1 indicated considerable uncertainty in the estimated magnitude of the association, likely reflecting the relatively small number of farms and the steep relationship between the temperature factor and pathogen seropositivity. In addition, every one-unit increase in elevation was associated with a 1.5% (OR = 1.015, 95% CI: 1.0016; 1.029, p = 0.029) increase in the odds of a herd being seropositive (Figure 3).
Figure 3.
Marginal model-predicted probabilities of herd-level seropositivity for T. gondii across factor score A1 (overall thermal conditions), factor score B1 (warm-season vegetation activity), and elevation. Model-adjusted predictions were represented by solid lines, and 95% confidence intervals (CIs) were denoted by error bars, with all other predictors held constant at their means. The predicted probability was near zero at low values of factor score A1 and approached one at high values.
The full logistic regression model for herd-level seropositivity for C. burnetii included temperature-related factor scores (A1 and A2), a vegetation-related factor score (B1), and a precipitation-related factor score (C2), along with human population density, yet only factor scores B1 and C2 remained statistically significant and were retained in the final model (Table 4). For each unit increase in factor score B1, a farm had 3.23 times (OR = 3.23, 95% CI: 1.18; 8.82, p = 0.022) higher odds of being seropositive. Conversely, for every one-unit increase in factor score C2, the odds of a farm being seropositive decreased by 66% (OR = 0.34, 95% CI: 0.13; 0.87, p = 0.024) (Figure 4).
Figure 4.
Marginal model-predicted probability of herd-level seropositivity for C. burnetii across factor scores B1 (warm-season vegetation activity) and C2 (dry-season precipitation). Model-adjusted predictions were represented by solid lines, and 95% confidence intervals (CIs) were denoted by error bars, with the other predictor held constant at its mean.
Table 4.
Final multivariable logistic regression models for factors associated with herd-level seropositivity for N. caninum, T. gondii, and C. burnetii in Greek dairy cattle herds.
3.4. Performance of the Final Models
Apparent model performance was evaluated in terms of calibration and goodness-of-fit, discrimination, and classification performance.
Pearson’s goodness-of-fit test indicated adequate fit for the N. caninum (χ2 = 39.30, p = 0.5018), T. gondii (χ2 = 32.72, p = 0.7119), and C. burnetii (χ2 = 39.36, p = 0.4538) models. All three models had an O:E ratio of 1.00, a CITL of 0.00, and a calibration slope of 1.00. The calibration plots showed reasonably good agreement between observed and predicted probabilities across most of the predicted risk range (Figure S2).
Discrimination was acceptable for the N. caninum model (AUC = 0.788, 95% CI: 0.644; 0.932), excellent for the T. gondii model (AUC = 0.927, 95% CI: 0.850; 1.000), and acceptable for the C. burnetii model (AUC = 0.762, 95% CI: 0.616; 0.908) (Figure S3).
The relationship between predicted-probability thresholds and classification performance showed the expected trade-off between sensitivity and specificity across all three models (Figure S4). Lower probability thresholds generally resulted in higher sensitivity and lower specificity, whereas higher thresholds resulted in higher specificity at the cost of sensitivity. The probability range in which sensitivity and specificity were most closely balanced varied among the three models, reflecting differences in their predicted-risk distributions and discriminatory characteristics.
Internal validation was performed using 2000 bootstrap resamples to assess potential overfitting and estimate optimism-corrected model performance. For the N. caninum model, an optimism-corrected AUC of 0.790 (95% CI: 0.653; 0.947) and an optimism-corrected calibration slope of 1.058 (95% CI: 0.406; 2.271) were obtained. Regarding the T. gondii model, an optimism-corrected AUC of 0.908 (95% CI: 0.820; 1.000) and an optimism-corrected calibration slope of 0.810 (95% CI: 0.104; 1.449) were estimated. Similarly, for the C. burnetii model, an optimism-corrected AUC of 0.738 (95% CI: 0.603; 0.883) and a corresponding calibration slope of 0.922 (95% CI: 0.360; 1.895) were obtained. Overall, discriminatory performance was largely maintained across all three models, with only minor changes in AUC compared with the apparent estimates. Modest deviations from the ideal calibration slope were observed, particularly for the T. gondii model.
3.5. Pairwise Associations Between Pathogens’ Seropositivity
Pairwise associations between herd-level serostatus for N. caninum, T. gondii, and C. burnetii were evaluated using Pearson’s χ2 tests and tetrachoric correlation analysis. Two-sided Fisher’s exact-test p-values were also obtained and adjusted for the three pairwise comparisons using the Bonferroni method (Table 5). A significant association was found between the herd-level serostatus for N. caninum and T. gondii (Pearson’s χ2 =12.5481, p < 0.001), together with a strong negative tetrachoric correlation (rtet= −0.7856; Bonferroni-adjusted Fisher’s exact-test p = 0.002). Seropositive herds for N. caninum were more likely to be seronegative for T. gondii, and vice versa. Furthermore, a significant association was found between the herd-level serostatus for N. caninum and C. burnetii (Pearson’s χ2 = 8.3049, p = 0.004) alongside a strong negative tetrachoric correlation (rtet= −0.6882; Bonferroni-adjusted Fisher’s exact-test p = 0.0242). Seropositive herds for N. caninum were more likely to be seronegative for C. burnetii, and vice versa.
In contrast, a significant association was found between the herd-level serostatus for T. gondii and C. burnetii (Pearson’s χ2 = 19.0556, p < 0.001) together with a strong positive tetrachoric correlation (rtet = 0.8804; Bonferroni-adjusted Fisher’s exact-test p < 0.001). Seropositive herds for T. gondii were more likely to be seropositive for C. burnetii.
The corresponding 2 × 2 contingency tables are provided in Table S2.
Table 5.
Tetrachoric correlation matrix of N. caninum, T. gondii, and C. burnetii herd-level serostatus.
3.6. Residual Spatial Autocorrelation
Residual spatial autocorrelation was assessed using global Moran’s I, calculated from the standardized Pearson residuals of the final logistic regression models. Moran’s I values were close to zero for all three pathogen-specific models: N. caninum (I = −0.0905, Z = −0.3568, p = 0.7213), T. gondii (I = −0.0148, Z = 0.0550, p = 0.9561), and C. burnetii (I = 0.1198, Z = 0.7664, p = 0.4434). Therefore, no statistically significant differences between the observed and expected Moran’s I values were detected under the null hypothesis of spatial randomness, indicating no evidence of residual spatial autocorrelation after adjustment for the predictors included in the final models.
3.7. Spatial Model Implementation
Before spatial projection, an additional comparison of candidate models was performed using AICc. For all three pathogens, the models retained in the final logistic regression analyses were ranked first. The following predictors were included in these models: temperature-related factor score A1 for N. caninum (K = 2, AICc = 47.840, ΔAICc = 0.00, Akaike weight = 0.376); temperature-related factor score A1, vegetation-related factor score B1, and elevation for T. gondii (K = 4, AICc = 45.598, ΔAICc = 0.00, Akaike weight = 0.397); and vegetation-related factor score B1 and precipitation-related factor score C2 for C. burnetii (K = 3, AICc = 53.962, ΔAICc = 0.00, Akaike weight = 0.582).
Close agreement was observed between raster-derived and model-fitted probabilities, indicating that the regression equations and the inverse-logit transformation had been correctly implemented. Agreement metrics were as follows: for N. caninum—Pearson’s r = 1.000, RMSE = 5.71 × 10⁻⁷, mean absolute difference = 4.08 × 10⁻⁷, maximum absolute difference = 1.43 × 10⁻⁶; for T. gondii—Pearson’s r = 0.9979, RMSE = 0.0217, mean absolute difference = 0.0115, maximum absolute difference = 0.0847; and for C. burnetii—Pearson’s r = 0.9956, RMSE = 0.0213, mean absolute difference = 0.0135, maximum absolute difference = 0.0647.
Model-based uncertainty was summarized as the width of the 95% confidence interval around the spatial predictions (upper 95% CI – lower 95% CI). Within the environmentally supported prediction areas, the mean confidence-interval width was 0.336 (median = 0.336; range = 0.202–0.459) for N. caninum, 0.465 (median = 0.443; range = 0.101–0.916) for T. gondii, and 0.427 (median = 0.408; range = 0.316–0.830) for C. burnetii.
The verified raster implementations were subsequently used to generate pathogen-specific environmental suitability maps.
3.8. Environmental Suitability Maps
Distinct spatial patterns were observed in the environmentally supported suitability maps for N. caninum, T. gondii, and C. burnetii across Greece (Figure 5). Interpretation was restricted to areas where all predictor values fell within their respective calibration ranges.
Figure 5.
Environmentally supported maps of model-predicted suitability for herd-level seropositivity for N. caninum (A), T. gondii (B), and C. burnetii (C) across Greece. Seronegative and seropositive herds were represented by open and filled circles, respectively. Predicted suitability was displayed on a continuous scale ranging from 0 (lower suitability; purple) to 1 (higher suitability; yellow). Raster cells requiring environmental extrapolation were indicated by grey areas because at least one predictor value fell outside its respective calibration range.
Marked spatial heterogeneity was observed in the suitability map for N. caninum (Figure 5A). Higher values were concentrated in northern Greece, parts of the western mainland, the Peloponnese, and Crete, whereas lower values were distributed across several mainland and island regions. Environmentally unsupported areas were located mainly in western mainland Greece, with smaller, scattered zones in the northern and central regions, the Peloponnese, Crete, and various islands. Raster cells were shaded grey where the values of the temperature-related factor A1 fell outside its calibration range.
A general north–south contrast was depicted in the suitability map for T. gondii (Figure 5B). Suitability was generally higher across central and southern mainland Greece, the Peloponnese, Crete, and several island regions, and lower in northern Greece, particularly in the northeast. Environmentally unsupported areas were most extensive in western and northwestern mainland Greece, with smaller, scattered zones in the northern and central regions, the Peloponnese, Crete, and several islands. Cells where the values of one or more predictors—namely, temperature-related factor A1, vegetation-related factor B1, or elevation—fell outside their respective calibration ranges were shaded grey.
A heterogeneous and comparatively fragmented pattern was shown in the suitability map for C. burnetii (Figure 5C). Environmentally supported areas were largely confined to northern and central mainland Greece. Suitability was generally higher in parts of the western and northern mainland and lower in parts of the central and northeastern regions. In the Peloponnese, the supported prediction surface was limited and spatially fragmented, with environmental extrapolation required across large areas. Nearly all of Crete was classified as environmentally unsupported, whereas both supported predictions and areas requiring extrapolation occurred across other island regions. Cells where the values of vegetation-related factor B1, precipitation-related factor C2, or both fell outside their respective calibration ranges were shaded grey.
4. Discussion
A knowledge gap regarding the environmental and demographic factors associated with herd-level seropositivity for N. caninum, T. gondii, and C. burnetii in dairy cattle herds across Greece was identified through the literature review. Therefore, in this study, the serostatus of these pathogens was statistically modeled against these variables to evaluate their associations at the herd level. The herd-level serostatus was also used to assess potential pairwise associations, and to generate environmental suitability maps.
Forty-two dairy cattle herds located in different regions of Greece were serologically tested for antibodies against N. caninum, T. gondii, and C. burnetii. Individual-level seropositivity for N. caninum was identified in 24.56% of the dairy cattle, whereas herd-level seropositivity was 64.29%. Prevalence estimates of 15.2% and 27.9% for N. caninum antibodies in the milk of dairy herds were obtained using ELISA and immunoblot tests, respectively [73], while detection rates of 21.03% (184/875) and 21.50% (200/931) were reported in dairy cattle from Greece [74,75]. Collectively, exposure to N. caninum was consistently detected among Greek dairy cattle. In addition, antibodies against T. gondii were identified in 15.74% (116/737) of the tested cattle and 50.00% (21/42) of the herds. These results were consistent with previously published seropositivity rates of 39.7% [76,77], 20.0% [77,78], 8.1% [77,79], and 6.54% [75] in Greek cattle. Finally, antibodies against C. burnetii were detected in 21.17% of the tested cattle (156/737) and 57.14% (24/42) of the herds. Animal-level seropositivity ranging from 4.9% to 46.3% among herds was reported, whereas 35% of the examined herds were seropositive based on bulk-milk testing [80]. In addition, an animal-level seropositivity of 21% and a herd-level seropositivity of 40% were reported in the regions of Macedonia and the Aegean Islands [81]. C. burnetii DNA was detected in 33.8% of the bulk-tank milk of dairy herds across Greece [82]. In a recent study, C. burnetii DNA was detected in the bulk-tank milk samples from 58.3% of 60 Greek dairy herds, whereas antibodies were identified in 95% of bulk-milk samples. Following individual serum testing in a subset of 28 herds, at least one seropositive animal was detected in 89.3% of the herds [41], which was higher than the 57.14% observed in the present study. This difference may partly reflect the geographical composition of the sampled herds. Most herds in the present study were located in Central Greece (25/42), whereas the individual-serum analysis by Valiakos et al. was focused mainly on herds located in northern Greece [41]. Variation in herd selection and management practices between the two study populations may also have contributed to the difference. Overall, exposure to C. burnetii is widespread among Greek dairy cattle herds.
The extracted factors, together with additional variables, were evaluated for their associations with herd-level seropositivity for each pathogen using three multivariable logistic regression models. The models demonstrated acceptable-to-excellent discriminatory performance and good apparent calibration, as indicated by the calibration statistics and graphical assessments. Following bootstrap internal validation, the AUC values remained largely unchanged despite the limited sample size, indicating that the models retained their ability to distinguish between seropositive and seronegative herds. The optimism-corrected calibration slopes showed relatively small deviations from the ideal value, with the largest deviation observed for the T. gondii model. Overall, these findings suggested that the models provided a useful framework for investigating factors associated with herd-level seropositivity, although further validation using independent datasets would be necessary to assess their reliability and predictive performance.
In the final model of herd-level seropositivity for N. caninum, only the temperature-related factor A1 was retained as statistically significant. This factor represented overall thermal conditions characterized by increased maximum temperature of the warmest month and increased mean temperatures across all quarters, and was negatively associated with herd-level seropositivity. Specifically, the odds of herd-level seropositivity decreased as factor score A1 increased. This finding may be related to the life cycle of N. caninum which involves the shedding of oocysts into the farm environment by definitive canine hosts [4]. Greek summers are usually characterized by extended periods with high ambient temperatures coupled with drought. These climatic conditions might promote the desiccation and degradation of oocysts in contaminated feed and water supplies. Consequently, a lower oocyst load in the environment might decrease the odds of infection in cattle through horizontal transmission, which is considered the main route of pathogen introduction into a naïve herd. Nevertheless, vertical transmission remains important for the persistence of N. caninum in endemically infected herds [83]. According to current scientific evidence, this appears to be the first study to report a negative association between increased ambient temperatures and herd-level seropositivity for N. caninum in Greece.
Associations between N. caninum seropositivity and several environmental factors have been reported in previous studies conducted in other European countries. These included precipitation during the driest month and elevation in northeastern Spain [84]; mean July temperature and annual precipitation in Germany [85]; and higher minimum spring temperatures together with a narrow extension of summer NDVI in a buffer zone surrounding farms in Italy [86]. Although temperate conditions can favor the transmission cycle of N. caninum, the findings of the present study suggest that higher ambient temperatures may reduce the potential for horizontal transmission.
In the final model of herd-level seropositivity for T. gondii, the temperature-related factor A1, the vegetation-related factor B1, and elevation were retained as statistically significant. More precisely, the odds of herd-level seropositivity increased as factor scores A1 and B1, and elevation increased. Despite the positive association reported between factor A1, representing overall thermal conditions, and herd-level seropositivity, the corresponding estimate was imprecise, as reflected by the wide confidence interval. This uncertainty may be attributed to the limited sample size and the steep gradient in the model-predicted probability of herd-level seropositivity across the observed range of the temperature factor. Thus, the magnitude of the estimated association should be interpreted cautiously. According to the findings, this factor was also negatively associated with herd-level seropositivity for N. caninum. The contrasting associations observed between factor A1 and herd-level seropositivity for N. caninum and T. gondii could suggest differences in the ecology of the two parasites and/or the behavior of their respective definitive hosts. Given that feral and domestic cats serve as the definitive hosts responsible for shedding T. gondii oocysts into the environment [22], it could be hypothesized that periods of increased ambient temperatures influence their behavioral and roaming patterns, thereby increasing opportunities for fecal contamination around feed and water storage facilities. Several factors associated with cattle seropositivity, including unrestricted movement of cats on farms and unsecured feed storage, were identified [87]. Similar conditions may also be present on Greek dairy cattle farms.
Herd-level seropositivity for T. gondii was also positively associated with factor B1, which reflected warm-season vegetation activity. Although increased ambient temperatures might accelerate the desiccation of oocysts, the combination of high temperatures and increased vegetation activity during warm months might create a protective microclimate. Under such conditions, vegetation cover could protect oocysts from lethal UV radiation and extreme dryness, providing favorable conditions for their survival in soil and forage [88].
In addition, an increase in farm elevation was positively associated with herd-level seropositivity for T. gondii. High-elevation areas of Greece may be characterized by heavy rainfall and prolonged morning mist, thereby creating humid conditions that could favor oocyst survival [23]. In these regions, denser vegetation surrounding farms could provide suitable habitats for small rodents and birds that may serve as prey for farm or stray cats. Based on the available literature, this appears to be the first report associating environmental factors with herd-level seropositivity for T. gondii in cattle from Greece.
In the model of herd-level seropositivity for C. burnetii, both the vegetation-related factor B1 and precipitation-related factor C2 were retained as statistically significant. Specifically, the odds of herd-level seropositivity increased as factor score B1, which represented warm-season vegetation activity, increased. This positive association could be related to a greater abundance of vectors such as ticks and/or the grazing habits of cattle. On the one hand, ticks can harbor the pathogen and require ambient moisture to survive during off-host periods [89,90,91,92]. Higher NDVI metrics reflect denser, healthier, and more abundant vegetation, which is usually associated with a more humid microclimate. Such conditions could enhance tick survival by reducing the desiccation effects of wind and direct sunlight during the warmer months [93,94]. Furthermore, farms situated in landscapes with denser vegetation may be more likely to use pasturelands for cattle grazing, thereby increasing the probability of direct livestock contact not only with tick vectors but also with contaminated environmental material.
Conversely, the odds of herd-level seropositivity decreased as factor score C2, which reflected dry-season precipitation, increased. This outcome was consistent with the findings of Valiakos et al. [41] and may be related to airborne transmission of the pathogen. In particular, the small-cell variants (SCVs) are highly resistant, spore-like structures that can attach to dust particles, and can then be disseminated by wind over long distances [95,96]. Rainfall and increased humidity can mitigate airborne transmission by reducing the dispersion of dust containing infectious particles, and thereby minimizing the formation of contaminated aerosols. By contrast, dry conditions could facilitate the formation of aerosols from dusty, contaminated farm debris, increasing the risk of respiratory exposure among grazing cattle [97,98].
Beyond the environmental factors associated with herd-level seropositivity for N. caninum, T. gondii and C. burnetii, distinct patterns of pairwise association among the herd-level serostatus of these pathogens were identified. Herds seropositive for N. caninum tended to be seronegative for T. gondii and vice versa, further suggesting an inverse association between their herd-level serostatus. A negative correlation was also observed between herd-level seropositivity for N. caninum and C. burnetii, indicating that seropositivity for both pathogens tended to occur less frequently within the same herd. These inverse relationships might reflect differences in the environmental conditions associated with N. caninum compared with T. gondii and C. burnetii. Local macroclimatic conditions associated with herd-level seropositivity for N. caninum might simultaneously be less suitable for herd-level seropositivity for T. gondii and C. burnetii. In addition, the multivariable models showed that the temperature-related factor A1 was associated with herd-level seropositivity in opposite directions—negatively for N. caninum and positively for T. gondii. Finally, the environmental factors associated with herd-level seropositivity for N. caninum differed from those identified for T. gondii and C. burnetii.
In contrast, a strong positive association was identified between the herd-level serostatus for T. gondii and C. burnetii, indicating that concurrent herd-level seropositivity tended to occur more frequently within the same herds. This pattern could reflect shared environmental associations and was consistent with the finding that herd-level seropositivity for both pathogens was positively associated with the vegetation-related factor B1. Overall, these findings suggested that macroclimatic conditions and warm-season vegetation activity may be associated with distinct and overlapping patterns of seropositivity among the examined Greek dairy cattle herds. The pairwise associations should be interpreted cautiously because they were based on a relatively small number of herds and on a binary herd-level classification, whereby a herd was considered seropositive when at least one tested animal was seropositive.
Spatial modelling was implemented and the geographical distribution of model-predicted environmental suitability for herd-level seropositivity for each pathogen across Greece was depicted in the resulting maps. The single-predictor model for N. caninum followed the spatial distribution of the temperature-related factor A1 and the broadest environmentally supported prediction surface was produced. A pronounced north–south contrast in predicted suitability across a relatively extensive supported domain was produced by the T. gondii model, which included the temperature-related factor A1, the vegetation-related factor B1, and elevation. In contrast, the C. burnetii model, which included the vegetation-related factor B1 and the precipitation-related factor C2, was characterized by the most geographically restricted and fragmented supported domain, concentrated mainly in northern and central mainland Greece. The distinct spatial patterns observed for each pathogen were likely attributable to differences in the retained predictors. Areas of higher model-predicted environmental suitability were identified by the maps, which could be used to guide future field investigations into the spatial ecology of these pathogens. The planning of surveillance activities in environmentally comparable areas may also be informed by these maps.
However, several limitations should be considered when interpreting the findings of this study and assessing the potential applications of these maps. First, a convenience sample of cattle and farms was used, because only serological results obtained through diagnostic investigations of bovine reproductive disorders were available. Consequently, the study population may not be representative of the national cattle population, potentially limiting the applicability of the findings. In addition, individual- and herd-level serological results were used as indirect indicators of pathogen exposure and circulation but did not necessarily indicate active infection or clinical disease.
Second, the factors identified through factor analyses may represent both underlying environmental gradients and deterministic relationships arising from the construction of bioclimatic variables. Since some variables are mathematically derived from one another, the covariance structure may reflect not only ecological processes but also the mathematical formulas used to construct them. Therefore, factor analysis may capture genuine environmental gradients together with patterns arising from deterministic relationships among the bioclimatic variables. Consequently, a temperature factor identified by factor analysis may partly reflect how the variables were defined rather than solely represent a latent ecological construct.
Third, environmental support was assessed using the observed marginal ranges of the predictors in the calibration dataset. This approach identifies predictions extending beyond the individual environmental ranges represented by the sampled farms, but it does not necessarily detect novel multivariable combinations in which all predictors remain individually within their respective calibration ranges.
Fourth, apparent model performance was evaluated using the 42 farms included in model development, because an independent dataset was not available for external validation. Therefore, the reported predictive performance may be optimistic, and the geographical transferability of the fitted models remains uncertain.
Finally, the generated maps represented model-derived environmental suitability for herd-level seropositivity based exclusively on the predictors included in the fitted models. They should not be interpreted as maps of pathogen prevalence, active infection, environmental contamination, disease occurrence, or epidemiological risk.
5. Conclusions
Herd-level seropositivity for N. caninum, T. gondii, and C. burnetii was common among the examined dairy cattle herds. Factor analyses were used to summarize the correlated environmental predictors into a smaller set of environmental dimensions, while biologically interpretable, pathogen-specific associations with herd-level seropositivity were identified using multivariable logistic regression. The models demonstrated acceptable-to-excellent discriminatory performance, which was largely maintained following bootstrap internal validation. Based on tetrachoric correlation analysis, herd-level seropositivity for N. caninum was inversely associated with seropositivity for both T. gondii and C. burnetii, whereas a positive association was identified between T. gondii and C. burnetii. Distinct spatial patterns for each pathogen were depicted in the suitability maps, and environmentally supported areas were distinguished from areas requiring extrapolation. Overall, these findings provide a basis for targeted field validation and pathogen-specific surveillance planning. As the maps were designed to represent environmental suitability for herd-level seropositivity rather than prevalence or disease risk, independent validation using larger and more representative datasets will be required before their broader application.
Supplementary Materials
The following supporting information can be downloaded at https://www.mdpi.com/article/10.3390/vetsci13111202/s1, Figure S1: Scree plots from the factor analyses of temperature (A), vegetation (B), and precipitation (C) variables. Solid blue lines represented the eigenvalues obtained from each analysis, whereas horizontal red dashed lines indicated Kaiser’s criterion (eigenvalue = 1). Factor retention was determined by considering eigenvalues ≥ 1 together with visual inspection of the scree plots, parsimony, interpretability, and the proportion of variance explained; Figure S2: Calibration plots of the final logistic regression models for Neospora caninum (1), Toxoplasma gondii (2), and Coxiella burnetii (3). Dashed blue lines represented perfect calibration, solid blue lines represented the smoothed calibration curves, and open green circles represented grouped observed and model-predicted probabilities. Shaded areas indicated 95% confidence intervals around the smoothed curves. The apparent O:E ratio and CITL were 1.000 and 0.000, respectively, for all three models. Calibration slopes were reported as apparent estimates, followed in parentheses by the optimism-corrected estimates and their corresponding 95% confidence intervals. For models 1, 2, and 3, respectively, the calibration slopes were 1.000 (1.058; 95% CI: 0.406–2.271), 1.000 (0.810; 95% CI: 0.104–1.449), and 1.000 (0.922; 95% CI: 0.360–1.895); Figure S3: Receiver operating characteristic (ROC) curves of the final multivariable logistic regression models for Neospora caninum (1), Toxoplasma gondii (2), and Coxiella burnetii (3). The ROC curves represented the apparent ability of the models to discriminate between seropositive and seronegative herds, whereas the diagonal red lines represented discrimination equivalent to chance. AUCs were reported as apparent estimates, followed in parentheses by the optimism-corrected estimates and their corresponding 95% confidence intervals. The AUCs were 0.788 (0.790; 95% CI: 0.653–0.947), 0.927 (0.908; 95% CI: 0.820–1.000), and 0.762 (0.738; 95% CI: 0.603–0.883) for models 1, 2, and 3, respectively; Figure S4: Sensitivity and specificity across predicted-probability cut-offs for the final multivariable logistic regression models for Neospora caninum (1), Toxoplasma gondii (2), and Coxiella burnetii (3). Sensitivity (blue) and specificity (red) were plotted against the predictedprobability threshold. The curves illustrated the trade-off between sensitivity and specificity across the evaluated thresholds and facilitated identification of the probability range in which the two measures were most closely balanced; Table S1: Results of factor analyses A, B, and C for temperature, normalized difference vegetation index (NDVI), and precipitation variables following iterated principal-factor (IPF) extraction and orthogonal (Varimax) rotation a; Table S2: Pairwise 2 × 2 contingency tables of herd-level serostatus for N. caninum, T. gondii, and C. burnetii in 42 Greek dairy cattle herds.
Author Contributions
Conceptualization, V.S. (Vassilis Skampardonis) and M.S.; methodology, V.S. (Vassilis Skampardonis), E.T., A.G. and M.S.; software, V.S. (Vassilis Skampardonis), E.T. and A.G.; validation, V.S. (Vassilis Skampardonis), E.T., A.G., Z.A., A.T. and M.S.; formal analysis, V.S. (Vassilis Skampardonis), E.T., A.G., Z.A., A.T., I.N. and M.S.; investigation, V.S. (Vassilis Skampardonis), E.T., A.G., Z.A., A.T., D.C.C., I.N., G.S.A. and M.S.; resources, V.S. (Vassilis Skampardonis), E.T., V.S. (Vassiliki Spyrou), I.N., G.S.A. and M.S.; data curation, V.S. (Vassilis Skampardonis), E.T., A.G. and M.S.; writing—original draft preparation, V.S. (Vassilis Skampardonis), E.T. and M.S.; writing—review and editing, V.S. (Vassilis Skampardonis), Z.A., D.C.C., V.S. (Vassiliki Spyrou), C.B. and M.S.; visualization, V.S. (Vassilis Skampardonis), E.T., A.G. and M.S.; supervision, V.S. (Vassilis Skampardonis), V.S. (Vassiliki Spyrou), C.B. and M.S.; project administration, D.C.C., C.B. and M.S.; funding acquisition, G.S.A. and C.B. All authors have read and agreed to the published version of the manuscript.
Funding
This research has been co-financed by the European Regional Development Fund of the European Union and Greek national funds through the Operational Program Competitiveness, Entrepreneurship and Innovation, under the call RESEARCH–CREATE–INNOVATE (project code: T1EDK-01078).
Institutional Review Board Statement
Ethical review and approval were waived for this study because all blood samples were collected by veterinarians as part of routine diagnostic investigations or investigations of pre-existing herd health problems, and no experimental procedures were performed specifically for this research.
Informed Consent Statement
Written informed consent was obtained from all farm owners before sample collection.
Data Availability Statement
The original contributions presented in this study are included in the article/Supplementary Material. Further inquiries can be directed to the corresponding authors.
Acknowledgments
The research is conducted in the operating framework of the University of Thessaly Innovation, Technology Transfer Unit and Entrepreneurship Center “One Planet Thessaly”, under the “University of Thessaly Grants for Scientific Publication Support” action and is funded by the Special Account of Research Grants of the University of Thessaly.
Conflicts of Interest
The authors declare no conflicts of interest.
Abbreviations
The following abbreviations are used in this manuscript:
| N. caninum | Neospora caninum |
| T. gondii | Toxoplasma gondii |
| C. burnetii | Coxiella burnetii |
| BIO | Bioclimatic |
| NDVI | Normalized Difference Vegetation Index |
| PCA | Principal component analysis |
| FA | Factor analysis |
| CITL | Calibration-in-the-large |
| O:E | Observed-to-expected ratio |
| ROC | Receiver operating characteristic curve |
| AUC | Area under the curve |
| CI | confidence intervals |
| Se | Sensitivity |
| Sp | Specificity |
| AICc | Corrected Akaike information criterion |
| RMSE | Root mean squared error |
| MAD | Mean absolute difference |
| KMO | Kaiser–Meyer–Olkin measures |
| OR | Odds Ratio |
References
- Anderson, M.L.; Blanchard, P.C.; Barr, B.C.; Dubey, J.P.; Hoffman, R.L.; Conrad, P.A. Neospora-like Protozoan Infection as a Major Cause of Abortion in California Dairy Cattle. J. Am. Vet. Med. Assoc. 1991, 198, 241–244. [Google Scholar] [CrossRef] [Scilit]
- Barr, B.C.; Conrad, P.A.; Breitmeyer, R.; Sverlow, K.; Anderson, M.L.; Reynolds, J.; Chauvet, A.E.; Dubey, J.P.; Ardans, A.A. Congenital Neospora Infection in Calves Born from Cows That Had Previously Aborted Neospora-Infected Fetuses: Four Cases (1990–1992). J. Am. Vet. Med. Assoc. 1993, 202, 113–117. [Google Scholar] [CrossRef] [Scilit]
- Dubey, J.P.; Hartley, W.J.; Lindsay, D.S.; Topper, M.J. Fatal Congenital Neospora Caninum Infection in a Lamb. J. Parasitol. 1990, 76, 127–130. [Google Scholar] [CrossRef] [Scilit]
- Dubey, J.P. Review of Neospora Caninum and Neosporosis in Animals. Korean J. Parasitol. 2003, 41, 1–16. [Google Scholar] [CrossRef] [Scilit] [PubMed]
- Barr, B.C.; Anderson, M.L.; Woods, L.W.; Dubey, J.P.; Conrad, P.A. Neospora-like Protozoal Infections Associated with Abortion in Goats. J. Vet. Diagn. Investig. 1992, 4, 365–367. [Google Scholar] [CrossRef] [Scilit] [PubMed]
- McAllister, M.M.; Dubey, J.P.; Lindsay, D.S.; Jolley, W.R.; Wills, R.A.; McGuire, A.M. Rapid Communication: Dogs Are Definitive Hosts of Neospora Caninum. Int. J. Parasitol. 1998, 28, 1473–1479. [Google Scholar] [CrossRef] [Scilit]
- Sedlák, K.; Bartova, E.; Machacova, T. Seroprevalence of Neospora Caninum in Cats from the Czech Republic. Acta Parasitol. 2014, 59, 359–361. [Google Scholar] [CrossRef] [Scilit] [PubMed]
- Hornok, S.; Edelhofer, R.; Joachim, A.; Farkas, R.; Berta, K.; Répási, A.; Lakatos, B. Seroprevalence of Toxoplasma Gondii and Neospora Caninum Infection of Cats in Hungary. Acta Vet. Hung. 2008, 56, 81–88. [Google Scholar] [CrossRef] [Scilit] [PubMed]
- Ferroglio, E.; Guiso, P.; Pasino, M.; Accossato, A.; Trisciuoglio, A. Antibodies to Neospora Caninum in Stray Cats from North Italy. Vet. Parasitol. 2005, 131, 31–34. [Google Scholar] [CrossRef] [Scilit] [PubMed]
- Dubey, J.P.; Jenkins, M.C.; Rajendran, C.; Miska, K.; Ferreira, L.R.; Martins, J.; Kwok, O.C.H.; Choudhary, S. Gray Wolf (Canis lupus) Is a Natural Definitive Host for Neospora Caninum. Vet. Parasitol. 2011, 181, 382–387. [Google Scholar] [CrossRef] [Scilit] [PubMed]
- Gondim, L.F.P.; McAllister, M.M.; Pitt, W.C.; Zemlicka, D.E. Coyotes (Canis latrans) Are Definitive Hosts of Neospora caninum. Int. J. Parasitol. 2004, 34, 159–161. [Google Scholar] [CrossRef] [Scilit] [PubMed]
- Almería, S.; Ferrer, D.; Pabón, M.; Castellà, J.; Mañas, S. Red Foxes (Vulpes vulpes) Are a Natural Intermediate Host of Neospora caninum. Vet. Parasitol. 2002, 107, 287–294. [Google Scholar] [CrossRef] [Scilit] [PubMed]
- Nardoni, S.; Poli, A.; Varvaro, I.; Rocchigiani, G.; Ceccherelli, R.; Mancianti, F. Detection of Neospora caninum DNA in Wild Birds from Italy. Pathogens 2019, 8, 202. [Google Scholar] [CrossRef] [Scilit] [PubMed]
- de Barros, L.D.; Miura, A.C.; Minutti, A.F.; Vidotto, O.; Garcia, J.L. Neospora caninum in Birds: A Review. Parasitol. Int. 2018, 67, 397–402. [Google Scholar] [CrossRef] [Scilit] [PubMed]
- Schlüter, D.; Däubener, W.; Schares, G.; Groß, U.; Pleyer, U.; Lüder, C. Animals Are Key to Human Toxoplasmosis. Int. J. Med. Microbiol. 2014, 304, 917–929. [Google Scholar] [CrossRef] [Scilit] [PubMed]
- Stelzer, S.; Basso, W.; Benavides Silván, J.; Ortega-Mora, L.M.; Maksimov, P.; Gethmann, J.; Conraths, F.J.; Schares, G. Toxoplasma Gondii Infection and Toxoplasmosis in Farm Animals: Risk Factors and Economic Impact. Food Waterborne Parasitol. 2019, 15, e00037. [Google Scholar] [CrossRef] [Scilit] [PubMed]
- Schares, G.; Bangoura, B.; Randau, F.; Goroll, T.; Ludewig, M.; Maksimov, P.; Matzkeit, B.; Sens, M.; Bärwald, A.; Conraths, F.J.; et al. High Seroprevalence of Toxoplasma Gondii and Probability of Detecting Tissue Cysts in Backyard Laying Hens Compared with Hens from Large Free-Range Farms. Int. J. Parasitol. 2017, 47, 765–777. [Google Scholar] [CrossRef] [Scilit] [PubMed]
- Dubey, J.P. A Review of Toxoplasmosis in Wild Birds. Vet. Parasitol. 2002, 106, 121–153. [Google Scholar] [CrossRef] [Scilit] [PubMed]
- Alvarado-Esquivel, C.; Rajendran, C.; Ferreira, L.R.; Kwok, O.C.H.; Choudhary, S.; Alvarado-Esquivel, D.; Rodríguez-Peña, S.; Villena, I.; Dubey, J.P. Prevalence of Toxoplasma Gondii Infection in Wild Birds in Durango, Mexico. J. Parasitol. 2011, 97, 809–812. [Google Scholar] [CrossRef] [Scilit] [PubMed]
- Galeh, T.M.; Sarvi, S.; Montazeri, M.; Moosazadeh, M.; Nakhaei, M.; Shariatzadeh, S.A.; Daryani, A. Global Status of Toxoplasma Gondii Seroprevalence in Rodents: A Systematic Review and Meta-Analysis. Front. Vet. Sci. 2020, 7, 461. [Google Scholar] [CrossRef] [Scilit] [PubMed]
- Pappas, G.; Roussos, N.; Falagas, M.E. Toxoplasmosis Snapshots: Global Status of Toxoplasma Gondii Seroprevalence and Implications for Pregnancy and Congenital Toxoplasmosis. Int. J. Parasitol. 2009, 39, 1385–1394. [Google Scholar] [CrossRef] [Scilit] [PubMed]
- Dubey, J.P.; Miller, N.L.; Frenkel, J.K. The Toxoplasma gondii oocyst from cat feces. J. Exp. Med. 1970, 132, 636–662. [Google Scholar] [CrossRef] [Scilit] [PubMed]
- Shapiro, K.; Bahia-Oliveira, L.; Dixon, B.; Dumètre, A.; De Wit, L.A.; VanWormer, E.; Villena, I. Environmental Transmission of Toxoplasma Gondii: Oocysts in Water, Soil and Food. Food Waterborne Parasitol. 2019, 15, e00049. [Google Scholar] [CrossRef] [Scilit] [PubMed]
- Dubey, J.P. A Review of Toxoplasmosis in Pigs. Vet. Parasitol. 1986, 19, 181–223. [Google Scholar] [CrossRef] [Scilit] [PubMed]
- Dubey, J.P. Toxoplasmosis in Sheep—The Last 20 Years. Vet. Parasitol. 2009, 163, 1–14. [Google Scholar] [CrossRef] [Scilit] [PubMed]
- Jacobs, L.; Moyle, G.G. The Prevalence of Toxoplasmosis in New Zealand Sheep and Cattle. Am. J. Vet. Res. 1963, 24, 673–675. [Google Scholar] [PubMed]
- Dubey, J.P.; Streitel, R.H. Prevalence of Toxoplasma Infection in Cattle Slaughtered at an Ohio Abattoir. J. Am. Vet. Med. Assoc. 1976, 169, 1197–1199. [Google Scholar] [CrossRef] [Scilit]
- Guatteo, R.; Seegers, H.; Taurel, A.-F.; Joly, A.; Beaudeau, F. Prevalence of Coxiella Burnetii Infection in Domestic Ruminants: A Critical Review. Vet. Microbiol. 2011, 149, 1–16. [Google Scholar] [CrossRef] [Scilit] [PubMed]
- Higgins, D.; Marrie, T.J. Seroepidemiology of Q Fever among Cats in New Brunswick and Prince Edward Island. Ann. N. Y. Acad. Sci. 1990, 590, 271–274. [Google Scholar] [CrossRef] [Scilit] [PubMed]
- Ebani, V.V. Retrospective Study on the Occurrence of Antibodies against Coxiella Burnetii in Dogs from Central Italy. Pathogens 2020, 9, 1068. [Google Scholar] [CrossRef] [Scilit] [PubMed]
- Meerburg, B.G.; Reusken, C.B.E.M. The Role of Wild Rodents in Spread and Transmission of Coxiella Burnetii Needs Further Elucidation. Wildl. Res. 2011, 38, 617–625. [Google Scholar] [CrossRef] [Scilit]
- Anderson, A.; Bijlmer, H.; Fournier, P.-E.; Graves, S.; Hartzell, J.; Kersh, G.J.; Limonard, G.; Marrie, T.J.; Massung, R.F.; McQuiston, J.H.; et al. Diagnosis and Management of Q Fever--United States, 2013: Recommendations from CDC and the Q Fever Working Group. MMWR Recomm. Rep. 2013, 62, 1–30. [Google Scholar] [CrossRef] [Scilit]
- Derrick, E.H. “Q” Fever, a New Fever Entity: Clinical Features, Diagnosis and Laboratory Investigation. Rev. Infect. Dis. 1983, 5, 790–800. [Google Scholar] [CrossRef] [Scilit] [PubMed]
- World Organization for Animal Health. Manual of Diagnostic Tests and Vaccines for Terrestrial Animals; World Organization for Animal Health: Paris, France, 2018. [Google Scholar]
- Reid, A.J.; Vermont, S.J.; Cotton, J.A.; Harris, D.; Hill-Cawthorne, G.A.; Könen-Waisman, S.; Latham, S.M.; Mourier, T.; Norton, R.; Quail, M.A.; et al. Comparative Genomics of the Apicomplexan Parasites Toxoplasma Gondii and Neospora Caninum: Coccidia Differing in Host Range and Transmission Strategy. PLoS Pathog. 2012, 8, e1002567. [Google Scholar] [CrossRef] [Scilit] [PubMed]
- Dubey, J.P. Toxoplasma Gondii Oocyst Survival under Defined Temperatures. J. Parasitol. 1998, 84, 862–865. [Google Scholar] [CrossRef] [Scilit]
- Lélu, M.; Villena, I.; Dardé, M.-L.; Aubert, D.; Geers, R.; Dupuis, E.; Marnef, F.; Poulle, M.-L.; Gotteland, C.; Dumètre, A.; et al. Quantitative Estimation of the Viability of Toxoplasma Gondii Oocysts in Soil. Appl. Environ. Microbiol. 2012, 78, 5127–5132. [Google Scholar] [CrossRef] [Scilit] [PubMed]
- Waap, H.; Bärwald, A.; Nunes, T.; Schares, G. Seroprevalence and Risk Factors for Toxoplasma Gondii and Neospora Caninum in Cattle in Portugal. Animals 2022, 12, 2080. [Google Scholar] [CrossRef] [Scilit] [PubMed]
- Villa, L.; Allievi, C.; Di Cerbo, A.R.; Zanzani, S.A.; Sommariva, F.; Zanini, L.; Mortarino, M.; Manfredi, M.T. Neospora Caninum Antibodies in Bulk Tank Milk from Dairy Cattle Herds in Italy in Relation to Reproductive and Productive Parameters and Spatial Analysis. Acta Trop. 2024, 254, 107194. [Google Scholar] [CrossRef] [Scilit] [PubMed]
- Nusinovici, S.; Frössling, J.; Widgren, S.; Beaudeau, F.; Lindberg, A. Q Fever Infection in Dairy Cattle Herds: Increased Risk with High Wind Speed and Low Precipitation. Epidemiol. Infect. 2015, 143, 3316–3326. [Google Scholar] [CrossRef] [Scilit] [PubMed]
- Valiakos, G.; Gouvias, I.; Lysitsas, M.; Bouzalas, I.; Tampach, S.; Malissiova, E.; Giannakopoulos, A.; Tsokana, C.N.; Vourvidis, D.; Kyrma, A.; et al. Exposure of Dairy Cows to Coxiella Burnetii in Greece: Surveillance Results and Association of Bacterial Presence with Environmental Variables. Microbiol. Res. 2024, 15, 655–666. [Google Scholar] [CrossRef] [Scilit]
- Colin Cameron, A.; Miller, D.L. A Practitioner’s Guide to Cluster-Robust Inference. J. Hum. Resour. 2015, 50, 317–372. [Google Scholar] [CrossRef] [Scilit]
- Wallis, S. Binomial Confidence Intervals and Contingency Tests: Mathematical Fundamentals and the Evaluation of Alternative Methods. J. Quant. Linguist. 2013, 20, 178–208. [Google Scholar] [CrossRef] [Scilit]
- Hijmans, R.J.; Cameron, S.E.; Parra, J.L.; Jones, P.G.; Jarvis, A. Very High Resolution Interpolated Climate Surfaces for Global Land Areas. Int. J. Climatol. 2005, 25, 1965–1978. [Google Scholar] [CrossRef] [Scilit]
- European Environment Agency. Copernicus Land Monitoring Service—Corine Land Cover. Available online: https://www.eea.europa.eu/data-and-maps/data/copernicus-land-monitoring-service-corine (accessed on 25 May 2023).
- European Environment Agency. Datasets. Available online: https://www.eea.europa.eu/data-and-maps/data/#c0=5&c11=&c5=all&b_start=0 (accessed on 25 May 2023).
- SRTM 90m Digital Elevation Database v4.1. Available online: https://csidotinfo.wordpress.com/data/srtm-90m-digital-elevation-database-v4-1/ (accessed on 2 November 2026).
- HydroSHEDS. Available online: https://www.hydrosheds.org/ (accessed on 25 May 2023).
- Nicolas, G.; Robinson, T.P.; Wint, G.R.W.; Conchedda, G.; Cinardi, G.; Gilbert, M. Using Random Forest to Improve the Downscaling of Global Livestock Census Data. PLoS ONE 2016, 11, e0150424. [Google Scholar] [CrossRef] [Scilit] [PubMed]
- ΡAΕ|Official Website. Available online: https://www.rae.gr/ (accessed on 2 November 2026).
- Kyriazos, T.; Poga, M. Dealing with Multicollinearity in Factor Analysis: The Problem, Detections, and Solutions. Open J. Stat. 2023, 13, 404–424. [Google Scholar] [CrossRef]
- Dohoo, I.R.; Ducrot, C.; Fourichon, C.; Donald, A.; Hurnik, D. An Overview of Techniques for Dealing with Large Numbers of Independent Variables in Epidemiologic Studies. Prev. Vet. Med. 1997, 29, 221–239. [Google Scholar] [CrossRef] [Scilit] [PubMed]
- Lepš, J.; Šmilauer, P. Multivariate Analysis of Ecological Data. Bull. Ecol. Soc. Am. 2006, 87, 193. [Google Scholar] [CrossRef] [Scilit][Green Version]
- Tahtali, Y. Use of Factor Scores in Multiple Regression Analysis for Estimation of Body Weight by Certain Body Measurements in Romanov Lambs. PeerJ 2019, 7, e7434. [Google Scholar] [CrossRef] [Scilit] [PubMed]
- Berghaus, R.D.; Lombard, J.E.; Gardner, I.A.; Farver, T.B. Factor Analysis of a Johne’s Disease Risk Assessment Questionnaire with Evaluation of Factor Scores and a Subset of Original Questions as Predictors of Observed Clinical Paratuberculosis. Prev. Vet. Med. 2005, 72, 291–309. [Google Scholar] [CrossRef] [Scilit] [PubMed]
- Costello, A.; Osborne, J. Best Practices in Exploratory Factor Analysis: Four Recommendations for Getting the Most From Your Analysis. Pract. Assess. Res. Eval. 2005, 10, 1–9. [Google Scholar]
- Stevens, J. Applied Multivariate Statistics for the Social Sciences, 3rd ed.; Lawrence Elbaum Associates: Mahwah, NJ, USA, 1996. [Google Scholar]
- Hosmer, D.W.; Lemeshow, S. Model-Building Strategies and Methods for Logistic Regression. In Applied Logistic Regression; John Wiley & Sons, Ltd.: Hoboken, NJ, USA, 1989; pp. 89–151. [Google Scholar]
- Mickey, R.M.; Greenland, S. The Impact of Confounder Selection Criteria on Effect Estimation. Am. J. Epidemiol. 1989, 129, 125–137. [Google Scholar] [CrossRef] [Scilit] [PubMed]
- Ensor, J.; Snell, K.I.; Martin, E.C. PMCALPLOT: Stata Module to Produce Calibration Plot of Prediction Model Performance. Comput. Sci. Math. 2024. [Google Scholar]
- Fernandez-Felix, B.M.; García-Esquinas, E.; Muriel, A.; Royuela, A.; Zamora, J. Bootstrap Internal Validation Command for Predictive Logistic Regression Models. Stata J. Promot. Commun. Stat. Stata 2021, 21, 498–509. [Google Scholar] [CrossRef] [Scilit]
- StataCorp. Stata Statistical Software, Release 17; StataCorp LLC: College Station, TX, USA, 2021. [Google Scholar]
- Guisan, A.; Zimmermann, N.E. Predictive Habitat Distribution Models in Ecology. Ecol. Model. 2000, 135, 147–186. [Google Scholar] [CrossRef] [Scilit]
- Hurvich, C.M.; Tsai, C.L. Model Selection for Extended Quasi-Likelihood Models in Small Samples. Biometrics 1995, 51, 1077–1084. [Google Scholar] [CrossRef] [Scilit]
- Mesgaran, M.B.; Cousens, R.D.; Webber, B.L. Here Be Dragons: A Tool for Quantifying Novelty Due to Covariate Range and Correlation Change When Projecting Species Distribution Models. Divers. Distrib. 2014, 20, 1147–1159. [Google Scholar] [CrossRef] [Scilit]
- Elith, J.; Kearney, M.; Phillips, S. The Art of Modelling Range-Shifting Species. Methods Ecol. Evol. 2010, 1, 330–342. [Google Scholar] [CrossRef] [Scilit]
- Hijmans, R.J. Geodata: Access Geographic Data, R Package Version 0.6-9; The R Foundation: Vienna, Austria, 2026. [Google Scholar]
- Pebesma, E. The R Journal: Simple Features for R: Standardized Support for Spatial Vector Data. R J. 2018, 10, 439–446. [Google Scholar] [CrossRef] [Scilit]
- Wickham, H. Ggplot2: Elegant Graphics for Data Analysis; Springer: New York, NY, USA, 2016. [Google Scholar]
- Hernangómez, D. Using the Tidyverse with Terra Objects: The Tidyterra Package. J. Open Source Softw. 2023, 8, 5751. [Google Scholar] [CrossRef] [Scilit]
- Dunnington, D.; Thorne, B.; Hernangómez, D. Ggspatial: Spatial Data Framework for Ggplot2; The R Foundation: Vienna, Austria, 2026. [Google Scholar]
- Wickham, H.; François, R.; Henry, L.; Müller, K.; Vaughan, D. Dplyr: A Grammar of Data Manipulation; The R Foundation: Vienna, Austria, 2023. [Google Scholar]
- Sotiraki, S.; Brozos, C.; Samartzi, F.; Schares, G.; Kiossis, E.; Conraths, F.J. Neospora caninum Infection in Greek Dairy Cattle Herds Detected by Two Antibody Assays in Individual Milk Samples. Vet. Parasitol. 2008, 152, 79–84. [Google Scholar] [CrossRef] [Scilit] [PubMed]
- Lefkaditis, M.; Mpairamoglou, R.; Sossidou, A.; Spanoudis, K.; Tsakiroglou, M. Neospora Caninum, A Potential Cause of Reproductive Failure in Dairy Cows from Northern Greece. Vet. Parasitol. Reg. Stud. Rep. 2020, 19, 100365. [Google Scholar] [CrossRef] [Scilit] [PubMed]
- Lefkaditis, M.; Athanasakopoulou, Z.; Sofia, M.; Mpairamoglou, R.; Billinis, C. Seroprevalence of Toxoplasma Gondii and Associated Risk Factors in Dairy Cows in Greece. Approaches Poult. Dairy Vet. Sci. 2022, 9, 887–890. [Google Scholar] [CrossRef] [Scilit]
- Kritsepi-Konstantinou, M. Serological survey for toxoplasmosis in cattle. J. Hell. Vet. Med. Soc. 1992, 43, 48–52. [Google Scholar]
- Symeonidou, I.; Sioutas, G.; Lazou, T.; Gelasakis, A.I.; Papadopoulos, E. A Review of Toxoplasma Gondii in Animals in Greece: A FoodBorne Pathogen of Public Health Importance. Animals 2023, 13, 2530. [Google Scholar] [CrossRef] [Scilit] [PubMed]
- Diakou, A.; Papadopoulos, E.; Haralabidis, S.; Papachristou, F.; Karatzias, H.; Panousis, N. Prevalence of Parasites in Intensively Managed Dairy Cattle in Thessaloniki Region, Greece. Cattle Pract. 2005, 13, 51–54. [Google Scholar]
- Lefkaditis, M.; Evagelopoulou, G.; Sossidou, A.; Spanoudis, K. Neosporosis and Toxoplasmosis Are Two Prevalent and Important Protozoses in Dairy Cows in Small Farms from Thessaly, Central Greece. J. Hell. Vet. Med. Soc. 2020, 71, 2357–2362. [Google Scholar] [CrossRef] [Scilit]
- Dovolou, E.; Tsiligianni, T.; Vouzaras, D.; Amiridis, G.S. Prevalence of Coxiella Burnetii Antibodies in Bulk Milk and Blood Serum and Associations with Reproductive Indices in Cow Dairy Herds of Central and Northern Greece. J. Hell. Vet. Med. Soc. 2011, 62, 314–319. [Google Scholar] [CrossRef] [Scilit][Green Version]
- Vourvidis, D.; Kyrma, A.; Linou, M.; Edouard, S.; Angelakis, E. Sero-Epidemiology Investigation of Coxiella Burnetii in Domestic Ruminants throughout Most Greek Regions. Vet. Med. Sci. 2021, 7, 99–104. [Google Scholar] [CrossRef] [Scilit] [PubMed]
- Kalaitzakis, E.; Fancello, T.; Simons, X.; Chaligiannis, I.; Tomaiuolo, S.; Andreopoulou, M.; Petrone, D.; Papapostolou, A.; Giadinis, N.D.; Panousis, N.; et al. Coxiella Burnetii Shedding in Milk and Molecular Typing of Strains Infecting Dairy Cows in Greece. Pathogens 2021, 10, 287. [Google Scholar] [CrossRef] [Scilit] [PubMed]
- Selim, A.; Alshammari, A.; Gattan, H.S.; Marzok, M.; Salem, M.; AL-Jabr, O.A. Neospora Caninum Infection in Dairy Cattle in Egypt: A Serosurvey and Associated Risk Factors. Sci. Rep. 2023, 13, 15489. [Google Scholar] [CrossRef] [Scilit] [PubMed]
- Nogareda, C.; Jubert, A.; Kantzoura, V.; Kouam, M.K.; Feidas, H.; Theodoropoulos, G. Geographical Distribution Modelling for Neospora Caninum and Coxiella Burnetii Infections in Dairy Cattle Farms in Northeastern Spain. Epidemiol. Infect. 2013, 141, 81–90. [Google Scholar] [CrossRef] [Scilit] [PubMed]
- Schares, G.; Bärwald, A.; Staubach, C.; Ziller, M.; Klöss, D.; Wurm, R.; Rauser, M.; Labohm, R.; Dräger, K.; Fasen, W.; et al. Regional Distribution of Bovine Neospora Caninum Infection in the German State of Rhineland-Palatinate Modelled by Logistic Regression. Int. J. Parasitol. 2004, 33, 1631–1640. [Google Scholar] [CrossRef] [Scilit] [PubMed]
- Rinaldi, L.; Fusco, G.; Musella, V.; Veneziano, V.; Guarino, A.; Taddei, R.; Cringoli, G. Neospora Caninum in Pastured Cattle: Determination of Climatic, Environmental, Farm Management and Individual Animal Risk Factors Using Remote Sensing and Geographical Information Systems. Vet. Parasitol. 2005, 128, 219–230. [Google Scholar] [CrossRef] [Scilit] [PubMed]
- Fajardo, H.V.; D’ávila, S.; Bastos, R.R.; Cyrino, C.D.; de Lima Detoni, M.; Garcia, J.L.; das Neves, L.B.; Nicolau, J.L.; Amendoeira, M.R.R.; Fajardo, H.V.; et al. Seroprevalence and Risk Factors of Toxoplasmosis in Cattle from Extensive and Semi-Intensive Rearing Systems at Zona Da Mata, Minas Gerais State, Southern Brazil. Parasites Vectors 2013, 6, 191. [Google Scholar] [CrossRef] [Scilit] [PubMed]
- Ware, M.W.; Augustine, S.A.J.; Erisman, D.O.; See, M.J.; Wymer, L.; Hayes, S.L.; Dubey, J.P.; Villegas, E.N. Determining UV Inactivation of Toxoplasma Gondii Oocysts by Using Cell Culture and a Mouse Bioassay. Appl. Environ. Microbiol. 2010, 76, 5140–5147. [Google Scholar] [CrossRef] [Scilit] [PubMed]
- Chaligiannis, I.; Fernández de Mera, I.G.; Papa, A.; Sotiraki, S.; de la Fuente, J. Molecular Identification of Tick-Borne Pathogens in Ticks Collected from Dogs and Small Ruminants from Greece. Exp. Appl. Acarol. 2018, 74, 443–453. [Google Scholar] [CrossRef] [Scilit] [PubMed]
- Psaroulaki, A.; Ragiadakou, D.; Kouris, G.; Papadopoulos, B.; Chaniotis, B.; Tselentis, Y. Ticks, Tick-Borne Rickettsiae, and Coxiella Burnetii in the Greek Island of Cephalonia. Ann. N. Y. Acad. Sci. 2006, 1078, 389–399. [Google Scholar] [CrossRef] [Scilit] [PubMed]
- Vourvidis, D.; Makka, S.; Baniasadi, V.; Perdikaris, S.; Emmanouil, M.; Tzouganatou, G.; Martinez-Gonzalez, B.; Evangelia, K.; Grigorios, M.; Papadogiannakis, E.; et al. Genotyping of Coxiella Burnetii in Ticks Collected from Wildlife in Greece. J. Biotechnol. Biomed. 2025, 8, 141–147. [Google Scholar] [CrossRef] [Scilit]
- Randolph, S.E. Tick Ecology: Processes and Patterns behind the Epidemiological Risk Posed by Ixodid Ticks as Vectors. Parasitology 2004, 129, S37–S65. [Google Scholar] [CrossRef] [Scilit] [PubMed]
- Pfäffle, M.; Littwin, N.; Muders, S.V.; Petney, T.N. The Ecology of Tick-Borne Diseases. Int. J. Parasitol. 2013, 43, 1059–1077. [Google Scholar] [CrossRef] [Scilit] [PubMed]
- Gray, J.S.; Dautel, H.; Estrada-Peña, A.; Kahl, O.; Lindgren, E. Effects of Climate Change on Ticks and Tick-Borne Diseases in Europe. Interdiscip. Perspect. Infect. Dis. 2009, 2009, 593232. [Google Scholar] [CrossRef] [Scilit] [PubMed]
- Tiwade, Y.R.; Bankar, N.J.; Dawande, P.; Mankar, A.; Noman, O. From Animal to Humans: A Review of Coxiella Burnetii and Its Role in Zoonotic Diseases. J. Cell. Biotechnol. 2025, 11, 73–78. [Google Scholar] [CrossRef] [Scilit]
- Tissot-Dupont, H.; Amadei, M.-A.; Nezri, M.; Raoult, D. Wind in November, Q Fever in December. Emerg. Infect. Dis. 2004, 10, 1264–1269. [Google Scholar] [CrossRef] [Scilit] [PubMed]
- de Rooij, M.M.T.; Borlée, F.; Smit, L.A.M.; de Bruin, A.; Janse, I.; Heederik, D.J.J.; Wouters, I.M. Detection of Coxiella Burnetii in Ambient Air after a Large Q Fever Outbreak. PLoS ONE 2016, 11, e0151281. [Google Scholar] [CrossRef] [Scilit] [PubMed]
- Boikmanis, G.; Elferts, D.; Šteingolde, Ž.; Mališevs, A.; Ķibilds, J.; Grantiņa-Ieviņa, L.; Bērziņš, A.; Valciņa, O. Surveillance of Q Fever in Dairy Cattle in Latvia: Molecular and Serological Findings and Association with Farm and Woodland Density. Microorganisms 2026, 14, 881. [Google Scholar] [CrossRef] [Scilit] [PubMed]
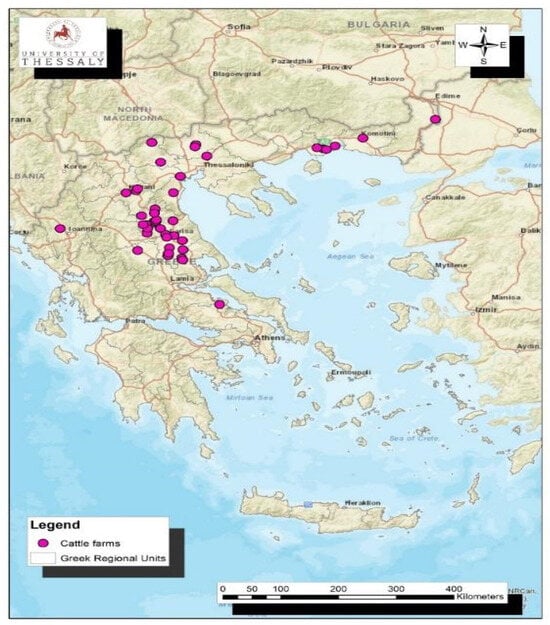
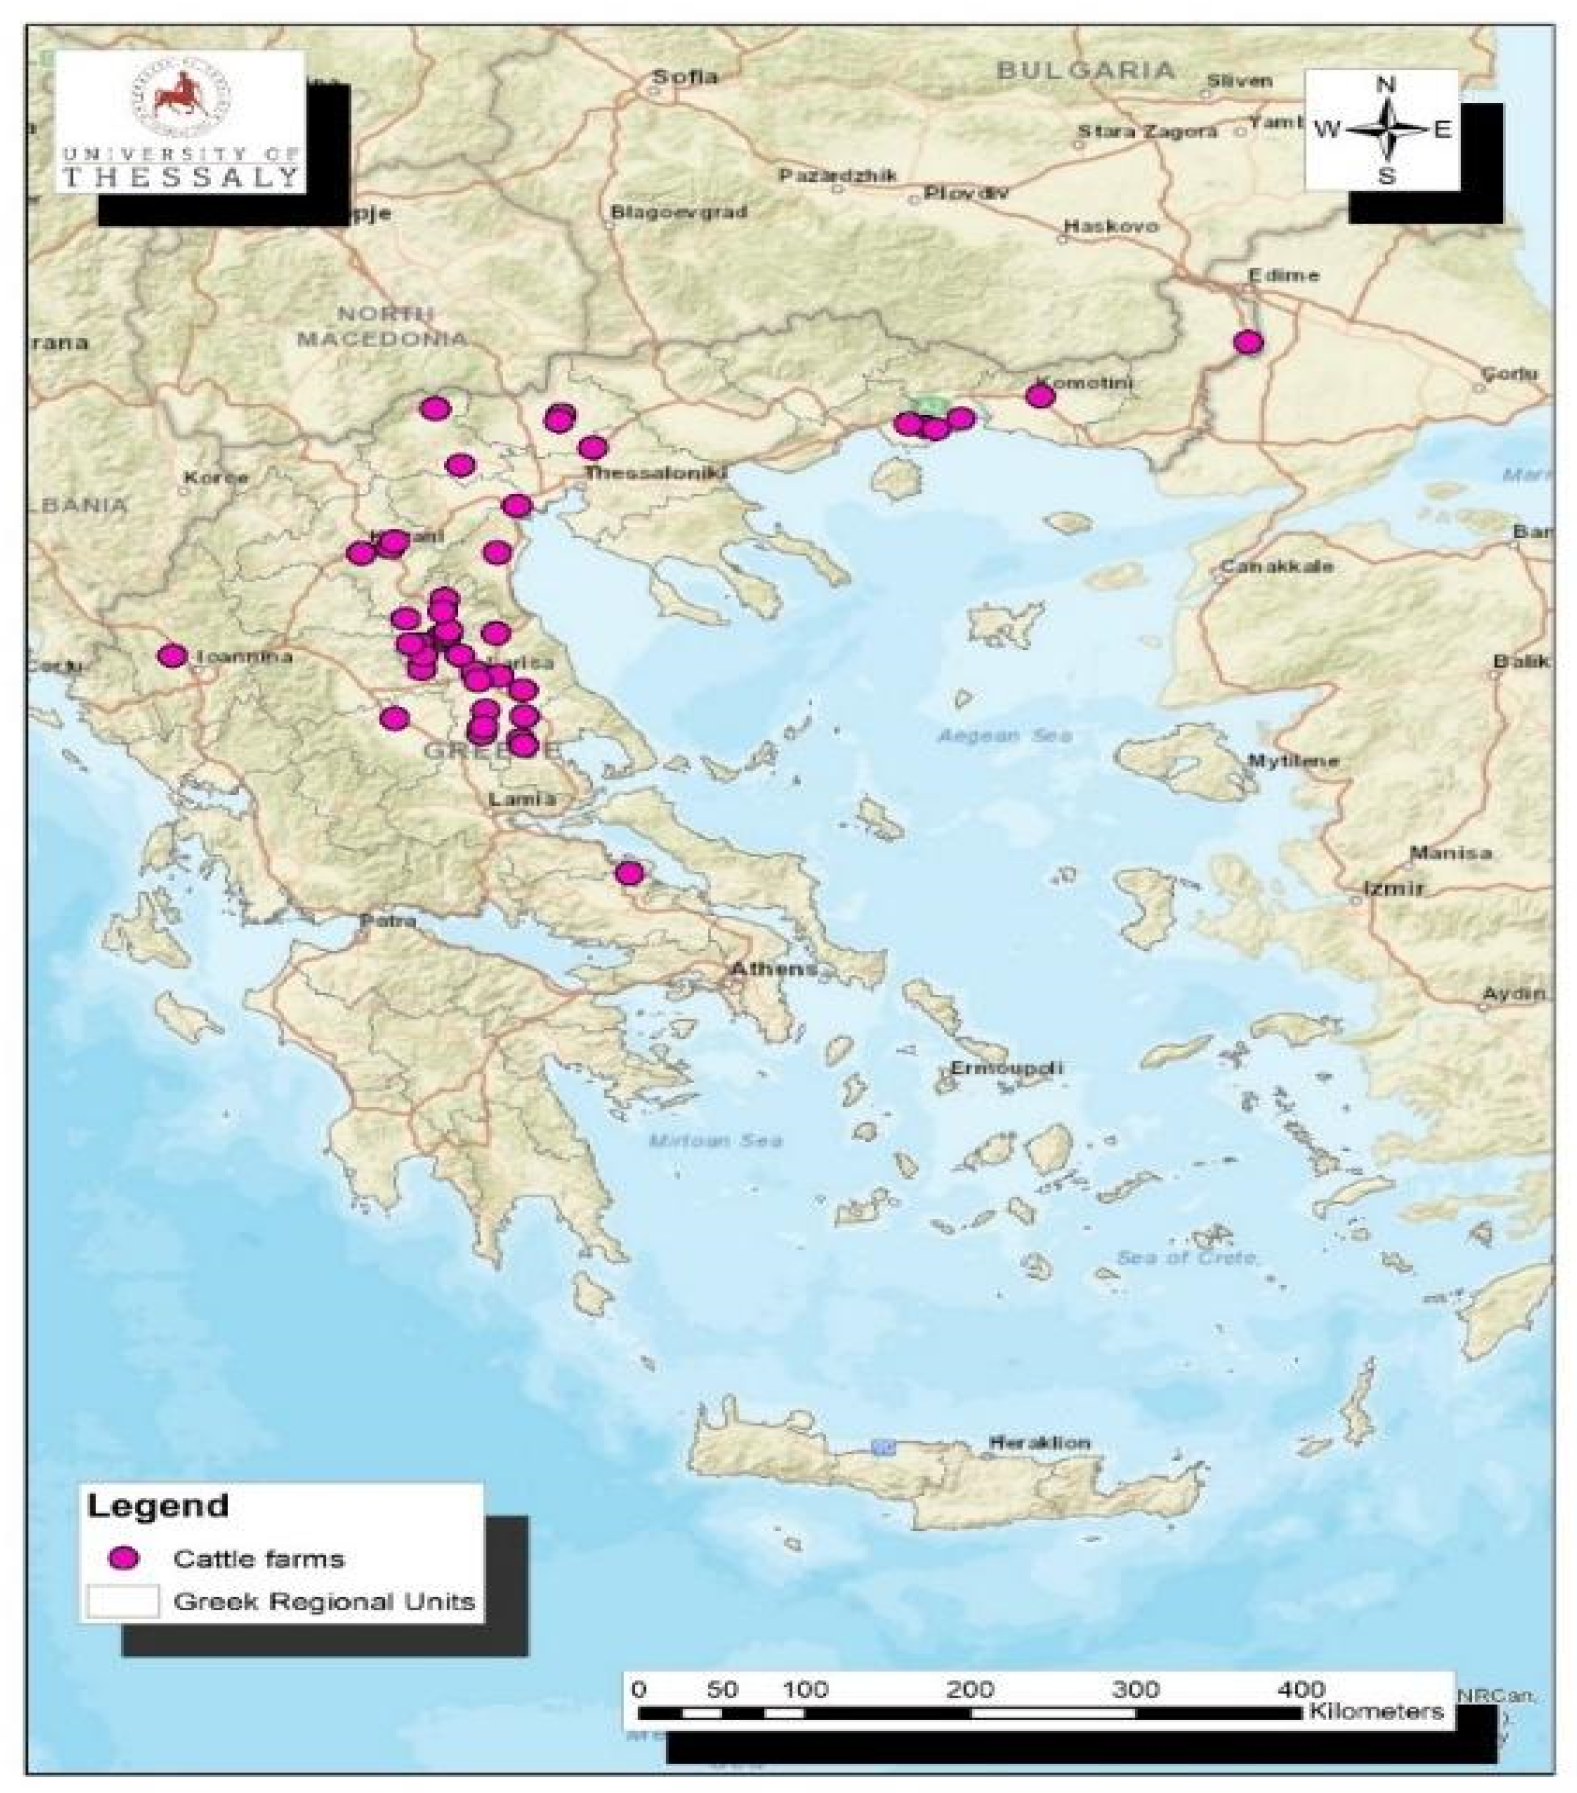
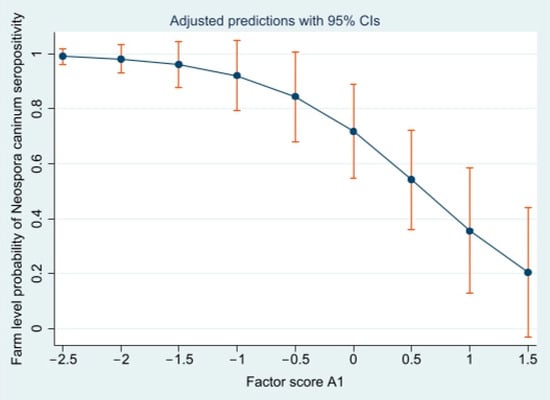
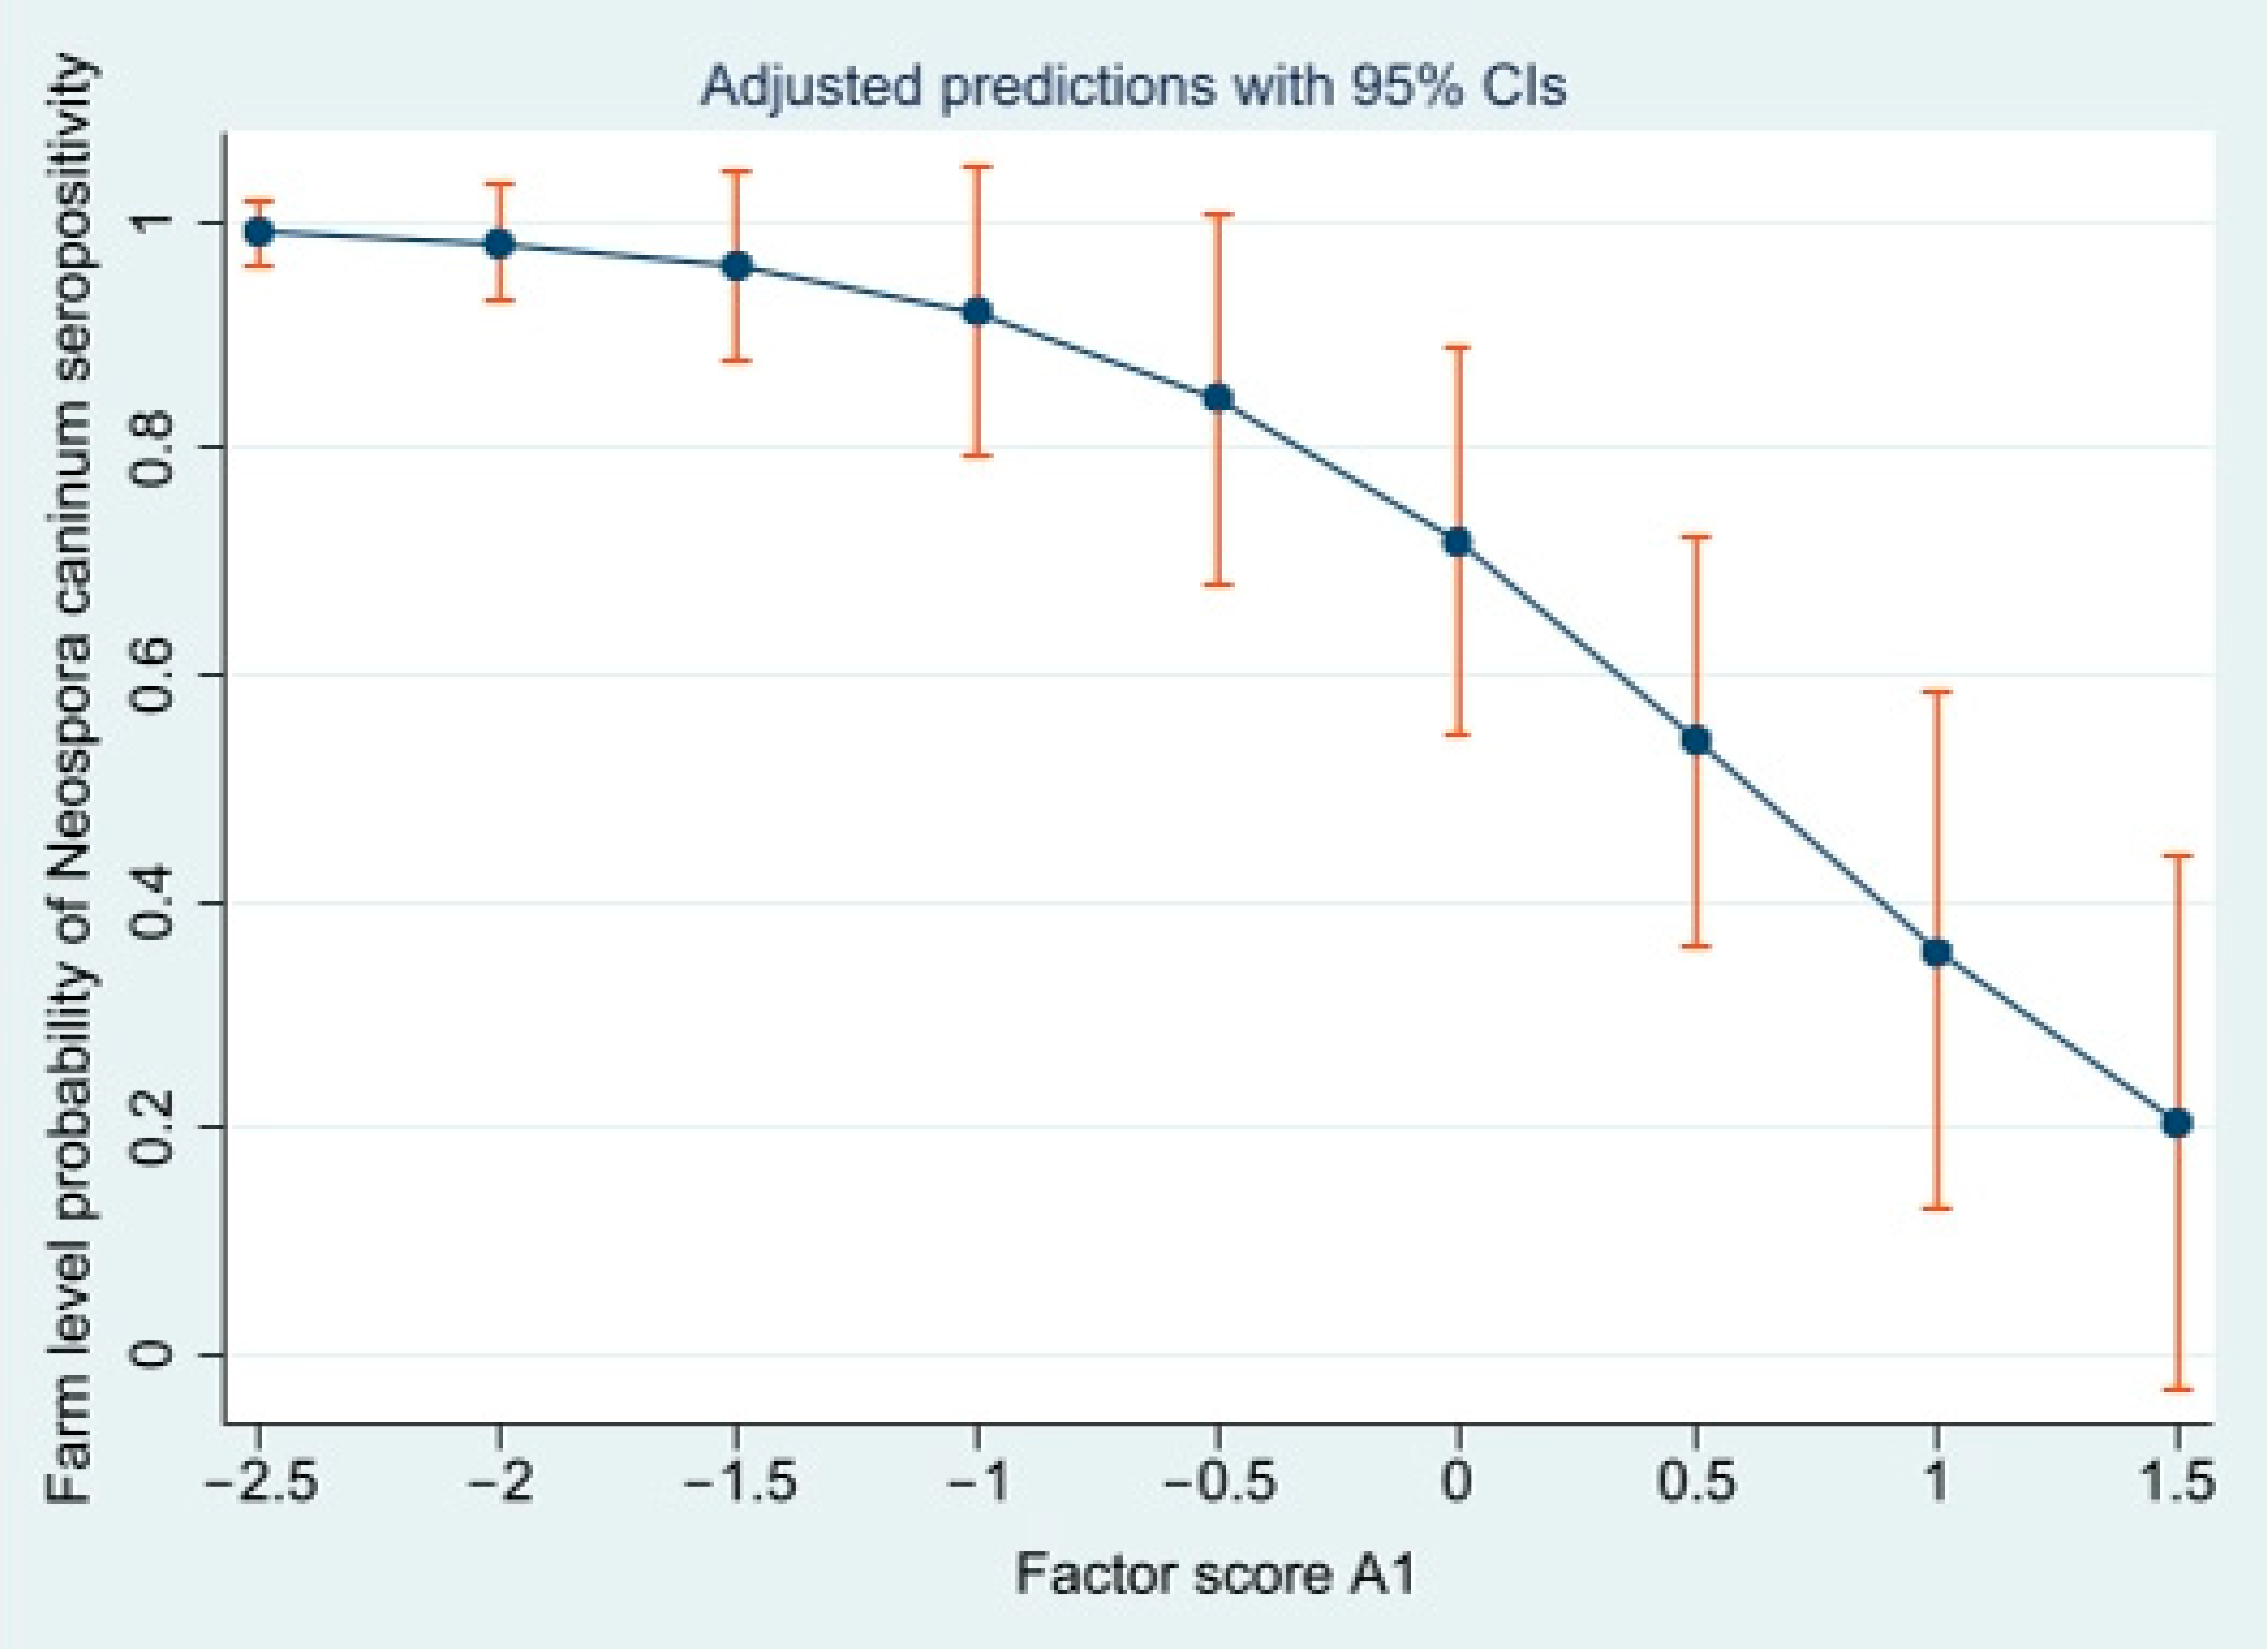
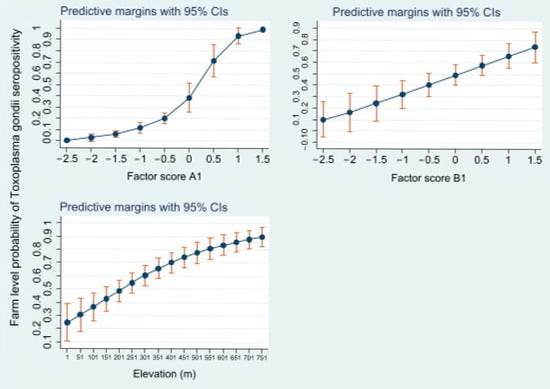
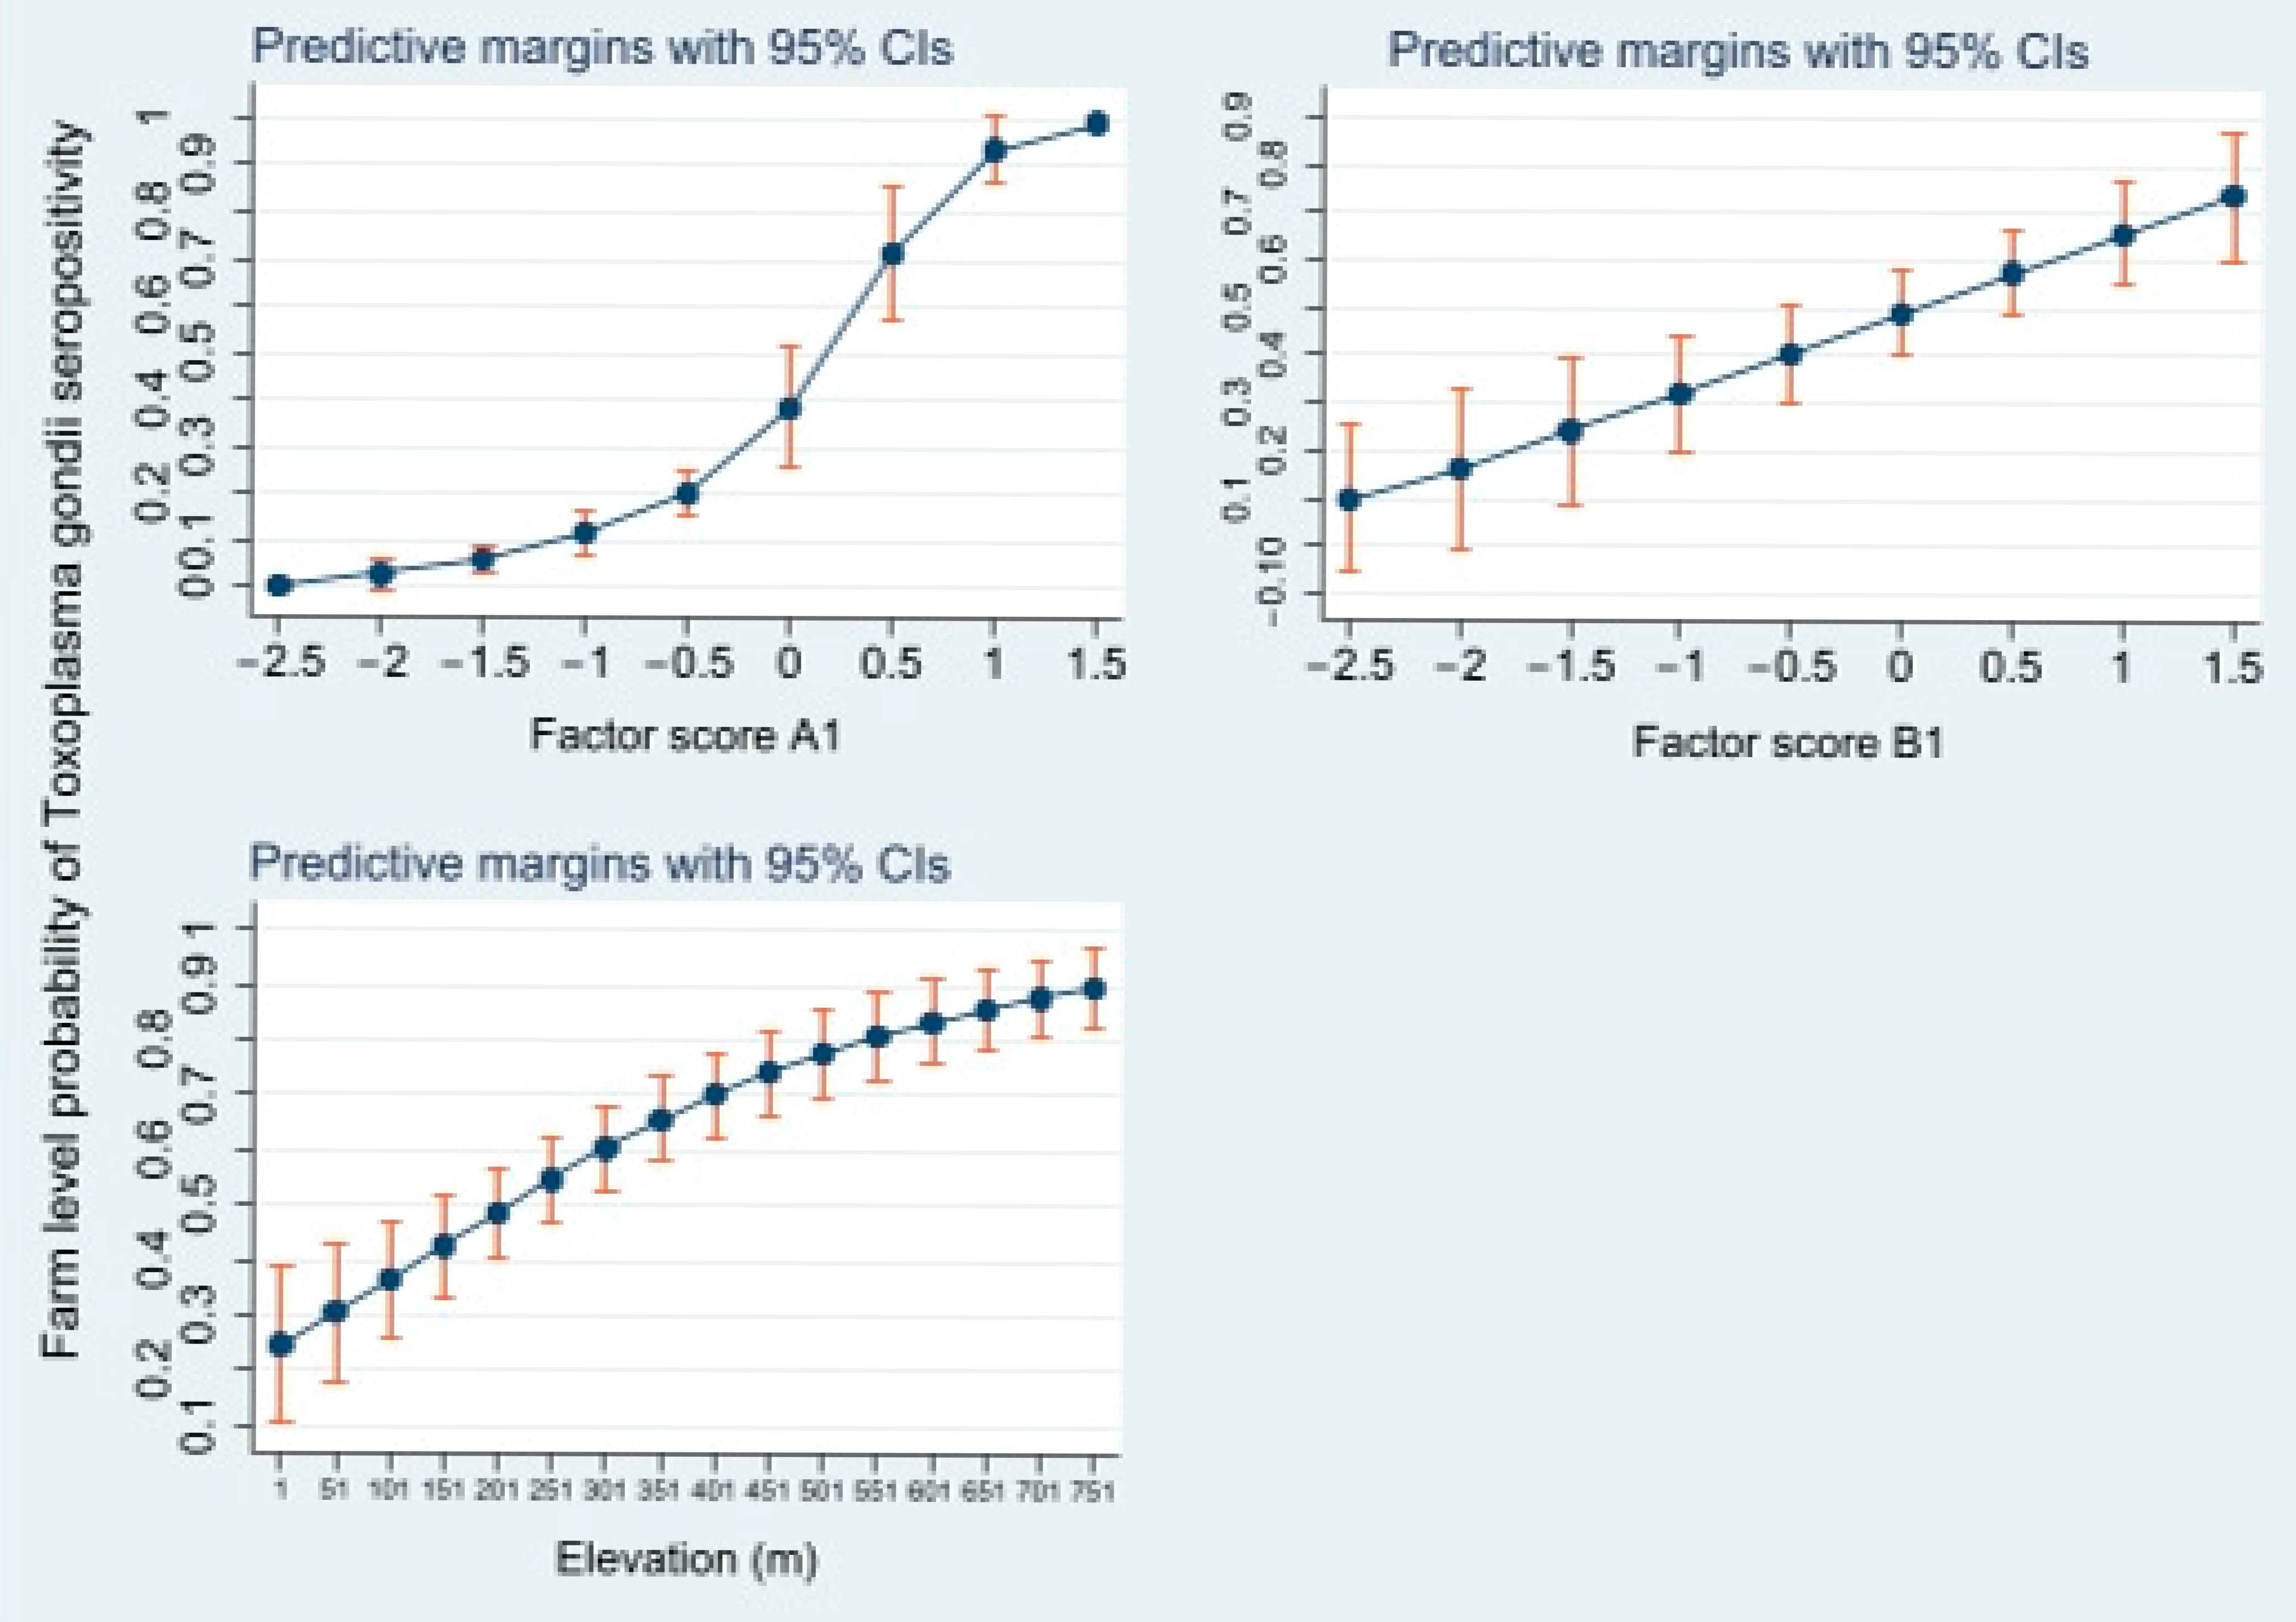
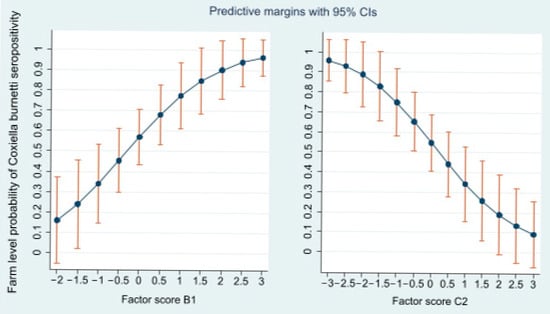
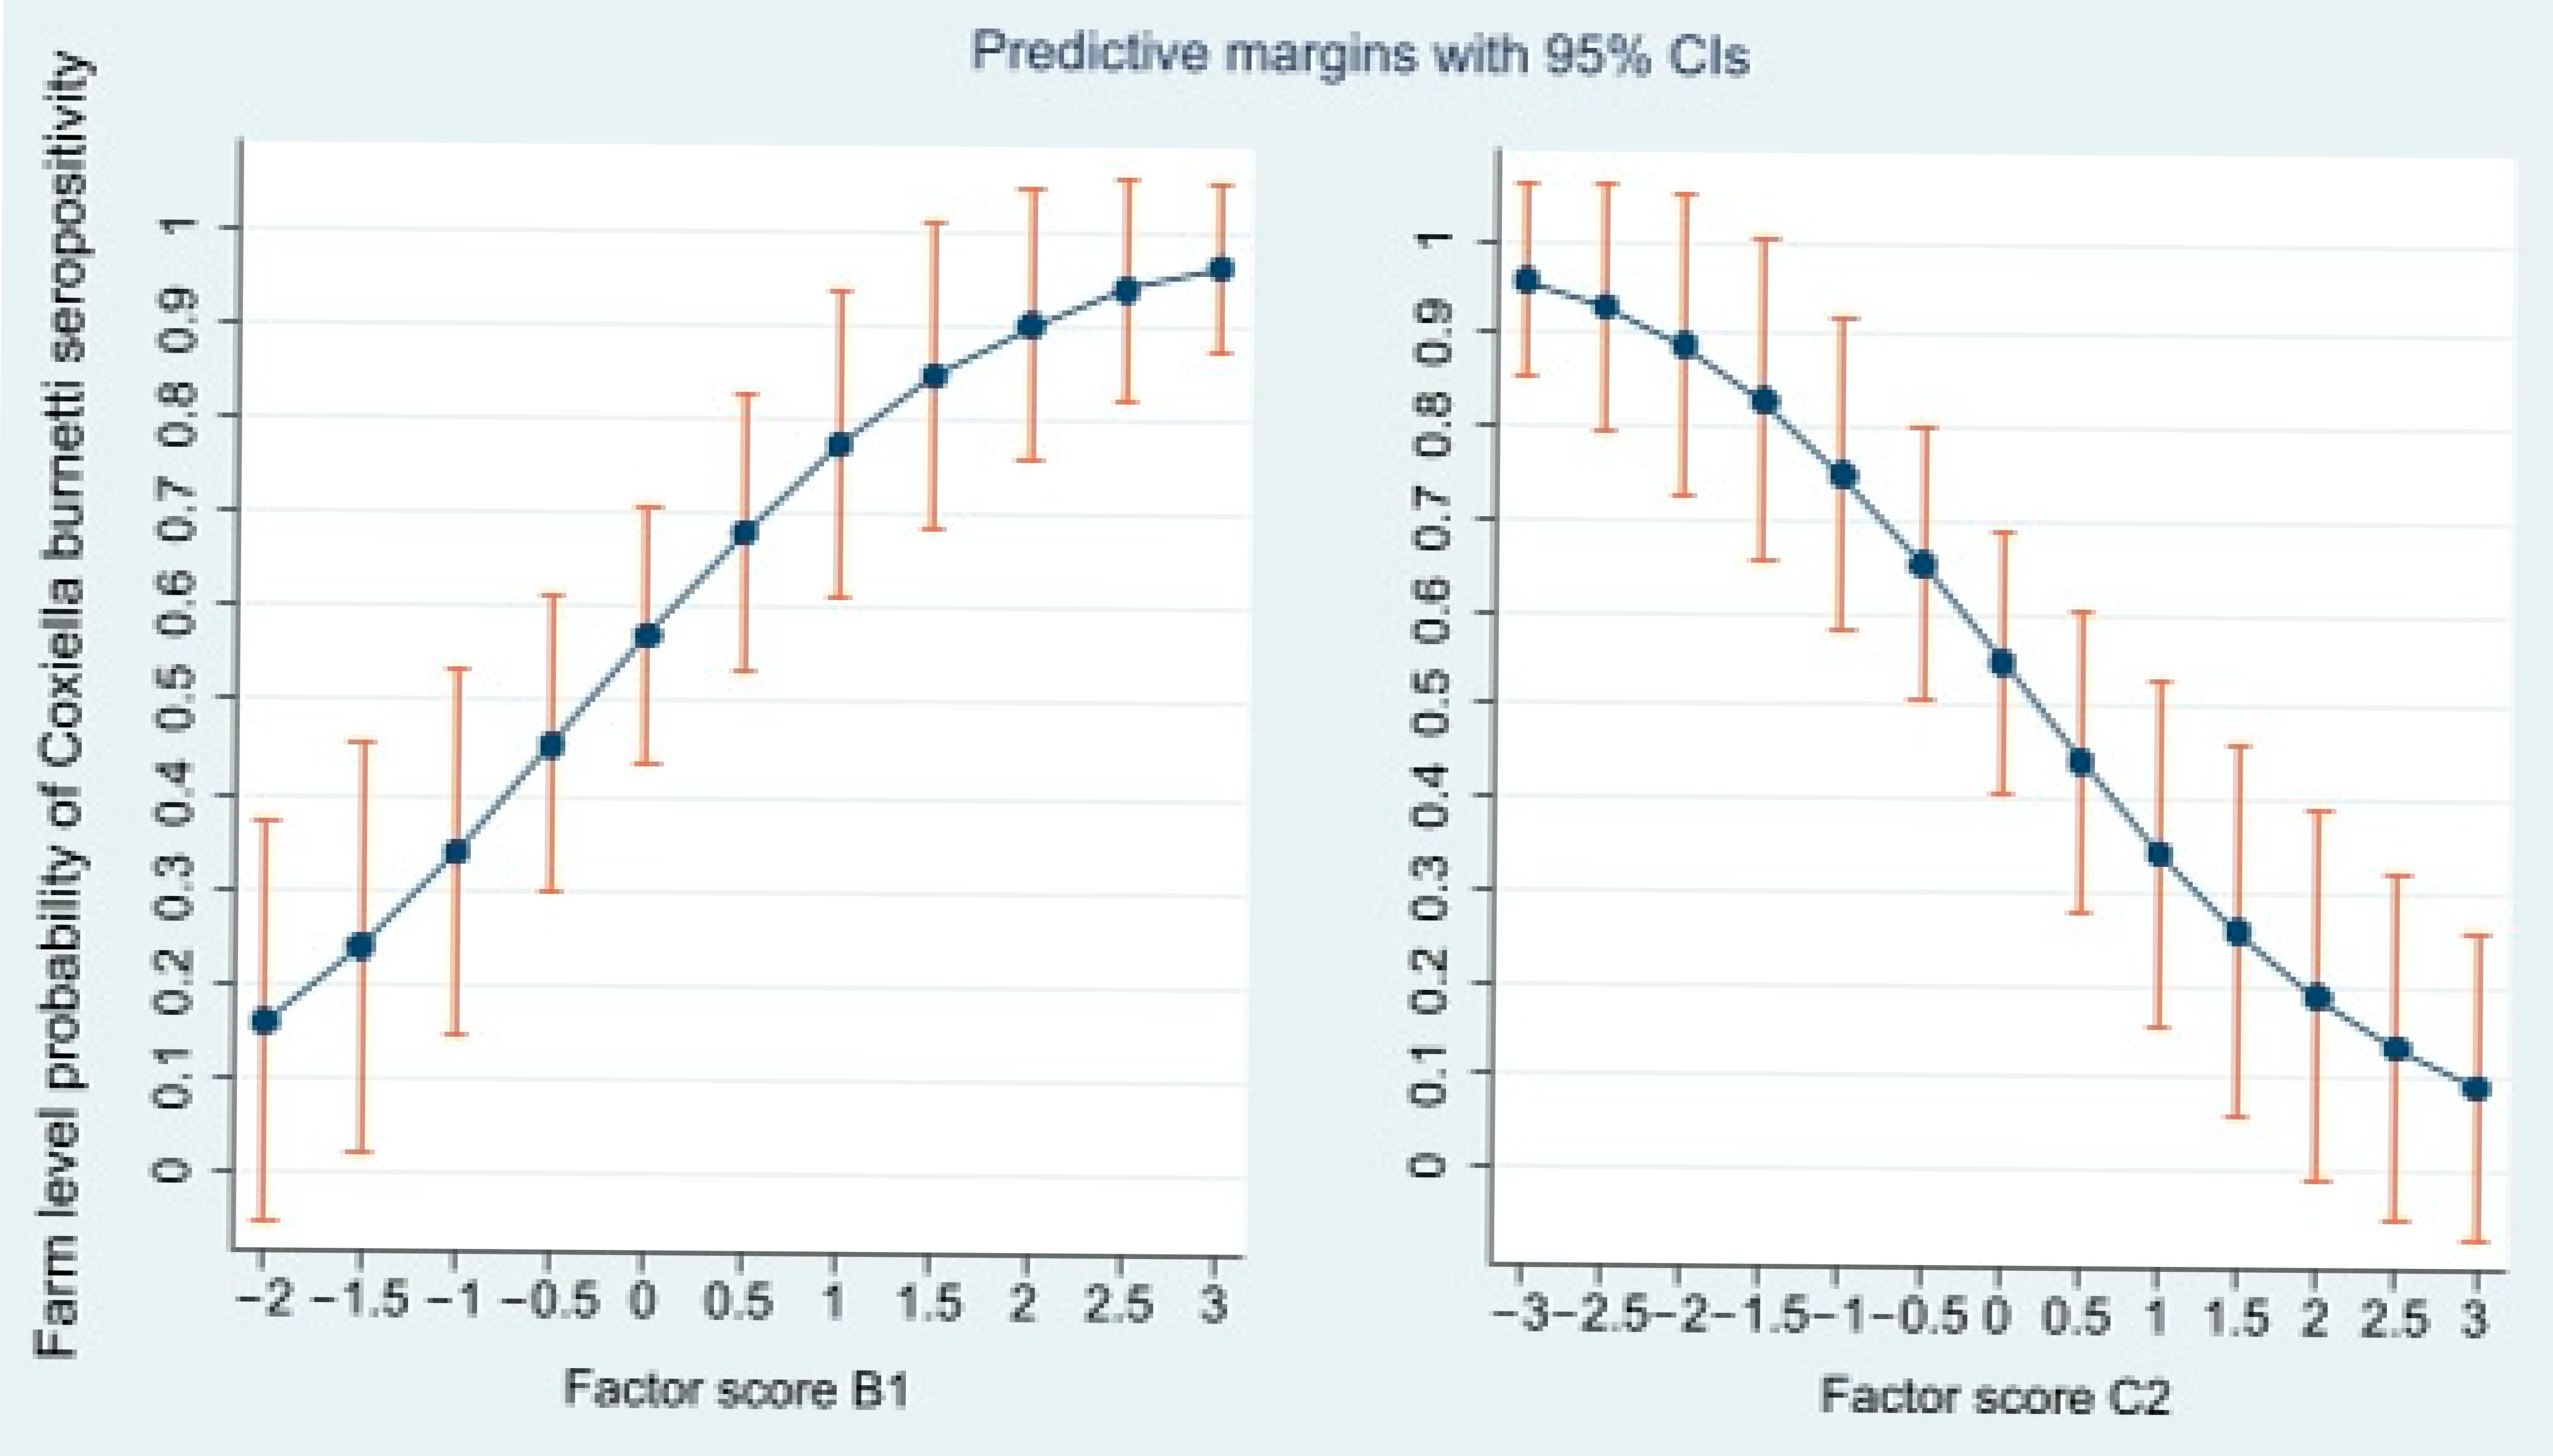
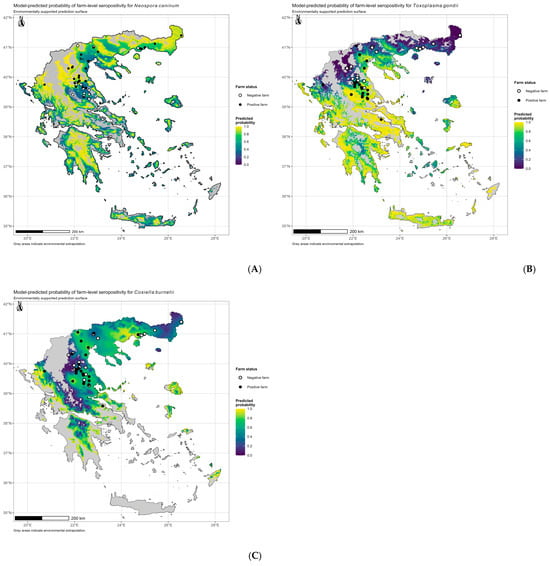
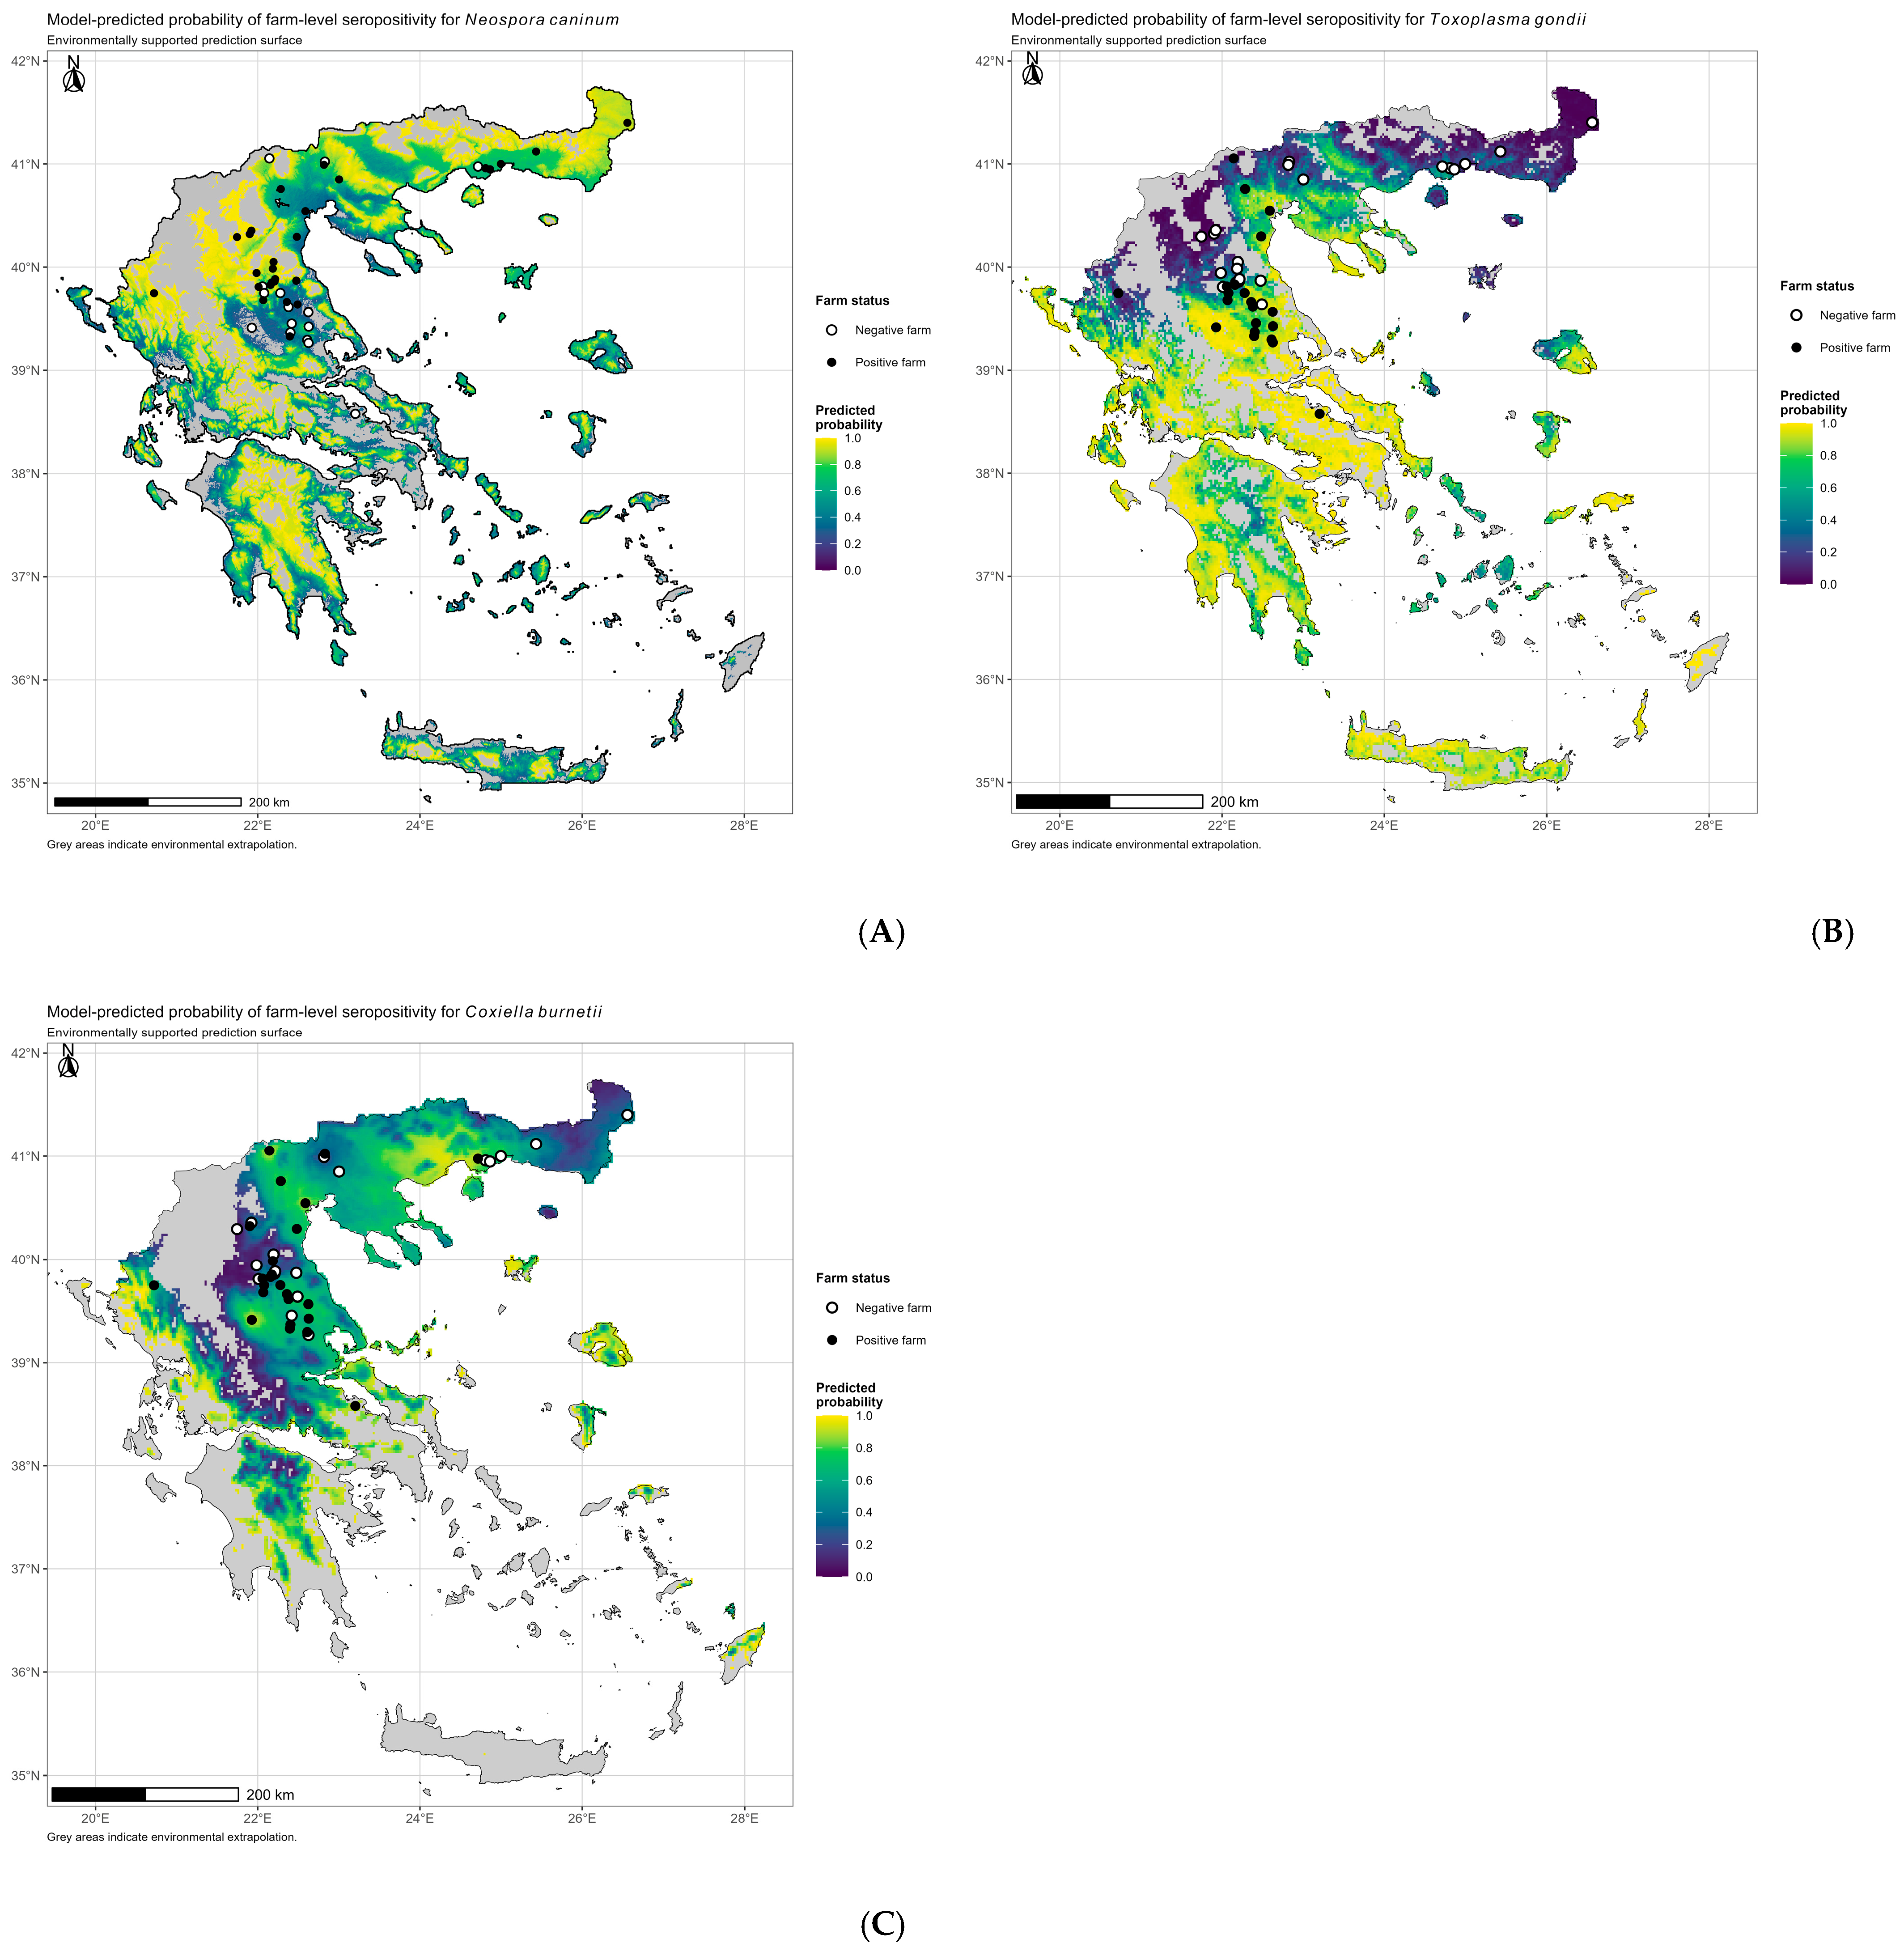
Disclaimer/Publisher’s Note: The statements, opinions and data contained in all publications are solely those of the individual author(s) and contributor(s) and not of MDPI and/or the editor(s). MDPI and/or the editor(s) disclaim responsibility for any injury to people or property resulting from any ideas, methods, instructions or products referred to in the content. |
© 2026 by the authors. Licensee MDPI, Basel, Switzerland. This article is an open access article distributed under the terms and conditions of the Creative Commons Attribution (CC BY) license.