


Simple Summary
Indigenous chicken breeds are valuable genetic resources, but their egg production is generally lower than that of commercial laying hens. Understanding the genetic mechanisms influencing egg production can help improve the production performance of local chickens. In this study, we used a self-bred white-feather green-eggshell chicken line as the research subject, recording age at first egg, egg number at different stages, and average consecutive days of laying per hen. We estimated the heritability and genetic correlations of seven egg production traits, revealing that different egg production traits may share part of their genetic basis. Through genome-wide association studies and multiple trait fine-mapping, we prioritized 25 SNPs and seven genes for further investigation of their potential roles in egg production. These findings provide clues for explaining differences in laying performance among hens. After further validation, the relevant results are expected to assist breeders in selecting local chickens with improved egg production performance, thereby increasing the utility value of indigenous breeds and the efficiency of poultry production.
Abstract
Egg production traits are major breeding targets, but their genetic architecture remains poorly characterized in indigenous chickens. In this study, seven egg production traits were measured in the WG chicken line: age at first egg (AFE), egg number at 21–25 (EN21–25W), 26–30 (EN26–30W), 31–35 (EN31–35W), and 36–43 weeks of age (EN36–43W), total egg number from 21 to 43 weeks of age (TEN), and average clutch length (ACL). Heritability and genetic correlations among seven egg production traits were estimated. Genome-wide association studies (GWASs) were performed using mixed linear model (MLM) and FarmCPU, followed by multiple trait fine-mapping with mvSuSiE. Variants were prioritized based on posterior inclusion probability (PIP) and proportion of phenotypic variance explained (PVE), and genes were prioritized for further investigation based on their positions within linkage disequilibrium-defined QTL intervals. Heritability estimates ranged from 0.19 (EN26–30W) to 0.74 (EN36–43W). AFE was moderately to strongly negatively correlated with other traits ( = −0.37 to −0.93), whereas genetic correlations between egg numbers across laying stages were strongly positively correlated. GWASs identified 26 significant SNPs within 24 independent regions across 14 chromosomes. Multi-trait fine-mapping prioritized 25 SNPs, among which rs732088229 showed the strongest evidence of pleiotropic effects. Seven genes (NHLH2, MAFB, SYNDIG1, BNC1, TFPI2, EDNRB, and GSS) were prioritized for further investigation based on QTL delimitation and functional annotation. These findings provide potential markers for improving egg production and support the application of multiple trait fine-mapping to reproductive traits in poultry.
1. Introduction
Egg production performance directly determines the economic efficiency of laying hens and dual-purpose chickens and is therefore a major breeding objective in the global poultry industry. China is the world’s largest producer and consumer of eggs, with annual production exceeding 30 million tonnes and accounting for approximately 40% of global egg production [1]. Genetic improvement of egg production performance is thus essential for ensuring a stable domestic egg supply. China has a rich diversity of indigenous chicken breeds, but their commercial utilization remains limited. Compared with commercial layer lines, such as Hy-Line Brown, which have undergone decades of intensive selection, most indigenous chicken breeds produce only 50 to 70% as many eggs annually [2,3,4]. Moreover, indigenous chicken breeds differ substantially in age at first egg (AFE), laying rhythm, laying persistency, and other reproductive traits, with these differences reflecting variation in genetic background [3,5,6]. Variation in genetic background and linkage disequilibrium patterns may limit the effectiveness of QTL or molecular markers identified in one breed when applied to breeding programs in another breed [7,8]. Nevertheless, indigenous chickens retain abundant breed-specific genetic variation, some of which may have been lost from commercial populations, thereby representing valuable genetic resources for trait improvement and future breeding objectives [9]. Therefore, systematic genomic characterization of indigenous chicken populations is needed not only to address challenges associated with breed-specific genetic improvement but also to facilitate the discovery and effective utilization of the genetic resources present in Chinese indigenous chickens.
In recent years, rapid advances in high-throughput sequencing and genotyping technologies, together with their steadily declining costs, have made genome-wide association studies (GWASs) an important approach for elucidating the genetic basis of egg production traits in chickens. Using GWASs, numerous quantitative trait loci (QTL) associated with egg production have been identified across diverse chicken breeds and populations. To date, 872 QTLs associated with egg production traits have been deposited in Chicken QTLdb and are widely distributed across the chicken genome, highlighting the complex polygenic architecture of these traits [10]. GWASs in commercial layer lines have identified multiple genomic regions associated with egg production and clutch traits [9,11,12]. Studies of Chinese indigenous breeds, including Beijing-You, Wuhua Yellow, Langya, and Shuanglian chickens, have also revealed multiple population-specific association signals and candidate genes, further demonstrating differences in the genetic architecture of egg production traits among chicken populations [13,14,15]. A systematic review that synthesized findings from dozens of GWASs on egg production traits in chickens highlighted a major challenge in translating association signals into causal variants [16]. Although numerous QTLs have been reported, limitations related to population size, marker density, and linkage disequilibrium have restricted most association signals to genomic intervals ranging from hundreds of Kb to several Mb. These intervals commonly contain dozens or even hundreds of positional candidate genes. To date, most reported loci remain unresolved at the causal-variant level, and only a limited number of candidate variants have been further investigated through fine-mapping and functional validation [17,18]. This limitation has substantially constrained the effective application of GWAS findings in marker-assisted selection and precision breeding programs.
Fine-mapping provides an effective approach to overcome these limitations by narrowing GWAS-associated regions and prioritizing variants with a high probability of causality. Bayesian variable selection has become one of the principal approaches to statistical fine-mapping By accounting for the local linkage disequilibrium (LD) structure, this approach jointly models multiple variants within a candidate region and uses posterior inclusion probabilities (PIPs) to quantify the probability that each variant is potentially causal [19]. The Sum of Single Effects (SuSiE) model is a representative Bayesian approach. SuSiE decomposes the genetic effects within a candidate region into a sum of single effects and applies iterative Bayesian variable selection to infer potentially independent causal signals and their corresponding credible sets [20]. These approaches have been widely applied to human complex diseases and economically important traits in livestock, reducing some association intervals for dairy production traits in cattle and body size traits in pigs to a small number of candidate variants [21,22,23]. However, conventional fine-mapping methods are generally designed for a single trait and cannot fully leverage genetic information shared among correlated traits. Consequently, their mapping resolution may remain limited in populations with small sample sizes or weak association signals. Joint fine-mapping of multiple traits provides an alternative statistical framework for addressing these limitations. Egg production traits in chickens are often strongly genetically correlated. For example, the genetic correlation between age at first egg (AFE) and egg number during the early laying period can reach −0.97, suggesting that these traits are partly controlled by shared genetic factors [24]. Because single-trait analyses evaluate each phenotype separately, they cannot fully exploit the consistency of association evidence across traits and may have limited ability to distinguish truly pleiotropic causal variants from indirect associations arising from LD [25]. Therefore, multiple trait fine-mapping may improve the resolution of GWASs in indigenous chickens by leveraging genetic information shared among correlated egg production traits, thereby facilitating the identification of prioritized variants and functional markers for molecular breeding.
The white-feather green-eggshell (WG) chicken line is a locally adapted line developed by the Hangzhou Academy of Agricultural Sciences through multigenerational selection, with well-documented pedigree and phenotypic records. In this study, we estimated genetic parameters for egg production traits and identified associated QTLs, prioritized genes, and prioritized SNPs using GWASs and multiple trait fine-mapping. Our findings provide potential molecular markers for improving egg production in indigenous chickens and support the application of multiple trait fine-mapping in poultry genomics.
2. Materials and Methods
2.1. Experimental Population and Phenotypic Measurements
The animal study protocol was approved by the Institutional Ethics Committee of Hangzhou Academy of Agricultural Sciences (approval number: NKY-SEC-2025-010; date of approval: 10 June 2025). All procedures were conducted in accordance with the committee’s guidelines for animal research.
The initial population consisted of 622 WG-line laying hens raised at the Shuangjiang farm of the Hangzhou Academy of Agricultural Sciences. Thirty-five hens died during the recording period and were excluded, leaving 587 hens for phenotypic analyses. All birds were reared in a brooding facility until 6 weeks of age, transferred to a growing facility until 12 weeks of age, and subsequently housed in individual cages in the laying facility to allow accurate recording of individual egg production. During the laying period, all hens were maintained under standardized management conditions with ad libitum access to feed and water, routine vaccination, and a photoperiod of 16 h light and 8 h darkness (16L:8D). Individual egg production was recorded daily from the onset of lay to 43 weeks of age. Seven egg production traits were measured: age at first egg (AFE, days); egg number during four laying periods, namely 21–25 weeks (EN21–25W), 26–30 weeks (EN26–30W), 31–35 weeks (EN31–35W), and 36–43 weeks (EN36–43W); total egg number from 21 to 43 weeks (TEN); and average clutch length from 21 to 43 weeks (ACL). ACL was defined as the mean number of consecutive laying days per clutch cycle: ACL = total laying days/number of clutch cycles.
2.2. Whole-Genome Resequencing, Genotype Imputation, and Quality Control
A total of 246 hens were randomly selected from the experimental population. Approximately 0.5 mL of blood was collected from the brachial vein of each bird by standard venipuncture, preserved in 1.5 mL of 75% ethanol, and stored at −20 °C. Genomic DNA was extracted using the DNeasy Blood & Tissue Kit (QIAGEN GmbH, Hilden, Germany). DNA concentration and purity were assessed using a NanoDrop spectrophotometer (Thermo Fisher Scientific, Wilmington, DE, USA), and DNA integrity was evaluated by agarose gel electrophoresis. Samples meeting the quality requirements were used for library preparation and whole-genome resequencing.
Whole-genome resequencing was performed by Wuhan Yingzi Technology Co., Ltd. Eighteen birds were sequenced to an average depth of approximately 20×, whereas the remaining 228 birds were sequenced to approximately 10×. Paired-end 150-bp reads were generated using an Illumina NovaSeq 6000 platform (Illumina, Inc., San Diego, CA, USA). Raw reads were assessed using FastQC (v0.11.9) and processed with Trimmomatic (v0.39) to remove adapter sequences and low-quality bases [26]. Clean reads were aligned to the chicken reference genome (GRCg7b) using BWA (v0.7.17) [27]. Alignments were sorted using the “sort” function from samtools (v1.10.2), and PCR duplicates were marked using Picard (v2.25.0) [28]. Base quality score recalibration, variant calling, GVCF import, and joint genotyping were performed using BaseRecalibrator, HaplotypeCaller, GenomicsDBImport, and GenotypeGVCFs, respectively, in GATK (v4.2.0) [29]. The resulting raw variant set was subjected to GATK hard filtering with the following thresholds: QD < 2.0, MQ < 40.0, FS > 60.0, SOR > 3.0, MQRankSum < −12.5, and ReadPosRankSum < −8.0. Haplotypes derived from individuals sequenced at 20× coverage were used as the reference panel, and the genotypes of individuals sequenced at 10× coverage were imputed using Beagle (v5.4) [30]. Imputation accuracy was evaluated by (i) comparing the imputed genotypes with the original genotype calls at scaffold SNPs (genotype concordance = 99.76%) and (ii) performing a masking experiment in which genotypes at a random subset of scaffold SNPs were masked and subsequently re-imputed (genotype concordance = 96.60%). The imputed genotypes were filtered with a minor allele frequency (MAF) > 0.01, missing rate < 0.1, and a Hardy–Weinberg equilibrium p > 1 × 10⁻⁶. After filtering, 11,369,068 SNPs were retained for subsequent analyses.
2.3. Breeding Value Prediction and Genetic Parameter Estimation
The variance components for the seven traits were estimated using restricted maximum likelihood (REML), and the estimated breeding values (EBVs) were predicted using best linear unbiased prediction (BLUP) in HIBLUP (v1.4.0) [31]. Genetic parameters were calculated from the estimated variance components. The statistical model was as follows:
y = Xb + Za + e
2.4. Genome-Wide Association Analysis
To systematically identify genetic markers associated with egg production traits in the WG chicken line, EBVs for each of the seven traits were used as response variables in genome-wide association studies conducted using a mixed linear model (MLM) and the fixed and random model circulating probability unification (FarmCPU) method. Both analyses were implemented in the R package rMVP (v1.4.0) [32]. The first five principal components were included as fixed covariates to account for population structure. The MLM incorporated a random polygenic effect based on the kinship matrix to account for the relatedness among individuals. FarmCPU iteratively fits fixed- and random-effect models and includes associated markers as pseudo-quantitative trait nucleotides (QTNs), thereby reducing confounding between the tested markers and population structure. The genome-wide significance threshold was determined by Bonferroni correction as (p < 0.05/N), where N was the total number of SNPs tested. Based on 11,369,068 SNPs, the significance threshold was p < 4.40 × 10⁻⁹), corresponding to −log10 (p) > 8.356. Candidate regions were defined as the 500-kb intervals upstream and downstream of each significant SNP identified by FarmCPU. Physically overlapping intervals were merged, resulting in 24 nonoverlapping genomic regions for subsequent multiple trait fine-mapping. Manhattan and quantile–quantile plots were generated using functions implemented in rMVP.
2.5. Multiple Trait Fine-Mapping
Multiple trait fine-mapping was performed for each independent genomic region identified by GWASs using mvSuSiE to prioritize variants. mvSuSiE extends the Sum of Single Effects (SuSiE) model to multiple traits and assumes that each region contains a limited number of variants with nonzero effects [25]. These effects may be shared across correlated traits or exhibit trait-specific patterns. The model requires four main inputs: the genotype matrix (G), phenotype matrix (Y), prior distribution of genetic effects (p), and residual variance–covariance matrix (V). The V matrix was constructed as follows: a matrix of SNP-level Z-scores across traits was first generated; null SNPs, defined as variants with |Z-scores| < 2 for all traits, were retained, whereas SNPs located within the independent GWAS regions were excluded. Subsequent LD pruning (--indep-pairwise 50 5 0.2) retained 618,894 null SNPs; the Z-score matrix of the remaining null SNPs was denoted as Znull, and V was estimated as V= cov(Znull). This matrix characterizes residual correlations among traits and accounts for correlated noise in the mvSuSiE model. The p was estimated using the extreme deconvolution (ED) algorithm implemented in the R package mashr (v0.2.73). The inputs included (1) the V matrix and (2) the matrix containing the Z-scores of the lead SNP from each independent region across all traits. Under an empirical Bayes framework, the ED algorithm fits a mixture of multiple traits normal distributions to learn shared and trait-specific covariance patterns of genetic effects across traits. For each independent association signal, mvSuSiE generated a 99% credible set (CS), defined as the smallest set of SNPs with a cumulative posterior probability of at least 0.99 of containing a variant with a nonzero effect under the fitted model. The method also calculated a posterior inclusion probability (PIP) for each SNP, representing the posterior probability that the SNP affected at least one of the analyzed traits.
To further prioritize variants with relatively larger effects on a single trait, the proportion of EBV variance explained by each SNP was calculated for all 7 egg production traits as follows:
where is the minor allele frequency, is the SNP effect estimated from the MLM, and is the variance of the EBV for the corresponding trait. SNPs within the credible sets were classified as high-confidence prioritized variants when they had a PIP > 0.80 and a > 0.01 for at least one trait (PVE_max > 0.01).
2.6. SNP Annotation, QTL Delimitation, and Gene Prioritization
The high-confidence prioritized SNPs were functionally annotated using the Ensembl Variant Effect Predictor (VEP, release 110) based on the GRCg7b reference genome [33]. Default settings were applied, and the consequences for all available transcripts were retained. Variant consequences were classified according to Sequence Ontology terms, including intron variants, regulatory-region variants, and upstream or downstream gene variants. Each of the high-confidence prioritized SNPs was then used as an index variant, and pairwise linkage disequilibrium (r2) with neighboring SNPs located within 1 Mb upstream and downstream was calculated using PLINK (v1.90) [34]. Candidate QTL intervals were defined by SNPs in strong LD with each index variant (r2 > 0.80), and overlapping intervals were merged. Genes within each QTL interval were subsequently retrieved from the Ensembl release 110 annotation and evaluated as candidates for egg production and reproductive traits based on previously reported gene functions.
2.7. Use of Generative Artificial Intelligence
ChatGPT (GPT-5.6 sol, OpenAI) was used to assist in writing R code for visualizing fine-mapping results and generating bubble plots of single-nucleotide polymorphism effects. It was also used to identify spelling and grammatical errors and suggest language improvements throughout the manuscript. The authors critically reviewed the generated code and its graphical outputs and revised the text after evaluating the suggested changes. The authors take full responsibility for the final code, figures, and manuscript content.
3. Results
3.1. Descriptive Statistics and Genetic Parameters Estimates
Descriptive statistics for the seven egg production traits are shown in Table 1. The coefficients of variation (CV) ranged from 11.6% (AFE) to 59.2% (EN21–25W). The high CV for EN21–25W was largely attributable to the fact that some hens had not initiated laying during this period, resulting in substantial differences in egg number among individuals. After 26 week, the CV for stage-specific egg number decreased to 19.5–23.1%, indicating reduced between-individual variation after most hens had reached sexual maturity.
Table 1.
Descriptive statistics of egg production traits.
Genetic parameter estimates are presented in Table 2. Heritability estimates differed substantially among stage-specific egg production traits, ranging from 0.19 (EN26–30W) to 0.74 (EN36–43W). TEN, AFE, and ACL had heritability estimates of 0.74, 0.44, and 0.40, respectively. The genetic correlation matrix revealed 2 major patterns. First, AFE was negatively genetically correlated with all egg number traits, with the strongest correlation observed for EN21–25W ( = −0.93) and the weakest for EN31–35W ( = −0.37). This indicates that AFE has the greatest impact on early-stage egg production, an effect that gradually diminishes as the laying cycle progresses. Second, egg number traits measured at different stages were strongly positively genetically correlated. The genetic correlation was 0.98 between EN31–35W and EN36–43W and 0.82 between EN21–25W and EN26–30W, suggesting that egg production across laying stages is influenced by substantially shared genetic factors. In contrast, ACL showed weak to moderate genetic correlations with the stage-specific egg number traits ( = 0.21–0.35), suggesting that clutch length and total egg production may have partially distinct genetic determinants.
Table 2.
Genetic parameters and phenotypic correlations of egg production traits.
3.2. GWAS Analysis Results
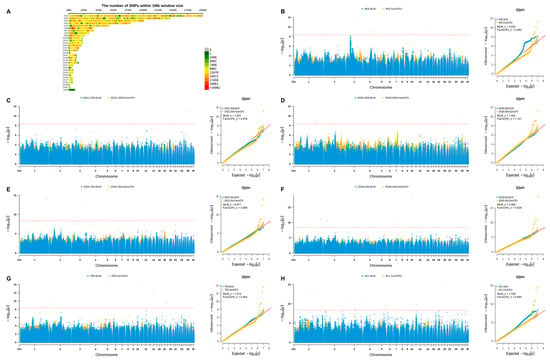
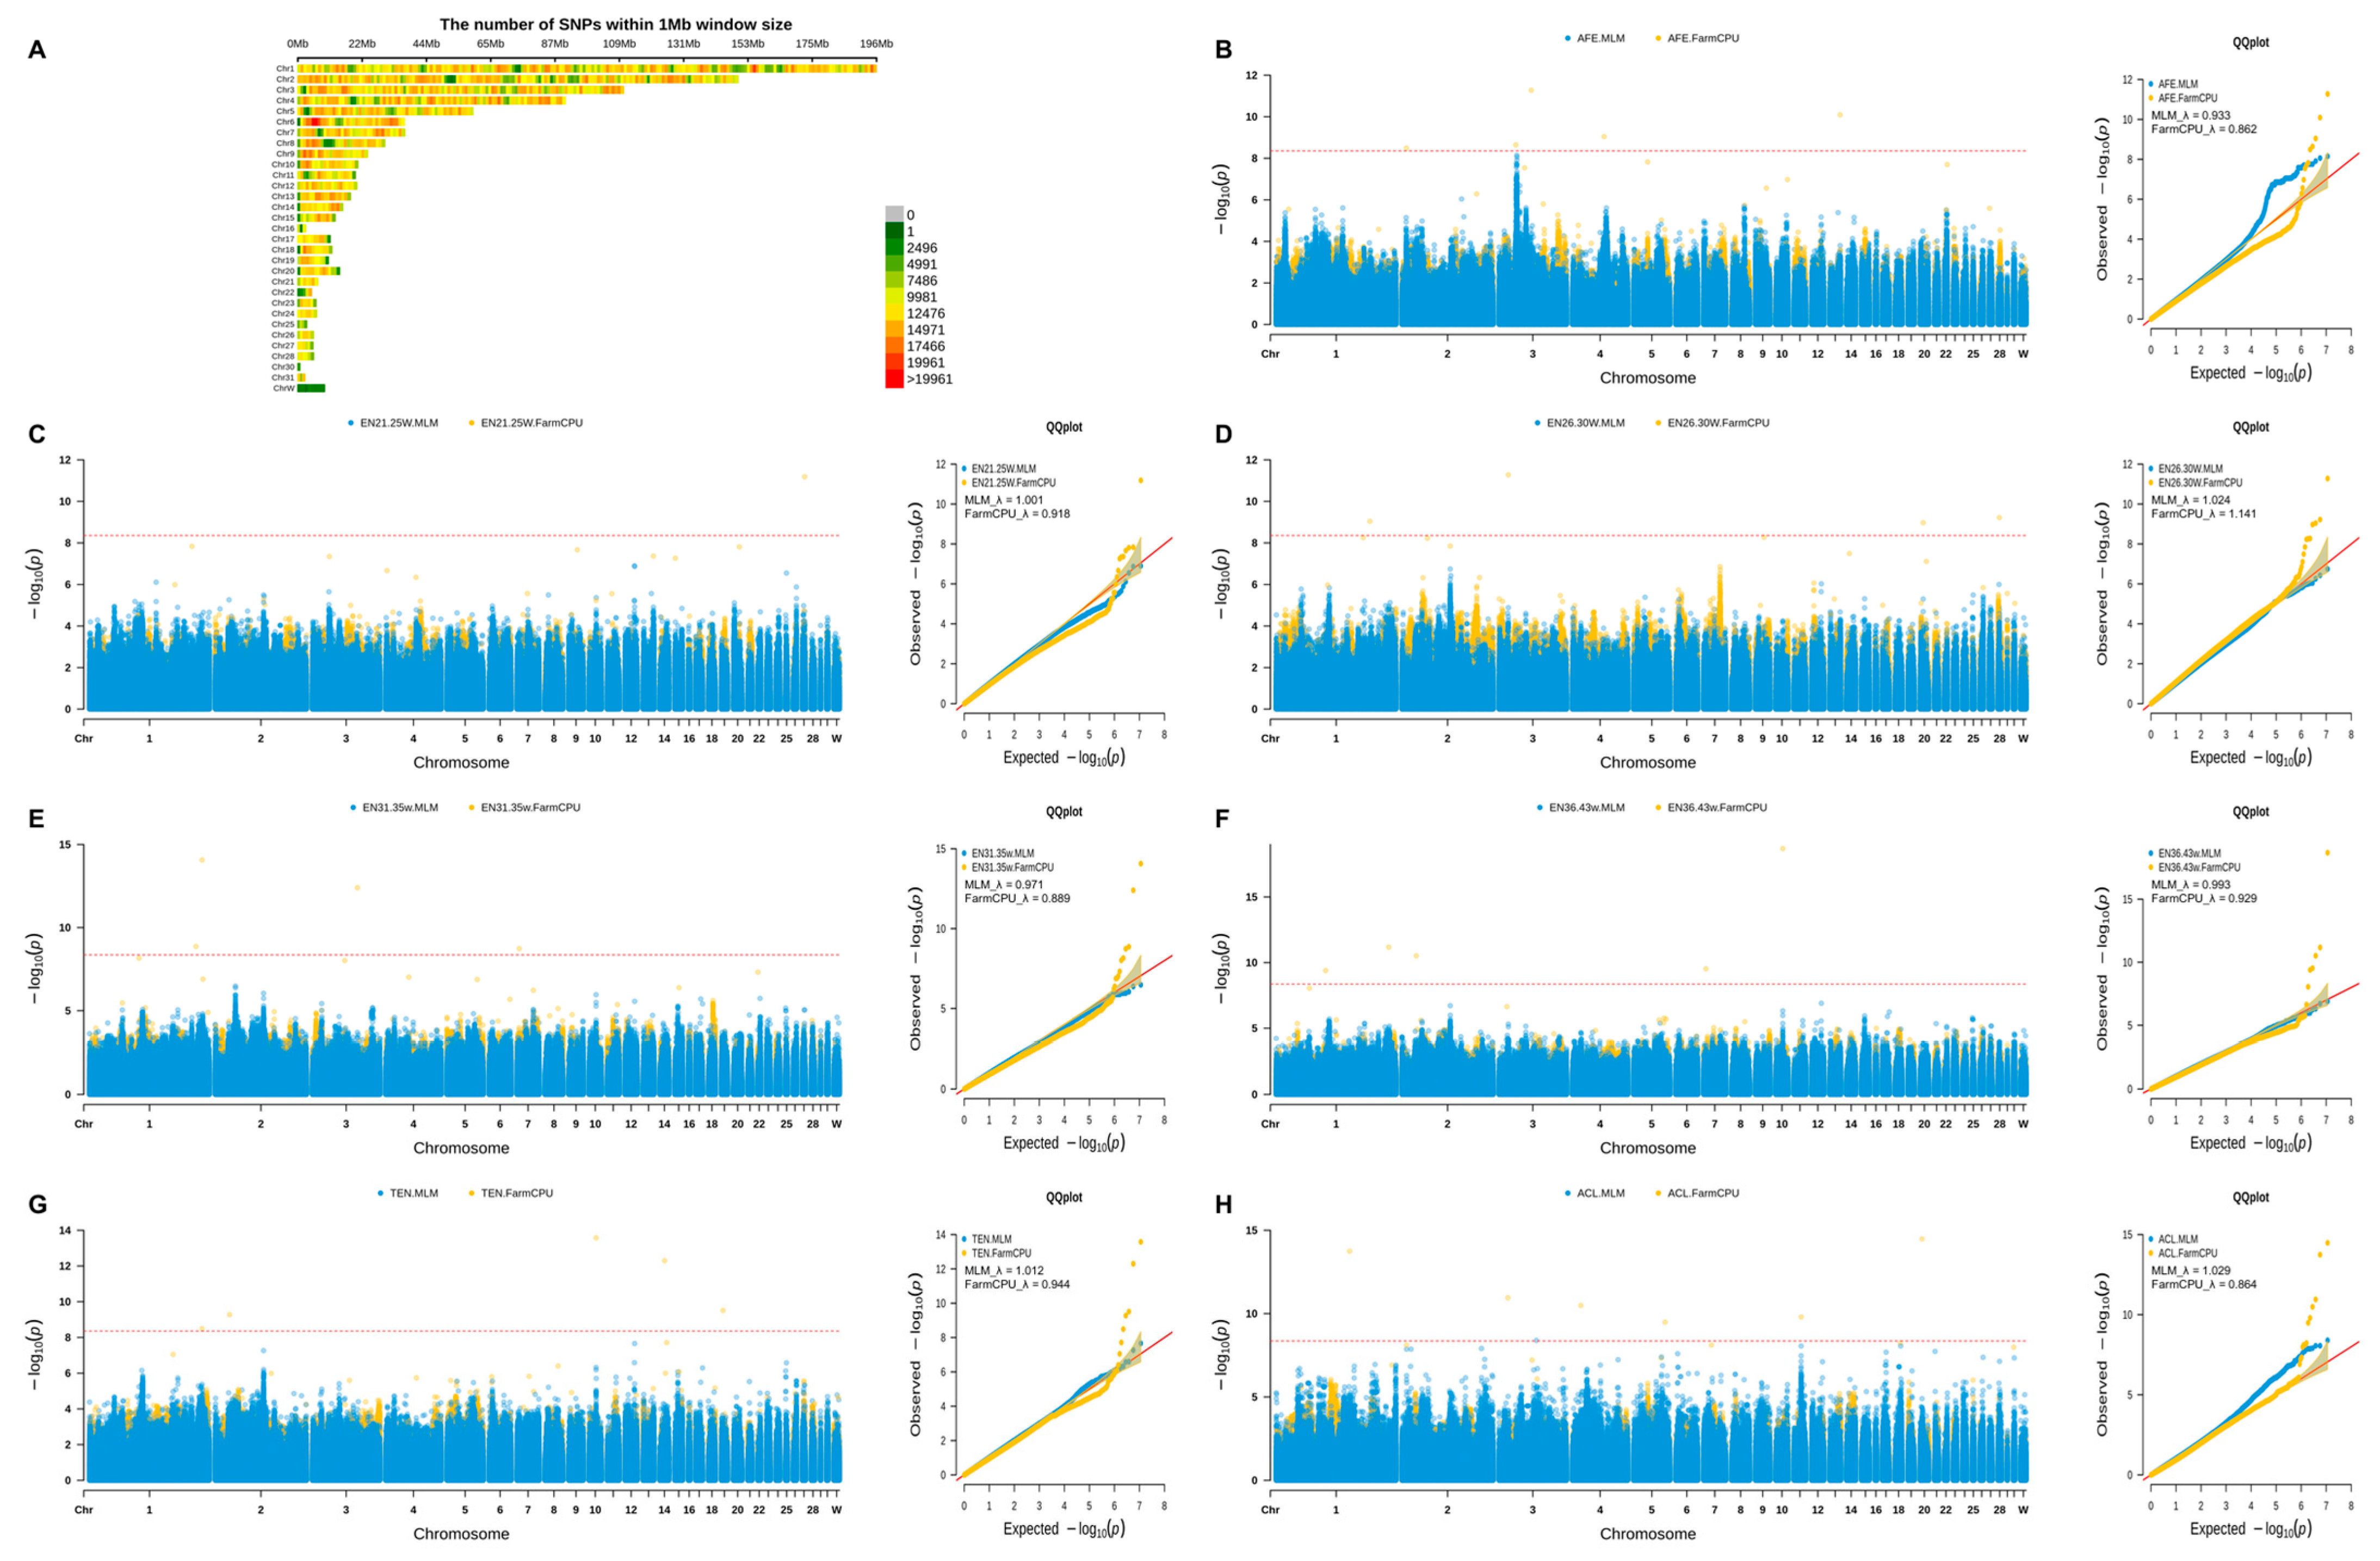
Principal component analysis revealed no obvious outliers (Figure S1). Quantile–quantile plots showed that most observed test statistics closely followed their expected distributions, with genomic inflation factors (λ) ranging from 0.895 to 1.182, suggesting that population structure and relatedness were generally adequately controlled (Figure 1). No SNP reached the genome-wide significance threshold using the MLM, whereas FarmCPU identified 26 genome-wide significant SNPs located within 24 independent genomic regions across multiple chromosomes (Figure 1; Table 3).
Figure 1.
(A) Distribution of SNP density across the chromosomes. (B–H) Manhattan and quantile–quantile (Q–Q) plots for AFE (B), EN21–25W (C), EN26–30W (D), EN31–35W (E), EN36–43W (F), TEN (G), and ACL (H). Blue and yellow dots represent the results from the MLM and FarmCPU models, respectively. The horizontal red dashed line indicates the genome-wide significance threshold (−log10(p) = 8.356).
Table 3.
Genome-wide significant SNPs were identified using FarmCPU.
With the exception of EN21–25W, multiple significant associations were detected for all egg production traits. Six significant SNPs were associated with ACL, with rs739578177 showing the strongest association (p = 3.31 × 10⁻¹⁵). Five SNPs were associated with each of TEN and EN36–43W, and rs14947651 was the most significant SNP for both traits (p = 2.67 × 10⁻¹⁴ and 2.07 × 10⁻¹⁹). Five significant SNPs were identified each for AFE and EN31–35W, whereas four were detected for EN26–30W. Several significant SNPs were associated with more than one trait. On chromosome 10, rs14947651 was associated with both TEN and EN36–43W. On chromosome 1, rs732441590 was associated with TEN, EN31–35W, and EN36–43W, whereas rs737594117 on chromosome 7 was associated with EN31–35W and EN36–43W. Trait-specific signals were also observed within the same genomic regions. In region 7, rs740924058 and rs15921924 on chromosome 2 were associated with EN36–43W and TEN, respectively, and were separated by only 1761 bp. In region 8, rs312556096 and rs314787820 on chromosome 3 were associated with EN26–30W and ACL, respectively, and were separated by 579 kb. Collectively, these cross-trait and colocalized association signals are consistent with a partially shared genetic basis among egg production traits and may contribute to the strong positive genetic correlations observed among stage-specific egg numbers.
3.3. Identification of Prioritized SNPs Through Multi-Trait Fine-Mapping
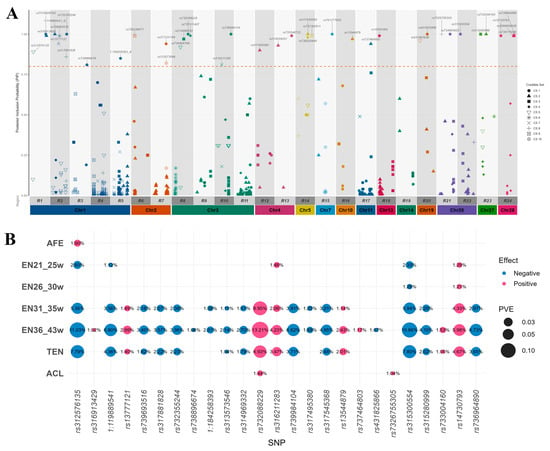
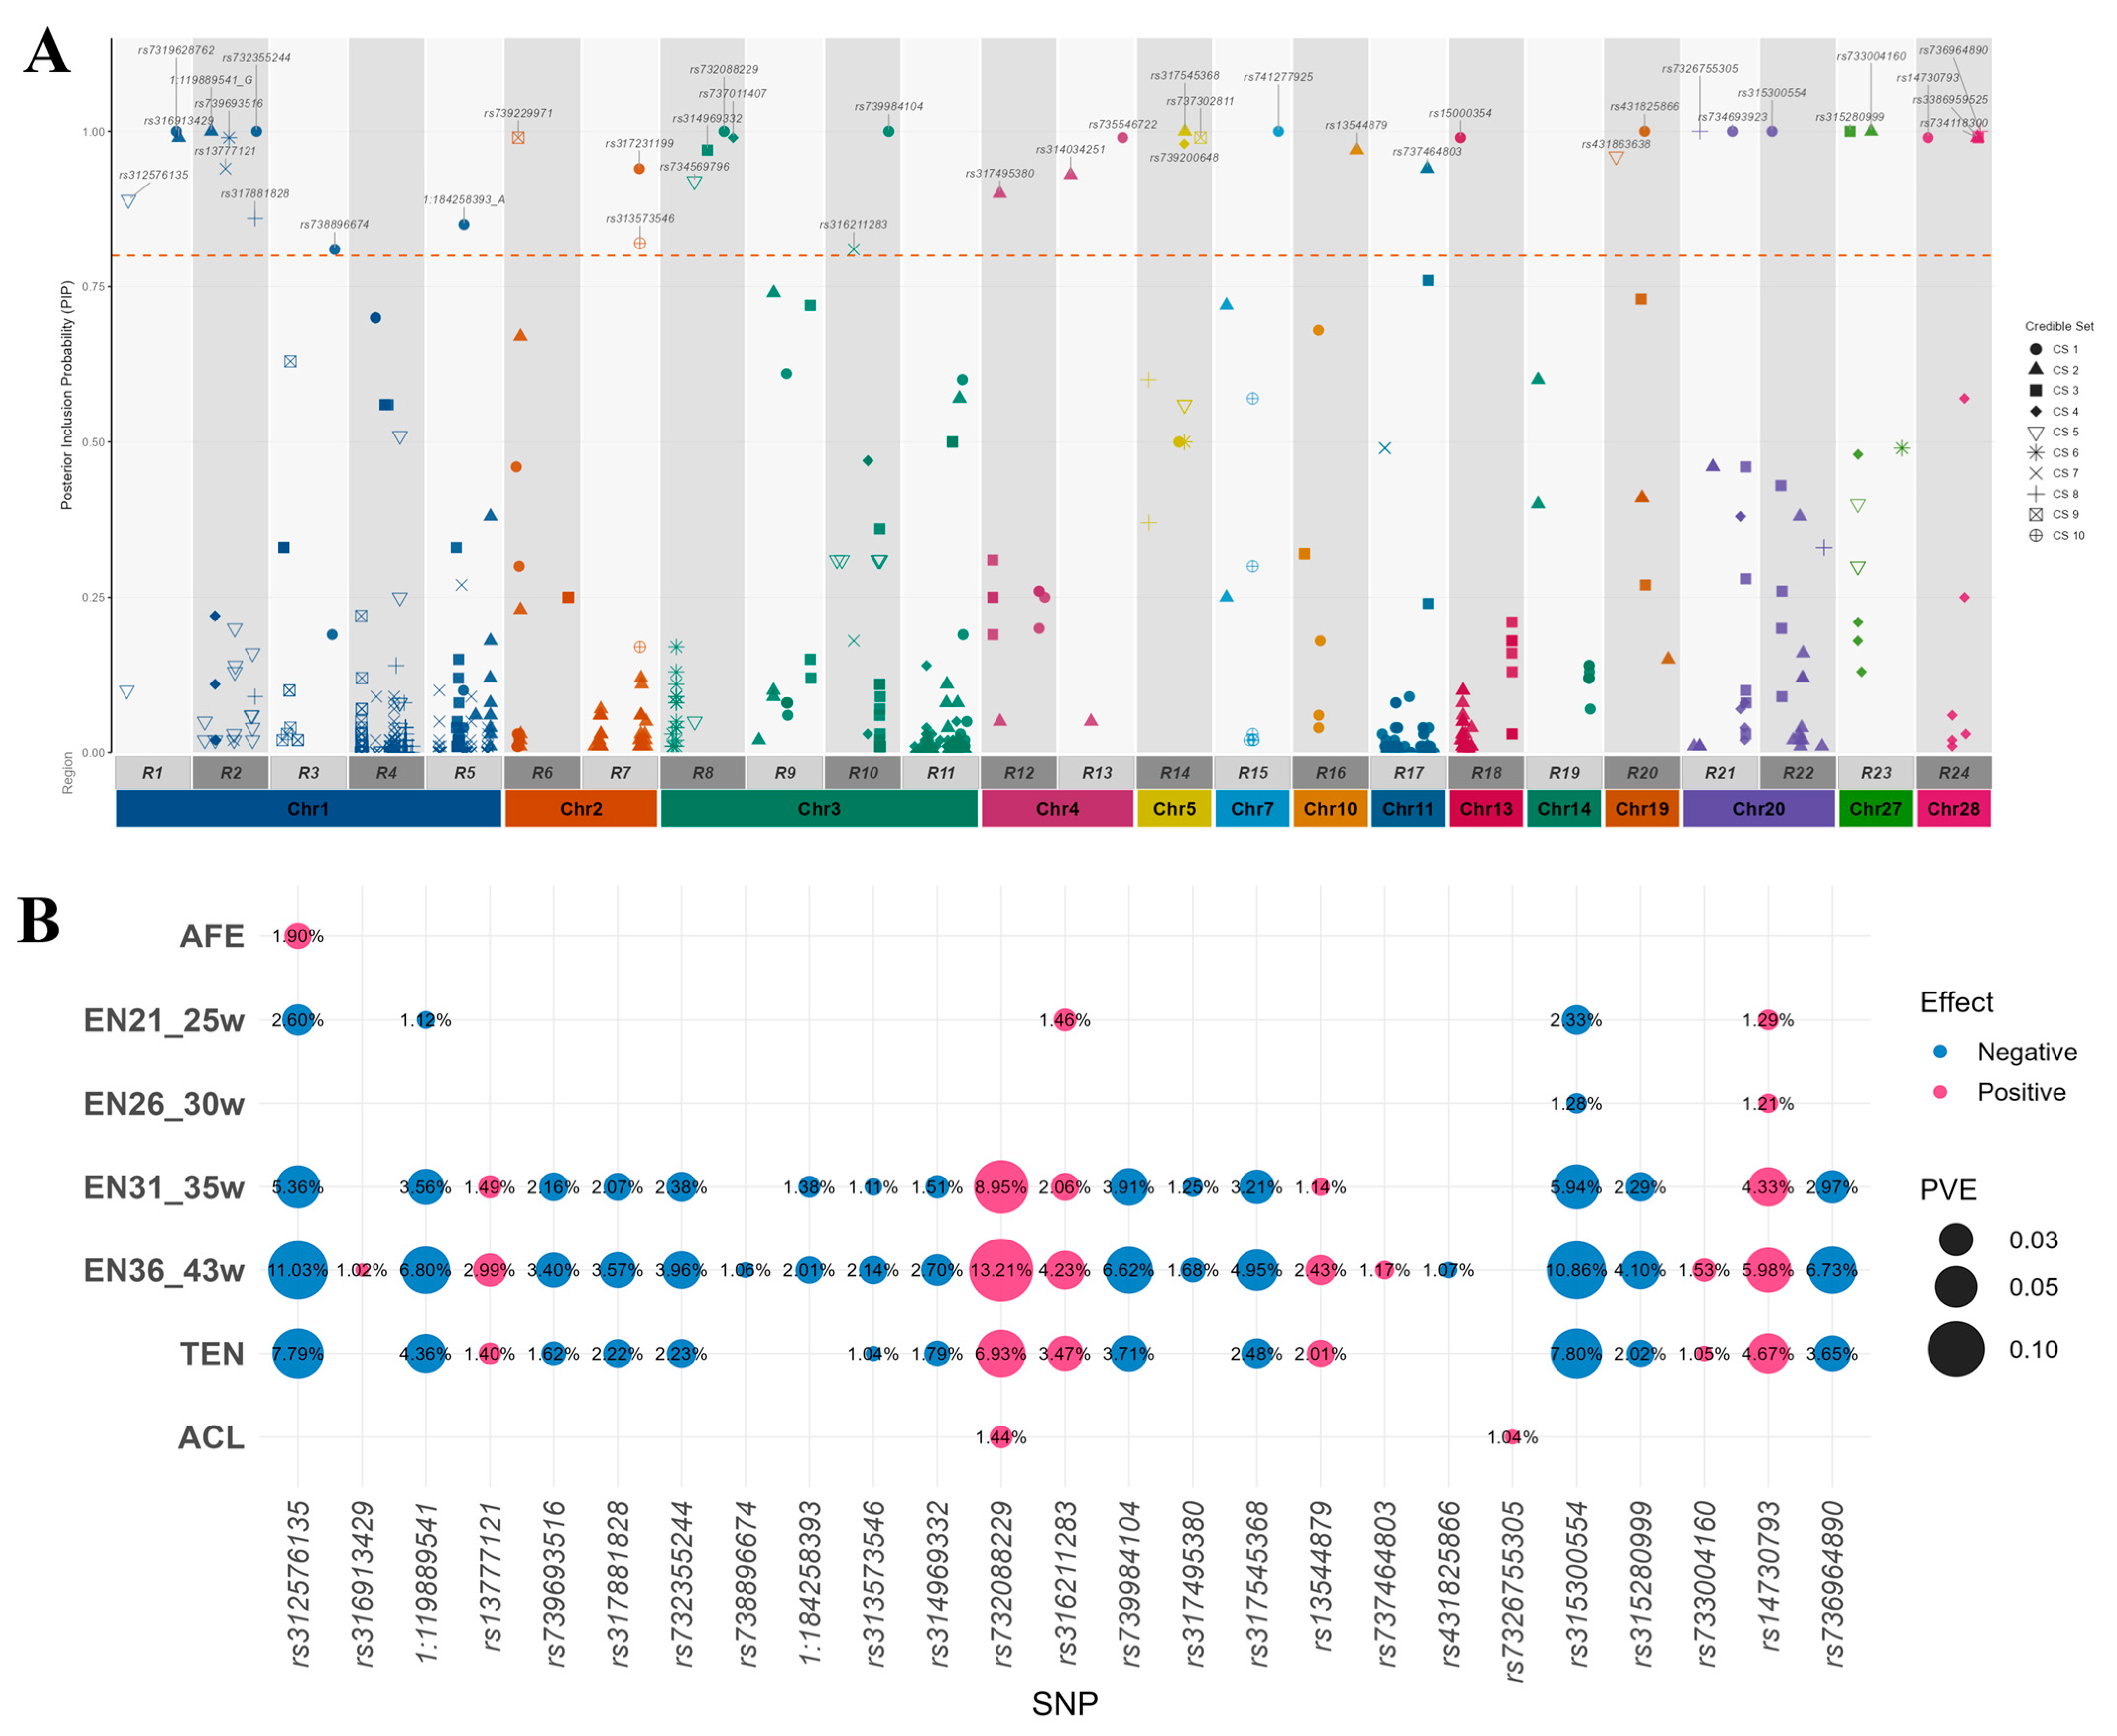
Multiple trait fine-mapping of the 24 independent genomic regions using mvSuSiE identified 97 credible sets (CSs), with an average of approximately 4 CSs per region. A total of 961 SNPs were included across all CSs, and the largest CS contained 159 SNPs (Figure 2A; Table S1). After filtering for PIP >0.80 and PVE_max > 0.01, 25 high-confidence prioritized SNPs were retained (Figure 2B; Table S2). The median PIP of the 25 high-confidence prioritized SNPs was 0.99, and ten SNPs had a PIP of 1.00. The highest PVE_max was 13.21%.
Figure 2.
(A) Fine-mapping of multiple traits in independent genomic regions. The x-axis shows the independent genomic regions and their chromosomal positions (indicated by differently coloured blocks), and the y-axis shows the posterior inclusion probability (PIP) of each SNP. The red horizontal dashed line denotes the PIP threshold (0.8). The colours of the points indicate the chromosome on which the SNP is located, and the shapes of the points indicate the credible set to which the SNP belongs (points with the same shape belong to the same credible set). (B) Bubble plot of the PVE of high-confidence prioritized SNPs. The x-axis shows the 25 identified high-confidence prioritized SNPs, and the y-axis shows the different traits. The point size represents the proportion of phenotypic variance explained (PVE) of a given trait by that SNP, and the point colour indicates the direction of the SNP effect, with red denoting a positive effect and blue denoting a negative effect.
The SNP rs732088229 (PIP = 1.00) on chromosome 3 had the highest PVE_max, explaining 13.21% of the EBV variance for EN36–43W, followed by 8.95% for EN31–35W and 6.93% for TEN. Its summed PVE across the 7 traits was 32.00%, the highest among the 25 SNPs (Figure 2B and Table S2). The next 2 SNPs with the highest PVE_max were rs312576135 on chromosome 1 (PIP = 0.89, PVE_max =11.03%) and rs315300554 on chromosome 20 (PIP = 1.00, PVE_max =10.86%). Their effects were also concentrated on EN36–43W and TEN. As illustrated in the bubble plot (Figure 2B), the PVE profiles of most high-confidence SNPs differed among traits, with generally greater values for EN31–35W, EN36–43W, and TEN than for EN21–25W and EN26–30W. For ACL, only 4 of the 25 SNPs explained more than 1% of the EBV variance, and the largest PVE was 1.44% for rs732088229. This pattern was consistent with the weak to moderate genetic correlations between ACL and egg number traits ( = 0.21–0.35). Among the 25 SNPs, 20 explained more than 1% of the EBV variance for at least 2 traits, and 17 met this threshold for at least 3 traits, indicating that these loci are primarily pleiotropic rather than trait-specific.
VEP annotation showed that the 25 prioritized SNPs were predominantly classified as intron variants (14), followed by downstream gene variants (5), upstream gene variants (4), intergenic variant (1) and 5′-UTR variant (1) (Table S3).
3.4. QTL Delimitation and Gene Prioritization
Candidate QTL intervals were defined around each of the 25 prioritized SNPs based on strong LD (r2 > 0.80) with neighboring SNPs located within 1 Mb upstream and downstream, resulting in 25 QTL intervals (Table 4). QTL sizes ranged from 0 to 495 kb, with a median of 7.9 kb. The largest interval was anchored by rs738896674 and spanned 495 kb, containing nine SNPs in strong LD with the index variant. The QTL anchored by rs7326755305 on chromosome 20 contained the greatest number of LD-linked SNPs, comprising 51 SNPs across 424 kb. For seven index SNPs (28%), no additional SNPs meeting the (r2 > 0.80) threshold were detected; therefore, their corresponding QTLs consisted only of the index SNP. Comparison with previously reported egg production-related QTLs in Chicken QTLdb revealed no direct overlap with the QTL intervals identified in this study. Five candidate intervals were located within 250 kb of nine previously reported egg production-related QTLs, with a minimum interval distance of 25.24 kb (Table S4). The 25 QTL intervals contained 35 unique annotated genes (Table 4). Considering SNP–gene distances, gene overlap with QTL intervals, predicted variant consequences, functional annotations, and published evidence, seven genes—NHLH2, EDNRB, SYNDIG1, BNC1, TFPI2, MAFB, and GSS—were selected for further discussion as biologically plausible genes for egg production traits, pending functional validation. Table S5 summarizes the functional evidence and limitations for all genes listed in Table 4.
Table 4.
Identified QTL intervals and genes within each interval.
4. Discussion
Egg production traits are strongly influenced by environmental factors, including photoperiod, ambient temperature, and nutrient supply [35]. These effects may be particularly pronounced in indigenous chicken populations with relatively small population sizes and less intensive environmental control [36]. Unlike commercial layer lines that have undergone decades of intensive selection, indigenous chickens have generally experienced lower selection pressure and retain greater within-population genetic diversity, resulting in wider phenotypic variation in egg production traits [37]. This variation was particularly evident for AFE, EN21–25W, and ACL. Although AFE had the lowest coefficient of variation (CV; 11.6%) among the seven traits, it ranged from 86 to 192 d, indicating significant variation in the timing of sexual maturation among individuals. There was a strong negative genetic correlation between AFE and EN21–25W (= −0.93), indicating that variation in AFE substantially affects early egg production. This is also reflected in the CV at different laying stages, with the CV for EN21–25W reaching 59.2%, approximately three times higher than the CV observed for mid-to-late laying number (19.5–23.1%). These findings suggest that variation in sexual maturity can contribute to differences in early egg number, as also reported in other indigenous breeds, such as Beijing-You chickens [38]. After 26 weeks of age, most hens had initiated laying, and the CV of stage-specific egg numbers remained between 19.5 and 23.1%, indicating reduced between-individual variation during the middle-to-late laying period. The maximum TEN of the WG population was 138 eggs. Although this value was lower than the cumulative egg production reported for Hy-Line Brown hens at a comparable age, it still represents relatively high performance for an indigenous chicken population [13,39]. The presence of high-producing individuals within the WG line suggests that further improvement may be achieved through systematic selection.
Genetic parameter estimates revealed marked stage-specific differences in the genetic architecture of the egg production. Heritability was highest for EN36–43W ( = 0.74) and comparatively lower for EN21–25W, EN26–30W, and EN31–35W ( = 0.37, 0.19, and 0.35, respectively). Early egg production is jointly affected by the onset of sexual maturity and adaptation to the laying environment, whereas later egg production may more directly reflect the maintenance of ovarian follicle reserves and ovulatory activity [40]. AFE was negatively genetically correlated with all egg number traits, with estimates ranging from −0.93 to −0.37. The association was strongest with early egg production and was generally weaker at later stages. Once most hens had entered a relatively established laying cycle, variation in egg production was likely influenced increasingly by other genetic and physiological factors [41]. Heritability estimates for EN36–43W and TEN were higher than previously reported, with standard errors of 0.06 and 0.07, respectively. Accurate egg production records may partly explain this difference by reducing measurement error, but the limited population size calls for further validation in a larger population. ACL showed weak-to-moderate genetic correlations with stage-specific egg number traits ( = 0.21–0.35) and TEN ( = 0.30), consistent with previous findings in indigenous chickens [42]. The ACL reflects the continuity of ovulation, whereas the TEN denotes the cumulative egg output over the specified laying period. Their weak genetic correlation suggests that ACL and TEN are partly controlled by distinct genetic pathways, allowing concurrent selection for both traits without substantial genetic antagonism. Collectively, the phenotypic and genetic analyses highlighted three features relevant to subsequent GWASs and fine-mapping. First, the moderate-to-high heritability estimates for most traits provide a sound genetic basis for association mapping. Second, genetic correlations ranged from very strong, as between AFE and EN21–25W ( = −0.93), to relatively weak, as between ACL and TEN ( = 0.30), thereby providing a theoretical basis for subsequent multi-trait fine-mapping analyses. Third, the differences in heritability and genetic correlations among egg production traits at different laying stages that early and late egg production may be influenced by distinct genetic loci.
Egg production traits, including age at first egg, egg number at different laying stages, and average clutch length, are complex quantitative traits with a polygenic genetic architecture [43]. Genetic correlations among egg production traits suggest a partially shared genetic basis, with some causal variants potentially exerting pleiotropic effects [42]. Single-trait analysis is insufficient to fully leverage this shared genetic information. Therefore, this study utilizes multi-trait joint fine-mapping, integrating association evidence from related egg production traits to improve the resolution for pinpointing potential causal variants. However, MLM identified no SNPs reaching genome-wide significance, possibly because the sample size of 246 individuals and the stringent Bonferroni threshold (p < 4.40 × 10⁻⁹) limited detection power. FarmCPU iteratively combines fixed and random effect models, which may improve detection power [44]. In this study, it identified 26 genome-wide significant SNPs across 24 independent genomic regions. To control false positives, we applied the same significance threshold and included the first five principal components as covariates to account for population structure. Genomic inflation factors for FarmCPU ranged from 0.862 to 1.141, with modest inflation for EN26–30W and varying degrees of deflation for the remaining traits. Most points in the QQ plots followed the diagonal, with deviations mainly confined to the tails, suggesting no widespread inflation of test statistics. Nevertheless, these diagnostics cannot exclude individual false-positive associations, and the findings require validation in larger, independent populations. Among these, five independent genomic regions (region 5, 7, 8, 15, and 16) were jointly detected in the GWASs for at least two egg production traits, suggesting that different egg production traits may share part of their genetic basis and provide molecular-level support for the observed genetic correlations among traits. After identifying the candidate regions, this study further employed mvSuSiE for multi-trait joint fine-mapping. Compared with single-trait SuSiE, mvSuSiE can learn patterns of effect sharing between traits from the data, and by integrating association evidence across traits, enhance the ability to localize prioritized variants [25]. For example, rs732088229 exhibits association evidence in EN31–35W, EN36–43W, and TEN, suggesting that it may exhibit pleiotropy. This study initially screened 41 SNPs from 97 credible sets using a PIP ≥ 0.8 threshold, and further selected 25 high-confidence prioritized SNPs by combining PVE_max > 0.01, prioritizing variants with both high posterior support and large estimated effects. Among them, 20 SNPs had a PVE exceeding 1% for at least two traits, suggesting that these candidate variants may be broadly involved in the shared regulation of multiple egg-laying traits. Notably, the PVE_max > 1% cutoff was an empirical prioritization criterion, and the final SNP list was partly dependent on the chosen threshold [45]. The 25 prioritized SNPs may not capture the full genetic basis of these traits. Additional small-effect variants may remain undetected because of the limited sample size and stringent filtering criteria. However, VEP annotation shows that all 25 prioritized SNPs are located in non-coding regions, with intronic variants accounting for 56% and upstream and downstream variants together accounting for 36%. This distribution suggests that these variants may be involved in the regulation of egg production traits by affecting gene expression or RNA splicing, rather than directly altering the amino acid sequence of proteins. The modest sample size limit the statistical power of internal validation, and the association signals identified in this study require replication in larger, independent populations. Therefore, we compared the candidate QTL intervals identified in this study with previously reported egg production-related QTLs but observed no direct overlap. However, five candidate intervals were located within 250 kb of nine reported QTLs, providing a degree of spatial support for positional concordance with previous findings. The absence of direct overlap may be attributable to differences in genetic background between the studied populations and in the methods used to define QTL intervals; for instance, the LD threshold applied in this study may have been relatively stringent, resulting in narrowed interval boundaries.
The seven prioritized genes are involved in biological processes ranging from neuroendocrine regulation to ovarian function. NHLH2 and MAFB may be involved in upstream neuroendocrine regulation of the hypothalamic–pituitary–gonadal axis. NHLH2 encodes a basic helix–loop–helix transcription factor expressed in the hypothalamus and has been implicated in the development and function of gonadotropin-releasing hormone neurons [46]. Disruption of NHLH2 in mice results in delayed sexual maturation and reduced fertility [47]. The variant rs312576135, located in a putative regulatory region near NHLH2, explained more than 1% of the EBV variance for AFE, EN21–25W, EN31–35W, EN36–43W, and TEN, with the largest estimate observed for EN36–43W (11.03%). These cross-trait associations suggest that the region may contribute to both sexual maturity and subsequent egg production. MAFB encodes a basic leucine zipper transcription factor and has also been implicated in reproductive potential in cattle. Banerjee et al. observed reduced MAFB expression in peripheral white blood cells collected at weaning from beef heifers that were subsequently classified as subfertile, suggesting a potential association between MAFB expression and reproductive performance [48]. The variant rs315300554 was annotated as a downstream gene variant near MAFB. It explained more than 1% of the EBV variance for EN21–25W, EN26–30W, EN31–35W, EN36–43W, and TEN, with the largest estimate observed for EN36–43W (10.86%). This cross-stage effect distribution suggests that this locus may be associated with egg production performance across multiple stages; however, whether it exerts its effect through regulation of MAFB expression still requires further validation. EDNRB encodes endothelin receptor type B and is involved in the regulation of vascular tone and cell migration [49]. In ovarian tissues, endothelin signaling has been associated with follicular angiogenesis and luteal development and may therefore influence follicle development by modulating its vascular supply. GSS encodes glutathione synthetase, which catalyzes the final step in glutathione biosynthesis and contributes to cellular redox homeostasis [50]. Because granulosa cells experience changes in oxidative stress during follicle selection, atresia, and ovulation, GSS may contribute to the maintenance of granulosa cell viability. BNC1 has been implicated in the maintenance of ovarian function, as Bnc1-mutant female mice exhibit reduced follicle numbers and infertility [51]. These findings suggest that BNC1 may influence egg production through its role in oocyte and follicle maintenance, although this possibility remains to be verified in chickens. TFPI2 has more direct functional support in chickens. Wang et al. reported higher hypothalamic TFPI2 expression in high-producing Gushi hens and showed that TFPI2 promoted GnRH secretion and reduced NPVF expression in primary chicken hypothalamic neurons [43]. These findings support a potential role for TFPI2 in the neuroendocrine regulation of egg production. rs732088229 had the highest summed PVE across traits (32.00%), but no other SNPs in strong LD (r2 > 0.80) were detected within ± 1 Mb. However, rs732088229 is located within an intron of SYNDIG1. SYNDIG1 encodes an AMPA receptor-interacting transmembrane protein involved in excitatory synapse development [52]. A spatiotemporal transcriptomic study in sheep highlighted its expression in granulosa cells at the small antral follicle stage, suggesting a possible role in follicular development [34]. However, its contribution to egg production in chickens remains to be established.
This study has limitations in gene prioritization, which relied primarily on physical proximity to associated variants, variant annotations, and previously reported biological functions. However, mere proximity cannot establish a causal relationship between variants and genes, and related variants may also exert their effects through genes at a greater distance. For the prioritized genes, the expression patterns and functional evidence in chicken reproductive tissues are still limited. Future studies integrating spatiotemporal transcriptomic profiles of the ovary and hypothalamus, expression QTL mapping, independent-population validation, and in vitro functional assays will be required to establish variant-to-gene relationships and clarify the underlying molecular mechanisms.
5. Conclusions
This study integrated GWASs, multiple trait fine-mapping, and LD-based QTL annotation to investigate the genetic architecture of egg production traits in the WG indigenous chicken line. The results revealed marked stage-specific genetic variation, with heritability ranging from 0.19 for early egg production to 0.74 for late egg production, and a strong negative genetic correlation between AFE and EN21–25W ( = −0.93). A total of 25 high-confidence prioritized SNPs were found. Table S3 shows annotation results for high-confidence prioritized SNPs. SNPs were prioritized through GWASs and multiple trait fine-mapping, and most showed evidence of cross-trait effects. The LD-based interval definition identified 25 QTLs and prioritized seven genes: NHLH2, EDNRB, SYNDIG1, BNC1, TFPI2, MAFB, and GSS. These findings provide potential targets for genetic improvement of egg production in the WG line and demonstrate the utility of multiple trait fine-mapping for dissecting correlated reproductive traits in poultry.
Supplementary Materials
The following supporting information can be downloaded at https://www.mdpi.com/article/10.3390/vetsci13111187/s1. Table S1: Results of multivariate fine-mapping across the 24 independent genomic regions; Table S2: PIP and PVE for egg production traits by high-confidence prioritized SNPs; Table S3: Annotation results for high-confidence prioritized SNPs; Table S4: Previously reported egg production-related QTLs located within 250kb of the candidate QTL intervals identified in this study; Table S5: Genomic annotation, biological functions, and potential relevance to egg production of genes overlapping the identified QTL intervals in chickens. Figure S1: Principal component analysis of the WG line; Fig_PIP_Manhataan.R: R script for the PIP plot; Figure 3_PVE_Bubble.R: R script for the PVE bubble plot.
Author Contributions
H.L.: Writing—original draft, Visualization, Software, Methodology, Data curation, Conceptualization. Y.W. (Yinghui Wei): Methodology, Investigation. Y.W. (Yanlu Wang): Methodology. Y.Z.: Software. L.Z.: Data curation. W.Z.: Visualization. Y.G.: Data curation. Q.L.: Investigation. J.F.: Writing—review and editing, Methodology. H.W.: Writing—review and editing, Supervision, Resources, Project administration, Funding acquisition. All authors have read and agreed to the published version of the manuscript.
Funding
This study was supported by the Hangzhou Joint Fund of the Zhejiang Provincial Natural Science Foundation of China under Grant No. LHZY24C170001, the Agricultural and Social Development Project of Hangzhou (202003A02) and the Agricultural Science Innovation Fund of Hangzhou Academy of Agricultural Sciences (2025HNCT-07).
Institutional Review Board Statement
The animal study protocol was approved by the Institutional Ethics Committee of Hangzhou Academy of Agricultural Sciences (approval number: NKY-SEC-2025-010; date of approval: 10 June 2025).
Informed Consent Statement
All animals used in this study were owned by the Hangzhou Academy of Agricultural Sciences, and no privately owned animals were involved.
Data Availability Statement
The data presented in this study are available on request from the corresponding authors due to the need to ensure standardized and traceable data use, as well as to prevent inappropriate use or unauthorized citation.
Acknowledgments
The authors thank the laboratory members and farm staff who assisted with sample collection, cryopreservation and analysis. The authors also acknowledge the assistance of ChatGPT (GPT-5.6 Sol, OpenAI).
Conflicts of Interest
The authors declare no conflicts of interest.
References
- Yang, N. Egg Production in China: Current Status and Outlook. Front. Agric. Sci. Eng. 2021, 8, 25–34. [Google Scholar] [CrossRef] [Scilit]
- Shi, L.; Li, Y.; Isa, A.M.; Ma, H.; Yuan, J.; Wang, P.; Ge, P.; Gong, Y.; Chen, J.; Sun, Y. Characterization of Clutch Traits and Egg Production in Six Chicken Breeds. Anim. Biosci. 2023, 36, 899–907. [Google Scholar] [CrossRef] [Scilit] [PubMed]
- Lei, Q.; Zhang, S.; Wang, J.; Qi, C.; Liu, J.; Cao, D.; Li, F.; Han, H.; Liu, W.; Li, D.; et al. Genome-Wide Association Studies of Egg Production Traits by Whole Genome Sequencing of Laiwu Black Chicken. Poult. Sci. 2024, 103, 103705. [Google Scholar] [CrossRef] [Scilit] [PubMed]
- Liu, H.; Wei, Y.; Wang, Y.; Zhou, Y.; Zhang, L.; Zhang, W.; Fan, J.; Wang, H. Integrated Multi-Omics Analysis Reveals Molecular Regulation of the Hypothalamus–Pituitary–Ovary Axis Underlying Egg Production in Indigenous Chickens. Poult. Sci. 2026, 105, 107510. [Google Scholar] [CrossRef] [Scilit] [PubMed]
- Liu, J.; Liang, F.; Sun, C.; Wang, X.; Su, Z.; Li, Y.; Luan, P.; Cao, Z.; Bai, X.; Leng, L. Estimation of Genetic Parameters for Egg Production and Clutch Traits in Lindian Chickens. Animals 2025, 15, 1867. [Google Scholar] [CrossRef] [Scilit] [PubMed]
- Huang, X.; Zhong, Z.; Zhang, Z.; Weng, Z.; Xu, Y.; Li, W.; Zhong, G.; Wang, Q.; Shi, Y.; Xie, T.; et al. Genome-Wide Association Study Reveals Candidate Genes Associated with Egg-Laying Performance in Wuhua Yellow Chicken. Poult. Sci. 2025, 104, 105739. [Google Scholar] [CrossRef] [Scilit] [PubMed]
- Lipkin, E.; Smith, J.; Soller, M.; Burt, D.W.; Fulton, J.E. Mapping Quantitative Trait Loci Regions Associated with Marek’s Disease on Chicken Autosomes by Means of Selective DNA Pooling. Sci. Rep. 2024, 14, 31896. [Google Scholar] [CrossRef] [Scilit] [PubMed]
- Li, X.; Cai, X.; Chen, J.; Pan, X.; Gong, W.; Zhong, Z.; Teng, J.; Zhang, Z. Characterizing Breed-Shared and Breed-Specific Genetic Regulatory Effects of Gene Expression across Three Pig Breeds. J. Anim. Sci. Biotechnol. 2026, 17, 62. [Google Scholar] [CrossRef] [Scilit] [PubMed]
- Wu, S.; Dou, T.; Wang, K.; Yuan, S.; Yan, S.; Xu, Z.; Liu, Y.; Jian, Z.; Zhao, J.; Zhao, R.; et al. Artificial Selection Footprints in Indigenous and Commercial Chicken Genomes. BMC Genom. 2024, 25, 428. [Google Scholar] [CrossRef] [Scilit] [PubMed]
- Hu, Z.L.; Park, C.A.; Reecy, J.M. Bringing the Animal QTLdb and CorrDB into the Future: Meeting New Challenges and Providing Updated Services. Nucleic Acids Res. 2022, 50, D956–D961. [Google Scholar] [CrossRef] [Scilit] [PubMed]
- Wolc, A.; Jankowski, T.; Arango, J.; Settar, P.; Fulton, J.E.; O’Sullivan, N.P.; Dekkers, J.C.M. Investigating the Genetic Determination of Clutch Traits in Laying Hens. Poult. Sci. 2019, 98, 39–45. [Google Scholar] [CrossRef] [Scilit] [PubMed]
- Chen, A.; Zhao, X.; Wen, J.; Zhao, X.; Wang, G.; Zhang, X.; Ren, X.; Zhang, Y.; Cheng, X.; Yu, X.; et al. Genetic Parameter Estimation and Molecular Foundation of Chicken Egg-Laying Trait. Poult. Sci. 2024, 103, 103627. [Google Scholar] [CrossRef] [Scilit] [PubMed]
- Zhao, X.; Nie, C.; Zhang, J.; Li, X.; Zhu, T.; Guan, Z.; Chen, Y.; Wang, L.; Lv, X.Z.; Yang, W.; et al. Identification of Candidate Genomic Regions for Chicken Egg Number Traits Based on Genome-Wide Association Study. BMC Genom. 2021, 22, 610. [Google Scholar] [CrossRef] [Scilit] [PubMed]
- Fu, M.; Wu, Y.; Shen, J.; Pan, A.; Zhang, H.; Sun, J.; Liang, Z.; Huang, T.; Du, J.; Pi, J. Genome-Wide Association Study of Egg Production Traits in Shuanglian Chickens Using Whole Genome Sequencing. Genes 2023, 14, 2129. [Google Scholar] [CrossRef] [Scilit] [PubMed]
- Zhang, H.; Fu, Y.; Wang, Y.; Yin, S.; Jiang, Y.; Sun, Y.; Kang, L. Genome-Wide Association Study Reveals Candidate Genes Associated with Key Egg Production Traits in Langya Chickens. Poult. Sci. 2026, 105, 106396. [Google Scholar] [CrossRef] [Scilit] [PubMed]
- Kochetova, O.; Korytina, G.; Timasheva, Y.; Gilyazova, I.; Chumakova, A.; Karunas, A.; Khusnutdinova, E.; Gusev, O. Genetic Architecture of Egg Production Traits in Chickens: A Systematic Review. Int. J. Mol. Sci. 2026, 27, 5255. [Google Scholar] [CrossRef] [Scilit] [PubMed]
- Zhu, D.; Shi, K.; Li, C.; Yan, Y.; Li, H.; Bai, Z.; Tan, L.; Guan, D.; Zhao, Y.; Wang, Y.; et al. Egg-Laying ChickenGTEx Resource Deciphers Context-Specific Regulatory Effects on Fertility Traits. Nat. Commun. 2025, 17, 553. [Google Scholar] [CrossRef] [Scilit] [PubMed]
- Zhang, S.; Dong, W.; You, G.; Jiang, T.; Liao, H.; Hou, Z.; Yin, Z. Genome-Wide Association Study in the Baicheng-You Chickens Highlights Candidate Variants for Egg Quality Traits. Animal 2026, 20, 101899. [Google Scholar] [CrossRef] [Scilit] [PubMed]
- Schaid, D.J.; Chen, W.; Larson, N.B. From Genome-Wide Associations to Candidate Causal Variants by Statistical Fine-Mapping. Nat. Rev. Genet. 2018, 19, 491–504. [Google Scholar] [CrossRef] [Scilit] [PubMed]
- Wang, G.; Sarkar, A.; Carbonetto, P.; Stephens, M. A Simple New Approach to Variable Selection in Regression, with Application to Genetic Fine Mapping. J. R. Stat. Soc. Ser. B Stat. Methodol. 2020, 82, 1273–1300. [Google Scholar] [CrossRef] [Scilit] [PubMed]
- Yuan, K.; Longchamps, R.J.; Pardiñas, A.F.; Yu, M.; Chen, T.; Lin, S.; Chen, Y.; Lam, M.; Liu, R.; Xia, Y.; et al. Fine-Mapping across Diverse Ancestries Drives the Discovery of Putative Causal Variants Underlying Human Complex Traits and Diseases. Nat. Genet. 2024, 56, 1841–1850. [Google Scholar] [CrossRef] [Scilit] [PubMed]
- Teng, J.; Zhao, X.; Yan, Q.; Yang, J.; Pei, F.; Zhang, X.; Duan, C.; Chen, Z.; Xu, Q.; Liu, Y.; et al. Integrative Analysis of GWAS, Bayesian Fine-Mapping, Mendelian Randomization and Colocalization Reveals Genetic Determinants Underlying Milk-Related Traits in Dairy Cattle. Genet. Sel. Evol. 2026, 58, 4. [Google Scholar] [CrossRef] [Scilit] [PubMed]
- Yu, N.; Cui, D.; Xie, L.; Tang, X.; Xiong, S.; Zhang, Y.; He, R.; Li, L.; Xiao, S.; Guo, Y. Functional Genomic Dissection and Prediction of Body Size Traits in Pigs. Genet. Sel. Evol. 2026, 58, 55. [Google Scholar] [CrossRef] [Scilit] [PubMed]
- Yuan, J.; Sun, C.; Dou, T.; Yi, G.; Qu, L.; Qu, L.; Wang, K.; Yang, N. Identification of Promising Mutants Associated with Egg Production Traits Revealed by Genome-Wide Association Study. PLoS ONE 2015, 10, e0140615. [Google Scholar] [CrossRef] [Scilit] [PubMed]
- Zou, Y.; Carbonetto, P.; Xie, D.; Wang, G.; Stephens, M. Fast and Flexible Joint Fine-Mapping of Multiple Traits via the Sum of Single Effects Model. Nat. Genet. 2026, 58, 454–462. [Google Scholar] [CrossRef] [Scilit] [PubMed]
- Bolger, A.M.; Lohse, M.; Usadel, B. Trimmomatic: A Flexible Trimmer for Illumina Sequence Data. Bioinformatics 2014, 30, 2114–2120. [Google Scholar] [CrossRef] [Scilit] [PubMed]
- Li, H.; Durbin, R. Fast and Accurate Short Read Alignment with Burrows–Wheeler Transform. Bioinformatics 2009, 25, 1754–1760. [Google Scholar] [CrossRef] [Scilit] [PubMed]
- Li, H.; Handsaker, B.; Wysoker, A.; Fennell, T.; Ruan, J.; Homer, N.; Marth, G.; Abecasis, G.; Durbin, R.; 1000 Genome Project Data Processing Subgroup. The Sequence Alignment/Map Format and SAMtools. Bioinformatics 2009, 25, 2078–2079. [Google Scholar] [CrossRef] [Scilit] [PubMed]
- McKenna, A.; Hanna, M.; Banks, E.; Sivachenko, A.; Cibulskis, K.; Kernytsky, A.; Garimella, K.; Altshuler, D.; Gabriel, S.; Daly, M.; et al. The Genome Analysis Toolkit: A MapReduce Framework for Analyzing Next-Generation DNA Sequencing Data. Genome Res. 2010, 20, 1297–1303. [Google Scholar] [CrossRef] [Scilit] [PubMed]
- Browning, B.L.; Zhou, Y.; Browning, S.R. A One-Penny Imputed Genome from Next-Generation Reference Panels. Am. J. Hum. Genet. 2018, 103, 338–348. [Google Scholar] [CrossRef] [Scilit] [PubMed]
- Yin, L.; Zhang, H.; Tang, Z.; Yin, D.; Fu, Y.; Yuan, X.; Li, X.; Liu, X.; Zhao, S. HIBLUP: An Integration of Statistical Models on the BLUP Framework for Efficient Genetic Evaluation Using Big Genomic Data. Nucleic Acids Res. 2023, 51, 3501–3512. [Google Scholar] [CrossRef] [Scilit] [PubMed]
- Yin, L.; Zhang, H.; Tang, Z.; Xu, J.; Yin, D.; Zhang, Z.; Yuan, X.; Zhu, M.; Zhao, S.; Li, X.; et al. rMVP: A Memory-Efficient, Visualization-Enhanced, and Parallel-Accelerated Tool for Genome-Wide Association Study. Genom. Proteom. Bioinform. 2021, 19, 619–628. [Google Scholar] [CrossRef] [Scilit] [PubMed]
- Hunt, S.E.; Moore, B.; Amode, R.M.; Armean, I.M.; Lemos, D.; Mushtaq, A.; Parton, A.; Schuilenburg, H.; Szpak, M.; Thormann, A.; et al. Annotating and Prioritizing Genomic Variants Using the Ensembl Variant Effect Predictor—A Tutorial. Hum. Mutat. 2022, 43, 986–997. [Google Scholar] [CrossRef] [Scilit] [PubMed]
- Bonnet, A.; Servin, B.; Mulsant, P.; Mandon-Pepin, B. Spatio-Temporal Gene Expression Profiling during In Vivo Early Ovarian Folliculogenesis: Integrated Transcriptomic Study and Molecular Signature of Early Follicular Growth. PLoS ONE 2015, 10, e0141482. [Google Scholar] [CrossRef] [Scilit] [PubMed]
- Ncho, C.M.; Berdos, J.I.; Gupta, V.; Rahman, A.; Mekonnen, K.T.; Bakhsh, A. Abiotic Stressors in Poultry Production: A Comprehensive Review. J. Anim. Physiol. Anim. Nutr. 2025, 109, 30–50. [Google Scholar] [CrossRef] [Scilit] [PubMed]
- Xin, H.; Gates, R.S.; Green, A.R.; Mitloehner, F.M.; Moore, P.A.; Wathes, C.M. Environmental Impacts and Sustainability of Egg Production Systems. Poult. Sci. 2011, 90, 263–277. [Google Scholar] [CrossRef] [Scilit] [PubMed]
- Zhang, J.; Nie, C.; Li, X.; Ning, Z.; Chen, Y.; Jia, Y.; Han, J.; Wang, L.; Lv, X.; Yang, W.; et al. Genome-Wide Population Genetic Analysis of Commercial, Indigenous, Game, and Wild Chickens Using 600K SNP Microarray Data. Front. Genet. 2020, 11, 543294. [Google Scholar] [CrossRef] [Scilit] [PubMed]
- Zhang, Z.; Ge, C.; Ni, A.; Yao, J.; Isa, A.M.; Yang, H.; Du, H.; Yuan, J.; Li, Y.; Zhang, Q.; et al. Phenotype and Genetic Characterization of the Egg-Laying Related Traits in Indigenous Beijing-You Chickens. Poult. Sci. 2025, 104, 105733. [Google Scholar] [CrossRef] [Scilit] [PubMed]
- Kang, H.K.; Park, S.B.; Jeon, J.J.; Kim, H.S.; Kim, S.H.; Hong, E.; Kim, C.H. Effect of Stocking Density on Laying Performance, Egg Quality and Blood Parameters of Hy-Line Brown Laying Hens in an Aviary System. Eur. Poult. Sci. 2018, 82, 1–13. [Google Scholar] [CrossRef] [Scilit]
- Francoeur, L.; Scoville, D.M.; Ahern, J.G.; Johnson, P.A. Characterization of Persistency of Lay in Laying Hens. Biol. Reprod. 2025, 113, 1433–1443. [Google Scholar] [CrossRef] [Scilit] [PubMed]
- Tan, L.; Cai, X.; Kong, Y.; Liu, Z.; Wen, Z.; Bu, L.; Wang, Y.; Liu, X.; Zhang, Z.; Han, J.; et al. Genome-Wide Analyses Reveal Intricate Genetic Mechanisms Underlying Egg Production Efficiency in Chickens. J. Anim. Sci. Biotechnol. 2025, 16, 114. [Google Scholar] [CrossRef] [Scilit] [PubMed]
- Yang, H.; Li, Y.; Yuan, J.; Ni, A.; Ma, H.; Wang, Y.; Zong, Y.; Zhao, J.; Jin, S.; Sun, Y.; et al. Research Note: Genetic Parameters for Egg Production and Clutch-Related Traits in Indigenous Beijing-You Chickens. Poult. Sci. 2023, 102, 102904. [Google Scholar] [CrossRef] [Scilit] [PubMed]
- Wang, D.; Tan, L.; Zhi, Y.; Bu, L.; Wang, Y.; Wang, Z.; Guo, Y.; Tian, W.; Xu, C.; Li, D.; et al. Genome-Wide Variation Study and Inter-Tissue Communication Analysis Unveil Regulatory Mechanisms of Egg-Laying Performance in Chickens. Nat. Commun. 2024, 15, 7069. [Google Scholar] [CrossRef] [Scilit] [PubMed]
- Liu, X.; Huang, M.; Fan, B.; Buckler, E.S.; Zhang, Z. Iterative Usage of Fixed and Random Effect Models for Powerful and Efficient Genome-Wide Association Studies. PLoS Genet. 2016, 12, e1005767, Correction in PLoS Genet. 2016, 12, e1005957. [Google Scholar] [CrossRef] [Scilit] [PubMed]
- Gonzalez, M.; Aguilar, I.; Quezada, M.; Balmelli, G. Single-Step GWAS Multi-Trait Threshold Linear Model for Growth Rate and Heteroblasty in Eucalyptus globulus. Forests 2025, 16, 247. [Google Scholar] [CrossRef] [Scilit]
- Cogliati, T.; Delgado-Romero, P.; Norwitz, E.R.; Guduric-Fuchs, J.; Kaiser, U.B.; Wray, S.; Kirsch, I.R. Pubertal Impairment in Nhlh2 Null Mice Is Associated with Hypothalamic and Pituitary Deficiencies. Mol. Endocrinol. 2007, 21, 3013–3027. [Google Scholar] [CrossRef] [Scilit] [PubMed]
- Johnson, S.A.; Marín-Bivens, C.L.; Miele, M.; Coyle, C.A.; Fissore, R.; Good, D.J. The Nhlh2 Transcription Factor Is Required for Female Sexual Behavior and Reproductive Longevity. Horm. Behav. 2004, 46, 420–427. [Google Scholar] [CrossRef] [Scilit] [PubMed]
- Banerjee, P.; Diniz, W.J.S.; Hollingsworth, R.; Rodning, S.P.; Dyce, P.W. mRNA Signatures in Peripheral White Blood Cells Predict Reproductive Potential in Beef Heifers at Weaning. Genes 2023, 14, 498. [Google Scholar] [CrossRef] [Scilit] [PubMed]
- Liu, H.; Luo, Q.; Zhang, J.; Mo, C.; Wang, Y.; Li, J. Endothelins (EDN1, EDN2, EDN3) and Their Receptors (EDNRA, EDNRB, EDNRB2) in Chickens: Functional Analysis and Tissue Distribution. Gen. Comp. Endocrinol. 2019, 283, 113231. [Google Scholar] [CrossRef] [Scilit] [PubMed]
- Zhou, S.; Zhao, A.; Wu, Y.; Mi, Y.; Zhang, C. Protective Effect of Grape Seed Proanthocyanidins on Oxidative Damage of Chicken Follicular Granulosa Cells by Inhibiting FoxO1-Mediated Autophagy. Front. Cell Dev. Biol. 2022, 10, 762228. [Google Scholar] [CrossRef] [Scilit] [PubMed]
- Zhang, D.; Liu, Y.; Zhang, Z.; Lv, P.; Liu, Y.; Li, J.; Wu, Y.; Zhang, R.; Huang, Y.; Xu, G.; et al. Basonuclin 1 Deficiency Is a Cause of Primary Ovarian Insufficiency. Hum. Mol. Genet. 2018, 27, 3787–3800. [Google Scholar] [CrossRef] [Scilit] [PubMed]
- Kalashnikova, E.; Lorca, R.A.; Kaur, I.; Barisone, G.A.; Li, B.; Ishimaru, T.; Trimmer, J.S.; Mohapatra, D.P.; Díaz, E. SynDIG1: An Activity-Regulated, AMPA-Receptor-Interacting Transmembrane Protein That Regulates Excitatory Synapse Development. Neuron 2010, 65, 80–93. [Google Scholar] [CrossRef] [Scilit] [PubMed]

Disclaimer/Publisher’s Note: The statements, opinions and data contained in all publications are solely those of the individual author(s) and contributor(s) and not of MDPI and/or the editor(s). MDPI and/or the editor(s) disclaim responsibility for any injury to people or property resulting from any ideas, methods, instructions or products referred to in the content. |
© 2026 by the authors. Licensee MDPI, Basel, Switzerland. This article is an open access article distributed under the terms and conditions of the Creative Commons Attribution (CC BY) license.