


Simple Summary
Salmonella Typhimurium infection can negatively affect the health and growth of pigs, but individual animals may respond differently to the same health challenge. Understanding this variation may help identify pigs that are more likely to maintain growth under challenging conditions. In this study, data from four independent experiments involving growing–finishing pigs exposed to a common Salmonella Typhimurium challenge were combined to investigate whether weight gain could be predicted using machine learning methods. The ability to predict weight gain was compared between the early stage of the challenge, from day 0 to day 7, and the later stage, from day 7 to day 28. Weight gain during the early stage was difficult to predict from information collected before the challenge, whereas prediction was more accurate during the later stage. Prediction of later growth also used information collected during the first week after the challenge, which may partly account for the difference between periods. Body weight, body composition, and blood measurements related to protein metabolism and health status contributed to the predictions. Overall, predictive performance differed between the two periods evaluated with different information available at the time of prediction. These findings can guide future research aimed at identifying practical indicators of how pigs respond to disease challenges and developing more effective tools for monitoring animal health and performance.
Abstract
This study aimed to evaluate the internal predictability of weight gain using an integrated dataset derived from four experiments conducted with growing–finishing pigs subjected to a common Salmonella Typhimurium challenge protocol. Individual-animal data from 230 pigs were harmonized into a database containing growth performance, body composition, serum biochemical measurements, and experiment-level information. Relative weight gain, calculated relative to body weight at the beginning of each evaluation period, was evaluated separately during the acute phase, from days 0 to 7 post-challenge (RWG7; n = 132), and the chronic phase, from days 7 to 28 post-challenge (RWG7–28; n = 131). Linear Model, Elastic Net, Random Forest, XGBoost, Generalized Additive Models, and Support Vector Machine were compared using individual-level five-fold cross-validation, in which pigs from the same source experiment could occur in both training and validation folds. Single regression trees were additionally fitted as exploratory tools. During the acute phase, cross-validated R2 values ranged from 0.078 to 0.186, indicating that the available baseline variables explained only a limited proportion of the variation in RWG7. Predictive performance was higher during the chronic phase, particularly for the Linear Model and Elastic Net, which showed essentially equivalent cross-validated performance, with R2 values of 0.419 and 0.420, respectively. Random Forest and XGBoost achieved high in-sample performance but substantially lower out-of-fold performance, suggesting overfitting structures within the integrated dataset. Body weight, body composition, biochemical variables, and the source experiment contributed to model predictions, indicating that the predictive signal incorporated information related to both individual physiological status and between-experiment heterogeneity. Overall, acute-phase growth performance was poorly predicted from baseline information, whereas chronic-phase growth showed a stronger internal predictive signal. This comparison reflects differences in the predictor information available at the beginning of each phase, as chronic-phase models additionally incorporated body weight and relative weight gain measured on day 7. These results should be interpreted as exploratory and hypothesis-generating because experiment-held-out or external validation is required before extrapolation to independent experimental or commercial populations.
1. Introduction
Salmonella enterica serovar Typhimurium (ST) is one of the most prevalent Salmonella serovars affecting pig production worldwide and remains a major cause of enteric disease in growing pigs [1]. Although mortality is generally low, ST infection is characterized by high morbidity and persistent intestinal colonization, allowing infected pigs to become asymptomatic carriers that may intermittently shed the pathogen and contribute to its persistence within herds [2,3]. This persistent infection compromises animal health and productive performance, representing an important challenge for modern swine production systems.
The reduction in growth performance following ST infection is largely attributed to the metabolic cost of mounting an immune response [4]. Nutrients that would otherwise support muscle protein deposition are redirected toward acute-phase protein synthesis, maintenance of intestinal barrier integrity, antioxidant defenses, and tissue repair [1]. However, the magnitude of these responses varies considerably among pigs. This biological variability reflects complex interactions among physiological, immunological, metabolic, and performance-related factors that may substantially influence growth, even in the absence of overt clinical signs.
Conventional statistical models, including generalized linear and mixed-effects models, remain essential for hypothesis testing and treatment-effect estimation. However, machine learning methods can provide a complementary analytical framework by identifying complex data-driven patterns without imposing strict parametric assumptions. Algorithms such as Random Forest, Extreme Gradient Boosting (XGBoost), and Support Vector Machine (SVM) have been increasingly applied in animal science for predictive modelling, variable prioritization, and pattern recognition because they can accommodate nonlinear relationships and interactions among predictors [5,6,7]. Growth deviations and acute-phase protein responses have been combined to characterize individual resilience following immune stimulation [8]. Pre-challenge plasma protein profiles have also been associated with subsequent performance and resilience [9], while blood-based multi-omics information has been evaluated for prediction of these outcomes under a polymicrobial challenge [10]. However, the extent to which baseline biochemical measurements and early growth responses can predict relative weight gain across distinct post-challenge phases remains unclear. Integrating individual-animal data from multiple controlled experiments provides an opportunity to investigate predictive patterns across a broader range of animal characteristics and experimental conditions. Nevertheless, this approach requires careful consideration of methodological consistency and between-experiment heterogeneity. Phase-specific analyses may help distinguish predictors associated with early growth disruption from those associated with subsequent growth under continued sanitary pressure. These analyses may improve our understanding of inter-individual variability in response to sanitary challenges and guide future research on resilience indicators and monitoring strategies.
Therefore, our objective was to compare the internal predictive performance of machine learning models for relative weight gain during the acute and chronic post-challenge phases, using the predictor information available at the beginning of each phase, and to identify the individual-level predictors and source-experiment indicators contributing to model predictions. We hypothesized that the internal predictability of relative weight gain would be greater during the chronic than during the acute phase because early post-challenge growth is influenced by rapidly changing and heterogeneous host responses, whereas prediction of later growth may benefit from information collected after the initial host response has begun to develop.
2. Materials and Methods
2.1. Database Description and Source Studies
The dataset was compiled from four independent experiments involving growing–finishing pigs subjected to a common ST challenge protocol under poor sanitary conditions [11,12,13,14]. All experiments were conducted in accordance with protocols approved by the Institutional Animal Care and Use Committee of São Paulo State University (UNESP): No. 4784/20 [11], No. 0607/22 [12], and No. 2296/21 [13,14]. The experiments reported by França et al. [13,14] were conducted under the same ethical approval protocol but involved separate and independent cohorts of pigs. Each pig was included in only one source dataset. The experiments addressed distinct nutritional questions, including functional amino acid supplementation, individual precision feeding, and preventive or curative dietary strategies during immune stimulation. Nevertheless, all experiments employed a common challenge model, providing a methodological basis for integrating individual-animal data.
Individual-animal data from pigs assigned to the ST challenge were harmonized into a single database containing growth performance, body composition, dietary information, experiment-level descriptors, and serum biochemical variables. Throughout the article, the term experiment refers to each of the four independent datasets included in the harmonized database.
The integrated database comprised 230 unique pigs from four independent source experiments (Table 1), with each pig included in only one dataset. A complete-case approach was applied separately to each prediction phase. Pigs with missing outcome data, missing required predictor variables (primarily serum biochemical and body-composition measurements), or insufficient measurements to calculate relative weight gain over the corresponding period were excluded from the respective analyses. The final analytical datasets included 132 pigs for the acute phase (RWG7) and 131 pigs for the chronic phase (RWG7–28). Harmonizing individual-animal data across experiments increased the sample size available for internal predictive modeling while introducing between-experiment heterogeneity. This heterogeneity was represented by the source-experiment factor, which was included as a categorical predictor. For the present analysis, days 0–7 post-challenge were defined as the acute phase, consistent with evidence from a source experiment indicating that the acute response occurred during the first experimental week [12]. Days 7–28 were designated as the chronic phase, representing the subsequent period under continued poor sanitary conditions. These phase definitions were adopted for analytical purposes and do not imply a universally established transition between stages of ST infection. The source-experiment factor was included to account for systematic differences among datasets, including sex, initial body weight, dietary strategies, management practices, and other experiment-specific characteristics. Because these characteristics were partially confounded with the source experiment, their independent effects could not be estimated.
Table 1.
General description of the experimental studies included in the final harmonized machine learning database.
2.2. Sanitary Challenge
In all experiments included in the present database, pigs were exposed to shared core challenge procedures designed to induce controlled immune activation under ST pressure. In each experiment, pigs assigned to the ST challenge under poor sanitary conditions (ST + POOR) were orally inoculated with 5 mL of brain heart infusion broth (CM 1135, Oxoid, Thermo Fisher Scientific, Hampshire, England) containing approximately 2 × 10⁹ colony-forming units (CFU) of a nalidixic acid-resistant ST strain (25 µg/mL).
Across all four studies (total pigs = 230), pigs assigned to the challenge were fasted for 6 h and deprived of water for 1 h before inoculation. Following ST administration, fresh manure from a commercial herd was uniformly distributed on the pen floor of the ST + POOR treatment group. In addition, pens assigned to this treatment were intentionally maintained without routine cleaning or sanitation procedures throughout the 28-day experimental period, as described by Li et al. [15]. The combination of ST oral inoculation, continuous exposure to contaminated manure, and the absence of hygiene protocols was adopted consistently in the four studies to sustain a chronic level of pathogenic pressure and promote prolonged immune system stimulation. The common challenge protocol was used to promote comparable sanitary pressure across experiments and supported the integration of the four datasets for the present machine learning analysis.
2.3. Growth Performance and Body Composition
Individual body-weight records were used to calculate growth over the evaluation periods. Individual feed intake was recorded using automated feeder systems, and average daily feed intake (ADFI, kg/d) was calculated for each period. Average daily gain (ADG, kg/d) was calculated from body-weight changes, and the gain-to-feed ratio (G:F kg/kg) was calculated from ADG and ADFI.
For the present reanalysis, available records of total body lean and fat masses from days 0 and 28 post-challenge were obtained from the original datasets. Body composition was assessed using dual-energy X-ray absorptiometry (DXA; Lunar Prodigy Advance; GE Healthcare, Madison, WI, USA). Sedation protocols included intramuscular administration of xylazine (1.5 mg/kg body weight) and ketamine (15 mg/kg body weight), with additional acepromazine maleate (0.1 mg/kg body weight) in França et al. [13]. Details of fasting and scanning procedures are provided in the source publications [11,12,13,14].
DXA estimates of lean and fat mass were converted to their corresponding protein and lipid chemical equivalents according to Pomar and Rivest [16]. Body protein and lipid contents from days 0 and 28 were included according to their availability in each source dataset. Only baseline body protein and lipid percentages from day 0 were used as body-composition predictors in the machine learning analyses.
2.4. Blood Biomarkers
Blood samples and serum biochemical measurements originated from the four source experiments included in the harmonized database; no additional samples were collected specifically for the present study. For the present reanalysis, available day-0 serum biochemical records were harmonized across the four source datasets.
Blood samples were collected from the jugular vein on day 0, after a minimum of six hours of fasting. Samples were collected before the ST challenge and therefore represented pre-challenge baseline measurements. Pigs were restrained using a snout rope, and each sampling procedure was completed within two minutes to minimize stress and potential interference with blood measurements. Two 8 mL serum tubes were collected per pig (BD Vacutainer; Franklin Lakes, NJ, USA). Blood samples were centrifuged at 3000× g for 10 min at 4 °C (NT 835; Novatecnica, Piracicaba, SP, Brazil), and serum was stored at −80 °C until analysis.
Serum concentrations of albumin (g/dL), total protein (g/dL), urea (mg/dL), triglycerides (mg/dL), and creatinine (mg/dL), and serum lactate dehydrogenase (LDH) activity (U/L) were determined. Albumin concentrations were determined using sodium dodecyl sulfate–polyacrylamide gel electrophoresis (SDS-PAGE), followed by computerized densitometry (Shimadzu 9301 PC; Shimadzu Corporation, Kyoto, Japan), with values corrected for serum total protein concentrations, as described in the source studies [11,12,13,14]. Total protein, urea, triglycerides, creatinine, and LDH were measured using commercial reagents (Labtest Diagnóstica SA, Lagoa Santa, MG, Brazil) and a semiautomatic spectrophotometer (Labmax Plenno; Labtest Diagnóstica SA), as reported in the source study [13]. For the present machine learning analyses, baseline serum biochemical measurements were used as predictors of relative weight gain during both the acute and chronic phases.
2.5. Machine Learning Analysis
This study was conducted as a post hoc exploratory reanalysis focused on predictive-pattern discovery rather than causal inference or treatment-effect estimation. The ability of the multivariable models to predict relative weight gain was assessed within the harmonized dataset, whereas biological interpretation was restricted to predictive associations and variable-ranking patterns requiring further validation.
Relative weight gain was calculated separately for the acute and chronic post-challenge phases to account for differences in body weight at the beginning of each period. Acute-phase relative weight gain was calculated as
where BW0 and BW7 represent body weight measured on days 0 and 7, respectively. Chronic-phase relative weight gain was calculated as
where BW7 and BW28 represent body weight measured on days 7 and 28, respectively. Both outcomes were expressed as unitless proportional changes rather than as percentages or kg/d.
RWG7 = (BW7 − BW0)/BW0,
RWG7–28 = (BW28 − BW7)/BW7,
For RWG7, predictors included baseline body weight (BW0), body protein and lipid percentages measured on day 0, baseline serum biochemical measurements, and the source-experiment factor. For RWG7–28, the same baseline predictors were used, along with BW7 and RWG7, both available at the beginning of the chronic phase. Variables measured on day 28 were not included as predictors. Similarly, feed intake during each prediction interval was excluded because it was measured concurrently with the outcome and was therefore unavailable at the beginning of the respective prediction period. Thus, acute-phase models relied exclusively on pre-challenge information, whereas chronic-phase models additionally incorporated BW7 and RWG7. Consequently, the analyses represented prediction tasks conducted at different time points using distinct sets of available predictors. Comparisons between phases should therefore be interpreted as differences in predictive performance under these respective information sets rather than as evidence of differences in intrinsic biological predictability.
The evaluated modelling approaches were Linear Model, Elastic Net, Random Forest, XGBoost, Generalized Additive Models (GAMs), and SVM with a radial basis function kernel. Single regression trees were additionally fitted as exploratory tools to visualize hierarchical predictor partitions.
All analyses were performed in R version 4.3.2. The caret package was used as the primary modelling framework together with model-specific packages, including glmnet, randomForest, xgboost, mgcv, kernlab, and rpart. Before model fitting, observations with missing values in the response variable or in any of the predictors required for the corresponding analysis were excluded. Consequently, models were trained using complete cases for the predictor set defined for each prediction phase. A Linear Model was fitted using ordinary least squares without hyperparameter tuning. Elastic Net was fitted using the glmnet framework, with the regularization parameters alpha and lambda selected during model tuning. Random Forest models were fitted using the randomForest framework, with mtry tuned during model training. XGBoost models were fitted using the XGBoost framework, with model-specific learning and complexity parameters defined within the tuning procedure. Generalized Additive Models were fitted using mgcv, whereas SVM was implemented with a radial basis function kernel using kernlab, with continuous predictors centered and scaled before model fitting. Model tuning was conducted within the cross-validation framework described below.
Predictive performance was evaluated using five-fold cross-validation at the individual-animal level. In each resampling iteration, approximately 80% of the available observations were used to fit the model, and the remaining 20% were used for validation. This procedure was repeated across the five folds so that each animal was used once for validation, and predictions generated for animals when they were not included in model fitting were retained as out-of-fold (OOF) predictions. Because folds were created at the animal level, pigs from the same source experiment could occur in both the training and validation folds. OOF predictions were used to calculate RMSE and R2. These metrics were interpreted as cross-validated predictive performance within the harmonized dataset rather than as evidence of generalization to independent experiments.
Variable importance was estimated using model-specific procedures and scaled within each model. Because the definition of importance differed among algorithms, absolute scores were not compared across modelling approaches. Only within-model predictor rankings were interpreted. These measures describe model-specific predictive contributions and do not establish biological importance or causal effects.
3. Results
3.1. Predictability of Relative Weight Gain During the Acute and Chronic Phases
In-sample performance metrics for all evaluated models are presented in Supplementary Table S1, while cross-validated results are summarized in Table 2. Differences between these metrics indicate potential model overfitting.
Table 2.
Cross-validated model performance in the acute (D0-7 days post-challenge) and chronic (D7-28 days post-challenge) phases (RMSE and R2).
During the acute phase (RWG7), XGBoost achieved the highest in-sample fit (R2 = 0.990; RMSE = 0.006), followed by Random Forest (R2 = 0.789; RMSE = 0.031). However, predictive performance declined under five-fold cross-validation, with R2 values ranging from 0.078 to 0.186 and RMSE values from 0.063 to 0.071. Among the evaluated models, the GAM achieved the highest cross-validated R2 (0.186), whereas XGBoost showed the lowest (0.078; Table 2).
During the chronic phase (RWG7–28), XGBoost also achieved the highest in-sample fit (R2 = 0.996; RMSE = 0.008), followed by Random Forest (R2 = 0.890; RMSE = 0.044). However, cross-validation revealed lower predictive performance across all models. Elastic Net and Linear Model achieved the highest cross-validated R2 values (0.420 and 0.419, respectively), both with an RMSE of 0.103. In contrast, XGBoost showed a cross-validated R2 of 0.214 and an RMSE of 0.122, while GAM achieved an R2 of 0.320. Support Vector Machine showed lower cross-validated performance than the best-performing models in both phases (Table 2).
Overall, the highest cross-validated R2 was greater during the chronic phase (0.420; Elastic Net) than during the acute phase (0.186; GAM). Higher cross-validated R2 values were observed during the chronic phase for GAM, Linear Model, Elastic Net, Random Forest, and XGBoost.
3.2. Predictors of Acute-Phase Relative Weight Gain
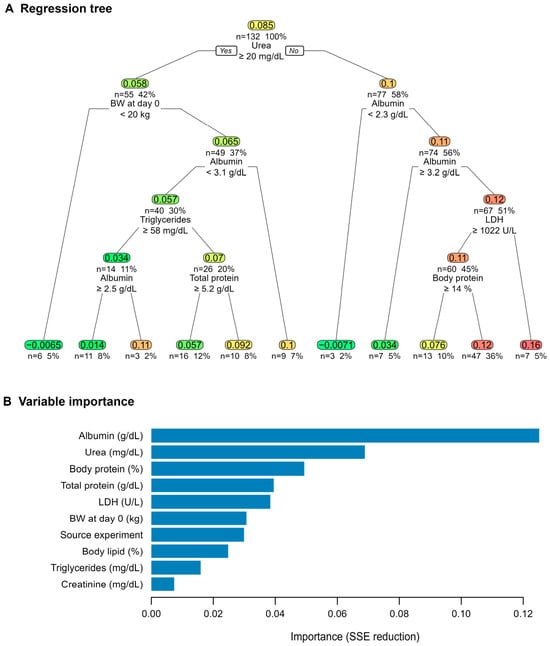
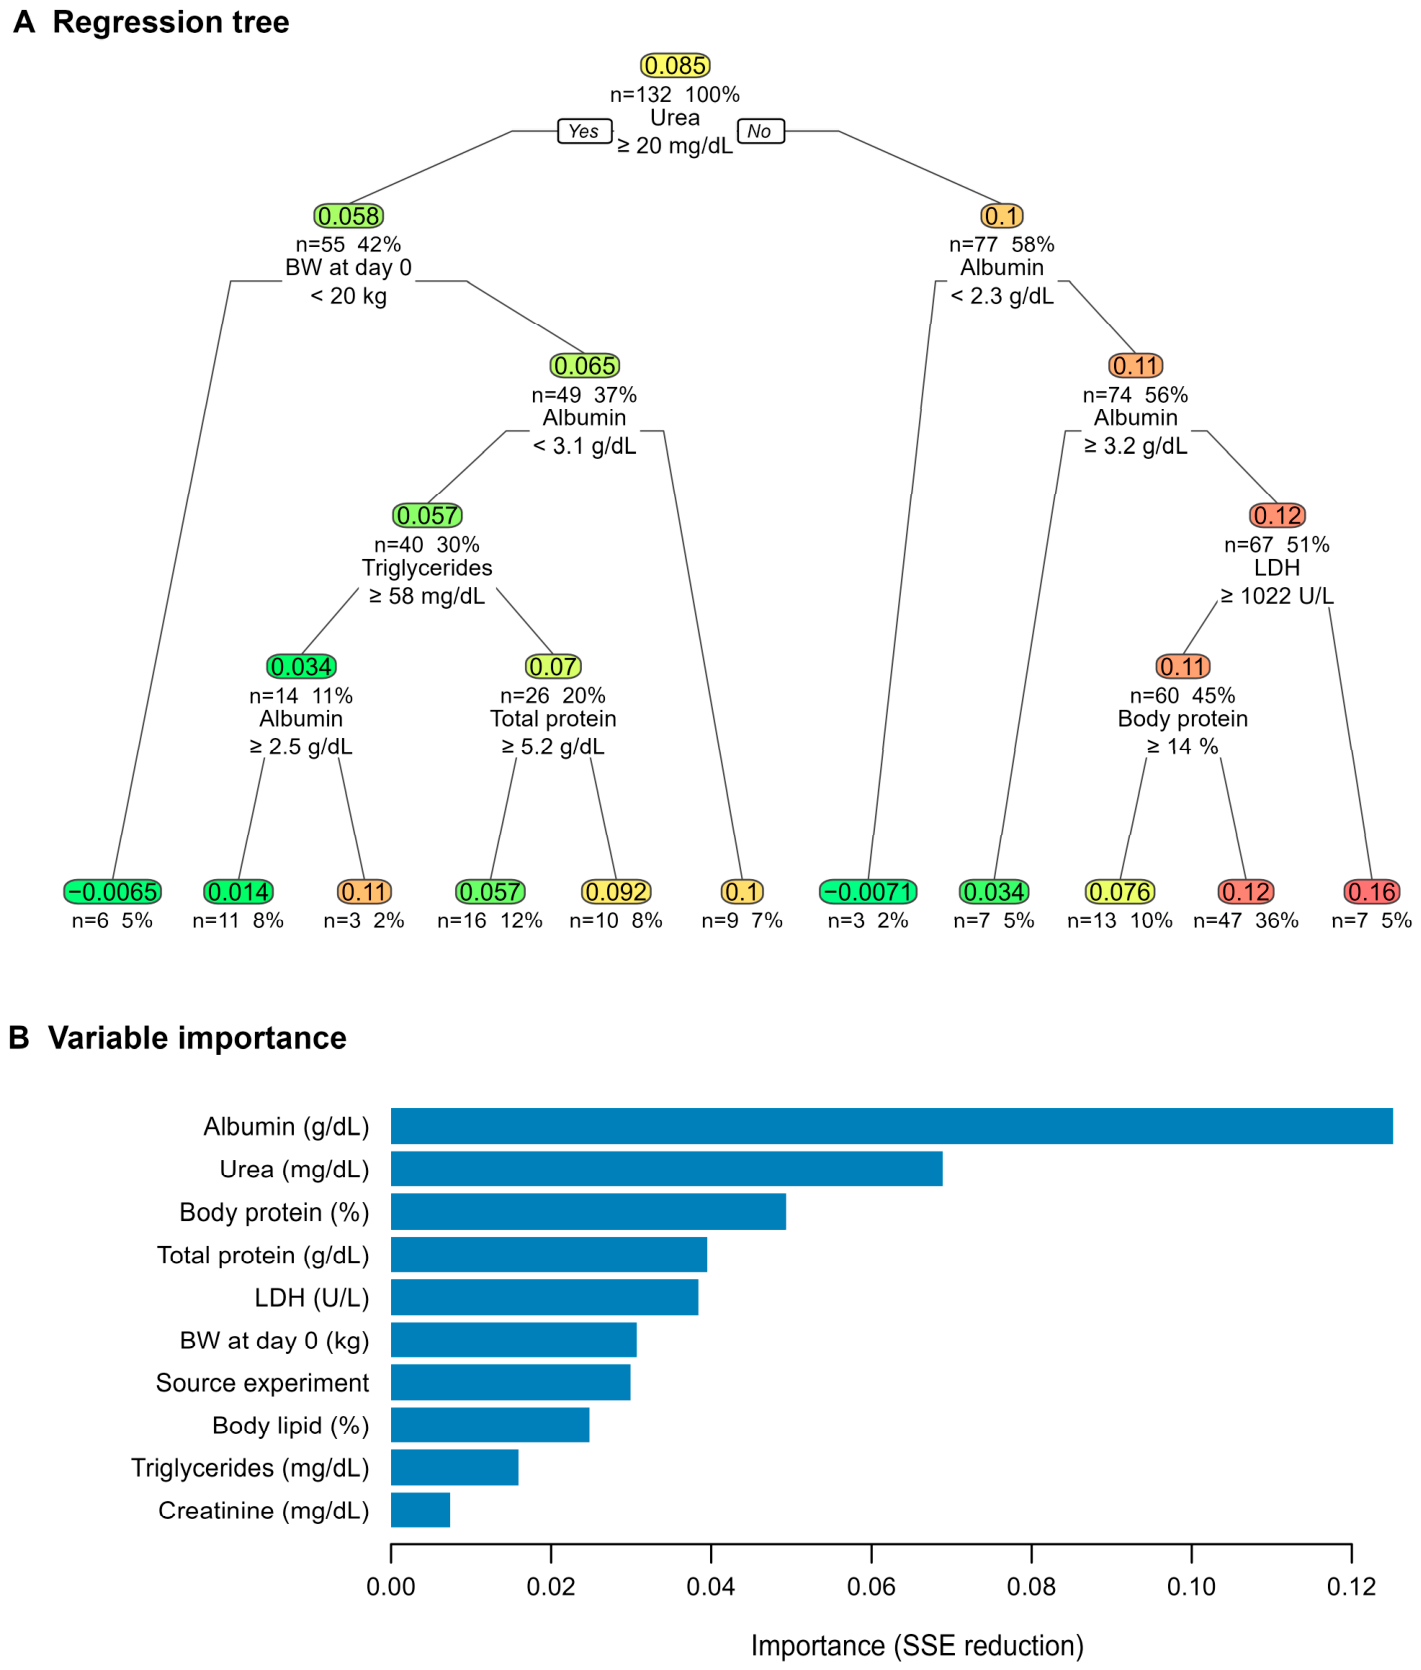
Single regression trees are sensitive to sample composition and splitting criteria and were therefore used primarily as exploratory and interpretative tools. Their results were examined alongside variable-importance analyses and the predictive performance of other machine learning models. During the acute phase (days 0–7 post-challenge), baseline urea concentration was selected as the first splitting variable, providing the greatest reduction in prediction error at the root node (Figure 1). Pigs with baseline urea concentrations ≥ 20 mg/dL were further partitioned according to body weight, albumin, triglycerides, and total protein concentrations, whereas those with lower urea concentrations were primarily stratified by albumin and LDH activity. These successive splits identified subgroups with different predicted relative weight gain values, reflecting hierarchical partitioning based on biochemical and growth-related variables. Variable-importance analysis of the regression tree identified baseline albumin concentration as the most influential predictor in reducing the overall sum of squared errors, followed by baseline urea concentration, body protein percentage, total protein concentration, and LDH activity. Baseline body weight and the source-experiment factor also contributed to model partitioning, whereas triglycerides and creatinine showed comparatively lower importance.
Figure 1.
(A) Exploratory regression tree for acute-phase relative weight gain (RWG7; days 0–7 post-challenge). Nodes display the estimated RWG7 and the number and percentage of pigs, with colors ranging from green (lower values) to red (higher values). (B) Corresponding variable importance based on the reduction in the sum of squared errors (SSE). The analysis included 132 pigs.
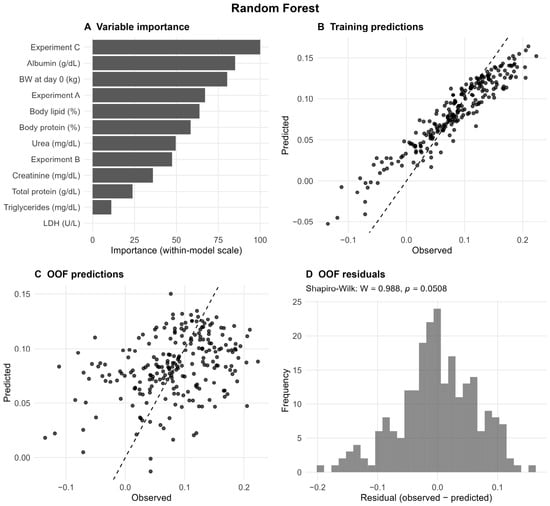
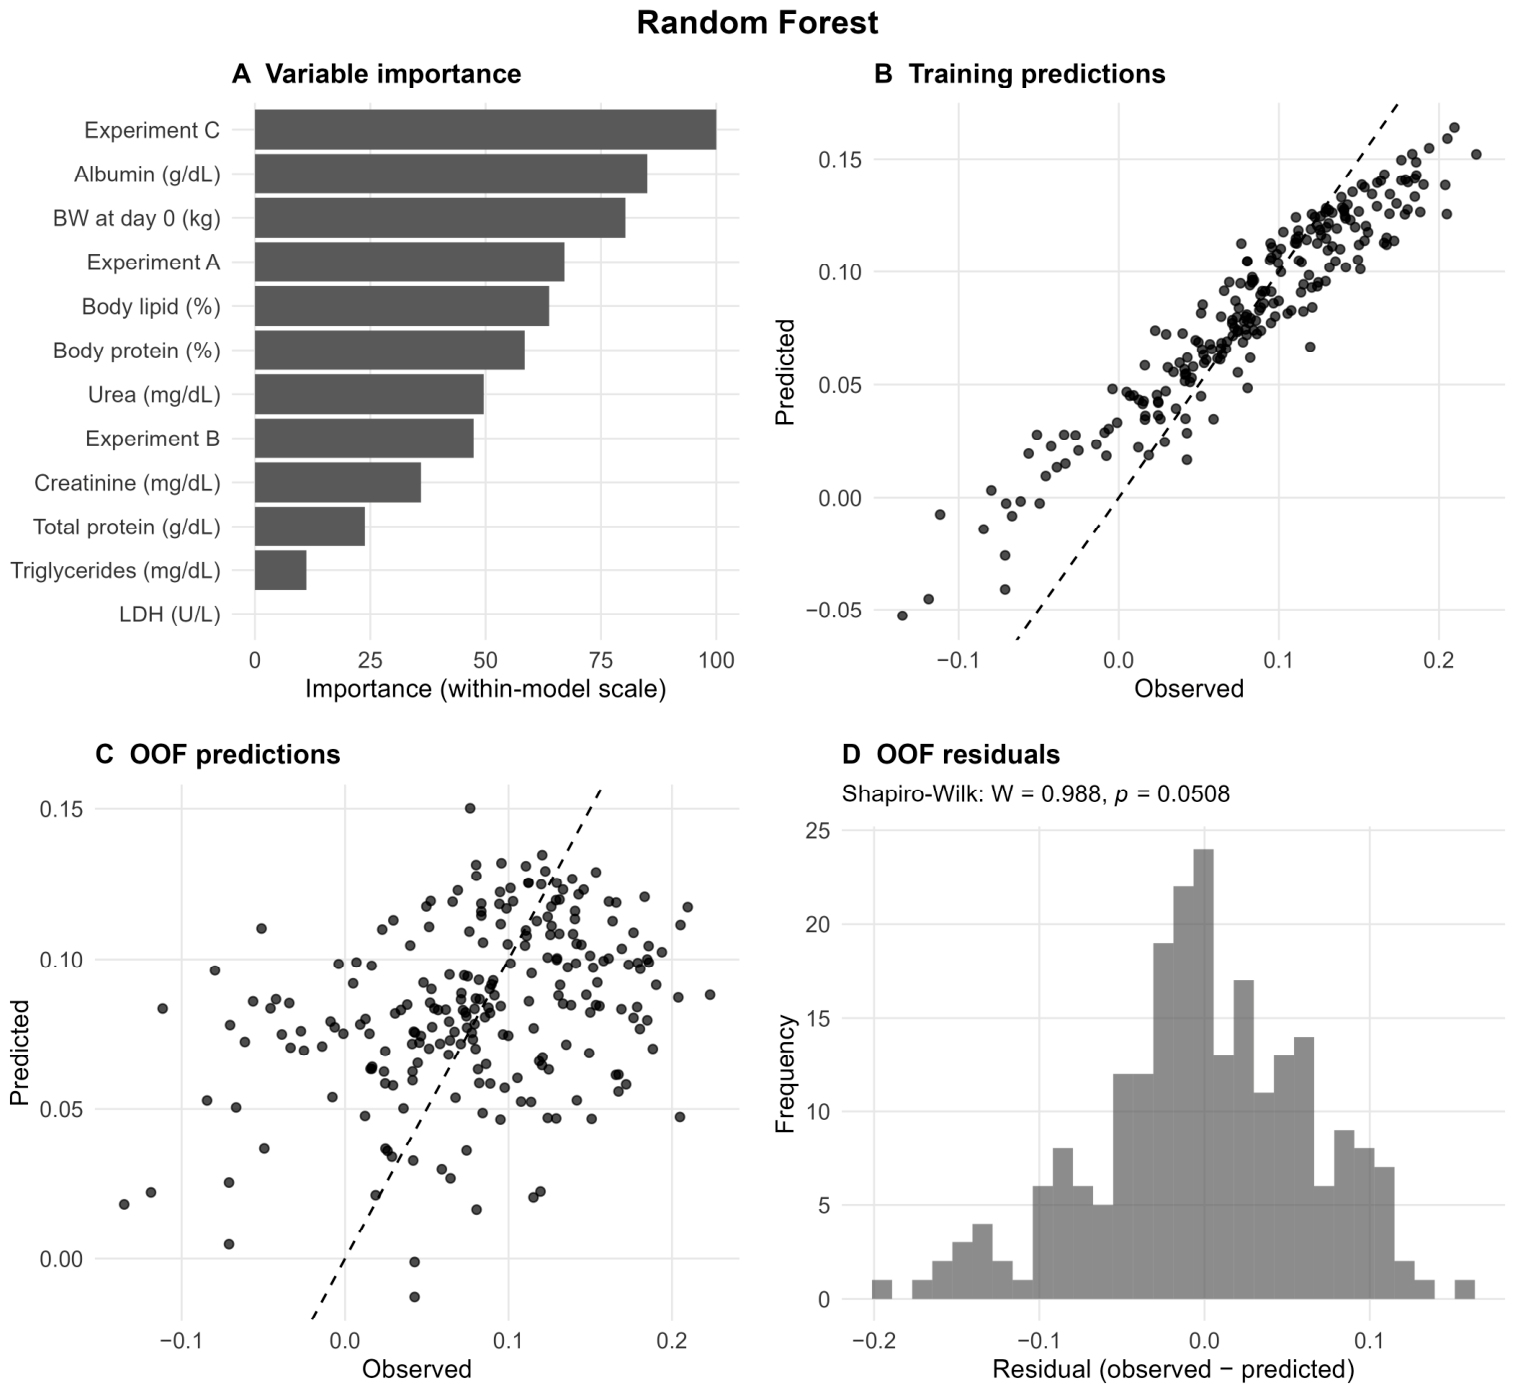
In the Random Forest model, variable-importance analysis identified the source-experiment indicator corresponding to Arnaut et al. [12] as the most influential predictor, followed by baseline albumin concentration and body weight. Other important predictors included the source-experiment indicators corresponding to França et al. [13,14], body lipid and protein percentages, and baseline serum concentrations of urea, creatinine, total protein, and triglycerides (Figure 2).
Figure 2.
Random Forest panel for the acute phase using RWG7 as the response variable, including variable importance, training and out-of-fold (OOF) observed-versus-predicted plots, and out-of-fold residual distribution. Source experiments A, B, and C correspond to França et al. (2024) [13], França et al. (2026) [14], and Arnaut et al. (2025) [12], respectively.
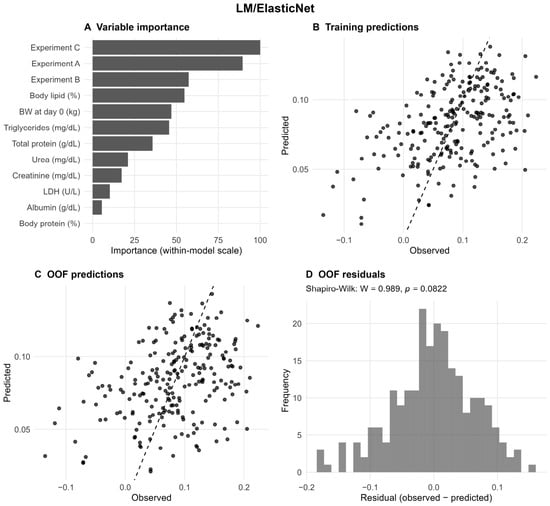
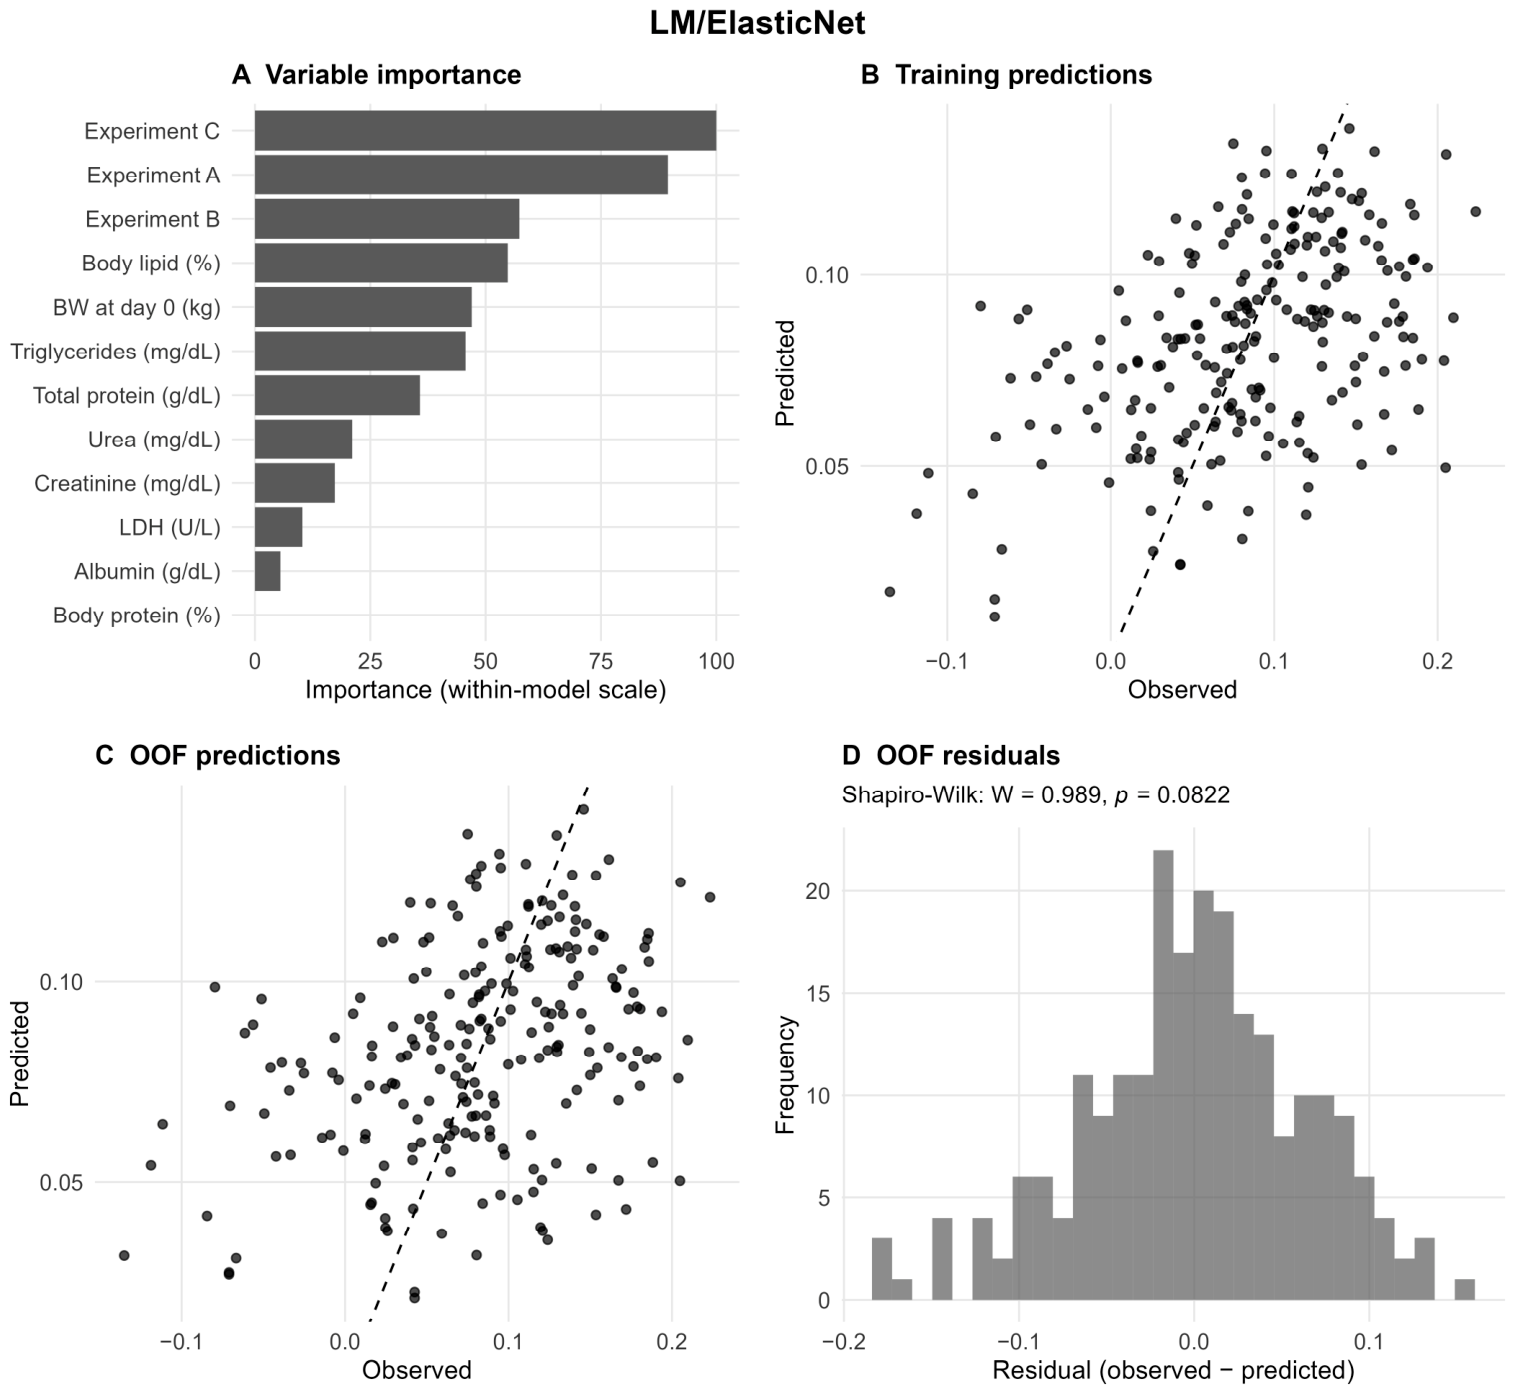
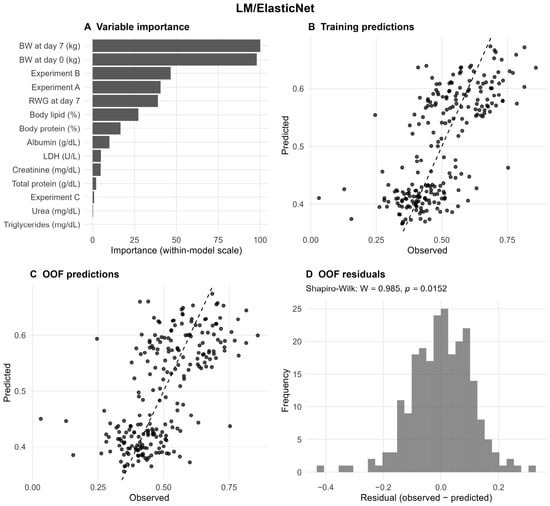
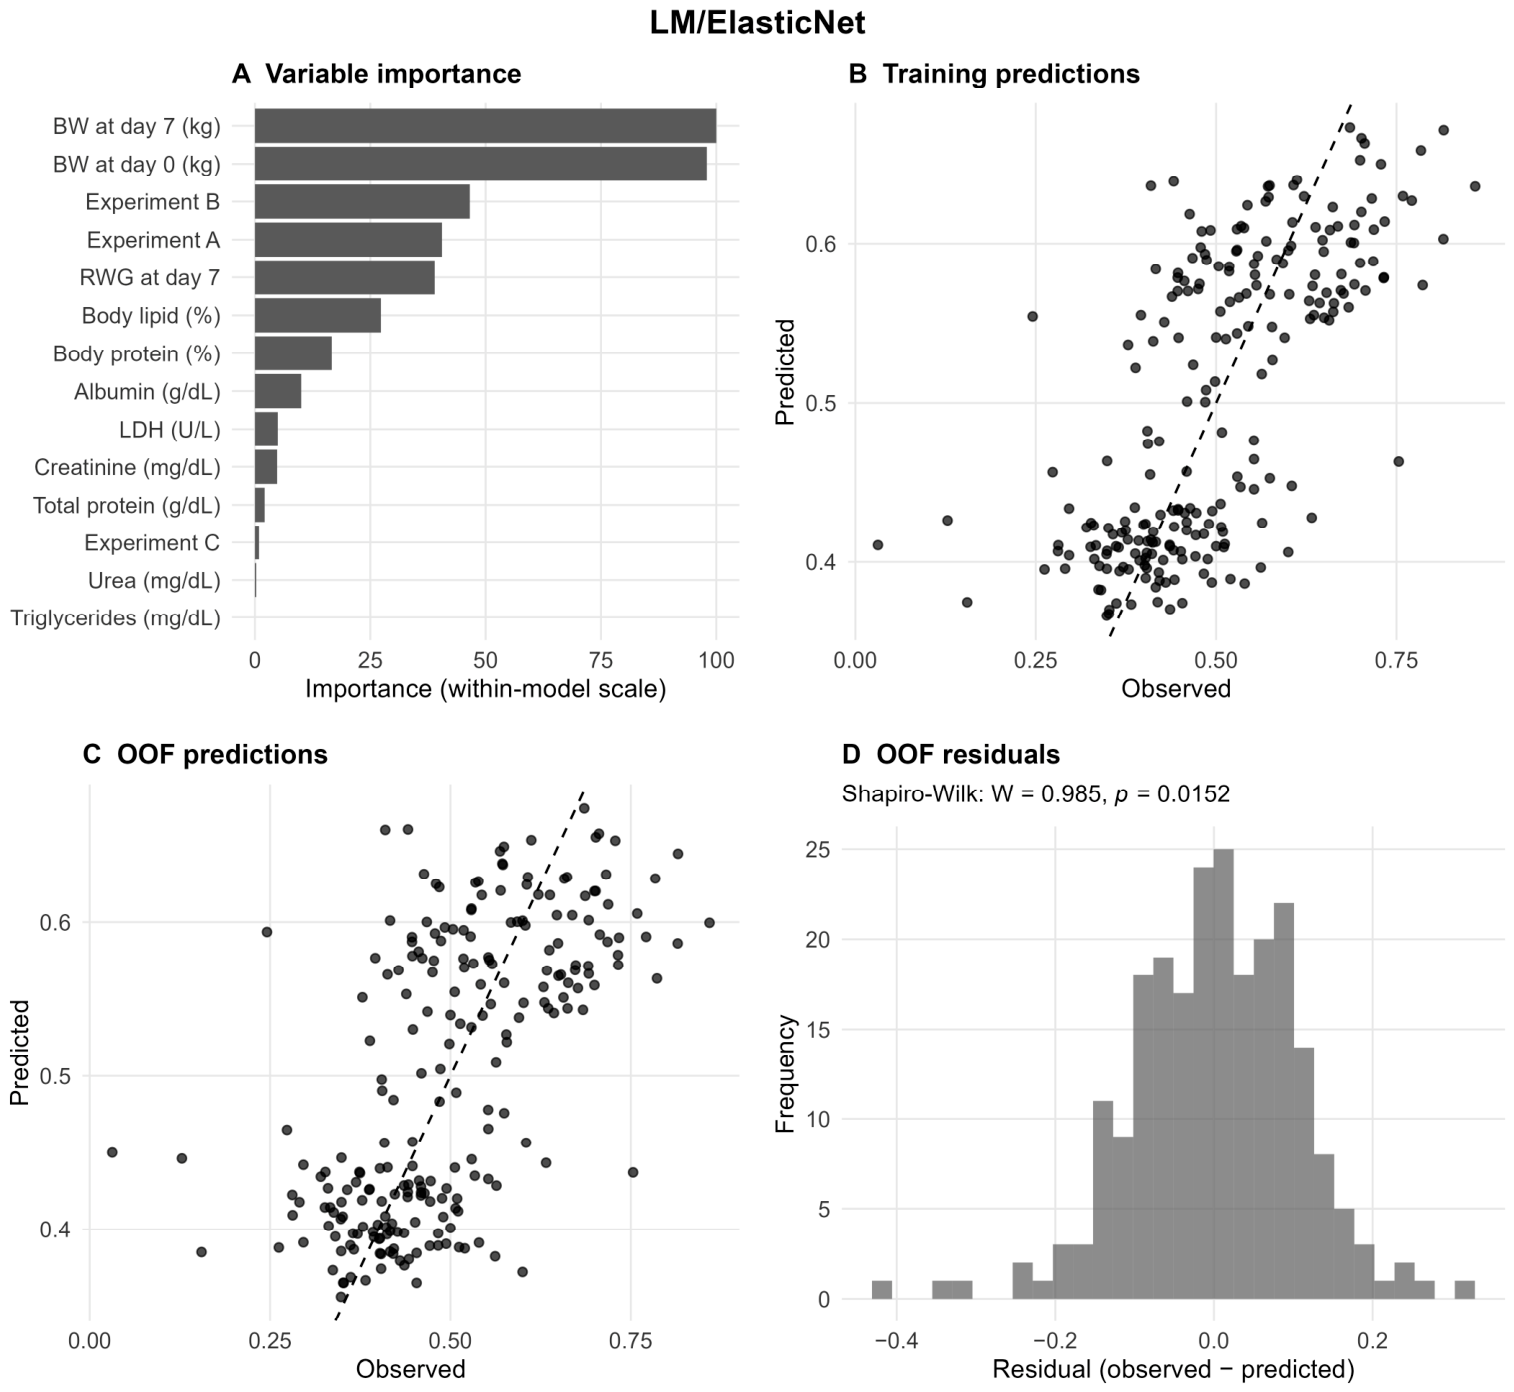
For the Linear Model and Elastic Net, variable-importance analysis identified Arnaut et al. [12], França et al. [13], and França et al. [14] as the most influential predictors in both models. Among the biological variables, percentage of body lipid, baseline body weight, and baseline concentrations of triglycerides, total protein, urea, creatinine, LDH, and albumin also showed relatively high importance (Figure 3).
Figure 3.
Linear Model and Elastic Net panels for the acute phase using RWG7 as the response variable, including variable importance, training and out-of-fold (OOF) observed versus predicted plots, and out-of-fold residual distribution. Source experiments A, B, and C correspond to França et al. (2024) [13], França et al. (2026) [14], and Arnaut et al. (2025) [12], respectively.
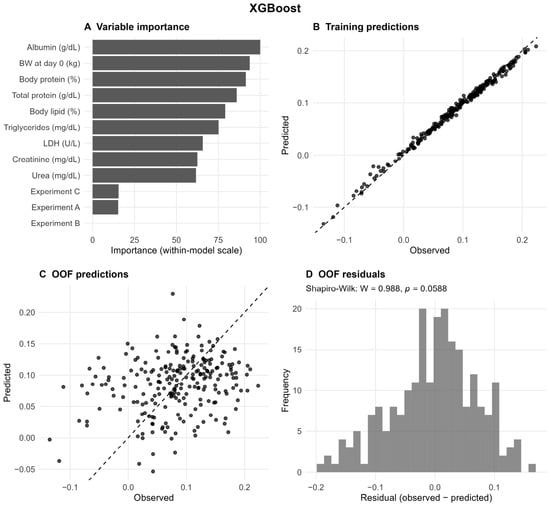
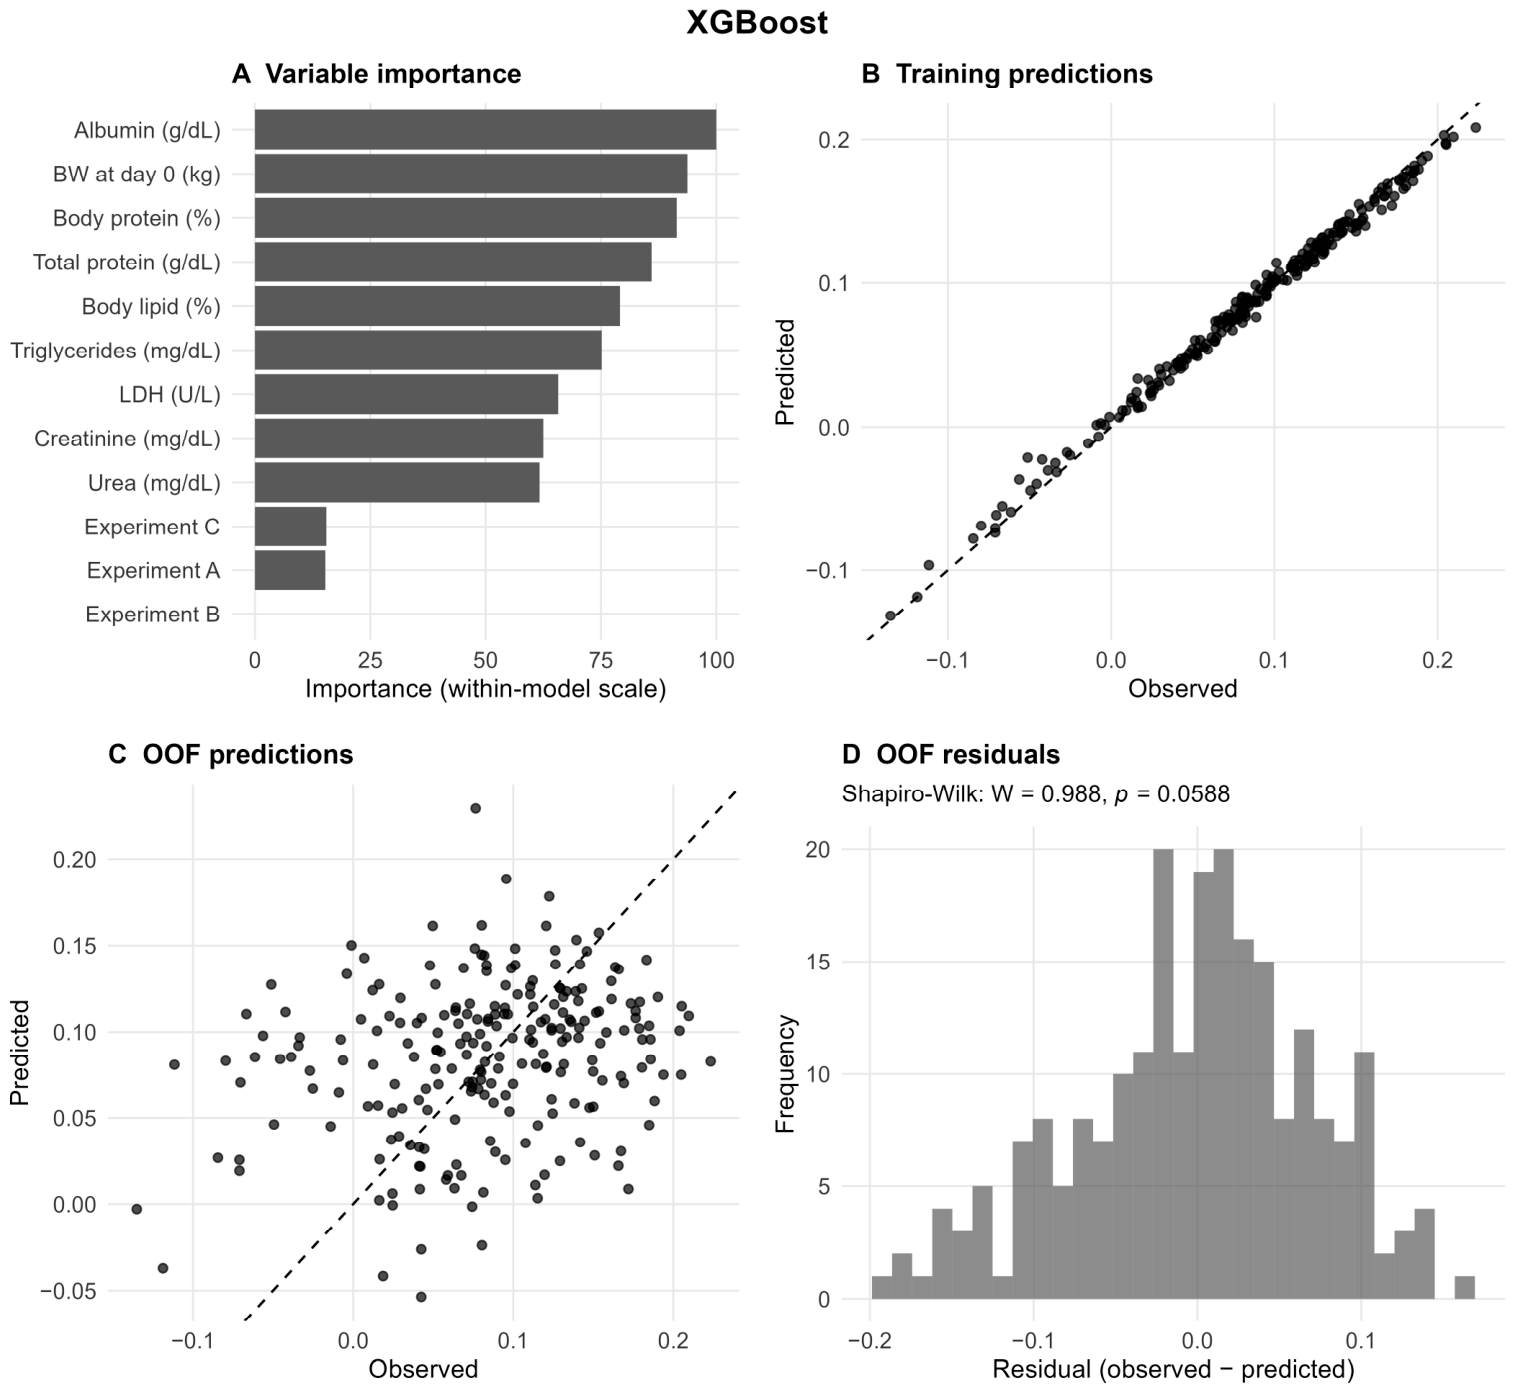
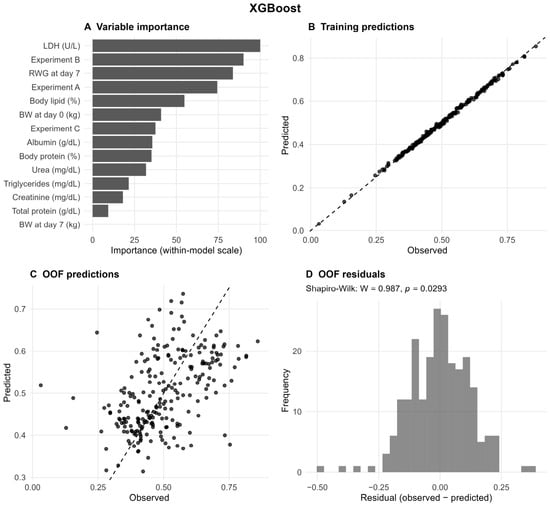
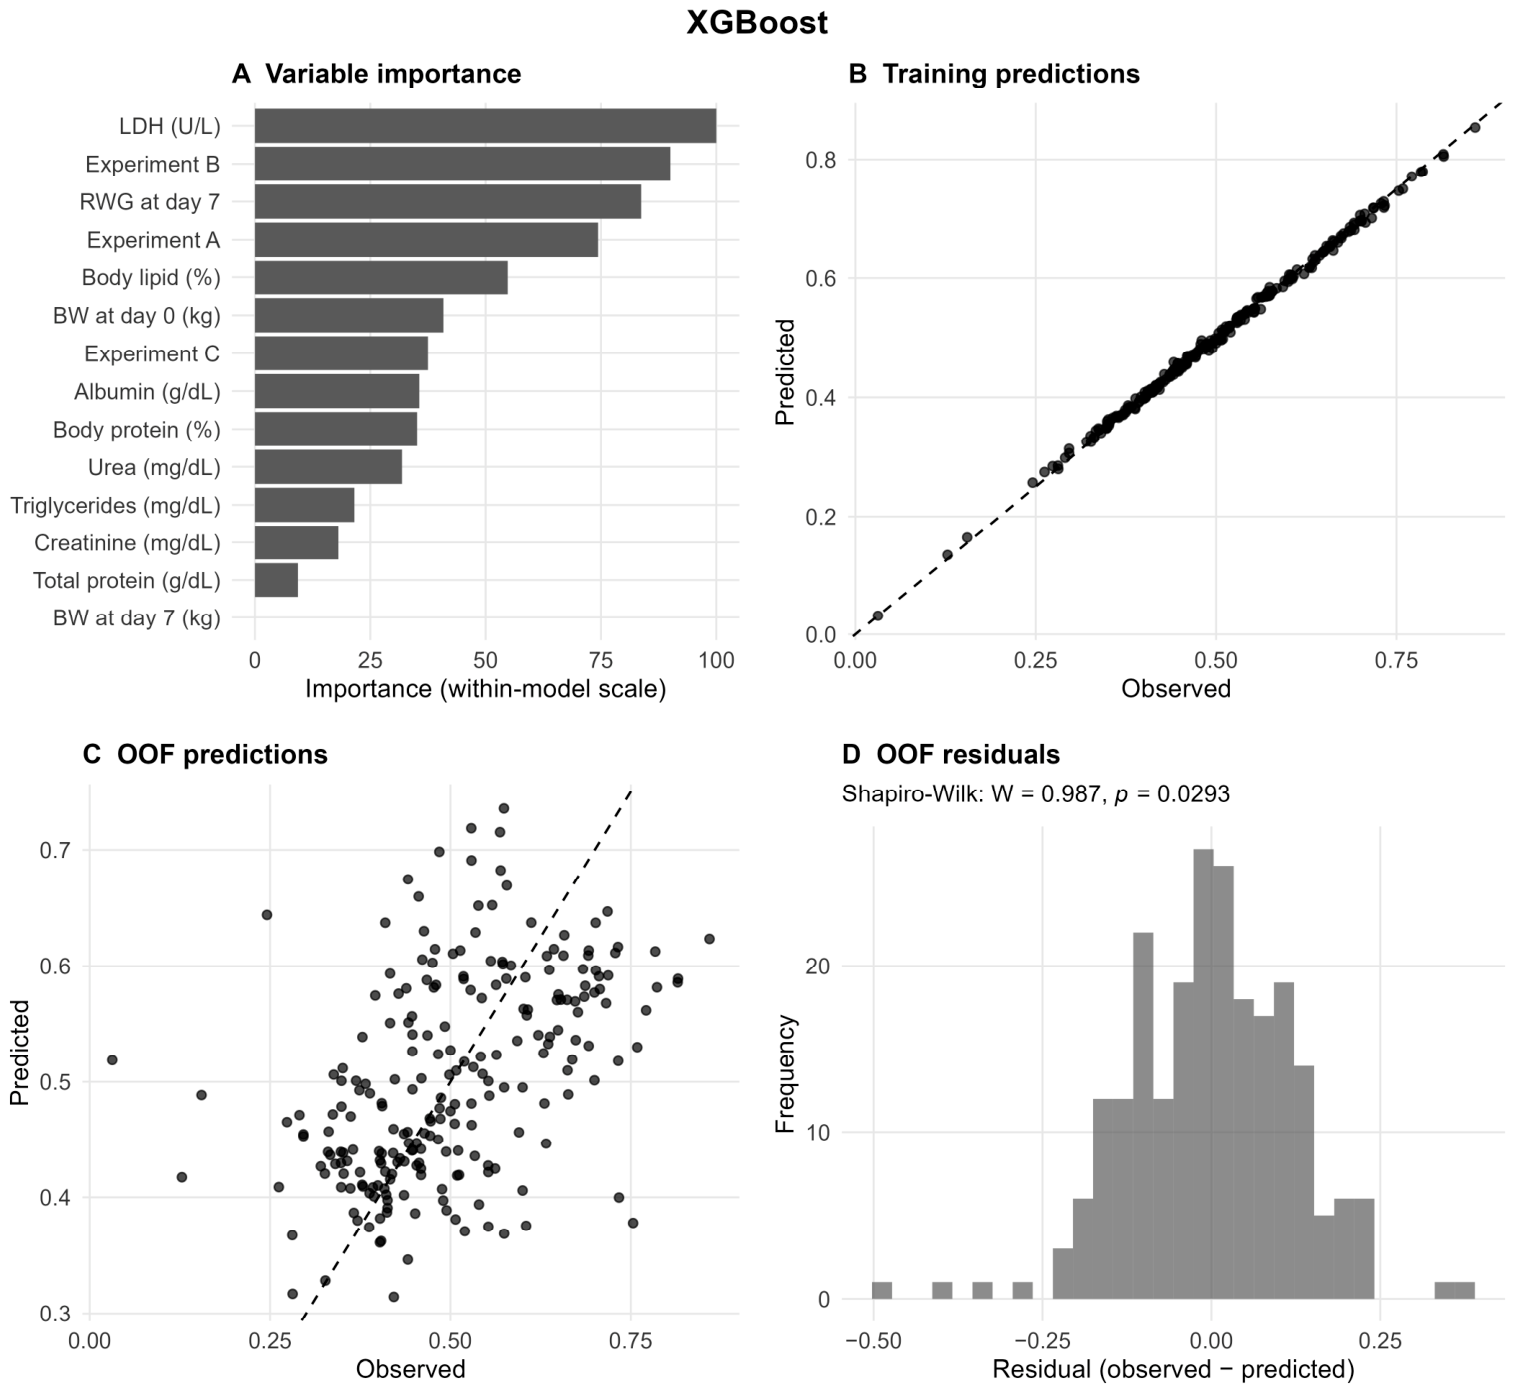
Variable-importance analysis of the XGBoost model identified baseline albumin concentration as the most influential predictor, followed by baseline body weight, body protein percentage, baseline total protein concentration, body lipid percentage, baseline triglyceride concentration, LDH activity, and baseline creatinine and urea concentrations. Source-experiment indicators showed comparatively lower importance scores (Figure 4).
Figure 4.
XGBoost panel for the acute phase using RWG7 as the response variable, including variable importance, training and out-of-fold (OOF) observed vs. predicted plots, and out-of-fold residual distribution. Source experiments A, B, and C correspond to França et al. (2024) [13], França et al. (2026) [14], and Arnaut et al. (2025) [12], respectively.
Predictor-importance rankings varied across algorithms. Baseline albumin concentration and body weight consistently emerged as important predictors in tree-based models, whereas source-experiment indicators showed relatively high importance in Random Forest, Linear Model, and Elastic Net.
3.3. Predictors of Chronic-Phase Relative Weight Gain
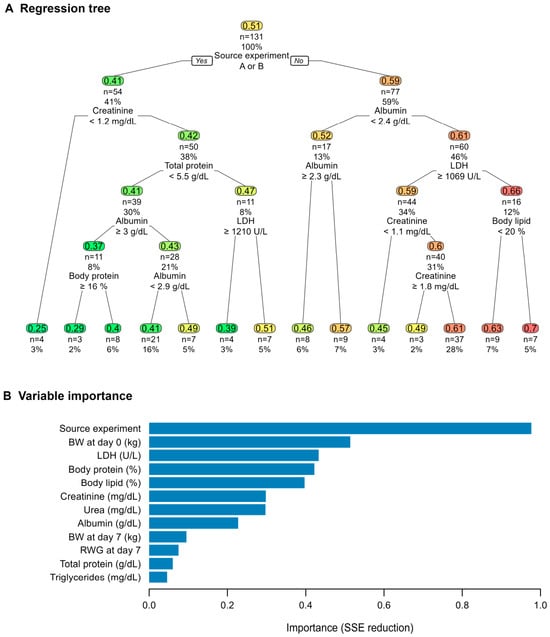
The regression tree for the chronic phase (7–28 days post-challenge) identified experiment as the primary splitting variable (Figure 5). Subsequent splits were based on creatinine, albumin, LDH, total protein, and body protein and lipid percentages, generating subgroups with distinct predicted relative weight gain values. Pigs allocated to the right branch of the tree exhibited higher predicted relative weight gain values than those allocated to the left branch. Within each branch, additional splits based on biochemical and body composition variables further partitioned pigs into terminal nodes with different predicted values. The variable-importance analysis ranked experiment as the most important predictor, followed by baseline body weight, LDH, percentage of body protein, percentage of body lipid, creatinine, urea, albumin, body weight at day 7, RWG7, total protein, and triglycerides.
Figure 5.
(A) Exploratory regression tree for chronic-phase relative weight gain (RWG7–28; days 7–28 post-challenge). Nodes display the estimated RWG7–28 and the number and percentage of pigs, with colors ranging from green (lower values) to red (higher values). Source experiments A and B correspond to França et al. (2024) [13] and França et al. (2026) [14], respectively. (B) Corresponding variable importance based on the reduction in the sum of squared errors (SSE). The analysis included 131 pigs.
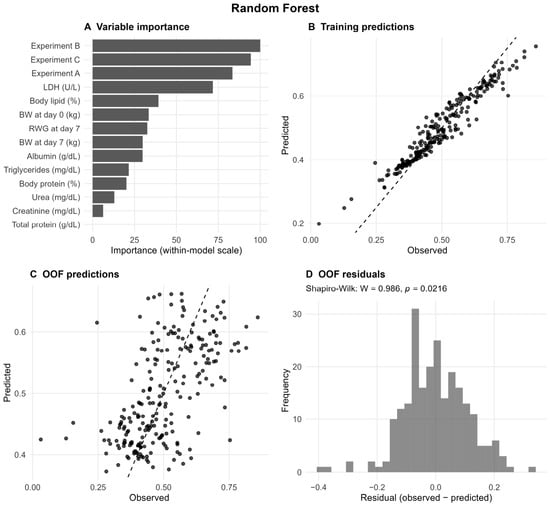
In the Random Forest model, variable-importance analysis ranked França et al. [14], Arnaut et al. [12], and França et al. [13] as the most influential predictors, followed by baseline LDH activity and percentage of body lipid (Figure 6).
Figure 6.
Random Forest panel for the chronic phase using RWG7–28 as the response variable, including variable importance, training and out-of-fold (OOF) observed-versus-predicted plots, and out-of-fold residual distribution. Source experiments A, B, and C correspond to França et al. (2024) [13], França et al. (2026) [14], and Arnaut et al. (2025) [12], respectively.
For the Linear Model and Elastic Net, variable-importance analysis identified body weight at days 0 and 7, França et al. [14], França et al. [13], and RWG7 as the most influential predictors. Additional variables with moderate importance included percentage of body lipid, percentage of body protein, baseline albumin, LDH, creatinine, total protein, urea, and triglyceride concentrations (Figure 7).
Figure 7.
Linear Model and Elastic Net panels for the chronic phase using RWG7–28 as the response variable, including variable importance, training and out-of-fold (OOF) observed versus predicted plots, and out-of-fold residual distribution. Source experiments A, B, and C correspond to França et al. (2024) [13], França et al. (2026) [14], and Arnaut et al. (2025) [12], respectively.
In the XGBoost model, variable-importance analysis identified baseline LDH activity, França et al. [14], RWG7, and França et al. [13] as the most influential predictors. Additional variables with relatively high importance included percentage of body lipid, baseline body weight, Arnaut et al. [12], baseline albumin concentration, percentage of body protein, baseline urea concentration, baseline triglyceride concentration, baseline creatinine concentration, and body weight at day 7 (Figure 8).
Figure 8.
XGBoost panel for the chronic phase using RWG7–28 as the response variable, including variable importance, training and out-of-fold (OOF) observed vs. predicted plots, and out-of-fold residual distribution. Source experiments A, B, and C correspond to França et al. (2024) [13], França et al. (2026) [14], and Arnaut et al. (2025) [12], respectively.
Experiment-related predictors were prominent across the chronic-phase analyses, although their rankings differed among algorithms. Baseline LDH was particularly influential in Random Forest and XGBoost, whereas body weight and early growth information were prominent in the Linear Model and Elastic Net. RWG7 also ranked among the most influential predictors in XGBoost.
4. Discussion
The present study investigated whether consistent predictive patterns for relative weight gain could be identified within a harmonized dataset derived from independent experiments conducted with growing–finishing pigs subjected to a common Salmonella Typhimurium challenge protocol. We hypothesized that model predictive performance for relative weight gain would differ between the acute and chronic post-challenge phases because early growth may be influenced by rapidly changing inflammatory and metabolic responses, whereas later performance may reflect the cumulative consequences of immune activation and metabolic reallocation over time [17]. Regardless of the modeling approach, internal cross-validated predictive performance was generally low during the acute phase and higher during the chronic phase. However, this comparison should be interpreted in the context of the different predictor information sets available at the beginning of each phase.
These findings are conceptually consistent with those of Le Floc’h et al. [18], who reported that immune and metabolic indicators explained a substantial proportion of the interindividual variation in pig growth under sanitary challenge. Their study identified variables related to inflammation, antioxidant capacity, amino acid metabolism, and energy mobilization as relevant contributors to relative average daily gain. Despite differences in analytical approach and predictor availability, both studies support the interpretation of growth under sanitary challenge as an integrated phenotype involving immune activation, metabolic regulation, and nutrient partitioning.
One of the most consistent findings was the recurrent contribution of baseline albumin to prediction across several modelling approaches. Albumin is a negative acute-phase protein whose hepatic synthesis may decrease during systemic inflammation as amino acids and hepatic synthetic capacity are redirected toward positive acute-phase proteins and other immune-related functions [19]. Consequently, circulating albumin concentrations may reflect the balance among inflammatory burden, hepatic protein metabolism, and metabolic homeostasis [20]. Associations between albumin status and productive growth performance under sanitary challenge have also been reported by Le Floc’h et al. [18]. Therefore, albumin may represent an integrated marker of inflammatory and metabolic status contributing to the predictive signal. However, variable-importance rankings do not establish causality.
Blood urea concentration also contributed to prediction across multiple models. Circulating urea reflects amino acid catabolism and the disposal of nitrogen that is not retained for protein synthesis [21]. During immune activation, amino acids may be redirected from muscle protein deposition toward acute-phase protein synthesis, immune-cell proliferation, and tissue repair [22]. Therefore, variation in circulating urea may reflect differences in amino acid utilization efficiency, nitrogen metabolism, dietary amino acid supply, and protein deposition among pigs [23], although the present analysis cannot determine which of these processes primarily explained its predictive contribution. Because the source experiments evaluated different nutritional strategies, the predictive contribution of urea should not be attributed exclusively to immune activation. Likewise, the urea threshold identified by the regression tree should be interpreted as a sample-specific predictive partition rather than as a physiological reference value.
LDH was also repeatedly ranked among the influential predictors. Circulating LDH is a nonspecific indicator of tissue injury [24]. LDH also participates in cellular lactate metabolism, which is involved in inflammatory responses [25]. However, serum LDH activity does not directly identify these intracellular processes. Nevertheless, because LDH activity was not separated according to tissue-specific isoenzymes, its predictive contribution cannot be attributed to a particular tissue or physiological pathway.
Body protein and lipid percentages were repeatedly ranked among the influential predictors across the evaluated modelling approaches, indicating that pre-existing body composition contributed to the prediction of post-challenge growth. These variables may reflect differences in nutritional status, physiological maturity, nutrient partitioning, and the relative availability of tissues and energy reserves to support maintenance, immune function, and tissue accretion. This interpretation is consistent with the concept that body composition reflects previously accumulated metabolic resources that may influence the allocation of nutrients between immune defense and tissue accretion during prolonged sanitary challenge [26]. Previous studies have similarly indicated that body reserves may affect resource allocation between immune function and growth, particularly during prolonged immune stimulation [27,28]. Nevertheless, body protein and lipid percentages are interrelated descriptors of body composition and should not be interpreted as independent causal effects. Their recurrent importance indicates that physiological and nutritional status contributed to prediction but does not demonstrate that greater protein or lipid reserves improved growth during immune activation.
The limited predictive performance during the acute phase likely reflects both the rapid temporal dynamics of the early response to ST infection and substantial interindividual heterogeneity. During the first days after inoculation, pigs undergo marked inflammatory, immunological, and metabolic adjustments, and the magnitude and timing of these responses may differ considerably among individuals [1,29]. Activation of the innate immune response promotes nutrient redistribution, diverting amino acids and energy from lean tissue accretion toward acute-phase protein synthesis, maintenance of intestinal barrier integrity, antioxidant defense, and immune-cell activity [15,19].
Growth during the first post-challenge week therefore represents a highly dynamic phenotype influenced by events occurring after inoculation. Le Floc’h et al. [18] identified associations between changes in blood biomarkers over the first three weeks and relative average daily gain over six weeks under contrasted sanitary conditions. Although the pre-challenge condition of the pigs may have influenced their ability to cope with the subsequent challenge, the low cross-validated performance for RWG7 indicates that the day-0 variables considered in this study contained limited prognostic information when evaluated collectively.
Even under controlled experimental conditions, pigs may differ in intestinal colonization, pathogen shedding, immune activation, metabolic adaptation, clinical expression, and subsequent growth response [2,3]. This heterogeneity increases biological noise and reduces the consistency of the relationships between pre-challenge variables and subsequent growth [30]. Future studies could assess dynamic prediction approaches in which measurements collected at prespecified post-challenge landmark times are used to predict subsequent, non-overlapping growth intervals.
The chronic-phase prediction task showed higher internal cross-validated R2 than the acute-phase task. However, this difference cannot be attributed solely to greater biological predictability of the chronic phase. Chronic-phase models additionally incorporated BW7 and RWG7, which contain information on the pig’s initial response to the challenge. Their higher predictive performance may therefore reflect both differences in growth responses between periods and the additional information available at day 7. The present analysis does not isolate these contributions. Although growth from days 7 to 28 may reflect aspects of adaptation and recovery under continued sanitary pressure, the superior performance of the chronic-phase models should not be interpreted solely as evidence of greater physiological stability or resilience. Resilience is a dynamic trait that involves both the response to perturbation and the capacity to return toward an expected or pre-challenge state [31,32]. Because recovery trajectories and return to baseline were not formally quantified, RWG7–28 should not be considered a validated resilience phenotype.
The Linear Model and Elastic Net achieved the highest internal cross-validated performance during the chronic phase, whereas the more flexible Random Forest and XGBoost algorithms showed considerably larger discrepancies between apparent and out-of-fold performance. The high in-sample fit of these flexible models, followed by a marked decline in performance under cross-validation, indicates that they captured patterns specific to the training data. For acute-phase XGBoost, the discrepancy between the in-sample R2 of 0.990 and the cross-validated R2 of 0.078 indicates substantial overfitting [33]. Therefore, the high in-sample fit should not be interpreted as evidence of predictive ability, which was limited under internal cross-validation.
This pattern may reflect approximately additive predictor-outcome relationships, but it may also result from the moderate sample size, correlation among predictors, between-experiment heterogeneity, and the higher variance of more flexible algorithms. Therefore, the present results do not demonstrate that true biological relationships were exclusively linear; rather, they indicate that the Linear Model and Elastic Net achieved the highest internal cross-validated performance during the chronic phase for the available dataset.
The prominent contribution of the source-experiment factor, particularly during the chronic phase, requires careful interpretation. Rather than representing a biological determinant of growth, this variable likely captured systematic differences among the source experiments. Despite the use of a common ST challenge protocol, the source trials differed in several trial-level characteristics, including sex, initial body weight, nutritional strategy, management, environmental conditions, season, and potentially microbial pressure. Because these characteristics were partially confounded with the source experiment, their individual contributions could not be disentangled. The importance of the experiment factor therefore reflects the hierarchical and heterogeneous structure of the integrated dataset rather than a direct physiological mechanism. Nevertheless, its recurrent contribution across algorithms highlights the need to account for trial-level heterogeneity when integrating independent experiments for predictive modeling. Unmeasured biological and experimental sources of variation may also have remained after harmonization of the major procedures and variables.
Several limitations should be considered when interpreting these findings. First, cross-validation was performed at the individual-animal level, allowing pigs from the same source experiment to occur in both training and validation folds. The models may therefore have benefited from experiment-specific patterns represented in the training data, and the reported performance should be interpreted as internal predictability within the harmonized dataset rather than transportability to independent experiments. Second, the partial confounding between the source experiment and trial-level characteristics precluded attribution of model performance or variable importance to specific experimental conditions. Third, variable-importance rankings were algorithm-dependent and were interpreted only within each model. The recurrence of a predictor across algorithms was considered a descriptive finding rather than evidence of comparable importance scores or greater biological relevance. Correlated predictors may also have shared or redistributed importance within a model. No permutation importance or SHAP analyses with uncertainty estimates were performed, which limits the assessment of the stability of predictor rankings. Finally, the analyses were limited by the variables consistently available across the source studies. Several potentially informative indicators, including inflammatory cytokines, pathogen load, oxidative-status markers, and clinical signs, were not measured consistently across experiments and therefore could not be evaluated systematically. Feed intake measured during the prediction interval was deliberately excluded because it was collected concurrently with the relative weight-gain outcome rather than being available at the beginning of the prediction window.
Beyond predictive performance, the present study illustrates the potential of machine learning approaches for integrating complex biological datasets and prioritizing candidate variables associated with pig growth performance under sanitary challenge. These methods should be viewed as complementary to conventional statistical analyses rather than as replacements for hypothesis-driven inference. In the present context, machine learning enabled the comparison of alternative predictive structures and the identification of variables that repeatedly contributed to prediction across algorithms. Nevertheless, the identified biomarkers and predictor rankings require confirmation in independent datasets and should not yet be interpreted as validated decision-support variables. Future studies using larger and more diverse populations, experiment-held-out validation, longitudinal biological measurements, and external commercial data will be necessary before these models can support applications in precision livestock farming.
5. Conclusions
This cross-experiment machine learning analysis suggests that the internal predictability of relative weight gain in Salmonella Typhimurium-challenged growing–finishing pigs differs between post-challenge periods evaluated with different predictor information sets. Relative weight gain during the acute phase showed limited internal predictability, potentially because baseline variables did not capture the dynamic responses that were developed following the challenge. In contrast, chronic-phase relative weight gain showed a stronger internal predictive signal. However, this difference likely reflected both biological differences between phases and the availability of predictors measured closer to the chronic growth interval. Among the evaluated predictors, biochemical markers related to protein metabolism and inflammatory status, including albumin, urea, and lactate dehydrogenase, together with body composition variables, consistently contributed to the prediction of relative weight gain. These findings highlight variables related to metabolic status and body composition as candidate predictors of post-challenge growth performance, without establishing their causal roles. The Linear Model and Elastic Net achieved the highest internal cross-validated performance during the chronic phase. Overall, the present study suggests that integrating machine learning approaches with controlled experimental datasets can improve the identification of candidate predictors of pig growth performance and supports a hypothesis-generating framework for future studies aimed at developing predictive tools for precision livestock farming under sanitary challenge.
Supplementary Materials
The following supporting information can be downloaded at https://www.mdpi.com/article/10.3390/vetsci13111139/s1, Table S1: Training performance of the machine learning models evaluated during the acute and chronic post-challenge phases.
Author Contributions
Conceptualization, G.M.G., M.V., I.A., A.Z.F., M.K. and L.H.; methodology, I.F., P.R.A., G.A.d.C.V., A.Z.F. and L.H.; software, M.V.; validation, G.M.G. and M.V.; formal analysis, G.M.G. and M.V.; investigation, I.F., P.R.A. and G.A.d.C.V.; resources, L.H.; data curation, G.M.G., I.F., P.R.A. and G.A.d.C.V.; writing—original draft preparation, G.M.G.; writing—review and editing, M.V., I.A., A.Z.F., M.K., I.F., P.R.A., G.A.d.C.V. and L.H.; visualization, G.M.G. and M.V.; supervision, I.A., A.Z.F., M.K. and L.H.; project administration, L.H.; funding acquisition, L.H. All authors have read and agreed to the published version of the manuscript.
Funding
This work was supported by the São Paulo Research Foundation (FAPESP, São Paulo, Brazil, grant number 2018/15559–7), and Brazilian National Council for Scientific and Technological Development (CNPq, Federal District, Brazil, grants number 408287/2021–7, and 442675/2023–2).
Institutional Review Board Statement
The animal study protocols corresponding to the source experiments included in this harmonized database were approved by the Ethical Committee on Animal Use (CEUA) of the School of Agricultural and Veterinary Sciences, São Paulo State University (UNESP/FCAV), Jaboticabal, SP, Brazil, in accordance with the Brazilian National Council for the Control of Animal Experimentation (CONCEA). The applicable protocol numbers and dates were 4784/20, 10 December 2020; 0607/22, 18 April 2022; and 2296/21, 28 October 2021. Protocol 2296/21 covered the experiments reported in França et al. [13,14].
Informed Consent Statement
Not applicable. The study used data from controlled experimental trials conducted with research animals under protocols approved by the institutional Ethical Committee on Animal Use; privately owned animals were not enrolled in the present study.
Data Availability Statement
The data analyzed in this study were derived from the source experiments cited in references [11,12,13,14]. The harmonized dataset supporting the findings of the present study is available from the corresponding author upon reasonable request, subject to applicable institutional and data-sharing restrictions.
Acknowledgments
The authors gratefully acknowledge the financial support provided by the São Paulo Research Foundation (FAPESP), the Brazilian National Council for Scientific and Technological Development (CNPq), and the Coordination for the Improvement of Higher Education Personnel (CAPES).
Conflicts of Interest
The authors declare no conflicts of interest.
References
- Soliani, L.; Rugna, G.; Prosperi, A.; Chiapponi, C.; Luppi, A. Salmonella infection in pigs: Disease, prevalence, and a link between swine and human health. Pathogens 2023, 12, 1267. [Google Scholar] [CrossRef] [Scilit]
- Patterson, S.K.; Kim, H.B.; Borewicz, K.; Isaacson, R.E. Towards an understanding of Salmonella enterica serovar Typhimurium persistence in swine. Anim. Health Res. Rev. 2016, 17, 159–168. [Google Scholar] [CrossRef] [Scilit]
- Martelli, F.; Oastler, C.; Barker, A.; Jackson, G.; Smith, R.P.; Davies, R. Abattoir-based study of Salmonella prevalence in pigs at slaughter in Great Britain. Epidemiol. Infect. 2021, 149, e218. [Google Scholar] [CrossRef] [Scilit]
- Rodrigues, L.A.; Wellington, M.O.; González-Vega, J.C.; Htoo, J.K.; Van Kessel, A.G.; Columbus, D.A. Functional amino acid supplementation, regardless of dietary protein content, improves growth performance and immune status of weaned pigs challenged with Salmonella typhimurium. J. Anim. Sci. 2021, 99, skaa365. [Google Scholar] [CrossRef] [Scilit]
- Kavlak, A.T.; Pastell, M.; Uimari, P. Disease detection in pigs based on feeding behaviour traits using machine learning. Biosyst. Eng. 2023, 226, 132–143. [Google Scholar] [CrossRef] [Scilit]
- Yang, Y.; Hu, Q.; Wang, L.; Wang, L.; Xiao, N.; Dong, X.; Liu, S.; Lai, C.; Zhang, S. Modeling energy partition patterns of growing pigs fed diets with different net energy levels based on machine learning. J. Anim. Sci. 2024, 102, skae220. [Google Scholar] [CrossRef] [Scilit]
- Carrara, E.R.; Oliveira, P.C.S.; Dias, L.C.C.M.; Costa, W.G.; Conceição, A.R.; Braga, P.H.S.; Chizzotti, M.L.; Veroneze, R.; Schultz, E.B. Comparison of supervised machine learning and variable selection methods for body weight prediction of growth pigs using image processing data. Rev. Bras. Zootec. 2024, 53, e20240001. [Google Scholar] [CrossRef] [Scilit]
- Laghouaouta, H.; Pena, R.N.; Ros-Freixedes, R.; Reixach, J.; Díaz, M.; Estany, J.; Armengol, R.; Bassols, A.; Fraile, L. A methodology to quantify resilience in growing pigs. Animals 2021, 11, 2970. [Google Scholar] [CrossRef] [Scilit]
- Chen, Y.; Lonergan, S.; Lim, K.-S.; Cheng, J.; Putz, A.M.; Dyck, M.K.; Canada, P.; Fortin, F.; Harding, J.C.S.; Plastow, G.S.; et al. Plasma protein levels of young healthy pigs as indicators of disease resilience. J. Anim. Sci. 2023, 101, skad014. [Google Scholar] [CrossRef] [Scilit]
- Chen, Y.; Lonergan, S.; Lim, K.-S.; Cheng, J.; Dervishi, E.; Dyck, M.K.; Steadham, E.; Canada, P.; Fortin, F.; Harding, J.C.S.; et al. Prediction of disease resilience of pigs using multi-omics data. J. Anim. Sci. Biotechnol. 2026, 17, 107. [Google Scholar] [CrossRef] [Scilit]
- Valini, G.A.C.; Righetti Arnaut, P.; França, I.; Trevisan Ortiz, M.; Karpeggiane de Oliveira, M.J.; Brandão Melo, A.D.; Marçal, D.A.; Campos, P.H.R.F.; Htoo, J.K.; Brand, H.G.; et al. Increased dietary Trp, Thr, and Met supplementation improves growth performance and protein deposition of Salmonella-challenged growing pigs under poor housing conditions. J. Anim. Sci. 2023, 101, skad141. [Google Scholar] [CrossRef] [Scilit]
- Arnaut, P.R.; Valini, G.A.C.; França, I.; Ortiz, M.T.; Oliveira, M.J.K.; Marçal, D.A.; Melo, A.D.B.; Fraga, A.Z.; Oliveira, A.F.; Brand, H.G.; et al. Effects of precision feeding and functional amino acid supplementation on Salmonella-challenged growing pigs under poor housing conditions. J. Anim. Sci. 2025, 103, skaf405. [Google Scholar] [CrossRef] [Scilit]
- França, I.; Valini, G.A.C.; Arnaut, P.R.; Ortiz, M.T.; Silva, C.A.; Oliveira, M.J.K.; Paulino, G.S.C.; Marçal, D.A.; Melo, A.D.B.; Htoo, J.K.; et al. Dietary supplementation with functional amino acids improves the capacity of growing pigs to cope with a health challenge. Anim. Feed. Sci. Technol. 2024, 318, 116148. [Google Scholar] [CrossRef] [Scilit]
- França, I.; Marçal, D.A.; Valini, G.A.C.; Arnaut, P.R.; Ortiz, M.T.; Silva, C.A.; Oliveira, M.J.K.; Melo, A.D.B.; Htoo, J.K.; Brand, H.G.; et al. Preventive–curative functional amino acid–supplemented diet improves health, growth performance, and resilience of growing pigs under an immune challenge. J. Anim. Sci. 2026, 104, skaf457. [Google Scholar] [CrossRef] [Scilit]
- Li, M.M.; Seelenbinder, K.M.; Ponder, M.A.; Deng, L.; Rhoads, R.P.; Pelzer, K.D.; Radcliffe, J.S.; Maxwell, C.V.; Ogejo, J.A.; White, R.R.; et al. Effects of dirty housing and a Salmonella Typhimurium DT104 challenge on pig growth performance, diet utilization efficiency, and gas emissions from stored manure. J. Anim. Sci. 2017, 95, 1264–1276. [Google Scholar] [CrossRef] [Scilit]
- Pomar, C.; Rivest, J. The effect of body position and data analysis on the estimation of body composition of pigs by dual energy X-ray absorptiometry. In Proceedings of the 46th Annual Conference of the Canadian Society of Animal Science, Lethbridge, AB, Canada, 7–11 July 1996; p. 26. [Google Scholar]
- Lessard, M.; Talbot, G.; Bergeron, N.; Lo Verso, L.; Morissette, B.; Yergeau, É.; Matte, J.J.; Bissonnette, N.; Blais, M.; Gong, J.; et al. Weaning diet supplemented with health-promoting feed additives influences microbiota and immune response in piglets challenged with Salmonella. Vet. Immunol. Immunopathol. 2023, 255, 110533. [Google Scholar] [CrossRef] [Scilit]
- Le Floc’h, N.; Gondret, F.; Resmond, R. Identification of blood immune and metabolic indicators explaining the variability of growth of pigs under contrasted sanitary conditions. BMC Vet. Res. 2021, 17, 166. [Google Scholar] [CrossRef] [Scilit]
- Eckersall, P.D.; Bell, R. Acute phase proteins: Biomarkers of infection and inflammation in veterinary medicine. Vet. J. 2010, 185, 23–27. [Google Scholar] [CrossRef] [Scilit]
- Allison, S.P.; Lobo, D.N. The clinical significance of hypoalbuminaemia. Clin. Nutr. 2024, 43, 909–914. [Google Scholar] [CrossRef] [Scilit]
- Torres, N.; Tobón-Cornejo, S.; Velazquez-Villegas, L.A.; Noriega, L.G.; Alemán-Escondrillas, G.; Tovar, A.R. Amino acid catabolism: An overlooked area of metabolism. Nutrients 2023, 15, 3378. [Google Scholar] [CrossRef] [Scilit]
- Colditz, I.G. Effects of the immune system on metabolism: Implications for production and disease resistance in livestock. Livest. Prod. Sci. 2002, 75, 257–268. [Google Scholar] [CrossRef] [Scilit]
- Marín-García, P.J.; Llobat, L.; López-Lujan, M.C.; Cambra-López, M.; Blas, E.; Pascual, J.J. Urea nitrogen metabolite can contribute to implementing the ideal protein concept in monogastric animals. Animals 2022, 12, 2344. [Google Scholar] [CrossRef] [Scilit]
- Farhana, A.; Lappin, S.L. Biochemistry, Lactate Dehydrogenase. In StatPearls; StatPearls Publishing: Treasure Island, FL, USA, 2023. [Google Scholar]
- Fang, Y.; Li, Z.; Yang, L.; Li, W.; Wang, Y.; Kong, Z.; Miao, J.; Chen, Y.; Bian, Y.; Zeng, L. Emerging roles of lactate in acute and chronic inflammation. Cell Commun. Signal. 2024, 22, 276. [Google Scholar] [CrossRef] [Scilit]
- Rauw, W.M.; Baumgard, L.H.; Dekkers, J.C.M. Review: Feed efficiency and metabolic flexibility in livestock. Animal 2025, 19, 101376. [Google Scholar] [CrossRef] [Scilit]
- Rauw, W.M. Immune response from a resource allocation perspective. Front. Genet. 2012, 3, 267. [Google Scholar] [CrossRef] [Scilit]
- Le Floc’h, N.; Wessels, A.; Corrent, E.; Wu, G.; Bosi, P. The relevance of functional amino acids to support the health of growing pigs. Anim. Feed. Sci. Technol. 2018, 245, 104–116. [Google Scholar] [CrossRef] [Scilit]
- Naberhaus, S.A.; Krull, A.C.; Arruda, B.L.; Arruda, P.; Sahin, O.; Schwartz, K.J.; Burrough, E.R.; Magstadt, D.R.; Matias Ferreyra, F.; Gatto, I.R.H.; et al. Pathogenicity and competitive fitness of Salmonella enterica serovar 4,[5],12:i:- compared to Salmonella Typhimurium and Salmonella Derby in swine. Front. Vet. Sci. 2020, 6, 502. [Google Scholar] [CrossRef] [Scilit]
- Ortiz, M.T.; Arnaut, P.R.; Valini, G.A.C.; França, I.; Silva, C.A.; de Oliveira, M.J.K.; Marçal, D.A.; Melo, A.D.B.; Hauschild, L. A salmonella-challenge impacts the variability of performance, body composition and lysine requirements of growing pigs under poor housing conditions. Livest. Sci. 2024, 283, 105462. [Google Scholar] [CrossRef] [Scilit]
- Doeschl-Wilson, A.; Knap, P.W.; Opriessnig, T.; More, S.J. Review: Livestock disease resilience: From individual to herd level. Animal 2021, 15, 100286. [Google Scholar] [CrossRef] [Scilit]
- Taghipoor, M.; Pastell, M.; Martin, O.; Nguyen Ba, H.; van Milgen, J.; Doeschl-Wilson, A.; Loncke, C.; Friggens, N.C.; Puillet, L.; Muñoz-Tamayo, R. Animal board invited review: Quantification of resilience in farm animals. Animal 2023, 17, 100925. [Google Scholar] [CrossRef] [Scilit]
- Cawley, G.C.; Talbot, N.L.C. On over-fitting in model selection and subsequent selection bias in performance evaluation. J. Mach. Learn. Res. 2010, 11, 2079–2107. Available online: https://www.jmlr.org/papers/v11/cawley10a.html (accessed on 20 July 2026).

Disclaimer/Publisher’s Note: The statements, opinions and data contained in all publications are solely those of the individual author(s) and contributor(s) and not of MDPI and/or the editor(s). MDPI and/or the editor(s) disclaim responsibility for any injury to people or property resulting from any ideas, methods, instructions or products referred to in the content. |
© 2026 by the authors. Licensee MDPI, Basel, Switzerland. This article is an open access article distributed under the terms and conditions of the Creative Commons Attribution (CC BY) license.