


Abstract
Digital transformation has become an essential component of sustainable rural development, yet substantial inequalities persist in how communities access, adopt, and benefit from digital technologies. Understanding these disparities requires not only information about technological resources but also knowledge of the relational structures through which information, support, and opportunities circulate. This article presents a reproducible synthetic socio-digital network dataset designed to support the analysis of digital gaps in community-based tourism (CBT) environments. Rather than containing original respondent-level observations, the repository was computationally reconstructed from aggregate statistics derived from field studies conducted in three rural communities in the province of Guayas, Ecuador: Bucay (5 de Septiembre), Manglares Churute, and Ruta de los Chirijos. All node-level records, survey variables, and support relationships included in the repository were synthetically generated to preserve aggregate community characteristics while protecting participant confidentiality and preventing individual re-identification. The repository contains synthetic actor metadata, reconstructed socio-digital variables, directed support networks, graph representations in interoperable formats, and precomputed Social Network Analysis (SNA) indicators. The dataset includes 90 synthetic actors, more than one thousand generated support interactions distributed across multiple socio-digital dimensions, machine-readable metadata, and reusable scripts for preprocessing, validation, graph construction, and metric computation. The represented dimensions include financial assistance, training support, information exchange, technological support, social media promotion, institutional collaboration, trust, and emotional closeness. To facilitate reuse, all resources are distributed in standardized formats compatible with NetworkX, Gephi, Neo4j, and graph-learning frameworks. The repository follows FAIR principles and includes documentation intended to support transparency, reproducibility, and methodological benchmarking. Potential applications include social network analysis, graph mining, graph neural networks, digital inequality research, computational social science, community resilience studies, and educational activities. By providing an openly documented synthetic dataset and reproducible computational workflow, the repository contributes to the study of socio-digital systems, privacy-preserving data sharing, and community-level digital transformation processes.
1. Introduction
Digital technologies have become increasingly important for supporting economic activities, social participation, communication processes, and local development initiatives. Recent studies have shown that rural tourism destinations increasingly depend on digital capabilities and online visibility mechanisms to strengthen competitiveness and resilience [1,2]. Despite their widespread adoption, substantial disparities remain in how communities access, appropriate, and benefit from digital resources. These disparities, commonly described as digital gaps, continue to affect opportunities for innovation, information exchange, and sustainable development, particularly in rural environments and geographically dispersed territories [3,4,5,6]. Recent studies suggest that digital inequalities cannot be explained solely by differences in infrastructure availability or technological access. Organizational structures, social relationships, and community-level collaboration mechanisms also influence the capacity of individuals and groups to participate effectively in digital ecosystems [7,8].
Community-based tourism (CBT) provides an especially relevant context for examining these challenges because local communities frequently depend on collaborative governance structures, collective participation, and shared access to resources for sustainable tourism development [9,10]. Community-based tourism has also been recognized as a mechanism for fostering sustainable development and community resilience in rural destinations [11]. In contrast to conventional tourism models, CBT initiatives rely heavily on local participation, collective governance, resource sharing, and cooperation among community members. Previous studies have highlighted the importance of community engagement and collaborative governance as key drivers of sustainable tourism outcomes [12]. Consequently, the effectiveness of tourism activities frequently depends on the existence of support networks that facilitate information exchange, training opportunities, promotion strategies, and coordination among stakeholders [10,13]. The ability of communities to access and mobilize such resources often determines their capacity to respond to changing market conditions and to incorporate digital tools into local development processes.
The growing availability of computational methods has expanded opportunities for investigating these socio-digital dynamics from a structural perspective. Social Network Analysis (SNA) offers a formal framework for representing communities as graphs composed of actors and relationships, enabling the quantification of interaction patterns through reproducible metrics such as density, centrality, reciprocity, and cohesion [14]. By transforming social interactions into graph structures, SNA makes it possible to identify influential actors, collaborative clusters, communication bottlenecks, and support mechanisms that would be difficult to observe using purely descriptive approaches [15,16]. Previous research has successfully applied network-based approaches to the study of tourism systems, collaborative organizations, and community development processes, demonstrating the relevance of relational structures for understanding collective outcomes [17,18,19].
At the same time, bibliometric analyses reveal growing scientific interest in digital transformation, social capital, collaborative governance, and network-oriented approaches to community development. Recent studies have documented the expansion of research addressing digital inclusion, sustainable tourism, stakeholder collaboration, and resilience in community-based systems [20,21,22]. Nevertheless, despite the increasing volume of scientific production, publicly available datasets describing socio-digital interactions within community-based tourism environments remain scarce. Existing datasets frequently focus on online social media platforms, institutional communication networks, or large-scale digital ecosystems, whereas relatively little attention has been devoted to rural community contexts characterized by localized interaction structures and heterogeneous support mechanisms [23,24].
The limited availability of open and reusable datasets restricts opportunities for comparative analysis, methodological benchmarking, and reproducible computational research [20,25,26]. Researchers interested in graph analytics, community resilience, digital inclusion, and socio-digital systems often face difficulties accessing structured relational data accompanied by detailed metadata and documented preprocessing procedures. Such limitations reduce transparency and hinder the development of reusable analytical workflows capable of supporting cumulative scientific progress [20,25,26,27].
To contribute to addressing this gap, this article presents a reproducible socio-digital network dataset derived from community-based tourism environments in rural Ecuador. The dataset describes support relationships, resource exchange mechanisms, and interaction structures among actors participating in local tourism initiatives. In addition to relational data, the repository includes anonymized node-level metadata, reconstructed survey variables, graph representations in interoperable formats, and precomputed Social Network Analysis indicators. The data capture multiple dimensions of community interaction, including financial support, training activities, information exchange, technological assistance, social media promotion, institutional collaboration, trust, and emotional closeness.
It is important to clarify that the repository does not contain original respondent-level survey records. Instead, the released resource consists of synthetic actors, attributes, and support relationships generated from aggregate community-level statistics reported in the original field documentation. The objective of the reconstruction process is not to reproduce individual observations but to provide a privacy-preserving and reproducible approximation of socio-digital structures suitable for computational experimentation and methodological benchmarking.
The repository incorporates information from three community-based tourism initiatives located in the province of Guayas: Bucay (5 de Septiembre), Manglares Churute, and Ruta de los Chirijos. Together, these communities represent heterogeneous socio-digital environments characterized by different organizational structures, support configurations, and levels of technological integration. Such diversity provides opportunities for comparative analysis while preserving the contextual richness that is often absent from synthetic benchmark datasets.
Beyond its descriptive value, the dataset was designed to support a broad range of computational applications. Potential reuse scenarios include Social Network Analysis, graph mining, graph representation learning, link prediction, digital inequality modeling, community resilience assessment, and educational benchmarking activities. To facilitate these applications, the repository provides standardized CSV files, GraphML representations, machine-readable metadata, and reusable scripts for preprocessing, validation, graph construction, and metric computation.
Although previous studies have substantially advanced the understanding of digital transformation, rural tourism, and community-based tourism governance, two limitations remain particularly relevant for socio-digital research. First, many studies still approach digital inequality mainly through access-, infrastructure-, or platform-oriented indicators, which may overlook the relational mechanisms through which information, training, trust, and technological support circulate within communities. Second, research on community-based tourism frequently emphasizes participation and governance, but less frequently provides reusable relational datasets that allow these processes to be examined through reproducible graph-based methods. This creates a methodological and empirical gap: digital gaps in rural tourism are not only technological deficits but also networked phenomena shaped by support structures, actor positions, and community-level patterns of collaboration.
Based on the identified gap, this article is guided by the following research questions:
- RQ1
- How can socio-digital support relationships in community-based tourism communities be represented as reusable graph-structured data for reproducible analysis?
- RQ2
- What structural patterns of connectivity, reciprocity, and support distribution can be identified across rural tourism communities, and how do these patterns contribute to the analysis of digital inequality?
The main contributions of this work are therefore threefold:
- The publication of an openly documented socio-digital network dataset describing support structures and digital integration processes within community-based tourism environments in rural Ecuador.
- The provision of interoperable graph representations, metadata documentation, and reproducible computational workflows that facilitate reuse across network science, computational social science, and graph-learning research.
- The creation of a reusable benchmark resource that supports future investigations of digital gaps, relational structures, and community resilience within socio-digital systems.
The remainder of this article is organized as follows. Section 2 describes the structure and contents of the dataset, including communities, variables, graph representations, and metadata resources. Section 3 details the acquisition process, reconstruction strategy, graph construction procedures, feature generation, and preprocessing workflow. Section 4 presents the technical validation process, including consistency checks, structural verification, and interoperability assessments. Section 5 discusses scientific relevance, reuse opportunities, and representative applications across network science, digital inclusion research, graph analytics, and education. Finally, Section 6 summarizes the principal contributions of the dataset and outlines future directions for repository expansion and reuse.
2. Data Description
The repository distributed through this publication is entirely synthetic. All node-level records, survey responses, and edge relationships were generated through a reconstruction procedure based on aggregate statistics reported in the original field studies. No original respondent-level observations, sociometric nominations, or identifiable personal information are included in the released dataset.
The dataset was designed to support the analysis of socio-digital structures within community-based tourism (CBT) environments. It integrates relational interaction data, node-level metadata, reconstructed survey variables, graph representations, and precomputed Social Network Analysis (SNA) indicators into a unified repository intended for computational reuse. The resulting resource enables the study of digital support mechanisms, collaboration patterns, trust relationships, and information exchange processes within rural communities.
The structure of the dataset responds directly to the theoretical premise that digital inequality is multidimensional. In this study, digital gaps are not interpreted only as differences in access to devices or connectivity, but as differences in the capacity of community actors to mobilize social, informational, technological, and institutional support. For this reason, the repository combines individual attributes, support relationships, trust indicators, emotional closeness, and graph-level measures. This design connects digital inequality theory with community-based tourism theory by treating local tourism communities as relational systems in which digital participation depends on both technological resources and collective support mechanisms.
From the perspective of community-based tourism, the selected variables also reflect key dimensions of local governance and collaborative capacity. Training support, information exchange, technological assistance, social media promotion, and institutional collaboration are relevant because they influence how rural tourism actors coordinate activities, access opportunities, and increase digital visibility. Thus, the dataset does not merely document community characteristics; it operationalizes theoretical constructs associated with digital inclusion, social capital, and collaborative tourism development.
Recent studies have highlighted the growing importance of reusable socio-digital datasets for understanding how communities coordinate resources, exchange information, and adapt to digital transformation processes [4,5,6,28]. At the same time, advances in network science and computational social science have increased demand for datasets that combine relational information, contextual metadata, and interoperable graph representations [15,16]. The repository was therefore structured to facilitate reproducibility, interoperability, and long-term scientific reuse.
The repository follows a modular organization that separates raw information, processed datasets, graph representations, metadata documentation, and reproducible computational scripts. Similar repository architectures have become increasingly common in computational research because they promote transparency, facilitate validation, and reduce barriers to data reuse across different analytical environments [20,23,26].
Figure 1 presents the logical organization of the repository and the relationship between its principal components.
Figure 1.
Logical organization of the socio-digital network dataset repository.
Figure 1 illustrates how source information is transformed into reusable graph structures and documented through metadata and reproducible computational workflows. This type of organization facilitates independent validation, supports interoperability across analytical platforms, and aligns with current recommendations for transparent computational research and reusable scientific datasets [20,23,26].
Table 1 summarizes the organization of the public repository. The separation of datasets, metadata, documentation, and computational resources facilitates navigation, supports long-term maintenance, and promotes transparent scientific reuse. The inclusion of licensing information, citation metadata, and dependency specifications further contributes to reproducibility and interoperability across analytical environments.
Table 1.
Repository organization and distributed resources.
2.1. Study Communities
The three communities were selected because they represent analytically relevant cases for examining socio-digital inequalities in community-based tourism. Bucay (5 de Septiembre), Manglares Churute, and Ruta de los Chirijos differ in number of participants, primary tourism orientation, territorial context, and organizational dynamics. This heterogeneity is important because digital inequality may manifest differently in communities with distinct levels of connectivity, collaboration, ecological-tourism orientation, entrepreneurial activity, and institutional support. Therefore, the selection of these communities allows the repository to support comparative analyses rather than describing a single homogeneous rural tourism context.
Together, the three communities provide a heterogeneous socio-digital environment characterized by different governance structures, support configurations, and levels of technological integration. This diversity increases the analytical value of the repository and facilitates comparative analyses of digital support networks across distinct community contexts.
Community-based tourism initiatives frequently exhibit substantial variability in governance mechanisms, collaboration intensity, stakeholder participation, and access to external support networks [10,13,29]. Capturing such diversity is particularly important for comparative analyses because differences in organizational structure may influence information diffusion, collective action, and digital adoption processes.
Table 2 summarizes the communities represented in the repository.
Table 2.
Communities represented in the dataset.
As shown in Table 2, the repository includes information from 90 participants distributed across three tourism communities characterized by different organizational and socio-digital contexts. The diversity of these environments increases the analytical value of the dataset and supports future comparative investigations involving governance structures, collaboration mechanisms, and digital integration processes [10,13,29]. Differences in organizational structures and local governance observed among community-based tourism initiatives have also been reported in other developing regions, where heterogeneous stakeholder participation generates distinct development trajectories [30,31].
2.2. Data Components
The repository contains four principal categories of information:
- Node-level metadata describing community actors;
- Edge-level relational data representing support interactions;
- Survey-derived socio-digital variables;
- Precomputed graph indicators and structural metrics.
The integration of these components enables researchers to analyze communities simultaneously from individual and structural perspectives. Multidimensional representations combining actor attributes and network topology have become increasingly relevant in computational social science because they support richer interpretations of collective behavior and resource mobilization processes [15,16,32].
Table 3 provides a consolidated overview of the repository structure and its principal contents. The dataset combines synthetic actor metadata, reconstructed survey variables, graph representations, precomputed network indicators, metadata resources, and reusable computational scripts within a single interoperable repository. This integration facilitates scientific reuse across Social Network Analysis, graph analytics, computational social science, and machine learning environments while supporting transparency and reproducibility.
Table 3.
Repository contents and overall dataset characteristics.
2.3. Variables and Metadata
The survey component captures thirteen dimensions associated with socio-digital interaction and community support. These variables describe different forms of assistance, collaboration, trust, and relational proximity exchanged among participants.
Several recent studies emphasize that digital integration depends not only on technological infrastructure but also on information sharing, social capital, organizational support, and collaborative capacity [4,5,6,28]. Consequently, the selected variables were designed to represent both technological and relational dimensions of community participation.
Table 4 summarizes the principal dimensions represented in the dataset.
The metadata documentation included in the repository provides detailed definitions, coding schemes, and usage recommendations for all variables. This documentation facilitates secondary analysis, improves interoperability, and contributes to the reproducibility of future investigations [23,26].
Table 4.
Principal survey dimensions represented in the dataset.
2.4. Graph Representations
The dataset models socio-digital interactions as directed graphs, where nodes represent actors and edges represent support relationships. This representation enables the application of established methods from network science and graph analytics [14].
Formally, each community network is represented as:
where V denotes the set of actors and E represents the set of directed support relationships observed within the community.
Representing social systems as graphs enables the systematic analysis of influence, cohesion, collaboration, and information flow. Such graph-based abstractions constitute the foundation of contemporary Social Network Analysis and have been extensively applied to organizational systems, tourism networks, and socio-digital environments [14,15,17,18].
Figure 2 illustrates the conceptual structure used to represent community interactions.
Figure 2.
Conceptual representation of support relationships modeled as a directed graph. Uppercase letters (A–D) represent example community actors, while arrows represent directed support relationships between actors.
Figure 2 illustrates the graph abstraction adopted throughout the repository, where community actors correspond to nodes and support interactions correspond to directed relationships. The labels A–D are used only as illustrative identifiers and do not represent actual participants. Similar representations are widely employed to investigate collaboration networks, stakeholder interactions, and community-level information flows [14,15,16].
2.5. Precomputed Network Indicators
To facilitate immediate analytical use, the repository includes precomputed Social Network Analysis indicators derived from the graph structures. These metrics allow researchers to characterize the position of individual actors and the structural properties of each community network without requiring additional preprocessing.
Table 5 summarizes the principal indicators distributed with the dataset.
Table 5.
Precomputed Social Network Analysis indicators included in the repository.
These indicators provide complementary perspectives on community organization and relational structure. Degree centrality captures local connectivity, betweenness centrality identifies potential intermediaries, closeness centrality reflects accessibility to information, and clustering coefficients reveal local cohesion patterns. At the network level, density and reciprocity contribute to understanding collaboration intensity and mutual support mechanisms. Such metrics have been extensively employed in studies of tourism systems, organizational networks, and socio-digital environments [14,17,18,32,33].
Together, the variables, graph representations, metadata documentation, and precomputed indicators create a reusable resource suitable for exploratory analysis, graph mining, machine learning applications, computational social science research, and future investigations of digital inclusion processes in rural communities.
3. Materials and Methods
The purpose of the methodological process was to transform field-derived community information into a reusable socio-digital network dataset suitable for graph analytics, computational social science, digital inclusion studies, and tourism research. Rather than storing isolated survey responses, the repository was designed to preserve the structural characteristics of community support networks while providing machine-readable resources that can be reused across different analytical environments.
The adopted methodology combines principles from Social Network Analysis (SNA), reproducible computational research, and scientific data publication. Such integration has become increasingly relevant because network-oriented datasets require not only relational information but also transparent generation procedures, metadata documentation, and interoperable representations that facilitate independent verification and reuse [20,23,26]. From a methodological perspective, graph-based representations provide an effective mechanism for modeling socio-digital systems because they enable the characterization of actors, interactions, and collective structures through mathematically defined metrics [14,15,16]. Recent advances in graph analytics continue to expand the applicability of network representations across diverse socio-technical environments and complex interaction systems [34,35].
The complete workflow consists of five sequential stages: (i) acquisition and organization of source information, (ii) generation of anonymized respondent records, (iii) construction of graph-based relational structures, (iv) computation of network indicators, and (v) validation and export of reusable resources. Figure 3 summarizes the overall process.
Figure 3.
Workflow adopted for constructing the socio-digital network dataset.
Figure 3 illustrates the sequence of operations through which field-derived information is transformed into reusable graph representations and associated metadata products. Similar workflows have been adopted in network-oriented repositories to improve transparency, facilitate reproducibility, and reduce preprocessing requirements for secondary users [20,23,24].
3.1. Source Information
The source information originated from fieldwork activities conducted within an ongoing undergraduate thesis project developed by the first author. The available documentation included community descriptions, aggregate survey results, support dimensions, and relational indicators. No respondent-level datasets, individual survey forms, or complete sociometric matrices were available for public release.
The repository is derived from field studies conducted in three community-based tourism initiatives located in the province of Guayas, Ecuador: Bucay (5 de Septiembre), Manglares Churute, and Ruta de los Chirijos. The available documentation contained community descriptions, sample sizes, aggregated survey results, support dimensions, and relational indicators describing how resources and assistance circulate within each community.
The original material did not include identifiable respondent information, complete sociometric matrices, or individual-level survey responses. Consequently, a synthetic reconstruction strategy was adopted to generate anonymized records that preserve the aggregate distributions reported in the field documentation while preventing disclosure of sensitive information. Comparable reconstruction approaches have been employed when privacy constraints limit direct publication of primary records but the structural characteristics of the data remain scientifically valuable. The reconstruction strategy follows principles commonly employed in synthetic-data generation and privacy-preserving data release, where aggregate characteristics are preserved while direct respondent identification becomes impossible [36,37,38,39].
Table 6 summarizes the principal information sources used during the dataset reconstruction process, indicating their level of aggregation and their contribution to the generation of synthetic records, network structures, and contextual metadata. The reconstruction workflow relied exclusively on aggregate information and methodological documentation rather than identifiable respondent-level records, preserving the principal analytical characteristics of the original study while protecting participant confidentiality and facilitating the public dissemination of reusable research data. Similar approaches have been adopted in recent studies seeking to balance transparency, reproducibility, and ethical data sharing when original respondent-level information cannot be openly distributed [23,24,40,41].
The aggregate statistics employed during reconstruction were obtained from field studies conducted as part of an ongoing undergraduate research project focused on socio-digital interactions in community-based tourism communities in the province of Guayas, Ecuador. At the time of publication, the underlying academic work remains under development and has not yet been formally published as a separate scientific study. Consequently, the present repository should be interpreted as a synthetic derivative resource reconstructed from aggregate community-level observations and designed to support reproducible computational research while preserving participant confidentiality.
Table 6.
Sources of information used during dataset reconstruction.
Although the released repository does not reproduce the original respondent-level observations, it preserves the aggregate statistical characteristics necessary to support reproducible computational experiments. This approach is consistent with established synthetic-data methodologies that seek to balance scientific utility, privacy protection, and data-sharing requirements [36,37,38,39].
3.2. Generation of Synthetic Respondent Records
Synthetic respondent records were generated through probabilistic procedures constrained by the frequencies reported for each community. Every synthetic actor was assigned an anonymous identifier and linked to one of the three communities represented in the repository.
Binary variables describing support relationships were generated using Bernoulli sampling:
where p corresponds to the observed proportion associated with a particular support dimension. Continuous variables representing trust and emotional closeness were generated using truncated normal distributions:
where represents the community mean reported in the source documentation and controls the variability around that value.
The objective of the reconstruction procedure was not to reproduce individual responses but to preserve aggregate tendencies, relational heterogeneity, and community-level characteristics. Such an approach supports methodological experimentation while minimizing disclosure risks and maintaining consistency with the distributions reported in the original field studies. Similar principles have been widely adopted in synthetic-data generation and privacy-preserving data release, where statistical utility is maintained while eliminating direct disclosure of respondent-level information [36,37,38,39].
3.3. Network Construction
Following respondent generation, support relationships were transformed into graph structures. Actors correspond to nodes and support interactions correspond to directed edges connecting pairs of actors. The resulting graphs were then used for network reconstruction and metric computation.
Support interactions were generated through a probabilistic reconstruction procedure designed to transform aggregate community-level support frequencies into dyadic network structures. For each community, a set of synthetic actors was first created according to the reported sample size. Subsequently, the support frequencies associated with each socio-digital dimension were converted into probabilities governing the generation of directed relationships between pairs of actors.
For each ordered pair of actors , the probability of generating a support relationship was defined as:
where corresponds to the support frequency reported for the corresponding community and support category.
Directed edges were generated through Bernoulli sampling and initially stored separately for each support dimension. The resulting support layers were subsequently aggregated into a unified edge list representing the overall socio-digital support structure of the community.
Following edge generation, self-loops were removed, duplicate relationships were eliminated, and consistency checks were performed to verify node references and graph integrity. The resulting graph representations preserve the aggregate support patterns reported in the source documentation while providing a reproducible and privacy-preserving approximation of community-level socio-digital structures.
To improve transparency and reproducibility, Algorithm 1 summarizes the procedure used to generate synthetic support networks from aggregate community-level statistics. The algorithm transforms reported support frequencies into probabilistic dyadic interactions while preserving the aggregate characteristics observed in the source documentation.
| Algorithm 1 Synthetic Network Generation Procedure |
|
Algorithm 1 illustrates the principal stages of the reconstruction workflow. Synthetic actors are first generated according to the reported community sizes and assigned attributes that preserve the aggregate distributions observed in the source documentation. Support relationships are then generated independently for each socio-digital dimension using probabilistic sampling. The resulting support layers are aggregated into a unified directed graph representation, after which quality control procedures are applied to remove invalid relationships and verify structural consistency. Finally, network indicators are computed and the resulting graph structures are exported in interoperable formats to facilitate reuse across graph analytics, Social Network Analysis, and machine learning environments.
Support interactions were organized into multiple relational categories, including financial assistance, information exchange, training activities, technological support, promotion services, labor exchange, and institutional collaboration. Representing these dimensions as graph structures allows researchers to investigate relational patterns using established techniques from network science [14,15]. The transformation workflow adopted during network construction is summarized in Figure 4.
Figure 4.
Transformation of survey-derived information into graph representations.
Figure 4 summarizes the reconstruction workflow used to transform synthetic survey-derived variables into graph representations suitable for computational analysis. The process begins with the generation of support-related variables, which are subsequently organized into thematic support categories and transformed into interaction records. These records are then converted into directed edge lists and exported as graph structures for downstream analysis. Such transformation pipelines are increasingly adopted in graph-oriented repositories because they facilitate reproducibility, interoperability, and direct integration with network analytics, graph databases, and machine learning frameworks [15].
To maximize compatibility with existing software ecosystems, network structures were exported as CSV edge lists, GraphML files, and JSON graph representations.
3.4. Computation of Network Indicators
The repository includes a set of precomputed Social Network Analysis indicators intended to facilitate immediate analytical reuse. These metrics capture complementary aspects of actor influence, collaboration patterns, cohesion, and network organization [14,17,18].
Degree centrality was computed as:
where indicates the existence of a relationship involving actor .
Network density was calculated as:
where denotes the number of actors and denotes the number of directed interactions.
Additional indicators include betweenness centrality, closeness centrality, clustering coefficient, and reciprocity. Together, these measures provide complementary perspectives on community organization and relational structure. Degree centrality reflects local participation, betweenness centrality identifies potential brokers, closeness centrality estimates accessibility to information, and clustering coefficients capture local cohesion patterns. Density and reciprocity characterize collective interaction intensity and mutual support mechanisms [14,32,33].
Table 7 summarizes the indicators distributed with the repository. The resulting indicators are distributed as reusable files and can be regenerated automatically using the scripts included in the repository.
3.5. Validation and Quality Control
Validation focused on three complementary dimensions: structural consistency, metadata integrity, and computational reproducibility. Structural consistency verifies that every interaction references valid actors and that graph structures remain free of duplicate relationships. Metadata integrity ensures that variables are consistently documented and encoded across repository components. Computational reproducibility confirms that network metrics can be regenerated from the distributed scripts without modifying the resulting outputs.
Table 7.
Network indicators computed during preprocessing.
Figure 5 summarizes the validation workflow.
Figure 5.
Validation procedures applied during dataset generation.
Table 8 summarizes the principal validation procedures applied during dataset construction and quality assurance. These procedures were designed to verify structural consistency, ensure interoperability across distributed resources, and confirm that graph representations and derived indicators can be reproduced from the released data. Similar validation strategies have been recommended in studies emphasizing transparency, reproducibility, and scientific reuse in computational datasets [20,40,41].
Table 8.
Validation procedures applied to the dataset.
The validation procedures ensure that all relationships reference existing actors, that graph representations remain internally consistent, and that distributed indicators can be reproduced independently. Such controls contribute to the reliability and long-term usability of the repository while supporting transparent scientific reuse [20,23,26].
Overall, the adopted methodology provides a reproducible mechanism for generating graph-oriented socio-digital datasets suitable for applications in network science, tourism research, digital inclusion studies, graph learning, and computational social science. Researchers may employ the repository to explore relationships between tourism governance, community participation, sustainability indicators, and local development outcomes [42].
3.6. Limitations of the Synthetic Reconstruction Process
Although the reconstruction procedure preserves aggregate distributions and selected structural properties, several limitations should be acknowledged.
- First, synthetic records do not correspond to actual respondent-level observations. Consequently, individual behavioral trajectories and latent participant heterogeneity cannot be recovered.
- Second, the reconstruction process preserves marginal distributions but cannot guarantee preservation of higher-order dependencies, non-linear associations, or hidden correlations that may have existed in the original data.
- Third, because original sociometric nominations were unavailable, support relationships were generated through probabilistic procedures. Therefore, the resulting networks should be interpreted as plausible approximations rather than exact reproductions of observed community structures.
- Finally, within-community variance is constrained by the information available in the original aggregate reports. Additional relational mechanisms may have existed in the original communities but could not be reconstructed from the available documentation.
Although the reconstruction procedure preserves aggregate distributions and selected structural properties, it should be interpreted within the broader context of synthetic-data methodologies. The reconstruction strategy follows principles commonly employed in synthetic-data generation and privacy-preserving data release, where aggregate characteristics are preserved while direct respondent identification becomes impossible [36,37,38,39]. Consequently, the released repository should be viewed as a synthetic approximation of community-level socio-digital structures rather than a reproduction of respondent-level observations.
For these reasons, the repository is most appropriate for methodological benchmarking, exploratory graph analytics, educational applications, reproducible computational workflows, and comparative structural analysis rather than respondent-level behavioral inference.
4. Technical Validation
The validation process was also connected to the research questions stated in Section 1. Regarding RQ1, validation assessed whether the reconstructed records, metadata, and graph files provide a coherent and reproducible representation of socio-digital support relationships. Regarding RQ2, validation examined whether the resulting networks reveal interpretable structural differences across communities, particularly in terms of density, reciprocity, average degree, and connectedness. Therefore, the validation is not limited to technical correctness; it also evaluates whether the dataset can support theoretically meaningful analysis of socio-digital inequality in community-based tourism.
The objective of the validation process was not only to verify the internal consistency of the repository but also to assess whether the generated dataset preserves meaningful structural characteristics suitable for socio-digital network analysis. Since the repository was reconstructed from aggregated field documentation rather than original respondent-level records, validation focused on evaluating structural coherence, distributional consistency, and analytical usability.
Previous studies have emphasized that the scientific value of network-oriented datasets depends not only on data availability but also on the preservation of meaningful relational structures capable of supporting reproducible analyses [40,41,43]. Consequently, multiple validation procedures were applied to evaluate both the integrity of the generated records and the properties of the resulting graph representations.
4.1. Consistency of Reconstructed Variables
The first validation stage examined whether the generated respondent-level records preserved the aggregate characteristics reported in the original field documentation. For each community, support variables, trust indicators, and emotional closeness measures were compared against their target distributions.
Figure 6 illustrates the validation logic applied during the reconstruction process. It summarizes the procedure used to compare reconstructed variables with the aggregate values reported in the source documentation. Maintaining consistency between observed frequencies and generated records is essential for ensuring that the dataset remains representative of the original community characteristics while preserving anonymity [23,24].
Figure 6.
Validation of reconstructed respondent-level variables.
Table 9 presents representative examples comparing the aggregate proportions reported in the source documentation with the corresponding values generated during dataset reconstruction. The comparison was designed to evaluate whether the probabilistic reconstruction process preserved the principal characteristics of the original socio-digital profiles while maintaining anonymity and supporting scientific reuse.
Table 9.
Illustrative comparison between reported and reconstructed proportions.
4.2. Structural Validation of Network Topology
Beyond variable reconstruction, validation also examined whether the generated networks exhibit realistic structural properties. Previous studies of community-based tourism and collaborative rural systems consistently report heterogeneous interaction patterns characterized by varying levels of cohesion, reciprocity, and centralization [10,13,29,44]. To evaluate whether similar characteristics emerged in the reconstructed dataset, community-level structural indicators were computed for each generated network. Table 10 presents representative metrics describing network size, connectivity, reciprocity, and overall structural organization.
Table 10.
Illustrative structural characteristics of generated community networks.
The structural indicators reported in Table 10 should be interpreted together with the representation strategy adopted in the repository. The value of more than one thousand directed support interactions reported in the dataset summary corresponds to the cumulative number of generated interactions across all support dimensions and communities. In contrast, the average degree values reported in Table 10 were computed from the aggregated graph representations distributed for analytical reuse. Consequently, both measures describe different levels of representation and should not be interpreted as directly equivalent. While the former reflects the total volume of support interactions generated during reconstruction, the latter characterizes the structural properties of the final graph representations used for network analysis.
Figure 7 complements the values reported in Table 10 by providing a visual comparison of representative structural indicators across communities. Ruta de los Chirijos exhibits the highest levels of density, reciprocity, and average connectivity, suggesting a more cohesive support structure where actors may have greater opportunities to exchange information, coordinate activities, and reinforce mutual assistance. In contrast, the lower density observed in Bucay indicates a more dispersed structure that may increase dependence on specific intermediaries and limit the circulation of socio-digital resources. From a digital inequality perspective, these differences suggest that access to support opportunities may vary substantially according to network position and community structure.
Figure 7.
Comparison of selected structural indicators across the three communities.
To further examine the realism of the generated networks, additional statistics describing degree distributions were computed. Beyond average connectivity, these indicators provide insight into the heterogeneity of support relationships and the potential presence of highly connected actors within each community.
Table 11 summarizes additional properties of the degree distributions observed in the generated networks. The positive skewness values indicate that all three communities exhibit heterogeneous connectivity patterns, where a limited number of actors maintain substantially more support relationships than the community average. This characteristic is commonly observed in social and collaborative networks, where certain individuals act as information brokers, coordinators, or support providers.
Table 11.
Degree distribution statistics for generated community networks.
The lower skewness observed in Ruta de los Chirijos suggests a more homogeneous distribution of support relationships, which is consistent with the higher density and reciprocity values reported previously. In contrast, Bucay exhibits the highest skewness, indicating a stronger concentration of interactions around a smaller subset of actors. These results provide additional evidence that the generated networks exhibit realistic structural characteristics beyond the aggregate metrics presented in Table 10.
However, these differences should not be interpreted as direct evidence of superior or inferior community performance. Higher density may facilitate support circulation, but it may also reflect local closure and limited exposure to external actors. Similarly, lower density may indicate fragmentation, but it may also suggest the presence of more selective or specialized relationships. Consequently, the dataset should be used to examine structural tendencies rather than to assign deterministic conclusions about community development.
Table 12 compares the structural characteristics of the generated networks against literature-informed reference ranges derived from empirical and conceptual studies of tourism and community collaboration networks. Previous research has consistently described tourism systems as moderately connected structures characterized by heterogeneous interaction patterns, localized clustering, varying levels of cohesion, and partial reciprocity among actors [19,45,46].
Table 12.
Comparison between generated networks and literature-informed reference ranges for tourism and community collaboration networks.
The generated networks exhibit density values ranging from 0.12 to 0.26, reciprocity values between 0.31 and 0.47, and average degree values between 4.9 and 7.4. All these indicators fall within the reference intervals commonly reported in the tourism network literature. These findings suggest that the reconstruction process generates structurally plausible socio-digital networks that preserve realistic interaction patterns while avoiding both excessively sparse and unrealistically dense configurations.
It should be noted that the literature ranges presented in Table 12 are intended as reference intervals derived from reported structural characteristics of tourism and collaboration networks rather than direct benchmark values obtained from a single study. Their purpose is to provide contextual validation regarding the realism of the generated network structures.
Taken together, the structural indicators, degree-distribution statistics, and literature-based comparisons suggest that the generated networks are not only internally consistent but also exhibit topological properties commonly associated with empirical tourism and community collaboration systems. These findings support the suitability of the repository for reproducible graph analytics, network science experiments, and studies of socio-digital interaction processes.
4.3. Interpretation of Deviations and Structural Anomalies
The validation process also considered possible deviations between reported aggregate tendencies and reconstructed network structures. Minor differences between reported and generated proportions are expected because the reconstruction procedure uses probabilistic sampling constrained by aggregate values rather than deterministic replication of individual responses. These deviations do not invalidate the dataset; instead, they indicate that the released data should be interpreted as a reproducible and anonymized approximation of the socio-digital structures described in the source documentation.
A second relevant issue concerns structural variation across communities. Ruta de los Chirijos presents higher density, reciprocity, and average degree than the other communities. This pattern may reflect stronger internal cohesion, but it may also be influenced by the smaller number of participants, since density tends to increase more easily in smaller networks. Therefore, comparative analyses should consider both absolute and relative network indicators. This methodological caution is important for avoiding overinterpretation of structural differences that may be partially affected by network size.
Finally, the presence of one connected component in all three communities indicates that each reconstructed network preserves internal reachability. Nevertheless, this does not imply that all actors occupy equivalent positions or have similar access to socio-digital resources. Future users should therefore combine global indicators, such as density and reciprocity, with node-level measures, such as degree, betweenness, and closeness centrality, to identify possible asymmetries in access, brokerage, and support distribution.
4.4. Validation of Network Indicators
The repository includes precomputed network metrics intended to facilitate immediate analytical reuse. To verify computational consistency, all indicators were regenerated independently from the distributed edge lists and compared against the stored values.
Figure 8 summarizes the verification procedure.
Figure 8.
Verification workflow for precomputed network indicators.
The comparison confirmed that all distributed metrics can be reproduced from the corresponding graph structures. This result demonstrates computational consistency and supports reproducibility across independent analytical environments.
4.5. Reuse-Oriented Validation
A final validation stage assessed interoperability and compatibility with commonly used graph-analysis environments. The repository was tested using standard graph representations, including CSV edge lists, GraphML files, and JSON network structures.
Such interoperability is particularly important because recent studies increasingly employ graph analytics, graph mining, graph neural networks, and explainable artificial intelligence techniques to investigate socio-digital systems [15,32,33]. Datasets that can be imported directly into multiple analytical environments reduce preprocessing effort and improve reproducibility. Table 13 summarizes the supported formats and potential analytical applications.
The validation results indicate that the repository preserves meaningful structural characteristics, maintains consistency with the source documentation, supports reproducible metric generation, and can be integrated directly into a variety of computational workflows. Collectively, these properties increase the scientific value of the dataset and facilitate its reuse across disciplines interested in digital inclusion, community resilience, tourism systems, and socio-digital network analysis.
Table 13.
Interoperability validation and supported analytical environments.
5. Usage Notes and Reuse Potential
The scientific value of a dataset extends beyond the study that originated it when the resource can support new investigations, facilitate methodological comparison, and contribute to reproducible computational research. The repository presented in this article was designed with these objectives in mind. By combining socio-digital interaction data, graph representations, metadata documentation, and reusable computational scripts, the dataset provides a flexible resource that can be employed across multiple research domains.
The reuse potential of the repository should be interpreted in relation to the research gap identified in Section 1. Its main value is not only that it provides files in multiple formats, but that it enables researchers to examine digital inequality as a relational phenomenon. In this sense, the dataset allows future studies to move beyond descriptive indicators of access and toward analyses of how support, trust, information, and technological assistance are distributed across community networks. This distinction is important because two communities with similar levels of digital access may still differ substantially in their capacity to transform digital resources into collective tourism opportunities.
At the same time, the dataset should be reused with methodological caution. Because the released records are reconstructed from aggregate documentation, they are most appropriate for methodological benchmarking, exploratory analysis, educational use, and comparative structural analysis. They should not be interpreted as a substitute for original respondent-level field data. This limitation does not reduce the usefulness of the repository, but it clarifies the type of inference that can be reasonably supported.
Community-based tourism systems constitute complex socio-technical environments in which digital adoption, collective decision-making, resource exchange, and social support mechanisms coexist. Recent studies have emphasized the importance of understanding these interactions through analytical approaches capable of integrating technological, organizational, and relational dimensions within a unified framework [4,5,6,28]. The repository contributes to this objective by providing structured representations of support relationships and socio-digital interactions observed in three rural tourism communities.
5.1. Applications in Social Network Analysis
One of the most immediate applications of the repository involves Social Network Analysis (SNA). Because the dataset is distributed as directed graph structures accompanied by precomputed indicators, researchers can directly investigate patterns of connectivity, reciprocity, centralization, brokerage, and community cohesion. Previous studies have demonstrated the usefulness of network-oriented approaches for examining governance structures, stakeholder relationships, information exchange processes, and collaborative dynamics in tourism and community-development environments [17,18,19]. Figure 9 illustrates representative analytical pathways that can be explored using the repository.
Figure 9.
Representative Social Network Analysis workflows supported by the dataset.
The analytical pathways represented in Figure 9 illustrate how the same dataset can support multiple complementary perspectives on community organization. While centrality measures reveal influential actors and potential brokers, community-detection techniques expose collaborative substructures, and cohesion metrics characterize the intensity of social integration. The simultaneous availability of these perspectives is particularly valuable for studying socio-digital systems in which information exchange, support mechanisms, and collective action processes interact continuously [15,16,17].
5.2. Applications in Graph Analytics and Machine Learning
The increasing adoption of graph representation learning, graph neural networks, link prediction algorithms, and explainable graph analytics has generated demand for datasets that combine relational structures with contextual attributes. Because the repository integrates node-level metadata, support categories, trust indicators, and graph topology, it can be employed in a variety of graph-learning scenarios.
Table 14 presents representative graph-learning tasks that can be explored using the repository. The combination of node attributes, relational structures, support dimensions, and contextual metadata provides a flexible environment for evaluating a variety of graph-based analytical techniques, ranging from predictive modeling to explainable artificial intelligence and anomaly detection.
Table 14.
Potential graph-learning applications supported by the repository.
The applications presented in Table 14 demonstrate that the repository is suitable not only for traditional network analysis but also for contemporary graph-learning research. Tasks such as link prediction and node classification can be performed directly from the graph representations, while graph embeddings and explainable artificial intelligence techniques may support deeper investigations of the mechanisms underlying digital support and collaboration processes. These characteristics align with recent trends emphasizing the importance of graph-structured datasets for benchmarking machine learning methodologies and evaluating explainable analytical approaches [15,32,33].
5.3. Applications in Digital Inclusion Research
Digital inequality has traditionally been examined through indicators related to connectivity, technological infrastructure, and access to digital resources. However, recent evidence suggests that social relationships, organizational capacity, and support networks also influence how communities adopt and benefit from digital technologies [7,8,28]. Consequently, understanding digital inclusion requires analytical approaches capable of integrating both technological and relational dimensions.
The repository supports this perspective by combining support variables, trust indicators, emotional closeness measures, and graph structures within a unified analytical resource. Researchers may therefore investigate how different forms of social support influence digital participation, how information circulates through community networks, or how structural positions relate to access to technological opportunities. Such questions have become increasingly relevant in studies examining socio-digital resilience, community adaptation, and sustainable development in rural environments [29,43,44].
The increasing integration of digital platforms into tourism ecosystems creates opportunities for investigating how communities leverage technology to enhance visibility, communication, and stakeholder engagement [47,48,49].
5.4. Educational and Reproducibility Applications
Beyond scientific research, the repository can also be employed in educational and methodological contexts. The availability of documented metadata, graph representations, reusable scripts, and precomputed indicators makes the dataset suitable for teaching topics related to network science, computational social science, data analytics, tourism intelligence, and graph-based machine learning.
Figure 10 presents the principal domains that may benefit from the repository and illustrates how a single socio-digital dataset can support interdisciplinary research and training activities.
Figure 10.
Principal scientific and educational domains supported by the dataset.
The structure illustrated in Figure 10 highlights the interdisciplinary nature of the repository. Although the dataset originates from community-based tourism environments, its graph-oriented representation and comprehensive metadata documentation allow its use in a much broader range of contexts, including computational social science, graph analytics, digital transformation research, and educational activities focused on reproducible data analysis. This versatility is consistent with current efforts to promote transparent research practices and reusable scientific resources capable of supporting cumulative knowledge generation across disciplines [20,21,26].
Taken together, the characteristics of the repository support a wide range of scientific, educational, and methodological applications. The combination of graph structures, contextual metadata, reproducible workflows, and interoperable formats provides a reusable foundation for future studies investigating socio-digital systems, digital inclusion processes, collaborative networks, community resilience, and graph-based analytical methods.
6. Conclusions
This article presented a reproducible socio-digital network dataset designed to support the study of digital gaps, community interactions, and support structures within community-based tourism environments. The repository integrates anonymized actor metadata, reconstructed survey variables, graph representations, precomputed network indicators, and reusable computational workflows into a unified resource intended for scientific reuse.
The dataset contributes to a growing body of research emphasizing the importance of relational structures in shaping digital participation, collaboration processes, and community resilience. While digital inequalities have often been examined through indicators of technological access and infrastructure availability, recent studies suggest that social support mechanisms, trust relationships, and organizational configurations also influence how communities engage with digital environments [4,5,6,7,8,28]. By representing these dimensions through interoperable graph structures, the repository provides opportunities to investigate socio-digital phenomena from both individual and structural perspectives.
A central contribution of the repository lies in its emphasis on reproducibility. The dataset is accompanied by metadata documentation, graph representations in multiple formats, validation procedures, and computational scripts that allow researchers to reconstruct analytical outputs and verify network indicators independently. Such transparency aligns with current efforts to strengthen reproducible practices in computational social science, network science, and data-intensive research while remaining consistent with FAIR principles for scientific data management and stewardship [25].
The repository also offers substantial reuse potential beyond its original context. Researchers may employ the data to investigate community organization, digital inclusion, social capital, stakeholder collaboration, information diffusion, and support-network dynamics. The dataset may also contribute to investigations examining how community participation and local governance influence sustainable tourism development and destination resilience [50]. Furthermore, the graph-oriented design facilitates applications involving graph mining, network visualization, graph representation learning, explainable artificial intelligence, and methodological benchmarking [15,32,33]. The coexistence of relational structures and contextual metadata increases the versatility of the dataset and enables experimentation across multiple analytical paradigms.
From an educational perspective, the repository can support teaching activities related to Social Network Analysis, computational social science, graph analytics, tourism intelligence, and reproducible research practices. The availability of machine-readable formats and documented workflows reduces barriers to adoption and facilitates the integration of real-world network data into classroom and training environments.
Several opportunities exist for future extensions of the repository. Additional communities may be incorporated to increase geographical diversity and improve comparative analyses. Longitudinal observations could enable the investigation of temporal network dynamics and the evolution of digital-support structures over time. The integration of complementary information sources, including digital-platform activity, geographic information systems, and institutional collaboration networks, may further enhance the analytical richness of the dataset and support more sophisticated models of socio-digital development [29,43,44].
The validation results reinforce the conceptual contribution of the dataset. The differences observed in density, reciprocity, and average degree show that socio-digital support is not evenly structured across the three communities. These structural differences are relevant because they suggest that digital inclusion in community-based tourism depends not only on access to technology but also on the organization of local support networks. In this sense, the dataset provides a basis for examining digital inequality as a relational and community-level phenomenon.
Methodologically, the study also shows both the potential and the limits of reconstructed socio-digital datasets. The use of anonymized and probabilistically generated records facilitates open data sharing, reproducibility, and ethical dissemination. However, this approach requires careful interpretation because reconstructed records preserve aggregate tendencies rather than original individual trajectories. Future studies should therefore complement this type of dataset with longitudinal fieldwork, qualitative evidence, and direct community validation when the objective is to explain causal mechanisms or evaluate intervention outcomes.
Overall, the repository contributes a reusable empirical and methodological resource for studying digital gaps in rural tourism communities. Its principal contribution lies in connecting digital inequality, community-based tourism, and network science through an openly documented graph-oriented dataset. By linking validation results with theoretical interpretation, the study demonstrates that socio-digital datasets can support not only computational experimentation but also critical analysis of how relational structures shape digital participation and community development.
Author Contributions
Conceptualization, D.M.-C., N.M. and C.V.-S.; methodology, N.M. and C.V.-S.; software, N.M. and C.V.-S.; validation, D.M.-C., N.M. and C.V.-S.; formal analysis, D.M.-C., N.M. and C.V.-S.; investigation, D.M.-C., L.S.-T., V.Z.-B., J.Z.-M. and M.V.; data curation, D.M.-C., L.S.-T. and V.Z.-B.; writing—original draft preparation, N.M. and C.V.-S.; writing—review and editing, all authors; visualization, N.M. and C.V.-S.; supervision, N.M. and C.V.-S.; project administration, D.M.-C.; funding acquisition, D.M.-C. All authors have read and agreed to the published version of the manuscript.
Funding
This research received no external funding.
Informed Consent Statement
The aggregate statistics employed during dataset reconstruction were obtained from field studies involving community-based tourism initiatives in the province of Guayas, Ecuador. Participation in the original study was voluntary and based on informed consent obtained from participants prior to data collection. The collected information was used exclusively for academic and research purposes. The source documentation available for the present work consisted exclusively of aggregate community-level statistics. No respondent-level records, personal identifiers, contact information, or original sociometric nominations were available to the authors during the reconstruction process. The repository released through this publication contains only synthetic records generated from aggregate statistical distributions. Consequently, no identifiable personal information is distributed, and the risk of participant re-identification is effectively eliminated. Because the published dataset is entirely synthetic and derived from aggregate information, it does not contain human-subject data as defined by current data-sharing and privacy guidelines.
Data Availability Statement
The dataset described in this article is publicly available through GitHub: https://github.com/cvidalmsu/community-tourism-network-dataset-ecuador, accessed on 10 June 2026. The repository includes socio-digital network data, metadata documentation, survey materials, computational scripts, citation metadata, and supplementary resources required to reproduce the analyses described in this article. Future releases of the repository will be archived through Zenodo to provide permanent versioning and DOI-based citation support.
Conflicts of Interest
The authors declare no conflicts of interest.
References
- Liu, H.; Tan, Z.; Xia, Z. The Coupling Coordination Relationship and Driving Factors of the Digital Economy and High-Quality Development of Rural Tourism: Insights from Chinese Experience Data. Land 2024, 13, 1734. [Google Scholar] [CrossRef] [Scilit]
- Zhong, Z.; Zhang, Y.; Zhang, J.; Su, M. How Information and Communication Technologies Contribute to Rural Tourism Resilience: Evidence from China. Electron. Commer. Res. 2025, 25, 4559–4594. [Google Scholar] [CrossRef] [Scilit] [PubMed]
- Hilbert, M. The bad news is that the digital access divide is here to stay: Domestically installed bandwidths among 172 countries for 1986–2014. Telecommun. Policy 2016, 40, 567–581. [Google Scholar] [CrossRef] [Scilit]
- Wang, Q.; Pang, X. Measurement and Dynamic Evolution of Relative Poverty in Rural Areas under the Background of Digitalization. For. Econ. Rev. 2025, 7, 54–76. [Google Scholar] [CrossRef] [Scilit]
- Zhang, Y.; Papp-Vary, A.; Szabo, Z. Global Influences of Digital Transformation on Behavioral Factors in Tourism: A Systematic Literature Review. Cogent Bus. Manag. 2025, 12, 2536101. [Google Scholar] [CrossRef] [Scilit]
- Zhang, Q.; Chen, J.L.; Li, G.; Jiao, X. Digital Transformation and Tourism Performance: A Systematic Literature Review and Research Agenda. Tour. Econ. 2025, 13548166251383186. [Google Scholar] [CrossRef] [Scilit]
- Shi, Y.; Xu, Y.; Hu, A. Affordance Design for Mitigating Digital Vulnerability in Smart Tourism. Int. J. Tour. Res. 2025, 27, e70060. [Google Scholar] [CrossRef] [Scilit]
- Subekti, P.; Novianti, E. Digital Communication Transformation in Micro Tourism Enterprises: Adaptation Strategies and Media Literacy Barriers. War. Ikat. Sarj. Komun. Indones. 2025, 8, 172–181. [Google Scholar] [CrossRef] [Scilit]
- Wang, S.; Imbaya, B.; Matiku, S.; Nthiga, R.; Rop, W. Community-Based Tourism: Global Perspectives, Benefits, Challenges, and Research Frameworks for Sustainable Development. Events Tour. Rev. 2025, 8, 36–51. [Google Scholar] [CrossRef] [Scilit] [PubMed]
- Tuyen, Q.D.; Phan, C.N.; Hieu, N.D.; Le Anh, T. How Has Community-Based Tourism Evolved Over Three Decades (1995–2025): A Bibliometric and Systematic Literature Review on Evolution and Future Research Directions. Sustain. Dev. 2025, 33, 8870–8893. [Google Scholar] [CrossRef] [Scilit]
- Suriyankietkaew, S.; Krittayaruangroj, K.; Thinthan, S.; Lumlongrut, S. Creative Tourism as a Driver for Sustainable Development: A Model for Advancing SDGs through Community-Based Tourism and Environmental Stewardship. Environ. Sustain. Indic. 2025, 27, 100828. [Google Scholar] [CrossRef] [Scilit]
- Abreu, L.A.d.; Walkowski, M.d.C.; Perinotto, A.R.C.; Fonseca, J.F.d. Community-Based Tourism and Best Practices with the Sustainable Development Goals. Adm. Sci. 2024, 14, 36. [Google Scholar] [CrossRef] [Scilit]
- Nguyen, T.Q.H.; Nguyen, Q.V. Research Trends in Community-Based Tourism: A Bibliometric Analysis. Glob. Econ. Res. 2026, 2, 100023. [Google Scholar] [CrossRef] [Scilit]
- Wasserman, S.; Faust, K. Social Network Analysis: Methods and Applications; Structural Analysis in the Social Sciencesl; Cambridge University Press: Cambridge, UK, 1994. [Google Scholar]
- Mohammadi, N.; Maghsoudi, M.; Abarghouezade, Z. Unveiling Digital Entrepreneurial Networks: An Actor-Network and Social Network Analysis Approach Using Instagram Data. Computing 2026, 108, 42. [Google Scholar] [CrossRef] [Scilit]
- Marzi, G.; Balzano, M.; Caputo, A.; Pellegrini, M.M. Guidelines for Bibliometric-Systematic Literature Reviews: 10 Steps to Combine Analysis, Synthesis and Theory Development. Int. J. Manag. Rev. 2025, 27, 81–103. [Google Scholar] [CrossRef] [Scilit]
- Wang, P.; Hernandez, R.; Fernandez, M.E.; Reininger, B.; Wells, R.; Crum, M.; Sifuentes, M.R.; Haffey, M.E.; Xia, D.; Lusher, D.; et al. Using Social Network Analysis to Identify Influential Community Organizations. Soc. Sci. Med. 2025, 365, 117477. [Google Scholar] [CrossRef] [Scilit] [PubMed]
- De Silva, R.; Divigalpitiya, P. Layered Social Network Dynamics in Community-Based Waste Management Initiatives: Evidence from Colombo, Sri Lanka. Resources 2026, 15, 19. [Google Scholar] [CrossRef] [Scilit]
- Casanueva, C.; Gallego, A.; Garcia-Sanchez, M.R. Social Network Analysis in Tourism. Curr. Issues Tour. 2016, 19, 1190–1209. [Google Scholar] [CrossRef] [Scilit]
- Falcone, P.M.; Tutore, I. Mapping the Nexus: A Bibliometric Analysis and Social Network Analysis of Transformative Innovation Policies and Sustainable Development Goals. Bus. Strategy Environ. 2025, 34, 2423–2435. [Google Scholar] [CrossRef] [Scilit]
- Morabi, J.H.; Mwirigi, D.; Ritter, K. Exploring Research Trends and Gaps in Community-Based Sustainable Tourism: A Bibliometric Analysis. Visegr. J. Bioecon. Sustain. Dev. 2025, 14, 71–79. [Google Scholar] [CrossRef] [Scilit]
- Ferrer-Serrano, M.; Fuentelsaz, L.; Latorre-Martínez, M.P. Knowledge Transfer and Networks: A Bibliometric Approach Through Performance Analysis, Science Mapping, and Dynamic Network Analysis. J. Knowl. Econ. 2026, 17, 5237–5272. [Google Scholar] [CrossRef] [Scilit]
- Ismail, A.; Munsi, H.; Yusuf, A.M. A Bibliometric Analysis the Scope of Local, Global, And Glocal Studies. Glocal Soc. J. 2024, 1, 1–13. [Google Scholar] [CrossRef] [Scilit]
- Kumar, R. Bibliometric Analysis: Comprehensive Insights into Tools, Techniques, Applications, and Solutions for Research Excellence. Spectr. Eng. Manag. Sci. 2025, 3, 45–62. [Google Scholar] [CrossRef] [Scilit]
- Wilkinson, M.D.; Dumontier, M.; Aalbersberg, I.J.; Appleton, G.; Axton, M.; Baak, A.; Blomberg, N.; Boiten, J.W.; da Silva Santos, L.B.; Bourne, P.E.; et al. The FAIR Guiding Principles for Scientific Data Management and Stewardship. Sci. Data 2016, 3, 160018. [Google Scholar] [CrossRef] [Scilit] [PubMed]
- Cobo, M.J.; López-Herrera, A.G.; Herrera-Viedma, E.; Herrera, F. Science Mapping Software Tools: Review, Analysis, and Cooperative Study Among Tools. J. Am. Soc. Inf. Sci. Technol. 2011, 62, 1382–1402. [Google Scholar] [CrossRef] [Scilit]
- Peng, R.D. Reproducible Research in Computational Science. Science 2011, 334, 1226–1227. [Google Scholar] [CrossRef] [Scilit] [PubMed]
- Wang, H.R.; Fang, Y.; Shao, J.P.; Li, C. Digital Governance Driving Tourism Development: The Mediating Role of Tourism Resources and the Moderating Effect of Provincial Economic Comprehensive Competitiveness. Sustainability 2025, 17, 3831. [Google Scholar] [CrossRef] [Scilit]
- Christou, E.; Giannopoulos, A.; Simeli, I. The Evolution of Digital Tourism Marketing: From Hashtags to AI-Immersive Journeys in the Metaverse Era. Sustainability 2025, 17, 6016. [Google Scholar] [CrossRef] [Scilit]
- Ramaano, A.I. Community-Based Tourism (CBT) Advancement and Sustainable Tourism Enterprise Establishments in Marginalized Rural Municipalities: Context for Ecotourism Development in Parks-Adjacent Communities. For. Econ. Rev. 2025, 7, 77–109. [Google Scholar] [CrossRef] [Scilit]
- Marefatnia, S.; Roghangirha, P.; Hosseinpour, H. Community-Based Tourism: Challenges, Strategies, and a Conceptual Framework for Sustainable Development. J. Creat. Perspect. 2025, 1, 54–64. [Google Scholar]
- Singh, D.; Verma, A. An Overview of Heterogeneous Social Network Analysis. WIREs Data Min. Knowl. Discov. 2025, 15, e70028. [Google Scholar] [CrossRef] [Scilit]
- Singh, S.S.; Muhuri, S.; Kumar, S.; Barua, J. From Nodes to Knowledge: Exploring Social Network Analysis in Education. ACM Trans. Web 2025, 19, 7. [Google Scholar] [CrossRef] [Scilit]
- Nwandikom, U.; Siami Namin, A. An Exploratory Survey on the Use of Graph Algorithms in Analysis of Social Networks. IEEE Access 2026, 14, 2850–2867. [Google Scholar] [CrossRef] [Scilit]
- Maghsoudi, M.; Khosravi, M.J.; Valikhani, M.H.; Amerian, M. Identifying and Analyzing Movie Websites Ecosystem Based on User Behavior: A Social Network Analysis Perspective. SN Comput. Sci. 2025, 6, 168. [Google Scholar] [CrossRef] [Scilit]
- Rubin, D.B. Statistical Disclosure Limitation. J. Off. Stat. 1993, 9, 461–468. [Google Scholar]
- Patki, N.; Wedge, R.; Veeramachaneni, K. The Synthetic Data Vault. In Proceedings of the 2016 IEEE International Conference on Data Science and Advanced Analytics (DSAA), Montreal, QC, Canada, 17–19 October 2016; pp. 399–410. [Google Scholar] [CrossRef] [Scilit]
- Snoke, J.; Raab, G.M.; Nowok, B.; Dibben, C.; Slavkovic, A. General and Specific Utility Measures for Synthetic Data. J. R. Stat. Soc. Ser. A (Stat. Soc.) 2018, 181, 663–688. [Google Scholar] [CrossRef] [Scilit]
- Figueira, A.; Vaz, B. Survey on Synthetic Data Generation, Evaluation Methods and GANs. Mathematics 2022, 10, 2733. [Google Scholar] [CrossRef] [Scilit]
- Ballesteros-Ballesteros, V.A.; Zárate-Torres, R.A. Mapping the Conceptual Structure of Research on Open Innovation in University–Industry Collaborations: A Bibliometric Analysis. Front. Res. Metr. Anal. 2025, 10, 1693969. [Google Scholar] [CrossRef] [Scilit] [PubMed]
- Mohammadi, N.; Soltanifar, E. Mapping the Knowledge Domain and Emerging Trends of Sustainable Startups. Discov. Sustain. 2025, 6, 1044. [Google Scholar] [CrossRef] [Scilit]
- Shah, I.A. Tourism and Poverty Alleviation: A Critical Review of Models, Multidimensional Impacts, and Inclusive Development Pathways. Tour. Plan. Dev. 2025, 1–21. [Google Scholar] [CrossRef] [Scilit]
- Oliver-Esteban, A.; Romero-Calcerrada, R. Tourism in Depopulation Contexts: A Hybrid Bibliometric and Narrative Systematic Review. World 2026, 7, 40. [Google Scholar] [CrossRef] [Scilit]
- Abusharieh, I.; Ruiz-Mafe, C.; Küster, I. A Decade of Innovation: A Bibliometric Analysis of Advergames and Gamification in Tourist Destinations. J. Theor. Appl. Electron. Commer. Res. 2025, 20, 34. [Google Scholar] [CrossRef] [Scilit]
- Seok, H.; Barnett, G.A.; Nam, Y. A Social Network Analysis of International Tourism Flow. Qual. Quant. 2021, 55, 419–439. [Google Scholar] [CrossRef] [Scilit]
- Valeri, M.; Baggio, R. Social Network Analysis: Organizational Implications in Tourism Management. Int. J. Organ. Anal. 2021, 29, 342–353. [Google Scholar] [CrossRef] [Scilit]
- Nunes, J.; Mata, D.; Ribeiro, F.; Metrôlho, J. Digital Platforms to Promote Sustainable and Authentic Tourism in Low-Density Territories of Southern Europe: Challenges and Opportunities. Sustainability 2025, 17, 6156. [Google Scholar] [CrossRef] [Scilit]
- Polukhina, A.; Sheresheva, M.; Napolskikh, D.; Lezhnin, V. Digital Solutions in Tourism as a Way to Boost Sustainable Development: Evidence from a Transition Economy. Sustainability 2025, 17, 877. [Google Scholar] [CrossRef] [Scilit]
- Abdelmalak, F. Smart Tourism Governance: An Institutional Perspective on Sustainability, Innovation, and Resilience. J. Smart Tour. 2025, 5, 185–202. [Google Scholar] [CrossRef] [Scilit]
- Jackson, L.A. Community-Based Tourism: A Catalyst for Achieving the United Nations Sustainable Development Goals One and Eight. Tour. Hosp. 2025, 6, 29. [Google Scholar] [CrossRef] [Scilit]
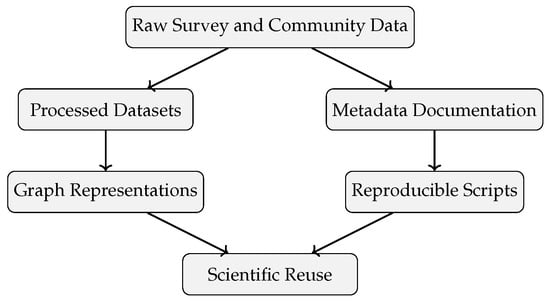
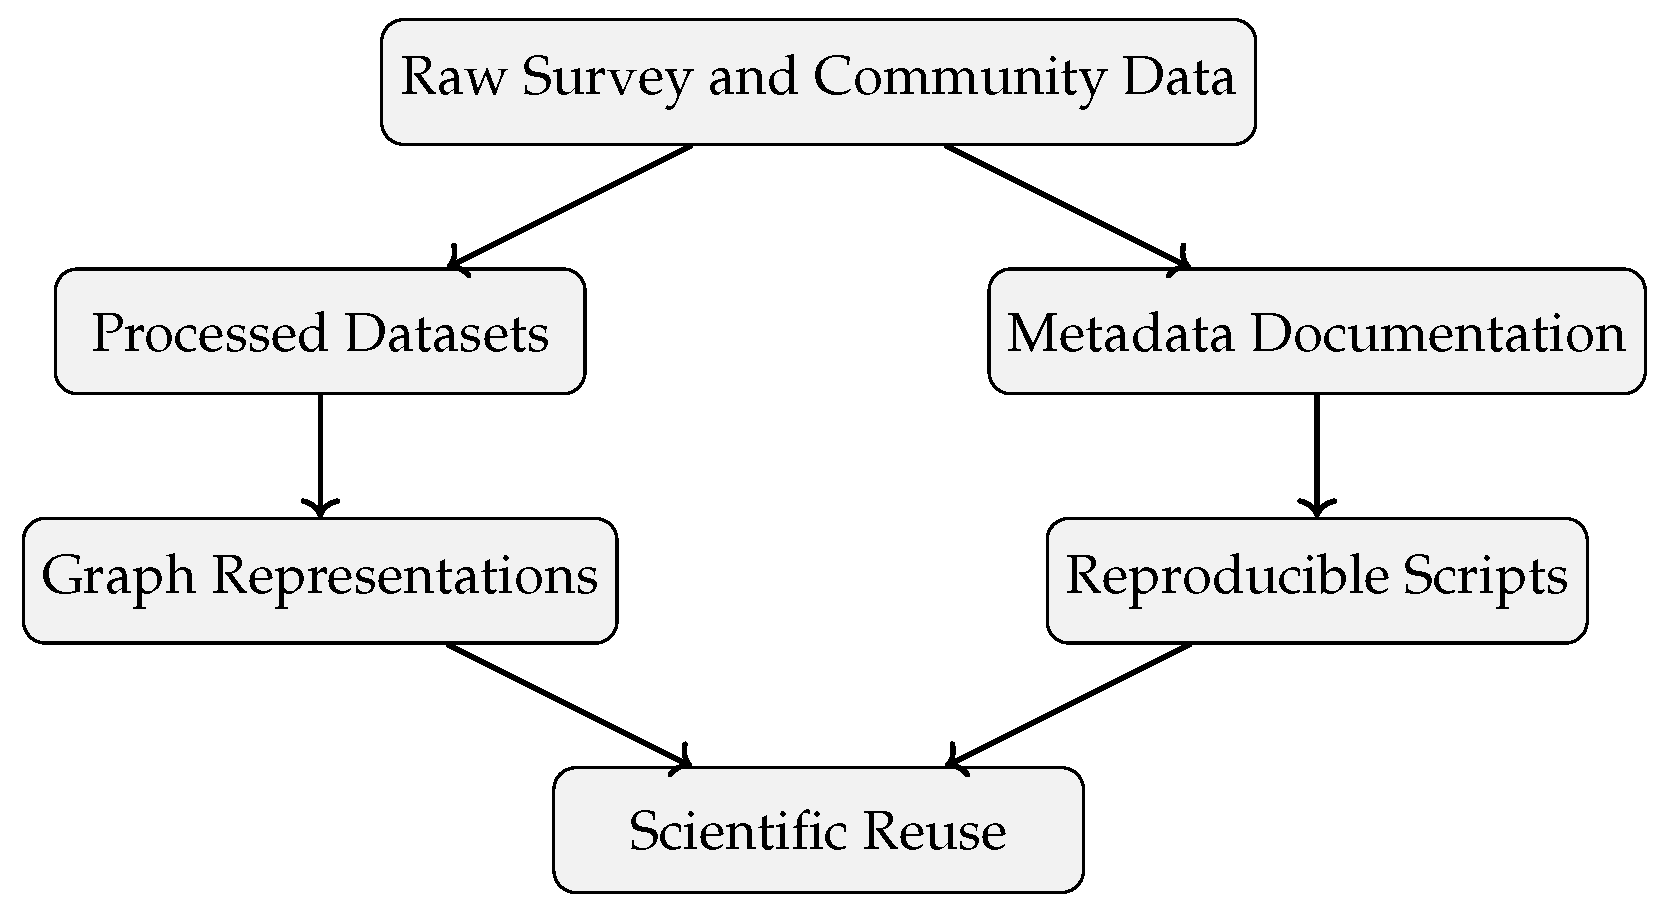
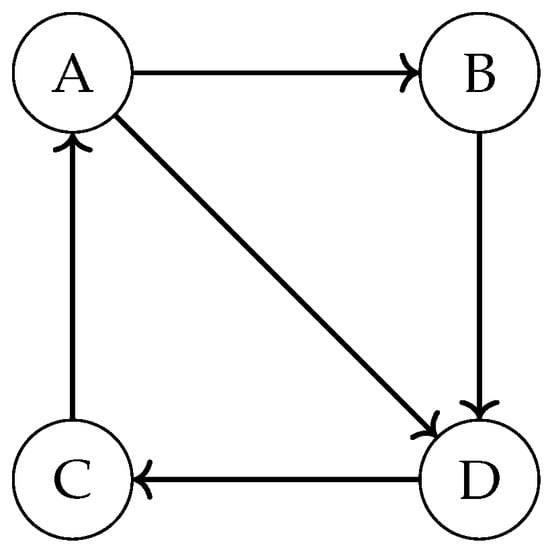
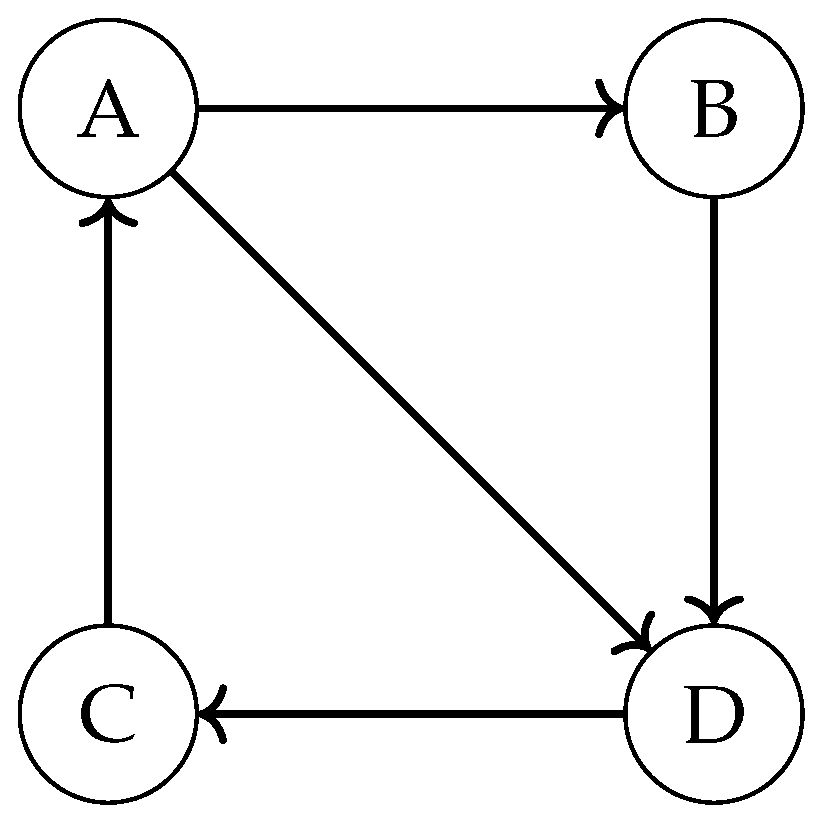
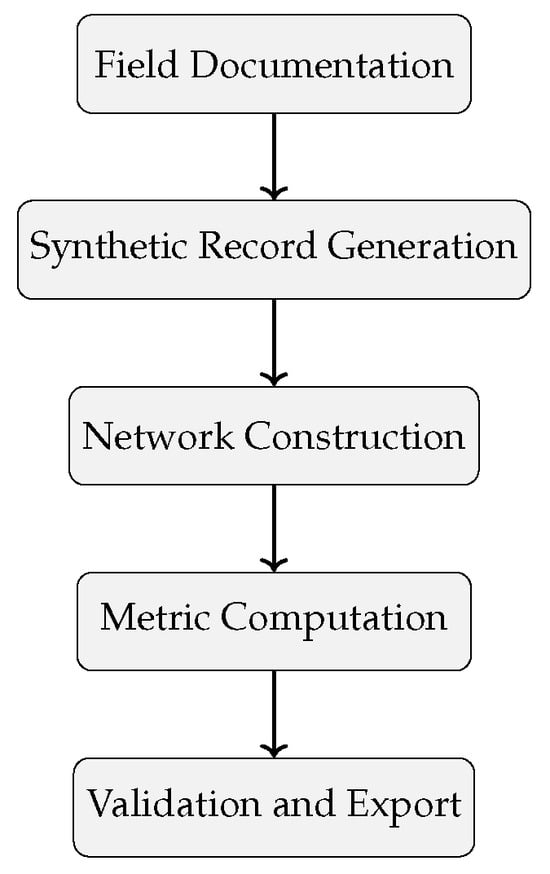


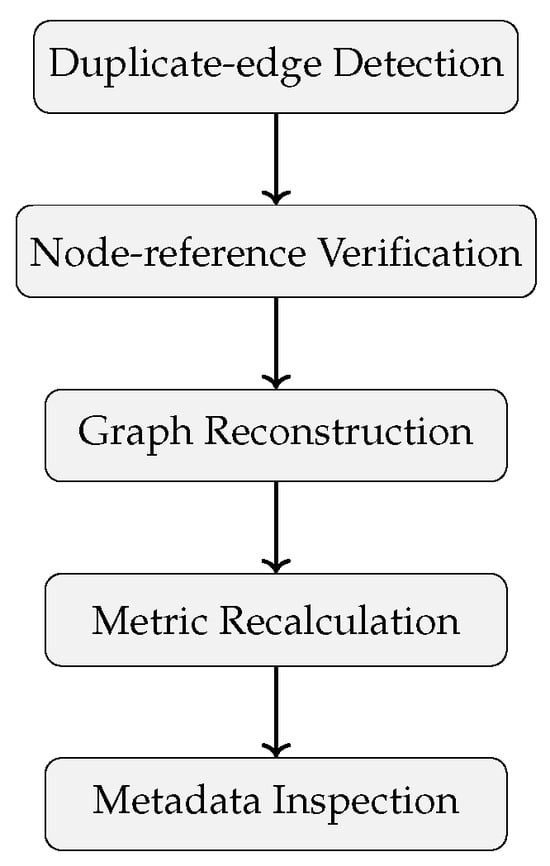


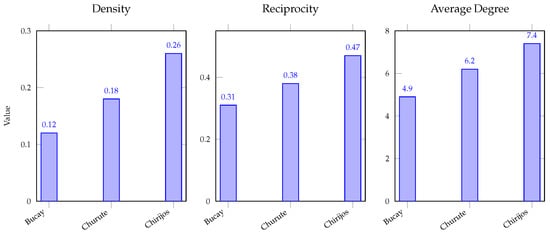
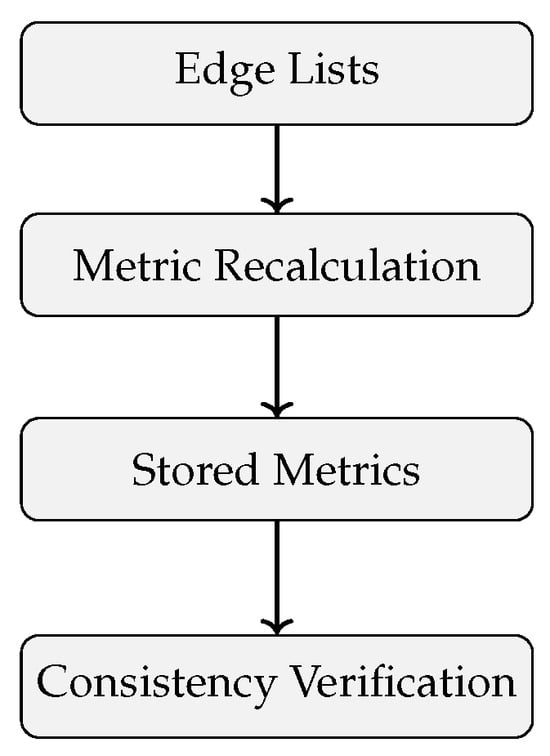
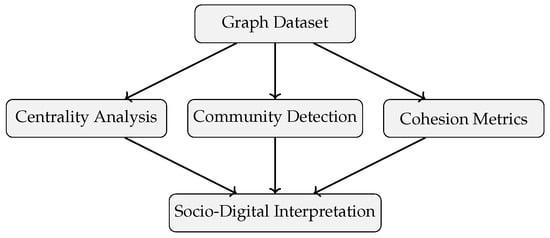
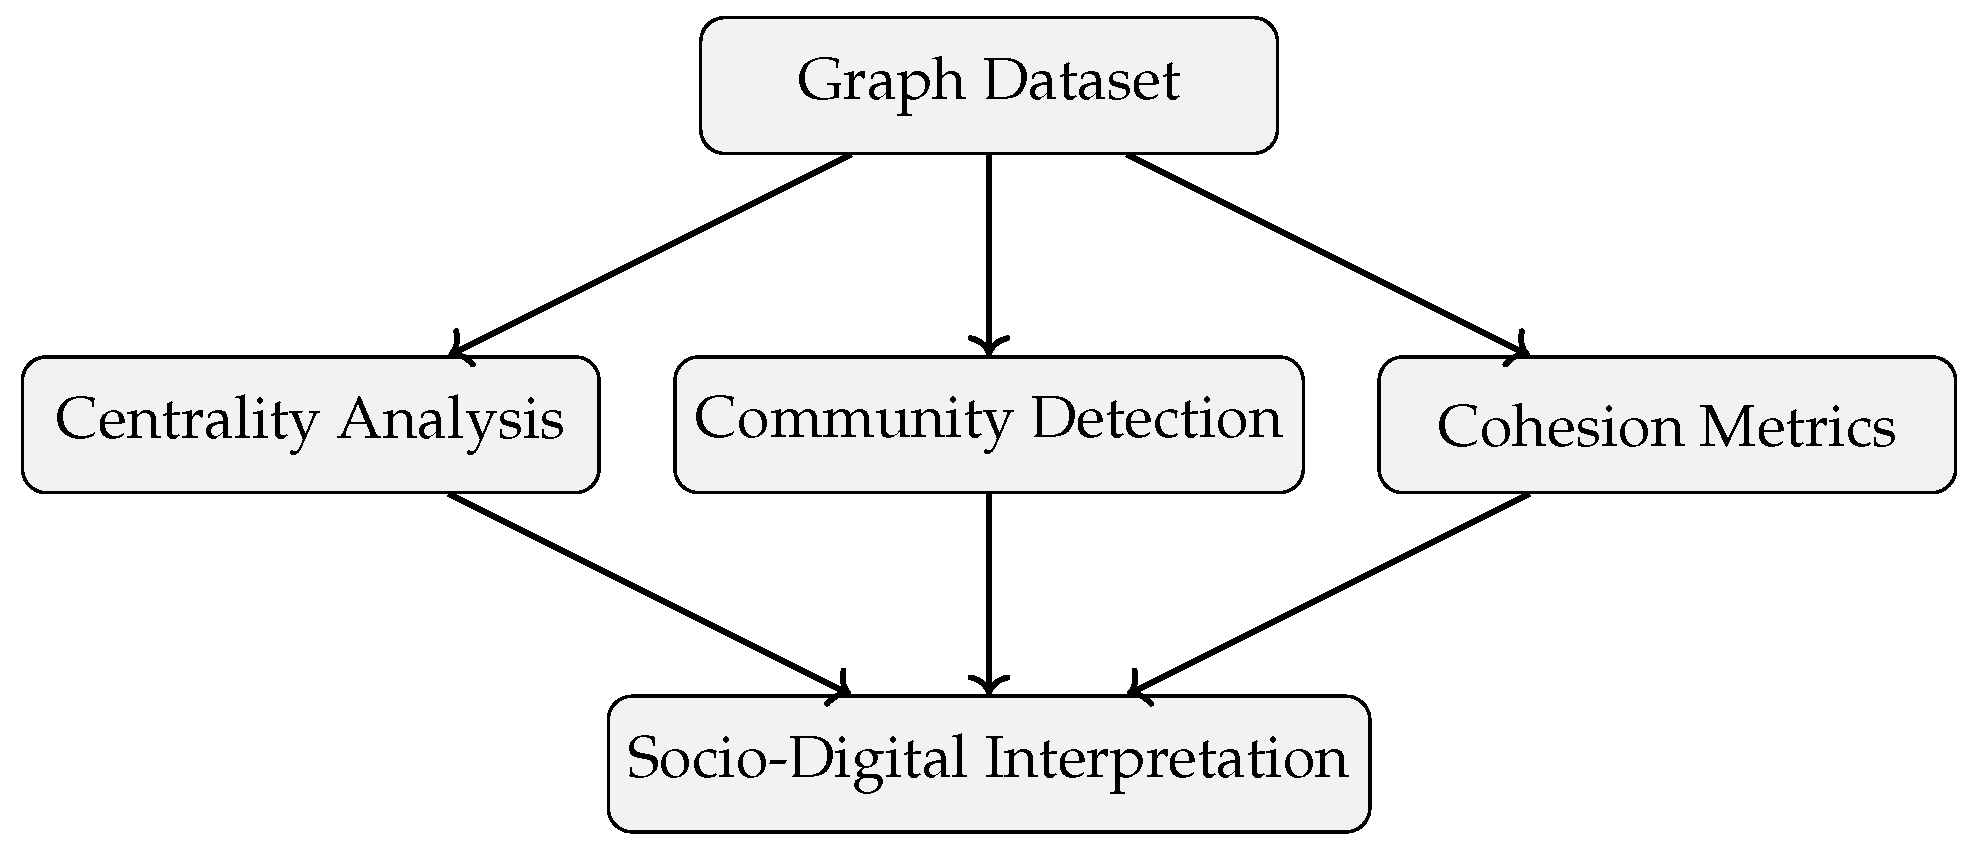
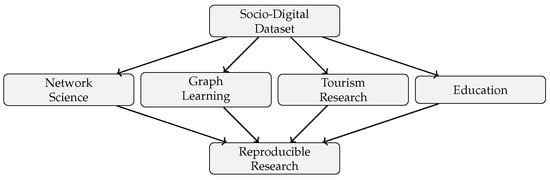
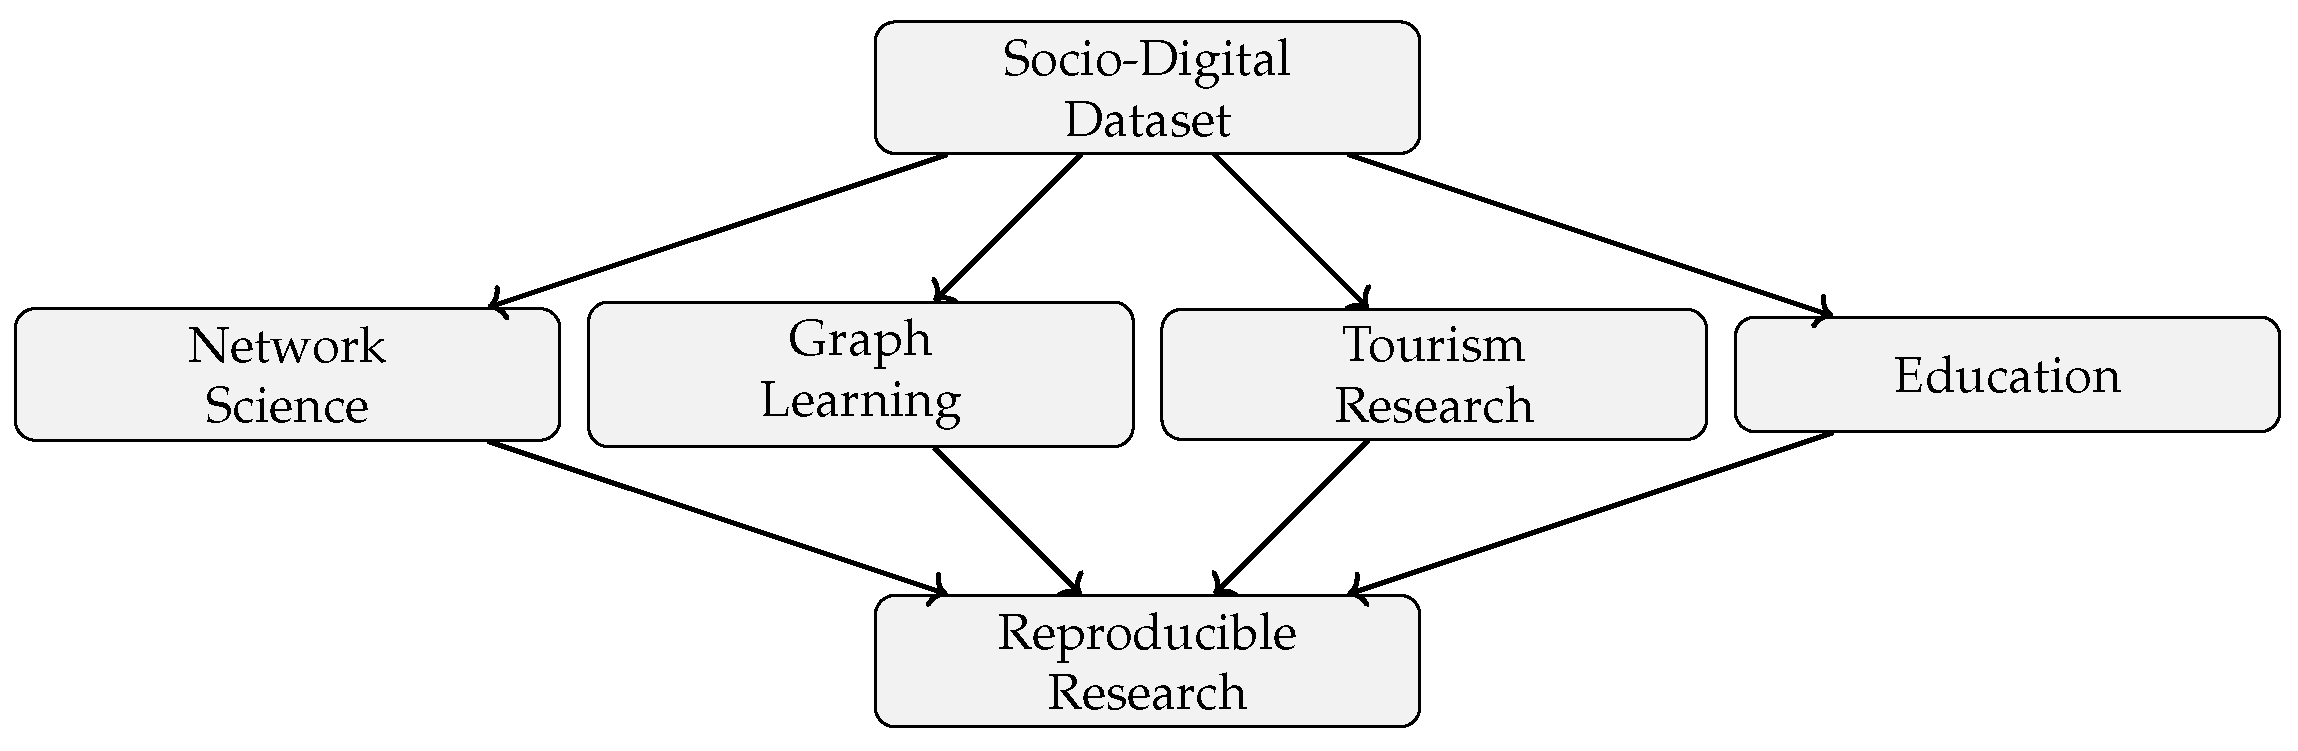
Disclaimer/Publisher’s Note: The statements, opinions and data contained in all publications are solely those of the individual author(s) and contributor(s) and not of MDPI and/or the editor(s). MDPI and/or the editor(s) disclaim responsibility for any injury to people or property resulting from any ideas, methods, instructions or products referred to in the content. |
© 2026 by the authors. Licensee MDPI, Basel, Switzerland. This article is an open access article distributed under the terms and conditions of the Creative Commons Attribution (CC BY) license.