


Abstract
Hyperspectral (HS) imaging has emerged as a promising tool for improving the non-invasive detection of different diseases, offering spatial and spectral information in a single imaging modality. In this work, we present a dataset of HS images of the in vivo human cervix, including different precancerous and cancerous lesions. The dataset comprises 77 HS images acquired from 77 patients during routine colposcopic examination. All images were captured using a clinical colposcope equipped with an HS camera, covering the spectral range from 470 to 900 nm. Each HS image is accompanied by detailed pixel-level annotations for different clinically relevant tissue classes: ectocervix, endocervix, cervical intraepithelial neoplasia lesions, and invasive carcinoma. These labels were established through expert colposcopic assessment and confirmed by cytology or biopsy. The dataset contains clinical data from these patients, including demographic information, colposcopy and biopsy findings, and clinical diagnoses.
Dataset: The data presented in this study are openly available in Zenodo at https://doi.org/10.5281/zenodo.18208664.
Dataset License: CC-BY
1. Summary
Colposcopy, in combination with cervical biopsies, is the standard clinical approach for detecting precancerous lesions in the cervix. Despite its widespread use, the procedure is highly operator-dependent and subject to significant inter- and intra-observer variability, which can compromise diagnostic consistency and patient outcomes [1,2].
Cervical cancer remains a major public health issue worldwide. It is the fourth most common cancer in terms of incidence and mortality in women, with an estimated 660,000 new cases and 350,000 deaths worldwide in 2022 [3]. This type of cancer is particularly high in low-income countries and among younger women under 45 years old, where its incidence is 19.3 per 100,000 [3]. While the implementation of large-scale screening programs in Europe, Oceania, and North America has reduced mortality, high risk persists in younger populations, partly due to changes in population behavior and increased transmission of human papillomavirus (HPV) [4,5,6].
Cervical cancer, specifically invasive carcinoma (IC), originates from precursor lesions in the cervix known as high-grade squamous cervical intraepithelial neoplasias (CIN), which are graded histologically as CIN1 (low-grade), CIN2, and CIN3 (high-grade). These lesions evolve gradually, beginning with HPV infection in the keratinocytes of the basal stratum of the epithelium [7]. Initially, a low-grade squamous intraepithelial lesion (LSIL) appears, which can progress to a high-grade squamous intraepithelial lesion (HSIL) with a high potential for malignancy [8].
Some datasets have previously been shared for cervical data analysis, but all of these were based on standard RGB images. Yu et al. published a dataset of 679 patients, for which five images of the acetowhitening process, one image with a green filter, and one image of the iodine test were collected for each patient [9]. Furthermore, the Intel & MobileODT Cervical Cancer Screening dataset comprises 4626 colposcopy RGB images captured using different systems, which varied in resolution and image quality [10]. Although these RGB datasets have been valuable for advancing AI in cervical image analysis, they do not provide any spectral information, and their annotations are only at the patient level, without lesion delineation.
Previous studies have explored the application of hyperspectral (HS) imaging (HSI) in cervical examinations. Recent works have provided further evidence that HSI can objectively distinguish CIN lesions from healthy cervical tissue by revealing significant increases in hemoglobin and water content, reflecting the angiogenesis and stromal alterations associated with neoplastic progression [11,12]. However, none of these studies have made their datasets publicly available, which limits reproducibility, hinders fair comparisons of methods, and restricts further development by other research groups.
In this work, we provide a publicly available dataset of HS images of the in vivo human cervix, including various precancerous and cancerous lesions. This dataset comprises 77 HS images from 77 different patients, with pixel-level annotations for six classes based on colposcopy, cytology, or biopsy examinations. HS images cover the spectral range from 470 to 900 nm and were taken using a colposcope at 1× magnification. Here, we present the curated version of the dataset.
2. Data Description
The HyCervix dataset was deposited in the Zenodo repository [13] and comprises 77 HS images from 77 different patients. The dataset is structured in a hierarchy of folders. At the top level of the hierarchy, there is a single folder associated with each one of the patients comprising the dataset. At the patient level, the folder names correspond to Pi, where . The HS images are stored in each patient’s folder in ENVI file format, where each file contains the HS reflectance data as a flat-binary raster DAT (data) file with an accompanying HDR (header) file containing essential metadata to interpret it. In total, we can find six files for each patient: (1) the HS image for such patient (cube.dat), (2) the header file with the metadata (cube.hdr), (3) a file that contains different masks (Patient_XX_GT.mat), (4) the definitive diagnostic (Patient_XX_Diagnostic.txt), (5) a synthetic RGB image generated from the HS image (Patient_XX_RGB.png), and (6) an RGB image that contains the ground truth (GT) pixel-level annotations (Patient_XX_GT.png). A more detailed description of the different files in each patient’s folder can be found in Table 1.
Table 1.
Brief description of the different files contained in each patient’s folder in the dataset.
The HS Cervix dataset is labelled into 6 different label classes, with 10 subclasses. The class distribution is presented in Table 2, which shows the number of images in each class, the subclasses for the normal classes, and the total number of pixels labelled from each class. The label IDs presented in Table 2 correspond to the values stored in the annotation map field of Patient_XX_GT.mat and are also visualized in Patient_XX_GT.png using the RGB codes indicated in the table.
Table 2.
Label names and class distribution in the dataset.
Demographic and clinical information for each patient, along with the HS image, was collected from the electronic health records and stored in a separate tabular file. These annotations contained valuable information, including patient ID, date, cytology results, HPV test results, colposcopy evaluation, and other clinical information. Furthermore, a data partitioning strategy is proposed for classification to ensure a balanced distribution of patients diagnosed with invasive carcinoma between the training and test sets. This tabular dataset was designed to be linked to the main imaging dataset through an anonymized identifier number unique to each patient. A CSV (comma-separated values) file contains the clinical data for each patient, organized into 15 attributes listed in Table 3. To analyze the spectral information, it is important to determine whether each cervix is normal or not. For this test, the gold standard for a normal cervix was defined as a negative HPV test together with a normal colposcopic assessment, corresponding to pixels labeled with ID 103 for the exocervix subclass, ID 104 for the endocervix subclass, and ID 105 for outliers.
Table 3.
Clinical variables of the dataset.
3. Methods
3.1. Ethics Approval
The HyCervix dataset was collected at Complejo Hospitalario Universitario Insular-Materno Infantil (CHUIMI) de Gran Canaria (Spain). The clinical study was approved by the Ethical Committee of the Hospital Universitario de Gran Canaria Dr. Negrín (Spain), with reference number 2022-081-1. All participants involved in this study and/or their legal guardians were informed about the research and voluntarily signed an informed consent form authorizing their participation and the anonymous publication of the results. Research methodology, including data acquisition and anonymization, was performed in accordance with the current guidelines and regulations.
3.2. HS Colposcope System
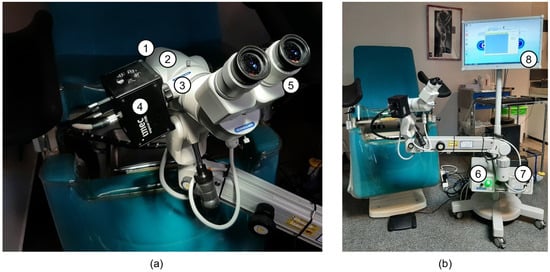
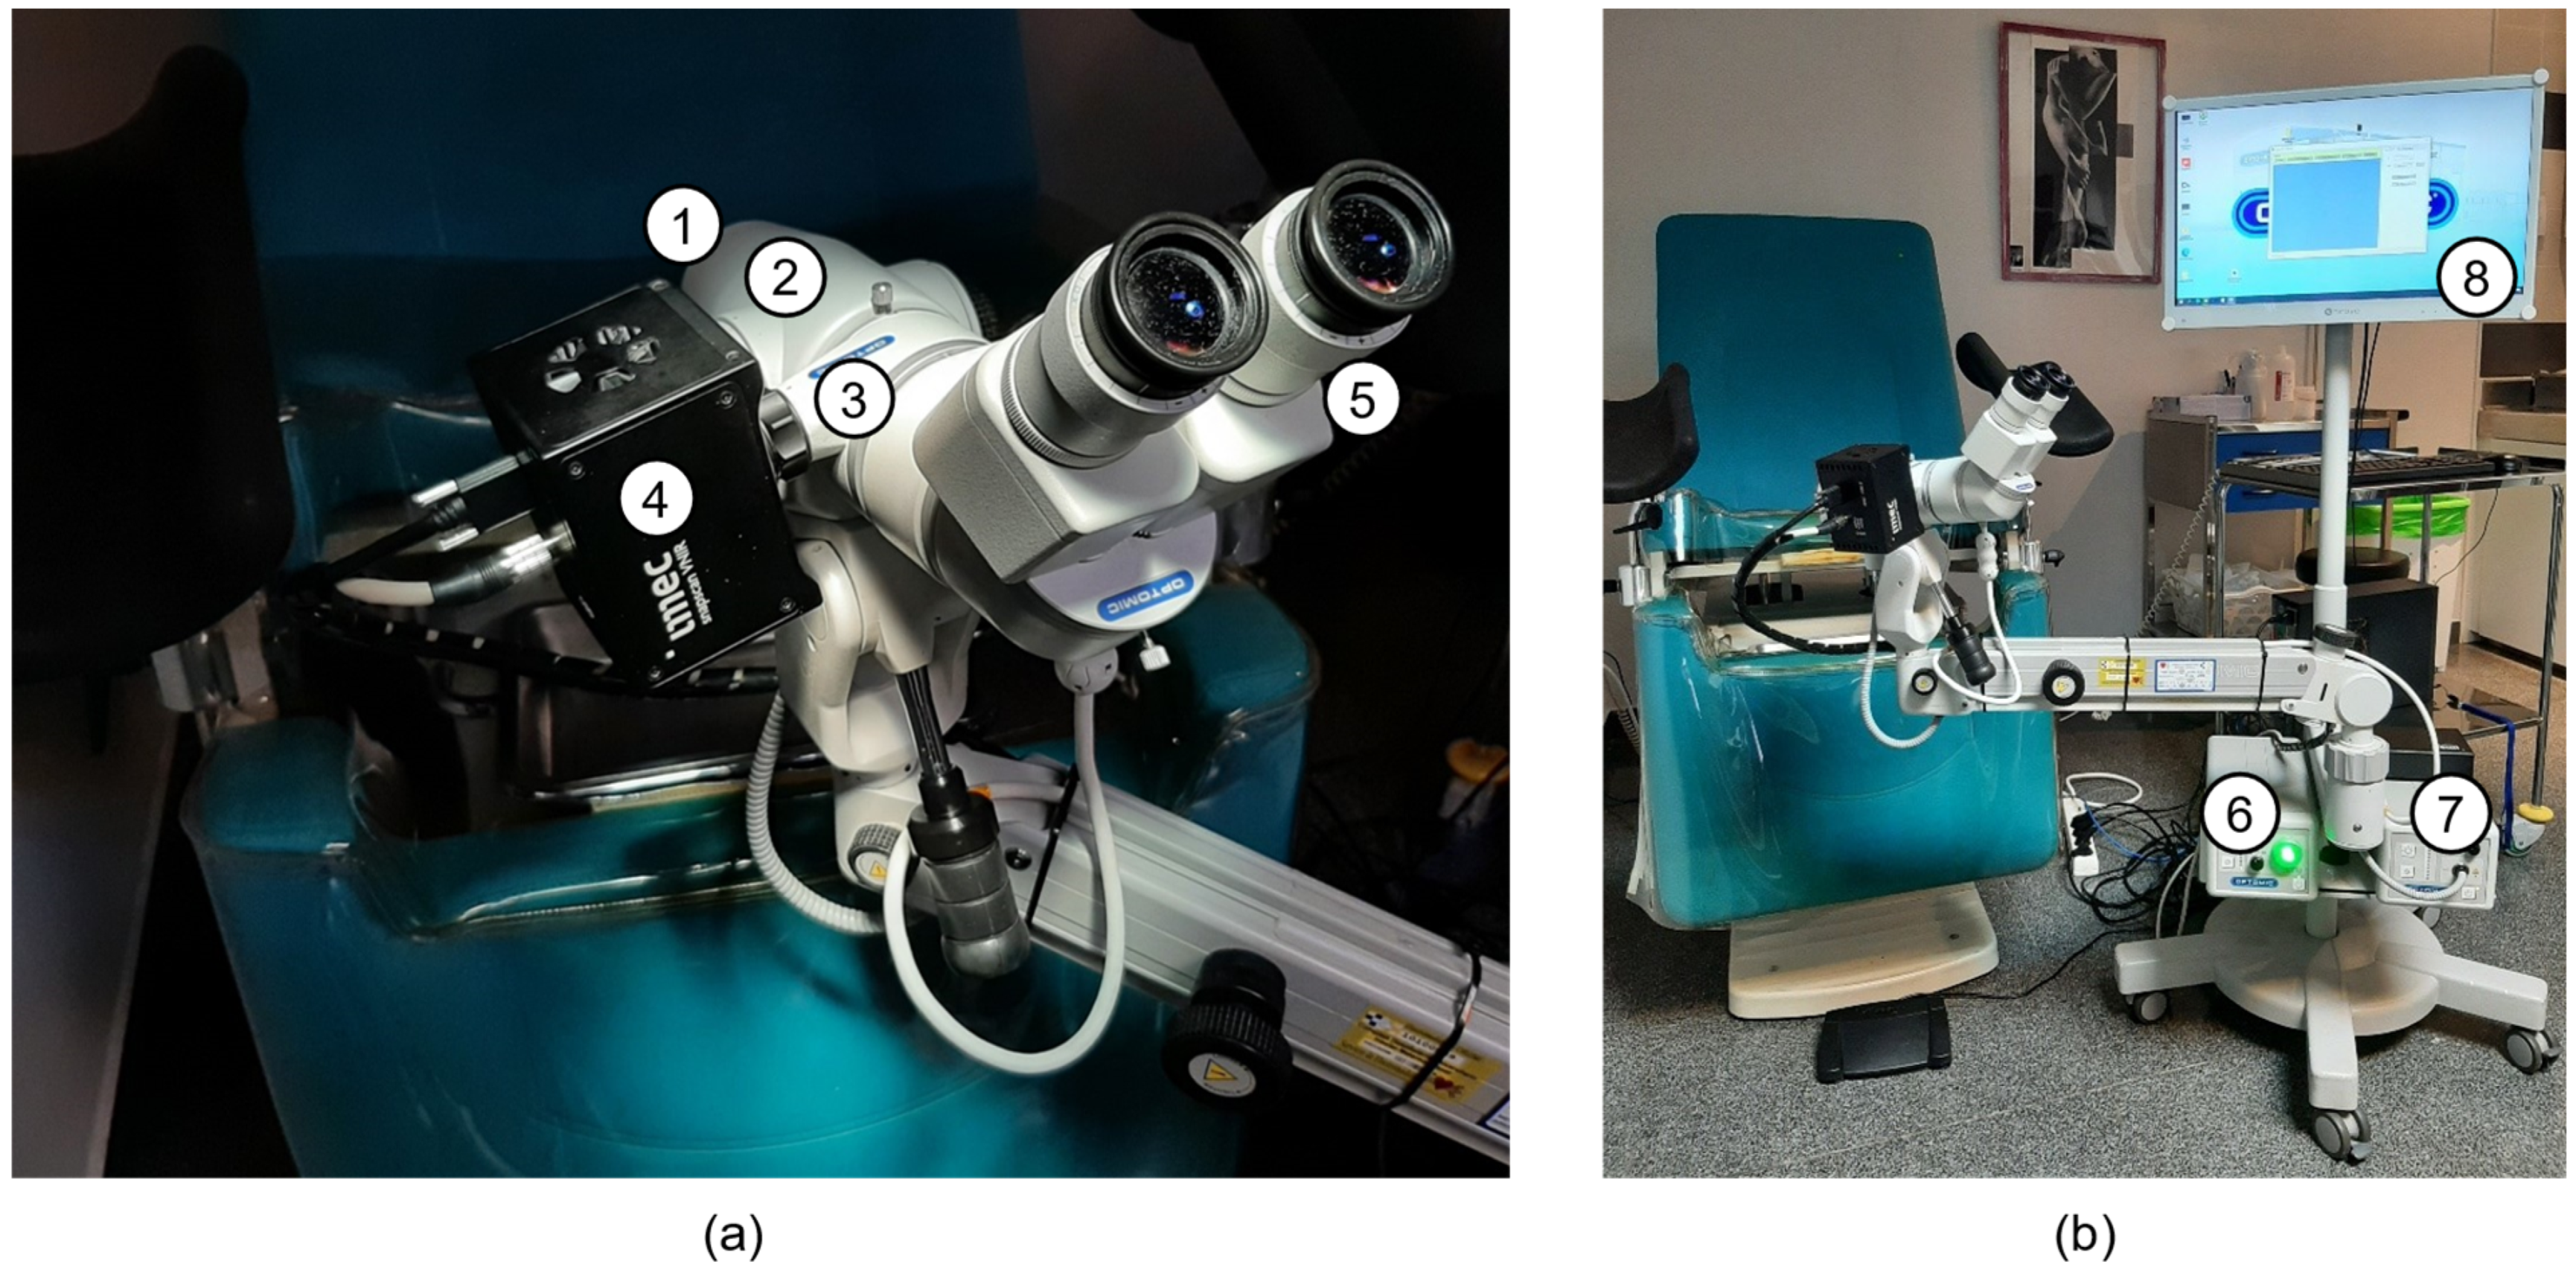
A custom HS colposcope system was employed to collect the HyCervix dataset, which was integrated into the gynecologist’s workflow [14]. This system was based on three components: (i) a commercial colposcope, (ii) a halogen illumination system, and (iii) an HS camera (Figure 1). The colposcope used was the Optomic OP-C5 (OPTOMIC España S.A., Colmenar Viejo, Spain), to which a series of modifications were made. First, the IR (infrared) filter was removed from the main body (2 in Figure 1a) to enable the HS camera to capture data beyond 750 nm. Secondly, the image splitter (3 in Figure 1a) was customized to be compatible with the standard C-Mount to attach the HS camera Snapscan VNIR (IMEC, Leuven, Belgium). This HS camera (4 in Figure 1a) is based on a spatio-spectral scanning technology called Snapscan, which is a linescan sensor on a platform that slides inside the camera, covering the 470–900 nm spectral range and capturing 158 spectral bands. The colposcope includes an original LED-based light source and a green filter (6 in Figure 1b). However, an additional halogen light source (OSRAM, 64634 HLX EFR, Premstaetten, Austria) was included in the system to capture the HS images (7 in Figure 1b). Finally, a custom graphical user interface (GUI) was developed to prevent non-expert users from entering low-level configuration parameters and to simplify the HS image acquisition process (8 in Figure 1b). The GUI allows annotation of the biopsy’s location, which is correlated with the HS image. A more detailed description of the different parts of the acquisition system is provided in Table 4.
Figure 1.
HS Colposcope system. (a) Colposcope head and HS camera (1: front lenses; 2: main body; 3: image splitter; 4: HS camera; 5: binoculars). (b) Colposcope system at the gynecologist’s office (6: original light source based on LED; 7: halogen light source, 8: graphical user interface).
Table 4.
Description of the HS colposcope system components.
3.3. Data Acquisition Methodology
During routine cervical cancer screening consultations, gynecologists acquired HS images using the custom GUI. When feasible, two HS images were obtained per patient: (1) a baseline HS image of the cervix after removing secretions and debris and (2) a subsequent HS image after the application of acetic acid and after cytology. Only the baseline HS images were employed to create this dataset.
The diagnosis of the lesions was conducted in accordance with the standard clinical protocol, which included two steps: (1) cytology and (2) a colposcopy examination. Firstly, after removing secretions and debris, liquid-based cytology (ThinPrep Pap Test PreservCyt™ Solution) was performed to classify the lesions as LSIL or HSIL, according to the Bethesda system [15]. The HPV test was performed using liquid-based cytology with a Cobas 4800 Test® kit (Roche Molecular Systems, Pleasanton, CA, USA). Secondly, during the colposcopy examination, an acetic acid solution was applied to the cervix to observe an epithelial reaction. Moreover, the employment of green filter lenses and compound iodine solution facilitates the observation of the lesions [9]. When abnormal colposcopic findings are identified, a biopsy is performed. In this case, the diagnosis was conducted employing histopathological criteria using the CIN system, which subdivides lesions into three categories: CIN1, CIN2, and CIN3. LSIL corresponds to CIN1, whereas HSIL includes CIN2 and CIN3. Finally, the definitive diagnosis was established by biopsy in cases with abnormal colposcopic findings or by cytology in patients with normal colposcopy. In addition, the evolution of the diagnosis from posterior clinical evaluations was incorporated into the associated clinical data.
3.4. Study Population
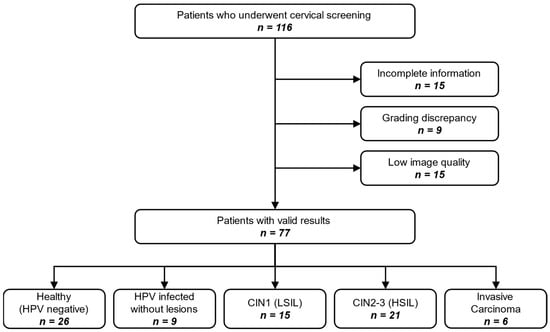
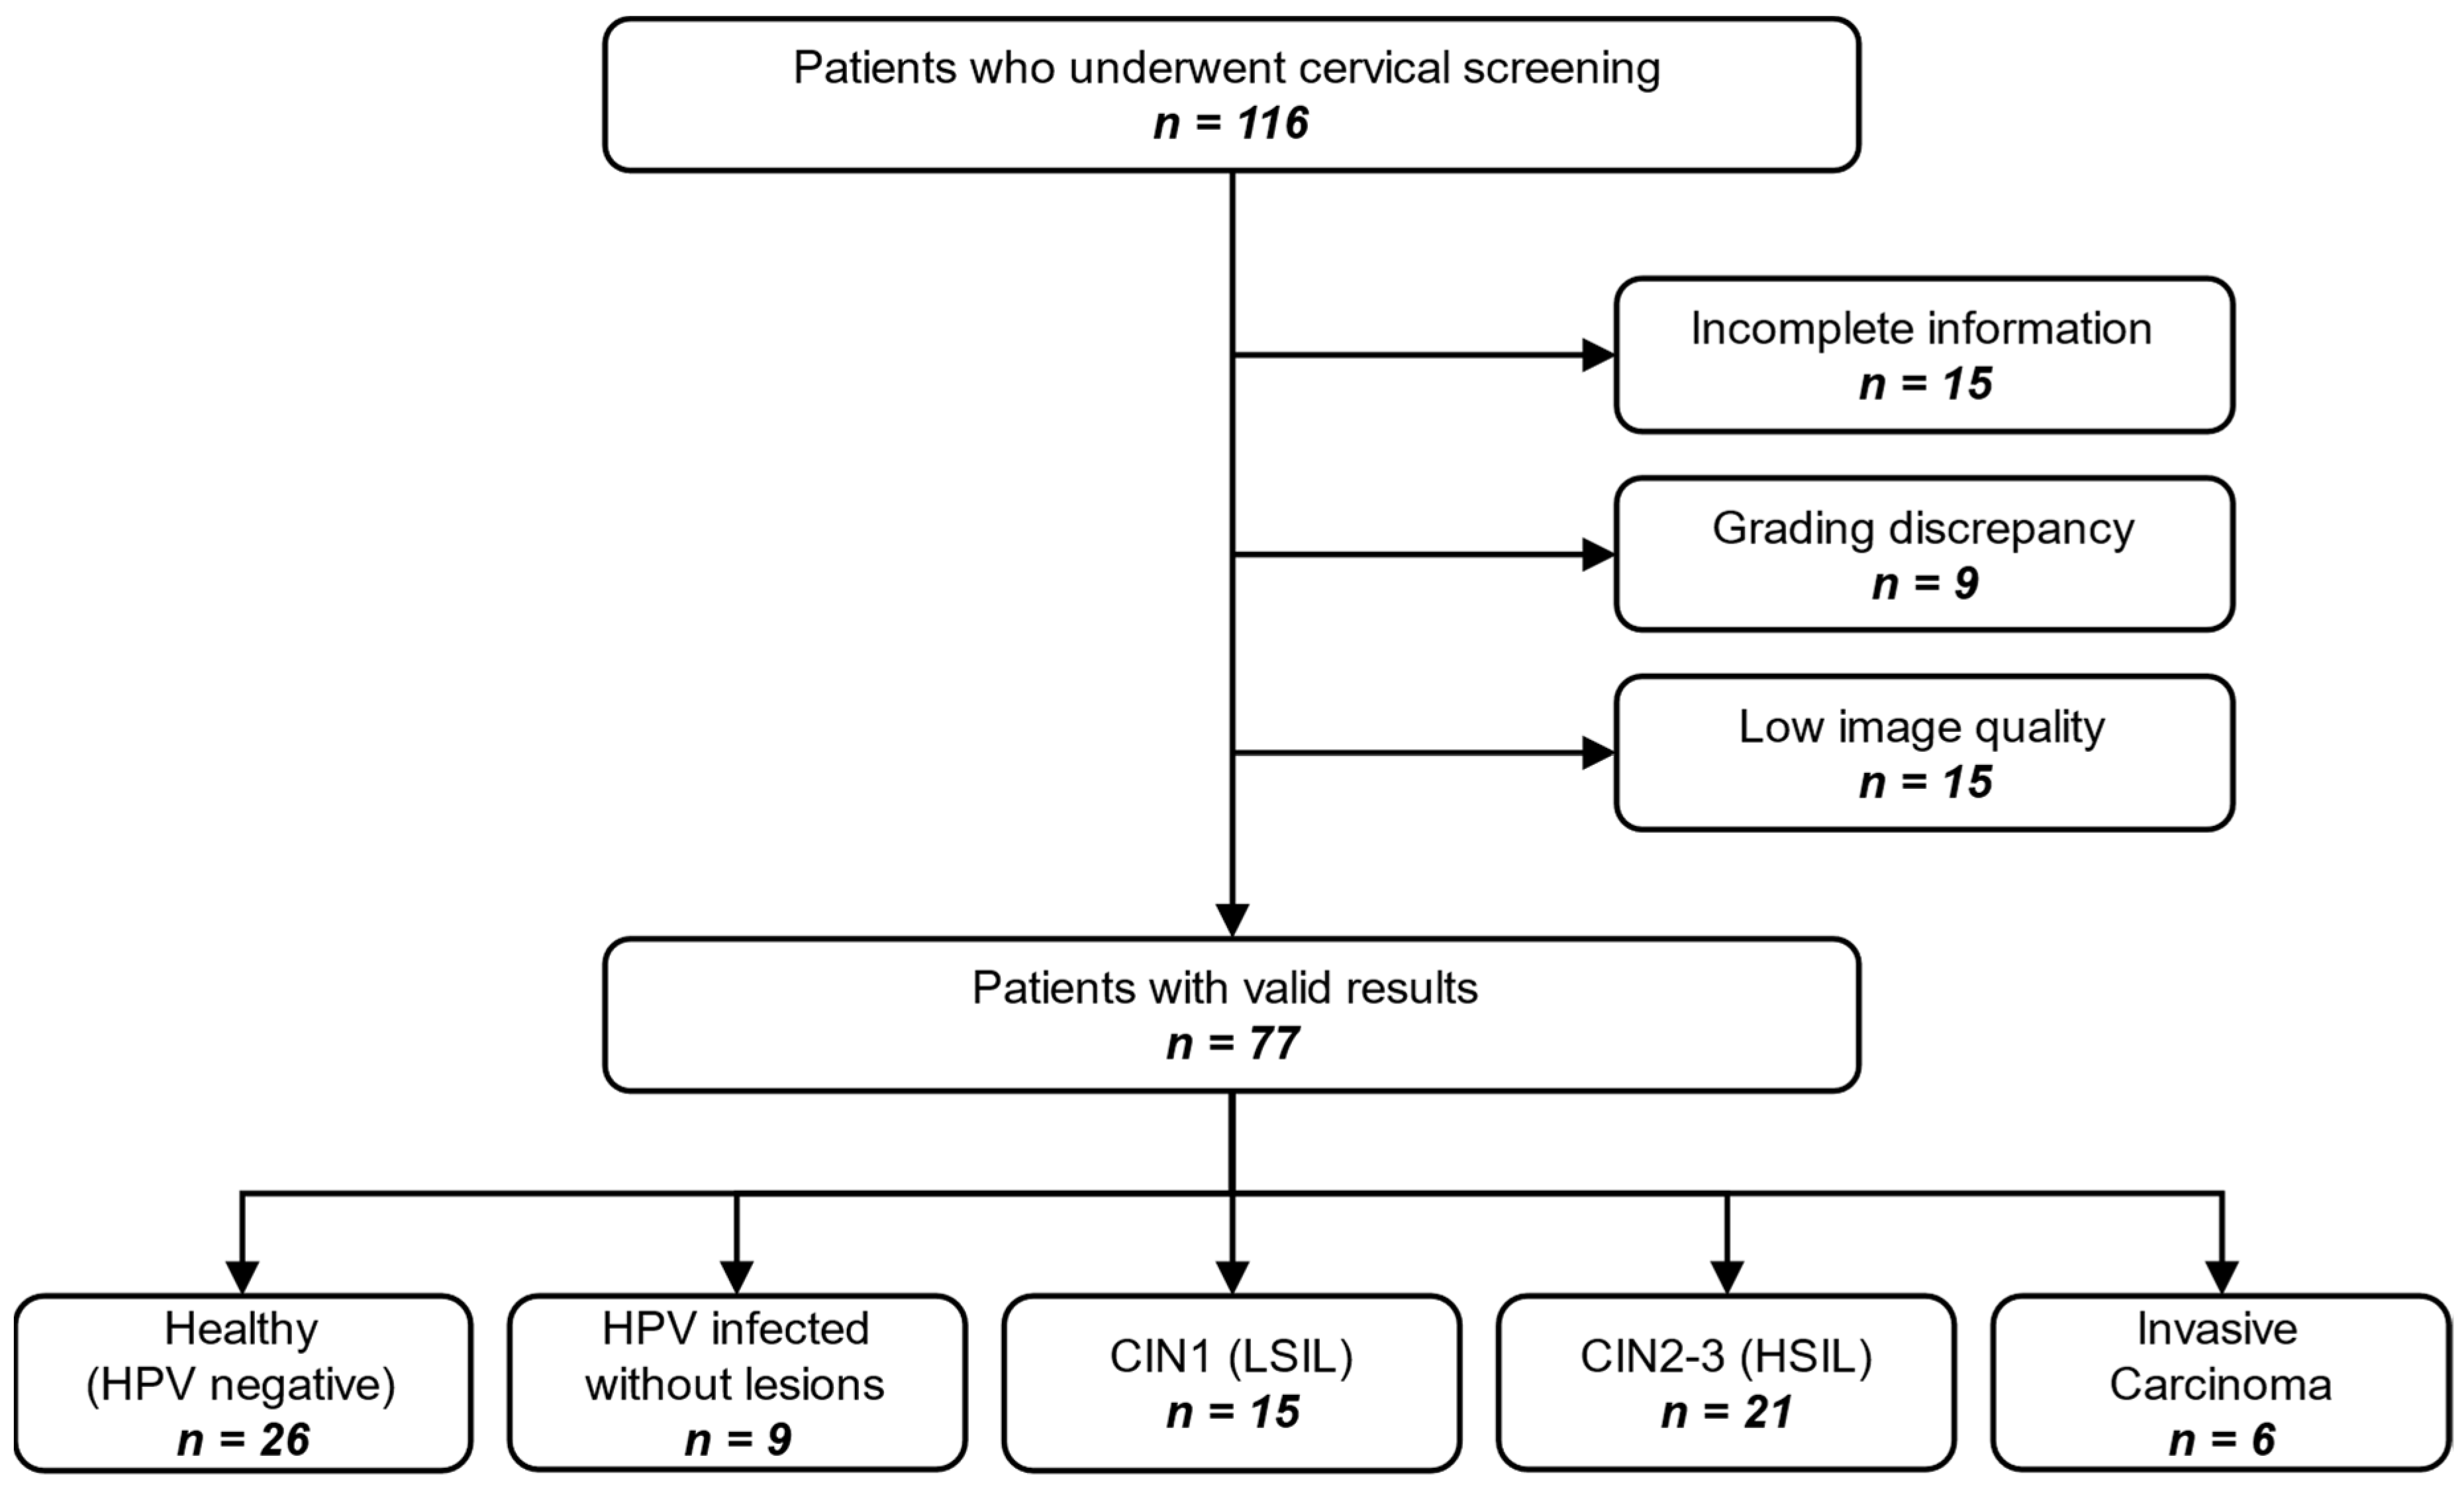
Women aged 18 or older who were treated at the CHUIMI in Las Palmas de Gran Canaria, Spain, were eligible for the study. Patients were recruited during screening and diagnostic evaluation by a gynecologist specializing in cervical cancer. The gynecologist conducted a regular consultation, collected the patient’s sociodemographic and clinical information, and captured the cervix using the HS colposcope. Over a 32-month period, 245 HS images were acquired from 116 different patients. However, it was determined that 15 of them were excluded due to incomplete information across image modalities and/or clinical data. Furthermore, nine patients were excluded due to discrepancies in pathological grading between the time of HS image acquisition (during colposcopy) and subsequent evaluations. Finally, 15 patients were excluded due to low-quality HS images, mainly because of substantial patient movement during acquisition, which produced motion artefacts or severe blurring. The final dataset is composed of 77 HS images from 77 patients where: 6 (8%) were diagnosed with invasive carcinoma, 21 (27%) presented CIN2-3 (HSIL) lesions, 15 (19%) presented CIN1 (LSIL) lesions, 9 (12%) were infected with HPV but without any lesions, and 26 (34%) were healthy patients (not infected with HPV and not affected by any lesion). The patient selection workflow is summarized in Figure 2.
Figure 2.
Flow diagram of the 116 patients screened, exclusions applied, and final cohort split.
In addition, Table 5 presents the statistical analysis based on the dataset’s clinical variables. The data show that most variables did not differ statistically across diagnostic categories, suggesting that the dataset does not exhibit strong demographic biases. Age, parity, smoking status, contraceptive method, age at first intercourse, number of sexual partners, and menopausal status all showed p-values > 0.05, indicating no strong association with lesion severity in this sample. In contrast, HPV testing results were strongly associated with clinical diagnosis (p < 0.001): HPV-16 infection was substantially more frequent among patients diagnosed with HSIL or invasive carcinoma, while HPV-negative patients were predominantly normal. Similarly, cytology and colposcopic findings displayed a highly significant correlation with the final diagnosis (p < 0.001), as expected given their diagnostic relevance. These results confirm that the cohort reflects the well-established clinical patterns linking HPV-16 infection and abnormal cytology/colposcopy to higher-grade cervical lesions, while maintaining balanced distributions in other sociodemographic factors.
Table 5.
Statistical study of the clinical variables of the dataset.
3.5. Annotation of the HS Images
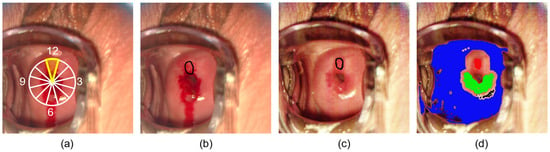
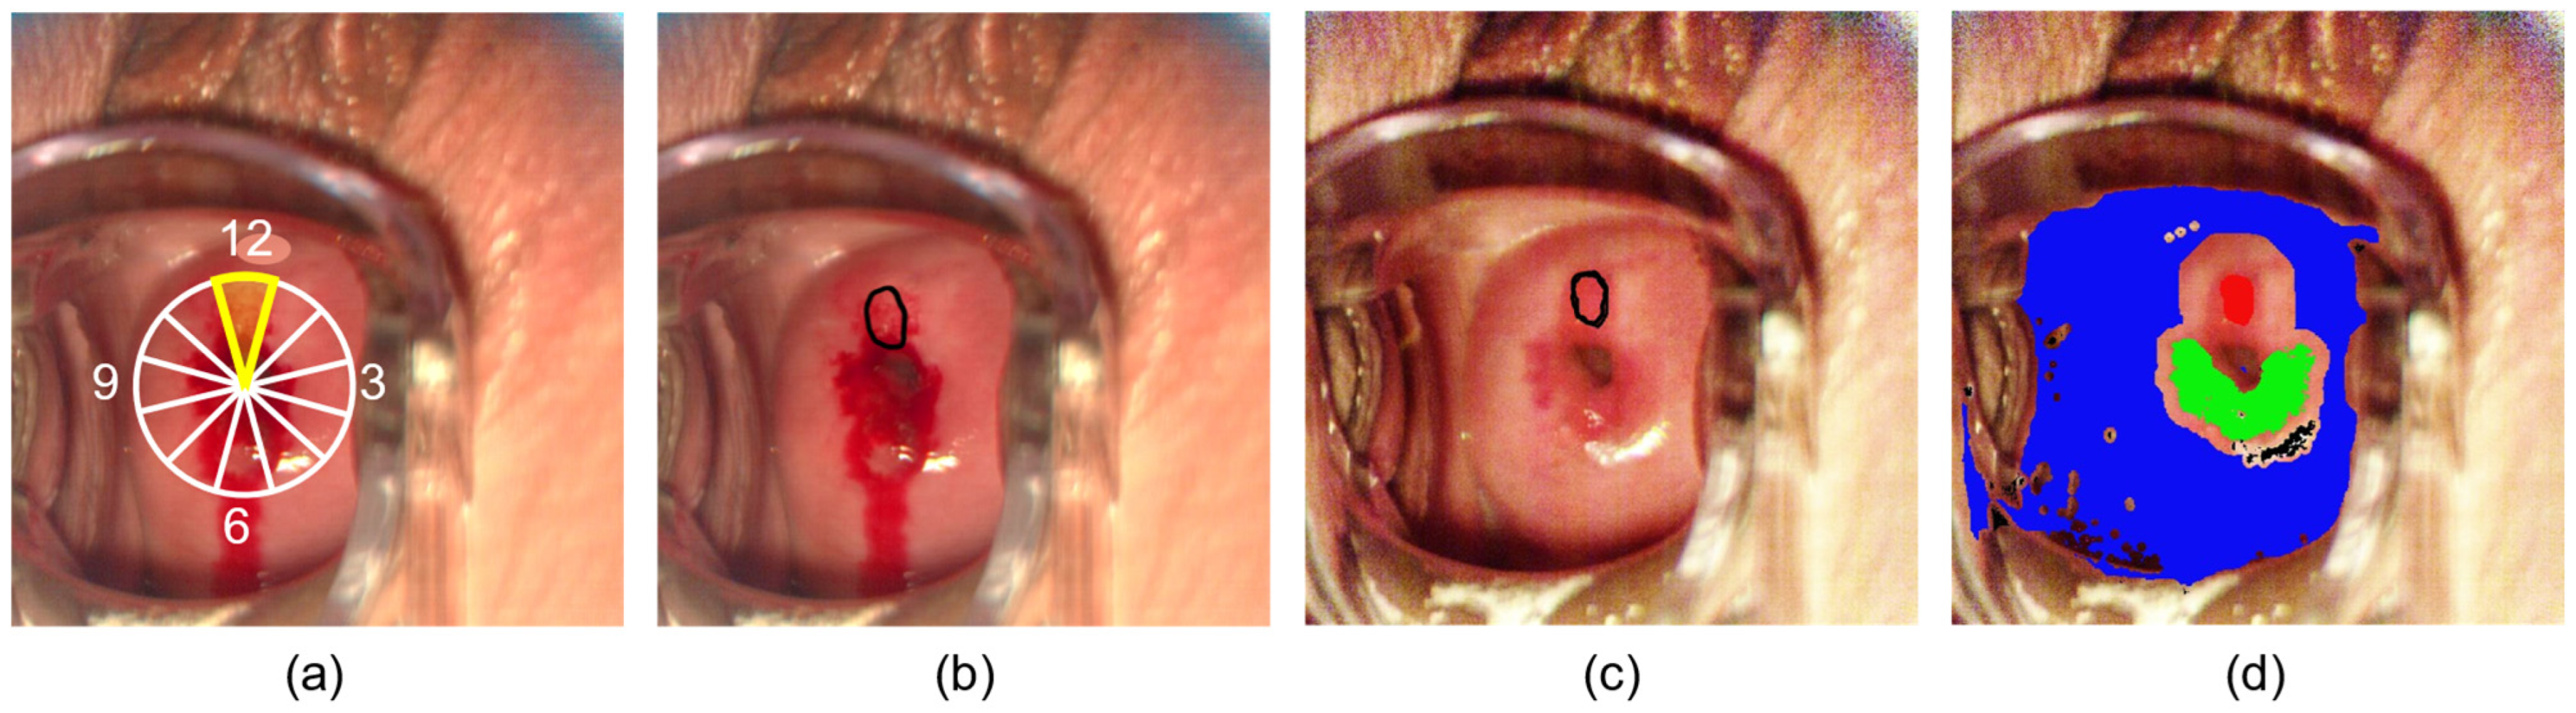
The HS images in this dataset were annotated at the pixel level into six distinct classes: Normal (HPV-Infected), Normal (Gold Standard), CIN 1, CIN 2, CIN 3, and Invasive Carcinoma. Lesion annotations (CIN and invasive carcinoma) were performed manually by an experienced gynecologist based on 38 biopsy-confirmed diagnoses. Biopsy location was recorded using the cervical clock-face notation (Figure 3a), and the lesion extent was delimited based on the post-acetic-acid capture by using the aceto-whitening as the reference (Figure 3b). Finally, the resulting delimitation was manually transferred to the baseline HS image (Figure 3c), and the annotations were created (Figure 3d). Patients with a cancer diagnosis were exclusively labelled as invasive carcinoma and not assigned to any other class. Pixels from the cervical area of patients diagnosed as HPV-negative and clinically normal were annotated as Normal (Gold Standard). The remaining cervical pixels from patients who did not meet the previous condition were annotated as Normal (HPV-Infected).
Figure 3.
Workflow for lesion annotation of the HS images. (a) Record the biopsy site in clock-face coordinates, (b) delineate the area of strongest acetowhitening, (c) transfer the resulting contour to the baseline (non-acetic) image, and (d) final annotation of the cervix region overlaid on the image, where lesions are shown in red, and ectocervix and endocervix from the normal HPV-infected class are shown in blue and green, respectively. The white figure represents the different sections in the clock-face coordinates, and the yellow area represents those indicated by the biopsy coordinates.
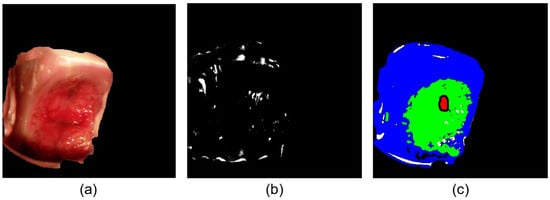
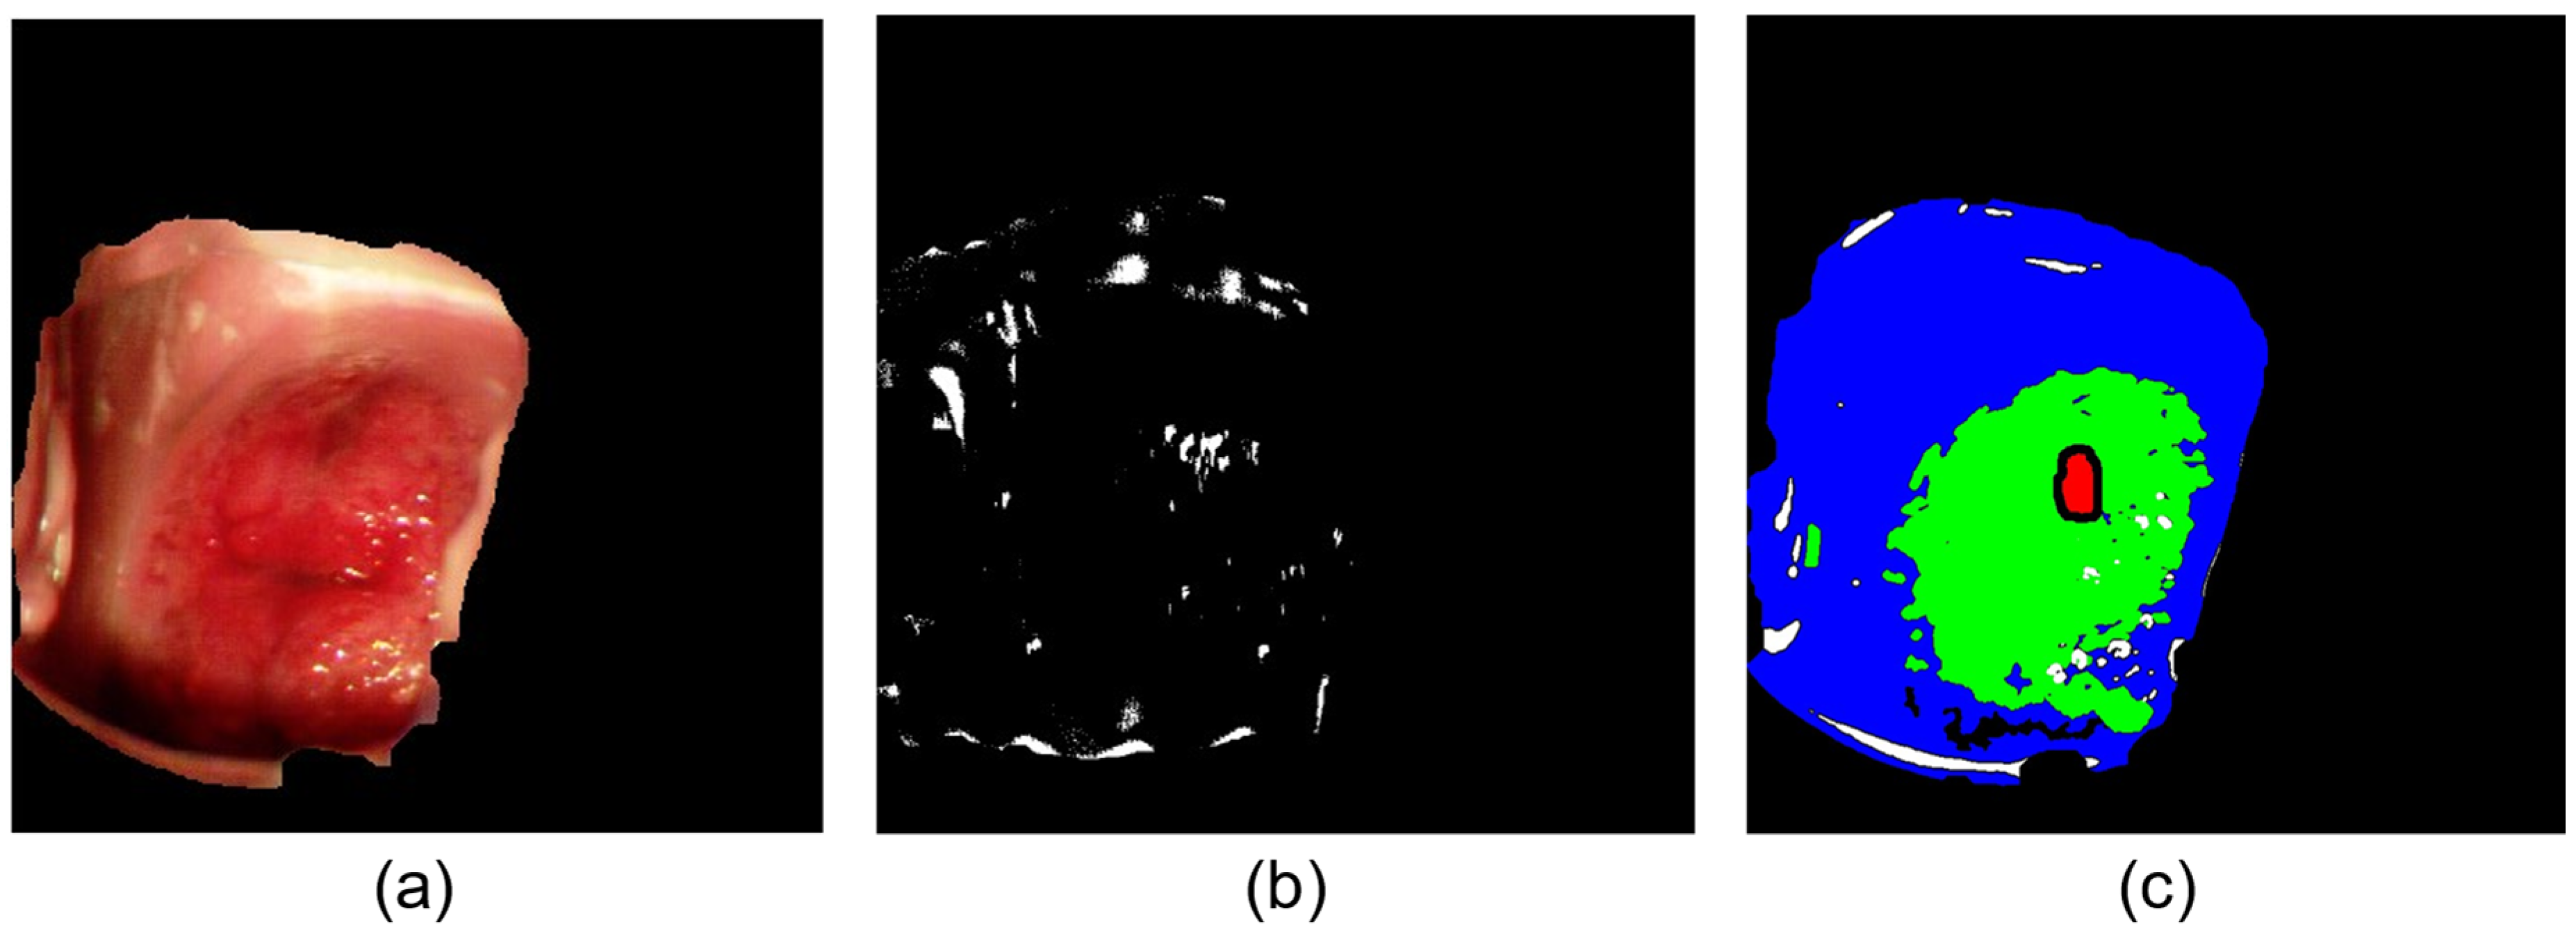
Annotations from the Normal (HPV-Infected) and Normal (Gold Standard) were subdivided into the subclasses ectocervix, endocervix, and outliers. These annotations are based on an unsupervised method presented in [14] and evaluated by a gynecologist, with any necessary corrections made. In addition, this method automatically generates two masks: the first delineates the cervical region within the speculum from the surrounding tissue, while the second identifies outliers, such as glares or abnormal elements, within the cervical mask. Figure 4 shows an example of the cervical and outliers mask (Figure 4a and Figure 4b, respectively) and the GT annotations for Normal (HPV-Infected) and Normal (Gold Standard) subdivided into ectocervix and endocervix (Figure 4c).
Figure 4.
GT examples: (a) automatic cervical mask, (b) automatic outliers mask, and (c) ectocervix and endocervix (blue and green, respectively) annotations. The red area represents the pixels annotated as lesion in the capture.
3.6. HS Data Calibration
HS images require calibration to determine the reflectance of each pixel relative to the emitted light. In spatio-spectral scanning technology, the HS cube is reconstructed from the filters integrated in front of the individual sensor pixels. These filters are designed for specific central wavelengths; however, manufacturing variability introduces deviations in their actual spectral response. To address this, IMEC, the camera manufacturer, provides a generic calibration procedure that compensates for sensor-specific variability by interpolating the data into a fixed 150-band HS cube. However, the complexity of our acquisition setup motivated the development of a custom calibration pipeline tailored to the specific HS camera model and based on the sensor’s true spectral response.
First, spectral bands that were identified as invalid due to manufacturing constraints were removed. The remaining bands were arranged according to their calibrated filtering wavelength. This approach increased the usable spectral representation from 150 interpolated bands to 158 directly measured bands, preserving the sensor’s actual spectral measurements rather than relying on interpolated values.
Subsequently, all spectral signatures were denoised using a two-stage Gaussian filtering strategy. An initial, more aggressive filter was applied to bands spanning the transition between the two sensor technologies (767.97–805.04 nm), followed by a less aggressive filter across the entire spectrum to reduce high-frequency noise.
Finally, the reflectance was computed pixel by pixel by following the flat field calibration equation:
where the white reference (WR) corresponds to the pixel captured using a high-reflection material (Zenith Lite Diffuse Target SG3151, SphereOptics GmbH, Herrsching, Germany). The dark reference (DR) is an image captured with the shutter closed, allowing the base noise level of the sensor to be modelled. I is the light reflected from the sample at the sensor, which in this case is the raw HS image. R is the coefficient that represents the amount of light reflected by the tissue compared to the light that is being emitted.
4. User Notes
Machine Learning Guidelines and Benchmark Protocol
The HyCervix dataset has also been prepared to support preliminary studies and benchmarking for training and validating machine learning algorithms. The development of machine learning algorithms for the non-invasive identification of cancer based on spectral response is a rapidly advancing area of research [12]. Recent studies suggest that HSI can objectively distinguish CIN lesions using different biomarkers detectable in spectra [11].
However, its use in machine learning development should be done with consideration of its limited sample size and class distribution. The generation of imaging datasets of cervical cancer is especially challenging due to the relatively low incidence of cervical cancer in higher-income countries. Current screening campaigns detect most cases at an early stage, avoiding the development of invasive carcinoma. The presented dataset also shows class imbalance and a limited sample size, indicating that it is primarily intended for preliminary studies and benchmarking rather than for training fully robust clinical models.
In Table 6, a configuration for pixel-level training is presented, in which the entire dataset was simplified into 4 different groups based on the Bethesda system (Normal, LSIL, HSIL, Invasive Carcinoma). When analyzed by the number of labelled pixels, the imbalance is clear: 96.4% of pixels are from the Normal group, while just 0.4% are from the LSIL group. But from a patient’s point of view, the Normal group comprises 26 patients (38%), while the LSIL group comprises 15 patients (22%), accounting for only 0.4% of the pixels. This occurs because the lesions are small relative to the size of the cervical region. The invasive carcinoma group comprises only 6 patients and is the most limited in terms of interpatient variability.
Table 6.
Proposed dataset grouping and distribution for machine learning classification.
To overcome this imbalance problem and the limited number of patients with invasive carcinoma, we have included the “group” variable in the CSV file to indicate which patient was used as training and test in previous work to perform machine learning analyses [16]. The test distribution ensures a balanced number of patients from each class. For training, we recommend performing k-fold cross-validation for training and validation, using a patient-based data partition rather than a pixel-based one to account for inter-patient variability. Furthermore, within the training group, we recommend enforcing a balanced distribution by limiting the number of pixels from the minority class when using multiclass algorithms.
Using this dataset, a recent study from our group has reported a binary classification between the Normal class and the HSIL + IC class, which combines the pixels from the HSIL and invasive carcinoma groups [16]. The analysis was performed at the pixel level, using only each pixel’s spectral signature as input to several machine learning models. The best results obtained on the test patients are presented in Table 7, with an F1-score of 0.85 ± 0.11 for normal pixels and 0.62 ± 0.42 for HSIL + IC. Similar trends were observed for precision (0.91 ± 0.14 and 0.69 ± 0.46, respectively) and recall (0.83 ± 0.14 and 0.60 ± 0.39, respectively). While the Normal class showed consistently strong performance with low variability across patients, the HSIL + IC class exhibited substantially larger standard deviations. This higher variability is likely driven by several inter-patient factors, including differences in lesion size, shape, grade composition, and spatial distribution within the cervix, as well as variability in the relative proportion of ectocervix, endocervix, and abnormal tissue captured in each case. In addition, acquisition-related factors such as patient motion during the relatively long HS acquisition time and subtle illumination shifts can degrade spectral fidelity, further increasing performance variability across patients. Therefore, these results should be regarded as a useful baseline for benchmarking while also reflecting the task’s intrinsic difficulty.
Table 7.
Reference benchmark results for binary classification between Normal and HSIL+IC classes from [16].
Author Contributions
Conceptualization, C.V. and R.L.; methodology, software, validation, and formal analysis, C.V.; patient recruitment and data curation, NM; writing—original draft preparation, R.L.; writing—review and editing, C.V., R.L.; visualization, C.V.; supervision, N.M., A.M., H.F. and G.M.C.; funding acquisition, G.M.C. All authors have read and agreed to the published version of the manuscript.
Funding
This work was supported by the Spanish Government and European Union (FEDER funds) as part of support program in the context of the OASIS project, under contract PID2023-148285OB-C43 AEI/10.13039/501100011033. This work was completed while Carlos Vega García was a beneficiary of a pre-doctoral grant given by the Agencia Canaria de Investigacion, Innovacion y Sociedad de la Información (ACIISI) of the Consejería de Economía, Conocimiento y Empleo, which is part-financed by the European Social Fund (FSE) (POC 2014–2020, Eje 3 Tema Prioritario 74 (85%)).
Institutional Review Board Statement
The study was conducted in accordance with the Declaration of Helsinki and approved by the Ethics Committee of the Hospital Universitario de Gran Canaria Doctor Negrín, Spain (protocol code: 2022-081-1; date of approval: 25 March 2022).
Informed Consent Statement
Informed consent was obtained from all subjects involved in the study.
Data Availability Statement
The dataset can be found at Zenodo: https://doi.org/10.5281/zenodo.18208664.
Acknowledgments
The cooperation of OPTOMIC España S.A. is gratefully acknowledged for the donation of the Colposcope, used for the development of the proposed system, and their technical support.
Conflicts of Interest
The authors declare no conflicts of interest.
Abbreviations
The following abbreviations are used in this manuscript:
| HS | Hyperspectral |
| HSI | Hyperspectral Imaging |
| CIN | Cervical Intraepithelial Neoplasia |
| HPV | Human Papillomavirus |
| IC | Invasive Carcinoma |
| HSIL | High-Grade Squamous Intraepithelial Lesion |
| LSIL | Low-Grade Squamous Intraepithelial Lesion |
| GT | Ground Truth |
| GUI | Graphical User Interface |
References
- Wentzensen, N.; Walker, J.; Smith, K.; Gold, M.A.; Zuna, R.; Massad, L.S.; Liu, A.; Silver, M.I.; Dunn, S.T.; Schiffman, M. A Prospective Study of Risk-Based Colposcopy Demonstrates Improved Detection of Cervical Precancers. Am. J. Obstet. Gynecol. 2018, 218, 604.e1–604.e8. [Google Scholar] [CrossRef] [Scilit] [PubMed]
- Lycke, K.D.; Kalpathy-Cramer, J.; Jeronimo, J.; de Sanjose, S.; Egemen, D.; del Pino, M.; Marcus, J.; Schiffman, M.; Hammer, A. Agreement on Lesion Presence and Location at Colposcopy. J. Low. Genit. Tract Dis. 2024, 28, 37–42. [Google Scholar] [CrossRef] [Scilit] [PubMed]
- Bray, F.; Laversanne, M.; Sung, H.; Ferlay, J.; Siegel, R.L.; Soerjomataram, I.; Jemal, A. Global Cancer Statistics 2022: GLOBOCAN Estimates of Incidence and Mortality Worldwide for 36 Cancers in 185 Countries. CA Cancer J. Clin. 2024, 74, 229–263. [Google Scholar] [CrossRef] [Scilit] [PubMed]
- Bray, F.; Carstensen, B.; Møller, H.; Zappa, M.; Žakelj, M.P.; Lawrence, G.; Hakama, M.; Weiderpass, E. Incidence Trends of Adenocarcinoma of the Cervix in 13 European Countries. Cancer Epidemiol. Biomark. Prev. 2005, 14, 2191–2199. [Google Scholar] [CrossRef] [Scilit] [PubMed]
- Bray, F.; Loos, A.H.; McCarron, P.; Weiderpass, E.; Arbyn, M.; Møller, H.; Hakama, M.; Parkin, D.M. Trends in Cervical Squamous Cell Carcinoma Incidence in 13 European Countries: Changing Risk and the Effects of Screening. Cancer Epidemiol. Biomark. Prev. 2005, 14, 677–686. [Google Scholar] [CrossRef] [Scilit] [PubMed]
- Utada, M.; Chernyavskiy, P.; Lee, W.J.; Franceschi, S.; Sauvaget, C.; Berrington de Gonzalez, A.; Withrow, D.R. Increasing Risk of Uterine Cervical Cancer among Young Japanese Women: Comparison of Incidence Trends in Japan, South Korea and Japanese-Americans between 1985 and 2012. Int. J. Cancer 2019, 144, 2144–2152. [Google Scholar] [CrossRef] [Scilit] [PubMed]
- Walboomers, J.M.; Jacobs, M.V.; Manos, M.M.; Bosch, F.X.; Kummer, J.A.; Shah, K.V.; Snijders, P.J.F.; Peto, J.; Meijer, C.J.L.M.; Muñoz, N. Human Papillomavirus Is a Necessary Cause of Invasive Cervical Cancer Worldwide. J. Pathol. 1999, 189, 12–19. [Google Scholar] [CrossRef] [Scilit]
- Ostör, A.G. Natural History of Cervical Intraepithelial Neoplasia: A Critical Review. Int. J. Gynecol. Pathol. 1993, 12, 186. [Google Scholar] [CrossRef] [Scilit] [PubMed]
- Yu, Y.; Ma, J.; Zhao, W.; Li, Z.; Ding, S. MSCI: A Multistate Dataset for Colposcopy Image Classification of Cervical Cancer Screening. Int. J. Med. Inform. 2021, 146, 104352. [Google Scholar] [CrossRef] [Scilit] [PubMed]
- Ben, O.; Jones, J.L.; Kumar, H.; Risdal, M.; Rao, M.; Sherman, V. Intel & MobileODT Cervical Cancer Screening. Kaggle Competition. 2017. Available online: https://www.kaggle.com/competitions/intel-mobileodt-cervical-cancer-screening (accessed on 17 January 2026).
- Jurjuţ, O.; Weiss, M.; Daniel, Y.; Matovina, S.; Neis, F.; Rall, K.; Schöpp, K.; Henes, M.; Linzenbold, W.; Brucker, S.Y.; et al. Detection of Cervical Intraepithelial Neoplasia Using Hyperspectral Tissue Signatures. IEEE J. Transl. Eng. Health Med. 2025, 13, 532–539. [Google Scholar] [CrossRef] [Scilit] [PubMed]
- Schimunek, L.; Schöpp, K.; Wagner, M.; Brucker, S.Y.; Andress, J.; Weiss, M. Hyperspectral Imaging as a New Diagnostic Tool for Cervical Intraepithelial Neoplasia. Arch. Gynecol. Obstet. 2023, 308, 1525–1530. [Google Scholar] [CrossRef] [Scilit] [PubMed]
- Vega, C.; Medina, N.; Leon, R.; Fabelo, H.; Martín, A.; Callico, M.G. HyCervix Dataset. Zenodo 2026. [Google Scholar] [CrossRef]
- Vega, C.; Medina, N.; Quintana-Quintana, L.; Leon, R.; Fabelo, H.; Rial, J.; Martín, A.; Callico, G.M. Feasibility Study of Hyperspectral Colposcopy as a Novel Tool for Detecting Precancerous Cervical Lesions. Sci. Rep. 2025, 15, 820. [Google Scholar] [CrossRef] [Scilit] [PubMed]
- Nayar, R.; Wilbur, D.C. The Bethesda System for Reporting Cervical Cytology: Definitions, Criteria, and Explanatory Notes; Springer: Berlin/Heidelberg, Germany, 2015. [Google Scholar]
- Vega, C.; Medina, N.; Leon, R.; Fabelo, H.; Martín, A.; Callico, G. In-Vivo Detection of Cervical Cancer Lesions Using Hyperspectral Colposcopy. Prepr. Res. Sq. 2026. [Google Scholar] [CrossRef] [Scilit]

Disclaimer/Publisher’s Note: The statements, opinions and data contained in all publications are solely those of the individual author(s) and contributor(s) and not of MDPI and/or the editor(s). MDPI and/or the editor(s) disclaim responsibility for any injury to people or property resulting from any ideas, methods, instructions or products referred to in the content. |
© 2026 by the authors. Licensee MDPI, Basel, Switzerland. This article is an open access article distributed under the terms and conditions of the Creative Commons Attribution (CC BY) license.