


Abstract
Quality monitoring in diagnostic-device manufacturing requires datasets that preserve temporal, hierarchical, and calibration-related structure while avoiding information leakage in predictive evaluation. This study presents the Diabetes-QMS Benchmark, a de-identified multi-level industrial dataset comprising 800 records: 70 completed glucose quality-control series, 690 HbA1c measurement-level records, and 40 HbA1c production-lot records collected between 2020 and 2026. Technical validation included statistical process control, leakage-aware classification analysis, production-lot-grouped and leave-one-year-out calibration evaluation, haematocrit-stratified bias assessment, conformal prediction, and lot-level anomaly screening. Glucose QC monitoring revealed increasing instability in the monitored quality-control indicators over time, with the most pronounced excursion occurring in 2025. Under production-lot-grouped validation, Random Forest calibration achieved performance numerically comparable with factory calibration (MAE 0.506 versus 0.541), whereas leave-one-year-out evaluation showed substantially poorer temporal generalisation of the static model. Conformal coverage similarly deteriorated under temporal shift, and calibration bias varied across haematocrit ranges. Lot-level analysis revealed pronounced temporal calibration drift and increased anomaly prevalence in 2025. The benchmark therefore provides a reusable resource for investigating manufacturing quality monitoring, temporal robustness, uncertainty quantification, anomaly screening, and leakage-aware machine learning under realistic industrial data constraints.
Dataset: https://huggingface.co/datasets/BekzatK/diabetes-qms-benchmark (accessed on 2 August 2026).
Dataset License: CC BY 4.0.
1. Summary
Diabetes mellitus represents a major and growing global health burden, creating sustained demand for reliable analytical systems for the measurement of glucose and glycated haemoglobin (HbA1c) [1,2,3,4]. The performance of these systems depends not only on analytical accuracy at the point of measurement but also on the stability of manufacturing, calibration, and quality-control processes. In diagnostic-device manufacturing, gradual changes in raw materials, production conditions, analytical response, or calibration behaviour may affect product performance over time. Quality-management frameworks therefore require traceable and reproducible approaches for monitoring manufacturing stability and identifying potentially meaningful process changes [5,6].
The increasing availability of manufacturing data creates opportunities to complement conventional quality-control procedures with statistical process control, machine learning, anomaly detection, calibration modelling, and predictive uncertainty analysis [7,8]. However, industrial data present several methodological challenges. Observations may be clustered within production lots, manufacturing regimes may change over time, abnormal outcomes are often rare, and some variables become available only after completion of the quality-control or reference-measurement procedure. If these characteristics are ignored, predictive performance may be overestimated because of target leakage, shared production context, or inappropriate random partitioning [9]. Reliable industrial benchmarking therefore requires datasets that preserve both the hierarchical organisation of production and the temporal order in which manufacturing conditions evolve.
The Diabetes-QMS Benchmark was developed to address these requirements in the context of glucose and HbA1c diagnostic-device manufacturing [10]. It is a publicly available, de-identified, multi-level industrial dataset derived from routine manufacturing quality-control, calibration, and analytical-process records. The benchmark contains 800 records across three complementary analytical levels: 70 completed glucose quality-control series collected between 2020 and 2026, 690 HbA1c measurement-level observations collected between 2022 and 2026, and 40 HbA1c production-lot records covering the same overall period. For HbA1c analyses requiring complete haematocrit information, the benchmark provides a complete-case analytical subset of 635 measurements from 39 production lots collected between 2023 and 2026. These components are preserved as distinct units of analysis rather than being merged into a single homogeneous table.
A central feature of the benchmark is the explicit preservation of variable availability, temporal structure, and production-lot hierarchy. In the glucose component, the final complete-series control coefficient of variation and maximum absolute percentage error contribute to the definition of the QC pass/fail outcome. Models using these quantities to reproduce the same final outcome should therefore be interpreted as retrospective end-of-series classifiers rather than as prospective early-warning systems. Similarly, HbA1c errors calculated against the reference measurement are retained for analytical evaluation rather than used as independent calibration predictors. At the production-lot level, calibration variables involved in defining the rule-based anomaly outcome must be distinguished from independent process descriptors when leakage-restricted anomaly screening is performed. These distinctions enable the benchmark to support methodological investigation not only of model accuracy but also of whether the evaluation design is appropriate for the intended prediction point.
Technical validation demonstrates that the benchmark contains a meaningful temporal and hierarchical manufacturing structure. The glucose QC-series component shows a relatively stable period during 2020–2022, followed by deterioration beginning in 2023, a pronounced excursion in 2025, and partial recovery in 2026. Statistical process control analyses showed that cumulative sum and exponentially weighted moving average monitoring detected sustained changes before the main concentration of failed QC series. Feature-sensitivity analysis further demonstrated that apparently strong retrospective glucose QC classification performance was partly dependent on temporally informative and complete-series control variables. These findings make the glucose component suitable for studying process drift, change detection, target-definition leakage, and the distinction between retrospective classification and genuinely prospective early-warning evaluation.
The HbA1c measurement-level analyses highlight an equally important distinction between within-regime generalisation and temporal transfer. Under production-lot-grouped validation, Random Forest calibration achieved numerical performance comparable with the established factory calibration, with mean absolute errors of 0.506 and 0.541, respectively; however, the difference was statistically inconclusive. In contrast, leave-one-year-out evaluation showed that the same static Random Forest model produced a higher error than factory calibration in every held-out production year. Predictive uncertainty showed a similar pattern: split-conformal prediction achieved approximately nominal coverage under in-regime evaluation but exhibited substantial coverage degradation when transferred across production periods. Haematocrit-stratified analysis additionally demonstrated that calibration bias varied across analytical operating ranges, indicating that pooled performance measures may obscure subgroup-dependent analytical behaviour.
At the production-lot level, the dataset supports investigation of longitudinal calibration variation and anomaly screening. Calibration characteristics varied substantially across production years, with the largest lot-level coefficient deviations and the highest rule-based anomaly prevalence observed in 2025. Isolation Forest provided an illustrative unsupervised anomaly-screening baseline, but its agreement with the rule-based anomaly outcome depended on the assumed contamination level and should not be interpreted as independently validated anomaly detection. The lot-level component should therefore be used primarily for methodological comparison, sensitivity analysis, and prioritisation research rather than for autonomous manufacturing decisions. The limited number of available production lots, particularly the single selected reference lot from 2022, should also be considered when interpreting temporal patterns.
The benchmark has several additional limitations. It originates from a single manufacturing environment, contains relatively few failed glucose QC series and production lots, and includes haematocrit missingness concentrated within particular production periods. Potentially relevant contextual variables, including equipment-maintenance history, environmental conditions, operator information, supplier or reagent changes, and corrective-action records, are not included. These limitations restrict causal interpretation and external generalisation but simultaneously provide realistic conditions for studying validation methodology, structured missingness, temporal distribution shift, and model robustness.
Overall, the Diabetes-QMS Benchmark provides a reusable industrial resource for research on statistical process control, calibration modelling, production-lot-aware validation, temporal generalisation, uncertainty quantification, haematocrit-dependent analytical bias, anomaly screening, missing-data handling, and leakage-aware machine learning. Its principal contribution is not to demonstrate the superiority of a particular predictive algorithm, but to provide a structured benchmark in which researchers can examine whether statistical and machine-learning methods remain reliable under changing production conditions and when predictor availability is defined according to the intended decision point. The benchmark is intended for retrospective methodological and human-supervised manufacturing-quality research rather than for patient-level diagnosis, independent regulatory conformity assessment, or autonomous product-release decisions.
2. Related Work
The digitalisation of manufacturing has accelerated the transition from conventional retrospective quality inspection towards data-driven predictive quality, continuous process monitoring, and proactive quality management. Machine-learning and deep-learning methods are increasingly used to estimate product quality from process and sensor data, enabling earlier identification of deviations and supporting process optimisation. In their systematic review of predictive-quality research, Tercan and Meisen [7] documented the growing application of machine-learning methods across heterogeneous manufacturing processes, while also identifying persistent challenges related to limited industrial datasets, inconsistencies in evaluation procedures, and sustainable deployment in production environments. From a statistical process control perspective, Mayer and Jochem [8] similarly described the shift from conventional capability assessment towards machine-learning-supported predictive process control, emphasising that the effectiveness of such approaches depends strongly on data quality, process characteristics, uncertainty, and robustness under changing operating conditions.
A persistent challenge in industrial quality monitoring is the scarcity and imbalance of abnormal observations. Manufacturing processes are typically designed to minimise defects, resulting in datasets containing substantially fewer non-conforming than conforming observations. Ribeiro et al. [11] investigated this issue using Isolation Forest and deep autoencoders for anomaly detection in industrial screw-tightening processes. Their rolling-window evaluation demonstrated the potential of unsupervised methods for identifying rare abnormal events while accounting for the dynamic nature of manufacturing data. Song et al. [12] addressed a related problem in wiring-harness manufacturing, where abnormal observations were initially unavailable, by generating synthetic defect examples from normal manufacturing data to train an artificial-intelligence-based fault-detection model. These studies illustrate that rare-event structure and limited defect labels are not merely secondary data-quality issues but fundamental characteristics of many industrial quality-monitoring problems.
Recent research has also progressed beyond isolated defect classifiers towards integrated intelligent quality-management architectures. Ali et al. [13] combined machine-condition monitoring during pre-production with machine-vision-based inspection of manufactured products, demonstrating how information generated at different stages of the production workflow can contribute to an integrated quality-control system. Antosz et al. [14] evaluated neural networks, support vector machines, and bagged trees for defect prediction in metal-product manufacturing and demonstrated the potential of process variables for data-driven quality improvement. Ullah et al. [15] extended this perspective through a cognitive-twin framework integrating feedstock quality, machine degradation, processing quality, and inspection information to support real-time quality optimisation. Collectively, these studies reflect a broader transition from isolated final inspection towards multi-stage quality-management systems in which information is integrated across the production lifecycle.
As industrial quality systems become increasingly data-intensive, data quality and provenance are critical to the reliability of machine-learning models. Hramov and Pisarchik [16] identified accuracy, completeness, consistency, integration, preprocessing, and fitness for use as key requirements for industrial data intended for artificial-intelligence applications. These considerations are particularly important when observations are hierarchically organised, variables are collected at different stages of the production workflow, or missingness is concentrated within specific production periods. Under such conditions, apparently strong predictive performance may reflect characteristics of dataset construction, grouping strategy, or variable availability rather than stable relationships that generalise to future production.
Anomaly detection introduces an additional methodological challenge because model outputs can be highly sensitive to the underlying data distribution and algorithm configuration. Choi and Jung [17] examined Isolation Forest for process-quality control under different data distributions and bootstrap configurations and demonstrated that anomaly-detection behaviour can vary substantially with modelling choices. This issue is particularly relevant to relatively small production-lot datasets, in which the assumed contamination level can materially affect the number of observations classified as anomalous. Consequently, unsupervised anomaly detection is more informative when continuous anomaly scores and sensitivity analyses are considered alongside binary anomaly classifications.
Beyond model selection, validation design is a major determinant of whether reported performance reflects genuine generalisation. Data leakage can occur when predictors contain information derived from the target, from post-outcome measurements, or from variables that would not be available at the intended prediction point [9]. This problem is especially important in manufacturing datasets containing repeated observations from the same production lot or measurements generated sequentially over time. Henao Villa et al. [18], in a systematic review of artificial intelligence in complex manufacturing systems, identified substantial weaknesses in validation rigour and reported that temporal and cross-domain evaluation remained less common than random or insufficiently specified validation strategies. Their findings reinforce the need to distinguish performance obtained through random partitioning from performance under chronological or structurally independent evaluation.
These methodological requirements are particularly important in medical-device manufacturing, where quality assessment must coexist with traceability, controlled production processes, and human-supervised manufacturing decisions. Gandhi et al. [19] developed and industrially validated an integrated closed-loop quality-control architecture for sterile medical-device assembly that combined radio-frequency identification, machine vision, programmable logic control, and centralised production monitoring. Their study demonstrates the operational importance of linking inspection results to product traceability and manufacturing actions. However, its primary focus is assembly-line inspection and unit-level traceability rather than longitudinal analytical calibration, multi-year process variation, or production-lot-dependent statistical modelling.
Another important challenge is the non-stationary nature of industrial processes. Changes in raw materials, equipment condition, environmental factors, operating settings, or production configuration may alter the relationship between predictors and quality outcomes over time. Kermenov et al. [20] explicitly formulated changing operating conditions in an industrial collaborative robot as a concept-drift problem and proposed an anomaly-detection framework capable of distinguishing legitimate changes in operating conditions from abnormal system behaviour. Gupta et al. [21] subsequently introduced TWIN-ADAPT, a continual-learning framework in which digital-twin-enabled anomaly classifiers are updated as operating conditions and data distributions evolve. These studies demonstrate that changes in data distribution should not automatically be interpreted as quality failures, as they may instead indicate a transition to a new operating regime requiring model adaptation.
The effect of such changes is particularly important for predictive-quality models trained on historical production data. Shen et al. [22] developed a drift-aware quality-monitoring framework for injection moulding that integrates operating-condition drift detection with incremental learning. Their experiments demonstrated that the performance of static predictive models can deteriorate as manufacturing conditions evolve and that model updating can recover part of the lost predictive performance. These findings support a critical distinction between within-regime and temporal generalisation: successful prediction for previously unseen observations drawn from historical production does not necessarily imply equivalent performance when the same model is transferred to a later production period.
Manufacturing-domain information can improve predictive performance, but contextual variables require careful interpretation. Guo et al. [23] proposed a domain-knowledge-informed convolutional neural network integrating operating-condition information with real-time sensor data for manufacturing quality prediction. Their results showed that domain information can improve both prediction and interpretability relative to purely data-driven approaches. Nevertheless, structural metadata such as production year or production-lot identity may encode historically specific production regimes. Such variables are highly useful for defining validation groups and chronological partitions, but their direct use as predictors should be evaluated cautiously when the objective is generalisation to future manufacturing conditions.
In addition to point-prediction accuracy, uncertainty quantification is becoming increasingly relevant for industrial predictive systems. Conformal prediction provides a distribution-light framework for constructing prediction sets or intervals with interpretable empirical coverage properties [24]. However, standard conformal guarantees depend on assumptions concerning the relationship between calibration and future observations. Gibbs and Candès [25] developed adaptive conformal inference for online prediction under arbitrary distribution shifts, demonstrating how uncertainty procedures can be updated when the data-generating process evolves over time. In an industrial context, Moccardi et al. [26] evaluated conformal approaches for predictive maintenance under non-exchangeable and heterogeneous operating conditions. These studies indicate that evaluation under temporal drift should consider not only prediction error but also whether uncertainty estimates preserve adequate empirical coverage following changes in the production distribution.
Diagnostic-device data additionally require consideration of analytical operating conditions and subgroup-dependent measurement effects. Lu et al. [27] demonstrated that haematocrit and ambient temperature can materially affect electrochemical glucose-test-strip measurements and developed a correction framework addressing both sources of interference. Their findings show that aggregate analytical-performance metrics can conceal systematic variation across haematocrit and environmental ranges. Although this work focuses on sensor-level analytical performance rather than manufacturing quality-management benchmarking, it provides relevant evidence that subgroup- and condition-dependent effects should be considered when evaluating glucose-related analytical systems.
Taken together, the recent literature demonstrates substantial progress in predictive quality modelling, statistical and machine-learning-based process control, anomaly detection, intelligent quality-management systems, concept-drift adaptation, continual learning, and uncertainty quantification [7,8,11,12,13,14,15,16,17,18,19,20,21,22,23,24,25,26,27]. Nevertheless, these methodological challenges are typically investigated in isolation. Individual studies commonly focus on a particular manufacturing process, equipment state, defect type, sensor modality, or prediction task. Consequently, comparatively few publicly reusable datasets allow hierarchical manufacturing structure, temporal evolution, analytical calibration, quality-control outcomes, missingness, subgroup-dependent effects, anomaly information, and predictor availability to be investigated jointly. This methodological gap motivates the comparison of existing industrial benchmark datasets and the positioning of the Diabetes-QMS Benchmark within this landscape.
Publicly available industrial benchmark datasets provide an important basis for positioning the present resource; however, they differ considerably in data provenance, modality, temporal organisation, and analytical scope. The SECOM dataset comprises 1567 real semiconductor-manufacturing observations described by 591 sensor and process variables together with pass/fail labels. Although timestamp information is available, the dataset does not preserve an explicit production-lot hierarchy or analytical calibration structure [28]. The AI4I 2020 Predictive Maintenance Dataset contains 10,000 synthetic observations designed to represent industrial predictive-maintenance scenarios and supports failure-classification and regression studies. Nevertheless, its synthetic nature and machine-centred targets limit its suitability for investigating naturally occurring multi-year manufacturing drift or lot-dependent product calibration [29]. The Tennessee Eastman Process benchmark provides multivariate simulated process time series with repeated fault scenarios and has been widely used for process monitoring and fault diagnosis. However, it represents a simulated chemical process rather than routine production records and does not include product-lot-specific analytical calibration [30]. MVTec AD comprises 5354 high-resolution images from 15 industrial object and texture categories together with pixel-level defect annotations, providing a well-established resource for visual anomaly detection. Its scope, however, does not extend to tabular calibration modelling, longitudinal process drift, or production-lot-aware validation [31]. The Skoltech Anomaly Benchmark (SKAB) provides multivariate sensor time series collected from a physical industrial testbed together with anomaly and change-point labels. Its experimental structure is primarily intended for anomaly- and change-point-detection studies rather than longitudinal quality-control and calibration analysis based on routine manufacturing records [32]. A comparative summary of these representative industrial benchmark datasets and Diabetes-QMS is provided in Table 1.
Table 1.
Comparison of representative publicly available industrial benchmark datasets with Diabetes-QMS.
This comparison indicates that the available public resources are complementary rather than directly interchangeable. Although Diabetes-QMS is smaller than several general-purpose industrial benchmarks and is derived from a single manufacturing environment, it addresses a distinct methodological gap. Its principal strength lies in the joint availability of routine manufacturing records at three analytical levels, comprising completed glucose QC series, individual HbA1c measurements, and HbA1c production lots, together with information on production year, lot hierarchy, analytical calibration, structured missingness, subgroup characteristics, QC and anomaly outcomes, and predictor availability. This structure enables the systematic investigation of statistical process control, production-lot-aware and temporal validation, calibration robustness, uncertainty quantification, subgroup-dependent bias, anomaly screening, and target-definition leakage within a common benchmark framework. Diabetes-QMS should therefore be regarded as complementary to existing predictive-maintenance, process-simulation, time-series anomaly-detection, and visual-inspection benchmarks rather than as a replacement for them.
This limitation is particularly relevant to diagnostic-device manufacturing, where a useful methodological benchmark should enable researchers to distinguish retrospective quality assessment from genuinely prospective prediction, maintain separation between observations originating from different production lots during validation, evaluate transfer across manufacturing periods, quantify the effects of temporal distribution shift, and identify predictors that are unavailable or target-derived at the intended decision point. Without these distinctions, apparently strong predictive performance may reflect within-regime interpolation, shared lot characteristics, temporal shortcuts, or target-related information rather than robustness to future manufacturing conditions.
The Diabetes-QMS Benchmark addresses this methodological gap by providing complementary glucose quality-control, HbA1c measurement-level, and HbA1c production-lot data within a unified diagnostic-device manufacturing setting [10]. Its contribution extends beyond the provision of a conventional tabular dataset for model development. By preserving production-year and production-lot structure, analytical calibration information, subgroup variables, structured missingness, QC and anomaly outcomes, and predictor-availability relationships, the benchmark supports the joint investigation of statistical process control, production-lot-aware validation, temporal distribution shift, calibration robustness, haematocrit-dependent analytical bias, predictive uncertainty, anomaly screening, and target-definition leakage. It therefore enables performance obtained within pooled historical data to be distinguished explicitly from performance achieved when analytical models are transferred to previously unseen manufacturing periods.
3. Data Description
3.1. Dataset Overview and Organisation
The Diabetes-QMS Benchmark is a multi-level tabular dataset containing de-identified manufacturing quality-control (QC), calibration, optical-signal, haematocrit, reference-measurement, and production-lot information generated during the routine manufacture of glucose test strips and HbA1c diagnostic systems [10]. The benchmark is publicly available through Hugging Face Datasets in comma-separated value (CSV) format under the Creative Commons Attribution 4.0 International licence [10].
The benchmark comprises three complementary analytical levels: completed glucose QC series, individual HbA1c analytical measurements, and HbA1c production lots. These levels represent distinct units of analysis and should not be interpreted as observations from a single homogeneous table. Table 2 summarises their size, temporal coverage, and principal analytical scope.
Table 2.
Overview of the Diabetes-QMS Benchmark components.
The public release contains 800 records in total: 70 glucose QC-series records, 690 HbA1c measurement-level records, and 40 HbA1c production-lot records [10]. Production year is retained across the benchmark to preserve longitudinal structure, while de-identified production-lot identifiers maintain the hierarchical organisation of the HbA1c data.
The two HbA1c levels are hierarchically related. A single production lot may be associated with multiple individual analytical measurements but with only one lot-level record. The production-lot dataset represents a separately curated production-level view and should not be interpreted as a simple arithmetic aggregation of all measurement-level fields.
By contrast, the glucose QC-series data originate from a distinct manufacturing workflow and have no direct row-level correspondence with the HbA1c records. The components are therefore linked conceptually through their common manufacturing quality-management context rather than through record-level joins.
Figure 1 illustrates the organisation of the benchmark, the relationship between the two HbA1c analytical levels, and the principal stages through which the source manufacturing records were transformed into the published datasets.
Figure 1.
Organisation and curation workflow of the Diabetes-QMS Benchmark.
The released benchmark contains no patient identifiers, treatment records, clinical interventions, or individual diagnostic decisions. It is intended as a resource for manufacturing quality-management and methodological research rather than for patient-level diagnosis or clinical decision-making [10].
3.2. Glucose QC-Series Data
The glucose component contains 70 completed quality-control series collected between 2020 and 2026, with ten series available for each production year. Of these, 59 series satisfied the predefined manufacturing acceptance criteria and 11 did not [10]. Each record represents one completed QC series evaluated across eight predefined glucose concentration conditions.
The dataset captures several complementary aspects of manufacturing QC. Control-solution measurements describe within-series analytical precision through summary measures including the mean, standard deviation, and coefficient of variation. Haematocrit descriptors characterise the analytical conditions represented within each QC series. Concentration-specific measurements are accompanied by reference-based analytical-error information, while aggregated error summaries describe the magnitude, variability, and direction of analytical deviation across the complete series.
Two outcomes are retained for methodological analysis. The first is a continuous maximum-error outcome, representing the largest absolute percentage deviation observed across the evaluated concentration conditions. The second is the final QC pass/fail outcome, reflecting whether the completed QC series satisfied the study-defined manufacturing acceptance criteria. The exact derivation of these outcomes and the associated mathematical definitions are provided in Section 4.5, rather than repeated here.
The principal information contained in the three benchmark levels is summarised in Table 3.
Table 3.
Principal information groups and analytical roles within the Diabetes-QMS Benchmark.
The QC-series level is particularly suitable for retrospective quality assessment and longitudinal process monitoring because each observation summarises a completed QC sequence. However, some complete-series and reference-derived quantities become available only after the corresponding analytical assessments have been completed. Their suitability as predictors therefore depends on the intended prediction point. This distinction is addressed formally in Section 4.9, Leakage and Variable-Availability Assessment, rather than being embedded in the descriptive definition of the dataset.
The 5% control-CV and 10% maximum-error limits used in constructing the final QC outcome are study-specific manufacturing acceptance criteria. They should not be interpreted as direct ISO 15197:2013 [5] conformity limits or as evidence of independent regulatory certification. The derivation and interpretation of these criteria are described in Section 4.
3.3. HbA1c Measurement- and Production-Lot Data
The HbA1c portion of the benchmark is represented at two complementary analytical levels. The measurement-level dataset contains 690 individual analytical observations collected between 2022 and 2026, whereas the production-lot dataset contains 40 de-identified lots covering the same overall period [1]. This hierarchical representation permits analytical behaviour to be examined both at the level of individual measurements and at the broader production-lot level.
At the measurement level, the principal candidate analytical inputs comprise a primary optical signal, a quadratic optical-signal term, a haemoglobin-related optical signal, and haematocrit. The reference HbA1c value provides the supervised calibration outcome, while the factory-calibrated HbA1c value is retained as an established comparator for alternative calibration approaches. Calibration-coefficient information is also retained as manufacturing metadata.
Reference-dependent quantities—including absolute calibration error, relative percentage error, and a study-defined analytical acceptance indicator—are provided to support analytical evaluation. Because these quantities are calculated only after comparison with the reference HbA1c measurement, they represent post-reference evaluation information rather than independent calibration inputs. The legacy name of the analytical acceptance field in the public dataset should not be interpreted as evidence of formal ISO conformity.
The public measurement-level dataset was derived from 1287 source replicate-level records. Records lacking the optical-signal or reference information required for the intended calibration analyses were excluded, yielding 690 published measurements. Among these observations, 55 lacked haematocrit information, comprising 42 records from 2022 and 13 from 2026. Analyses requiring complete haematocrit information therefore use a complete-case subset of 635 measurements from 39 production lots collected between 2023 and 2026. The full 690-record dataset remains publicly available to support alternative approaches to missing-data analysis.
At the production-lot level, each record represents one de-identified lot and contains summaries of haematocrit, optical-signal behaviour, analytical precision, reference measurements, and calibration characteristics. Calibration coefficients and their associated deviations enable changes in calibration behaviour to be examined across production lots and manufacturing periods. A rule-based anomaly outcome is additionally provided for methodological evaluation of lot-level anomaly-detection approaches.
The rule-based anomaly outcome is an internally derived benchmark variable and should not be interpreted as an independently adjudicated expert, regulatory, or product-release classification. When this outcome is analysed, quantities used directly in its construction must be distinguished from independent process descriptors to avoid circular evaluation. The precise construction rules are therefore documented in Section 4 rather than repeated within the dataset description.
The temporal distribution of production lots is unequal: the benchmark contains one lot from 2022, nine lots from 2023, and ten lots in each year from 2024 to 2026. Because only a single production lot is available for 2022, changes relative to that period represent deviations from a selected 2022 reference lot, not departures from a statistically characterised annual baseline.
3.4. Data Completeness and Analytical Scope
The benchmark preserves missing observations rather than providing a fully imputed analytical table. The principal documented source of missingness occurs in the HbA1c measurement-level data, where 55 of 690 observations lack haematocrit information. Because these missing observations are concentrated in 2022 and 2026, complete-case restriction changes the temporal composition of the analytical sample. No haematocrit imputation was applied in the reference benchmark analyses.
The variables contained in the benchmark can be conceptually distinguished into four analytical categories: candidate predictors, structural metadata, supervised outcomes, and post-reference or target-derived quantities. This distinction is important because availability within the manufacturing workflow differs across variables. Production year and de-identified lot identifiers primarily preserve temporal and hierarchical structure, whereas reference-dependent errors and final QC statistics represent information obtained later in the analytical workflow.
The three dataset levels consequently support different but complementary research questions. The glucose QC-series data enable investigation of process stability, analytical error, QC outcomes, and temporal change. The HbA1c measurement-level data support calibration modelling, analytical-bias assessment, subgroup analysis, and uncertainty estimation. The production-lot data support investigation of lot-level calibration variation, temporal drift, and anomaly-screening methods.
Validation procedures are deliberately not prescribed within the Data Description, because their appropriateness depends on the analytical objective and intended prediction point. The benchmark retains year and production-lot structure specifically so that group-aware and chronological strategies can be implemented where appropriate. Detailed treatment of predictor availability, leakage prevention, missing-data handling, grouped validation, and temporal evaluation is provided in Section 4.8, Section 4.9 and Section 4.10.
A machine-readable data dictionary accompanying the public release should provide the exact dataset field names, data types, measurement units, missing-value information, derivation rules, and recommended analytical roles [10]. This separation allows the manuscript to use scientifically interpretable terminology while preserving exact correspondence with the deposited machine-readable files.
The Diabetes-QMS Benchmark should therefore be regarded as a retrospective methodological resource for manufacturing quality monitoring. It is intended to support reproducible investigation of industrial analytical data and validation methodology, rather than patient-level diagnosis, independent regulatory conformity assessment, or autonomous product-release decisions.
4. Methods
4.1. Study Design and Data Source
The Diabetes-QMS Benchmark [10] was developed as a retrospective, multi-level data resource derived from routinely generated manufacturing quality-control, calibration, and analytical-process records for glucose test strips and HbA1c diagnostic systems. The study was designed as a Data Descriptor to transform operational production records into a structured and reusable benchmark for methodological research in manufacturing quality monitoring.
The source manufacturing data used to construct the benchmark were provided by Axel & A LLP (Almaty, Republic of Kazakhstan) and originated from routine manufacturing quality-control, calibration, and analytical-process activities rather than from a prospective clinical study.
Three distinct units of analysis were retained throughout dataset construction: completed glucose QC series, individual HbA1c analytical measurements, and HbA1c production lots. These analytical levels were processed separately because they represent different stages and objectives within the manufacturing workflow and should not be treated as observations from a single homogeneous population.
The benchmark was designed to support research on statistical process control, calibration modelling, temporal and lot-dependent variation, anomaly detection, uncertainty quantification, and leakage-aware machine-learning evaluation. Production year and de-identified production-lot identifiers were retained where applicable to enable chronological and group-aware analyses.
4.2. Data Acquisition and Source Consolidation
The source information consisted of routinely generated manufacturing, calibration, and QC records distributed across operational files corresponding to different diagnostic systems, production periods, analytical procedures, and levels of aggregation.
Data consolidation was performed independently for each analytical level. Source variables were reviewed with respect to their measurement meaning, unit of analysis, temporal coverage, relationship to quality outcomes, and availability within the manufacturing workflow. Records representing different analytical levels were not combined on the basis of row order or file position.
For the glucose data, the completed QC series was retained as the fundamental unit of analysis because the manufacturing acceptance decision was defined at the series level. Replicate control measurements and analytical assessments across predefined glucose concentration conditions were therefore consolidated within individual QC-series records.
For HbA1c, replicate-level analytical records were consolidated into a measurement-level representation after verifying the availability of the optical-signal and reference HbA1c information required for calibration analysis. A separate production-lot representation was retained for longitudinal calibration monitoring, drift analysis, and anomaly screening. The production-lot data constitute an independently curated production-level view and were not generated by simply averaging all fields in the measurement-level dataset.
4.3. De-Identification and Ethical Considerations
The released benchmark contains de-identified manufacturing, quality-control, calibration, optical-signal, haematocrit, reference-measurement, and production-lot information. It does not contain patient names, personal identification numbers, contact details, treatment records, clinical interventions, or individual diagnostic decisions.
Production-lot identifiers were de-identified before publication and were retained solely to preserve the hierarchical structure required for lot-aware analysis and reproducible validation. Production year was retained as temporal metadata. Neither manufacturing personnel nor individual subjects can be identified from the published tables.
The present work concerns retrospective curation and secondary methodological analysis of manufacturing and analytical records rather than prospective recruitment or observation of human participants. Ethical and regulatory requirements applicable to the original analytical procedures and source materials remained subject to the institutional, laboratory, and quality-management procedures of the data-generating environment. The public benchmark itself should therefore be interpreted as a manufacturing-quality research resource rather than as a clinical patient dataset.
4.4. Data Curation and Integrity Checks
Curation was performed separately for each analytical level in order to preserve its corresponding unit of analysis and manufacturing context. The procedure included schema inspection, data-type verification, missing-value assessment, duplicate review, range checking, and internal consistency assessment.
Variable naming was standardised for programmatic reuse, while numerical measurements were retained in their original analytical scales wherever possible. Identifier fields were treated as categorical or structural metadata rather than continuous measurements, and binary outcomes were encoded consistently.
Internal consistency checks were used to compare derived quantities with their underlying measurements. These checks included verification of summary statistics, confirmation that absolute-error quantities were non-negative, comparison of maximum-error summaries with their corresponding concentration-specific errors, and verification of final QC outcomes against the predefined benchmark acceptance rules.
Production-year and production-lot metadata were also inspected for inconsistent assignments, missing identifiers, and implausible combinations. Duplicate observations were assessed according to their analytical unit rather than removed solely because identical numerical values occurred, because repeated measurements may legitimately arise in routine manufacturing data.
Observations representing unusual but internally consistent process behaviour were retained. Records were excluded only when mandatory analytical information was unavailable or when their structure did not support the intended analytical component. No synthetic observations were introduced to balance production years, QC outcomes, or production-lot distributions.
The pronounced process instability observed in 2025 was present in the original routine manufacturing records and was not synthetically generated, manually perturbed, or otherwise introduced during benchmark construction. Observations representing unusual but internally consistent process behaviour were retained during curation. The 2025 excursion should therefore be interpreted as an empirically observed manufacturing-regime change within the source data rather than as an artificially constructed benchmark shift.
4.5. Construction of the Glucose QC-Series Dataset
The glucose component was constructed at the QC-series level, with each record representing one completed quality-control series evaluated across eight predefined glucose concentration conditions.
Control precision was characterised using the mean, standard deviation, and coefficient of variation (CV) of the replicate control measurements. For QC series ,
where and denote the mean and standard deviation of the replicate control measurements, respectively.
Analytical accuracy was assessed separately for each concentration condition. For QC series and concentration condition , the signed percentage error was calculated as
where denotes the measured glucose concentration and denotes the corresponding reference concentration. Absolute percentage error was defined as
and the maximum absolute percentage error for a completed QC series was calculated as
The maximum absolute percentage error was retained as the continuous QC outcome.
The binary QC outcome was derived from predefined manufacturing acceptance criteria. A completed series was classified as passing when both the complete-series control CV and maximum absolute percentage error satisfied their respective limits:
Application of this rule produced 59 passing and 11 failing QC series.
The 5% CV and 10% maximum-error limits are study-specific manufacturing acceptance criteria used to construct the benchmark outcome. These numerical limits were inherited from predefined internal manufacturing QC conventions applied to the source records and were retained unchanged during benchmark construction to preserve the original decision logic. They were not selected or adjusted through optimisation of the released dataset or to maximise the performance of any predictive model. They should not be interpreted as direct ISO 15197 conformity thresholds or as evidence of independent regulatory certification [5].
Complete-series control statistics and reference-derived analytical errors were preserved because they support retrospective QC assessment and methodological analyses. Their appropriateness for predictive modelling depends on the intended prediction point and is addressed explicitly in Section 4.9.
4.6. Construction of the HbA1c Measurement-Level Dataset
The HbA1c measurement-level dataset was constructed from an initial source table containing 1287 replicate-level analytical records. Records lacking the optical-signal measurements or reference HbA1c information required for calibration analysis were excluded, producing a public measurement-level table containing 690 observations.
Each retained observation represents one analytical measurement associated with a de-identified production lot and production year. The principal candidate analytical inputs comprise the primary optical signal, haemoglobin-related optical signal, and haematocrit. To represent potential non-linearity in the optical response, a quadratic signal term was additionally derived:
where denotes the primary optical signal for observation .
The reference HbA1c measurement was treated as the supervised calibration outcome. The factory-calibrated HbA1c value was retained as an established analytical comparator rather than as an input to alternative optical-signal-based calibration models. Calibration coefficients associated with the manufacturing process were retained as calibration metadata.
Factory calibration was implemented using a lot-specific quadratic calibration function rather than a single global model. For each production lot, the factory calibration was defined by the corresponding coefficients a, b, and c, such that the calibrated HbA1c concentration was obtained as The calibration coefficients were assigned at the production-lot level as part of the routine manufacturing calibration procedure and were retained in the benchmark as manufacturing metadata. Accordingly, the factory-calibrated HbA1c value represents the established calibration applicable to the corresponding production lot rather than the output of a model fitted globally across the complete benchmark. No observation-level adaptive updating of the factory calibration was applied in the reference analyses. The factory-calibrated value was used solely as an analytical comparator and was not included as an input predictor in the alternative calibration models.
For observation , absolute calibration error was calculated as
where denotes the reference HbA1c value and denotes the factory-calibrated or model-estimated value. Relative percentage error was calculated as
Absolute error, relative percentage error, and the study-defined analytical acceptance indicator were treated as post-reference evaluation quantities, not as independent calibration predictors. The acceptance indicator included in the public data should not be interpreted as evidence of formal ISO conformity.
Among the published measurement-level observations, 55 lacked haematocrit information. These comprised 42 observations from 2022 and 13 from 2026. Analyses requiring complete haematocrit information therefore used a predefined complete-case subset of 635 measurements from 39 production lots collected between 2023 and 2026. No haematocrit values were imputed in the reference analyses.
4.7. Construction of the HbA1c Production-Lot Dataset
The HbA1c production-lot component was constructed to represent manufacturing behaviour at the production-lot level rather than at the level of individual analytical measurements. The final table contains 40 de-identified production lots collected between 2022 and 2026, with each record corresponding to one production lot.
The lot-level representation preserves aggregated information describing haematocrit, optical response, analytical precision, reference HbA1c measurements, and calibration behaviour. These descriptors were retained to support longitudinal assessment of manufacturing variability, calibration stability, production-period drift, and lot-level anomaly screening.
Lot-associated calibration coefficients were retained together with three corresponding coefficient-deviation variables. These deviation variables represent departures of the individual calibration coefficients from the reference definition used during benchmark construction. They were preserved to support retrospective assessment of calibration stability across production lots and years. Because these quantities originate from the benchmark construction procedure, they should be interpreted according to their documented definitions rather than as independently estimated statistical measures of process capability.
The production-lot table also contains a rule-based calibration-anomaly outcome. This indicator identifies lots satisfying the predefined calibration-deviation rule applied during benchmark preparation. It was retained as a methodological benchmark outcome for anomaly-screening experiments and should not be interpreted as an independently adjudicated expert, clinical, regulatory, or product-release classification.
The annual distribution of the production-lot component comprised one lot from 2022, nine lots from 2023, and ten lots in each year from 2024 to 2026. Because only one lot is available for 2022, this record represents a selected reference production profile rather than a statistically characterised annual baseline. Consequently, estimates of annual drift or anomaly prevalence for 2022 should not be interpreted as estimates of natural between-lot variability.
The production-lot component was maintained as an independently curated production-level representation and should not be reconstructed by simply averaging all variables in the HbA1c measurement-level dataset. The measurement-level and lot-level tables serve different analytical purposes: the former supports individual-measurement calibration and subgroup evaluation, whereas the latter supports longitudinal production monitoring, calibration-drift assessment, and lot-prioritisation analyses.
Variables directly involved in constructing the rule-based anomaly outcome are target-related when that outcome is used as the prediction target. They should therefore not be included as ordinary predictors in leakage-aware anomaly-detection experiments. The corresponding variable-availability and leakage considerations are described in Section 4.9, while the quantitative definition of the lot-level drift summary used for technical validation is provided in Section 4.11.
4.8. Missing-Data Handling
Missingness was evaluated separately for each analytical level because the relevance of incomplete fields depends on the intended analysis. No universal imputation procedure was applied during benchmark construction.
The principal documented missingness occurred in the HbA1c measurement-level data, where 55 observations lacked haematocrit information. These observations were excluded only from analyses requiring haematocrit, while the complete public measurement-level dataset was retained to permit alternative missing-data strategies.
No haematocrit imputation was used in the reference experiments. Complete-case calibration, subgroup-bias, and uncertainty analyses therefore used the predefined 635-observation subset.
Missing haematocrit observations were not uniformly distributed across production years. Complete-case restriction consequently alters the temporal and lot composition of the analytical population and should not be assumed to represent missing completely at random.
Where imputation or other data-dependent preprocessing is used in subsequent modelling, all parameters should be estimated exclusively from the training partition within each validation fold. Preprocessing performed before partitioning may allow information from validation or test observations to influence model development and thereby introduce leakage.
4.9. Leakage and Variable-Availability Assessment
Variable suitability was assessed in relation to the intended prediction point, target definition, and stage of the manufacturing workflow at which each measurement becomes available [9]. Variables were conceptually distinguished as (i) candidate predictors available before the intended decision point; (ii) structural metadata; (iii) supervised outcomes; and (iv) post-reference or target-derived quantities.
A variable was considered suitable for prospective prediction only when it was available at or before the intended decision point and was not mathematically or logically derived from the corresponding outcome.
For glucose QC, the final complete-series control CV and maximum absolute percentage error directly determine the final pass/fail outcome. Their use as predictors of that same outcome therefore constitutes target-definition leakage when the model is interpreted prospectively. Concentration-specific and aggregated analytical errors are likewise reference-derived. Other complete-series control statistics may not directly define the final outcome but remain retrospective when they can only be calculated after acquisition of the complete QC series.
Accordingly, models using completed-series information should be interpreted as retrospective end-of-series quality classifiers, not as prospective early-warning systems. A genuinely prospective glucose QC task would require predictors to be calculated exclusively from information available up to a predefined replicate k, while reserving the final complete-series QC outcome as the endpoint.
For HbA1c calibration, the optical signals and haematocrit were treated as candidate analytical predictors, whereas the reference HbA1c measurement was the supervised outcome. Reference-dependent calibration errors and analytical acceptance indicators were restricted to model evaluation. The established factory-calibrated HbA1c result was retained as a comparator rather than used as an input to alternative calibration models.
At the production-lot level, calibration variables involved directly in constructing the rule-based anomaly outcome must similarly be excluded when that outcome is used as the prediction target, because their inclusion would result in circular evaluation.
Production year and de-identified production-lot identifiers were treated primarily as structural metadata. Lot identifiers were used to preserve group integrity during validation rather than as numerical model inputs. Production year was retained for chronological assessment; however, its use as a predictor may encode historically specific production regimes rather than transferable process relationships. Sensitivity analyses therefore examined performance after removing temporally informative and target-related variables.
4.10. Validation Strategy
Validation was designed to reflect the hierarchical and temporal organisation of the benchmark. Random record-level partitioning was treated only as a descriptive baseline, because such splitting may place closely related observations from the same production context in both development and evaluation subsets.
For HbA1c calibration modelling, production lot was used as the grouping unit. The primary within-regime evaluation used five-fold group cross-validation, ensuring that measurements from the same production lot did not simultaneously occur in the training and validation partitions. This design evaluates transfer to unseen lots while retaining observations from multiple historical production years.
Temporal robustness was evaluated separately using leave-one-year-out validation. In each iteration, all observations from one production year were reserved for evaluation while observations from the remaining years were available for model development. This strategy was used to distinguish generalisation to unseen production lots within pooled historical data from transfer to a different production period.
For glucose classification, temporal evaluation was considered separately from pooled classification because failures were not distributed uniformly across years. Random stratified analyses were therefore interpreted descriptively rather than as evidence of prospective temporal performance.
Prediction-model reporting was structured to distinguish model development, grouped internal validation, chronological evaluation, and final interpretation. Predictor availability, missing-data handling, grouping variables, sample sizes, and temporal cut-offs should be reported transparently in accordance with contemporary prediction-model reporting and risk-of-bias principles [33,34].
4.11. Technical Validation Procedures
Technical validation was performed to determine whether the Diabetes-QMS Benchmark preserves coherent analytical, temporal, and production-lot structure and whether these structures are sufficiently informative to support reproducible methodological research. The analyses were designed as benchmark demonstrations rather than as evidence of clinical, regulatory, or autonomous manufacturing deployment. The glucose QC-series, HbA1c measurement-level, and HbA1c production-lot components were therefore evaluated separately according to their respective units of analysis and intended methodological applications.
For the glucose QC-series component, longitudinal process behaviour was assessed using descriptive annual summaries and statistical process-control methods. Annual summaries included the mean and maximum control coefficient of variation, the mean and largest maximum absolute percentage error, and the number and proportion of failed QC series. The period from 2020 to 2022 was used as the Phase I reference period for estimating baseline process behaviour.
A Shewhart individuals chart was constructed for the control coefficient of variation. The Phase I centre line was estimated from the mean control CV during the reference period, while the process standard deviation was estimated from the average moving range divided by the standard individuals-chart constant d2 = 1.128. The upper control limit was defined as three estimated standard deviations above the Phase I centre line. The study-defined 5% QC threshold was displayed separately from the statistical control limit because the two quantities have different interpretations: the former contributes to the benchmark acceptance rule, whereas the latter represents an empirically estimated process-monitoring boundary.
Gradual process changes were additionally evaluated using one-sided upper cumulative-sum (CUSUM) and exponentially weighted moving-average (EWMA) monitoring. The CUSUM used a reference value of K = 0.5σ and a decision interval of , where σ denotes the Phase I process-standard-deviation estimate. EWMA monitoring used a smoothing parameter of λ = 0.20 and a control-limit width of . For graphical comparison, CUSUM and EWMA monitoring statistics were normalised relative to their corresponding decision or control limits, such that values exceeding 1 indicated a monitoring signal.
Average run length (ARL) was additionally examined as a descriptive comparison of monitoring sensitivity under in-control conditions and a simulated 0.5σ upward process shift. Because the monitoring procedures did not exhibit identical in-control ARLs, these comparisons were interpreted descriptively rather than as a controlled comparison at a common false-alarm rate.
Glucose QC classification was evaluated as a separate retrospective benchmark task. Class-weighted classification models were used because only 11 of the 70 QC series represented failures. Particular attention was given to the distinction between retrospective end-of-series classification and prospective early-warning prediction, because the final complete-series control CV contributes directly to the definition of the QC pass/fail outcome.
To quantify dependence on temporally informative and complete-series control variables, a sequential feature-ablation analysis was performed. The evaluated predictor configurations comprised (i) all evaluated predictors; (ii) exclusion of production year; (iii) exclusion of the final complete-series control CV; (iv) exclusion of both production year and control CV; and (v) a stricter configuration additionally excluding control standard deviation. Performance was summarised using balanced accuracy, failed-class recall, failed-class F1-score, receiver-operating-characteristic area under the curve (ROC-AUC), and the number of failed QC series incorrectly classified as passing. These experiments were intended to assess sensitivity to target-related and temporally informative variables and were not interpreted as genuine prospective early-warning validation because the remaining predictors were still derived from completed QC-series records.
For the HbA1c measurement-level component, calibration performance was evaluated using the predefined 635-measurement complete-case subset. Measurements from the same production lot were kept within the same analytical partition. The principal in-regime evaluation used five-fold production-lot-grouped cross-validation, thereby preventing measurements from a single production lot from appearing simultaneously in model-development and evaluation subsets.
Three calibration approaches were compared: the established factory calibration, linear regression, and Random Forest regression. Linear regression was included as a transparent parametric baseline, whereas Random Forest was selected as a representative nonlinear ensemble method for tabular calibration modelling. The purpose of including Random Forest was not to assume that it represented the optimal calibration algorithm, but to determine whether nonlinear relationships and interactions among the available optical-signal variables and haematocrit could be captured without specifying a fixed functional form [35]. This choice also provides a reproducible nonlinear reference for a moderate-sized tabular dataset. Importantly, production-lot dependence and temporal non-stationarity were addressed through the validation design rather than through the Random Forest architecture itself. The Random Forest regression baseline used 400 trees (n_estimators = 400) and a fixed random seed of 42 (random_state = 42). The remaining principal hyperparameters were retained at the scikit-learn 1.6.1 defaults, including squared-error splitting, unrestricted tree depth (max_depth = None), min_samples_split = 2, min_samples_leaf = 1, max_features = 1.0, and bootstrap sampling enabled. Candidate model inputs comprised the primary optical signal, its quadratic term, the haemoglobin-related optical signal, and haematocrit. The reference HbA1c measurement served as the supervised calibration target, while the factory-calibrated HbA1c value was retained solely as an established comparator.
Calibration performance was quantified using mean absolute error (MAE), root mean squared error (RMSE), coefficient of determination (R2), and the proportion of measurements satisfying the study-defined ±6% relative-error criterion. The ±6% threshold was defined a priori as a study-level analytical tolerance to provide a consistent supplementary criterion for comparing calibration approaches. It was not derived through optimisation of the released dataset and was not used for model fitting or parameter selection. Accordingly, it should not be interpreted as evidence of formal NGSP, ISO, regulatory, or manufacturer-certification conformity. Differences in MAE between factory calibration and Random Forest were additionally evaluated using paired bootstrap resampling, with predictions for the same held-out observations compared directly.
Temporal robustness was assessed independently from lot-grouped validation using leave-one-year-out evaluation. Leave-one-year-out evaluation was performed on the 635 complete-case observations from 39 production lots covering 2023–2026; 2022 was excluded because the corresponding measurement-level records lacked the haematocrit information required for this analysis. In each iteration, all measurements from one production year were held out for evaluation while observations from the remaining years were available for model development.
Potential haematocrit-dependent calibration bias was evaluated using three predefined non-overlapping ranges: low haematocrit, 30% ≤ HCT < 38%; medium haematocrit, 38% ≤ HCT < 45 and high haematocrit, 45% ≤ HCT ≤ 53%. Calibration bias for observation was defined as
where denotes the factory-calibrated or model-estimated HbA1c value and denotes the corresponding reference HbA1c measurement. Mean bias was calculated separately within each haematocrit stratum for factory calibration and Random Forest predictions. Subgroup sample sizes were retained to support interpretation of the resulting estimates.
Predictive uncertainty was assessed using split-conformal prediction [24]. For the in-regime split-conformal analysis, 20 repeated group-aware partitions were generated using production lot as the grouping variable. In each repetition, approximately 60% of production lots were assigned to the model-fitting subset, while the remaining 40% were subsequently divided equally by production lot between calibration and evaluation subsets, yielding an approximate 60%/20%/20% group-level split. A Random Forest regressor with 300 trees and random_state = 42 was fitted to the model-fitting subset. A 300-tree Random Forest specification was used for the repeated conformal experiments to reduce computational cost; this configuration was fixed a priori and was not tuned on the evaluation data. Absolute residuals in the calibration subset were used to estimate the conformal quantile using the higher empirical quantile, and empirical coverage and mean prediction-interval width were then evaluated on the held-out evaluation subset. Nominal coverage levels of 90% and 80% were assessed.
For temporal split-conformal evaluation, the most recent production year (2026) was held out entirely for evaluation. Observations from the preceding production years were used as the historical development pool; 30% of these historical observations were randomly assigned to the conformal-calibration subset using random_state = 42, and the remaining 70% were used for model fitting. No observations from the held-out 2026 period were used for either model fitting or conformal calibration. The same 300-tree Random Forest specification was used, and prediction intervals were evaluated at nominal coverage levels of 90% and 80%.
Conformal performance was compared between the in-regime and temporal settings to determine whether prediction intervals calibrated from historical observations retained their intended empirical coverage under production-period shift.
An additional sequential experiment evaluated Adaptive Conformal Inference (ACI) [25] on the 635 complete-case HbA1c observations. Observations were ordered by production year and lot identifier and divided sequentially into 190 observations (30%) for model fitting, 95 observations (15%) for held-out conformal calibration, and 350 observations (55%) for sequential evaluation. A Random Forest regressor with 300 trees and random_state = 42 was fitted to the initial training subset. The nominal coverage target was 90% (α = 0.10). Static split-conformal intervals were calibrated from the 95 held-out calibration residuals using the finite-sample-corrected higher empirical quantile. For ACI, the adaptive miscoverage level was initialised at 0.10, the update step was γ = 0.02, and a sliding window of the 80 most recently available residuals was used. For each sequential test observation, the adaptive conformal quantile was calculated using only calibration or previously observed residuals; the current residual was incorporated into the sliding window only after the corresponding prediction interval had been evaluated. The miscoverage level was then updated according to the ACI rule, where denotes a missed interval and denotes coverage. Empirical coverage and mean prediction-interval width were recorded for both static and adaptive procedures.
For the HbA1c production-lot component, longitudinal calibration behaviour was quantified using the lot-level maximum absolute calibration-coefficient deviation defined in Section 4.7. For each production lot l, the largest absolute deviation among the three calibration coefficients was obtained as
For each production year y, the corresponding annual drift summary was calculated as
where denotes the number of production lots available in that year. This measure is referred to as the mean lot-level maximum coefficient deviation. Because 2022 contained only one production lot and served as the selected benchmark reference profile, its zero deviation was not interpreted as an estimate of natural between-lot variability for that year.
Rule-based anomaly prevalence was calculated as the proportion of production lots satisfying the benchmark anomaly criterion within each production year. The rule-based indicator was treated as a methodological benchmark outcome rather than as an independently adjudicated expert, clinical, or regulatory gold-standard classification.
Multivariate anomaly screening was additionally evaluated using Isolation Forest applied to leakage-restricted lot-level process descriptors. The reference experiment used a contamination parameter of 0.20 and a fixed random seed of 42. Agreement between Isolation Forest classifications and the rule-based anomaly outcome was summarised using the corresponding classification table, sensitivity, and specificity. Because the assumed contamination level directly influences the number of lots classified as anomalous, and because the rule-based outcome is not an independent gold standard, the Isolation Forest experiment was interpreted as an illustrative lot-prioritisation and anomaly-screening analysis, rather than as independently validated anomaly detection. Sensitivity to alternative contamination assumptions should therefore be considered in subsequent reuse of the benchmark [17].
Across all predictive analyses, target-derived quantities and variables unavailable at the intended prediction point were excluded whenever the analytical objective required leakage-aware interpretation. Production-lot identifiers were used for grouping rather than as numerical model inputs, while production year was treated as temporal metadata and examined separately in sensitivity analyses. All data-dependent preprocessing was restricted to the corresponding model-development partitions.
The empirical findings obtained using these procedures are reported separately in Section 5. Technical Validation.
4.12. Statistical Analysis and Reproducibility
Continuous variables were summarised using the mean, standard deviation, median, interquartile range, minimum, and maximum, as appropriate. Categorical outcomes were described using counts and proportions. Temporal and production-lot distributions were inspected before predictive modelling.
Model performance was quantified using task-appropriate metrics. Classification analyses included balanced accuracy, class-specific recall, F1-score, and receiver-operating-characteristic area under the curve where applicable. Calibration regression analyses used MAE, RMSE, R2, and mean bias. Predictive-uncertainty analyses considered both empirical coverage and average interval width.
Where confidence intervals were estimated, 95% bootstrap intervals were used. Resampling for glucose classification preserved the pass/fail structure. For the HbA1c calibration comparison between factory calibration and Random Forest, 2000 paired bootstrap resamples were generated by sampling observation indices with replacement. In each resample, MAE was calculated for both calibration approaches using the same resampled observations, and the paired difference in MAE was recorded. The 2.5th and 97.5th percentiles of the resulting distribution were used as the 95% confidence limits. Comparisons between calibration approaches were based on paired prediction errors generated for the same held-out observations or groups.
Reference analyses were implemented using scikit-learn version 1.6.1. The corrected Adaptive Conformal Inference analysis was re-executed in Python 3.13.15, whereas the original reference analyses were conducted in Python 3.12. Data-dependent preprocessing was restricted to the training data within each validation partition.
For reproducible reuse, analyses should report the dataset repository revision or access date, analytical subset, exclusion criteria, predictor and outcome definitions, preprocessing steps, validation grouping, temporal cut-offs, random seed, model configuration, and software versions.
5. Technical Validation
Technical validation was undertaken to determine whether the Diabetes-QMS Benchmark preserves meaningful temporal, analytical, and production-lot structure and whether these structures can support reproducible methodological research. The analyses were not intended to demonstrate the deployment readiness or regulatory superiority of any particular modelling approach. Instead, they evaluated whether the benchmark exposes practically relevant phenomena including process drift, lot-dependent calibration behaviour, temporal generalisation failure, uncertainty degradation, subgroup-dependent analytical bias, anomaly structure, and target-related information leakage.
The three analytical levels were evaluated separately because they represent distinct manufacturing processes and units of analysis. Particular emphasis was placed on comparisons between performance obtained within pooled historical data and performance obtained when models were transferred across production periods.
5.1. Temporal Stability of Glucose Quality-Control Series
The glucose QC-series data exhibited a distinct longitudinal pattern over the seven-year observation period. During 2020–2022, mean control CV remained between 2.83% and 3.31%, mean maximum absolute percentage error remained between 5.10% and 6.30%, and no failed QC series were observed. The first indication of deterioration appeared in 2023, when mean control CV increased to 3.85% and one of ten series failed. In 2024, mean control CV remained elevated at 3.80%, the maximum observed control CV reached 5.68%, and two series failed.
The strongest process excursion occurred in 2025. Mean control CV increased to 5.06%, mean maximum absolute percentage error reached 10.00%, and seven of ten QC series failed. The largest individual maximum absolute percentage error was 42.74%. These values were directly observed in the source QC records and were not generated through synthetic perturbation, resampling, or benchmark-specific drift injection. Their co-occurrence across precision, analytical-error, and QC-failure indicators provides evidence that the 2025 deterioration reflects an observed change in the underlying manufacturing process rather than an artefact of dataset construction. In 2026, the corresponding values decreased substantially: mean control CV fell to 3.34%, mean maximum absolute percentage error to 4.48%, and only one of ten series failed. This pattern is consistent with partial recovery after the pronounced 2025 excursion, although it does not establish restoration of the earlier process regime. The corresponding annual QC stability indicators are summarised in Table 4.
Table 4.
Annual glucose QC stability indicators.
Statistical process-control analysis showed that the deterioration developed before the main concentration of failed series in 2025. Using 2020–2022 as the Phase I reference period, the control-CV individuals chart had a centre line of 3.016%, an estimated process standard deviation of 0.830%, and an upper control limit of 5.505%. Six QC series exceeded the upper control limit, with violations concentrated in 2024–2026.
The cumulative-sum procedure produced its first sustained upward signal at series index 37, corresponding to 2023, while EWMA first signalled at index 39, also in 2023. The Shewhart chart did not signal until 2024. The maximum-error individuals chart, with a Phase I centre line of 5.57% and an upper control limit of 10.90%, identified four exceedances occurring in 2023 and 2025.
These results indicate that cumulative and smoothed monitoring procedures identified the emerging process change before the later concentration of failed QC series. The benchmark therefore contains a non-trivial temporal structure suitable for investigating gradual drift and change detection rather than merely reproducing isolated final failure labels.
Average-run-length simulation provided a complementary descriptive comparison. For a simulated 0.5σ shift, estimated ARLs were 139.6 for Shewhart, 27.5 for CUSUM, and 44.3 for EWMA. However, their estimated in-control ARLs were 248.3, 157.1, and 288.9, respectively. Because the procedures were not calibrated to an identical false-alarm rate, these values should not be interpreted as a controlled comparison of detection efficiency.
The annual evolution of the glucose QC indicators and the corresponding statistical process-control results are summarised in Figure 2. Panels A and B show the progressive deterioration in precision, analytical error, and QC failure prevalence, whereas Panels C and D demonstrate that statistical monitoring identified changes before the main concentration of failed series in 2025.
Figure 2.
Temporal behaviour and statistical process-control characteristics of the glucose quality-control series from 2020 to 2026. (A) Annual mean and maximum control coefficient of variation (CV), together with the study-defined 5% QC threshold. (B) Annual mean and largest maximum absolute percentage error, together with the study-defined 10% maximum-error threshold and annual QC failure rate. (C) Shewhart individuals chart for control CV using 2020–2022 as the Phase I reference period; the Phase I centre line, statistical upper control limit, study-defined QC threshold, and Shewhart signals are shown separately. (D) Normalised CUSUM and EWMA monitoring statistics; values exceeding the normalised signal threshold indicate a monitoring signal.
5.2. HbA1c Calibration Performance Under Lot-Grouped Validation
HbA1c calibration performance was evaluated using the 635-measurement complete-case subset, with production lot used as the grouping variable so that measurements from the same lot did not occur simultaneously in model-development and evaluation partitions.
Factory calibration provided a strong reference benchmark, achieving an MAE of 0.541, RMSE of 1.144, and R2 of 0.770. Linear regression performed substantially worse, with an MAE of 1.471, RMSE of 1.874, and R2 of 0.383. Random Forest achieved an MAE of 0.506, RMSE of 1.086, and R2 of 0.793. The corresponding calibration-performance metrics are summarised in Table 5.
Table 5.
HbA1c calibration performance under production-lot-grouped validation.
Although Random Forest produced numerically lower MAE and RMSE than factory calibration, the magnitude of the difference was small. The paired MAE difference between factory calibration and Random Forest was 0.036, with a 95% bootstrap confidence interval of −0.068 to 0.141. Because this interval included zero, the observed numerical difference was not statistically conclusive.
Random Forest should therefore not be interpreted as a superior replacement for the established factory calibration. Rather, the lot-grouped results demonstrate that a nonlinear model can achieve comparable performance within the pooled historical production regime and can serve as a methodological benchmark for investigating residual calibration structure and model stability.
The study-defined ±6% relative-error rate followed the same general pattern, reaching 69.764% for Random Forest compared with 64.882% for factory calibration. This tolerance is a benchmark-specific analytical criterion and should not be interpreted as evidence of formal NGSP, ISO, or manufacturer-certification performance. The agreement between predicted and reference HbA1c values, together with the distributions of absolute calibration errors, is illustrated in Figure 3.
Figure 3.
HbA1c calibration agreement under production-lot-grouped validation. (A) Factory-calibrated HbA1c values versus reference measurements. (B) Linear-regression predictions obtained under five-fold production-lot-grouped cross-validation. (C) Random Forest predictions obtained under the same lot-grouped validation strategy. Dashed diagonal lines in (A–C) indicate perfect agreement. (D) Distribution of absolute calibration errors for factory calibration, linear regression, and Random Forest; green triangles indicate the mean absolute calibration error, and the horizontal orange lines indicate the median.
5.3. Temporal Generalisation and Predictive Uncertainty
A substantially different result emerged when model performance was evaluated across production years rather than across production lots drawn from pooled historical data. In leave-one-year-out evaluation, the static Random Forest model produced a higher MAE than factory calibration for every held-out year.
The largest difference was observed when 2023 was held out: Random Forest produced an MAE of 2.410, compared with 0.679 for factory calibration. The same pattern was observed for 2024, 2025, and 2026. The corresponding leave-one-year-out calibration results are summarised in Table 6.
Table 6.
Leave-one-year-out HbA1c calibration performance in the predefined complete-case population (635 observations from 39 production lots, 2023–2026).
The contrast between lot-grouped and chronological evaluation is one of the central technical findings of the benchmark. Under lot-grouped cross-validation, Random Forest was numerically comparable with factory calibration. Under year-wise transfer, however, the same static model failed to reproduce that performance. This indicates that relationships among optical signals, haematocrit, and reference HbA1c values were at least partly production-period dependent.
Accordingly, successful transfer to previously unseen production lots within pooled historical data should not be interpreted as evidence of successful transfer to a future production period.
The reference models evaluated in this study should not be interpreted as an exhaustive comparison of calibration algorithms. Random Forest was intentionally employed as a conventional nonlinear tabular baseline rather than as an assumed optimal solution. Gradient-boosted decision-tree methods, such as XGBoost, may provide stronger predictive baselines for structured tabular data [36], whereas generalised additive models can provide flexible yet interpretable representations of nonlinear predictor–response relationships [37]. Given the nested structure of the HbA1c measurements, hierarchical or mixed-effects models may also be appropriate for explicitly representing dependence among observations originating from the same production lot [38]. In addition, the marked differences between lot-grouped and leave-one-year-out performance indicate that approaches designed to accommodate temporal distribution shift may warrant further investigation. Concept-drift adaptation and continual-learning methods provide established frameworks for updating predictive relationships as data distributions evolve [20,21,22]. The Diabetes-QMS Benchmark is therefore intended to support comparative evaluation of such approaches rather than to establish a single preferred modelling strategy.
Predictive uncertainty exhibited a similarly pronounced sensitivity to temporal shift. At a nominal 90% coverage target, split-conformal prediction achieved empirical coverage of 0.913 under in-regime evaluation, with a mean interval width of 3.92 HbA1c percentage points. Under temporal evaluation, coverage decreased to 0.427, despite an average interval width of 2.08.
At the nominal 80% target, in-regime coverage was 0.824 with a mean interval width of 2.20, whereas temporal coverage declined to 0.220, with a mean width of 0.80. The corresponding split-conformal coverage and prediction-interval width results are summarised in Table 7.
Table 7.
Split-conformal prediction under in-regime and temporal evaluation.
The deterioration in coverage indicates that prediction intervals calibrated within the historical production regime did not retain their intended empirical reliability under temporal distribution shift. The contrast between in-regime and temporal performance is summarised in Figure 4. Figure 4A shows the relatively small difference between factory calibration and Random Forest under production-lot-grouped validation, whereas Figure 4B demonstrates the substantially poorer temporal generalisation of the static Random Forest model across all held-out production years. Figure 4C further shows the pronounced loss of conformal coverage under temporal shift, while Figure 4D demonstrates that this reduction in coverage occurred despite narrower, rather than wider, prediction intervals. Taken together, these results indicate that favourable within-regime calibration performance and uncertainty estimates did not reliably transfer across production periods.
Figure 4.
Temporal generalisation and predictive uncertainty of HbA1c calibration models. (A) Mean absolute error (MAE) of factory calibration and Random Forest under production-lot-grouped validation; the 95% bootstrap confidence interval for the paired MAE difference included zero. (B) Leave-one-year-out comparison of factory calibration and static Random Forest across the 2023–2026 production periods; the number of measurements in each held-out year is shown below the corresponding year. (C) Empirical split-conformal coverage under in-regime and temporal evaluation at nominal 90% and 80% coverage levels; dashed horizontal segments indicate the corresponding nominal targets. (D) Mean prediction-interval widths under the same in-regime and temporal evaluation settings.
In the sequential experiment, static split-conformal prediction achieved empirical coverage of 0.677 at the nominal 90% level, with a mean prediction-interval width of 4.553. Corrected Adaptive Conformal Inference increased empirical coverage to 0.897, closely approaching the nominal target, while increasing the mean interval width to 8.781. The improvement in coverage was particularly evident under later production regimes: static coverage decreased to 0.575 in 2025 and 0.540 in 2026, whereas adaptive coverage reached 0.863 and 0.933, respectively. These results indicate that sequential adaptation can substantially restore empirical coverage under temporal distribution shift, although at the cost of wider prediction intervals.
5.4. Haematocrit-Dependent Calibration Bias
Aggregate calibration metrics concealed systematic differences across haematocrit ranges. Using the non-overlapping strata defined in Section 4.11, the low-haematocrit group contained 111 measurements, the medium group 326, and the high group 198.
Factory calibration exhibited its largest positive bias in the low-haematocrit range, with a mean bias of +0.696 HbA1c percentage points. Random Forest reduced this value substantially to +0.033.
In the medium-haematocrit group, factory calibration showed a mean bias of +0.115, compared with −0.105 for Random Forest. In the high-haematocrit group, factory calibration bias was −0.051, whereas Random Forest bias was more negative at −0.190. The corresponding haematocrit-stratified calibration-bias results are summarised in Table 8.
Table 8.
Haematocrit-dependent HbA1c calibration bias.
The Random Forest correction was therefore most favourable in the low-haematocrit range but did not produce a uniform reduction in bias across all analytical strata. In particular, it increased the magnitude of negative bias in the high-haematocrit group.
These results illustrate why pooled MAE or RMSE alone may be insufficient for evaluating analytical calibration. An approach that improves overall or subgroup-specific performance in one operating range may simultaneously degrade performance in another. The benchmark therefore enables analytical models to be evaluated not only by aggregate accuracy but also by condition-dependent calibration behaviour.
5.5. Production-Lot Drift and Anomaly Analysis
The production-lot data displayed substantial temporal variation in calibration characteristics. Because the 2022 period contains only one lot, that observation was treated as a selected reference profile, rather than as an estimate of a stable annual calibration distribution.
Mean absolute calibration-coefficient deviation from the selected reference profile was 242.63 in 2023 and increased to 609.22 in 2024. The most pronounced deviation occurred in 2025, when mean absolute coefficient drift reached 3774.84, and eight of ten production lots met the rule-based anomaly criterion. In 2026, mean absolute drift decreased to 1047.27 and the rule-based anomaly rate fell to 40%. The corresponding year-wise calibration-drift and rule-based anomaly results are summarised in Table 9.
Table 9.
Year-wise HbA1c production-lot calibration drift.
The values suggest a marked temporal change in lot-level calibration characteristics, with the largest deviation concentrated in 2025 and partial reduction in 2026. However, because the 2022 reference consists of only one lot, these drift values quantify departure from that selected reference lot and should not be interpreted as deviation from a statistically characterised stable 2022 baseline.
Isolation Forest provided an illustrative multivariate anomaly-screening baseline. With contamination fixed at 0.20, the model classified eight of 40 production lots as anomalous. All eight of these lots were also positive under the rule-based anomaly criterion. However, an additional eight rule-positive lots were not detected by Isolation Forest. The resulting agreement pattern was therefore as follows:
- Eight rule-positive/Isolation-Forest-positive lots;
- Eight rule-positive/Isolation-Forest-negative lots;
- Twenty-four rule-negative/Isolation-Forest-negative lots;
- Zero rule-negative/Isolation-Forest-positive lots.
Relative to the rule-based outcome, this corresponds to 50% sensitivity and 100% specificity.
These values require cautious interpretation for two reasons. First, the rule-based anomaly indicator is not an independently adjudicated expert or regulatory gold standard. Second, the Isolation Forest contamination value of 0.20 effectively constrains the model to flag approximately eight of the 40 production lots. The results therefore demonstrate agreement with one benchmark rule under one algorithmic configuration, rather than independently validated anomaly detection.
Continuous anomaly scores and sensitivity analyses across alternative contamination assumptions would provide a more informative characterisation of lot-level anomaly structure. The temporal evolution of lot-level calibration drift, annual anomaly prevalence, individual lot deviations, and agreement between Isolation Forest screening and the rule-based anomaly outcome is illustrated in Figure 5.
Figure 5.
Temporal production-lot calibration drift and anomaly characteristics of the HbA1c benchmark. (A) Annual mean lot-level maximum absolute calibration-coefficient deviation relative to the benchmark reference definition. The 2022 period contains one selected reference lot and therefore does not represent a statistically characterised annual baseline. (B) Annual prevalence of the rule-based calibration-anomaly outcome, with the number of anomalous and total production lots shown for each year. (C) Individual lot-level maximum absolute calibration-coefficient deviations across production years, with rule-based anomalous lots highlighted. (D) Agreement between Isolation Forest screening and the rule-based anomaly outcome in the reference experiment; relative to the rule-based outcome, sensitivity was 50% and specificity was 100%.
5.6. Leakage and Feature-Sensitivity Analysis
The glucose QC classification experiment was additionally used to determine how strongly apparent predictive performance depended on temporally informative and complete-series control variables.
Using the full predictor configuration, balanced accuracy was 0.909, failed-class recall was 0.818, failed-class F1-score was 0.900, and ROC-AUC was 0.925, with two failed QC series missed.
Removing production year alone produced virtually no change in performance. Removing final control CV alone also resulted in only a modest reduction, suggesting that related complete-series control statistics retained overlapping information.
A larger decrease occurred when both production year and final control CV were excluded. Balanced accuracy fell to 0.810, failed-class recall to 0.636, and the number of missed failures increased from two to four. Under the strictest evaluated configuration, which additionally excluded control standard deviation, balanced accuracy fell further to 0.776, failed-class F1-score to 0.609, and ROC-AUC to 0.829. The corresponding feature-ablation results across all evaluated predictor configurations are summarised in Table 10.
Table 10.
Feature-ablation analysis of glucose QC failure classification.
The ablation results demonstrate that the strongest classification estimates were partly dependent on temporally informative and target-related complete-series information. Importantly, however, even the strictest configuration should not be described as a genuine prospective early-warning model, because the remaining predictors were still derived from completed QC-series records.
A genuinely prospective evaluation would require analytical predictors to be calculated only from measurements available up to a predefined early replicate k, with the complete-series final QC outcome reserved exclusively as the endpoint. The present analysis should therefore be interpreted as a demonstration of the benchmark’s utility for studying target-definition leakage, temporal shortcuts, correlated proxy variables, and prediction-point specification, rather than as validation of an operational early-warning classifier. The effects of progressively restricting the predictor set on balanced accuracy, failed-class recall, failed-class F1-score, ROC-AUC, and the number of missed failures are illustrated in Figure 6.
Figure 6.
Feature-ablation analysis of retrospective glucose quality-control failure classification. (A) Balanced accuracy, (B) failed-class recall, (C) failed-class F1-score, and (D) ROC-AUC together with the number of missed failures across progressively restricted predictor configurations. Removing production year alone produced no reduction in aggregate classification performance, whereas joint removal of production year and complete-series control CV resulted in lower balanced accuracy and failed-class recall. Further exclusion of control standard deviation produced the largest reduction in failed-class F1-score and ROC-AUC. All configurations remained retrospective because the available predictors were derived from completed QC-series records.
5.7. Overall Technical Validation
Taken together, the technical-validation analyses demonstrate that the Diabetes-QMS Benchmark preserves several complementary forms of manufacturing structure. The glucose QC-series component contains a sustained multi-year process shift, with CUSUM and EWMA monitoring identifying departures from the Phase I reference period before the main concentration of failed series in 2025. Feature-ablation analysis further demonstrates that apparently strong retrospective QC classification performance is partly dependent on temporal information and complete-series control statistics.
The HbA1c measurement-level component reveals a pronounced distinction between within-regime and temporal generalisation. Random Forest achieved performance numerically comparable with factory calibration under production-lot-grouped evaluation, but the same static model produced substantially larger errors than factory calibration for every held-out production year. Predictive uncertainty exhibited a similar pattern: split-conformal intervals achieved approximately nominal coverage under in-regime evaluation but showed substantial coverage deterioration under temporal shift. Haematocrit-stratified analysis additionally demonstrated that calibration bias was not uniform across analytical operating ranges.
At the production-lot level, calibration characteristics also changed substantially across years, with the largest mean lot-level maximum coefficient deviation and the highest rule-based anomaly prevalence observed in 2025. The Isolation Forest experiment further demonstrated that anomaly-screening conclusions depend on the chosen algorithmic configuration and reference definition and should not be interpreted as independently validated anomaly detection.
Overall, these findings support use of the benchmark for methodological research on statistical process control, calibration modelling, lot-aware validation, temporal distribution shift, uncertainty quantification, subgroup-dependent analytical bias, anomaly screening, and leakage-aware machine learning. At the same time, the results demonstrate why performance obtained from pooled retrospective manufacturing data should not automatically be interpreted as evidence of prospective robustness, regulatory conformity, or autonomous product-release capability.
6. User Notes
The Diabetes-QMS Benchmark is intended for retrospective methodological research in manufacturing quality monitoring. The released data can be analysed using standard statistical, spreadsheet, and machine-learning environments and support complementary investigations at three analytical levels: completed glucose QC series, individual HbA1c measurements, and HbA1c production lots. These components should be analysed according to their respective units of observation rather than combined into a single record-level dataset.
For the glucose QC-series component, users should distinguish between retrospective quality assessment and prospective prediction. The final complete-series control coefficient of variation and maximum absolute percentage error contribute directly to the definition of the final QC pass/fail outcome. Consequently, using these quantities to predict the same final outcome constitutes target-definition leakage if the resulting model is interpreted as an early-warning system. Other statistics calculated only after completion of the QC series are also retrospective with respect to an earlier production decision point. Prospective early-warning studies should therefore construct predictors exclusively from measurements available up to a predefined replicate k, while retaining the final complete-series QC status solely as the endpoint.
For the HbA1c measurement-level component, the public table contains 690 observations, including 55 records without haematocrit information. The reference analyses requiring haematocrit used the predefined complete-case subset of 635 measurements from 39 production lots collected between 2023 and 2026. No haematocrit values were imputed in the reference experiments. Users may instead analyse the full 690-record table when investigating missing-data methods, but the analytical subset and treatment of missing values should be reported explicitly. Because missing haematocrit observations are concentrated in specific production years, complete-case filtering changes the temporal composition of the analysed population and should not be assumed to represent missing completely at random.
Reference HbA1c measurements should be treated as supervised calibration outcomes, while errors and analytical acceptance indicators calculated from the reference measurement are post-reference evaluation quantities rather than independent predictors. The factory-calibrated HbA1c value is provided as an established analytical comparator. Studies developing alternative calibration models should clearly state whether it is used only for comparison or incorporated into the predictive model.
For the production-lot component, users should account for the limited sample size of 40 lots and the unequal annual distribution. In particular, 2022 contains only one selected reference lot and therefore does not provide a statistically characterised estimate of natural between-lot variation for that year. Calibration-coefficient deviations and the rule-based anomaly outcome are useful for retrospective drift and anomaly analyses, but variables directly involved in defining the anomaly outcome should not simultaneously be used as predictors of that same outcome.
Production year and de-identified lot identifiers are primarily intended to preserve the temporal and hierarchical structure of the benchmark. Lot identifiers should be used for grouping rather than treated as numerical predictors. When evaluating HbA1c models, measurements originating from the same production lot should remain within the same analytical partition. Where the objective is generalisation to future production periods, chronological or leave-one-year-out evaluation is preferable to random record-level partitioning.
The technical-validation experiments demonstrate that model performance obtained within pooled historical data may differ substantially from performance under temporal transfer. Users are therefore encouraged to report both in-regime and temporal validation results where appropriate. Predictive-uncertainty analyses should similarly report empirical coverage together with prediction-interval width, because coverage alone is insufficient to characterise operational usefulness.
Any data-dependent preprocessing, including scaling, feature transformation, or imputation, should be estimated exclusively from the training portion of each validation split. The analytical population, predictor set, outcome definition, grouping strategy, temporal cut-offs, preprocessing procedure, model configuration, random seed, and software versions should be documented to support reproducibility.
The study-defined QC and analytical tolerance criteria included in the benchmark are intended for methodological evaluation and should not be interpreted as independent ISO, NGSP, clinical, or regulatory conformity assessments. Likewise, the rule-based lot anomaly indicator is not an independently adjudicated expert or regulatory gold-standard classification.
The benchmark does not contain patient names, personal identifiers, treatment information, clinical interventions, or individual diagnostic decisions. It is therefore intended for manufacturing-quality, calibration, statistical process-control, anomaly-screening, uncertainty, and machine-learning research, not for patient-level diagnosis, clinical decision-making, autonomous product release, or replacement of established quality-management procedures.
7. Conclusions and Future Work
The Diabetes-QMS Benchmark provides a retrospective, multi-level industrial dataset for methodological research on quality monitoring in glucose and HbA1c diagnostic-device manufacturing. By preserving completed glucose QC series, individual HbA1c analytical measurements, and production-lot records as distinct but complementary analytical levels, the benchmark supports investigation of statistical process control, calibration modelling, temporal and lot-dependent variation, uncertainty quantification, anomaly screening, and leakage-aware machine-learning evaluation.
Technical validation demonstrated that the dataset contains meaningful temporal and hierarchical manufacturing structure rather than merely static tabular associations. In the glucose QC-series component, process-monitoring analyses identified sustained changes before the main concentration of failed QC series. In the HbA1c measurement-level component, calibration performance obtained under production-lot-grouped validation did not reliably transfer across held-out production years, demonstrating an important distinction between within-regime generalisation and temporal robustness. Predictive-uncertainty analysis showed a corresponding degradation of conformal coverage under temporal shift, while haematocrit-stratified analysis revealed that calibration bias varied across analytical operating ranges.
The production-lot component additionally demonstrated substantial temporal variation in calibration characteristics, with the largest lot-level coefficient deviations and highest rule-based anomaly prevalence occurring during the 2025 production period. The Isolation Forest experiment further illustrated that anomaly-screening results depend on both the algorithmic configuration and the definition of the reference anomaly outcome. These findings support the use of the lot-level data for methodological investigation and lot prioritisation, but not as evidence of independently validated automated anomaly detection.
An important contribution of the benchmark is its explicit representation of variable availability and target-definition leakage. The glucose experiments demonstrated that apparently strong retrospective classification performance can partly depend on complete-series statistics and temporal information. Consequently, model performance obtained from completed QC records should not be interpreted as prospective early-warning capability unless predictors are restricted to information genuinely available before the final QC decision. Similar considerations apply to reference-derived HbA1c variables and to calibration-coefficient information involved in defining lot-level anomaly outcomes.
Several limitations should be considered when reusing the benchmark. The data originate from a single manufacturing environment and contain relatively small numbers of failed glucose QC series and HbA1c production lots. The 2022 lot-level period contains only one selected reference lot and therefore does not provide an estimate of natural annual between-lot variability. Missing haematocrit information is concentrated in particular production periods, meaning that complete-case restriction alters the temporal composition of the HbA1c analytical population. Furthermore, potentially informative manufacturing variables, including equipment-maintenance history, environmental conditions, operator information, supplier or reagent changes, and corrective-action records, are not available in the present release.
Consequently, although the 2025 excursion is an empirical feature of the original manufacturing records, the present benchmark does not support attribution of this deterioration to a specific operational cause. The observed change should therefore be interpreted as a manufacturing-regime excursion rather than being assigned to equipment, environmental, operator, material, reagent, or corrective-action factors that are not represented in the released data.
Future work should therefore extend the benchmark across additional manufacturing sites, device generations, production periods, reagent or material lots, and operating conditions. Multi-site and multi-device data would enable stronger assessment of external generalisation and would help distinguish transferable analytical relationships from production-environment-specific patterns.
A second priority is the development of genuinely prospective glucose QC early-warning benchmarks. Rather than using statistics calculated from completed QC series, future datasets should preserve replicate-level acquisition order and construct predictors from only the first predefined k measurements. The final complete-series QC result could then be retained exclusively as the endpoint. Such a design would permit direct investigation of how early a developing precision or analytical-accuracy problem can be detected without introducing information from the eventual QC decision.
Future HbA1c studies should investigate calibration methods that explicitly accommodate temporal distribution shift, including scheduled or drift-triggered recalibration, incremental learning, and adaptive model-updating strategies. Evaluation should continue to distinguish production-lot generalisation from chronological transfer and should assess subgroup behaviour across haematocrit and other relevant analytical conditions rather than relying solely on pooled error metrics.
Further uncertainty-quantification research should compare static and adaptive conformal approaches under controlled chronological evaluation. Both empirical coverage and prediction-interval width should be reported, together with the calibration and evaluation periods used to obtain them. This is particularly important because restoration of nominal coverage alone does not establish practical usefulness if adaptation results in excessively wide prediction intervals.
The effects of missing-data handling also require further investigation. Future analyses should compare the complete-case HbA1c subset with approaches using the full measurement-level dataset, including training-partition-specific imputation strategies, and should quantify whether alternative missing-data treatments alter temporal, lot-level, or haematocrit-specific conclusions.
Finally, production-lot anomaly research would benefit from larger numbers of lots and from independently reviewed anomaly or root-cause labels. Future evaluations should report continuous anomaly scores and assess sensitivity across alternative model configurations rather than relying on a single assumed anomaly proportion. Linking lot-level signals to documented investigations, corrective actions, equipment events, or material changes would substantially improve the ability to evaluate whether detected deviations correspond to operationally meaningful manufacturing events.
Overall, the Diabetes-QMS Benchmark should be regarded as a reusable research resource for studying quality-monitoring methods under realistic temporal, hierarchical, missing-data, and leakage-sensitive conditions. Its principal value lies not in demonstrating the superiority of a particular machine-learning algorithm, but in enabling more rigorous evaluation of when statistical and machine-learning methods generalise, when they fail under production shift, and which information is genuinely available at the intended decision point. The benchmark is intended to support human-supervised manufacturing-quality research and methodological development rather than patient-level diagnosis, regulatory conformity assessment, or autonomous product-release decisions.
Author Contributions
Conceptualization, B.K.; methodology, B.K.; software, B.K.; validation, B.K.; formal analysis, B.K.; investigation, B.K.; resources, B.K.; data curation, B.K.; writing—original draft preparation, B.K.; writing—review and editing, B.K.; visualization, B.K.; supervision, I.U. and J.L.; project administration, B.K. All authors have read and agreed to the published version of the manuscript.
Funding
This research and the article processing charge (APC) were funded by A-Mediqal LLP, Almaty, 050000, Republic of Kazakhstan. The funder had no role in the study design, data collection or provision, data analysis, interpretation of the results, preparation of the manuscript, or the decision to publish.
Institutional Review Board Statement
Not applicable. The study involved de-identified manufacturing quality-control and calibration data and did not involve human participants or patient-level clinical data.
Informed Consent Statement
Not applicable. The study did not involve human participants or identifiable patient data.
Data Availability Statement
The de-identified dataset analysed in this study is publicly available in the Hugging Face repository “Diabetes-QMS Benchmark” at https://huggingface.co/datasets/BekzatK/diabetes-qms-benchmark (accessed on 2 August 2026). The repository contains the glucose QC-series, HbA1c measurement-level, and HbA1c production-lot components used in this study. The dataset is distributed under the Creative Commons Attribution 4.0 International (CC BY 4.0) licence.
Acknowledgments
The authors acknowledge Axel & A LLP for providing the de-identified manufacturing data used in this study. All numerical results were reviewed and verified by the authors against the source data. The authors have reviewed and edited the output and take full responsibility for the content of this publication.
Conflicts of Interest
B.K. is affiliated with Axel & A LLP, which provided the de-identified manufacturing data used in this study. Apart from data provision and the affiliation of B.K. with the organisation, Axel & A LLP had no role in the study design, statistical or machine-learning analyses, interpretation of the results, preparation of the manuscript, or the decision to publish. The research and the article processing charge were funded by A-Mediqal LLP; the funder had no role in the study design, data collection or provision, data analysis, interpretation of the results, preparation of the manuscript, or the decision to publish. The authors declare no other conflicts of interest.
Abbreviations
The following abbreviations are used in this manuscript:
| AI | Artificial Intelligence |
| ARL | Average Run Length |
| CI | Confidence Interval |
| CUSUM | Cumulative Sum |
| CV | Coefficient of Variation |
| EWMA | Exponentially Weighted Moving Average |
| FAIR | Findable, Accessible, Interoperable, and Reusable |
| HbA1c | Glycated Haemoglobin A1c |
| HCT | Haematocrit |
| ISO | International Organization for Standardization |
| MAE | Mean Absolute Error |
| ML | Machine Learning |
| NGSP | National Glycohemoglobin Standardization Program |
| QC | Quality Control |
| QMS | Quality Management System |
| RF | Random Forest |
| RMSE | Root Mean Squared Error |
| ROC-AUC | Area Under the Receiver Operating Characteristic Curve |
| SD | Standard Deviation |
| SPC | Statistical Process Control |
| UCL | Upper Control Limit |
References
- International Diabetes Federation. IDF Diabetes Atlas, 11th ed.; International Diabetes Federation: Brussels, Belgium, 2025. [Google Scholar]
- World Health Organization. Diabetes; World Health Organization: Geneva, Switzerland, 2024; Available online: https://www.who.int/news-room/fact-sheets/detail/diabetes (accessed on 16 August 2026).
- American Diabetes Association Professional Practice Committee for Diabetes. 2. Diagnosis and Classification of Diabetes: Standards of Care in Diabetes—2026. Diabetes Care 2026, 49, S27–S49. [Google Scholar] [CrossRef] [Scilit]
- Genitsaridi, I.; Salpea, P.; Salim, A.; Sajjadi, S.F.; Tomic, D.; James, S.; Thirunavukkarasu, S.; Issaka, A.; Chen, L.; Basit, A.; et al. 11th Edition of the IDF Diabetes Atlas: Global, Regional, and National Diabetes Prevalence Estimates for 2024 and Projections for 2050. Lancet Diabetes Endocrinol. 2026, 14, 149–156. [Google Scholar] [CrossRef] [Scilit]
- ISO 15197:2013; In Vitro Diagnostic Test Systems—Requirements for Blood-Glucose Monitoring Systems for Self-Testing in Managing Diabetes Mellitus. ISO (International Organization for Standardization): Geneva, Switzerland, 2013.
- ISO 13485:2016; Medical Devices—Quality Management Systems—Requirements for Regulatory Purposes. ISO (International Organization for Standardization): Geneva, Switzerland, 2016.
- Tercan, H.; Meisen, T. Machine Learning and Deep Learning Based Predictive Quality in Manufacturing: A Systematic Review. J. Intell. Manuf. 2022, 33, 1879–1905. [Google Scholar] [CrossRef] [Scilit]
- Mayer, J.; Jochem, R. Capability Indices for Digitized Industries: A Review and Outlook of Machine Learning Applications for Predictive Process Control. Processes 2024, 12, 1730. [Google Scholar] [CrossRef] [Scilit]
- Kapoor, S.; Narayanan, A. Leakage and the Reproducibility Crisis in Machine-Learning-Based Science. Patterns 2023, 4, 100804. [Google Scholar] [CrossRef] [Scilit]
- Karimkyzy, B. Diabetes-QMS Benchmark: Glucose QC and HbA1c Manufacturing Quality-Management Dataset; Hugging Face Datasets. 2026. Available online: https://huggingface.co/datasets/BekzatK/diabetes-qms-benchmark (accessed on 4 August 2026).
- Ribeiro, D.; Matos, L.M.; Moreira, G.; Pilastri, A.; Cortez, P. Isolation Forests and Deep Autoencoders for Industrial Screw Tightening Anomaly Detection. Computers 2022, 11, 54. [Google Scholar] [CrossRef] [Scilit]
- Song, J.; Kumar, P.; Kim, Y.; Kim, H.S. A Fault Detection System for Wiring Harness Manufacturing Using Artificial Intelligence. Mathematics 2024, 12, 537. [Google Scholar] [CrossRef] [Scilit]
- Ali, Y.; Shah, S.W.; Arif, A.; Tlija, M.; Siddiqi, M.R. Intelligent Framework Design for Quality Control in Industry 4.0. Appl. Sci. 2024, 14, 7726. [Google Scholar] [CrossRef] [Scilit]
- Antosz, K.; Knapčíková, L.; Husár, J. Evaluation and Application of Machine Learning Techniques for Quality Improvement in Metal Product Manufacturing. Appl. Sci. 2024, 14, 10450. [Google Scholar] [CrossRef] [Scilit]
- Ullah, A.; Younas, M.; Saharudin, M.S. Transforming Manufacturing Quality Management with Cognitive Twins: A Data-Driven, Predictive Approach to Real-Time Optimization of Quality. J. Manuf. Mater. Process. 2025, 9, 79. [Google Scholar] [CrossRef] [Scilit]
- Hramov, A.E.; Pisarchik, A.N. Big Data Management and Quality Evaluation for the Implementation of AI Technologies in Smart Manufacturing. Appl. Sci. 2025, 15, 11905. [Google Scholar] [CrossRef] [Scilit]
- Choi, H.; Jung, K. Impact of Data Distribution and Bootstrap Setting on Anomaly Detection Using Isolation Forest in Process Quality Control. Entropy 2025, 27, 761. [Google Scholar] [CrossRef] [Scilit]
- Henao Villa, C.F.; Garcia Arango, D.A.; Garcés Giraldo, L.F.; Meleán Romero, R.A.; Valencia-Arias, A.; Velásquez Ochoa, J.A. Artificial Intelligence in Complex Manufacturing Systems: A Systematic Review of Validation Rigor and Deployment Readiness in Predictive Maintenance. Information 2026, 17, 456. [Google Scholar] [CrossRef] [Scilit]
- Gandhi, D.; May, G.; Psarommatis, F. An Integrated RFID and Vision-Based Closed-Loop Quality Control Architecture for Sterile Medical Device Assembly Lines: Industrial Implementation and Validation. Appl. Sci. 2026, 16, 4841. [Google Scholar] [CrossRef] [Scilit]
- Kermenov, R.; Nabissi, G.; Longhi, S.; Bonci, A. Anomaly Detection and Concept Drift Adaptation for Dynamic Systems: A General Method with Practical Implementation Using an Industrial Collaborative Robot. Sensors 2023, 23, 3260. [Google Scholar] [CrossRef] [Scilit]
- Gupta, R.; Tian, B.; Wang, Y.; Nahrstedt, K. TWIN-ADAPT: Continuous Learning for Digital Twin-Enabled Online Anomaly Classification in IoT-Driven Smart Labs. Future Internet 2024, 16, 239. [Google Scholar] [CrossRef] [Scilit]
- Shen, G.; Li, S.; Zhang, Y.; Zhou, H.; Li, M. Dynamic Monitoring Method of Polymer Injection Molding Product Quality Based on Operating Condition Drift Detection and Incremental Learning. Polymers 2025, 17, 3025. [Google Scholar] [CrossRef] [Scilit]
- Guo, S.; Wang, D.; Feng, Z.; Chen, J.; Guo, W. Di-CNN: Domain-Knowledge-Informed Convolutional Neural Network for Manufacturing Quality Prediction. Sensors 2023, 23, 5313. [Google Scholar] [CrossRef] [Scilit]
- Angelopoulos, A.N.; Bates, S. Conformal Prediction: A Gentle Introduction. Found. Trends Mach. Learn. 2023, 16, 494–591. [Google Scholar] [CrossRef] [Scilit]
- Gibbs, I.; Candès, E.J. Conformal Inference for Online Prediction with Arbitrary Distribution Shifts. J. Mach. Learn. Res. 2024, 25, 1–36. [Google Scholar]
- Moccardi, A.; Conte, C.; Ghosh, R.C.; Moscato, F. A Robust Conformal Framework for IoT-Based Predictive Maintenance. Future Internet 2025, 17, 244. [Google Scholar] [CrossRef] [Scilit]
- Lu, M.; Cheng, J.; Lei, Q.; Guo, J.; Chen, K. A High-Precision Screen-Printed Glucose Sensor with In Situ Impedance-Based HCT Correction and Temperature Compensation. Biosensors 2026, 16, 193. [Google Scholar] [CrossRef] [Scilit]
- McCann, M.; Johnston, A. SECOM [Dataset]; UCI Machine Learning Repository. 2008. Available online: https://archive.ics.uci.edu/dataset/179/secom (accessed on 5 August 2026).
- Matzka, S. Explainable Artificial Intelligence for Predictive Maintenance Applications. In Proceedings of the 2020 Third International Conference on Artificial Intelligence for Industries (AI4I), Irvine, CA, USA, 21–23 September 2020; IEEE: Piscataway, NJ, USA, 2020; pp. 69–74. [Google Scholar] [CrossRef] [Scilit]
- Rieth, C.A.; Amsel, B.D.; Tran, R.; Cook, M.B. Additional Tennessee Eastman Process Simulation Data for Anomaly Detection Evaluation [Dataset]; Harvard Dataverse: Cambridge, MA, USA, 2017. [Google Scholar] [CrossRef]
- Bergmann, P.; Batzner, K.; Fauser, M.; Sattlegger, D.; Steger, C. The MVTec Anomaly Detection Dataset: A Comprehensive Real-World Dataset for Unsupervised Anomaly Detection. Int. J. Comput. Vis. 2021, 129, 1038–1059. [Google Scholar] [CrossRef] [Scilit]
- Katser, I.D.; Kozitsin, V.O. Skoltech Anomaly Benchmark (SKAB) [Dataset]; Kaggle. 2020. Available online: https://www.kaggle.com/datasets/yuriykatser/skoltech-anomaly-benchmark-skab (accessed on 9 August 2026).
- Collins, G.S.; Moons, K.G.M.; Dhiman, P.; Riley, R.D.; Beam, A.L.; Van Calster, B.; Ghassemi, M.; Liu, X.; Reitsma, J.B.; Van Smeden, M.; et al. TRIPOD + AI Statement: Updated Guidance for Reporting Clinical Prediction Models That Use Regression or Machine Learning Methods. BMJ 2024, 385, e078378. [Google Scholar] [CrossRef] [Scilit]
- Moons, K.G.M.; Damen, J.A.A.; Kaul, T.; Hooft, L.; Andaur Navarro, C.; Dhiman, P.; Beam, A.L.; Van Calster, B.; Celi, L.A.; Denaxas, S.; et al. PROBAST + AI: An Updated Quality, Risk of Bias, and Applicability Assessment Tool for Prediction Models Using Regression or Artificial Intelligence Methods. BMJ 2025, 388, e082505. [Google Scholar] [CrossRef] [Scilit]
- Breiman, L. Random Forests. Mach. Learn. 2001, 45, 5–32. [Google Scholar] [CrossRef] [Scilit]
- Chen, T.; Guestrin, C. XGBoost: A Scalable Tree Boosting System. In Proceedings of the 22nd ACM SIGKDD International Conference on Knowledge Discovery and Data Mining, San Francisco, CA, USA, 13–17 August 2016; pp. 785–794. [Google Scholar] [CrossRef] [Scilit]
- Hastie, T.; Tibshirani, R. Generalized Additive Models. Stat. Sci. 1986, 1, 297–310. [Google Scholar] [CrossRef] [Scilit]
- Laird, N.M.; Ware, J.H. Random-Effects Models for Longitudinal Data. Biometrics 1982, 38, 963–974. [Google Scholar] [CrossRef] [Scilit]
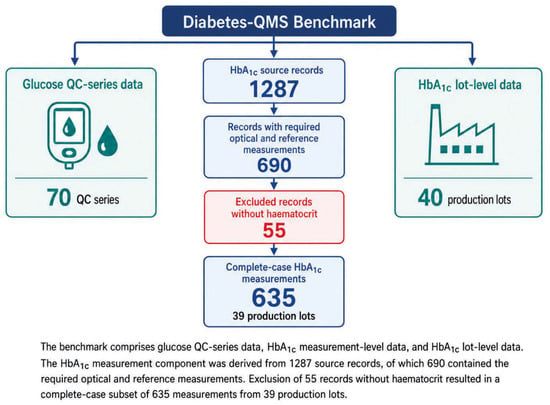
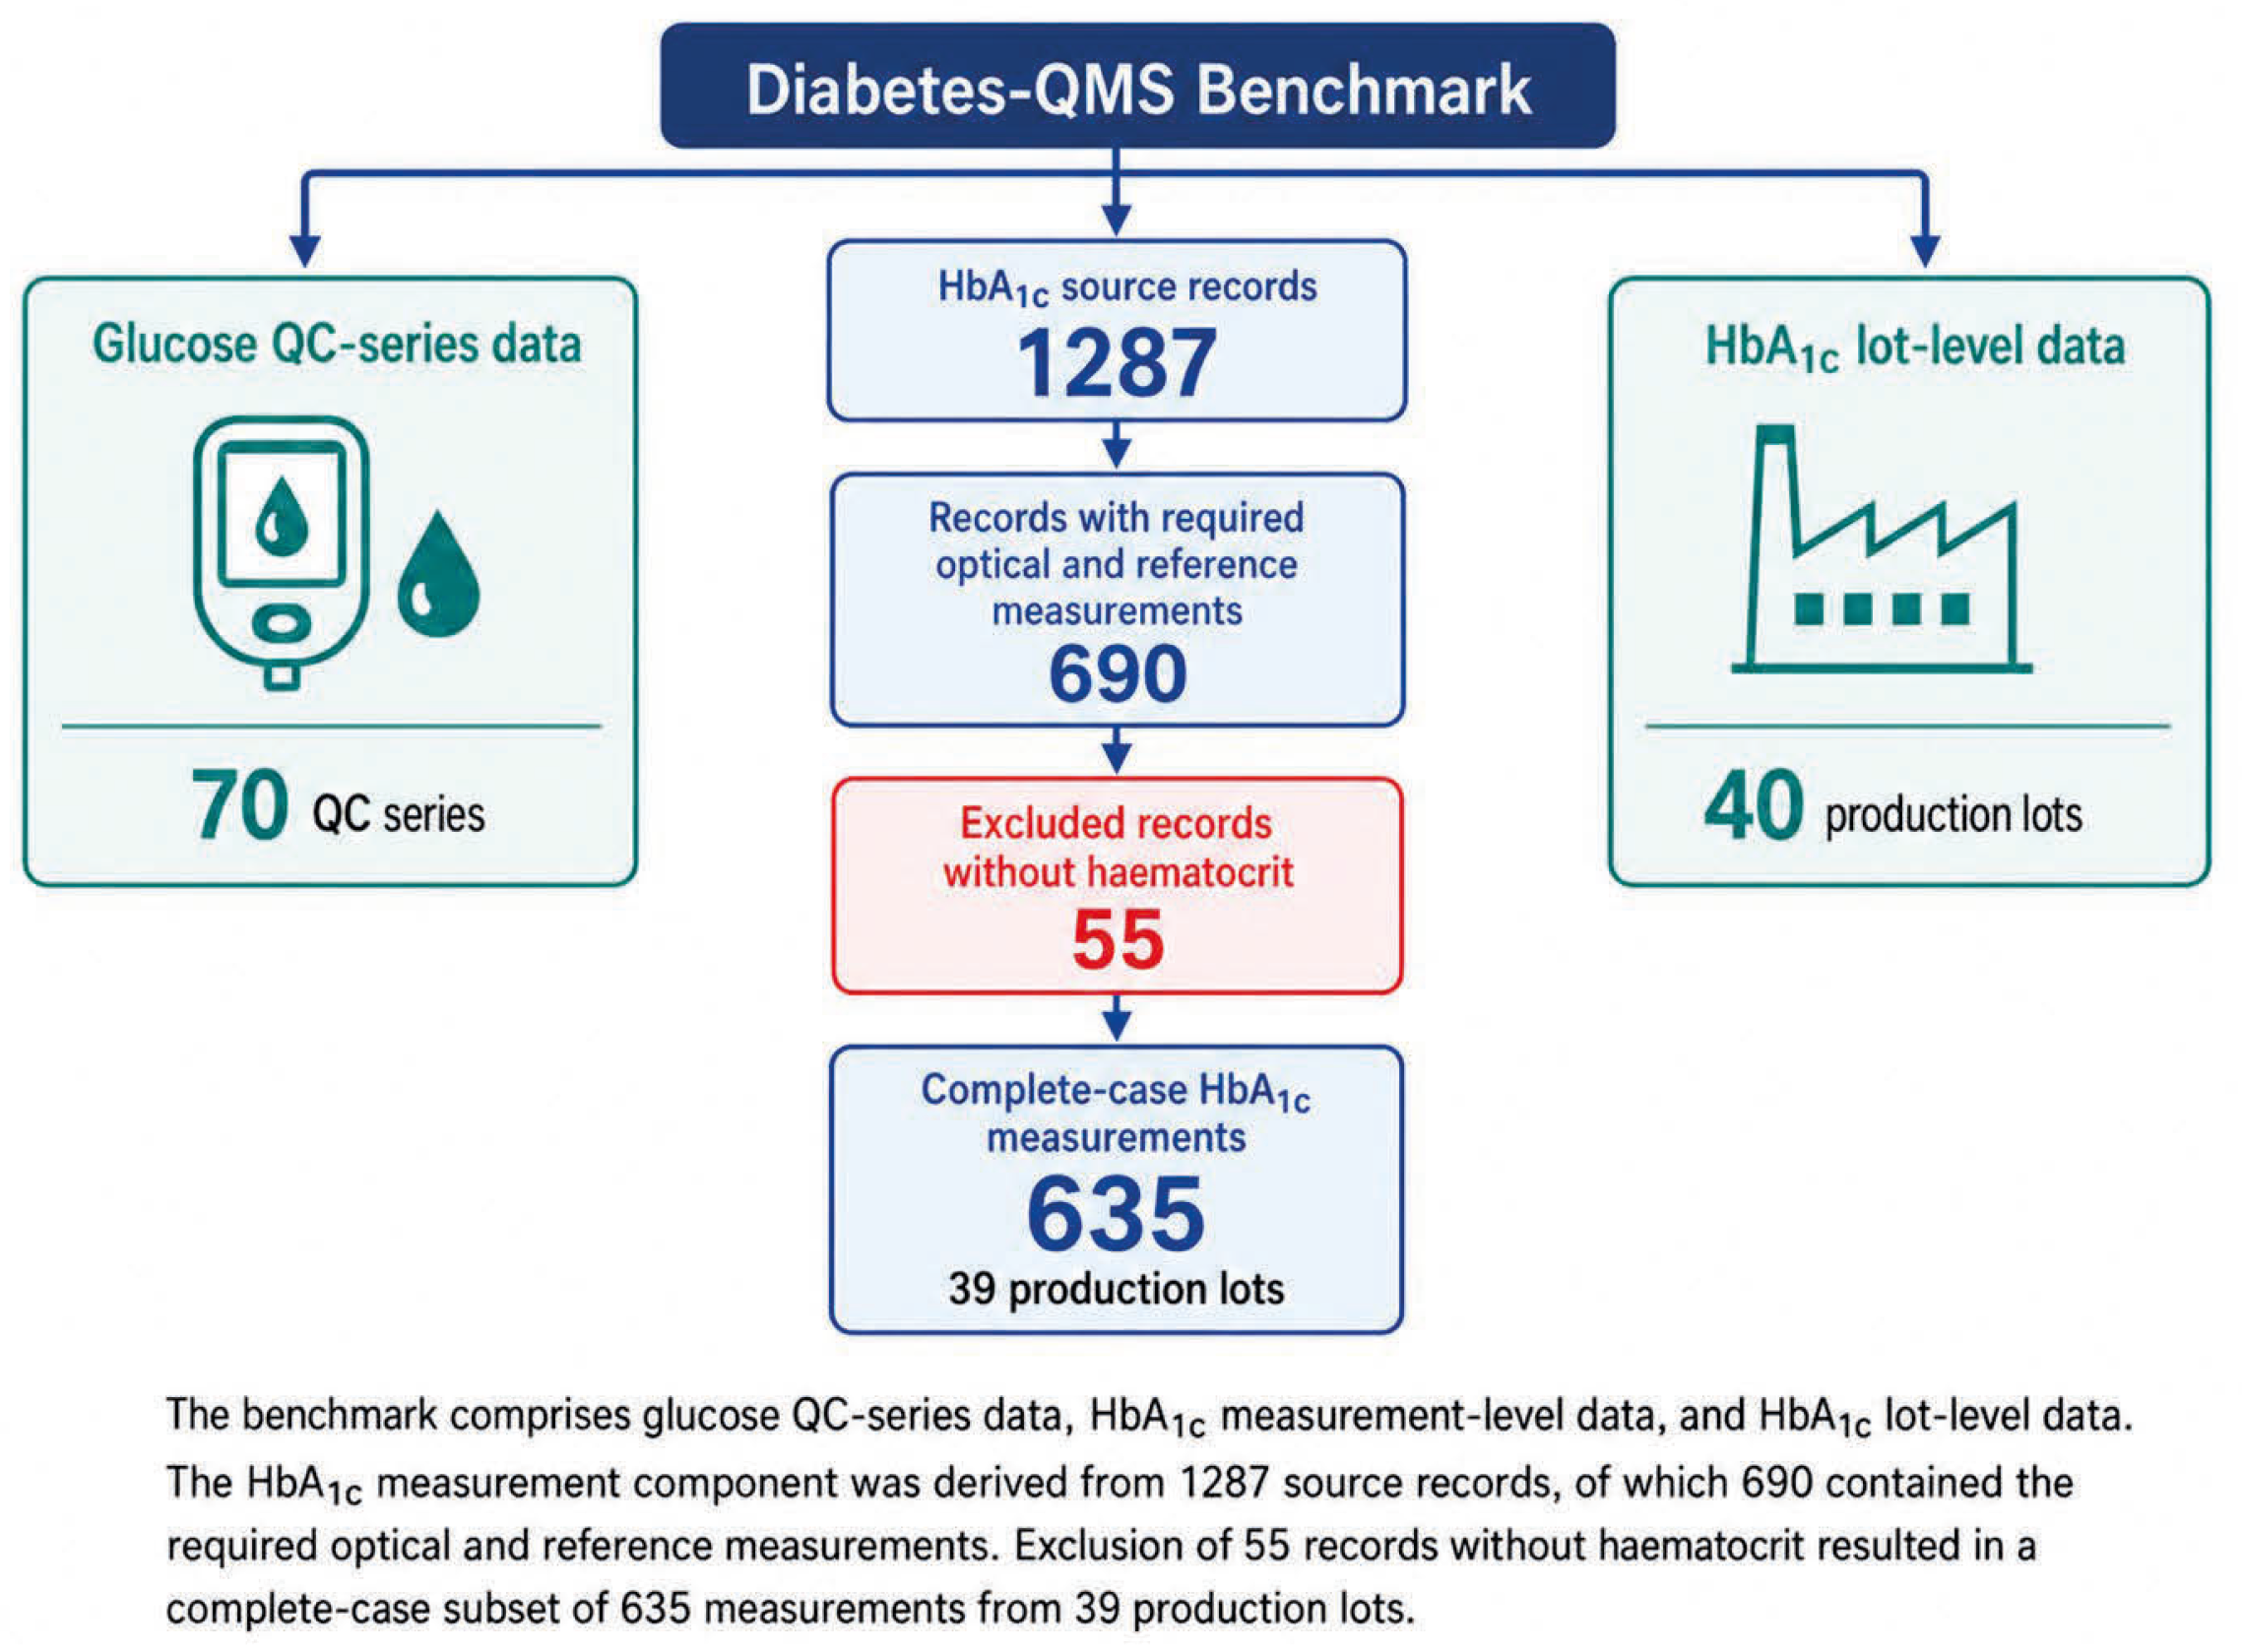
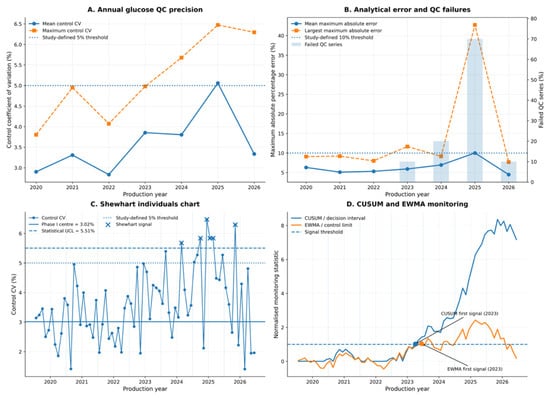
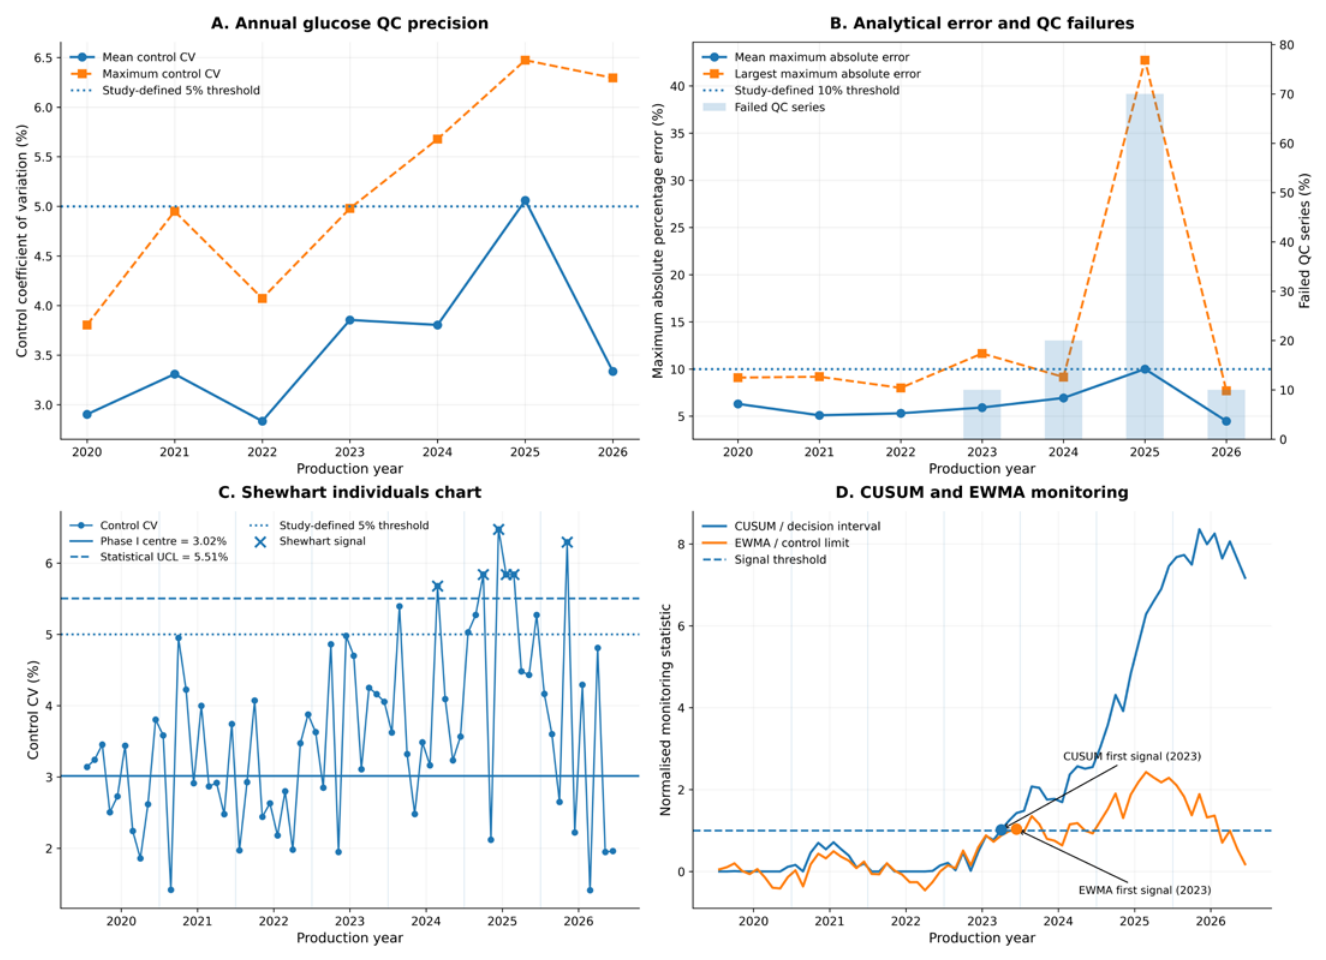
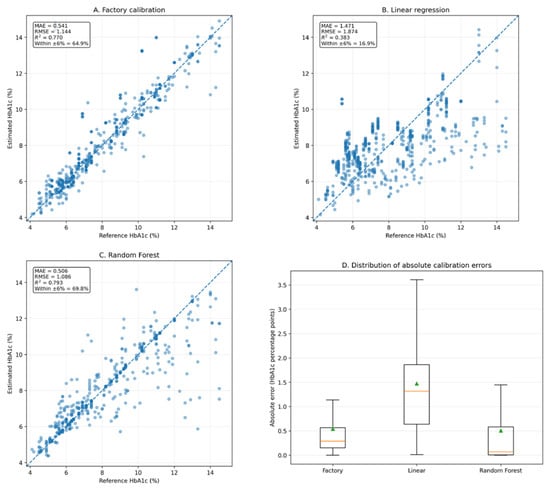
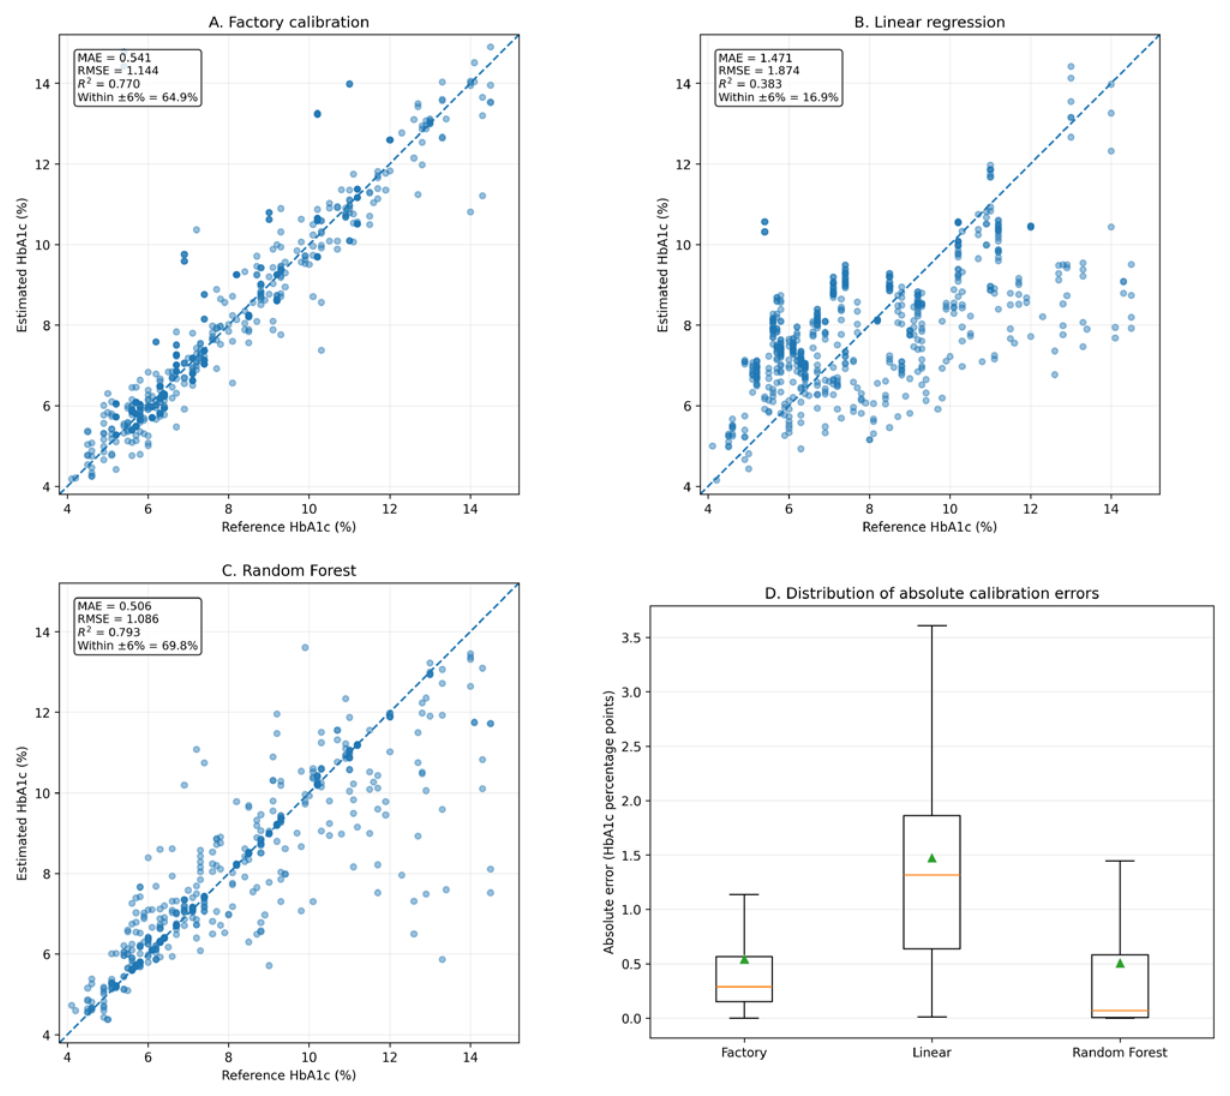
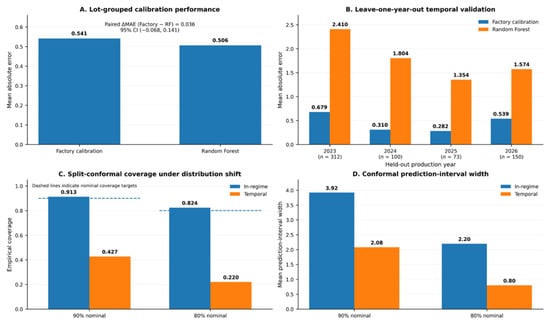
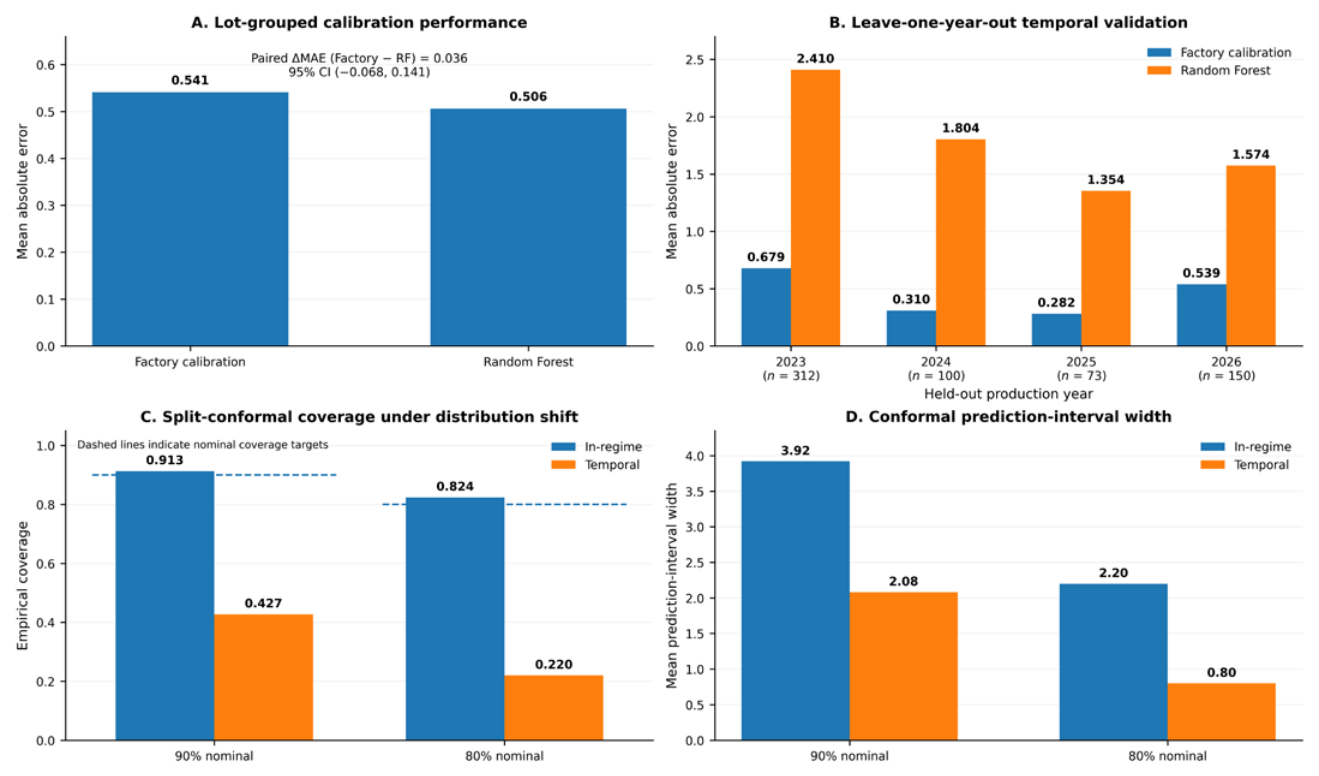
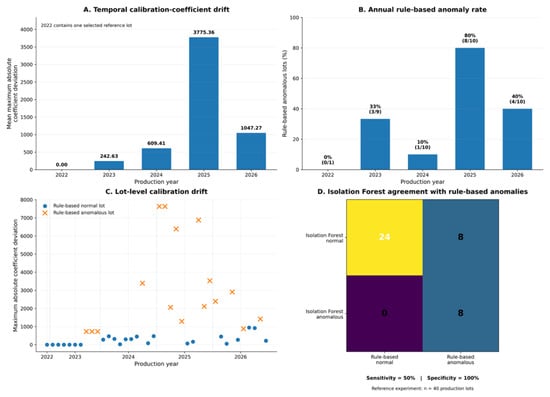
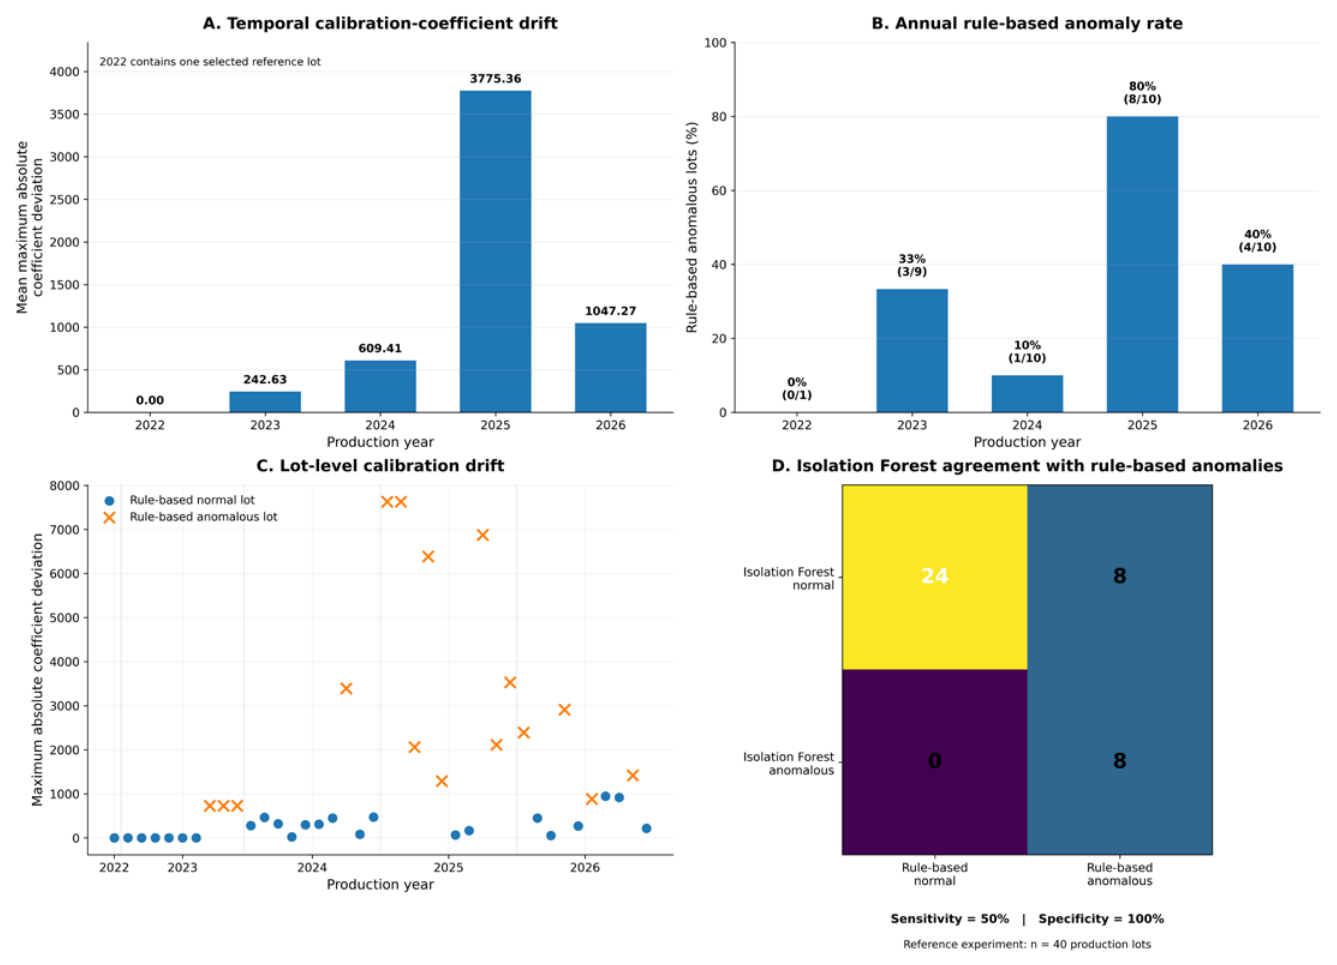
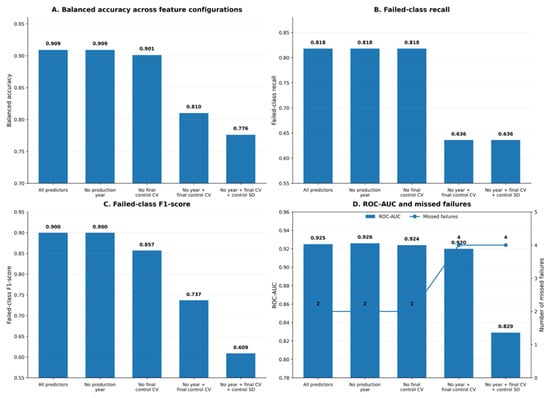
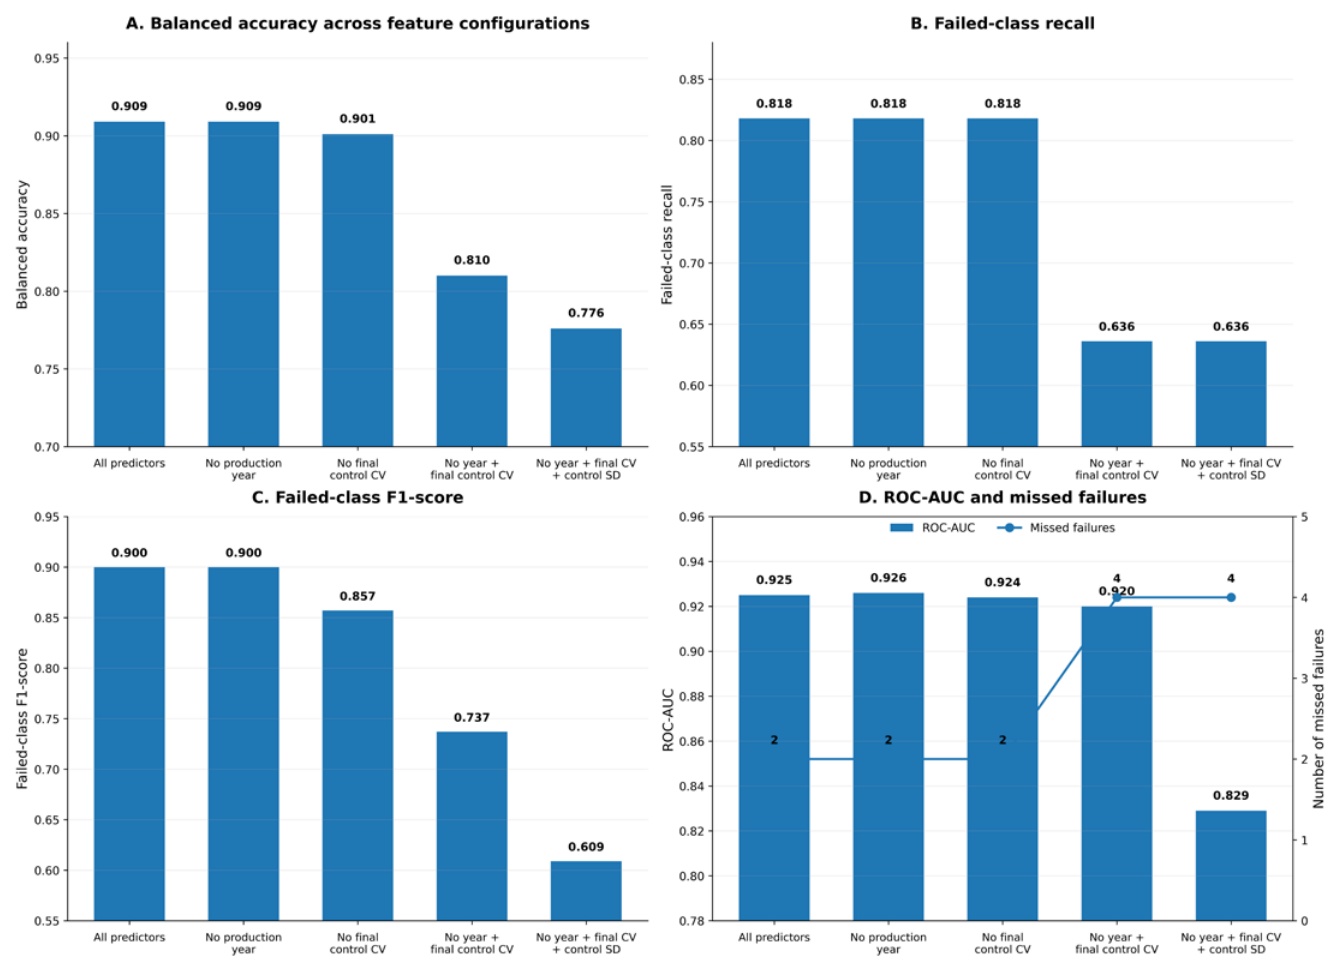

Disclaimer/Publisher’s Note: The statements, opinions and data contained in all publications are solely those of the individual author(s) and contributor(s) and not of MDPI and/or the editor(s). MDPI and/or the editor(s) disclaim responsibility for any injury to people or property resulting from any ideas, methods, instructions or products referred to in the content. |
© 2026 by the authors. Licensee MDPI, Basel, Switzerland. This article is an open access article distributed under the terms and conditions of the Creative Commons Attribution (CC BY) license.