


Abstract
Age-based model partitioning and subgroup calibration address different prediction problems. We reconstructed a legacy glycated hemoglobin (HbA1c) dataset against the National Health and Nutrition Examination Survey (NHANES) 2017–2018, corrected selection restrictions, and compared pooled and age-partitioned models in 2219 adults. Source-frozen models were evaluated in NHANES 2015–2016 and 2021–2023. Additional sensitivity analyses examined source splits, calibration partitions, survey design, case mix, and demographic predictors. Across 200 refitting partitions, hard-age ordinary least squares (OLS) showed no demonstrated predictive benefit over pooled OLS (mean hard-minus-pooled root mean squared error (RMSE) difference +0.0035). In the original forward evaluation, age-Mondrian calibration reduced coverage spread without improving minimum-group coverage, and the paired bootstrap interval for the spread change included zero. Across 200 source fitting/calibration splits, mean forward age-coverage spread was 7.40 percentage points with global residual calibration, 4.27 with age-Mondrian, and 2.51 with fasting-glucose Mondrian calibration. These findings distinguish subgroup balance from minimum coverage and show that the apparent benefit depends on the calibration partition. Subgroup assessment should report coverage, minimum coverage, width, interval score, and split sensitivity together. This same-program NHANES evaluation does not establish independent clinical validity or justify replacing laboratory HbA1c measurement.
1. Introduction
Glycated hemoglobin (HbA1c) reflects chronic glycemic exposure and is used with plasma-glucose criteria in diabetes screening and diagnosis [1]. Age- and sex-associated differences in the HbA1c–glucose relationship motivate subgroup assessment, but do not establish benefits from separate age-specific prediction models [2]. The present analysis does not measure red-cell lifespan, renal function, medication use, anemia, or other biological mechanisms, so it cannot identify a biological cause for any subgroup difference.
Richer NHANES models already estimate continuous HbA1c, and external diabetes-risk studies have investigated age-specific algorithms [3,4]. Here we ask whether separate age-group fitting adds value when pooled models already include age, and whether interval-calibration partitions affect subgroup coverage and width.
Data reuse, small subgroups, and favorable splits can produce apparent improvements [5,6,7]. Clinical-prediction guidance distinguishes internal evaluation, transport, and independent clinical validation [8,9,10,11,12,13]. Likewise, marginal conformal coverage does not imply subgroup or individual conditional validity [14,15,16,17,18], while complex-survey designs distinguish sample-level performance from population-oriented estimands [19,20,21,22,23,24].
Predictive reliability denotes observed calibration and interval-coverage behavior, assessed through error, coverage, minimum-group coverage, spread, width, and interval score. Reproducibility instead concerns whether provenance, procedures, and outputs can be inspected or regenerated.
We reconstruct the source cohort, compare pooled and hard-age point models, test alternative calibration partitions, and evaluate frozen models across NHANES cycles. This methodological study does not test clinical decision benefit.
2. Materials and Methods
2.1. Study Design and Cohorts
The legacy table contained 2325 adults with age, body mass index (BMI), fasting glucose, triglycerides (TG), HbA1c, and calculated Friedewald low-density lipoprotein (LDL). All rows were uniquely reconstructed from NHANES 2017–2018 [25,26,27,28]. The historical 2350-to-2325 reduction excluded 25 otherwise complete records with unavailable LDL, all with TG > 400 mg/dL. We removed this restriction because LDL was not a predictor.
The legacy table also included 131 observations outside the official fasting-subsample definition. The corrected source cohort therefore required age ≥ 20 years, complete BMI/glucose/TG/HbA1c, fasting duration 8 to <24 h, and a valid positive fasting-subsample weight. It contained 2219 adults: 666 aged 20–39 years, 991 aged 40–64 years, and 562 aged 65 years or older. The released age variable (RIDAGEYR) was top-coded at 80; RIDAGEYR = 80 was treated as the 80+ category [25,26,27,28].
Temporal evaluation used separate NHANES 2015–2016 [29] and August 2021–August 2023 [30,31,32,33] cross-sectional samples (Table 1). Both targets retained complete model variables and a positive cycle-specific fasting-subsample weight; auxiliary fasting-questionnaire fields were not used to add target exclusions. No target outcome updated the original source-frozen model or its calibration.
Table 1.
Cohort roles and age-group composition. Each cycle is a separate cross-sectional NHANES sample.
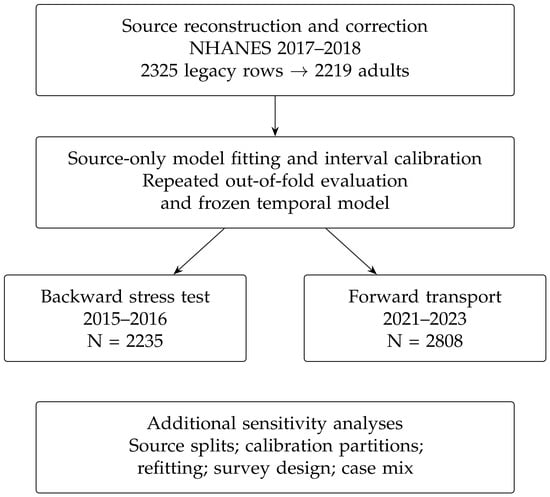
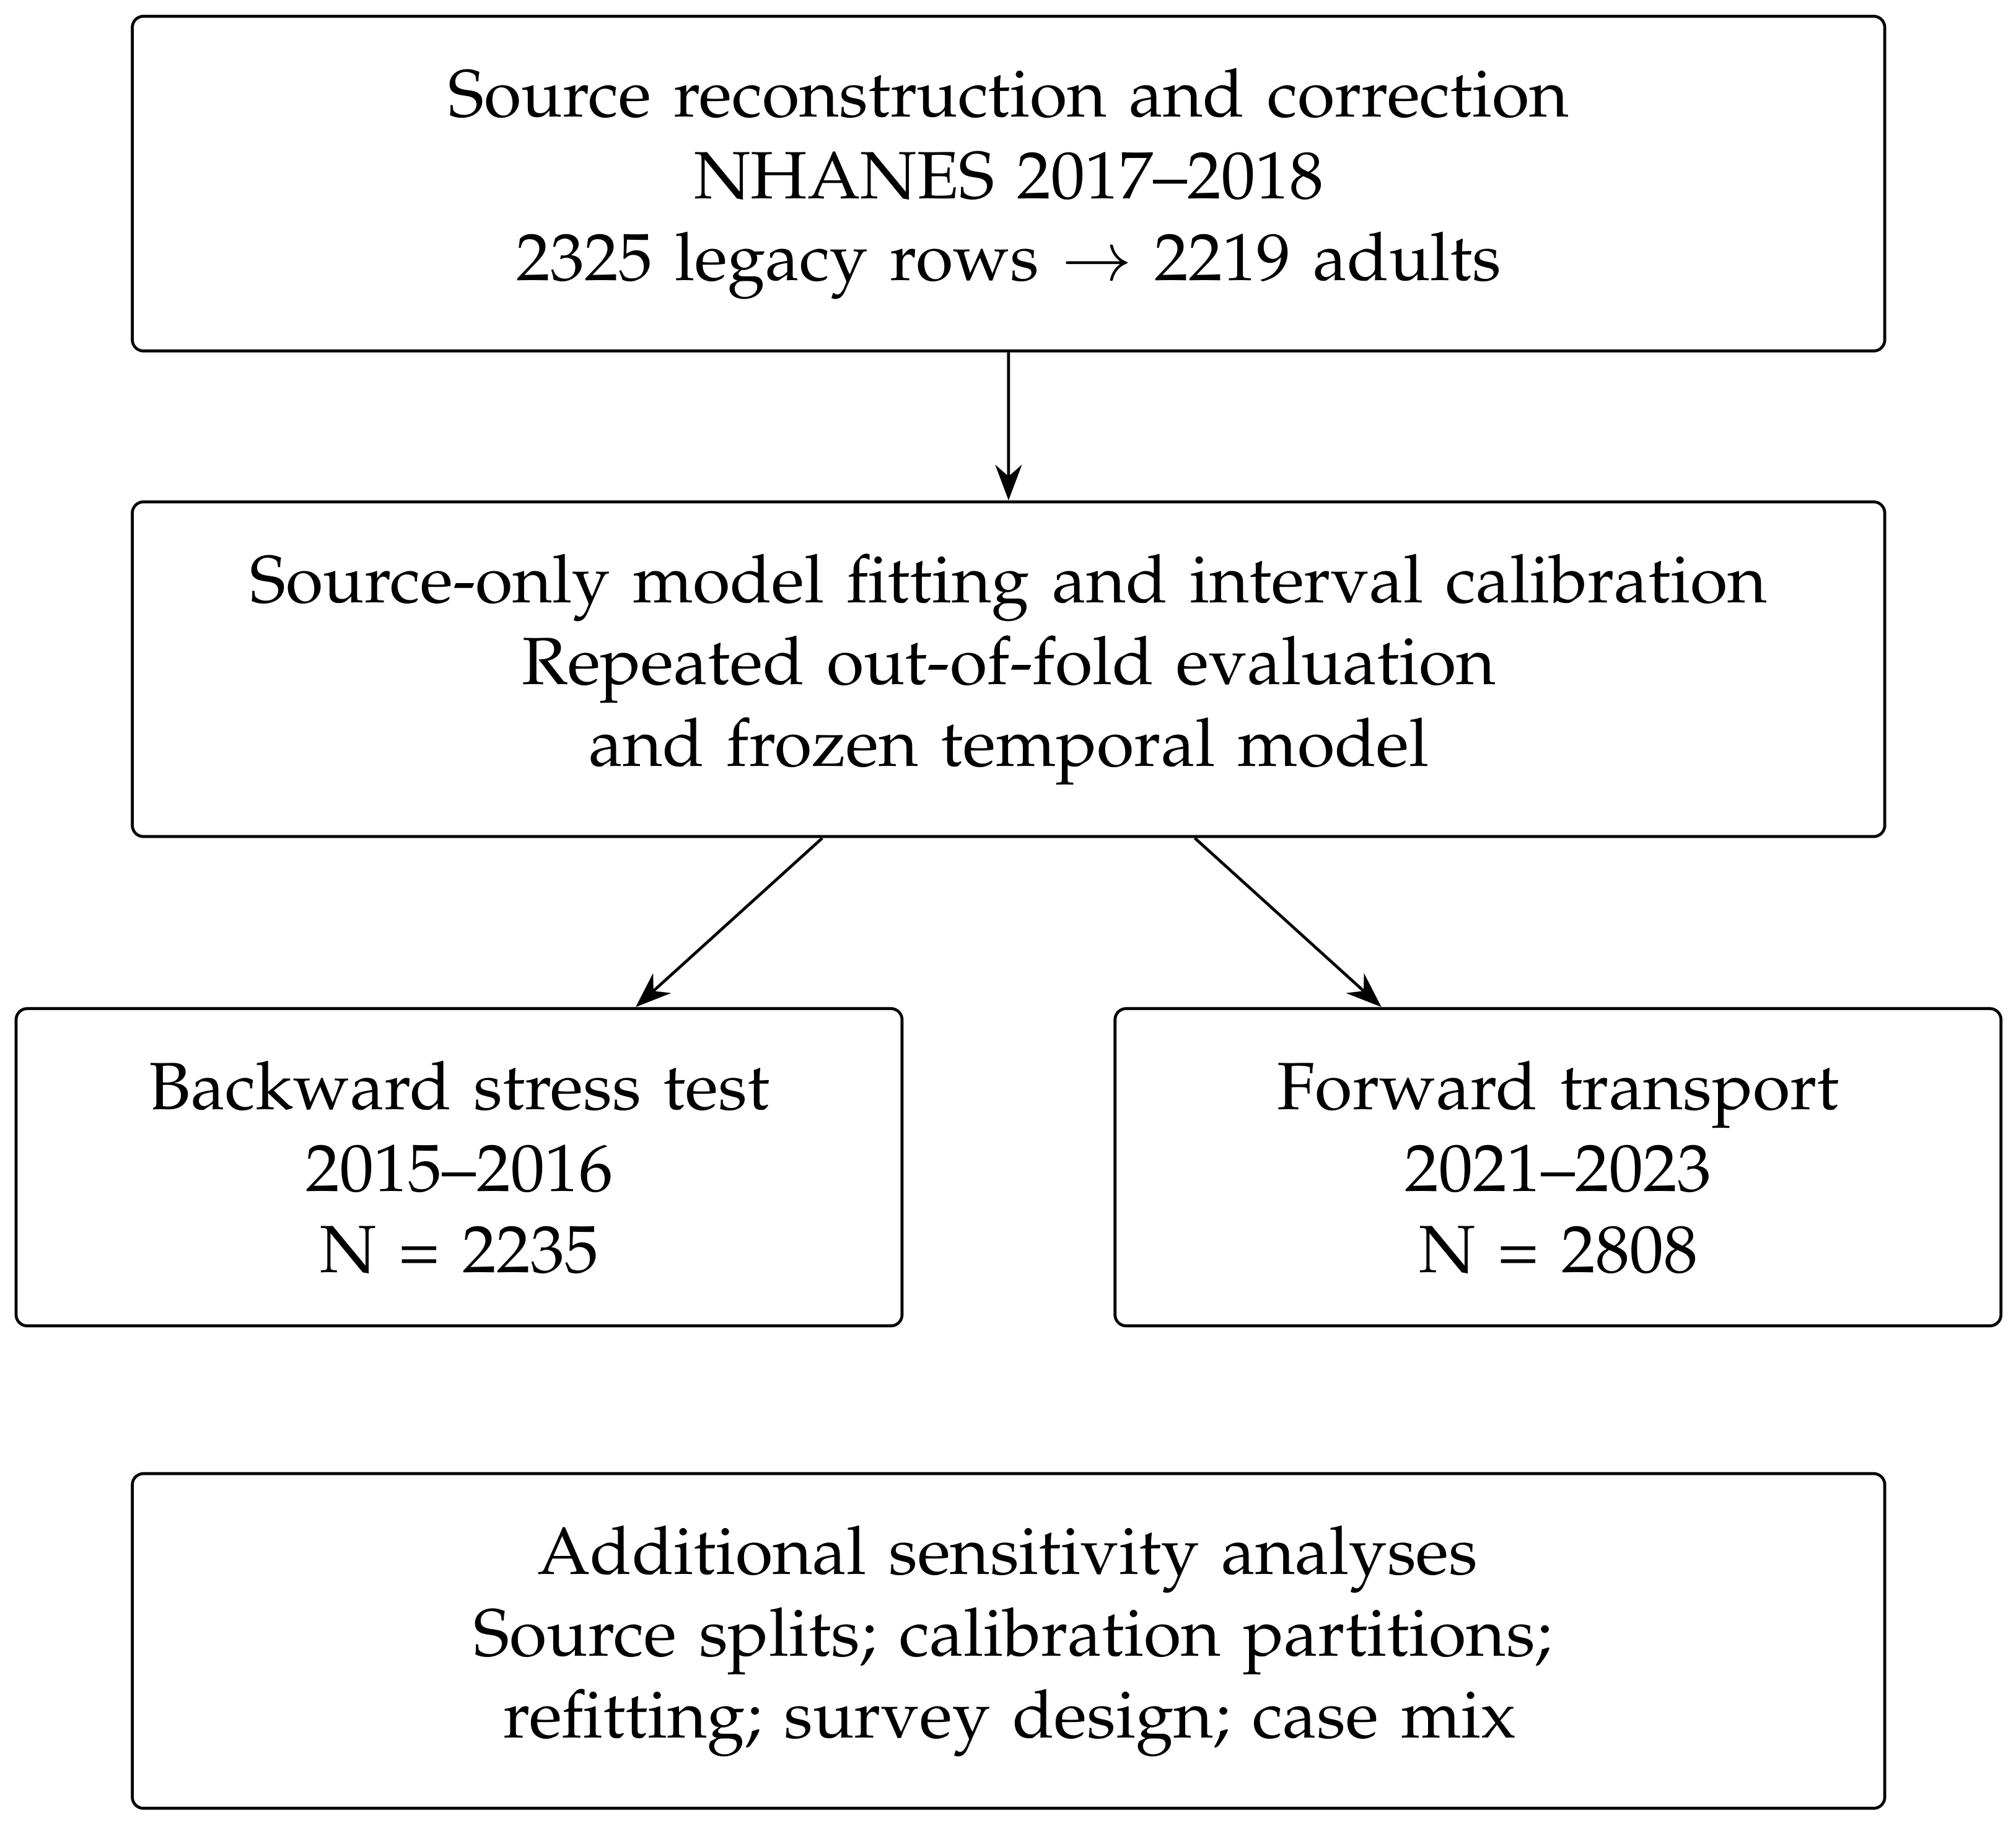
Figure 1 summarizes the separation of source development and temporal evaluation.
Figure 1.
Study structure. Source fitting and calibration roles are separated from temporal evaluation. Both temporal targets remain within NHANES. Additional sensitivity analyses are shown separately from the original source and temporal evaluations.
2.2. Predictors and Point-Prediction Models
Measured HbA1c (%) at the examination was the continuous outcome. The original comparison used age, BMI, fasting glucose, and TG. A glucose-only ordinary least squares (OLS) model was a parsimonious reference. Four-input models were pooled OLS; separate OLS models in ages 20–39, 40–64, and 65+; a fixed smooth continuous-age varying-coefficient OLS; pooled LightGBM; and separate age-group LightGBM [34].
The smooth varying-coefficient OLS used a degree-3 cubic age spline with five quantile knots, standardized BMI/glucose/TG, and all spline-by-metabolic interactions; the complete retained-code specification is given in Supplement Section S2.
Because pooled models include age, hard-age comparisons test separate fitting, including the resulting smaller subgroup training sets, rather than age inclusion. The inherited predictor set and boundaries are not a comprehensive clinical specification.
LightGBM inner tuning used three-fold cross-validation over num_leaves {7,15,31}, min_child_samples {20,50}, and learning_rate {0.03,0.07}, with n_estimators = 300, max_depth = −1, subsample = 0.90, subsample_freq = 1, colsample_bytree = 1.0, reg_alpha = 0, and reg_lambda = 1. Selection minimized mean inner-fold RMSE. Candidates within of the minimum were ordered by fewer leaves, larger min_child_samples, then lower learning_rate; these rules were verified in the original code. Model selection was confined to training data. The historical adaptive-network-based fuzzy inference system (ANFIS) objects are retained only as a supplementary reproducibility case because the original checking observations overlapped their training sets.
2.3. Internal Evaluation and Uncertainty
Internal evaluation used five outer folds by five repeats, stratified by age group. Each participant contributed one out-of-fold (OOF) prediction per repeat. Within each development set, 20% was reserved for calibration and excluded from point-model fitting.
The primary point metric was root mean squared error (RMSE):
Here n is the number of evaluated predictions, is measured HbA1c, and is its prediction. RMSE is in HbA1c percentage points.
The 10,000-resample paired bootstrap sampled participants within age groups, retaining all five repeated predictions together. Models were not refitted; intervals therefore condition on the fitted procedures rather than capturing full training-sample uncertainty. Correlated fold errors can undermine conventional cross-validation intervals [35]. An interval containing zero is not an equivalence test.
An additional sensitivity analysis refitted pooled and hard-age OLS across 200 common five-fold source partitions, reserving 20% of each development set from point fitting. Hard-minus-pooled RMSE percentiles describe stability conditional on this cohort, not population confidence intervals.
2.4. Residual Conformal Calibration and Partition Sensitivity
Internal out-of-fold evaluation used fold-specific source models and calibration-only observations within each outer split. Temporal transport instead used one final pooled OLS fitted on 1775 source observations and a disjoint 444-observation calibration set; neither the model nor its residual quantiles was updated in either target. For absolute calibration residuals, the finite-sample order statistic was
Here is the calibration count, the nominal miscoverage, the kth ordered absolute residual, the fitted point prediction at predictor vector x, and the resulting interval. The ceiling operator rounds upward to the next integer. Empty groups or give uninformative intervals, not silently clipped quantiles.
The primary 90% interval uses miscoverage 0.10. A global scheme used one residual quantile. The original age-Mondrian scheme estimated separate residual quantiles for ages 20–39, 40–64, and 65+.
An additional partition-sensitivity analysis used 200 source training/calibration splits, seeds 20261001–20261200. Each split used an 80/20 source allocation stratified by the original age groups. The point model was fitted only on source-training observations and residual quantiles only on source-calibration observations. Four residual-calibration schemes were compared using the same fitted model in each split: (1) one global residual quantile; (2) age-Mondrian using 20–39/40–64/65+; (3) fasting-glucose Mondrian using <100/100 to <126/≥126 mg/dL; (4) predicted-HbA1c bins defined by source-training prediction tertiles. An additional sensitivity used age cutoffs 20–44/45–64/65+.
All methods were compared using the original target age groups, providing a common reporting partition. Minimum-group coverage is the smallest of the three empirical age coverages; spread is their maximum minus minimum. Interval score combines width with penalties for misses; its equation is given in Supplement Section S7. We report age-specific coverage, minimum-group coverage, max–min spread, mean interval width, and interval score. Split percentiles describe stability across source allocations; they are not confidence intervals over new populations.
Conformalized quantile regression (CQR) [36] remains a secondary adaptive-width comparator. Its archived interval outputs were reaggregated, but the original fitted quantile-model objects are unavailable; this is not a historical training replay.
2.5. Temporal Transport and Measurement Comparability
The final original frozen pooled OLS used 1775 source observations for model fitting and 444 for conformal calibration. It was applied without target retraining or recalibration to the earlier and later NHANES samples.
Temporal point calibration and calibration-in-the-large (CITL) were evaluated separately from interval coverage:
The freely fitted intercept a is not CITL unless the slope b is fixed at one; is the regression residual. Supplement Table S14 reports intercepts, slopes, and CITL separately.
NHANES documents a 2015–2016 glucose equipment transition for which affected released results were already adjusted to the C311 scale [29]. No additional glucose bridge was applied; the later-cycle glucose documentation also reports no new method, equipment, or site change [30]. For 2021–2023 TG, NHANES documented a method/instrument change and supplied the backward relationship
Here is released later-cycle LBXTLG and is the mapped earlier-scale value. CDC bridge prose labels the regression measurements as mg/L, whereas the released-variable codebooks document mg/dL; we applied the published equation on the documented codebook scale and report this source inconsistency explicitly in Supplement Section A7 [31].
The original forward analysis used this bridge. For the frozen OLS, raw vs. bridged TG was evaluated with identical coefficients.
The 2021–2023 HbA1c documentation records a Tosoh G8 to Bio-Rad D-100 instrument change, but the NHANES bridging study concluded that released HbA1c values did not require adjustment [32]. The 2021–2023 sample design also changed: race/Hispanic-origin and income oversampling was removed and person-level age oversampling was modified [33]. These documented changes motivate case-mix and survey-design sensitivity analyses; they are not treated as causes of predictive-performance differences.
2.6. Survey and Case-Mix Sensitivities
In both temporal cohorts, survey-weighted sensitivities used fasting-subsample weight WTSAF2YR, stratum SDMVSTRA, and primary sampling unit (PSU) SDMVPSU. Taylor-linearized domain variances retained every observed stratum–PSU combination, with zero contributions outside each age group. The Supplement reports both normal-approximate intervals and t-based intervals with 15 design degrees of freedom. Complete-case selection remains a limitation; these estimates do not create a survey-population conformal guarantee.
A source sensitivity assigned public masked stratum–PSU clusters to outer test folds. These variance units are not household identifiers; the analysis addresses cluster separation, not household independence.
Case mix was examined by reporting forward frozen-OLS error for observed HbA1c <5.7%, 5.7–6.4%, and ≥6.5%. A descriptive source-composition standardized RMSE reweighted the target category-specific mean squared errors to the source outcome-category proportions. This analysis characterizes composition dependence; it does not identify a causal explanation for temporal differences.
2.7. Additional-Predictor Sensitivity and Analysis Chronology
An additional OLS sensitivity added NHANES RIAGENDR sex and RIDRETH3 race/Hispanic-origin indicators to age, BMI, glucose, and TG using the same source split roles; category codes and indicator reference levels are specified in Supplement Section S8. These variables were treated as measured predictive covariates, not biological causes [27].
Supplement Table S2 separates original source and forward analyses, secondary backward and CQR evaluations, retrospective diagnostics, and post hoc sensitivity analyses. The additional sensitivity analyses were conducted after the initial outcome inspection and were not part of the original analysis plan.
3. Results
3.1. Corrected Cohort and Point-Model Comparison
The corrected cohort contained 2219 adults. Original repeated-OOF RMSE was 0.573252 for pooled OLS and 0.577421 for hard-age OLS; the paired difference was +0.004169 (95% conditional bootstrap interval ). These results do not demonstrate a benefit of separate age-group fitting and do not establish equivalence.
Hard-age LightGBM was also worse than pooled LightGBM in the original source comparison (0.660133 vs. 0.593745). The other model comparisons are retained as descriptive/exploratory contrasts rather than a family of independent superiority tests.
The 200-refit mean difference was +0.003523, with split percentiles (−0.001388 to +0.009017); hard-age OLS was worse in 91% of runs (Table 2).
Table 2.
Point-model comparison. Differences are hard-age minus pooled OLS. Original bootstrap intervals condition on retained predictions; split percentiles summarize source-partition stability, not population confidence.
All 200 masked-PSU runs were valid. The mean difference was +0.003935 (split percentiles ), with hard-age OLS worse in 98.5% of runs.
3.2. Original Interval Findings: Balance, Minimum Coverage, and Width Are Different Outcomes
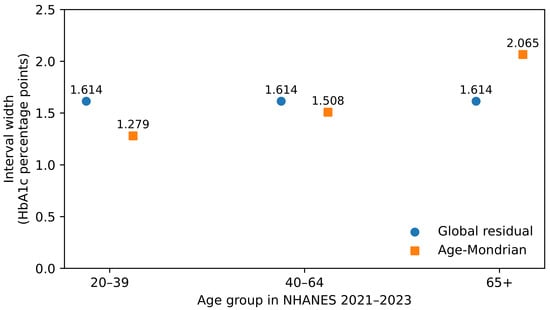
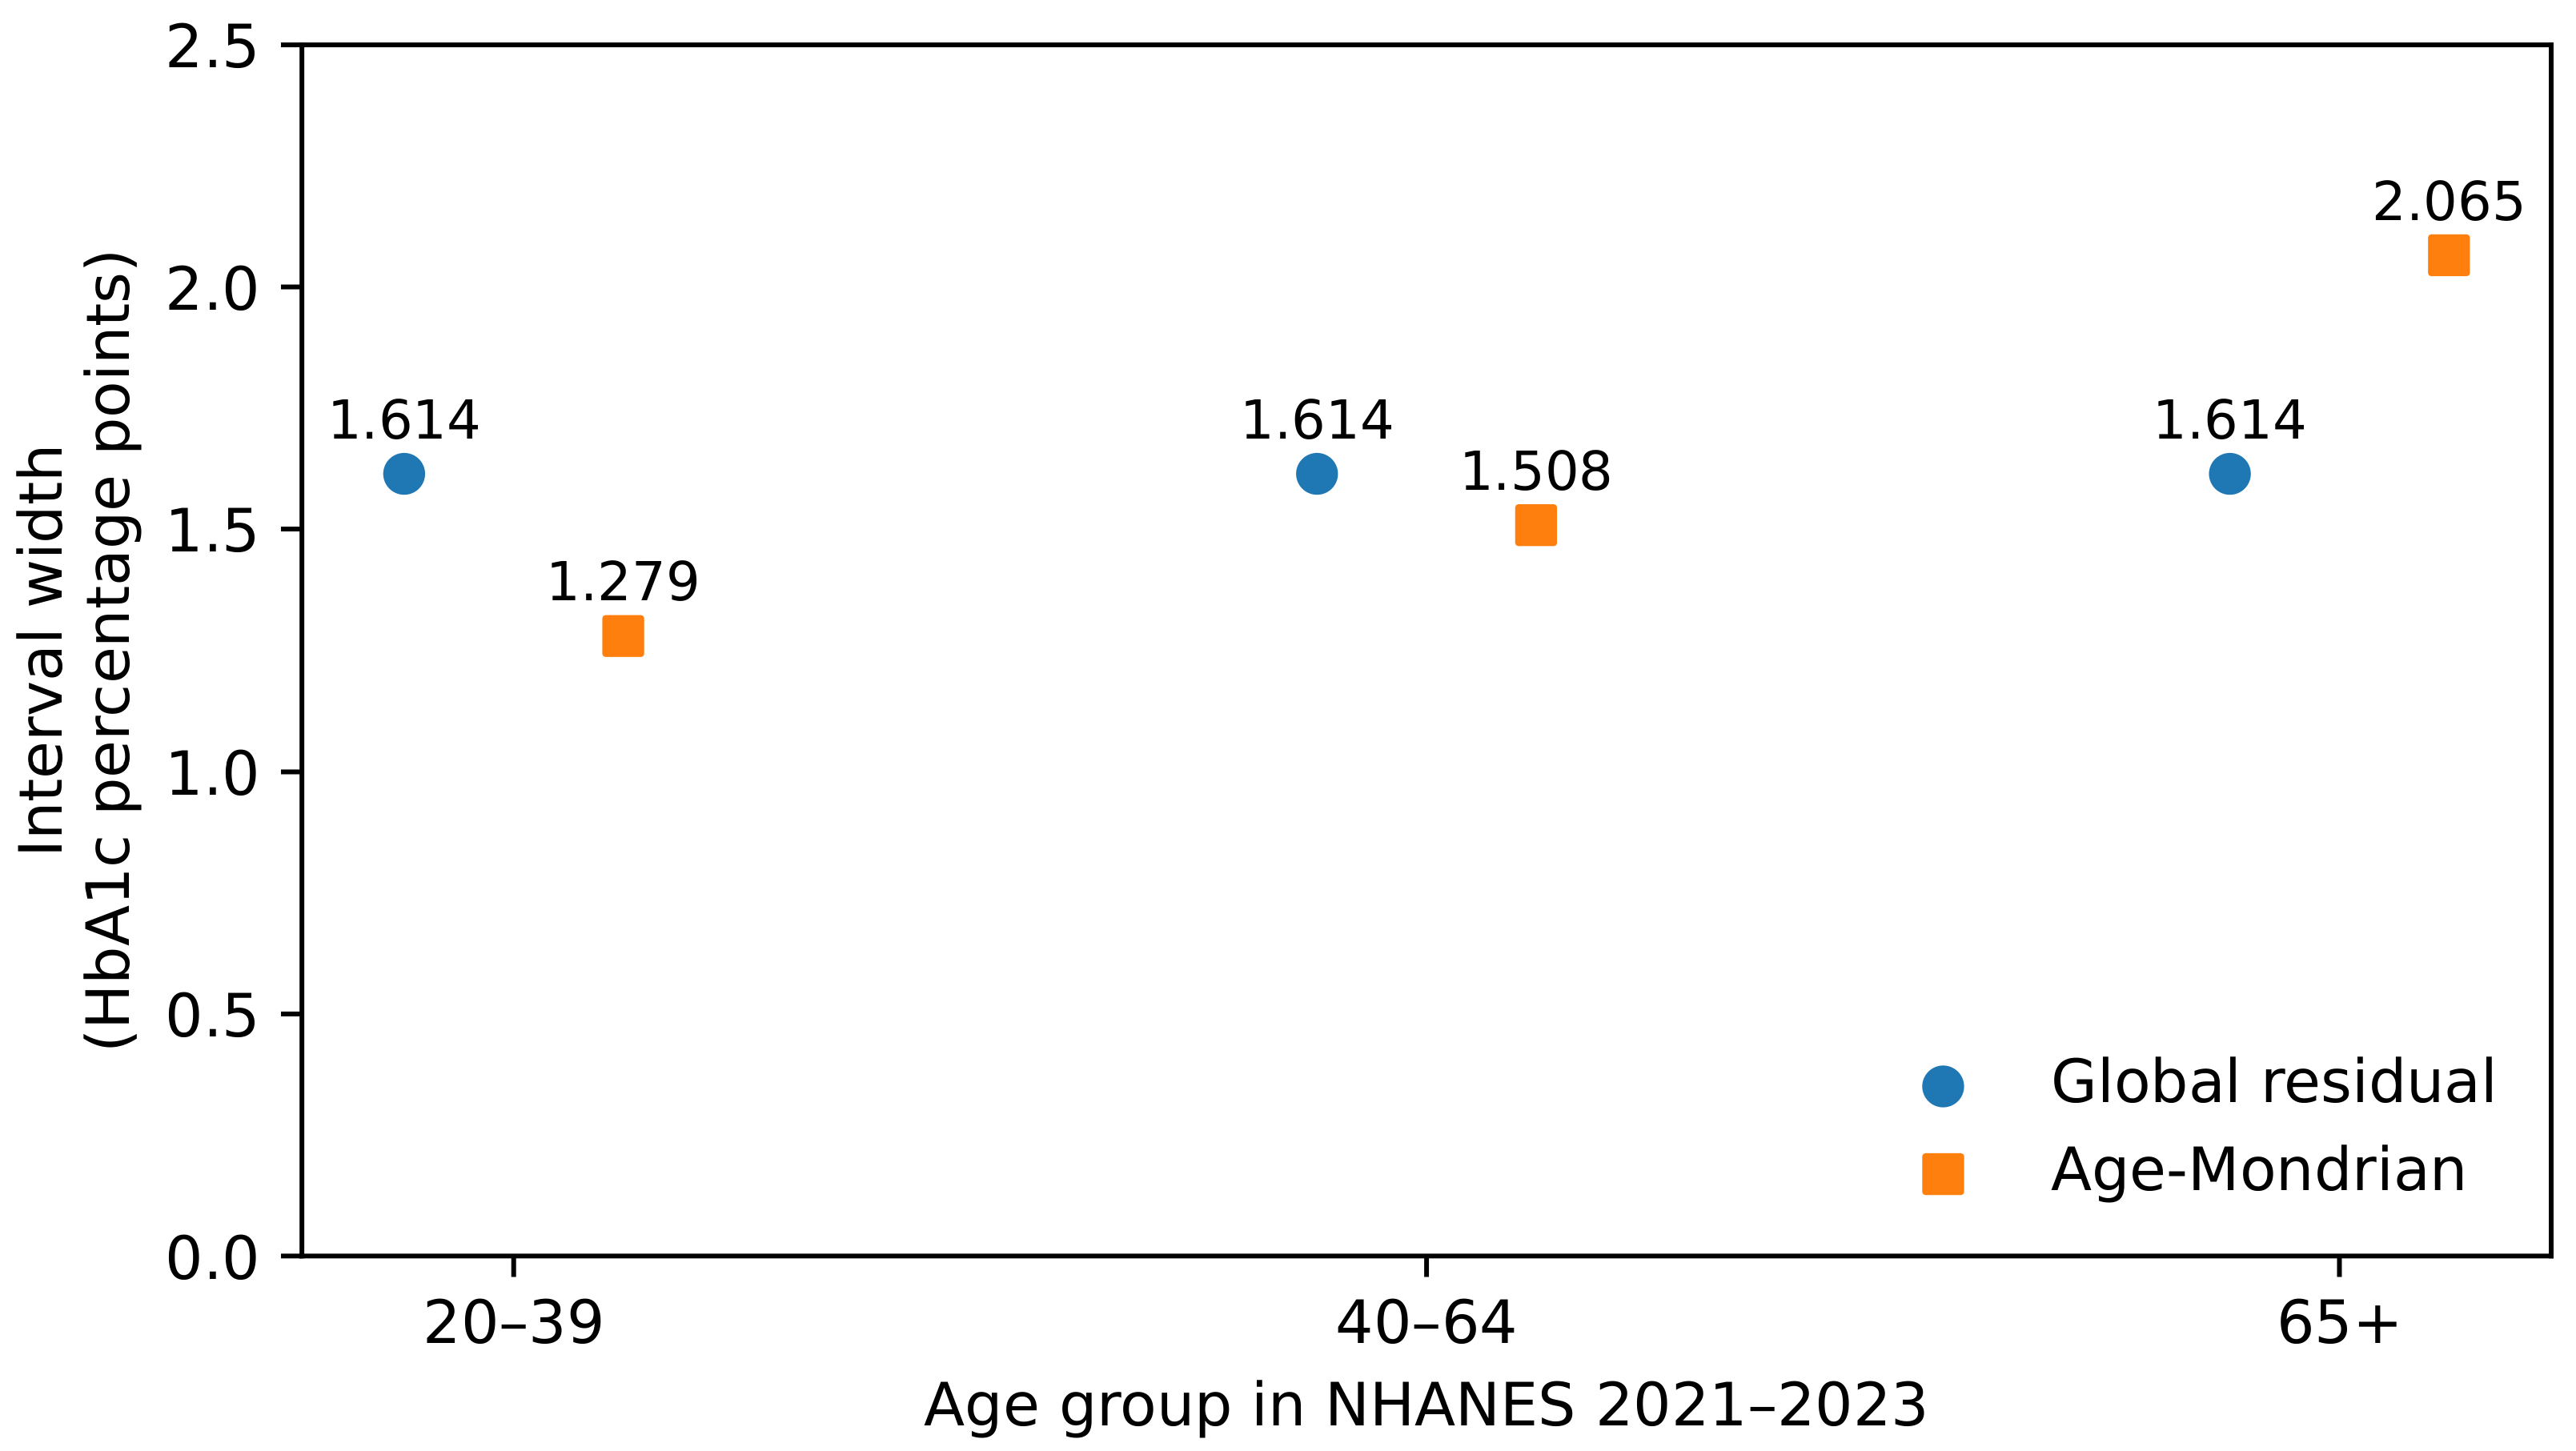
In the original internal analysis, global 90% residual coverage was 0.9622, 0.8928, and 0.8562 across ages 20–39, 40–64, and 65+, respectively, for a 10.59-point spread. Age-Mondrian changed coverage to 0.9120, 0.9037, and 0.8936, reducing the spread to 1.84 points. Interval width was not uniformly larger: compared with the global width of 1.593 in every group, age-Mondrian widths were 1.219, 1.693, and 1.929. Thus, the calibration redistributed both coverage and width.
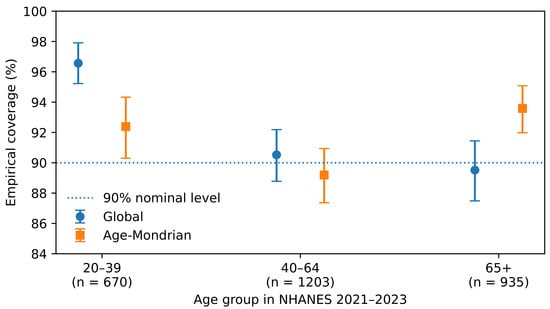
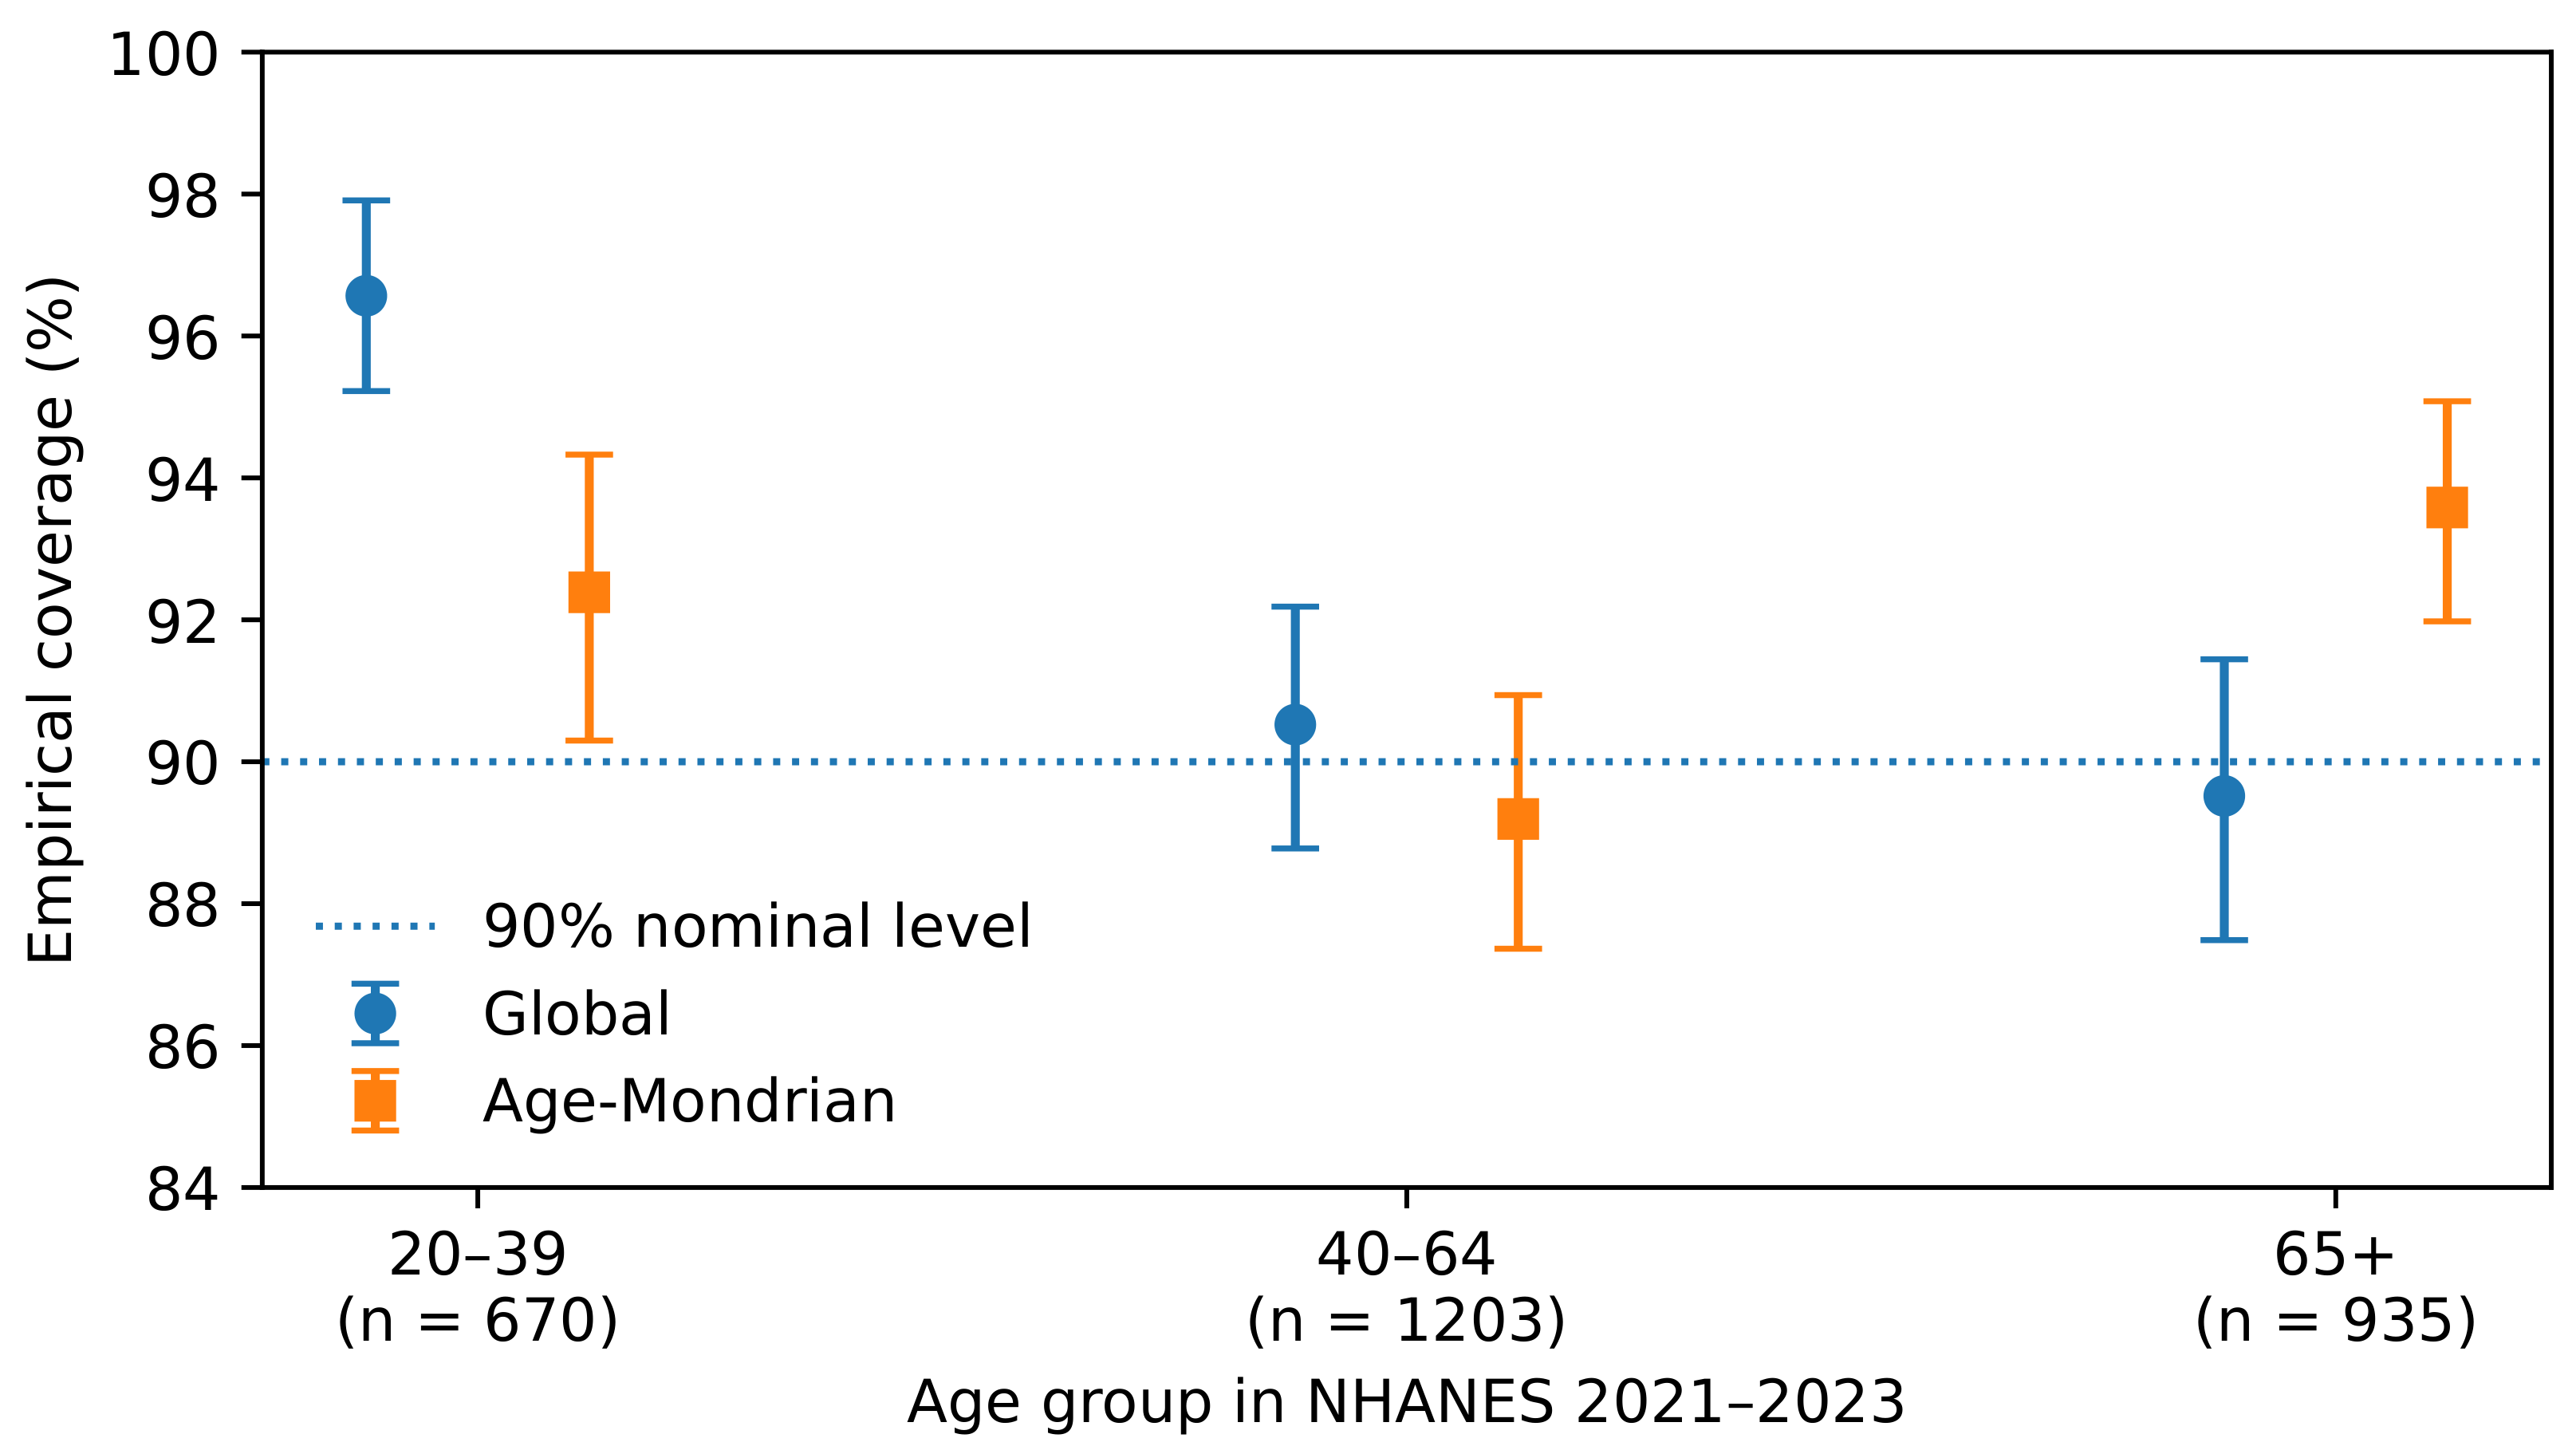
In fixed forward evaluation, age-Mondrian reduced spread but changed minimum coverage from 89.52% to 89.19%. The paired spread change was −2.66 percentage points (95% bootstrap interval ); minimum-coverage change was −0.33 points (). Thus, smaller spread did not establish improvement in the least-covered group.
Figure 2.
Fixed forward NHANES 2021–2023 coverage for source-calibrated 90% intervals. Error bars are 95% paired participant-bootstrap intervals stratified by age and conditional on the frozen model. Points are not connected across categories.
Figure 3.
Widths of the same fixed forward intervals shown in Figure 2. The global width is constant; age-Mondrian narrows intervals for ages 20–39 and 40–64 and widens them for ages 65+. These are frozen-temporal widths, not the repeated-OOF mean widths reported in Section 3.2.
3.3. Calibration-Partition Choice Materially Changes Forward Subgroup Results
Figure 4.
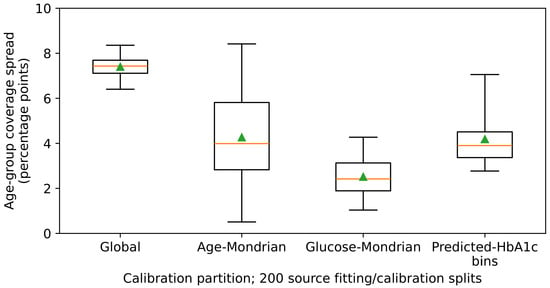
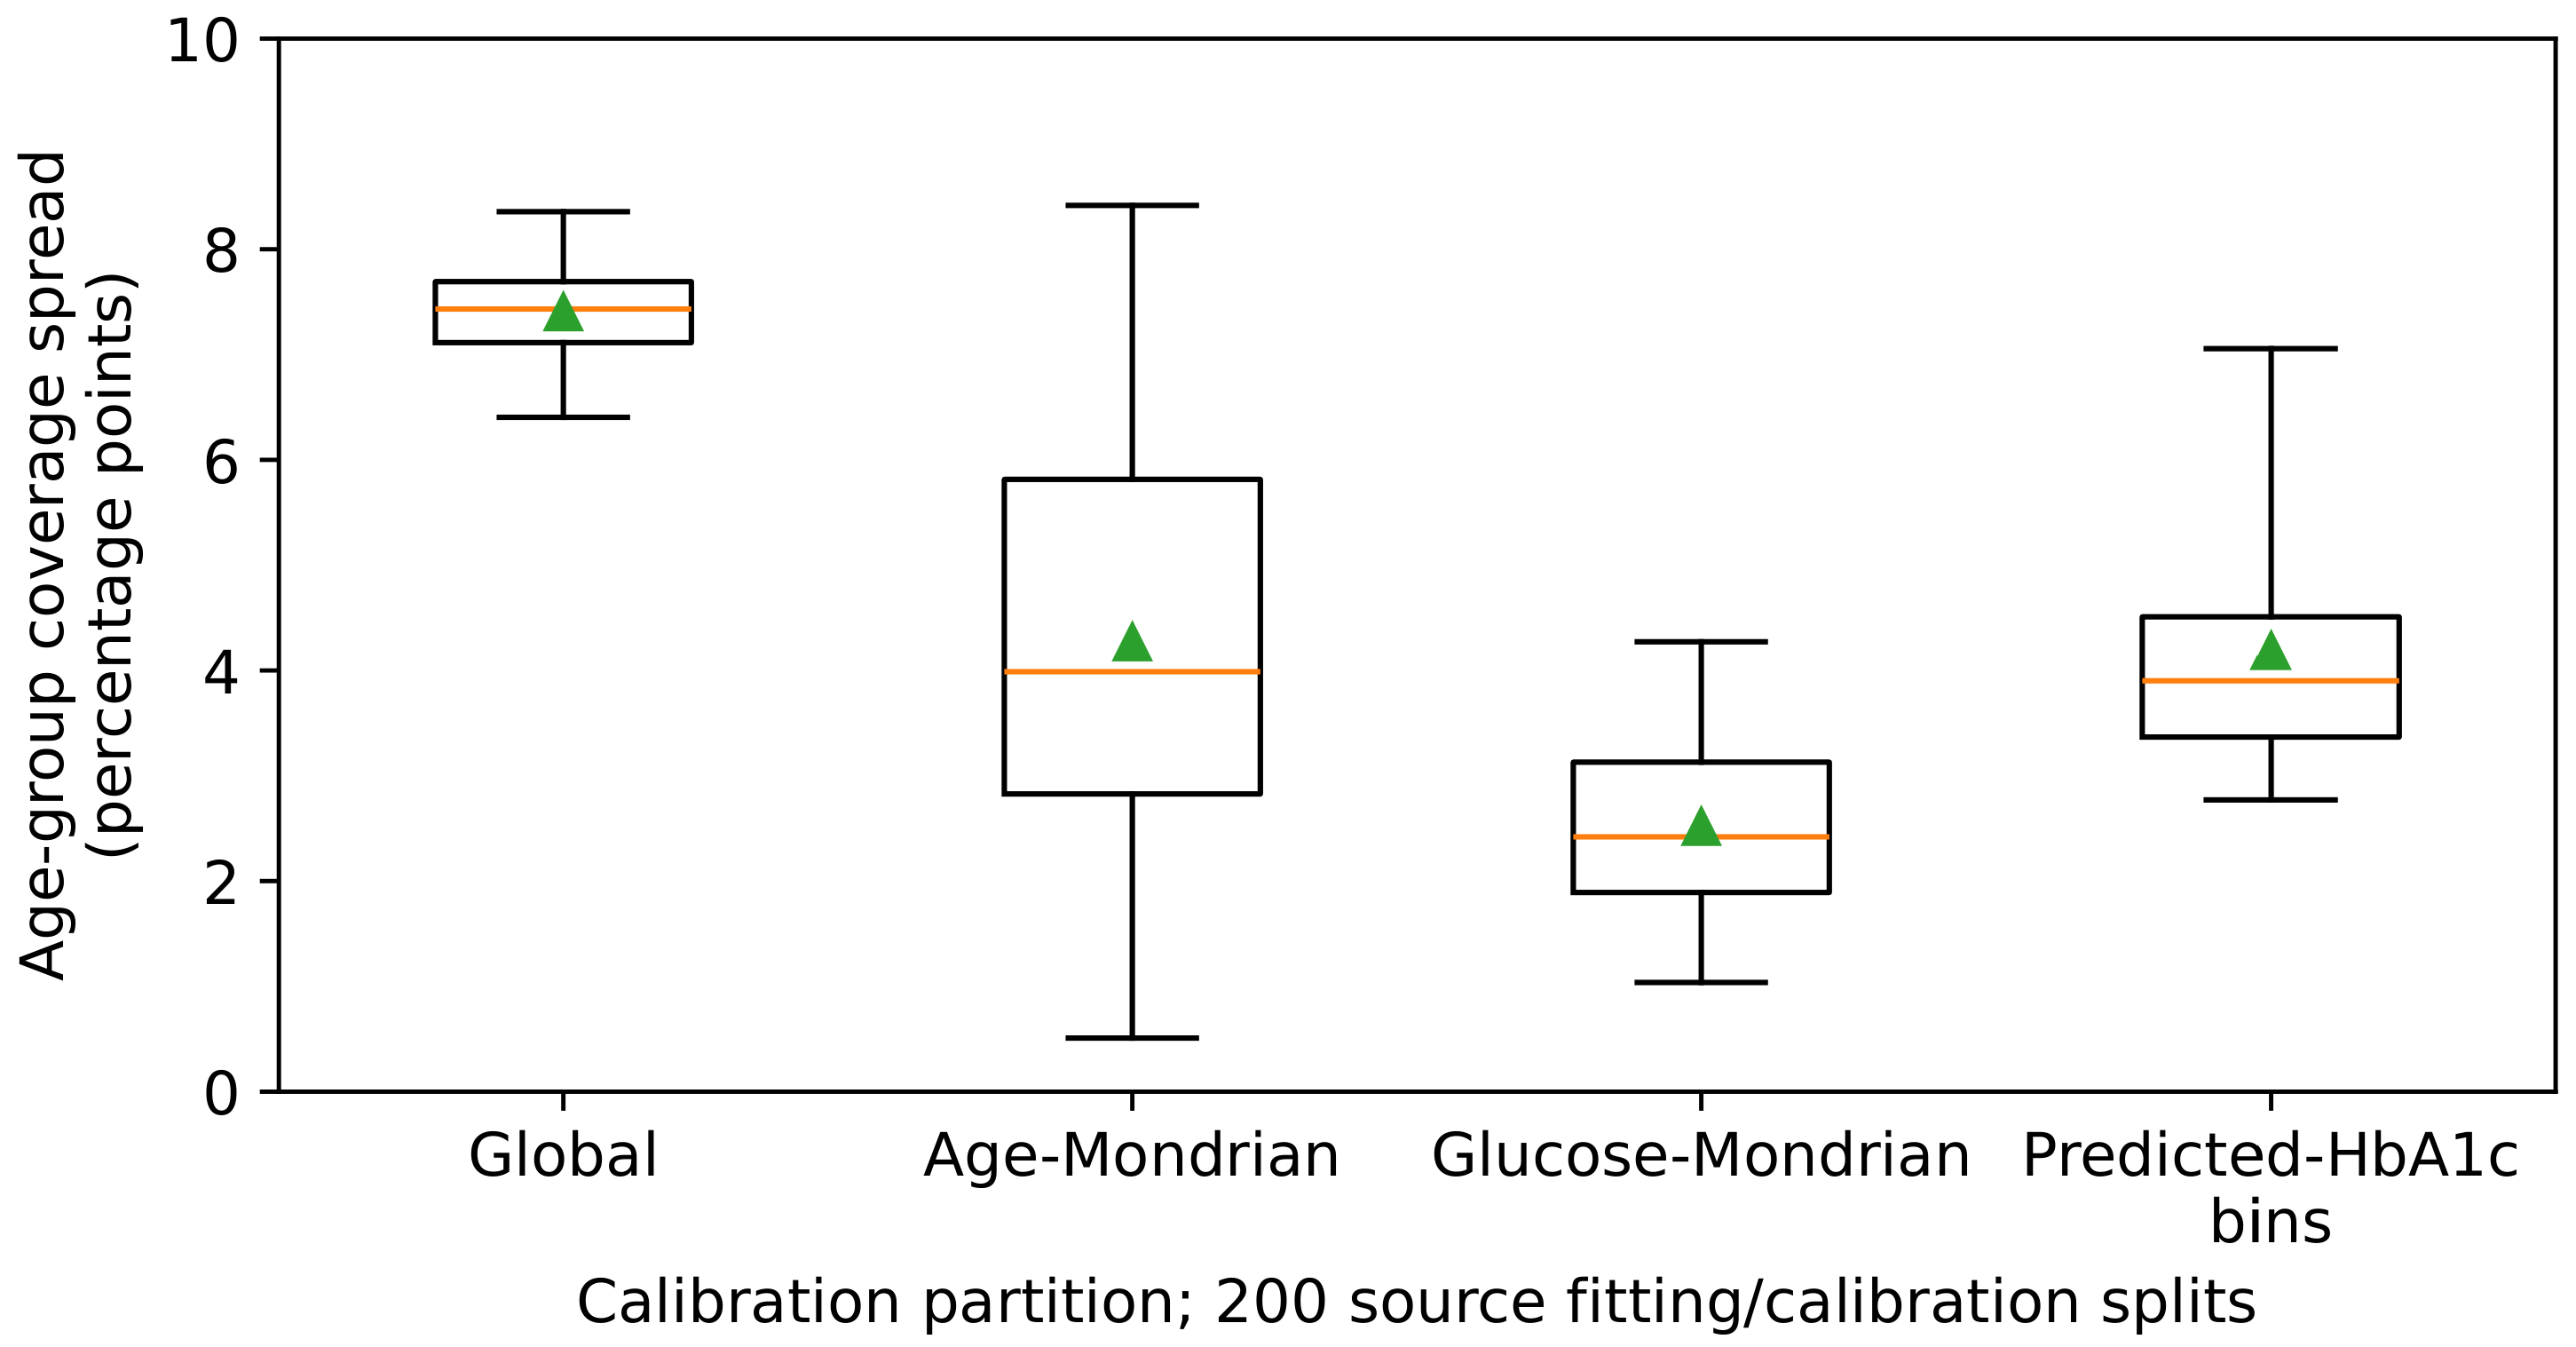
Forward age-coverage spread under four calibration schemes across 200 common source fitting/calibration allocations. Boxes show the interquartile range, lines the median, triangles the mean, and whiskers the empirical 2.5th–97.5th percentiles. These distributions are source-split sensitivities, not population confidence intervals.
Table 3.
Forward 90% residual calibration across 200 source fitting/calibration splits. Width is in HbA1c percentage points; pp denotes coverage percentage points. Percentiles describe split variability. Lower interval score is better.
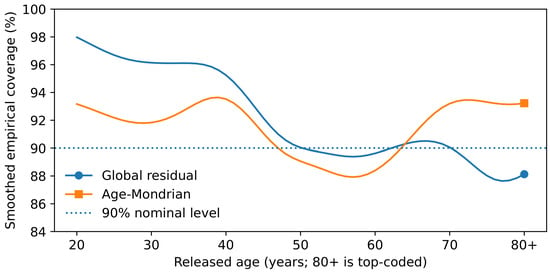
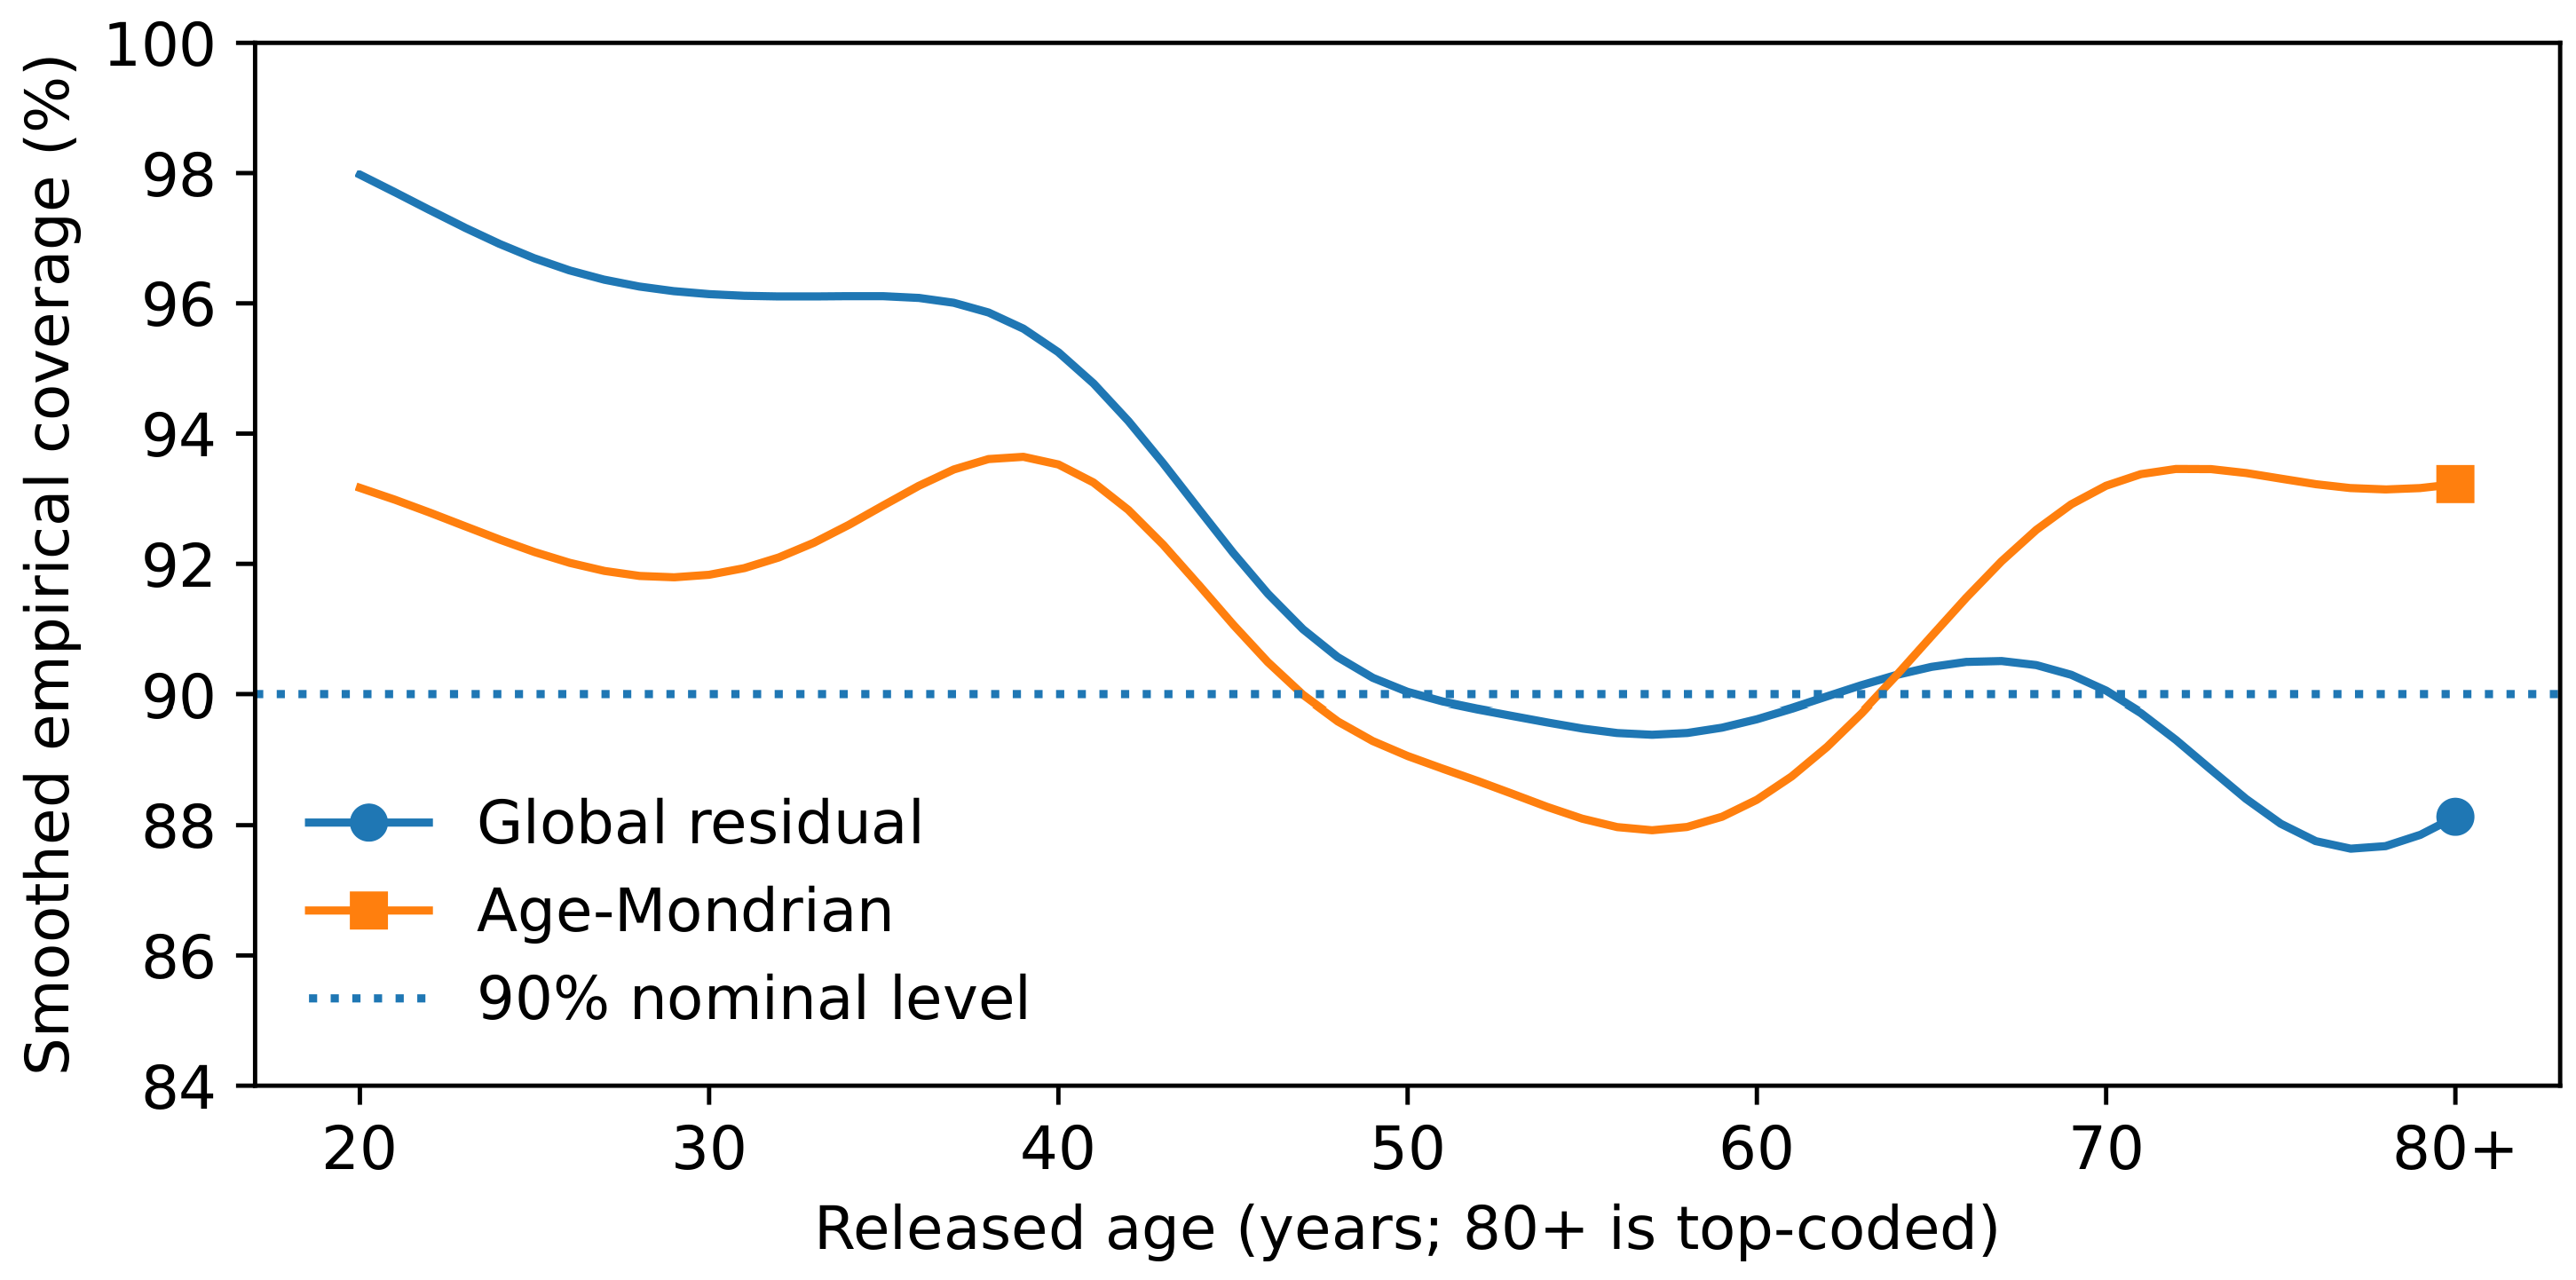
Figure 5 then shows the descriptive continuous-age pattern.
Figure 5.
Descriptive fixed-forward coverage by released age. Curves use a Gaussian smoother with four-year bandwidth. The 80+ point is top-coded; no ages above 80 are inferred. This descriptive display is not a guarantee of pointwise conditional coverage. Effective local sample sizes are included in the aggregate data.
Across 200 common source splits, mean forward age-coverage spread was 7.40 percentage points globally vs. 4.27 with age-Mondrian calibration. Their empirical split percentiles were 6.40–8.36 and 0.51–8.42, respectively (Table 3).
Glucose-Mondrian gave a smaller mean age spread of 2.51 points; predicted-HbA1c bins gave 4.18. Alternative age boundaries (20–44/45–64/65+) gave 3.87 points. Table 3 also reports minimum coverage, width, and interval score.
These sensitivity comparisons indicate partition dependence, not a universally preferred calibration variable.
3.4. Survey-Aware Temporal Estimates Preserve Subgroup Uncertainty
Forward weighted global coverage was 0.9686/0.9115/0.8962 across age groups, vs. 0.9239/0.8978/0.9328 with age-Mondrian (Table 4). Design-based uncertainty does not confer a survey-population conformal guarantee.
Table 4.
Fixed forward 90% coverage. Participant-bootstrap intervals condition on the frozen model and intervals. Survey-weighted coverage and Taylor SE use the NHANES design; the two uncertainty calculations are not interchangeable.
The forward weighted calibration-in-the-large (CITL) was −0.0122 (standard error (SE) 0.0154; t-based 95% interval −0.0450 to +0.0206); the backward value was −0.0381 (SE 0.0223; interval −0.0856 to +0.0093). This is materially more cautious than interpreting an independent and identically distributed (i.i.d.) interval as a population-oriented calibration statement.
Backward weighted coverage was 0.9560/0.9083/0.8776 globally and 0.9175/0.8944/ 0.9375 with age-Mondrian. Supplement Table S11 reports both cycles’ domain intervals; Supplementary Technical Section A retains the original unweighted backward results. Both temporal evaluations use separate NHANES cycles and therefore represent same-program temporal transport rather than validation in an independent clinical system.
3.5. Case Mix and Temporal RMSE
Frozen pooled-OLS RMSE was 0.6580 backward and 0.5677 forward. Observed HbA1c standard deviation (SD) also differed (approximately 1.2723 vs. 1.0587). Forward error was concentrated in the ≥6.5% category, which was less prevalent than in the source cohort. Reweighting category-specific squared errors to source proportions increased forward RMSE to 0.5988 (Table 5).
Table 5.
Forward case-mix sensitivity for the frozen pooled OLS. Categories use observed HbA1c only for descriptive evaluation, not to select prediction intervals. Standardization combines category-specific squared errors before taking a square root.
This descriptive standardization illustrates composition dependence, not a causal explanation of the model-ranking reversal.
Pooled LightGBM outperformed OLS in forward evaluation despite worse source OOF performance. Source OOF models used smaller training sets than the 1775-row frozen models; these comparisons are not training-size matched.
For the frozen OLS, using raw instead of bridged later-cycle TG changed RMSE only from 0.567696 to 0.567702 and changed any individual prediction by at most 0.000813 HbA1c percentage points. Reaggregation of the recovered historical LightGBM predictions gave pooled RMSE 0.544154 with bridged TG and 0.546519 with raw TG. Thus, the ordering relative to pooled OLS persisted under both inputs, although the maximum individual LightGBM prediction change was 0.675551 points. This is a stored-prediction check, not a refit of the historical model, and does not identify the cause of the ranking reversal.
3.6. Adding Sex and Race/Ethnicity Improves Point Error Modestly but Does Not Remove Global Age-Coverage Imbalance
Adding sex/race-ethnicity indicators reduced mean forward RMSE from 0.5679 to 0.5597 across identical source splits. However, global age-coverage spread remained 7.43 percentage points. These measured covariates improved point error modestly without removing the imbalance; no causal demographic interpretation follows.
4. Discussion
4.1. Separate Age-Group Point Models Do Not Show a Stable Prediction Benefit
The relevant comparison is separate vs. pooled fitting, not age vs. no age. Both the original contrast and refitting sensitivities showed no demonstrated benefit from hard-age OLS under this restricted protocol. Neither an interval containing zero nor a small mean difference establishes equivalence or a clinically acceptable margin.
4.2. A Smaller Subgroup Spread Is Not the Same as Reliable Subgroup Prediction
Age-Mondrian redistributed coverage rather than uniformly improving it. In the original forward split, spread decreased without better minimum coverage, and its bootstrap change interval included zero. This distinction prevents a balance statistic from being mistaken for protection of the least-covered group.
Coverage in each group, minimum coverage, spread, width, and interval score should be interpreted together; optimizing one does not necessarily improve the others.
4.3. Age Is One Candidate Partition, Not a Uniquely Validated Partition
The main extension is partition sensitivity. Glucose-Mondrian reduced forward age spread more than age-Mondrian across the retained splits, so age was not uniquely advantageous. The observed age-related heterogeneity may partly reflect variation associated with glycemic level or predicted HbA1c, although these comparisons do not identify its cause.
CQR further illustrates how covariate-dependent widths can alter subgroup coverage. CQR remains a secondary analysis, and the additional partition comparisons cannot establish a universally optimal method or partition.
4.4. Temporal RMSE Is Partly a Case-Mix Quantity
Target RMSE depends on outcome composition and evaluation design. Glycemic-category standardization raised forward OLS error, while the OLS/LightGBM comparison also involved different source-training sizes. Lower target RMSE therefore does not independently establish improved transport or algorithmic superiority.
Documented assay and sampling changes provide additional context, not identified causes of the ranking reversal [29,30,31,32,33].
4.5. Survey Design and Clinical Interpretation
Survey-weighted domain estimates and unweighted sample performance answer different questions. Neither the Taylor sensitivity nor masked-PSU source splitting establishes household independence, population conformal validity, or absence of every dependence mechanism.
No imputation or laboratory-error-detection workflow was tested. Because fasting glucose and HbA1c were measured at the same examination, clinical usefulness remains unestablished. As a hypothetical illustration, a symmetric interval centered at 6.0% with the mean internal older-group width of 1.929 HbA1c percentage points spans approximately 5.04–6.96%. This average-width illustration is not a patient-specific interval and does not establish clinical decision usefulness.
4.6. Future Work
Future work could examine whether explicit representation of measurement uncertainty in laboratory predictors provides information beyond residual conformal calibration. One possible direction is to represent uncertain laboratory inputs using prespecified fuzzy sets, propagate that uncertainty through a fixed prediction model, and calibrate residual predictive uncertainty on a separate calibration sample. Previous work on fully fuzzy data modeling and trapezoidal fully fuzzy systems provides mathematical precedent for representing imprecise numerical quantities [37,38]. Related methodological studies on coupled and generalized trapezoidal fully fuzzy matrix systems further illustrate structured approaches for representing and propagating fuzzy numerical uncertainty [39,40]. These mathematical formulations do not establish clinical validity; rather, they motivate a prospective comparison of fuzzy predictor uncertainty with residual conformal calibration. Any such framework should be specified before outcome evaluation and tested in an independent clinical cohort outside NHANES, with particular attention to whether it improves interval informativeness or subgroup performance without simply widening prediction intervals.
5. Limitations
Both targets are NHANES samples, not independent clinical systems. The added demographics do not address medications, renal function, or hematological determinants. Bootstrap intervals omit refitting uncertainty; split distributions remain cohort-conditional. The 200-split partition comparison and paired coverage bootstrap are forward-only. Masked PSUs do not identify households. Historical LightGBM comparisons use stored predictions, not fitted-model replays; original CQR fitted objects are unavailable.
6. Conclusions
Hard age-group partitioning showed no demonstrated point-prediction benefit under the evaluated protocol. Subgroup calibration changed coverage balance, but its apparent advantage depended on partition choice and source split. Glucose-Mondrian reduced mean age spread more than age-Mondrian across the 200 source splits, without establishing a universally preferred partition. Lower spread did not necessarily improve minimum coverage. Same-program transport assessments should therefore report coverage, minimum coverage, width, interval score, and split stability together; these results do not establish clinical utility.
Supplementary Materials
The following supporting information can be downloaded at https://www.mdpi.com/article/10.3390/bioengineering13111373/s1. The separate Supplementary Materials PDF contains Sections S1–S19 and Supplementary Technical Section A. Supplementary Table captions: Table S1. Source reconstruction and cohort-closure checks; Table S2. Analysis status and chronology. A recorded protocol date is provenance evidence, not independent proof of absence of earlier data inspection; Table S3. Original repeated-OOF point-prediction RMSE. The hard-age OLS contrast is +0.004169, with conditional participant-bootstrap interval [−0.002639, +0.012260]; Table S4. Source refitting sensitivity across 200 partitions. Percentiles are empirical split-distribution summaries, not population confidence intervals; Table S5. Masked-PSU grouped source sensitivity. All 200 retained runs were valid; masked PSUs are not household identifiers; Table S6. Original internal 90% residual intervals. Width is in HbA1c percentage points; Table S7. Forward 90% residual calibration across 200 common source splits. Spread values are percentage points (pp); mean width and interval score are expressed on the HbA1c scale; Table S7a. Age-group-specific forward 90% coverage across the 200 common source splits. Values are mean coverage with empirical 2.5th–97.5th split percentiles; Table S8. Alternative age cutoffs 20–44/45–64/65+, evaluated using the original age reporting groups; Table S9. Added sex/race-ethnicity sensitivity on the same 200 source allocations; Table S10. Fixed-forward participant-bootstrap results. Changes are age-Mondrian minus global. Coverage and changes are proportions; multiply changes by 100 for percentage points; Table S11. Survey-weighted 90% age coverage in both temporal cohorts. Intervals use the t distribution with 15 design degrees of freedom and Taylor-linearized domain standard errors. Original forward normal-approximate intervals are preserved in the separate data file, not relabelled as t intervals; Table S12. Forward case-mix sensitivity. Overall RMSE is 0.567696; source-composition standardized RMSE is 0.598805; Table S13. Recovered paired historical predictions under raw and bridged later-cycle TG. These are reaggregated stored-output results, not newly refitted historical models; Table S14. Recomputed linear point-calibration diagnostics from the frozen temporal predictions. CITL is observed minus predicted and differs from the free regression intercept; Table A1. SEQN/provenance certificate summary; Table A2. Exact final source-frozen pooled OLS and residual-conformal certificate used in both temporal evaluations; Table A3a. Recovered original temporal CQR specification. The finite-sample conformity score and interval construction are defined below; no target refitting or recalibration is used; Table A3b. Separate post hoc fixed-configuration exploratory CQR sensitivity. These model objects and hashes correspond only to the post hoc exploratory analysis; Table A4. Repeated out-of-fold point-model performance and participant-bootstrap contrasts; Table A5. Primary internal empirical 90% coverage and width by age; Table A6. Primary internal interval-score and age-spread summary; Table A7a. Original secondary 90% CQR results recomputed from archived interval outputs. All values were recomputed from archived intervals without refitting; Table A7b. Post hoc exploratory CQR sensitivity. These are distinct from the original secondary results in Table A7a; Table A8. Forward temporal point and continuous-calibration diagnostics. Calibration diagnostics are descriptive and do not update the frozen model; Table A9. Forward 2021–2023 primary 90% empirical coverage; Table A10. Backward temporal point and continuous-calibration metrics; Table A11. Backward source-calibrated conformal coverage. Age spreads were calculated from full-precision coverage values before rounding. The 95% subgroup values are reproduced from the archived frozen-prediction table using the source-frozen calibration quantiles; Table A12. NHANES assay/source ledger. The accompanying machine-readable CSV contains the complete source URLs and analysis-input SHA-256 values; Table A13. Model-ranking reversal in the later cycle. The target cycle was never used for model fitting or tuning; Table A14. Descriptive precision summary under sample-level approximations. The residual-variance-ratio definition is explicit; a complete Archer planning calculation and population-design inference are not claimed; Table A15. Legacy ANFIS context on the historical N = 2325 table. The original and corrected-evaluation rule counts are not directly comparable as biological complexity measures; Table A15a. One parameter-complete archived premise. Its local consequent is . This is one local rule, not the complete model prediction. Full-precision coefficients for all 41 rules and original FIS files are retained in verification materials held by the authors; Table A15b. Historical adaptive-network-based fuzzy inference system (ANFIS) settings recovered from the archived MATLAB (R2026b (v26.2)) workflow; Table A15c. Continuity of the earlier unpublished ANFIS analysis under the corrected reliability study; Table A16. Concise TRIPOD+AI-oriented reporting map. Wording is a study-specific paraphrase rather than a reproduction of the guideline checklist; Table A17. PROBAST+AI-oriented self-assessment used to bound claims; this is not an independent risk-of-bias assessment; Table A18. Claim-to-evidence map. Supplementary Figure legends: Figure A1. Forward 2021–2023 observed vs. predicted HbA1c summarized by frozen-prediction decile. The smooth full-range calibration curve is shown in Supplementary Figure A10; this grouped plot is retained as a secondary descriptive view; Figure A2. Backward 2015–2016 frozen-model calibration by prediction decile. The smooth full-range calibration curve is shown in Supplementary Figure A10; Figure A3. Backward 2015–2016 90% empirical coverage by age under global and age-Mondrian source calibration; Figure A4. Sample-level and fasting-weighted RMSE for the frozen pooled OLS under backward and forward temporal transport. Weighting changes the estimand; it does not create a population conformal guarantee; Figure A5. Fasting glucose and measured HbA1c in the corrected source cohort, shown by age. Points are observations; no clinical response function or causal relation is inferred; Figure A6. Pooled-OLS out-of-fold predictions in the first predefined repeat. Each of the 2219 participants appears once. The identity line is a reference, not a fitted calibration curve. All reported primary model comparisons still use five repeats; Figure A7. Historical 40–64 training and overlapping-checking traces, regenerated from stored MATLAB arrays. All 204 checking observations were also in the 1020-row training set. The saved first-output FIS corresponds to minimum training error, reached at epoch 999; Figure A8. Initial and trained age membership functions for rule 2 of the historical young-adult FIS. Functions are regenerated from the original FIS files; this selected example is a structural illustration, not an uncertainty interval or evidence of age-specific biological mechanisms; Figure A9. Declared historical-FIS age–TG response slice at BMI = 45.15 kg/m2 and fasting glucose = 249 mg/dL. The full computed output range is retained without clipping. The plot describes a fixed model on a rectangular grid, not a causal physiological surface, a representative patient, or an independent performance test; Figure A10. Retained full-range smooth calibration curves for frozen pooled OLS in the two NHANES temporal cohorts. These descriptive curves do not update the frozen model. Aggregate outputs and verification scripts are supplied separately. Supplementary-only source documentation and ANFIS/software references are also included in the main reference list [41,42,43,44,45,46].
Author Contributions
Conceptualization, H.A. and G.M.; methodology, H.A., G.M., A.A.E. and A.I.; software, H.A. and A.A.E.; validation, G.M., A.A. and R.M.; formal analysis, H.A. and A.A.E.; investigation, H.A., A.I. and A.A.; data curation, H.A. and R.M.; visualization, H.A. and M.A. (Mohanad Alata); writing—original draft preparation, H.A. and G.M.; writing—review and editing, G.M., A.A.E., A.I., A.A., R.M., M.A. (Mohanad Alata) and M.A. (Mohammad AlWedian); supervision, G.M.; project administration, H.A. and G.M. All authors have read and agreed to the published version of the manuscript.
Funding
This research received no external research funding. The article processing charge (APC), if applicable, will be covered by the Higher Colleges of Technology (HCT), United Arab Emirates. No grant number applies.
Institutional Review Board Statement
Not applicable. NHANES public-use files are de-identified and publicly released by the U.S. National Center for Health Statistics. This secondary analysis used only public-use data and did not involve contact with participants or access to restricted identifiers.
Informed Consent Statement
Not applicable.
Data Availability Statement
All analyses use publicly available NHANES data. Public-safe aggregate outputs, source-reconstruction certificates, retained analysis code, and verification scripts are available at https://github.com/shaikhamalkawi-ux/HbA1c-Age-Aware-Reliability-NHANES (accessed on 14 October 2026). The deposited materials support audit of the reported aggregate revision results; they do not constitute an end-to-end rerun of all 200-split revision experiments. Raw participant-level analytic tables and predictions are not redistributed.
Acknowledgments
The authors acknowledge the Higher Colleges of Technology (HCT), United Arab Emirates, for institutional support.
Conflicts of Interest
The authors declare no conflicts of interest.
References
- American Diabetes Association Professional Practice Committee for Diabetes. 2. Diagnosis and Classification of Diabetes: Standards of Care in Diabetes—2026. Diabetes Care 2026, 49, S27–S49. [Google Scholar] [CrossRef] [Scilit] [PubMed]
- Stedman, M.; Heald, A.H.; Holland, D.; Halsall, I.; Green, L.; Wu, P.; Patel, K.; Scargill, J.; Gibson, M.; Hanna, F.W.F.; et al. The Impact of Age and Sex on Fasting Plasma Glucose and Glycated Haemoglobin (HbA1c) in the Non-diabetes Population. Diabetes Ther. 2025, 16, 257–267. [Google Scholar] [CrossRef] [Scilit] [PubMed]
- Ezz, M.; Alrowaily, M.A.; Alshammeri, M.; Tantawy, A.A.; Allahim, A.; Mostafa, A.M. Machine Learning Framework for HbA1c Prediction: Data Enrichment, Cost Optimization, and Interpretability Through Stratified Regression and Multi-Stage Feature Selection. Diagnostics 2026, 16, 607. [Google Scholar] [CrossRef] [Scilit] [PubMed]
- Karashima, S.; Nishida, H.; Ishikawa, Y.; Mizoguchi, R.; Hashimoto, A.; Sawamura, T.; Nomura, A.; Tada, H.; Furukawa, K.; Higashi, A.; et al. Development and validation of Age-Specific algorithms for diabetes prediction. Endocrine 2025, 90, 1253–1262. [Google Scholar] [CrossRef] [Scilit] [PubMed]
- Yata, V.K.; Jena, S.; Indracanti, M.; Chitta, S.; Kolliputi, N. Adversarial debiasing for age-equitable diabetes prediction: Performance–fairness trade-offs and partition dependency in machine learning. Front. Digit. Health 2026, 8, 1816806. [Google Scholar] [CrossRef] [Scilit] [PubMed]
- Kapoor, S.; Narayanan, A. Leakage and the reproducibility crisis in machine-learning-based science. Patterns 2023, 4, 100804. [Google Scholar] [CrossRef] [Scilit] [PubMed]
- Bernett, J.; Blumenthal, D.B.; Grimm, D.G.; Haselbeck, F.; Joeres, R.; Kalinina, O.V.; List, M. Guiding questions to avoid data leakage in biological machine learning applications. Nat. Methods 2024, 21, 1444–1453. [Google Scholar] [CrossRef] [Scilit] [PubMed]
- Collins, G.S.; Dhiman, P.; Ma, J.; Schlussel, M.M.; Archer, L.; Van Calster, B.; Harrell, F.E.; Martin, G.P.; Moons, K.G.M.; van Smeden, M.; et al. Evaluation of clinical prediction models (part 1): From development to external validation. BMJ 2024, 384, e074819. [Google Scholar] [CrossRef] [Scilit] [PubMed]
- Riley, R.D.; Archer, L.; Snell, K.I.E.; Ensor, J.; Dhiman, P.; Martin, G.P.; Bonnett, L.J.; Collins, G.S. Evaluation of clinical prediction models (part 2): How to undertake an external validation study. BMJ 2024, 384, e074820. [Google Scholar] [CrossRef] [Scilit] [PubMed]
- Archer, L.; Snell, K.I.E.; Ensor, J.; Hudda, M.T.; Collins, G.S.; Riley, R.D. Minimum sample size for external validation of a clinical prediction model with a continuous outcome. Stat. Med. 2021, 40, 133–146. [Google Scholar] [CrossRef] [Scilit] [PubMed]
- Van Calster, B.; McLernon, D.J.; van Smeden, M.; Wynants, L.; Steyerberg, E.W. Calibration: The Achilles heel of predictive analytics. BMC Med. 2019, 17, 230. [Google Scholar] [CrossRef] [Scilit] [PubMed]
- Collins, G.S.; Moons, K.G.M.; Dhiman, P.; Riley, R.D.; Beam, A.L.; Van Calster, B.; Ghassemi, M.; Liu, X.; Reitsma, J.B.; van Smeden, M.; et al. TRIPOD+AI statement: Updated guidance for reporting clinical prediction models that use regression or machine learning methods. BMJ 2024, 385, e078378. [Google Scholar] [CrossRef] [Scilit] [PubMed]
- Moons, K.G.M.; Damen, J.A.A.; Kaul, T.; Hooft, L.; Andaur Navarro, C.; Dhiman, P.; Beam, A.L.; Van Calster, B.; Celi, L.A.; Denaxas, S.; et al. PROBAST+AI: An updated quality, risk of bias, and applicability assessment tool for prediction models using regression or artificial intelligence methods. BMJ 2025, 388, e082505. [Google Scholar] [CrossRef] [Scilit] [PubMed]
- Lei, J.; G’Sell, M.; Rinaldo, A.; Tibshirani, R.J.; Wasserman, L. Distribution-Free Predictive Inference for Regression. J. Am. Stat. Assoc. 2018, 113, 1094–1111. [Google Scholar] [CrossRef] [Scilit]
- Angelopoulos, A.N.; Bates, S. Conformal Prediction: A Gentle Introduction. Found. Trends Mach. Learn. 2023, 16, 494–591. [Google Scholar] [CrossRef] [Scilit]
- Barber, R.F.; Candès, E.J.; Ramdas, A.; Tibshirani, R.J. Conformal prediction beyond exchangeability. Ann. Stat. 2023, 51, 816–845. [Google Scholar] [CrossRef] [Scilit]
- Gibbs, I.; Cherian, J.J.; Candès, E.J. Conformal prediction with conditional guarantees. J. R. Stat. Soc. Ser. B Stat. Methodol. 2025, 87, 1100–1126. [Google Scholar] [CrossRef] [Scilit]
- Kladny, K.R.; Schölkopf, B.; Koch, L.; Baumgartner, C.F.; Muehlebach, M. A critical perspective on finite sample conformal prediction theory in medical applications. Artif. Intell. Med. 2026, 180, 103462. [Google Scholar] [CrossRef] [Scilit] [PubMed]
- Matabuena, M.; Vidal, J.C.; Ghosal, R.; Onnela, J.P. Screening for diabetes mellitus in the US population using neural network-based modeling and complex survey designs. Stat. Methods Med. Res. 2026, 35, 1257–1280. [Google Scholar] [CrossRef] [Scilit] [PubMed]
- Oh, Y.K.; Zheng, H.W.; Feng, J.; Bui, A.A.T. Survey-Aware Machine Learning: A Guideline for Valid Population Health Inference based on Scoping Review. Proc. Mach. Learn. Res. 2026, 333, 198–220. Available online: https://proceedings.mlr.press/v333/oh26a.html (accessed on 14 October 2026).
- Kim, H.; Rogers, P.; Wang, D. Machine learning models for chronic disease risks using complex survey data: The impact of sample weights. Front. Digit. Health 2026, 8, 1834715. [Google Scholar] [CrossRef] [Scilit] [PubMed]
- Lee, C.; Jung, S.; Hong, H.G. Predicting Current Outcomes From Historical Survey Data with Weighted Conformal Prediction. arXiv 2026, arXiv:2606.10563. [Google Scholar] [CrossRef] [Scilit]
- Wieczorek, J. Design-based Conformal Prediction. Surv. Methodol. 2023, 49, 443–473. [Google Scholar]
- Wieczorek, J.; Guerin, C.; McMahon, T. K-fold cross-validation for complex sample surveys. Stat. 2022, 11, e454. [Google Scholar] [CrossRef] [Scilit]
- National Center for Health Statistics. NHANES 2017–2018 Data Documentation, Codebook, and Frequencies: Plasma Fasting Glucose (GLU_J). Centers for Disease Control and Prevention. First Published August 2020. Available online: https://wwwn.cdc.gov/Nchs/Data/Nhanes/Public/2017/DataFiles/GLU_J.htm (accessed on 13 September 2026).
- National Center for Health Statistics. NHANES 2017–2018 Data Documentation, Codebook, and Frequencies: Cholesterol—Low-Density Lipoprotein (LDL) & Triglycerides (TRIGLY_J). Centers for Disease Control and Prevention. First Published December 2020; Revised March 2021. Available online: https://wwwn.cdc.gov/Nchs/Data/Nhanes/Public/2017/DataFiles/TRIGLY_J.htm (accessed on 13 September 2026).
- National Center for Health Statistics. NHANES 2017–2018 Data Documentation, Codebook, and Frequencies: Demographic Variables and Sample Weights (DEMO_J). Centers for Disease Control and Prevention. First Published February 2020. Available online: https://wwwn.cdc.gov/Nchs/Data/Nhanes/Public/2017/DataFiles/DEMO_J.htm (accessed on 13 September 2026).
- National Center for Health Statistics. Guidelines for High Quality Analyses of NHANES Data. Centers for Disease Control and Prevention. First Published 26 January 2026. Available online: https://wwwn.cdc.gov/nchs/nhanes/QualityAnalysesGuidelines.aspx (accessed on 13 September 2026).
- National Center for Health Statistics. NHANES 2015–2016 Data Documentation, Codebook, and Frequencies: Plasma Fasting Glucose (GLU_I). Centers for Disease Control and Prevention. Available online: https://wwwn.cdc.gov/Nchs/Data/Nhanes/Public/2015/DataFiles/GLU_I.htm (accessed on 13 September 2026).
- National Center for Health Statistics. NHANES August 2021–August 2023 Data Documentation, Codebook, and Frequencies: Plasma Fasting Glucose (GLU_L). Centers for Disease Control and Prevention. First Published September 2024. Available online: https://wwwn.cdc.gov/Nchs/Data/Nhanes/Public/2021/DataFiles/GLU_L.htm (accessed on 2 October 2026).
- National Center for Health Statistics. NHANES August 2021–August 2023 Data Documentation, Codebook, and Frequencies: Cholesterol—Low-Density Lipoproteins (LDL) & Triglycerides (TRIGLY_L). Centers for Disease Control and Prevention. First Published September 2025. Available online: https://wwwn.cdc.gov/Nchs/Data/Nhanes/Public/2021/DataFiles/TRIGLY_L.htm (accessed on 13 September 2026).
- National Center for Health Statistics. NHANES August 2021–August 2023 Data Documentation, Codebook, and Frequencies: Glycohemoglobin (GHB_L). Centers for Disease Control and Prevention. First Published September 2024. Available online: https://wwwn.cdc.gov/Nchs/Data/Nhanes/Public/2021/DataFiles/GHB_L.htm (accessed on 2 October 2026).
- National Center for Health Statistics. Brief Overview of Sample Design, Nonresponse Bias Assessment, and Analytic Guidelines for NHANES August 2021–August 2023. Centers for Disease Control and Prevention. Published 20 September 2024. Available online: https://wwwn.cdc.gov/nchs/nhanes/continuousnhanes/overviewbrief.aspx?Cycle=2021-2023 (accessed on 2 October 2026).
- Ke, G.; Meng, Q.; Finley, T.; Wang, T.; Chen, W.; Ma, W.; Ye, Q.; Liu, T.Y. LightGBM: A Highly Efficient Gradient Boosting Decision Tree. Adv. Neural Inf. Process. Syst. 2017, 30, 3146–3154. Available online: https://proceedings.neurips.cc/paper_files/paper/2017/hash/6449f44a102fde848669bdd9eb6b76fa-Abstract.html (accessed on 14 October 2026).
- Bates, S.; Hastie, T.; Tibshirani, R. Cross-Validation: What Does It Estimate and How Well Does It Do It? J. Am. Stat. Assoc. 2024, 119, 1434–1445. [Google Scholar] [CrossRef] [Scilit] [PubMed]
- Romano, Y.; Patterson, E.; Candès, E.J. Conformalized Quantile Regression. Adv. Neural Inf. Process. Syst. 2019, 32, 3543–3553. Available online: https://proceedings.neurips.cc/paper/2019/hash/5103c3584b063c431bd1268e9b5e76fb-Abstract.html (accessed on 14 October 2026).
- Alazzam, A.; Malkawi, G.; Elsayed, A.A.A.; Omari, A.; Badreddine, S. Optimizing Fully Fuzzy Linear Systems Using the Average Uniform Algorithm: A Fuzzy Data Modeling Approach. IEEE Access. 2026, 14, 21659–21673. [Google Scholar] [CrossRef] [Scilit]
- Elsayed, A.A.A.; Ahmad, N.; Malkawi, G. Trapezoidal Fully Fuzzy Sylvester Matrix Equation with Arbitrary Coefficients. Soft Comput. 2024, 28, 6953–6967. [Google Scholar] [CrossRef] [Scilit]
- Elsayed, A.A.A.; Ahmad, N.; Malkawi, G. Numerical Solutions for Coupled Trapezoidal Fully Fuzzy Sylvester Matrix Equations. Adv. Fuzzy Syst. 2022, 2022, 8926038. [Google Scholar] [CrossRef] [Scilit]
- Elsayed, A.A.A.; Ahmad, N.; Malkawi, G. Arbitrary Generalized Trapezoidal Fully Fuzzy Sylvester Matrix Equation. Int. J. Fuzzy Syst. Appl. 2022, 11, 1–22. [Google Scholar] [CrossRef] [Scilit]
- National Center for Health Statistics. NHANES 2015–2016 Data Documentation, Codebook, and Frequencies: Cholesterol - Low-Density Lipoprotein (LDL) & Triglycerides (TRIGLY_I). Centers for Disease Control and Prevention. Available online: https://wwwn.cdc.gov/Nchs/Data/Nhanes/Public/2015/DataFiles/TRIGLY_I.htm (accessed on 13 September 2026).
- Jang, J.S.R. ANFIS: Adaptive-network-based fuzzy inference system. IEEE Trans. Syst. Man. Cybern. 1993, 23, 665–685. [Google Scholar] [CrossRef] [Scilit]
- Chiu, S.L. Fuzzy model identification based on cluster estimation. J. Intell. Fuzzy Syst. 1994, 2, 267–278. [Google Scholar] [CrossRef] [Scilit]
- MathWorks. anfis: Output Arguments, Trained Fuzzy Inference System. Available online: https://www.mathworks.com/help/fuzzy/anfis.html (accessed on 13 September 2026).
- MathWorks. subclust: Data Scaling for Subtractive Clustering. Available online: https://www.mathworks.com/help/fuzzy/subclust.html (accessed on 13 September 2026).
- MathWorks. gensurf: Reference Values for Non-Displayed Inputs. Available online: https://www.mathworks.com/help/fuzzy/gensurf.html (accessed on 13 September 2026).

Disclaimer/Publisher’s Note: The statements, opinions and data contained in all publications are solely those of the individual author(s) and contributor(s) and not of MDPI and/or the editor(s). MDPI and/or the editor(s) disclaim responsibility for any injury to people or property resulting from any ideas, methods, instructions or products referred to in the content. |
© 2026 by the authors. Licensee MDPI, Basel, Switzerland. This article is an open access article distributed under the terms and conditions of the Creative Commons Attribution (CC BY) license.