


Abstract
Caenorhabditis elegans is a premier model organism for aging and neurobiology research, valued for its short lifespan, optical transparency, genetic tractability, and well-mapped nervous system. Automated imaging without immobilization is an important goal because it reduces reliance on anesthesia, restraint, and repeated handling. High-magnification imaging of freely moving worms remains challenging. Increasing magnification narrows the field of view, leading to target loss, motion blur, and focal drift. Immobilization approaches can alter physiology, suppress natural behavior, and limit longitudinal observation. Here, we present a fully automated real-time tracking workflow for imaging individual worms in a microfluidic platform under controlled culture conditions. The system integrates deep-learning-based head detection, image-based autofocus, and rapid motorized-stage feedback to support high-magnification imaging of freely moving worms. Tracking and image acquisition use the same microscope and objective. The platform maintains individually housed worms in a microfluidic environment while preserving animal identity for repeated imaging over time. Built entirely from commercially available equipment and requiring no additional custom tracking hardware, the platform provides modular, user-configurable tracking parameters that can be adapted to specific experimental goals.
1. Introduction
C. elegans is a widely used model organism for studying development, metabolism, neurobiology, reproduction, and aging [1,2,3]. It is especially useful for aging research because of its short lifespan, observable age-associated phenotypes, genetic tractability, and optical transparency [2,3]. Its high reproductive output, small size, simple culture requirements, compatibility with high-throughput assays, and conservation of fundamental biological pathways further support its use in large-scale studies [1,2,3,4].
Despite these advantages, C. elegans assays often remain labor-intensive and time-consuming. They require trained researchers to perform repeated manual picking, monitoring, and scoring over several weeks [3,4,5]. Manual handling limits throughput and increases experimental variability and the potential for subjective error, which can reduce consistency and reproducibility [4,5]. These challenges become especially pronounced when microscopy is required over extended periods.
To address these challenges, several automated non-microfluidic imaging and tracking systems have been developed. CARIBN II enables high-resolution neuronal imaging in freely moving worms but was demonstrated for short-duration recordings on plates. It relies on fluorescence-based tracking and a dedicated optical configuration optimized for neuronal imaging rather than long-term automated culture and longitudinal phenotyping [6]. The Lifespan Machine provides exceptionally high-throughput lifespan analysis through automated flatbed scanning but is not designed for cellular-scale microscopy or real-time tracking [7]. WorMotel preserves individual identity throughout life, but its original lifespan assays used FUdR-mediated progeny suppression [8]. Because FUdR is not biologically neutral and can alter lifespan and stress-response pathways under some conditions, its use may introduce an additional experimental variable [9]. More recently, Wormspy enabled fluorescence tracking and neuronal and subcellular calcium measurements in freely moving C. elegans using a specialized dual-camera motorized tracking microscope [10]. These systems provide limited control over dynamic culture conditions. Different experimental conditions often require separate culture areas, increasing handling and limiting environmental control. The lack of fluidic control limits environmental manipulation, food delivery, and progeny removal [11,12,13,14]. These procedures often involve repeated transfers between plates, chemical treatments, and labor-intensive handling. Furthermore, consistently identifying and tracking the same animals over time can be challenging in population-based cultures [11,12]. Even among genetically and chronologically similar C. elegans, substantial variation in lifespan, physiological decline, and age-associated phenotypes highlights the need to preserve individual identity throughout longitudinal studies [8,15,16,17]. These limitations motivate platforms that combine individual animal culture, continuous environmental control, progeny removal without reproductive inhibitors, and automated high-resolution imaging of freely moving animals [11,12,13,14].
Microfluidic platforms address these needs through precise environmental control, long-term culture, controlled fluid exchange, and organized housing of individual worms or groups of worms [4,11,12,13,14,18,19]. WormFarm enabled controlled feeding, environmental manipulation, and automated progeny removal but maintained approximately 30–50 worms per chamber, limiting persistent identification of individual animals [12]. NemaLife supports whole-life microfluidic culture and progeny removal without reproductive inhibitors while housing multiple worms per arena. It was designed primarily for lifespan and healthspan measurements rather than real-time computer-vision tracking with active stage recentering [11]. WormSpa maintained individual worms in separate chambers under a constant low flow rate, enabling continuous monitoring of physiological responses such as immune-response gene expression and egg laying [18,19]. However, animal localization relied primarily on spatial confinement rather than active target tracking and stage-based motion compensation [18,19]. Other confinement geometries can also alter C. elegans locomotion and, under sufficiently restrictive conditions, induce stress-associated responses such as DAF-16 nuclear localization [20,21]. HeALTH enabled controlled monitoring of more than 1400 isolated worms throughout adulthood but was designed primarily for behavioral and lifespan phenotyping rather than cellular-scale microscopy [13]. Lifespan-on-a-chip enabled longitudinal imaging of individually housed worms using reversible microfluidic clamps but was limited to 16 chambers [14]. Saberi-Bosari et al., in contrast, achieved lifelong, drug-free high-resolution fluorescence imaging with temporary cooling-based immobilization during image acquisition [22]. Although these platforms improve environmental control and long-term culture, they may sacrifice individual identity, rely on confinement or temporary immobilization, or lack active high-magnification tracking.
Despite advances in controlled microfluidic culture, tracking freely moving C. elegans at high magnification remains challenging. Higher magnification narrows the field of view and increases the likelihood that the target will leave the imaging area as the worm moves. At 20× and 40× magnifications, the entire worm may not remain within the field of view. Lower magnifications increase the observable area and reduce target loss but may not reliably resolve individual neuronal somata, particularly within the densely packed head ganglia surrounding the nerve ring [23]. Reliable high-magnification imaging of freely moving worms therefore requires rapid target detection, real-time stage recentering, and assessment of motion stability to minimize target loss and motion blur. Previous studies have shown that specialized tracking systems can overcome some of these challenges. Faumont et al. developed real-time tracking of neuron-sized fluorescent targets in freely moving worms [23], whereas Nguyen et al. achieved cellular-resolution whole-brain calcium imaging using real-time three-dimensional head tracking [24]. However, these systems rely on specialized tracking architectures and were developed primarily for neural and behavioral recordings. They were not designed for integration with high-throughput microfluidic culture and automated longitudinal phenotyping [23,24].
As an alternative to tracking systems, researchers often immobilize worms during imaging to reduce target loss and motion blur. Common methods include chemical agents [25], temperature-based approaches [26,27], and physical stabilization using nanoparticles, microfluidic confinement, or hydrogels [28,29,30,31]. Although these methods improve image stability, they may introduce chemical, thermal, or mechanical perturbations that affect physiology or normal behavior [25,26,27,28,29,30,31]. The limitations of specialized tracking systems and immobilization methods highlight the need to combine automated control of the microfluidic culture environment with real-time, high-magnification tracking of freely moving worms. This integration would support high-throughput, long-term phenotyping without immobilization.
Here, we developed an automated microfluidic tracking workflow for non-invasive, high-magnification imaging of freely moving C. elegans under controlled culture conditions. Our workflow performs tracking and imaging using a commercially available inverted microscope, motorized stage, and camera. It requires no additional custom tracking hardware. The platform integrates a 384-chamber microfluidic chip for individually housed worms with automated fluid delivery. This configuration supports feeding, environmental control, progeny removal, and multiple experimental conditions within a single chip. The modular software framework allows user-defined adjustment of detection, recentering, autofocus, inactivity, and acquisition parameters, enabling adaptation to different experimental requirements. The platform supports imaging at 10×, 20×, and 40× magnifications, ranging from whole-animal observation to high-resolution imaging of fine anatomical features, including neurons. Deep-learning-based head detection and worm segmentation are combined with rapid motorized-stage feedback and image-based autofocus to maintain the target region within the field of view during movement. Image acquisition is triggered only after predefined motion-stability criteria are satisfied, reducing motion blur without chemical or physical immobilization. By integrating microfluidic culture, deep-learning-based tracking, and high-magnification imaging within a single workflow, this platform is designed to support longitudinal, high-resolution phenotyping of freely moving C. elegans without immobilization.
2. Materials and Methods
2.1. C. elegans Culture
Wild-type C. elegans N2 worms and the fluorescent reporter strain OH99, mgIs18[ttx-3p::GFP] IV, were obtained from the Caenorhabditis Genetics Center (CGC; University of Minnesota, Minneapolis, MN, USA). Additional strains used were CB88 [dpy-7(e88) X], CB128 [dpy-10(e128) II], and GR1719 [unc-119(ed3) III; mgSi3 IV]. CB88 and CB128 contributed training images, whereas GR1719 was used for the lower-magnification imaging example. These strains are listed in the CGC strain catalog. Age-synchronized populations were generated by isolating embryos from gravid adults using a standard bleaching protocol. Worms were maintained at 20 °C on nematode growth medium (NGM) agar plates seeded with Escherichia coli OP50. On the first day of adulthood, animals were collected from the plates and loaded into the microfluidic device. All on-chip experiments were conducted at 20 °C in a temperature-controlled environment.
2.2. Microfluidic Chip Fabrication
The microfluidic chip comprised 384 elongated hexagonal chambers, each measuring 3800 µm in length and 1700 µm in width, and containing internal micropillars with a diameter of 200 µm. The device was fabricated from polydimethylsiloxane (PDMS) using conventional soft lithography with an SU-8-patterned silicon master mold, followed by casting, degassing, and thermal curing. The completed chip was connected to an external valve-controlled, pressure-driven fluidic system capable of independently delivering six different solutions to six groups of 64 chambers, for a total capacity of 384 individually housed worms. Alternating forward and backward flow enabled progeny to be flushed from the chambers without manual handling (Supplementary Movie S3).
2.3. Deep Learning Framework
The dataset consisted of 12,000 images of adult C. elegans. It included manually acquired still images and frames extracted from videos. To incorporate diversity, images were collected from multiple adult worms, including wild-type N2 and the dumpy strains CB88 [dpy-7(e88) X] and CB128 [dpy-10(e128) II]. These strains provided variation in body size. Video frames were manually selected following visible changes in worm position or posture. This selection reduced near-duplicate images while capturing different body curvatures, orientations, and head positions. Images were acquired under varied imaging conditions, including differences in illumination, focal quality, motion blur, animal position, and background complexity. The dataset also included worm-containing images, background-only fields, and images containing eggs and debris. These characteristics were incorporated as sources of visual variability rather than separately annotated classes. The final dataset was randomly partitioned at the image level into a training set of 8400 images, a validation set of 2400 images, and a test set of 1200 images, corresponding to a 70:20:10 ratio. The three subsets were mutually exclusive, and no individual image appeared in more than one subset. Partitioning was performed at the image level without separation by source video; therefore, different frames from the same video could appear in the training, validation, and test sets.
2.4. CVAT Annotation
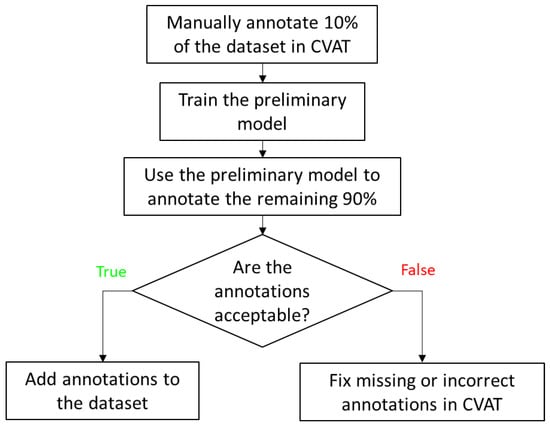
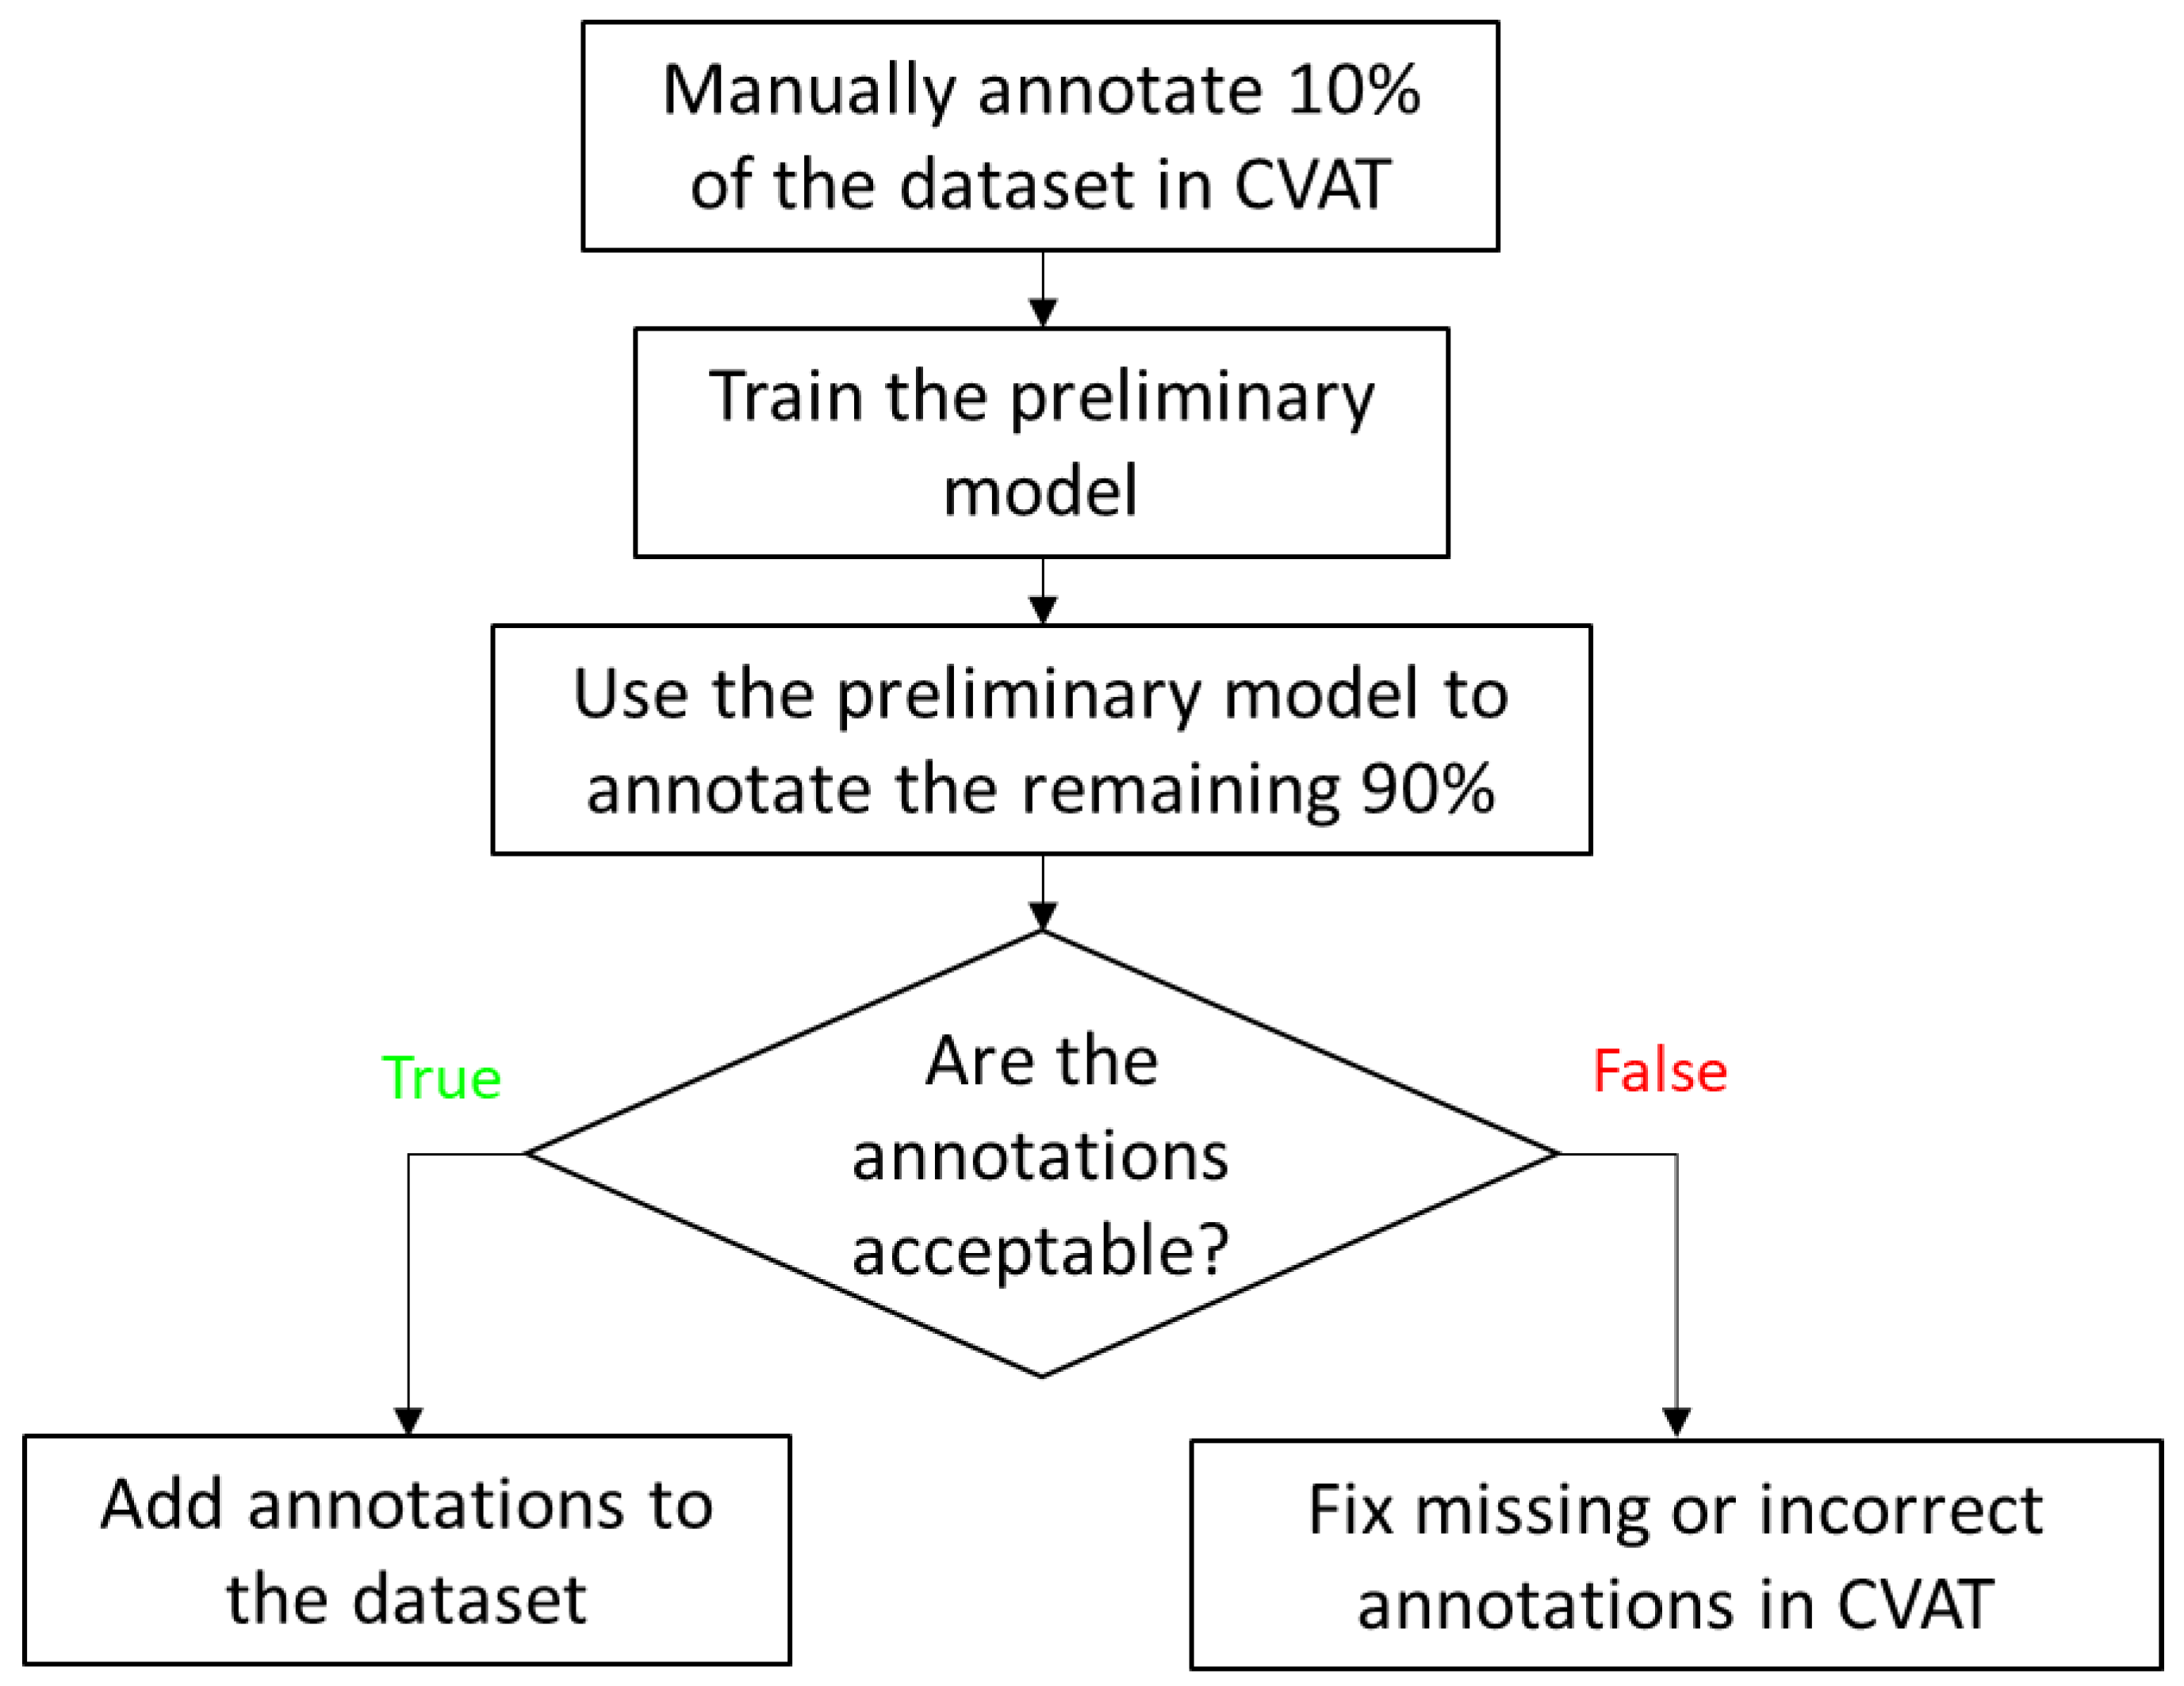
Image annotation was performed using the Computer Vision Annotation Tool (CVAT), a free, open-source platform for image and video labeling. Oriented bounding box (OBB) annotations were used for the head-detection model, and polygon annotations were used for the segmentation models. To reduce manual labeling effort, 10% of the images were first annotated in CVAT and used to train preliminary models for auto-annotation (Figure 1). These models were subsequently applied to annotate the remaining images, and the generated annotations were reviewed for quality. Images with acceptable auto-annotations were incorporated into the final dataset, whereas those with inaccurate or missing annotations were manually corrected before inclusion. The finalized annotations were then exported from CVAT in the Ultralytics YOLO Segmentation 1.0 and Oriented Bounding Box 1.0 formats for model training.
Figure 1.
Semi-automated CVAT annotation pipeline for dataset generation. An initial 10% of images were manually labeled to train a preliminary model for auto-annotation of the remaining dataset, followed by annotation review and dataset inclusion.
2.5. Model Training Details
Head detection and worm segmentation models were developed using the Ultralytics YOLO26 framework, which is designed for efficient real-time computer vision in practical applications [32]. YOLO26n-obb and YOLO26n-seg were used because the nano models offer the lowest inference latency, enabling real-time deployment in our fast imaging workflow. To improve model generalization, geometric and photometric augmentations were applied during training. These included random rotation (±30°), translation (±15%), scaling (±5%), horizontal flipping (probability 0.5), and vertical flipping (probability 0.1). Additional image-based augmentations included Gaussian blur (probability 0.5), contrast-limited adaptive histogram equalization (CLAHE; probability 0.5), and random gamma adjustment (probability 0.3).
Models were trained for up to 250 epochs with stochastic gradient descent (SGD), using a batch size of 8, an input size of 384 × 384 pixels, and a weight decay of 5 × 10⁻⁴. Early stopping was used when the validation loss did not improve for 50 epochs. Training was conducted in Python 3.14.3 on Windows 11 with CUDA 12.1 acceleration on a workstation equipped with an Intel Xeon w5-2445 CPU, 32 GB RAM, and an NVIDIA GeForce RTX 5000 Ada GPU with 32 GB VRAM.
2.6. Model Performance Evaluation
The head-detection model was evaluated using precision, recall, F1-score, and mean average precision (mAP). Confusion matrix analysis demonstrated strong discrimination between the head and background classes, with a true-positive rate of 99.4% and a false-negative rate of 0.6%. The model achieved 98.6% precision, 99.4% recall, a 99.0% F1-score, and 99.5% mAP@0.5. The trained head-detection model was integrated into the real-time tracking pipeline, in which BoT-SORT was applied with an Intersection over Union (IoU) threshold of 50% for frame-to-frame association of detected worm heads, thereby preserving worm identity across consecutive frames and reducing identity switches. The YOLO26n-obb head-detection model had a mean inference latency of 42.4 ms per frame, measured separately from the overall tracking cycle.
Segmentation model performance was quantified using both bounding-box and mask metrics, including precision, recall, F1-score, and mean average precision (mAP). For bounding-box prediction, the model achieved 100% precision, 99.5% recall, a 99.7% F1-score, and 99.5% mAP@0.5. For mask prediction, it achieved 100% precision, 99.5% recall, a 99.7% F1-score, and 99.5% mAP@0.5. The models were designed specifically for head detection and body segmentation in adult C. elegans. The high F1-scores and mAP values may partly reflect the restricted task scope and standardized imaging conditions. Each model addressed a single target class: the head for detection and the adult worm body for segmentation. We did not perform additional classification by strain, developmental stage, or phenotype. Distinct worm morphology provided recognizable target features, while identical chamber geometry limited structural variation in the background. These characteristics may have facilitated target–background discrimination, plausibly explaining the high scores in the evaluated dataset. The reported model performance applies to the tested imaging conditions and chamber geometry. Adaptation to other configurations may require application-specific training data, retraining, and independent validation.
2.7. Sharpness Calculation
In focused images, sharp edges and fine structural features produce larger spatial intensity variations, resulting in higher gradient and second-derivative values, whereas defocus reduces edge definition and attenuates high-frequency image content. To quantify image sharpness during acquisition, three gradient-based sharpness metrics, Tenengrad, Sobel variance, and Laplacian variance, were used to assess local spatial intensity variation. These metrics evaluate image intensity gradients and second-derivative responses. For the Tenengrad metric, horizontal and vertical gradients were obtained using Sobel filters, and the gradient magnitude was computed as
where Gx and Gy denote the horizontal and vertical Sobel filter responses, respectively. Higher gradient magnitudes correspond to sharper image regions, whereas lower values indicate blurred regions. The Tenengrad metric was defined as
Sobel variance was defined as the variance of the Sobel gradient magnitude image:
Ssobel = Var(G)
Laplacian variance was computed as
where ∇2I is the Laplacian response of the image. Higher values of all three metrics indicate stronger edge content and, therefore, better focus [33].
Slap = Var(∇2I)
3. Results
An adult C. elegans hermaphrodite is approximately 1 mm in length and 70–80 µm in width [21]. The narrow field of view makes tracking challenging, particularly during rapid movements such as escape responses, when locomotion speeds can reach approximately 800 µm/s. At this speed, a head moving directly toward an edge of the 400 × 400 µm field of view could travel from the center to the boundary in approximately 250 ms, allowing little time for detection and motorized-stage recentering. This constraint becomes more pronounced when imaging neuronal structures. Even brief worm movement can displace neuronal somata during exposure, causing motion blur, spreading fluorescence across more pixels, and reducing peak intensity and per-pixel signal-to-noise ratio. To address this problem, we developed a high-speed tracking system that continuously identifies the worm head and adjusts the motorized stage in real time to keep the target within the field of view during imaging. Operating at approximately 22 frames per second, the system completes image processing and rapid positional updates in about 45 ms per cycle. This update interval was shorter than the estimated 250 ms required for a rapidly moving head to leave the field of view when initially centered. The chip contains 384 individual incubation chambers. The system acquired approximately four high-quality images per worm per day on average, and each worm yielded at least one high-quality image per session. These results demonstrate repeated automated image acquisition over the tested period. The user-configurable imaging intervals and tracking parameters allow the workflow to be adapted to smaller cohorts and more frequent imaging schedules.
3.1. Tracking System Overview
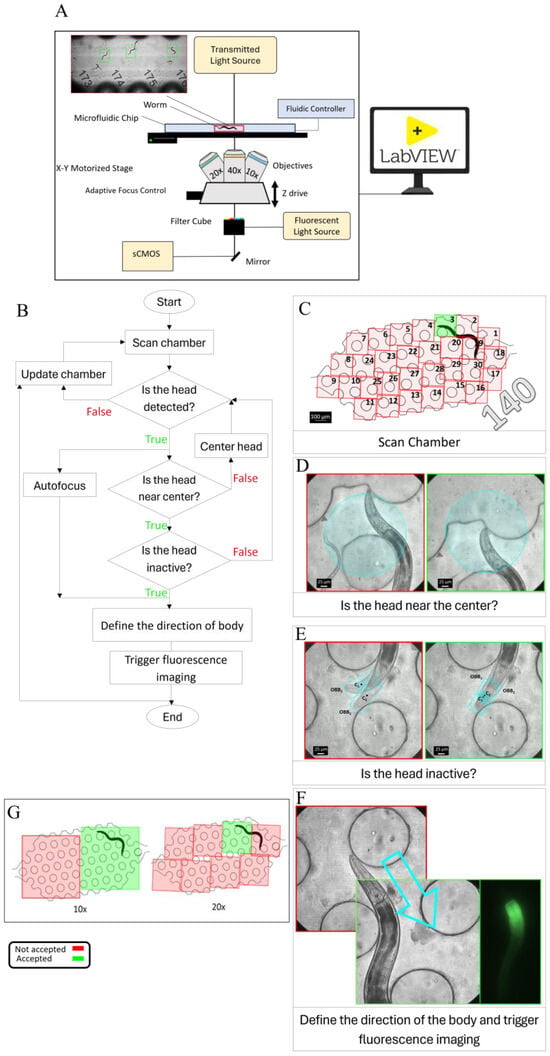
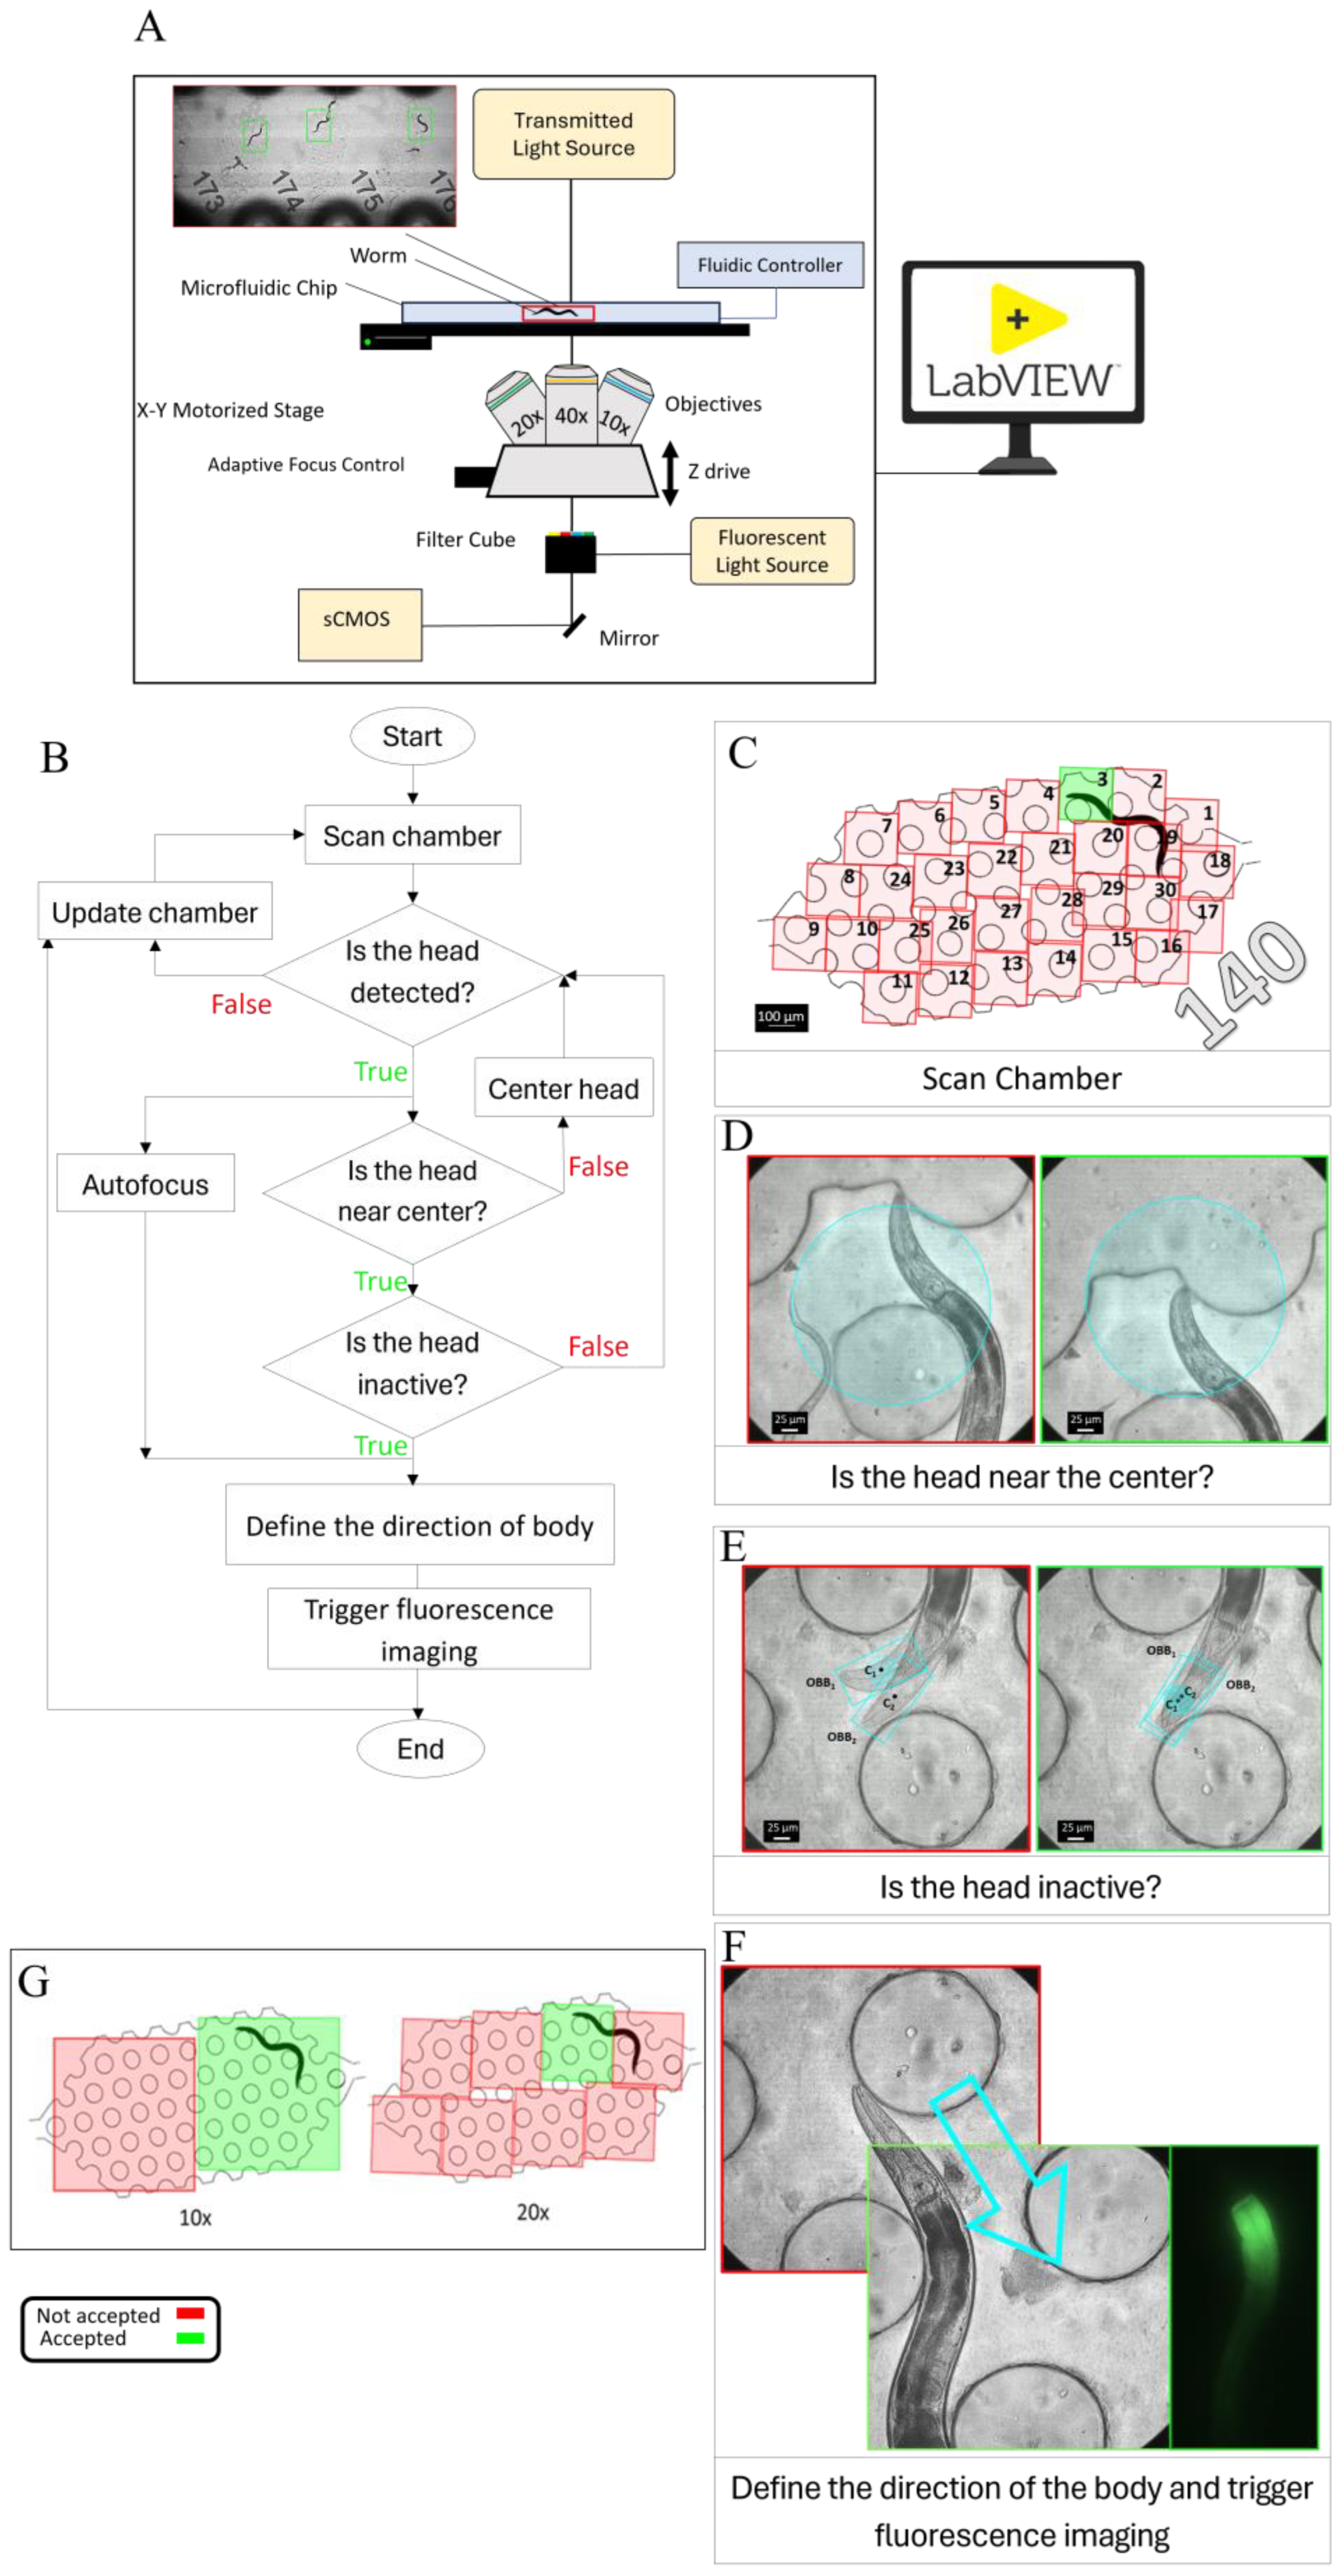
High-magnification tracking of C. elegans is performed using an integrated microscopy system (Figure 2A) comprising a Leica DMi8 inverted microscope (Leica Microsystems CMS GmbH, Wetzlar, Germany), a Kinetix22 high-speed camera (Teledyne Photometrics, Tucson, AZ, USA), and an LMT precision motorized XY stage (ITK Precisioning GmbH, Lahnau, Germany). Microscope operation, imaging automation, and stage motion are managed through a LabVIEW supervisory interface that executes Python modules for tracking and image processing. This framework automates control of the motorized z-drive, objective turret, contrast modes, and illumination settings. It supports worm tracking in the XY plane with axial focus control at 10×, 20×, and 40× magnification. Worms are housed in a microfluidic chip containing 384 individual chambers, each designed to confine a single animal. Image acquisition is performed using an sCMOS camera operated at up to 664 fps with an 8-bit depth. The motorized XY stage enables precise, high-speed motion and provides submicron positioning control, with travel speeds of up to 500 mm/s, 5 nm resolution, and positioning accuracy within ±1.0 µm.
Figure 2.
(A) Schematic of the tracking platform, including an sCMOS camera, fluorescence and transmitted-light illumination, filter cube, Adaptive Focus Control, objectives, motorized stage, microfluidic chip, and z-drive, all operated through a LabVIEW interface. (B) Tracking workflow. Each chamber was first scanned to localize the worm, after which the detected head was used to initiate tracking. The stage then recentered the worm during movement while autofocus established the optimal focal plane. Tracking continued until the worm satisfied the inactivity criterion, which triggered image acquisition. (C) Schematic of the tiled scan sequence used to locate a worm within chamber 140 at 40× magnification. Scanning begins at tile 1 and proceeds sequentially until the worm head is detected or all 30 tiles have been scanned. A complete 30-tile scan required approximately 2 s. In this example, no head was detected in tiles 1 and 2 (red), whereas detection in tile 3 (green) initiated tracking. (D) Stage Recentering. The red-bordered image shows the worm head outside the central target region, whereas the green image shows the worm head positioned within the circular target region. (E) Inactivity-state classification for fluorescence triggering. After autofocusing was completed, the first frame was designated as the reference frame, and the detected head in this frame was defined as OBB1 with centroid C1. In each subsequent frame, the newly detected head was defined as OBB2 with centroid C2. If C2 remained within a 50 µm-diameter circular region centered at C1 for four consecutive frames, corresponding to 200 ms, the worm was classified as inactive, and fluorescence imaging was triggered. If this condition was not met, OBB1 and C1 were updated, and the evaluation was repeated. The red image indicates an active state, in which C2 falls outside the predefined circular region. In contrast, the green image indicates an inactive state, in which C2 remains within the region and satisfies the triggering criterion. (F) Movement toward the midbody. The arrow indicates the direction of movement, and the corresponding brightfield and fluorescence images are displayed. (G) Schematic of the tiled scan pattern used to find the worm within a chamber at 10× and 20×.
3.2. Tracking Workflow
The dimensions of each chamber in our microfluidic chip are 3800 × 1700 µm. In contrast, the field of view at 40× magnification is only 400 × 400 µm, preventing the entire chamber from being captured in a single frame. The first step is to detect worms within each chamber (Figure 2B). A rapid tiled scan is acquired and processed using a YOLO-based head-detection model (Figure 2C). At 40× magnification, a complete scan of all 30 tiles in one chamber required approximately 2 s. Scanning stopped as soon as the worm head was detected, allowing tracking to begin before completion of the full scan. In Figure 2C, 140 denotes the chamber ID. If no worm is detected, the system advances to the next chamber and continues scanning. Once a worm is detected, the system locks onto the head, and tracking begins. During tracking, the motorized stage repositions the field of view to keep the detected worm’s head centered (Supplementary Movie S1). Recentering is triggered when the worm head approaches the boundary of a circular target region approximately 300 µm in diameter, corresponding to about 75% of the frame width (Figure 2D). This conditional recentering strategy minimizes unnecessary stage movements and reduces motion blur during imaging, as continuous unconditional recentering requires frequent high-speed corrections that can destabilize tracking. Autofocus runs concurrently with tracking to determine the optimal z-position. During this process, the x, y, and z coordinates are updated. After focus is established, the z-position remains constant until the worm enters an inactive state suitable for image acquisition. Inactivity is defined as the center of the detected head remaining within a circular region 50 µm in diameter for 200 ms (Figure 2E), allowing small local movements. The diameter of this region is comparable to the approximate width of the head-body region of a young adult C. elegans. Once inactivity is confirmed, fluorescence imaging is triggered. For head imaging, no additional stage movement is required. For midbody imaging, the stage is repositioned to bring the target body region into the field of view (Figure 2F). To assess positional stability during fluorescence acquisition, brightfield images with 2 ms exposures are acquired immediately before and after the 5 ms fluorescence exposure. The paired brightfield images are compared for changes in worm position and posture, with agreement requiring no detectable net displacement or posture change. This validation supports assessment of positional stability across the acquisition interval. Following successful tracking initiation, image acquisition typically occurred within 20 s. A preset 120-s timeout limited each tracking attempt. If the acquisition criteria were not satisfied within this period, the system advanced to the next chamber. Missed chambers could be revisited during subsequent imaging runs.
The workflow is compatible with multiple objective magnifications, with the scanning tiles adjusted accordingly. At lower magnifications, the larger field of view allows each chamber to be covered with fewer tiled images. Because the field-of-view area decreases approximately with the square of magnification, more tiled images are required to cover the same area at higher magnifications. In our system, complete chamber coverage required 2 frames at 10×, 8 frames at 20×, and 30 frames at 40× (Figure 2G).
3.3. Focus Optimization
Accurate focus control is essential for high-resolution microscopy, particularly in automated imaging systems where samples may move during acquisition [33]. In microfluidic imaging platforms, small variations in device geometry, chamber height, and specimen position can shift the optimal focal plane across the field of view, making dynamic focus adjustment necessary to maintain consistent image sharpness. Hardware-based methods such as Adaptive Focus Control (AFC) provide a stable initial focal reference from reflective optical interfaces, whereas image-based autofocus refines focus directly from specimen image quality. In this study, AFC, an infrared-based hardware autofocus system, was used during chamber-to-chamber movement to establish an initial focal reference [34]. AFC maintains a fixed distance between the objective and the bottom surface of the glass slide. However, this alone is insufficient for high-magnification imaging because it cannot compensate for variations in slide thickness or specimen movement along the z-axis. As a result, the AFC reference plane did not always coincide with the worm’s true plane of best focus during tracking, so focus was further refined using image-based sharpness evaluation.
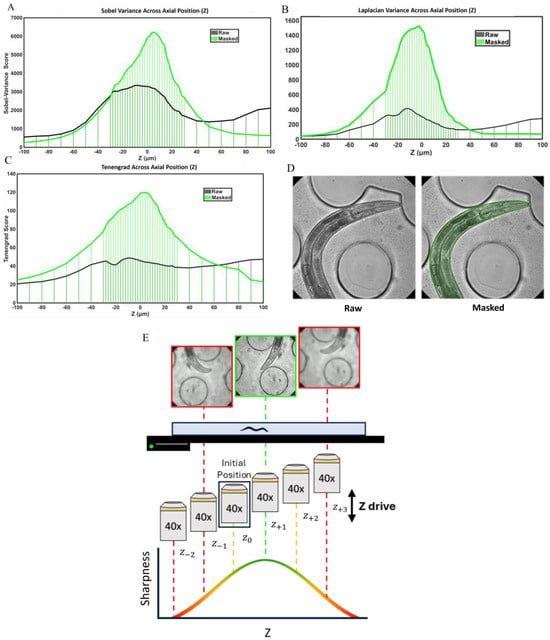
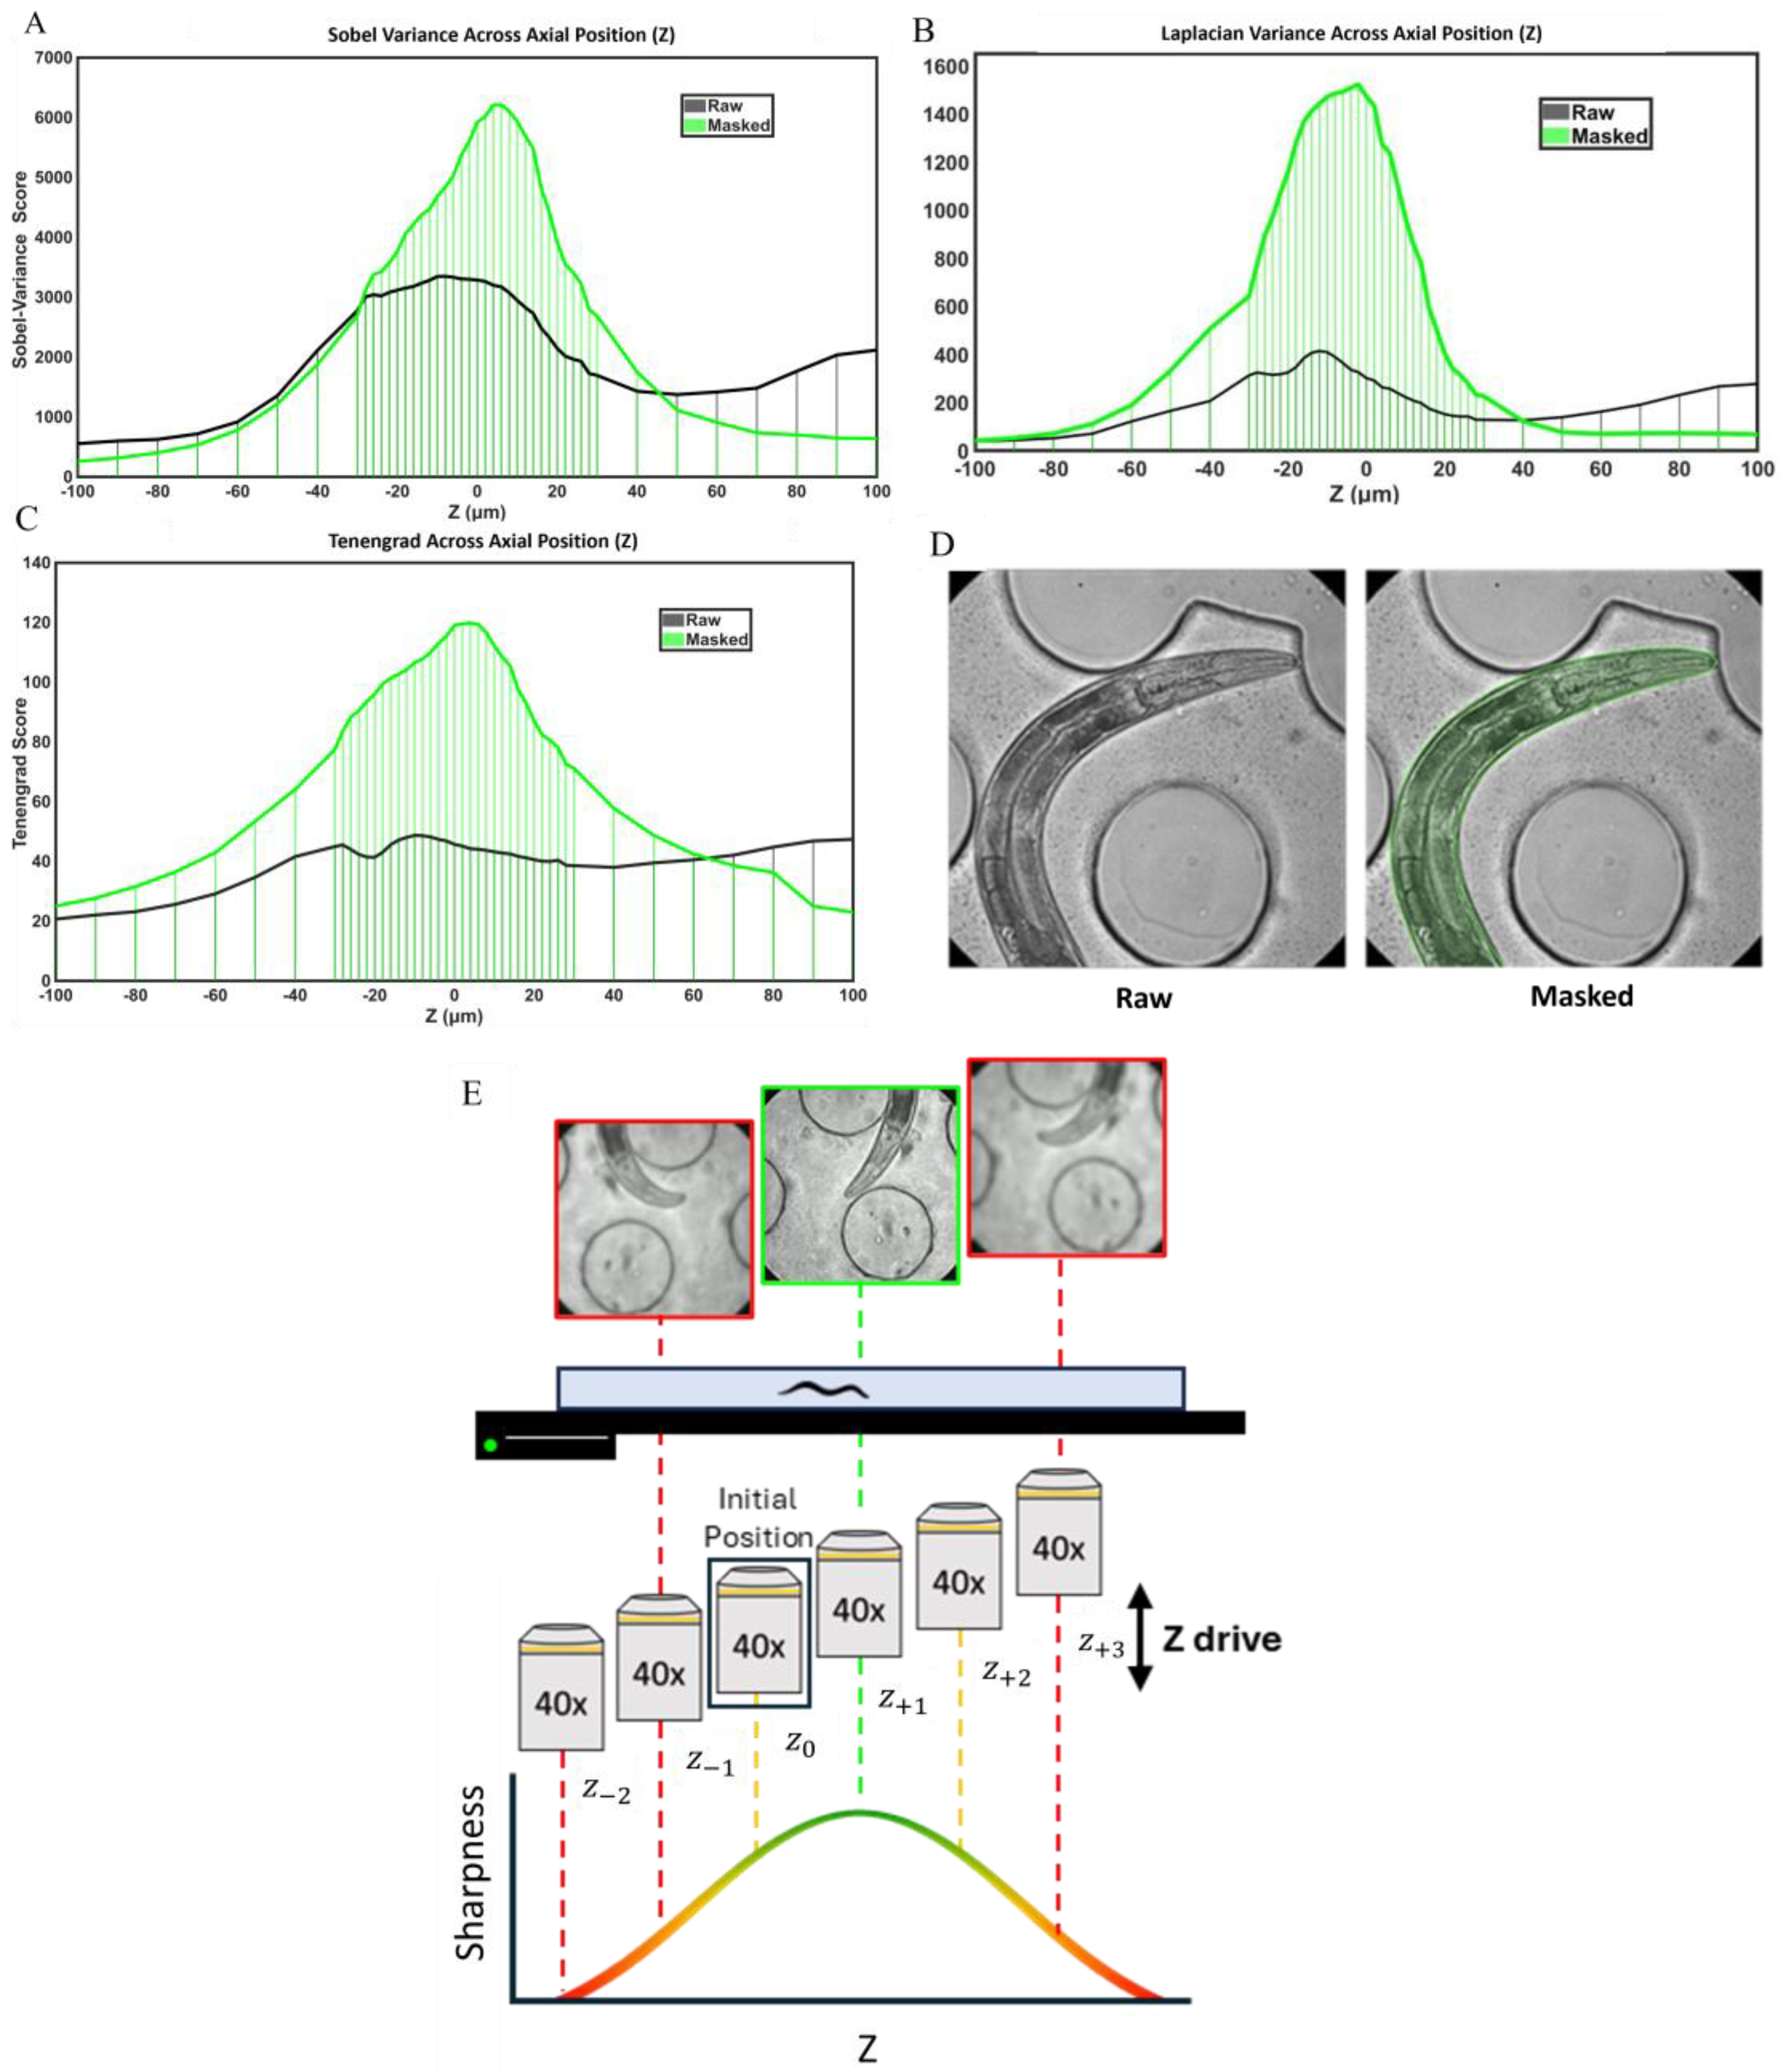
We first developed an image-processing method to identify the optimal focal plane. To compare sharpness across different axial positions, we used images of an immobilized worm acquired at multiple focal planes. Immobilization ensured that image features remained unchanged between acquisitions, allowing direct comparison of sharpness measurements. The in-focus position was defined as z = 0, and axial image stacks were collected from −100 to +100 µm relative to the in-focus plane without any x-y movement of the stage. In the initial analysis, image sharpness was computed over the entire frame using three gradient-based metrics: Tenengrad, Sobel variance, and Laplacian variance. However, the resulting sharpness profiles exhibited multiple local maxima rather than a single distinct peak, making it difficult to determine the true focal plane (Figure 3A–C). Sharpness values also varied inconsistently across axial positions and did not reliably reflect the worm’s actual focus, such that higher sharpness values did not always correspond to a sharper image of the animal. This inconsistency was primarily caused by background structures within the field of view, including microfluidic channel features, debris, eggs, and larvae.
Figure 3.
(A–C) Effect of worm masking on sharpness–z profiles calculated using Laplacian variance, Sobel variance, and Tenengrad. Sharpness values from the raw image are compared with those from the masked worm region. Masking improves peak definition and best-focus localization by reducing background contributions. Across all three metrics, the masked curves (green) peak near the user-defined best-focus plane (z = 0), with Sobel variance and Tenengrad peaking at z = +4 µm and Laplacian variance peaking at z = −2 µm. (D) Representative raw and masked images. (E) Autofocus Example. Starting from the adaptive focus control focal position, the motorized z-drive moves above and below the initial z position using small steps, which can be as low as 2 µm. Each image is segmented, and sharpness is measured only within the worm region. In the example shown, +1 step gives the highest sharpness and is selected as the candidate focal plane. This is supported by the −1 and +3 step images, which are blurrier and have lower sharpness values. Sharpness increases as the focal plane gets closer to the best-focus position and decreases as it moves away. Only a few sampled positions are shown here as an example. In practice, the autofocus routine can scan more than 40 steps, covering a total z-range of more than 80 µm when a 2 µm step size is used. Red indicates an unacceptable focal plane, yellow indicates a focal plane near the optimal focus, and green indicates the optimal focal plane.
To overcome this limitation, the analysis was limited to the worm body region (Figure 3). The segmentation model was used to generate a worm mask, and sharpness was calculated only within the masked region (Figure 3A–C). Excluding background features from the calculation eliminated interference in the sharpness measurements. After masking, all three metrics exhibited a single well-defined peak, enabling reliable identification of the highest-sharpness frame as the focal plane (Figure 3A–C). In this masked analysis, sharpness was maximal near focus and declined with increasing distance from the focal plane, producing a clear unimodal profile. All three sharpness metrics performed consistently, and the mean axial position of their peak sharpness values was 2 µm, close to the predefined in-focus position at z = 0, supporting the validity of the evaluation method.
We then integrated autofocus into the active tracking of freely moving animals (Supplementary Movie S2). To evaluate sharpness without interrupting real-time tracking, sharpness calculations were performed in a separate Python thread, allowing autofocus to run in parallel with the main tracking loop. Starting from the AFC-derived initial z-position (z0), we used the microscope z-drive to move the focal plane two steps upward (z+1,z+2) and two steps downward (z−1,z−2). At each z-position, an image was acquired, the animal was segmented, and sharpness was calculated only within the masked worm region to reduce background interference from chamber edges, debris, or illumination artifacts (Figure 3E). The algorithm then compared the mask-based sharpness values across the tested planes. If z0 was not the sharpest plane, the system moved in the direction where sharpness increased. The optimal focal plane was selected by comparing valid sharpness scores across all sampled positions. In the example shown in Figure 3E, z+1 was selected because it had the highest valid sharpness score among the sampled positions.
We quantified autofocus performance from 225 completed autofocus events recorded during automated operation. The algorithm used at least four z-steps to identify the optimal focal plane, with the number of steps ranging from 4 to 14. Approximately 55% of the events reached the optimal focal plane within six z-steps, whereas the remaining 45% required more than six z-steps. The average time from the initial focus evaluation to identification of the optimal focal plane was 10.95 ± 6.47 s (mean ± SD). Autofocus and worm tracking were performed simultaneously in separate computational threads, allowing focus optimization to proceed without interrupting continuous tracking. During active tracking, rapid movement or occlusion could temporarily reduce segmentation quality and require additional z-steps. The routine continued sampling along the z-axis to identify the maximum valid sharpness value from local and global measurements, thereby determining the optimal focal plane within the scanned range.
3.4. Tracking Performance Optimization
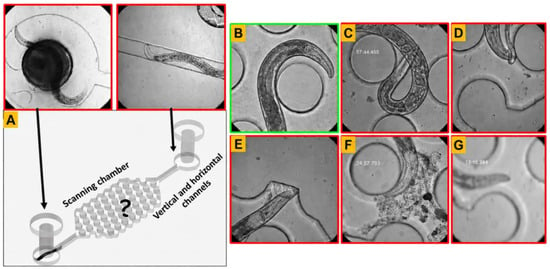
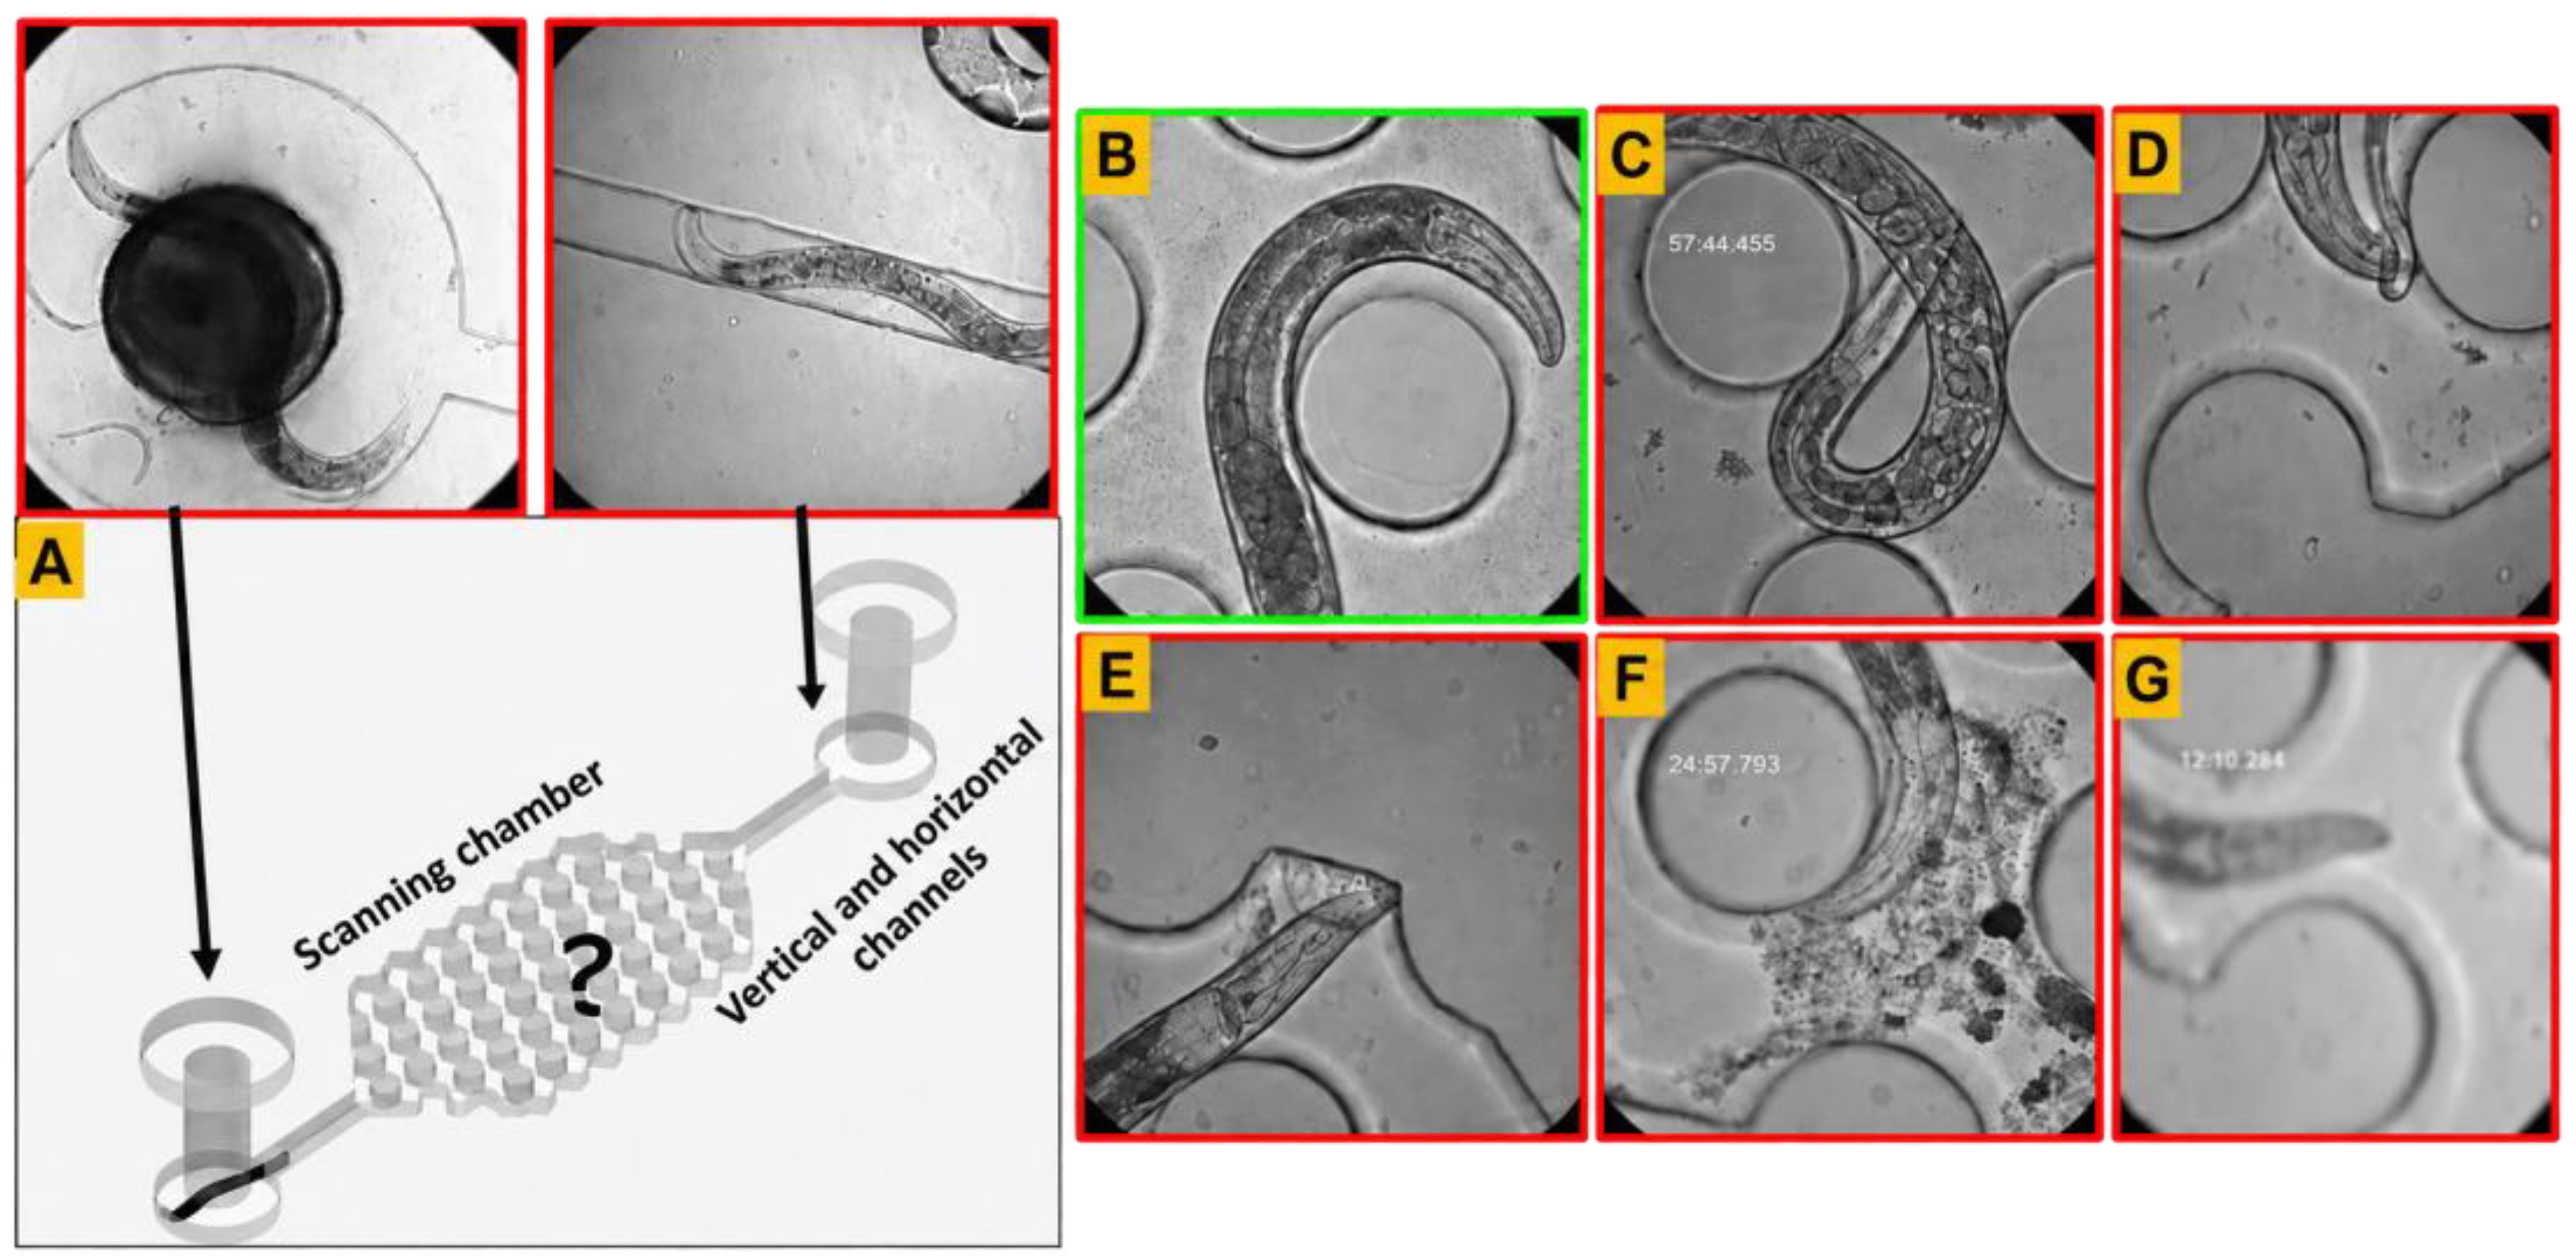
Tracking performance was evaluated using two criteria: tracking initiation and tracking continuation. Tracking initiation success rate (TI) was defined as the percentage of scan events in which the tracking workflow was successfully initiated. An initiation failure was recorded when scanning yielded no valid head detection. Such failures occurred when the worm was temporarily outside the scanned area, rapid movement caused motion blur, or occlusion by the worm’s body, other worms, or debris prevented reliable head detection (Figure 4A–G).
where NInitiated is the number of chambers in which tracking was successfully initiated, and NScanned is the total number of scanned chambers.
Figure 4.
Representative conditions affecting detection, segmentation, and tracking performance. (A) Detection and segmentation failure because the worm was outside the scanning chamber area covered by the 30-tile scan. (B) Suitable image for detection and segmentation, with a visible head and no occlusion or severe motion blur. (C) Detection and segmentation failure due to self-occlusion, with the head hidden beneath the worm’s body. (D) Detection and segmentation failure due to occlusion by progeny. (E,F) Detection and segmentation failure due to occlusion by debris. (G) Detection and segmentation failure caused by motion blur from rapid worm movement or defocus when the autofocus algorithm failed to converge. Detection failure in the initial frames prevents tracking initiation, whereas detection failure across consecutive frames during active tracking prevents tracking continuation. Segmentation failure alone affects only the autofocus convergence time.
Tracking continuation success rate (TC) was defined as the percentage of initiated tracking events in which tracking was maintained through acquisition of an image that met the acceptance criteria. This metric quantified how reliably the workflow maintained lock on a worm after tracking had been initiated. Continuation failure was recorded when the worm was lost after tracking had begun, for example, when rapid movement, motion blur, or occlusion prevented detection across consecutive frames (Figure 4B–G).
where NContinued is the number of chambers in which tracking was maintained through acquisition of an accepted image after initiation.
Overall tracking performance was defined as the product of tracking initiation success rate (5) and tracking continuation success rate (6):
This metric provides a combined measure of the workflow’s ability to initiate tracking and sustain it through image acquisition. Image acceptance was assessed using two criteria: sufficient sharpness and complete inclusion of the intended anatomical region within the field of view. Sharpness was evaluated within the worm body using Laplacian, Sobel-variance, and Tenengrad metrics. A frame was considered acceptable only if it met the sharpness criteria for at least two of these three methods and satisfied the anatomical-coverage requirement. Using these sharpness and anatomical-coverage criteria, the overall acceptable-frame yield was 97.4%. For performance evaluation, only acquisitions that produced an image meeting these acceptance criteria were counted as successful.
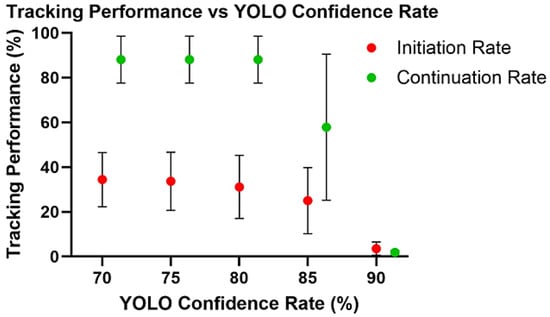
Tracking initiation and continuation are sensitive to the YOLO confidence threshold. Successful initiation requires a worm detection that exceeds the selected threshold, while continuous tracking requires accepted detections across consecutive frames. Five thresholds (90%, 85%, 80%, 75%, and 70%) were selected before analysis to evaluate a range of detection sensitivities. Higher thresholds may increase detection specificity but reject valid lower-confidence detections, whereas lower thresholds may improve sensitivity but increase false-positive detections of eggs, debris, background structures, or microfluidic features. All thresholds were evaluated at 40× magnification, the most challenging imaging condition because of its restricted field of view and the rapid movement of the worms. The same videos were analyzed at all five thresholds to ensure consistent worm movement, posture, occlusion, and imaging conditions across comparisons. Six approximately two-hour automated imaging runs were recorded using the same cohort of 64 individually housed worms. During real-time tracking, the confidence threshold was set to 70%, the lowest threshold evaluated. This setting reduced the exclusion of potentially valid detections during acquisition. Each of the six runs produced 64 chamber-specific tracking sequences, yielding 384 sequences in total. Each sequence was reanalyzed frame by frame at all five YOLO confidence thresholds to evaluate tracking initiation and continuation. The reported variability reflects differences across repeated runs within the same cohort rather than variation among independent cohorts.
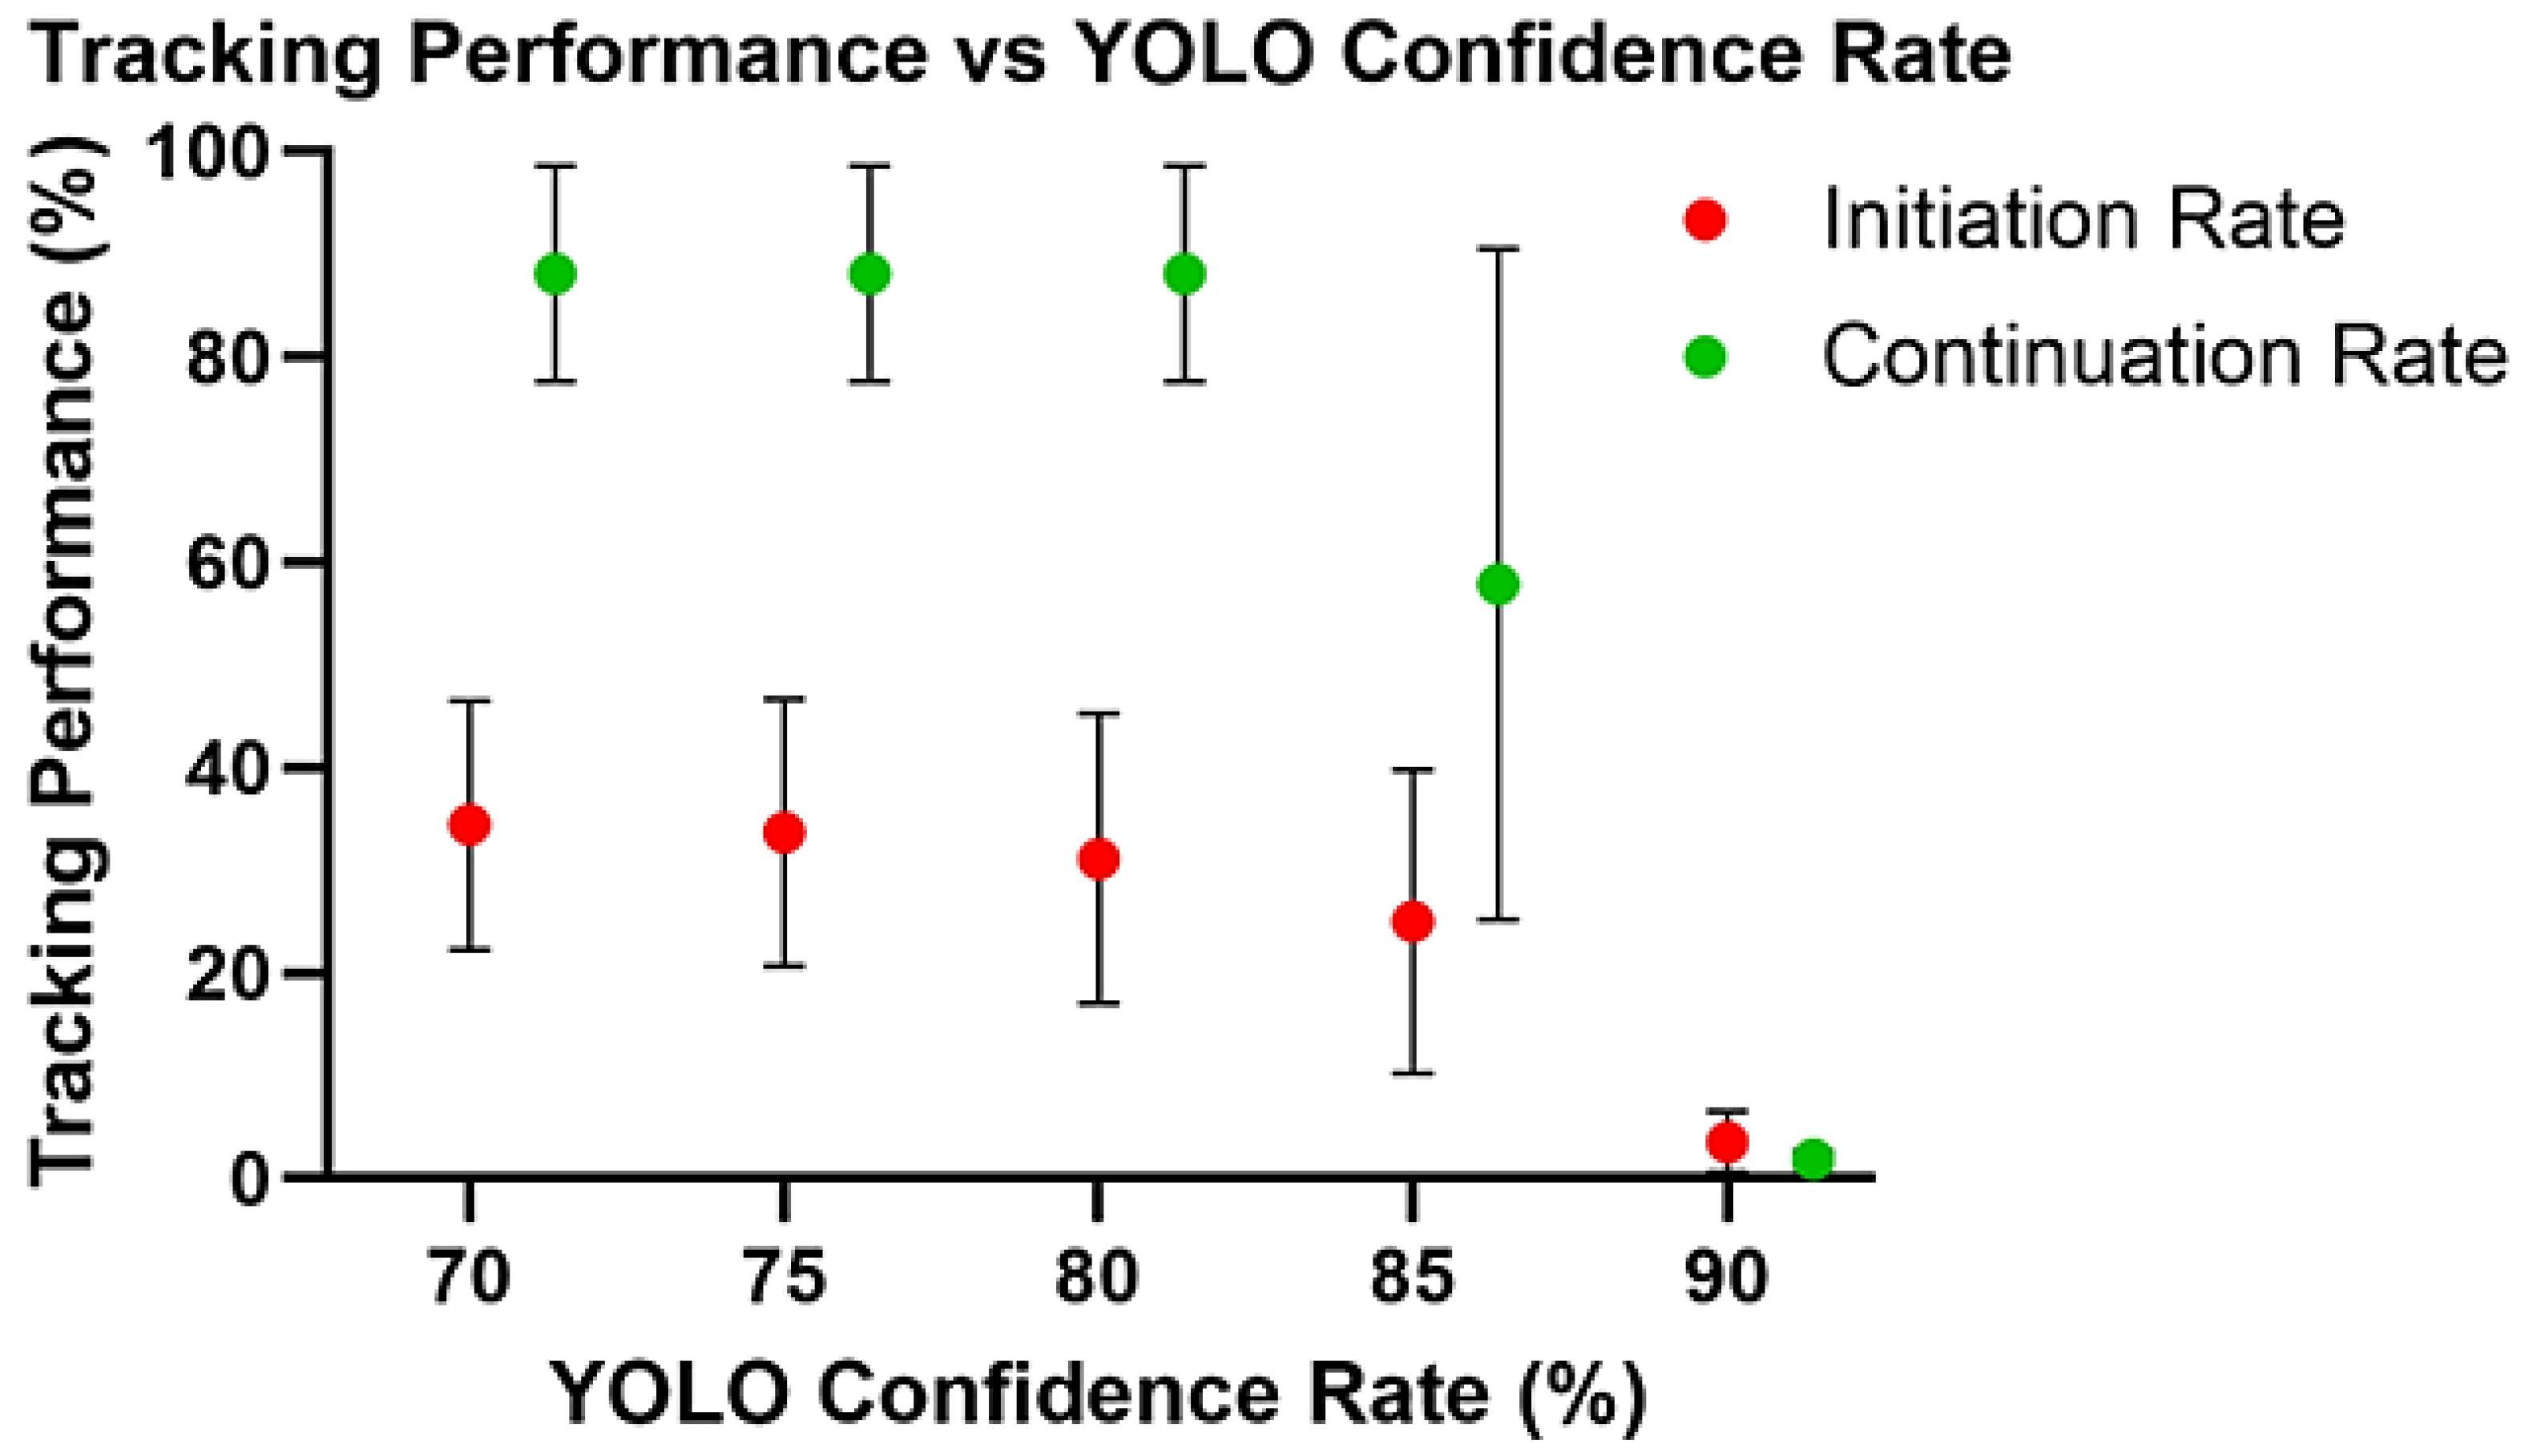
The YOLO confidence threshold strongly influenced tracking initiation and continuation (Figure 5). At the most stringent threshold of 90%, both tracking initiation and continuation rates were low. Lowering the threshold to 85% markedly improved performance, and a further reduction to 80% increased initiation to 31.1% and continuation to 88.1%. At 70%, continuation remained unchanged at 88.1%, whereas initiation increased modestly to 34.4%. Overall tracking performance was calculated as the product of the initiation and continuation rates. The highest combined performance was obtained at 70%, where the mean initiation and continuation rates of 34.4% and 88.1%, respectively, yielded an overall performance of 30.3%. These results indicate that thresholds between 70% and 80% provided the most favorable balance between detection sensitivity and tracking stability, with 70% selected for the subsequent automated experiment.
Figure 5.
Effect of YOLO confidence threshold on tracking performance (tracking initiation and tracking continuation). At 90%, both tracking initiation and continuation rates were low. Lowering the threshold markedly improved both metrics, with initiation and continuation reaching 31.1 ± 14.1% and 88.1 ± 10.5%, respectively, at 80%. At 70%, continuation remained unchanged at 88.1 ± 10.5%, whereas initiation increased only modestly to 34.4 ± 12.1%, indicating that thresholds in the range of 80 and 70% provided the most favorable balance between sensitivity and tracking stability. Values represent mean ± SD across six repeated runs involving the same cohort of 64 worms. The 384 chamber-specific sequences were repeated observations, and the same sequences were evaluated at each confidence threshold.
The relatively low initiation rate primarily reflected temporary worm unavailability within the scanned chamber area rather than detector malfunction. Worms were used on day 1 of adulthood, a highly active stage characterized by vigorous locomotion [35]. Visual review showed that 65% of initiation failures occurred when worms entered vertical connecting channels outside the scanned area (Figure 4A), whereas 32% occurred when worms entered tiles that had already been scanned during the sequential 30-tile scan. Together, these movement-related conditions accounted for approximately 97% of initiation failures. Only 3% were attributable to missed detections of visible worms. After an unsuccessful initiation, the system proceeded to the next chamber and revisited the missed chamber during a subsequent run. This repeated scanning, together with the approximately 88% continuation rate, supported repeated imaging despite occasional missed initiations.
The selected 70% YOLO confidence threshold was used for automated imaging of 384 individually housed worms. Four imaging sessions were initiated at 0, 8, 16, and 24 h, targeting one high-quality image per worm per session. Each session began with a complete chip scan, termed the initial run, which required approximately 2 h. In the evaluated imaging runs, 32.6–54.2% of the targeted worms were successfully imaged, with a mean success rate of 41.4%. These imaging yields exceeded the 30.3% overall tracking performance estimated from the mean initiation and continuation rates in the separate threshold-evaluation experiment involving 64 worms. This difference may reflect variation in worm position and movement, which influence whether the head is within the scanned area during acquisition and therefore affect tracking initiation success. The 30.3% estimate thus provides a reference value for the evaluated cohort, rather than a fixed success rate across imaging experiments. Subsequent runs targeted worms for which an acceptable image had not yet been acquired. Once successfully imaged, a worm was excluded from further attempts within that session. The initial run was therefore the most time-consuming, while subsequent runs were shorter as the number of chambers requiring scanning decreased. At the next scheduled session, the system again attempted to acquire a new image from all 384 worms, including those imaged previously. This schedule allowed acquisition of up to four images per worm across sessions initiated over a 24-h interval. Scanning, tracking, and image acquisition were performed automatically without user intervention.
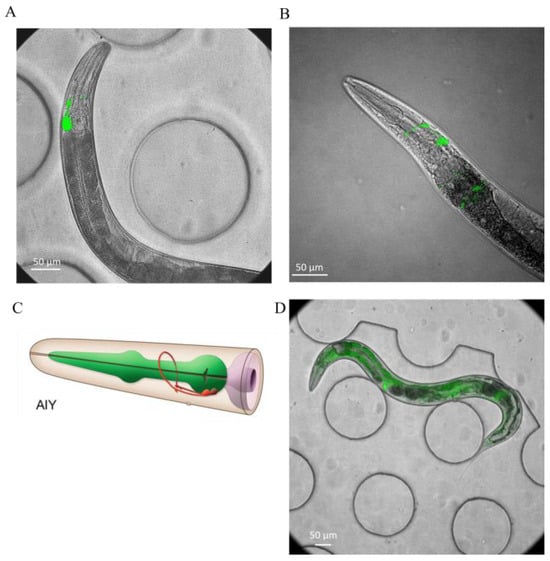
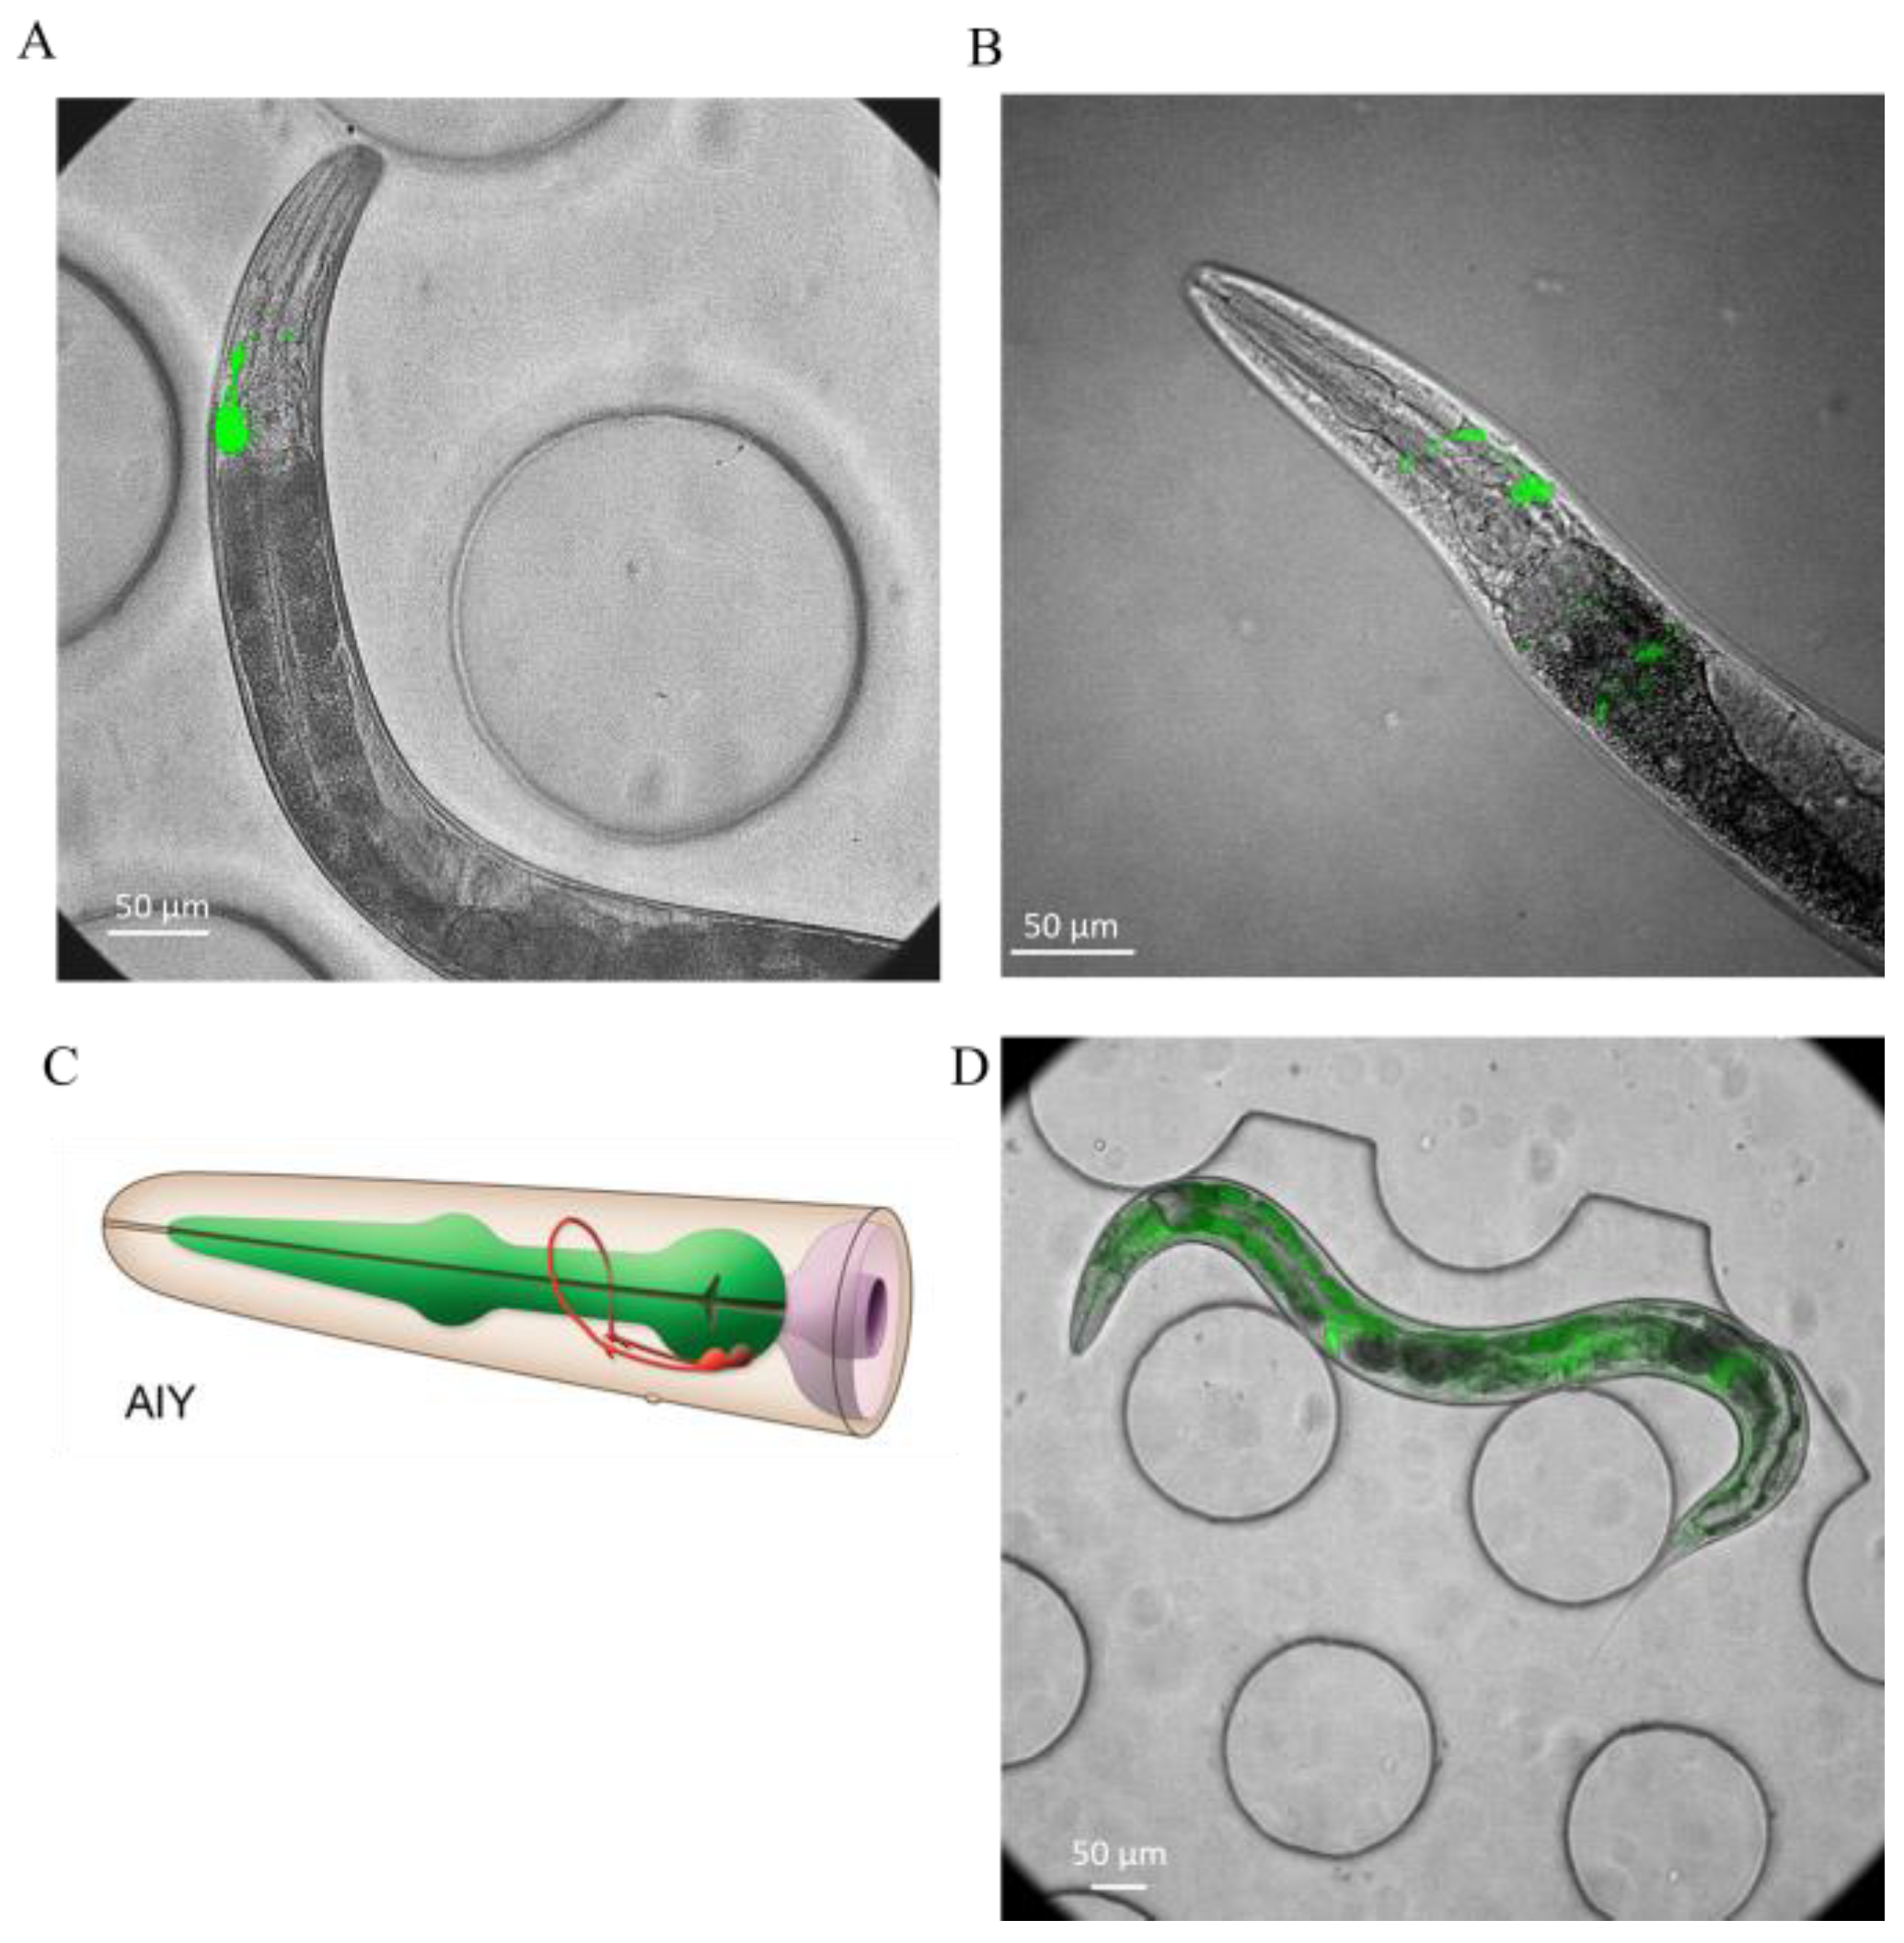
To evaluate imaging performance under natural behavioral conditions, brightfield and fluorescence images of the AIY reporter strain OH99 were acquired from freely moving C. elegans shown in Figure 6A and compared qualitatively with matched images from immobilized animals (Figure 6B). AIY is a pair of head interneurons that integrate sensory information and help regulate behaviors such as thermotaxis, olfactory responses, and locomotion in C. elegans [36,37]. Despite the absence of chemical or physical restraint, images of freely moving worms showed clear overall morphology in brightfield and distinct AIY fluorescence (Figure 6A), supporting the feasibility of high-magnification imaging without immobilization.
Figure 6.
Representative fluorescence images of GFP-expressing C. elegans. (A) Freely moving worm imaged at 40× (OH99, mgIs18). (B) Immobilized worm imaged at 40× (OH99, mgIs18). (C) Schematic of the AIY interneurons, adapted from WormAtlas. (D) Freely moving worm imaged at 20× (GR1719).
The platform also supported imaging at 10×, 20×, and 40× magnifications, with GR1719 shown as an example of lower-magnification imaging. At 10×, the system was well-suited for rapid whole-animal monitoring, including tracking, posture, body size, survival, and global fluorescence measurements. At 20×, it enabled organ- and cell-level analysis while maintaining a sufficiently broad field of view for longitudinal sampling, including intestinal reporter quantification and measurement of variation in nuclear fluorescence intensity (Figure 6D). At 40×, the platform provided the resolution required for mechanistic studies of aging, enabling analysis of cellular and subcellular pathology, including proteostasis defects, stress reporter localization, structural tissue deterioration, and neurodegenerative phenotypes such as neurite remodeling, axonal abnormalities, and changes in synaptic puncta.
3.5. Customizable Tracking LabVIEW Interface
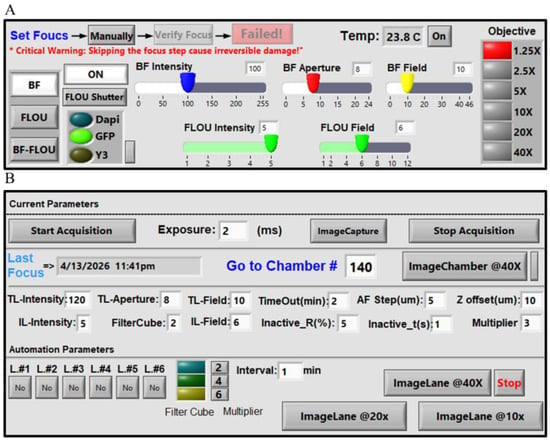
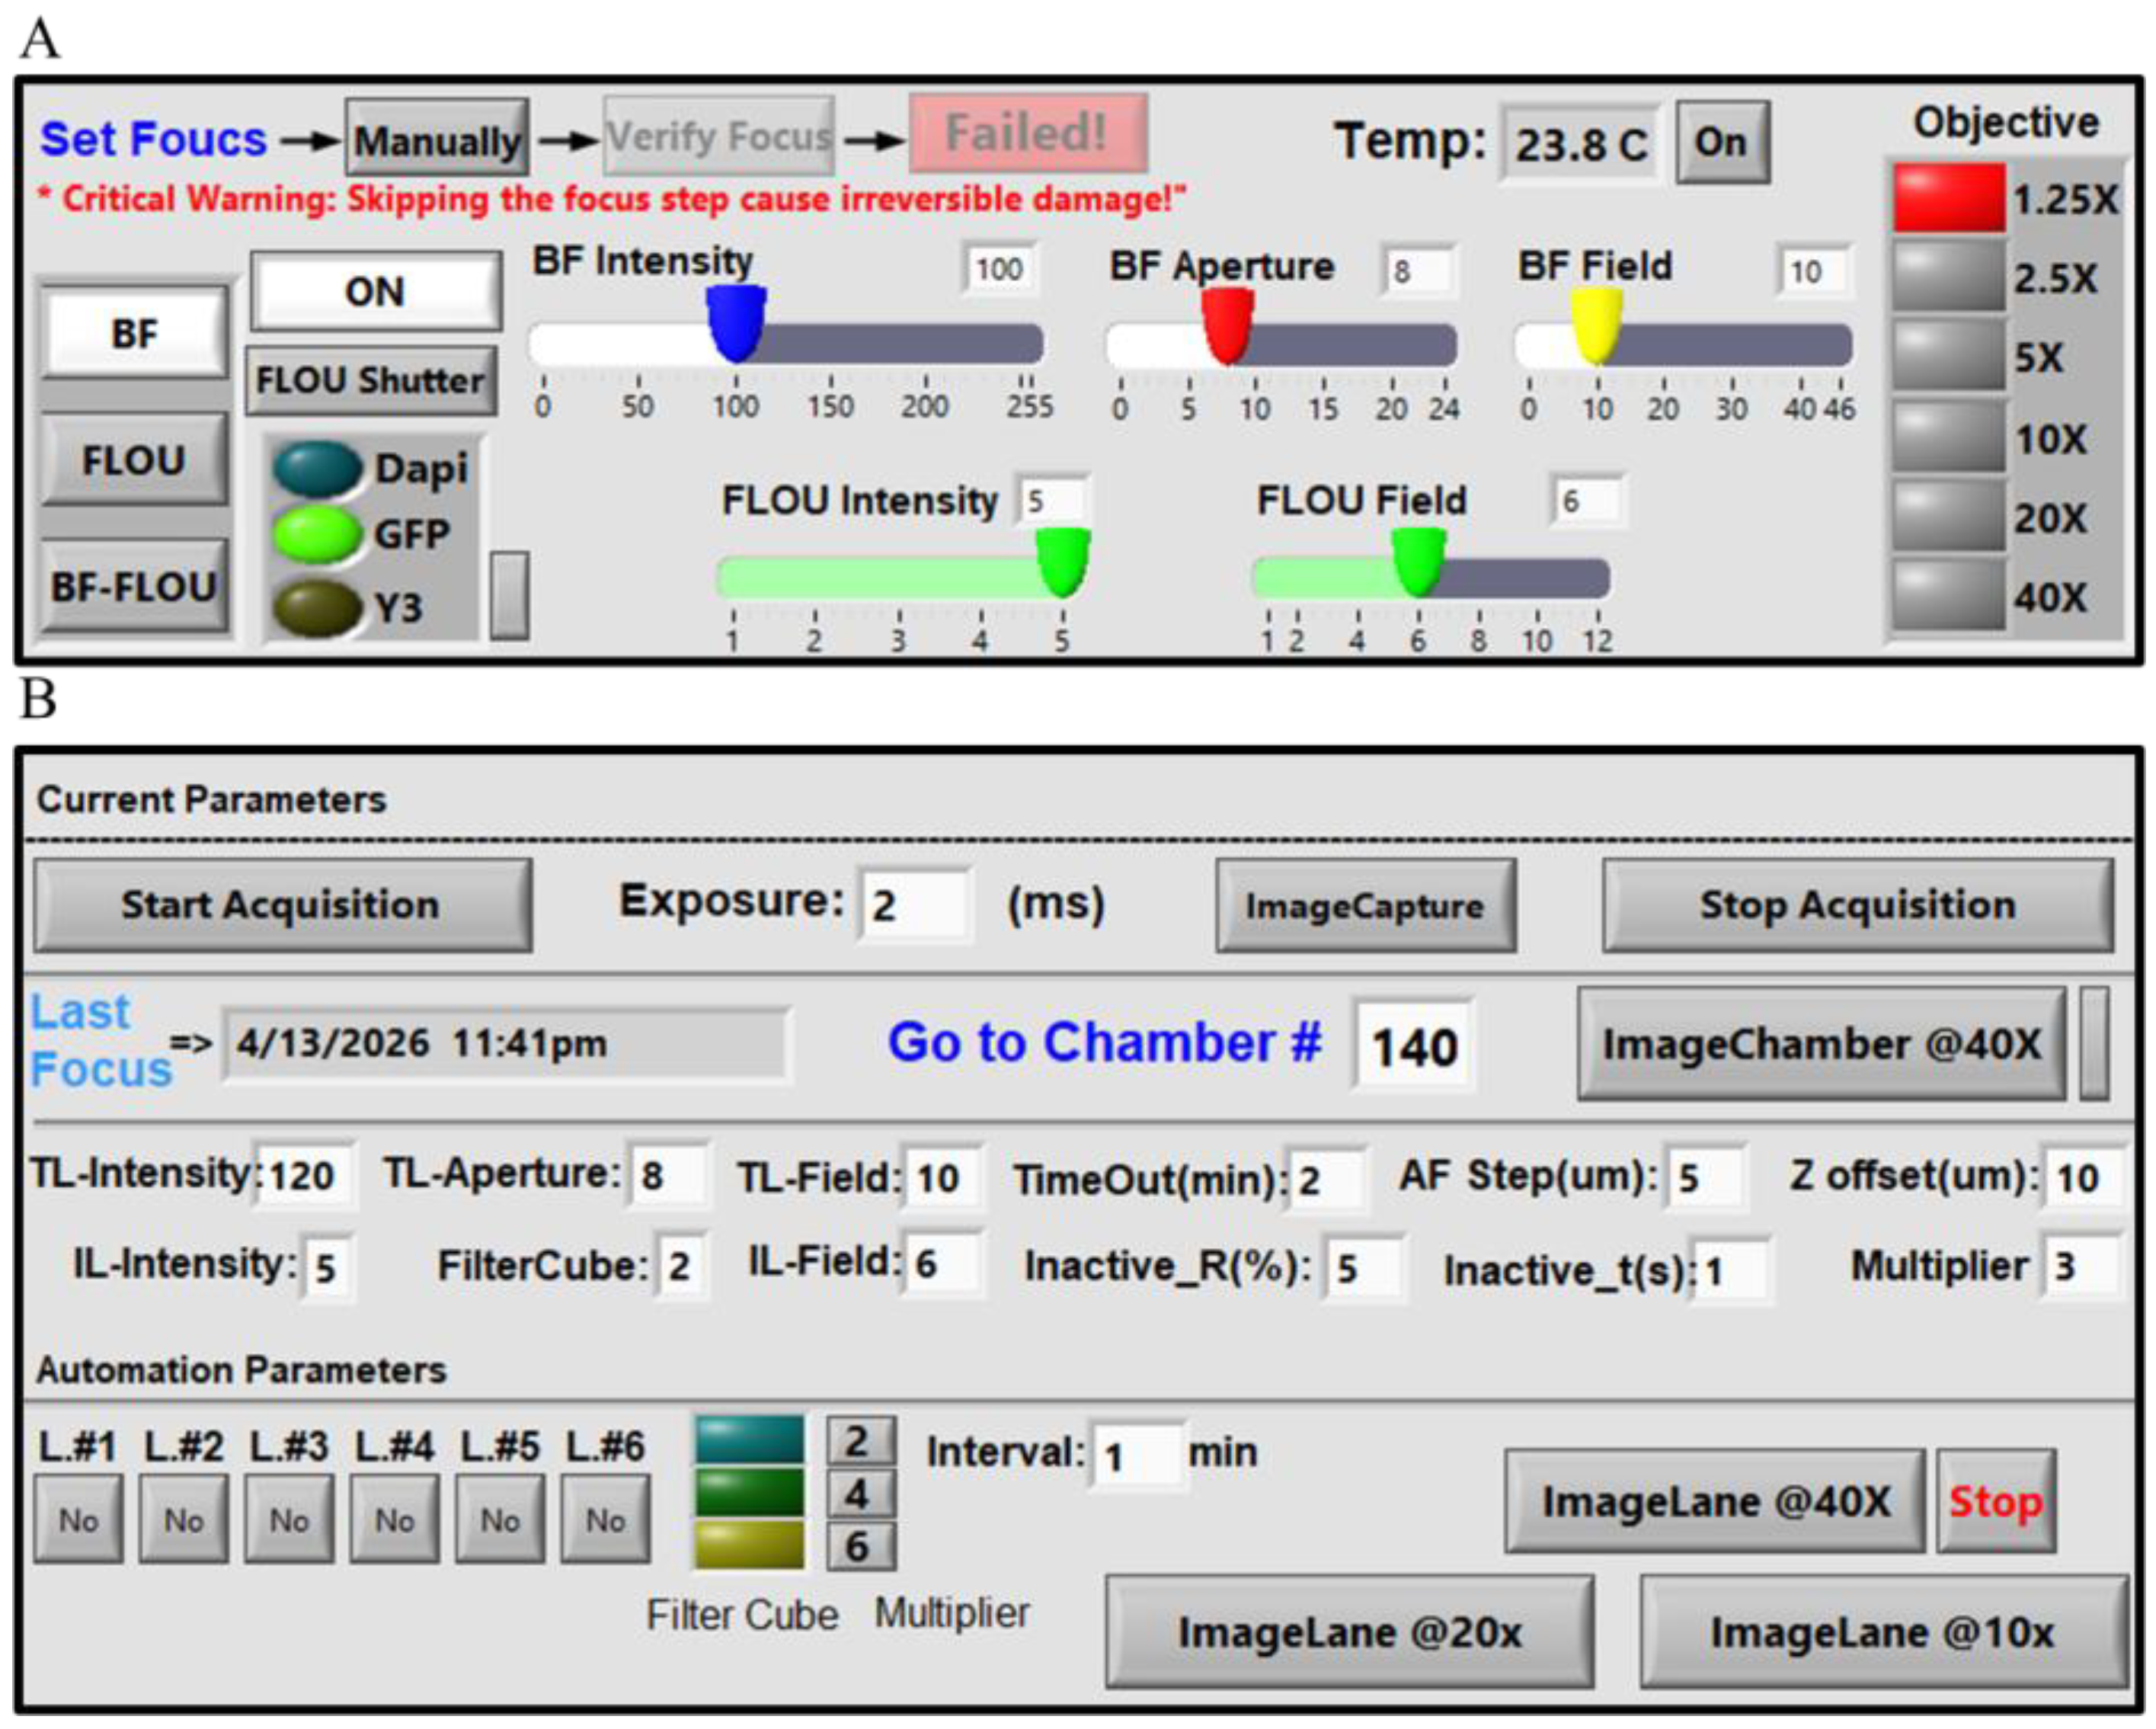
We developed a customizable LabVIEW interface for integrated microscope control, automated worm tracking, autofocus, and image acquisition. The interface combines real-time manual control of microscope hardware with user-defined automated workflow parameters, allowing flexible system setup, calibration, and continuous imaging during long-term experiments (Figure 7). The manual control panel allows users to adjust illumination and focus, select filter cubes and objectives, control shutters, and monitor temperature (Figure 7A). This enables direct control of the imaging system during setup and troubleshooting. The interface also allows users to define key tracking and acquisition parameters that control how the automated workflow responds to worm movement and imaging conditions (Figure 7B). These parameters include autofocus step, timeout, inactive t, and inactive radius. Autofocus step defines the axial step size used during autofocus sampling. The timeout specifies the maximum tracking duration before the system advances to the next chamber if the acquisition criteria are not satisfied. It was set to 120 s in these experiments. Tracking from initiation to successful image acquisition typically took less than 20 s, although the duration varied with worm movement. Thus, the 120-s setting served as an upper limit for unusually active worms or unsuccessful acquisition attempts. Inactive t defines how long the worm must remain within the inactivity region before image acquisition is triggered, whereas inactive radius defines the radius of this region as a percentage of the image-frame width. The 50 µm-diameter experimental region corresponds to a 25 µm radius. Together, inactive t and inactive radius control the sensitivity of the system to temporary pauses in worm movement and determine when the animal is considered sufficiently stationary for high-quality image acquisition. The interface also includes a multiplier parameter that adjusts stage displacement relative to the worm’s movement. Larger values shift the imaging region toward the midbody, whereas smaller values maintain the head within the field of view. The automated workflow supports both targeted single-worm imaging and higher-throughput sequential imaging across chambers. For targeted imaging, users can select a specific chamber number and initiate tracking and imaging of a single animal. For higher-throughput experiments, the ImageLane workflows enable sequential automated imaging across multiple chambers within selected chip lanes at 10×, 20×, or 40× magnification. The chip contains six lanes, each containing up to 64 chambers, allowing users to select specific lanes according to the experimental design. By integrating hardware control, autofocus settings, tracking parameters, and automated chamber progression within a single platform, the LabVIEW interface serves as the central operating environment for the imaging system.
Figure 7.
LabVIEW interface. (A) Manual microscope control panel. The manual control interface allows real-time adjustment of major microscope settings during setup and imaging. Available controls include filter cube selection (DAPI, GFP, and Y3), fluorescence and brightfield illumination intensity, aperture, field diaphragms, shutter operation, manual focus adjustment, objective switching, and chip surface temperature monitoring. The interface supports brightfield, fluorescence, and BF-Fluo imaging modes. In BF-Fluo mode, transmitted brightfield and incident fluorescence are combined through a single high-speed optical path, enabling rapid switching or overlay acquisition while preserving precise spatial alignment between channels without mechanical repositioning. This panel is used for calibration, setup, and direct manual operation of the microscope. (B) Automated imaging and tracking panel. The automation panel allows microscope settings and workflow parameters to be specified for fully automated worm tracking and image acquisition. Adjustable parameters govern tracking and acquisition. Timeout sets the maximum tracking duration before the system advances to the next chamber if the imaging criterion remains unmet. Autofocus step (AF step) specifies the autofocus step size in µm, and z-offset defines the focal offset between brightfield and fluorescence acquisition. Inactive radius specifies the radius of the inactivity region as a percentage of the image-frame width. The multiplier controls how far the stage moves along the worm’s direction of motion, with larger values (typically 4–6) shifting the field of view toward the midbody and smaller values (e.g., 2) helping maintain the head within the imaging area. The panel also displays the currently selected workflow settings in a dedicated section, allowing users to monitor or modify conditions for different imaging rounds or groups of worms. For targeted imaging, Image Chamber 40× enables tracking and imaging of a single worm by entering a chamber number in the Go to Chamber field. For higher-throughput experiments, ImageLane 40×, 20×, and 10× enable sequential, fully automated imaging across multiple chambers within a selected lane. The chip contains six lanes, each containing up to 64 worms, and individual lanes can be selected according to the experimental design. User-defined time intervals determine when the workflow automatically progresses between chambers or lanes, enabling continuous imaging without user intervention. The values shown next to the interval setting indicate the automation multiplier, and the adjacent selection specifies the filter cube used during automated image acquisition.
4. Discussion
To address current limitations in high-resolution tracking, we adopted a workflow based on conditional recentering rather than continuous stage recentering. Continuous unconditional recentering would require repeated high-speed stage movements, which could increase motion blur, destabilize focus, and cause loss of the target from the field of view. By recentering only when necessary, the system reduced unnecessary corrective motion while preserving tracking stability. Autofocus ran concurrently with tracking, with image processing offloaded to a dedicated thread to minimize latency and enable focus evaluation without interrupting the tracking loop. Autofocus refined the focal position during tracking; once focus was established, the selected z-position was held until image acquisition. Using small axial steps enabled fine focus adjustments. This is particularly important because the worm head can move vertically within the microfluidic chamber. We also implemented an inactivity-based triggering criterion to improve image quality, such that fluorescence images were acquired only when the worm was sufficiently stable, and the intended anatomical region was fully contained within the field of view. Accordingly, a valid image was defined as one that was both sufficiently sharp and correctly framed for the target region, including the head or midbody. Fluorescence illumination was restricted to triggered acquisitions lasting 5 ms and remained off during brightfield tracking. Each acquisition was 0.1% of the duration of the 5-s light pulses used for optogenetic motor stimulation [38]. This brief, intermittent illumination was intended to limit potential phototoxicity and light-induced behavioral disturbance. This combination of conditional recentering, concurrent autofocus, low-latency processing, and inactivity-triggered acquisition is particularly valuable for neuronal imaging, where even small displacements during exposure can substantially degrade signal quality. Image sharpness was quantitatively assessed for focus optimization and frame acceptance. The comparison between freely moving and immobilized animals in Figure 6 was limited to qualitative visual assessment.
Unlike systems that track worms at low magnification and then switch to a higher magnification for image acquisition, the present platform performs both tracking and imaging at the same magnification. The system is built on a commercially available inverted microscope and does not require a custom microscopy setup, thereby simplifying implementation and reducing hardware complexity while maintaining support for high-resolution imaging. The platform is modular and adaptable because its software, hardware configuration, and imaging settings can be adjusted for different experimental needs. However, this flexibility does not mean that the trained YOLO models will perform reliably in chambers with different geometries without additional training. The reported model performance applies to the imaging conditions and chamber geometry tested in this study. For new chamber geometries, the models should be retrained using images from the new setup and independently validated to confirm their performance.
The tracking results also highlight the workflow’s current strengths and limitations. Once the worm was detected and tracking was established, continuation remained high across intermediate confidence thresholds, indicating that the closed-loop system was sufficiently fast and robust to keep the detected worm head within the field of view during tracking. In contrast, initiation remained the weaker step. However, the lower initiation rate should be interpreted in the context of chamber occupancy rather than as a failure of the tracking algorithm alone (Figure 4A). In many scan events, the worm was not within the observable chamber area at the time of imaging but was instead in a connecting channel or outside the scanned region (Figure 4A). Because the workflow is fully automated, these missed initiation events do not substantially disrupt overall operation, since the system can proceed to subsequent chambers without user intervention. Thus, the relatively low initiation rate mainly reflects worm availability at the time of scanning rather than an inability to maintain tracking once the animal has been detected. A practical route for improvement would be to introduce forward and reverse flow steps before scanning to increase the likelihood that worms remain in the incubation chambers rather than drifting into connecting channels. Additional gains may also come from more advanced head-detection models and improved reacquisition strategies.
A key component of this system is the customizable LabVIEW interface, which provides a unified environment for microscope control and automated worm imaging. By combining manual hardware control with automated workflow configuration, the system supports precise experimental setup and unattended operation. The interface can also be adapted to different applications, allowing users to test and adjust multiple parameters according to their specific microscope setup and experimental requirements. This flexibility is particularly useful during method development, when imaging parameters may need to be optimized iteratively before reliable automated acquisition is achieved.
An additional strength of the platform is its ability to support imaging at 10×, 20×, and 40× magnifications within a unified workflow. Lower magnifications are well-suited for whole-animal observation and behavioral phenotyping, whereas higher magnifications provide the spatial resolution needed for organ-level, cellular, and neuronal imaging. This flexibility broadens the range of biological questions that can be addressed, from locomotion and posture to subcellular phenotypes and reporter dynamics. The videos generated during tracking may also provide useful information beyond endpoint image acquisition, for example, in studies of locomotion and, when image quality and magnification are sufficient, behaviors such as pharyngeal pumping.
Overall, the present system provides a practical foundation for automated, high-resolution imaging of freely moving C. elegans under controlled microfluidic conditions. During the 24-h validation experiment, the workflow operated automatically following initial setup and enabled repeated image acquisition without chemical or physical immobilization. Although multi-day operation and aging-related phenotypes were not evaluated in this study, the demonstrated capabilities may support future longitudinal studies of aging, neurodegeneration, and behavior. The platform integrates controlled microfluidic culture with high-resolution imaging using a commercially available microscope, motorized stage, and camera without additional custom imaging hardware, potentially reducing setup and integration barriers for other laboratories. A key technical challenge was coordinating image acquisition and processing through a single camera stream to sustain real-time tracking at approximately 22 frames per second. The workflow uses the same camera and selected objective, including the 40× objective, for both tracking and high-magnification image acquisition. The platform provides 384 chambers for individually housed worms, preserving animal identity during repeated imaging, and accommodates up to six independently controlled culture conditions within a single device. Automated fluid delivery supports feeding, environmental manipulation, and progeny removal without reproductive inhibitors. Imaging at 10×, 20×, and 40× enables observations across multiple spatial scales, while a modular LabVIEW interface integrates microscope control, tracking, autofocus, and scheduled acquisition within a customizable workflow.
5. Conclusions
A real-time tracking workflow was developed to enable high-magnification imaging of freely moving C. elegans without immobilization. By integrating a microfluidic culture platform with head detection, worm segmentation, rapid stage feedback, and image-based autofocus, the system maintained stable imaging while preserving natural animal behavior under controlled culture conditions. Once tracking was initiated, the workflow reliably kept the worm within the field of view, and image acquisition during brief inactive periods helped reduce motion blur and improve image quality. Representative brightfield and fluorescence images showed clear anatomical detail and AIY fluorescence in freely moving worms, supporting high-magnification imaging without physical or chemical restraint. This platform provides a foundation for repeated high-resolution imaging of individual worms, with potential applications in studies of aging, neurodegeneration, and behavior. Building on the technical capabilities demonstrated here, future work will apply the platform to biological questions in aging, neurodegeneration, and behavior. Planned studies will investigate longitudinal neuronal activity, synaptic organization, and subcellular pathology, and extend imaging across the adult lifespan using suitable reporters and validated quantitative measurements.
Supplementary Materials
The following supporting information can be downloaded at: https://www.mdpi.com/article/10.3390/bioengineering13111261/s1, Movie S1. Real-time tracking at 40× magnification. Representative video of an adult C. elegans moving rapidly within a microfluidic chamber during 40× imaging. The worm was tracked by real-time head-based recentering, while autofocus operated concurrently to preserve focus throughout the tracking process; Movie S2. Real-time autofocus during tracking at 10×. Representative video showing the autofocus procedure used during tracking. The z-drive sampled axial positions around the initial focal plane, and each image was processed by worm segmentation and sharpness analysis to determine the optimal focus position; Movie S3. Progeny removal using forward and backward flow. The video shows how alternating the flow direction removes progeny from the chamber and helps prevent them from remaining inside the device.
Author Contributions
Conceptualization, P.S. and S.S.; methodology, P.S., M.T. and S.S.; software, P.S.; validation, P.S., T.B.M. and R.T.; formal analysis, P.S.; investigation, P.S.; resources, P.S., M.T. and M.W.P.; data curation, P.S.; writing—original draft preparation, P.S.; writing—review and editing, P.S. and S.S.; visualization, P.S.; supervision, M.W.P. and S.S.; project administration, S.S.; funding acquisition, S.S. All authors have read and agreed to the published version of the manuscript.
Funding
This work was supported by the National Institutes of Health (NIH) under Award Number 1R15AG089221-01A1.
Institutional Review Board Statement
Ethical review and approval were not required for this study because it involved only the invertebrate nematode Caenorhabditis elegans. No human participants or vertebrate animals were involved.
Informed Consent Statement
Not applicable.
Data Availability Statement
The datasets generated and analyzed during this study are not publicly available because they are part of ongoing research. Requests for access to the datasets should be directed to the corresponding author.
Acknowledgments
The authors used ChatGPT for manuscript drafting and language editing. They reviewed and edited the output and take full responsibility for the publication’s content.
Conflicts of Interest
The authors declare no conflicts of interest.
References
- Corsi, A.K.; Wightman, B.; Chalfie, M. A Transparent Window into Biology: A Primer on Caenorhabditis elegans. Genetics 2015, 200, 387–407. [Google Scholar] [CrossRef] [Scilit] [PubMed]
- Riddle, D.L.; Blumenthal, T.; Meyer, B.J.; Priess, J.R. (Eds.) C. elegans II, 2nd ed.; Cold Spring Harbor Laboratory Press: Cold Spring Harbor, NY, USA, 1997. [Google Scholar]
- Tissenbaum, H.A. Using C. elegans for Aging Research. Invertebr. Reprod. Dev. 2015, 59, 59–63. [Google Scholar] [CrossRef] [Scilit] [PubMed]
- Mahbub, T.B.; Safaeian, P.; Sohrabi, S. Automated Platforms in C. elegans Research: Integration of Microfluidics, Robotics, and Artificial Intelligence. Micromachines 2025, 16, 1138. [Google Scholar] [CrossRef] [Scilit] [PubMed]
- Lin, Q.; Weng, J.; Cheng, Z.; Guo, J.; Zhang, R.; Zhang, J. High-Throughput Adult Caenorhabditis elegans Viability Monitoring System. Sci. Rep. 2026, 16, 15014. [Google Scholar] [CrossRef] [Scilit] [PubMed]
- Zheng, M.; Cao, P.; Yang, J.; Xu, X.Z.S.; Feng, Z. Calcium Imaging of Multiple Neurons in Freely Behaving C. elegans. J. Neurosci. Methods 2012, 206, 78–82. [Google Scholar] [CrossRef] [Scilit] [PubMed][Green Version]
- Stroustrup, N.; Ulmschneider, B.E.; Nash, Z.M.; López-Moyado, I.F.; Apfeld, J.; Fontana, W. The Caenorhabditis elegans Lifespan Machine. Nat. Methods 2013, 10, 665–670. [Google Scholar] [CrossRef] [Scilit] [PubMed]
- Churgin, M.A.; Jung, S.-K.; Yu, C.-C.; Chen, X.; Raizen, D.M.; Fang-Yen, C. Longitudinal Imaging of Caenorhabditis elegans in a Microfabricated Device Reveals Variation in Behavioral Decline during Aging. eLife 2017, 6, e26652. [Google Scholar] [CrossRef] [Scilit] [PubMed]
- Anderson, E.N.; Corkins, M.E.; Li, J.-C.; Singh, K.; Parsons, S.; Tucey, T.M.; Sorkaç, A.; Huang, H.; Dimitriadi, M.; Sinclair, D.A.; et al. C. elegans Lifespan Extension by Osmotic Stress Requires FUdR, Base Excision Repair, FOXO, and Sirtuins. Mech. Ageing Dev. 2016, 154, 30–42. [Google Scholar] [CrossRef] [Scilit] [PubMed]
- Wittekindt, S.N.; Owens, H.; Guisnet, A.; Wittekindt, L.; Hendricks, M. An Epifluorescence Microscope Design for Naturalistic Behavior and Cellular Activity in Freely Moving Caenorhabditis elegans. Nat. Commun. 2026, 17, 4411. [Google Scholar] [CrossRef] [Scilit] [PubMed]
- Rahman, M.; Edwards, H.; Birze, N.; Gabrilska, R.; Rumbaugh, K.P.; Blawzdziewicz, J.; Szewczyk, N.J.; Driscoll, M.; Vanapalli, S.A. NemaLife Chip: A Micropillar-Based Microfluidic Culture Device Optimized for Aging Studies in Crawling C. elegans. Sci. Rep. 2020, 10, 16190. [Google Scholar] [CrossRef] [Scilit] [PubMed]
- Xian, B.; Shen, J.; Chen, W.; Sun, N.; Qiao, N.; Jiang, D.; Yu, T.; Men, Y.; Han, Z.; Pang, Y.; et al. WormFarm: A Quantitative Control and Measurement Device toward Automated Caenorhabditis elegans Aging Analysis. Aging Cell 2013, 12, 398–409. [Google Scholar] [CrossRef] [Scilit] [PubMed]
- Le, K.N.; Zhan, M.; Cho, Y.; Wan, J.; Patel, D.S.; Lu, H. An Automated Platform to Monitor Long-Term Behavior and Healthspan in Caenorhabditis elegans under Precise Environmental Control. Commun. Biol. 2020, 3, 297. [Google Scholar] [CrossRef] [Scilit] [PubMed]
- Hulme, S.E.; Shevkoplyas, S.S.; McGuigan, A.P.; Apfeld, J.; Fontana, W.; Whitesides, G.M. Lifespan-on-a-Chip: Microfluidic Chambers for Performing Lifelong Observation of C. elegans. Lab Chip 2010, 10, 589–597. [Google Scholar] [CrossRef] [Scilit] [PubMed]
- Herndon, L.A.; Schmeissner, P.J.; Dudaronek, J.M.; Brown, P.A.; Listner, K.M.; Sakano, Y.; Paupard, M.C.; Hall, D.H.; Driscoll, M. Stochastic and Genetic Factors Influence Tissue-Specific Decline in Ageing C. elegans. Nature 2002, 419, 808–814. [Google Scholar] [CrossRef] [Scilit] [PubMed]
- Sánchez-Blanco, A.; Kim, S.K. Variable Pathogenicity Determines Individual Lifespan in Caenorhabditis elegans. PLoS Genet. 2011, 7, e1002047. [Google Scholar] [CrossRef] [Scilit] [PubMed]
- Kinser, H.E.; Mosley, M.C.; Plutzer, I.B.; Pincus, Z. Global, Cell Non-Autonomous Gene Regulation Drives Individual Lifespan among Isogenic C. elegans. eLife 2021, 10, e65026. [Google Scholar] [CrossRef] [Scilit] [PubMed]
- Kopito, R.B.; Levine, E. Durable Spatiotemporal Surveillance of Caenorhabditis elegans Response to Environmental Cues. Lab Chip 2014, 14, 764–770. [Google Scholar] [CrossRef] [Scilit] [PubMed]
- Lee, K.S.; Levine, E. A Microfluidic Platform for Longitudinal Imaging in Caenorhabditis elegans. J. Vis. Exp. 2018, 57348. [Google Scholar] [CrossRef] [Scilit] [PubMed]
- Wang, X.; Tang, L.; Xia, Y.; Hu, L.; Feng, X.; Du, W.; Liu, B.-F. Stress Response of Caenorhabditis elegans Induced by Space Crowding in a Micro-Column Array Chip. Integr. Biol. 2013, 5, 728–737. [Google Scholar] [CrossRef] [Scilit] [PubMed]
- Lebois, F.; Sauvage, P.; Py, C.; Cardoso, O.; Ladoux, B.; Hersen, P.; Di Meglio, J.-M. Locomotion Control of Caenorhabditis elegans through Confinement. Biophys. J. 2012, 102, 2791–2798. [Google Scholar] [CrossRef] [Scilit] [PubMed]
- Saberi-Bosari, S.; Huayta, J.; San-Miguel, A. A Microfluidic Platform for Lifelong High-Resolution and High-Throughput Imaging of Subtle Aging Phenotypes in C. elegans. Lab Chip 2018, 18, 3090–3100. [Google Scholar] [CrossRef] [Scilit] [PubMed]
- Faumont, S.; Rondeau, G.; Thiele, T.R.; Lawton, K.J.; E McCormick, K.; Sottile, M.; Griesbeck, O.; Heckscher, E.S.; Roberts, W.M.; Doe, C.Q.; et al. An Image-Free Opto-Mechanical System for Creating Virtual Environments and Imaging Neuronal Activity in Freely Moving Caenorhabditis elegans. PLoS ONE 2011, 6, e24666. [Google Scholar] [CrossRef] [Scilit] [PubMed]
- Nguyen, J.P.; Shipley, F.B.; Linder, A.N.; Plummer, G.S.; Liu, M.; Setru, S.U.; Shaevitz, J.W.; Leifer, A.M. Whole-Brain Calcium Imaging with Cellular Resolution in Freely Behaving Caenorhabditis elegans. Proc. Natl. Acad. Sci. USA 2016, 113, E1074–E1081. [Google Scholar] [CrossRef] [Scilit] [PubMed]
- Luke, C.J.; Niehaus, J.Z.; O’Reilly, L.P.; Watkins, S.C. Non-Microfluidic Methods for Imaging Live C. elegans. Methods 2014, 68, 542–547. [Google Scholar] [CrossRef] [Scilit] [PubMed]
- Manjarrez, J.R.; Mailler, R. Stress and Timing Associated with Caenorhabditis elegans Immobilization Methods. Heliyon 2020, 6, e04263. [Google Scholar] [CrossRef] [Scilit] [PubMed]
- Hwang, H.; Krajniak, J.; Matsunaga, Y.; Benian, G.M.; Lu, H. On-Demand Optical Immobilization of Caenorhabditis elegans for High-Resolution Imaging and Microinjection. Lab Chip 2014, 14, 3498–3501. [Google Scholar] [CrossRef] [Scilit] [PubMed]
- Kim, E.; Sun, L.; Gabel, C.V.; Fang-Yen, C. Long-Term Imaging of Caenorhabditis elegans Using Nanoparticle-Mediated Immobilization. PLoS ONE 2013, 8, e53419. [Google Scholar] [CrossRef] [Scilit] [PubMed]
- Levine, E.; Lee, K.S. Microfluidic Approaches for Caenorhabditis elegans Research. Anim. Cells Syst. 2020, 24, 311–320. [Google Scholar] [CrossRef] [Scilit] [PubMed]
- Dong, L.; Cornaglia, M.; Krishnamani, G.; Zhang, J.; Mouchiroud, L.; Lehnert, T.; Auwerx, J.; Gijs, M.A.M. Reversible and Long-Term Immobilization in a Hydrogel-Microbead Matrix for High-Resolution Imaging of Caenorhabditis elegans and Other Small Organisms. PLoS ONE 2018, 13, e0193989. [Google Scholar] [CrossRef] [Scilit] [PubMed]
- Burnett, K.; Edsinger, E.; Albrecht, D.R. Rapid and Gentle Hydrogel Encapsulation of Living Organisms Enables Long-Term Microscopy over Multiple Hours. Commun. Biol. 2018, 1, 73. [Google Scholar] [CrossRef] [Scilit] [PubMed]
- Ultralytics YOLO26—Ultralytics YOLO Docs. Available online: https://docs.ultralytics.com/models/yolo26/ (accessed on 8 March 2026).
- Herrmann, C.; Bowen, R.S.; Wadhwa, N.; Garg, R.; He, Q.; Barron, J.T.; Zabih, R. Learning to Autofocus. In Proceedings of the IEEE/CVF Conference on Computer Vision and Pattern Recognition (CVPR); 2020; pp. 2230–2239, Supplementary Material. Available online: https://openaccess.thecvf.com/content_CVPR_2020/html/Herrmann_Learning_to_Autofocus_CVPR_2020_paper.html (accessed on 13 October 2026).
- Leica Microsystems. DMi8 Inverted Microscope—Frequently Asked Questions: What Is Adaptive Focus Control? Available online: https://www.leica-microsystems.com/products/light-microscopes/p/dmi8/faq/ (accessed on 13 October 2026).
- Hahm, J.-H.; Kim, S.; DiLoreto, R.; Shi, C.; Lee, S.-J.V.; Murphy, C.T.; Nam, H.G. C. elegans Maximum Velocity Correlates with Healthspan and Is Maintained in Worms with an Insulin Receptor Mutation. Nat. Commun. 2015, 6, 8919. [Google Scholar] [CrossRef] [Scilit] [PubMed]
- Godini, R.; Handley, A.; Pocock, R. Transcription Factors That Control Behavior—Lessons From C. elegans. Front. Neurosci. 2021, 15, 745376. [Google Scholar] [CrossRef] [Scilit] [PubMed]
- Tsalik, E.L.; Hobert, O. Functional Mapping of Neurons That Control Locomotory Behavior in Caenorhabditis elegans. J. Neurobiol. 2003, 56, 178–197. [Google Scholar] [CrossRef] [Scilit] [PubMed]
- Donnelly, J.L.; Clark, C.M.; Leifer, A.M.; Pirri, J.K.; Haburcak, M.; Francis, M.M.; Samuel, A.D.T.; Alkema, M.J. Monoaminergic Orchestration of Motor Programs in a Complex C. elegans Behavior. PLoS Biol. 2013, 11, e1001529. [Google Scholar] [CrossRef] [Scilit] [PubMed]
Disclaimer/Publisher’s Note: The statements, opinions and data contained in all publications are solely those of the individual author(s) and contributor(s) and not of MDPI and/or the editor(s). MDPI and/or the editor(s) disclaim responsibility for any injury to people or property resulting from any ideas, methods, instructions or products referred to in the content. |
© 2026 by the authors. Licensee MDPI, Basel, Switzerland. This article is an open access article distributed under the terms and conditions of the Creative Commons Attribution (CC BY) license.