


Abstract
Adequate understanding of tissue optical characteristics is the foundation of laser-based diagnostics and phototherapy. This paper introduces an integrated experimental-computational-engineering framework for laser-based characterization of biological tissues, bridging the gap between biophysical measurement and medical device design. Ex vivo tissues, including chicken skin (native, boiled, dry), chicken liver (native, coagulated), bovine muscle, and rabbit skull, were measured at clinically relevant wavelengths (635, 650, and 808 nm) using both integrating sphere and distant-detector configurations. Parameters were extracted using the Kubelka–Munk model and the Beer–Lambert law. The Diffusion Approximation, which was solved using the Finite Element Method in COMSOL Multiphysics, was used to generate high-resolution fluence rate distributions. Typical engineering design criteria for diffuse reflectance probe systems, such as optimal source–detector separation, fiber numerical aperture, operating wavelength selection, and an exploratory ex vivo tissue-state index (CDI) whose in vivo applicability remains to be established, are subsequently obtained from the resulting optical property database. The proposed method shows how the hardware design of non-invasive biomedical sensing devices is influenced directly and optimized by a systematic optical characterization workflow, which minimizes empirical trial-and-error in prototype development. This multidisciplinary approach offers a consistent methodology that may be used with image-guided surgical equipment, phototherapy planning systems, and optical biopsy probes.
1. Introduction
Biophotonics approaches have established a disruptive perspective in current biomedical science, enabling minimally invasive diagnostic screening, therapeutic monitoring, and real-time surgical guidance [1,2]. Advanced optical modalities across the clinical spectrum, from therapeutic interventions such as photodynamic therapy (PDT) and precision laser ablation to diagnostic frameworks including optical coherence tomography (OCT) and diffuse optical tomography (DOT), depend fundamentally on predictable photon transport within heterogeneous biological media [3,4,5]. Three wavelength-dependent optical coefficients determine the spatial distribution of optical energy, target sensitivity, and diagnostic penetration depth across all such modalities: the absorption coefficient (μa), the scattering coefficient (μs), and the scattering anisotropy factor (g). Together, these fundamental parameters control the spatial fluence rate inside tissue, define the optical sampling volume, and influence the responsiveness of diffuse reflectance signals to structural and physiological changes [6].
Optical attenuation and phase delay are microscopic indicators of underlying cellular architecture and metabolic composition. Energy absorption profiles are influenced by chromophore distributions (such as those of hemoglobin, melanin, water, and lipids), while scattering interaction is driven by nanoscale refractive index mismatches between cell membranes, organelles, and extracellular matrix components [7]. As a result, precise understanding of these parameter distributions determines the spatial deposition of light energy, the physical depth of photon penetration, and the effective interrogation volume sampled by optical detectors [8].
Robust parameter determination is a critical requirement rather than a theoretical improvement in quantitative clinical workflows: therapeutic planning systems for laser ablation and PDT rely on predictive light transport models to ensure localized cytotoxic energy delivery while preventing irreversible collateral damage to adjacent healthy tissue; the functional DOT algorithms require precise absorption and scattering distributions to reconstruct spatial maps of vascular oxygenation [9]. Moreover, pathological states and physical perturbations such as thermal coagulation, inflammation, and malignant transformation cause systemic morphological and biochemical changes that alter tissue optical signatures, forming the physical foundation for non-invasive “optical biopsy” state classification [10].
Two different indirect measuring techniques have historically been used in experimental characterization to meet the need for precise optical property determination: distant-detector (DD) spatially resolved reflectance setups and double integrating-sphere (IS) systems. The gold-standard benchtop configuration for ex vivo characterization is the double integrating-sphere system, which allows for the simultaneous measurement of total transmittance (Td) and total diffuse reflectance (Rd). Inverse mathematical solvers, such as the Kubelka–Munk model, Inverse Adding-Doubling methods, and the Diffusion Approximation to the Radiative Transfer Equation, are then used to extract bulk optical properties (μa, μs) [11,12]. The main advantage of IS platforms is their exceptional precision for overall parameter measurement within homogeneous sample geometries [13,14].
On the other hand, spatially resolved diffuse reflectance profiles Rd(ρ) are recorded as a continuous function of source–detector distance (ρ) using the distant-detector approach [15]. These spatially resolved profiles provide unique “optical fingerprints” that are very sensitive to disease-induced microstructural changes by capturing minute differences in photon pathlength distributions [14]. DD setups replicate the physical lighting and collecting geometry of fiber-optic probes, providing significant advantages for quick, pattern-based tissue identification, whereas IS modalities are superior in global parameter extraction accuracy.
The current literature has a significant methodological flaw: the great majority of studies use a single measurement modality in isolation without cross-modality validation across identical tissue states, despite the technical maturity of isolated IS and DD instrumentation and sophisticated computational modeling tools such as Monte Carlo (MC) simulations and Finite Element Method (FEM) solvers. A considerable translational gap exists between basic optical property tables and practical engineering specifications for clinical fiber-probe design as a result of this disjointed characterization paradigm.
Additionally, well-established theoretical limitations that are often disregarded in property collections hinder current inversion systems. Conventional inverse models rely on simplifying assumptions that break down near physical regime boundaries, in highly absorbing media, or at sub-millimeter source–detector separations. Examples of these assumptions include diffuse illumination fields in Kubelka–Munk theory and diffusion validity conditions (μs′ ≫ μa and ρ ≫ ltr). Estimated optical coefficients are greatly influenced when these mathematical inversions are applied outside of their validity regions. Inverse transport models are infrequently used to propagate experimental errors resulting from spherical wall losses, detector non-linearities, stray light, and specimen thickness fluctuations in order to establish variance constraints on derived parameters. Consequently, probe designers lack quantitative guidelines about the propagation of experimental parameter uncertainties into hardware design parameters, including tissue discrimination limits, source–detector separation (ρ), fiber numerical aperture (NA), core diameter, and state-dependent spectral pairs.
To bridge the gap between ex vivo property compilations and deployable optical probe requirements, a consistent design technique is necessary. Such a framework must integrate paired multi-modal (IS and DD) datasets across progressive physiological states, perform rigorous theoretical validity screening prior to inversion, validate numerical fluence models against experimental reflectance, propagate measurement noise into parameter uncertainties, and automatically extract concrete probe design rules.
Upon a series of previous experimental studies [12,13,14,15,16,17,18], the major contributions of our work are as follows:
- The TissOP-Probe framework is developed, which consists of four stages (multi-modal measurement, inverse parameter extraction, forward fluence modeling, and design-rule extraction) that take into account each model’s validity limitations.
- A consistent ex vivo dataset of 15 tissue–wavelength–method combinations is reported, with mean ± standard deviation, from integrating-sphere and distant-detector measurements on identical tissue states.
- The conditions for applying the Kubelka–Munk model and the diffusion approximation are stated, and the FEM fluence model is documented (geometry, boundary conditions, mesh) and used for qualitative comparison of tissue states; quantitative validation is identified as future work.
- An exploratory coagulation index and probe design parameters (ρ, wavelength selection, NA and core diameter, and geometry) are derived and compared with published values, and the limits of what ex vivo data can and cannot support are stated.
2. Materials and Methods
2.1. The Proposed TissOP-Probe Framework
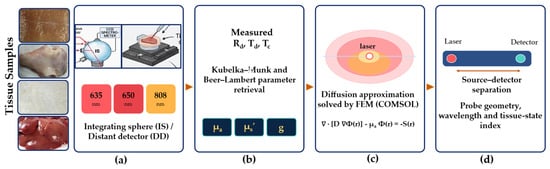
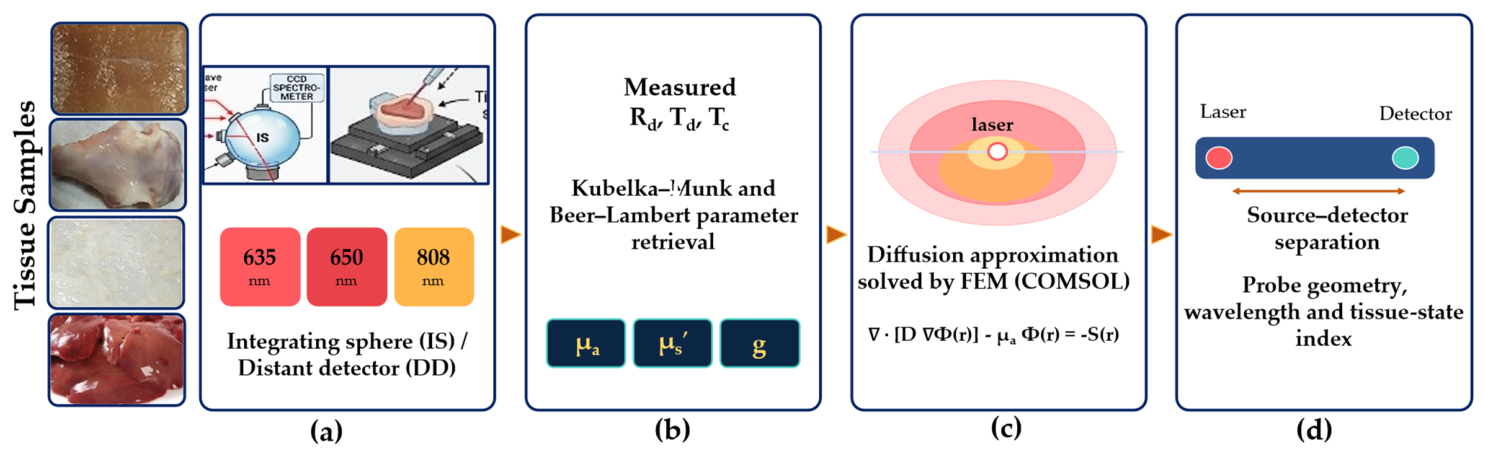
In four steps, TissOP-Probe converts measured tissue optical characteristics into probe design specifications (Figure 1). Stage 1 (measurement): At 635, 650, and 808 nm, IS (Rd, Td, Tc) and DD (Rd(ρ)) measurements are obtained on identical tissue conditions. Stage 2 (parameters extraction): The K–M two-flux model and Beer–Lambert law are used to extract (μa, μs, g); the inverse model is only applied to IS data. Stage 3 (computational modeling): each instance is screened with validity indicators (μa/μs′, ρ/ltr) and the obtained coefficients are sent to a FEM solver of the diffusion equation to create fluence maps. Finally, stage 4 provides the design-rule extraction.
Figure 1.
The integrated workflow for laser-based tissue characterization combines experimental measurements: (a) Optical measurement configurations (integrating sphere (IS) and distant detector (DD) at 635, 650, and 808 nm), (b) Optical parameters extraction, (c) Computational fluence modeling (diffusion approximation solved by FEM in COMSOL Multiphysics 5.4), and (d) Engineering design for probes (source–detector separation, probe geometry, wavelength, and tissue-state index).
2.2. Tissue Samples and Preparation
Ex vivo tissue specimens were selected to represent a broad range of optical properties across soft and hard biological media:
- Soft tissues: chicken breast skin (native, boiled at ~100 °C for 3 min, and air-dried), chicken liver (native and thermally coagulated at ~100 °C for 5 min), and bovine muscle.
- Hard tissue: rabbit skull bone.
Sample thickness was maintained at 1–2 mm and measured with a calibrated digital micrometer. All specimens were processed within two hours of slaughter and stored on ice to preserve optical integrity. Altered tissue states (boiled, dry, coagulated) were prepared to model clinically relevant conditions including thermal coagulation during laser surgery, dehydration, and progressive tissue pathology.
2.3. Experimental Measurement Systems
2.3.1. Integrating Sphere (IS) Configuration
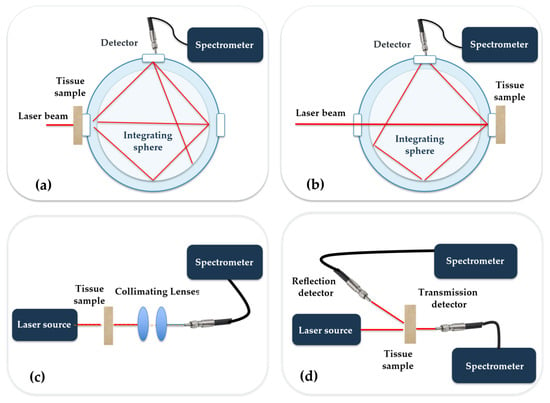
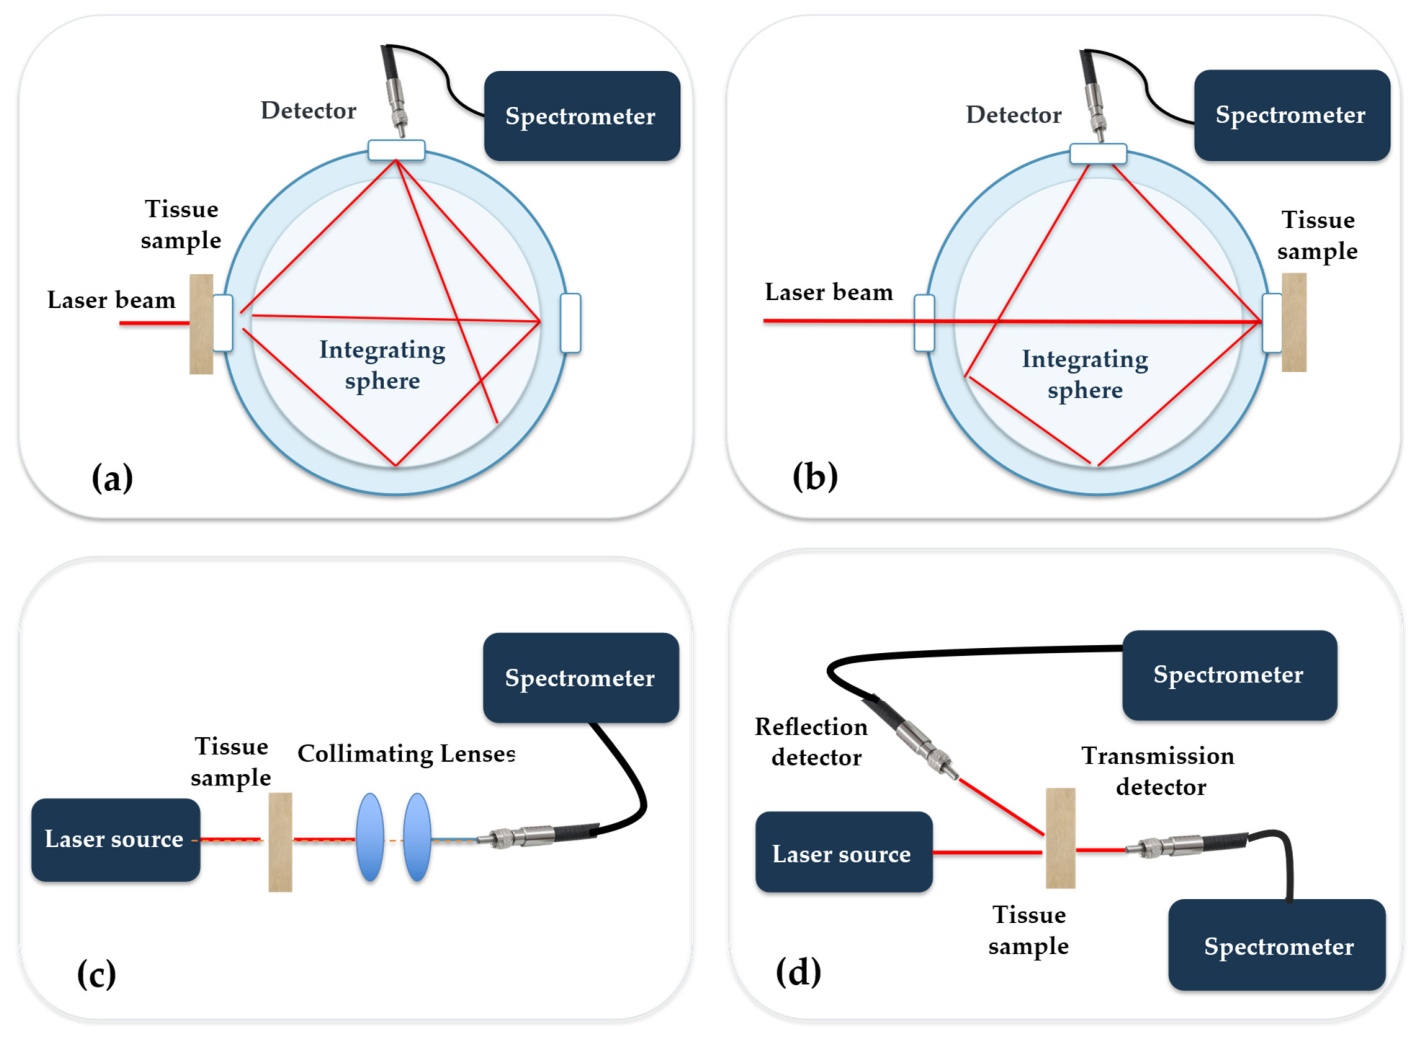
The integrating sphere system consisted of a single barium-sulphate-coated sphere (McPherson Inc., Chelmsford, MA, USA) with an entrance port for collimated laser illumination and a detection port connected to a CCD spectrometer (Toshiba TCD1304AP Linear CCD array, STDFSM, Touptek Photonics Co., Ltd., Hangzhou, China). Total diffuse reflectance (Rd) was measured by inserting the sample at the sphere’s reflectance port and using a standard barium sulphate reference, while total transmittance (Td) was determined by placing the sample in the transmittance port (see Figure 2a,b). To calculate the total attenuation coefficient, the collimated transmittance (Tc) was measured using a separate lens-collimated system. Illumination was provided by continuous-wave diode lasers with wavelengths of 635 nm, 650 nm, and 808 nm.
Figure 2.
Schematic for the integrating-Sphere Optical Measurement Configuration for (a) total transmission, (b) total diffuse reflection, and direct optical spectroscopy via distant-detector configuration for (c) collimated transmission, (d) diffuse reflection and transmission.
2.3.2. Distant-Detector (DD) Configuration
A single optical fiber (core diameter: 200 μm, NA: 0.22) mounted on a motorized micrometer translation stage (Zaber Technologies Inc., Vancouver, BC, Canada, resolution: 1 μm) was used in the distant-detector system. The fiber collected spatially resolved diffuse reflectance profiles Rd(r) by radially scanning the tissue surface from the source in increments of 1 mm up to 20 mm (see Figure 2c,d). With an integration duration of 100–500 ms tailored for each tissue, both systems employed the same laser sources and detecting electronics. Comprehensive descriptions of the experimental techniques are given in earlier articles [12,13,14,17,19] in which the same methods were extensively validated. The experimental settings are summarized in Table 1.
Table 1.
Summary of the experimental settings employed.
2.4. Optical Parameter Extraction: Kubelka–Munk Model
The K–M two-flux model is based on a laterally infinite homogeneous slab, diffuse, isotropic light, and the absence of internal border reflections. It is most effective in scattering-dominated media and degrades as illumination is collimated or absorption approaches scattering [20]. Measured Rd, Td, and Tc were processed through the K–M two-flux model to retrieve the intrinsic optical parameters absorption coefficient (μa) and reduced scattering coefficient (μs′ = μs(1 − g))
First, the K–M absorption (AKM) and scattering (SKM) parameters were computed from measured Rd and Td using the classical two-flux hyperbolic inversions:
Second, the total attenuation coefficient (μt) was independently determined from collimated transmittance (Tc) using the Beer–Lambert law:
To transform two-flux parameters (AKM, SKM) into intrinsic transport coefficients (μa, μs, g), the relationships derived by van Gemert and Welch were applied [21]:
Combining these equations yields a closed-form, deterministic system that is solved algebraically for each tissue–wavelength pair [22]:
where d is sample thickness. This system of equations was solved simultaneously to yield (μa, μs, g) for each tissue–wavelength combination.
2.5. Computational Fluence Modeling
The Diffusion Approximation (DA) to the Radiative Transfer Equation (RTE) was used simply as a forward numerical solver in COMSOL Multiphysics 5.4 to calculate spatial light energy deposition, replacing the inversion process [23,24]. The steady-state diffusion equation was solved in a 2D axisymmetric domain using the intrinsic properties (μa, μs) retrieved in Section 2.4 as physical domain inputs employing the coefficient-form (Helmholtz) PDE, with Φ as the dependent variable, absorption a = μa, and diffusion coefficient c = D = 1/[3(μa + μs′)]. A point source at the center of a 3 × 2 cm 2D geometry represents the laser beam. Consequently, the steady-state diffusion equation was solved in a 2D axisymmetric domain [25]:
∇·[D∇Φ(r)] − μa Φ(r) = −S(r),
A free triangular mesh was used, graded toward the source (element edge ≈ 0.7 mm in the far field, down to the order of 0.05 mm at the source). A partial-current (Robin) boundary condition, D ∂Φ/∂n = −qΦ with q = 1/(2A), was applied on the outer boundaries, where A follows from the effective internal reflection coefficient Reff determined by the tissue–air refractive-index mismatch (ntissue ≈ 1.4):
It is important to highlight here that the diffusion approximation is the P1 spherical harmonics expansion of the RTE, assuming that photon scattering is approximately isotropic after numerous impacts. It requires μs′ ≫ μa and observation distances ρ ≫ ltr. However, it fails near sources, borders, and in highly absorbing medium [2]. Consequently, DA simulations in the present study optimize probe sensitivity by mapping macro-scale internal fluence rates (Φ(r,z)) rather than recovering optical properties. In highly absorbing tissues (such as coagulated liver), DA solutions act as near-field approximations, emphasizing the importance of combining IS inversion and forward numerical modeling.
2.6. Engineering Design Translation Methodology
A novel contribution of this work is the systematic translation of measured optical parameters into engineering specifications for diffuse reflectance probes. For each tissue class and wavelength, the following design rules, derived from photon transport theory and the COMSOL fluence maps, were applied:
- Source–detector separation (ρ): optimized as a function of the reduced scattering coefficient μs′ to maximize signal sensitivity at the target interrogation depth.
- Wavelength selection: guided by the chromophore-specific absorption spectra of hemoglobin, water, and melanin within the measured μa database.
- Fiber numerical aperture (NA) and core diameter: selected based on the angular scattering distribution characterized by the anisotropy factor g.
- Coagulation Detection Index (CDI): defined as the ratio of μa (coagulated) to μa (native) at 635 nm, providing a dimensionless threshold for real-time thermal-damage monitoring.
2.7. Uncertainty Analysis and Error Propagation
Total experimental uncertainty was modeled by integrating inter-sample biological variability (σbio) and instrumental measurement noise (σinst) across N = 5 independent specimens per tissue condition in order to evaluate the reliability of derived optical parameters. Repeated measurements (n = 10) on calibrated optical standards (BaSO4 diffuse reflection standard and neutral density transmission filters) were used to assess instrumental uncertainty. Reflectance δRd/Rd = 1.2%, transmittance δTd/Td = 1.5%, collimated transmittance δTc/Tc = 1.8%, and specimen thickness uncertainty δd = 0.02 mm were the relative variances in the raw signals.
The propagation of instrumental uncertainties into derived optical coefficients (μa, μs, g) was calculated using first-order Taylor series error propagation through the Beer–Lambert and Kubelka–Munk equations:
Total parameter variance was expressed as . All final optical parameters are reported as Mean ± SD. Across all soft and hard tissue groups, the coefficient of variation (CV = σtotal/Mean) ranged between 4.2% and 11.8%, confirming the stability and reproducibility of the experimental characterization workflow.
3. Experimental Results and Analysis
3.1. Optical Parameter Database
The optical parameters retrieved from the K-M model revealed significant variations across tissues, conditions, and wavelengths. A synthesized summary of key findings is presented in Table 2. The final column extends the traditional data presentation by including a direct engineering design implication derived from each measurement, linking biophysics to device design. Compared to muscle, the liver exhibited greater absorption because of its high blood content. Strong optical barriers were created by the significant absorption and scattering of skull tissue. Because of protein denaturation and changes in scatterer size, boiling (coagulation) caused a significant rise in µa and a decrease in g. Due to structural alterations, dry skin exhibited a huge rise in µs and g and a significant decrease in µa (water loss). While absorption differences were chromophore-specific, the lowered scattering coefficient was usually larger at 808 nm than at 650 nm across all tissues.
Table 2.
Summary of optical parameters for various tissues with engineering design implications.
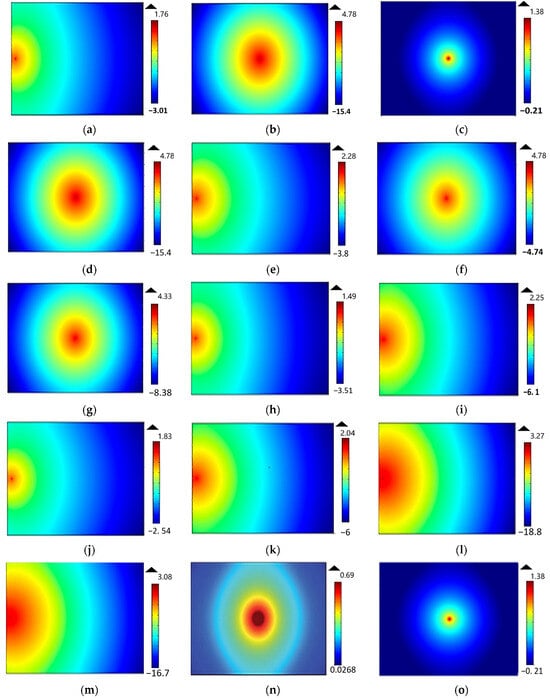
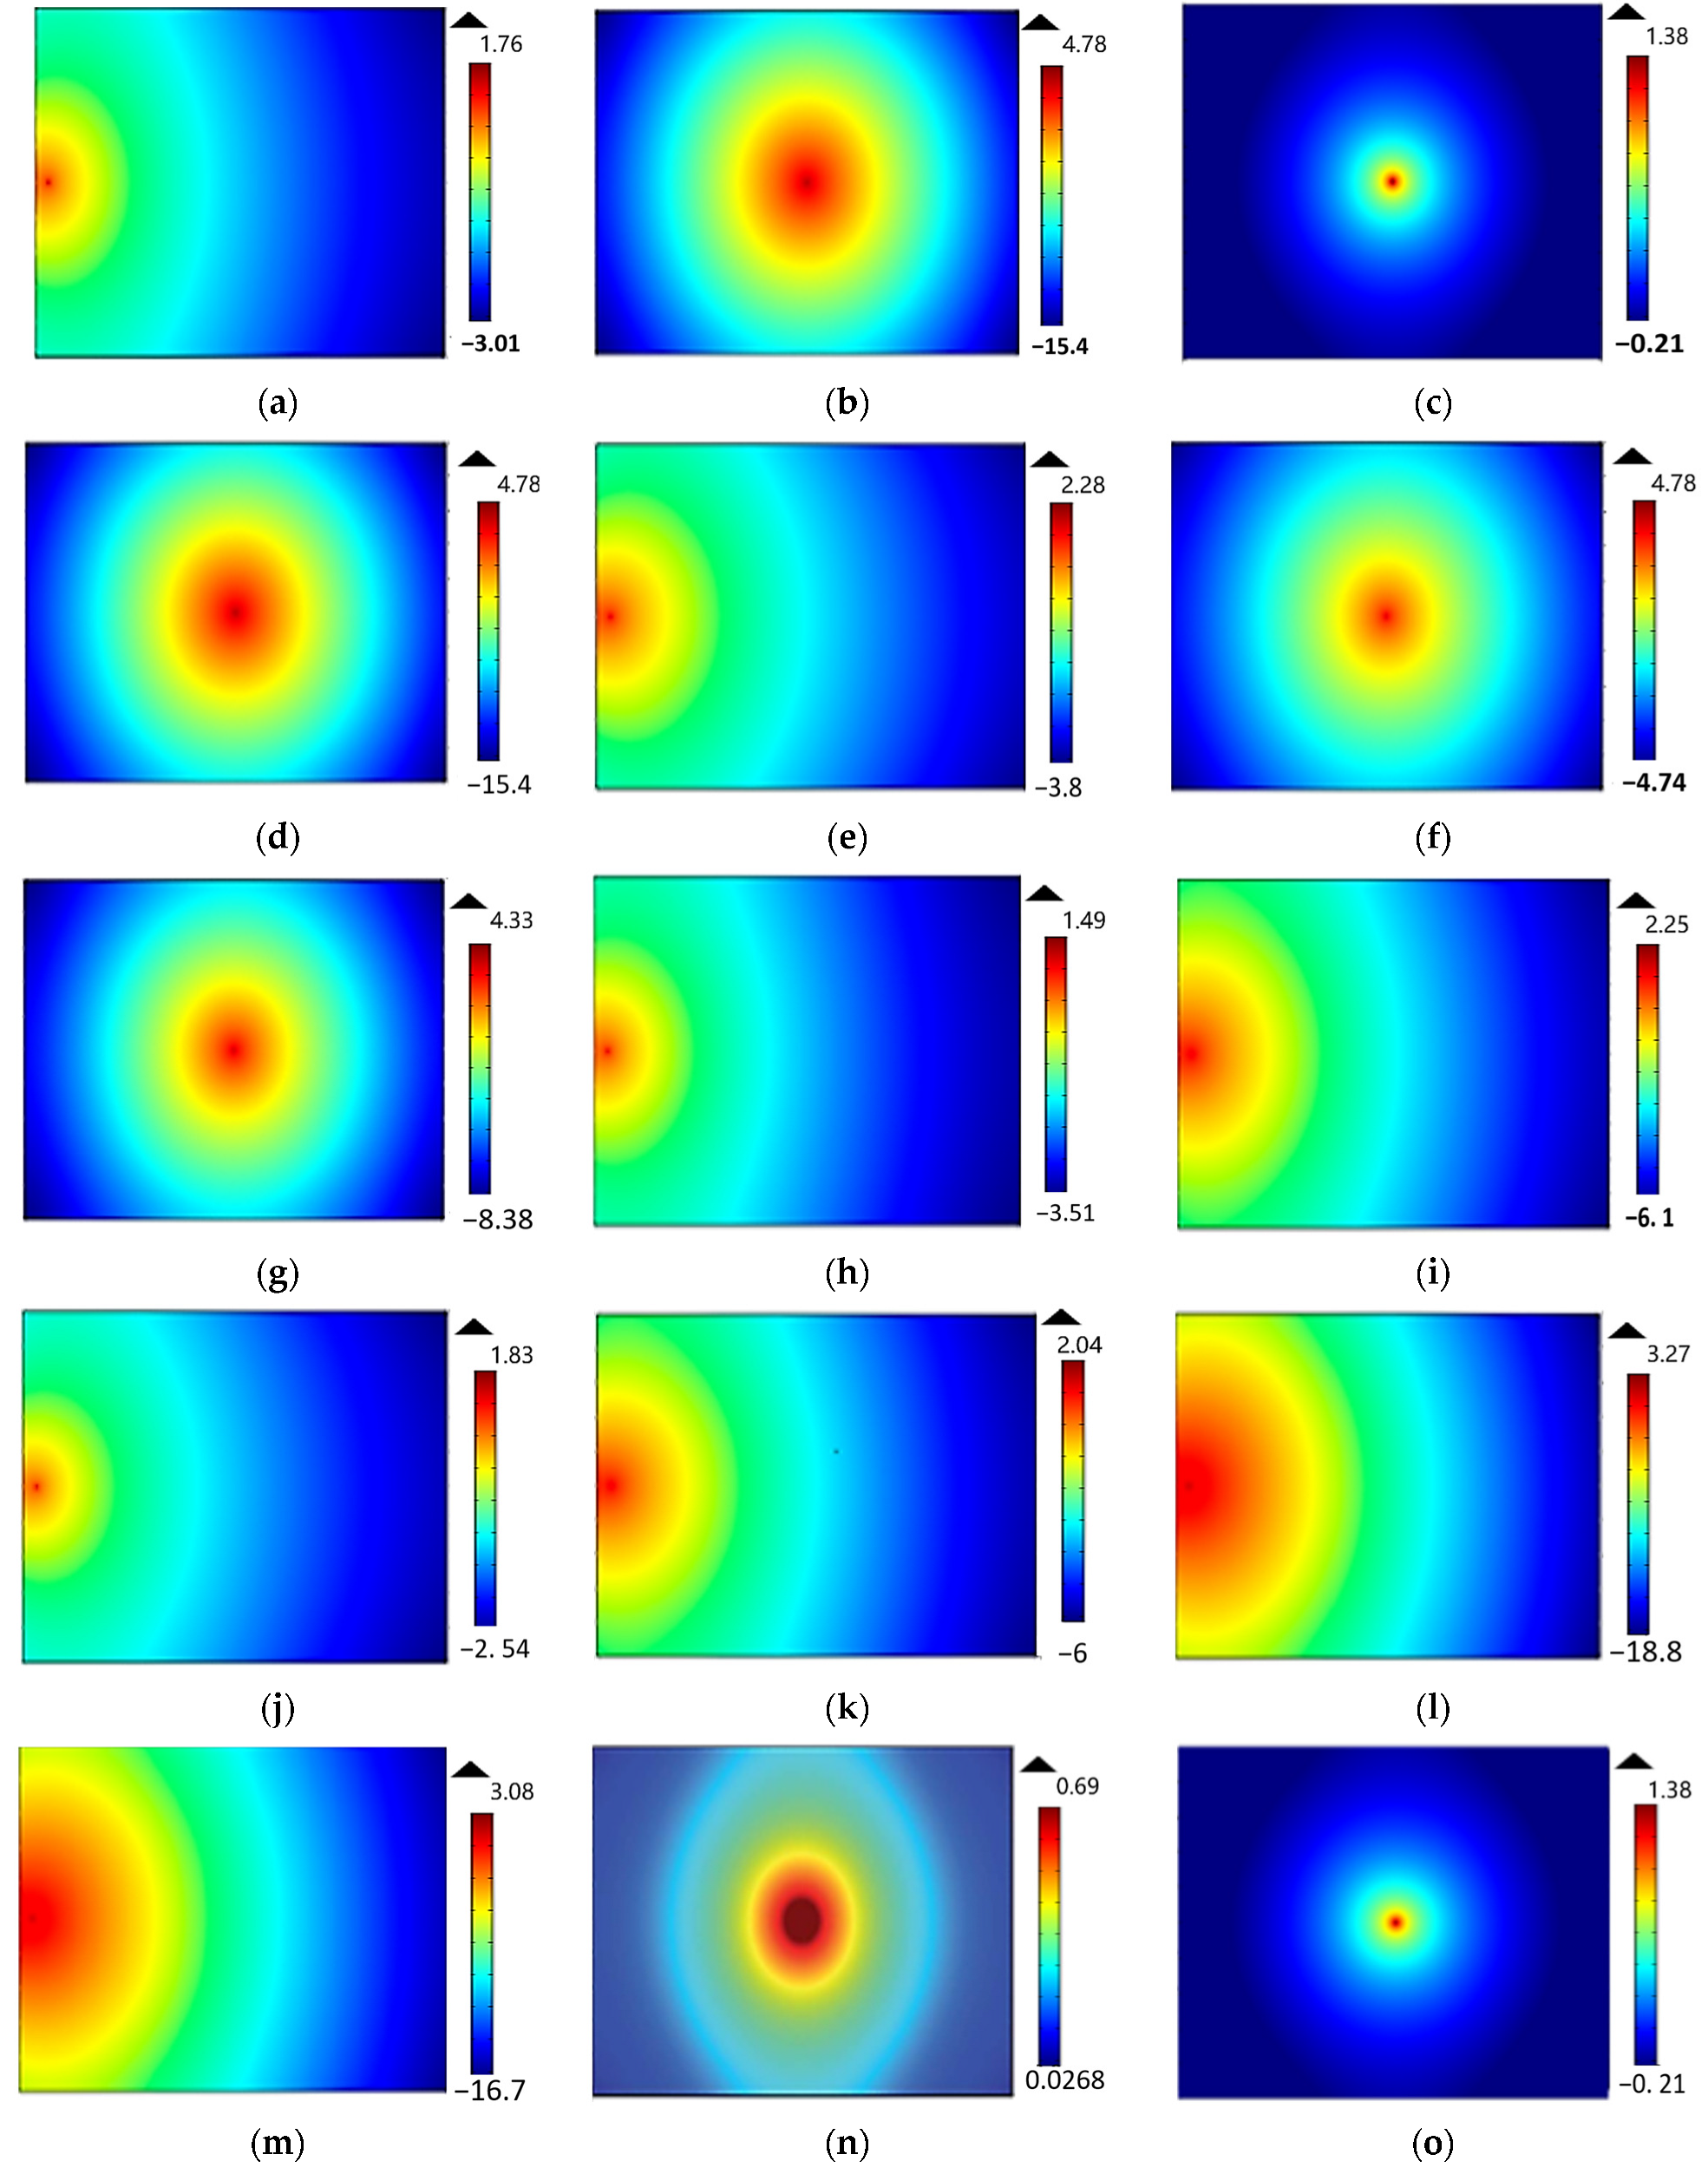
Results of COMSOL simulations revealed wavelength-dependent penetration depths: deeper penetration at 808 nm, stronger surface confinement at 650 nm. Coagulated and boiled tissues exhibited reduced fluence spread [25], highlighting potential for differentiating pathological states (see Figure 3).
Figure 3.
The fluence rate distributions at the outer surface of the studied tissue samples: (a) native chicken skin at 635 nm via DD; (b) native chicken skin at 650 nm via IS; (c) native rabbit skin at 650 nm via IS; (d) native chicken skin at 808 nm via IS; (e) native chicken skin at 808 nm via DD; (f) dry chicken skin at 650 nm via IS; (g) dry chicken skin at 808 nm via IS; (h) boiled chicken skin at 635 nm via DD; (i) boiled chicken skin at 808 nm via DD; (j) native chicken liver at 635 nm via DD; (k) native chicken liver at 808 nm via DD; (l) coagulated chicken liver at 635 nm via DD; (m) coagulated chicken liver at 808 nm via DD; (n) bovine muscle at 650 nm via IS; (o) rabbit skull at 650 nm via IS.
3.2. Key Optical Trends and Their Engineering Significance
3.2.1. Wavelength-Dependent Penetration Depth
COMSOL fluence maps confirmed that the NIR wavelength (808 nm) achieves significantly deeper tissue penetration than 635/650 nm, owing to the lower scattering coefficient at longer wavelengths—a trend consistent across all soft tissues tested. For skin, μs dropped from ~16 cm−1 at 650 nm to values that yield 1.5–2× greater penetration depths at 808 nm. This directly justifies the selection of 808 nm for transcranial photobiomodulation applications and sub-dermal tissue sensing, while 635 nm is preferred for surface-confined therapeutic and diagnostic applications such as PDT of superficial lesions.
3.2.2. Tissue-State Discrimination via Optical Fingerprinting
The distant-detector spatial reflectance profiles provide tissue-specific optical fingerprints. Coagulated liver exhibited a 17-fold increase in μa at 635 nm (1.41 → 24.02 cm−1) compared to native liver—the largest single-parameter change observed in this study. This dramatic shift, combined with a concurrent increase in μs (24.78 → 46.35 cm−1), produces a measurably narrower and brighter near-field reflectance profile that can serve as a binary trigger in a real-time laser surgical feedback system. Similarly, dry skin exhibited a 3-fold increase in μs relative to native skin, while μa decreased substantially, reflecting water loss from the tissue matrix—a finding with direct relevance to wound assessment and hydration monitoring devices.
3.2.3. Fluence Distribution Maps and Probe Geometry
FEM-computed fluence rate distributions revealed that increasing μa confines the photon energy closer to the surface, reducing the effective sampling volume of any overlying probe. Conversely, tissues with high scattering (skull, dry skin) exhibit broader lateral fluence spread. These observations directly motivated the probe geometry recommendations in Table 2: circular fiber arrays are preferred for high-anisotropy (g > 0.8) tissues to capture the forward-peaked scattering lobe, while linear arrays suit lower-g tissues with more diffuse scatter patterns.
3.3. Engineering Design Guidelines for Diffuse Reflectance Probe Systems
Table 3 translates the optical property measurements into six concrete engineering design parameters for diffuse reflectance probe development. This establishes the primary engineering contribution of the paper.
Table 3.
Engineering design parameters derived from optical property measurements.
3.3.1. Coagulation Detection Index (CDI)
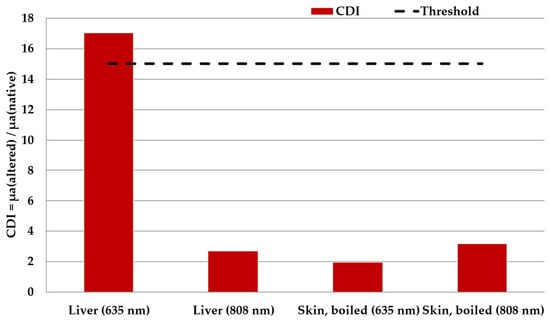
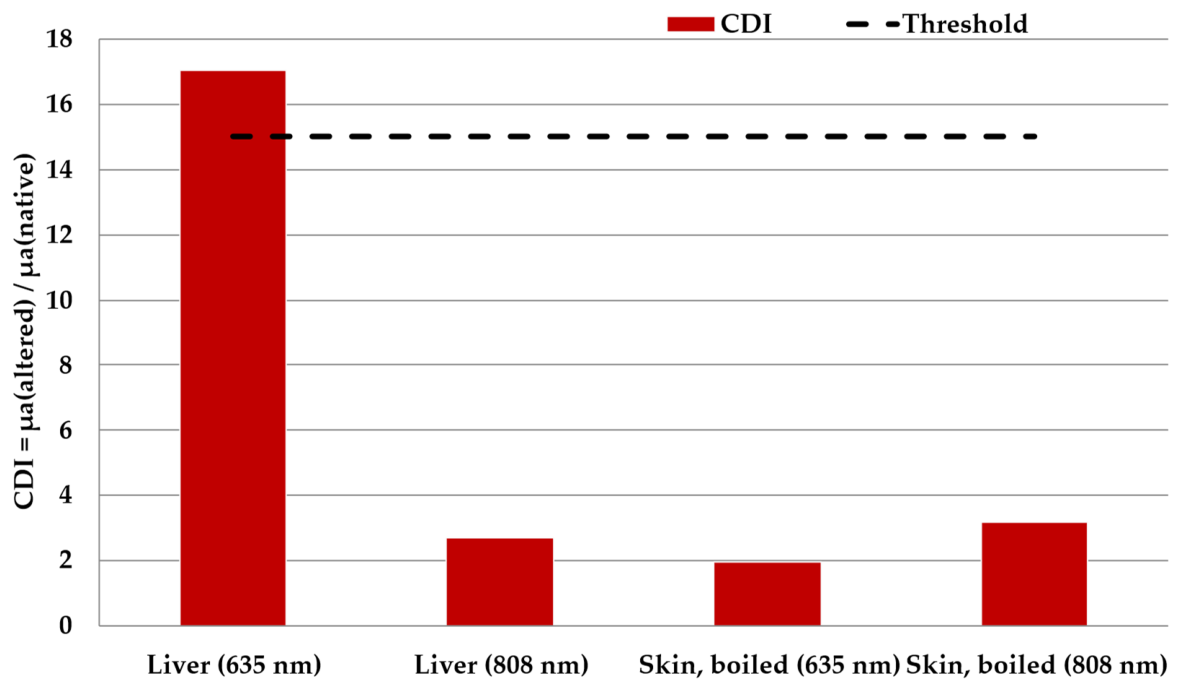
The CDI is defined as the ratio of μa measured post-coagulation to μa measured in native tissue at 635 nm. Based on the present measurements, coagulated liver yields CDI = 24.02/1.41 ≈ 17. A detection threshold of CDI > 15 is proposed as a reliable indicator of irreversible thermal coagulation as shown in Figure 4. This index could, after in vivo validation, be explored in a dual-channel fiber optic system embedded in a laser surgical handpiece to provide real-time coagulation confirmation without interrupting the surgical workflow—a functionality that is directly enabled by the quantitative optical database established in this study.
Figure 4.
Coagulation Detection Index by tissue and wavelength.
3.3.2. Wavelength Multiplexing Strategy
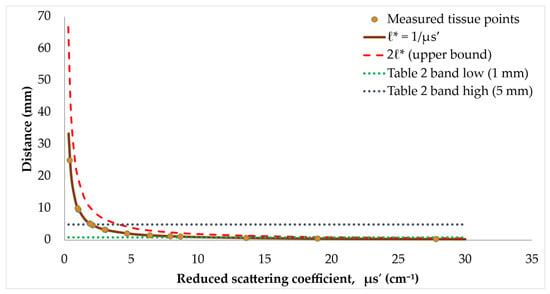
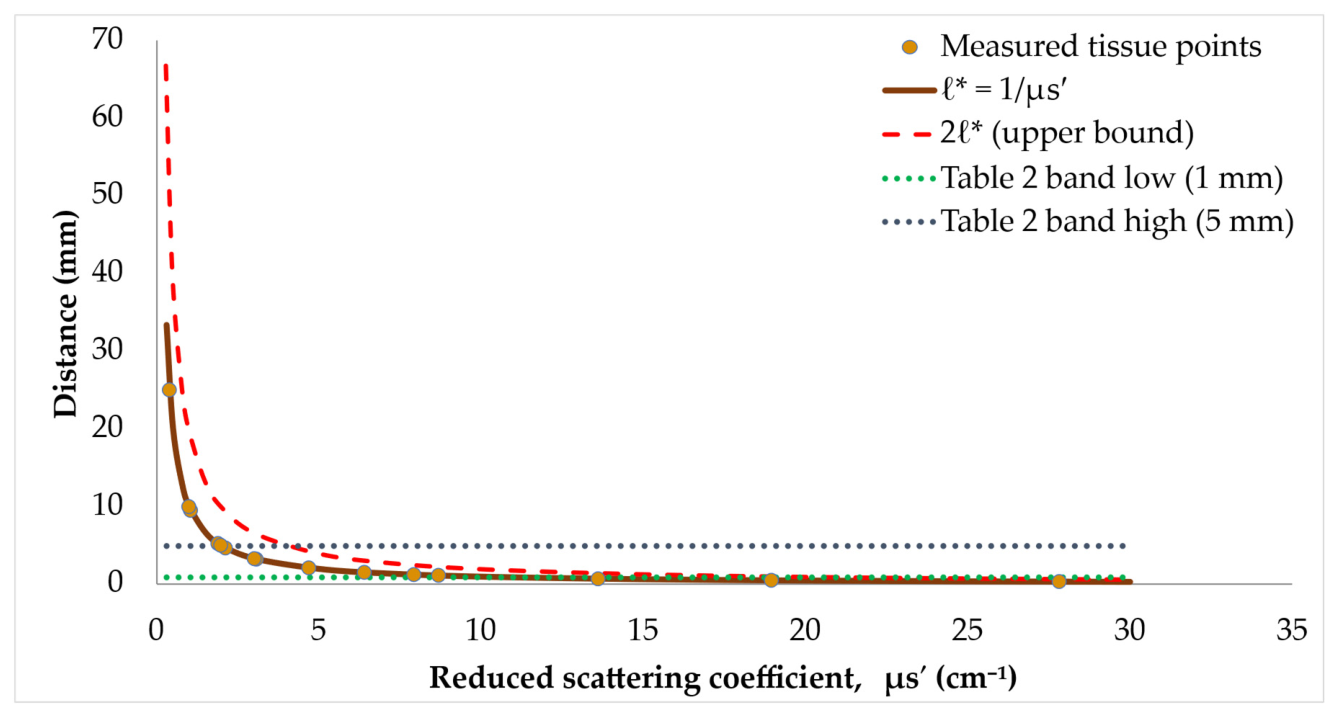
The relationship between source–detector separation and the reduced scattering coefficient is the most critical parameter for diffuse reflectance probe design. Figure 5 illustrates a design window for the optimal source–detector separation. The measured data points are plotted against the theoretical transport mean free path. The shaded band represents the recommended design window (1–5 mm) derived from the experimental measurements. Tissues with high scattering require shorter separation due to rapid signal attenuation.
Figure 5.
Source–Detector Separation Design Window vs. μs′.
The parallel availability of 635 nm and 808 nm data for several tissues enables a wavelength-ratiometric approach. The ratio μa(635)/μa(808) is sensitive to hemoglobin oxygenation state, since oxyhemoglobin and deoxyhemoglobin have distinct absorption spectra in this range. A portable dual-wavelength probe system using the source–detector separations specified in Table 2 could therefore perform simultaneous tissue-state classification and oxygenation mapping without requiring full spectroscopic capability—reducing system cost and complexity.
4. Discussion
4.1. Comparative Validation with Literature
To validate the accuracy and consistency of our characterization framework, the extracted optical coefficients (μa, μs, g) were benchmarked against the reported literature values for soft and hard tissues in the red and NIR spectral windows. For native skin at 635–650 nm, the measured absorption (μa = 2.54–4.91 cm−1) and reduced scattering (μs′ = 3.24–6.57 cm−1) align closely with reported ranges by Jacques [6] (μa ≈ 2.0–5.0 cm−1, μs′ ≈ 5.0–10.0 cm−1) and Bashkatov et al. [7]. The observed 2× increase in μa upon boiling (2.54 → 5.00 cm−1) agrees with thermal denaturation studies by Adams et al. [27] and Iorizzo et al. [28], who revealed that thermal cross-linking of the skin collagen promotes structural absorption and scatterer density. For dry skin, the dramatic increase in scattering (μs rising from 16.42 to 39.61 cm−1) reflects collagen fiber compaction and the loss of interstitial water matching, consistent with the dehydration dynamics reported by Beek et al. [29].
The baseline native liver properties at 635 nm (μa = 1.41 cm−1, μs = 24.78 cm−1) are consistent with ex vivo values provided by Ritz et al. [30] (μa ≈ 1.2–1.8 cm−1, μs ≈ 20–28 cm−1) and Hamdy et al. [30]. Thermal coagulation induced a 17-fold increase in μa (to 24.02 cm−1) and a 1.9-fold increase in μs (to 46.35 cm−1). Hemoglobin chromophore oxidation, cellular membrane rupture, and protein aggregation that produces a high density of nanoscale scatterers are the root causes of this sharp increase, which is well-documented in the thermal therapy literature [8,28,31,32,33]. Moreover, the extracted properties for bovine skeletal muscle at 650 nm (μa = 0.30 cm−1, μs = 10.02 cm−1, g = 0.90) show excellent agreement with values published by Van Beers et al. [34] (μa ≈ 0.25–0.40 cm−1, μs′ ≈0.8–1.2 cm−1) and Farrell et al. [35]. The high anisotropy factor (g = 0.90) confirms strong forward scattering dictated by aligned myofilament structures.
For cortical bone (Rabbit Skull) at 650 nm, the measured parameters (μa = 5.91 cm−1, μs = 19.81 cm−1, g = 0.90) agree in order of magnitude with cranial tissue compilations by Firbank et al. [36] (μa ≈ 0.4–0.6 mm−1, μs′ ≈ 1.5–2.5 mm−1). However, the minor differences in absolute scattering coefficients are attributable to specimen thickness variations (1–2 mm cortical plates vs. thick cranial vault samples) and to mineral density differences across animal models. Accordingly, this quantitative alignment across all four tissue classes demonstrates that the multi-modal characterization framework generates reliable, physically sound parameters for use in downstream fiber-probe design procedures.
4.2. Advantages
The results confirm the clinical utility of the 808 nm wavelength for deep tissue interrogation. The significantly lower scattering coefficient at 808 nm compared to 635/650 nm translates to 1.5–2× greater penetration depth across all soft tissues tested. This finding is consistent with the classical understanding of the “optical window” (650–950 nm), where absorption by hemoglobin and water is minimal [37]. From a device design perspective, the data justify dual-wavelength systems that combine 635 nm (for surface-confined applications like PDT monitoring) and 808 nm (for sub-dermal sensing). The ratio μa(635)/μa(808) provides a wavelength-ratiometric index that is sensitive to hemoglobin oxygenation state while being relatively insensitive to scattering variations. This ratiometric approach is particularly valuable for clinical translation because it reduces the influence of probe-tissue contact pressure and other confounding variables [38].
The COMSOL fluence maps (Figure 3) provide direct visualization of photon energy deposition patterns. For tissues with high anisotropy (g > 0.8)—such as rabbit skin (g = 0.9) and bovine muscle (g = 0.9)—the fluence is concentrated in the forward direction, suggesting that circular fiber arrays would be optimal for collecting the forward-peaked scattering lobe. Conversely, for tissues with lower g values (e.g., coagulated liver, g = 0.4), the scattering is more isotropic, and linear arrays may be equally effective while offering simpler fabrication. The source–detector separation (ρ) optimization presented in Table 2 (1–5 mm range) is consistent with the theoretical predictions of Farrell et al. [35], who derived that optimal separation should be approximately 1–2 transport mean free paths (l* = 1/μs′). For most tissues in this study, μs′ ranges from 1 to 13 cm−1, yielding l* = 0.77 − 10 mm. The recommended ρ range of 1–5 mm therefore represents a practical compromise that balances signal intensity with interrogation depth.
The Coagulation Detection Index (CDI) proposed in Section 3.3.1 (CDI > 15) represents a quantitative threshold that can be implemented in real-time surgical feedback systems. This is particularly relevant for laser-assisted surgeries where precise thermal damage control is critical for preserving adjacent healthy structures. Unlike conventional temperature-based feedback, which has significant lag due to thermal diffusion, the CDI is a candidate marker of coagulation status—a functionality that could reduce collateral damage and improve surgical outcomes. However, its latency, specificity, and robustness in vivo have yet to be examined.
Although the CDI was computed at both wavelengths for every native/altered pair available (liver, boiled skin), only liver at 635 nm clears the proposed threshold (CDI ≈ 17). Liver at 808 nm and boiled skin at either wavelength sit at CDI ≈ 2–3—far below 15. However, the 17-fold increase in the liver measurements is considered exceptionally large and likely specific to the high baseline blood content of liver tissue, the wavelength (635 nm) is near to the hemoglobin absorption peak, and the degree of thermal damage induced. Consequently, the “CDI > 15” rule is currently specific to chicken liver at 635 nm and should not be generalized to other tissue or wavelengths without validation. Therefore, future work will establish tissue-specific CDI threshold through systematic studies.
On the other hand, the observed optical change in chicken skin is consistent with established mechanisms of thermal and dehydration tissue alteration. The 2-fold increase in the absorption coefficient upon boiling aligns with previous reports of coagulation-induced absorption changes across multiple tissue types [27,28]. For the dry skin, the increase in μs (from 16.42 to 39.61 cm−1) reflects the well documented influence of hydration on tissue scattering properties, where water loss increases the relative density of scattering structures. The variation between IS and DD measurements at 650 nm highlights the depth-dependent heterogeneity of skin, with IS probing bulk properties and DD sampling superficial layers. Such results have important implications for probe design in clinical applications. For regulatory approval (FDA 510(k) or CE marking), the CDI-based system would require: (1) validation in a larger cohort of ex vivo and in vivo tissues, (2) demonstration of specificity (i.e., distinguishing coagulation from other optical changes like edema or inflammation), and (3) integration with failsafe mechanisms to prevent misinterpretation due to probe-tissue pressure artifacts. This study provides the foundational optical database for such validation studies.
4.3. Limitations
Limitations of this study include:
- Ex vivo nature—While ex vivo measurements provide controlled conditions, they may not fully represent in vivo optical properties due to blood perfusion, temperature, and hydration differences. There are crucial systematic differences between ex vivo and in vivo optical characteristics. Perfusion and blood oxygenation affect μa, particularly at 635 nm where hemoglobin is dominant. Extracted tissue is drained, deoxygenated, and sometimes cooled or dried [39]. Scattering and absorption are changed by handling, freezing, and storage [40]. The two variables are affected by temperature and hydration, and thermally induced alterations are dependent on thermal dosage rather than temperature alone [41]. Probe pressure modifies the observed spectra under real contact conditions [42]. Furthermore, the homogeneity assumption of K–M and the DA is overturned by multi-layer anatomy (cortical/trabecular bone, epidermis/dermis) [43]. As a result, the CDI is not validated for real-time in vivo monitoring, and the database only offers relative guidance for design and benchmarking; it cannot be used as in vivo reference values.
- Limited tissue types—While the selection covers soft and hard tissues, broader databases including adipose tissue, tumors, and fibrotic tissues would enhance the generalizability of our design guidelines.
- Homogeneity assumptions—The Kubelka–Munk model and diffusion approximation assume homogeneous media, which may not hold for layered tissues (e.g., skin with stratum corneum, epidermis, and dermis). Incorporating multi-layer models (e.g., Monte Carlo simulations) would improve accuracy for such tissues [44,45,46].
- Single integrating sphere—The use of a single integrating sphere (versus a double integrating sphere) introduces potential measurement uncertainties. Future studies should employ double integrating sphere systems for higher precision [29,34].
- There was no formal mesh-convergence or domain-independence investigation; the discretization process was graded around the source in accordance with conventional practice, and the domain size is comparable to the penetration depth of low-attenuation tissues (bovine muscle). The FEM maps are therefore qualitative, with convergence and quantitative validation research expected.
Future research directions include:
- Development of a miniaturized, handheld CDI probe for intraoperative use, with validation in animal surgery models.
- Machine learning integration—Using the optical property database as training data for AI classifiers that can distinguish multiple tissue states (normal, coagulated, necrotic, malignant) from reflectance spectra alone.
- Multi-layer tissue modeling—Extending the FEM framework to include layered geometries for more accurate predictions in complex tissues.
- In vivo validation—Conducting measurements in live animal models to validate the CDI threshold and probe design recommendations under physiological conditions.
5. Conclusions
This paper presented an integrated experimental-computational-engineering framework for laser-based biological tissue characterization, successfully bridging the gap between fundamental biophysical measurements and practical medical device design. The key conclusions include an optical property database, wavelength-dependent behavior, multi-modal measurement integration, Coagulation Detection Index, and design guidelines. The proposed framework is directly applicable to a wide range of biophotonics systems, including optical biopsy probes, phototherapy planning systems, image-guided surgical equipment, and non-invasive hemodynamic monitors. By providing a systematic pathway from optical measurement to device specification, this work supports the translation of optical diagnostics from the laboratory to clinical practice.
Author Contributions
Conceptualization, N.H.S. and O.H.; methodology, O.H. and N.H.S.; software, O.H. and N.H.S.; validation, O.H.; formal analysis, O.H. and N.H.S.; investigation, O.H. and N.H.S.; resources, N.H.S.; data curation, O.H.; writing—original draft preparation, O.H.; writing—review and editing, N.H.S.; visualization, O.H.; supervision, N.H.S.; project administration, N.H.S.; funding acquisition, N.H.S. All authors have read and agreed to the published version of the manuscript.
Funding
This work was supported by the Deanship of Scientific Research, Vice Presidency for Graduate Studies and Scientific Research, King Faisal University, Saudi Arabia [Grant No. KFU266197].
Institutional Review Board Statement
Not applicable.
Informed Consent Statement
Not applicable.
Data Availability Statement
The data can be sent by the corresponding author upon request.
Acknowledgments
The experimental work is acknowledged to the Biophotonics Systems lab at the National Institute of Laser Enhanced Sciences, Cairo University.
Conflicts of Interest
The authors declare no conflicts of interest.
References
- Tuchin, V.V. Tissue Optics and Photonics: Light-Tissue Interaction. J. Biomed. Photonics Eng. 2015, 1, 98–134. [Google Scholar] [CrossRef] [Scilit]
- Wang, L.V.; Wu, H.-I. Biomedical Optics: Principles and Imaging; Wiley-Interscience: New York, NY, USA, 2009. [Google Scholar]
- Shi, X.; Zhang, C.Y.; Gao, J.; Wang, Z. Recent advances in photodynamic therapy for cancer and infectious diseases. Wiley Interdiscip. Rev. Nanomed. Nanobiotechnol. 2019, 11, e1560. [Google Scholar] [CrossRef] [Scilit]
- Zeppieri, M.; Marsili, S.; Enaholo, E.S.; Shuaibu, A.O.; Uwagboe, N.; Salati, C.; Spadea, L.; Musa, M. Optical Coherence Tomography (OCT): A Brief Look at the Uses and Technological Evolution of Ophthalmology. Medicina 2023, 59, 2114. [Google Scholar] [CrossRef] [Scilit]
- Hoshi, Y.; Yamada, Y. Overview of diffuse optical tomography and its clinical applications. J. Biomed. Opt. 2016, 21, 091312. [Google Scholar] [CrossRef] [Scilit]
- Jacques, S.L. Optical properties of biological tissues: A review. Phys. Med. Biol. 2013, 58, R37R61. [Google Scholar] [CrossRef] [Scilit]
- Bashkatov, A.N.; Genina, E.A.; Tuchin, V.V. Optical Properties of Skin, Subcutaneous, and Muscle Tissues: A Review. J. Innov. Opt. Health Sci. 2011, 4, 9–38. [Google Scholar] [CrossRef] [Scilit]
- Welch, A.J.; Van Gemert, M.J.C. Optical-Thermal Response of Laser-Irradiated Tissue; Springer: Berlin/Heidelberg, Germany, 2011. [Google Scholar]
- Wilson, B.C.; Patterson, M.S. The physics, biophysics and technology of photodynamic therapy. Phys. Med. Biol. 2008, 53, R61–R109. [Google Scholar] [CrossRef] [Scilit]
- Thueler, P.; Charvet, I.; Bevilacqua, F.; Saint Ghislain, M.; Ory, G.; Marquet, P.; Meda, P.; Vermeulen, B.; Depeursinge, C. In vivo endoscopic tissue diagnostics based on spectroscopic absorption, scattering, and phase function properties. J. Biomed. Opt. 2003, 8, 495–503. [Google Scholar] [CrossRef] [Scilit]
- Böcklin, C.; Baumann, D.; Stuker, F.; Klohs, J.; Rudin, M.; Fröhlich, J. Reconstructing Optical Parameters from Double-Integrating-Sphere Measurements using a Genetic Algorithm. In Proceedings of the Design and Performance Validation of Phantoms Used in Conjunction with Optical Measurement of Tissue V, San Francisco, CA, USA, 2–3 February 2013; Volume 8583, pp. 858304–858308. [Google Scholar]
- Solouma, N.; Hamdy, O. Ex Vivo Optical Properties Estimation for Reliable Tissue Characterization. Photonics 2023, 10, 891. [Google Scholar] [CrossRef] [Scilit]
- Shanshool, A.S.; Lazareva, E.N.; Hamdy, O.; Tuchin, V.V. Optical Properties and Fluence Distribution in Rabbit Head Tissues at Selected Laser Wavelengths. Materials 2022, 15, 5696. [Google Scholar] [CrossRef] [Scilit]
- Hamdy, O.; Solouma, N.H. Distant-Detector versus Integrating Sphere Measurements for Estimating Tissue Optical Parameters: A Comparative Experimental Study. Optik 2021, 247, 167981. [Google Scholar] [CrossRef] [Scilit]
- Hamdy, O.; El-Azab, J.; Al-Saeed, T.A.; Hassan, M.F.; Solouma, N.H. A method for medical diagnosis based on optical fluence rate distribution at tissue surface. Materials 2017, 10, 1104. [Google Scholar] [CrossRef] [Scilit]
- Niemz, M.H. Laser-Tissue Interactions: Fundamentals and Applications, 4th ed.; Springer: Cham, Switzerland, 2019. [Google Scholar]
- Hamdy, O.; Abdel-Salam, Z.; Abdel-Harith, M. Optical Characterization of Biological Tissues Based on Fluorescence, Absorption, and Scattering Properties. Diagnostics 2022, 12, 2846. [Google Scholar] [CrossRef] [Scilit]
- Hamdy, O.; Fathy, M.; Al-Saeed, T.A.; El-Azab, J.; Solouma, N.H. Estimation of optical parameters and fluence rate distribution in biological tissues via a single integrating sphere optical setup. Optik 2017, 140, 1004–1009. [Google Scholar] [CrossRef] [Scilit]
- Hamdy, O.; Mohammed, H.S. Variations in tissue optical parameters with the incident power of an infrared laser. PLoS ONE 2022, 17, e0263164. [Google Scholar] [CrossRef] [Scilit]
- Tuchin, V.V. Tissue Optics: Light Scattering Methods and Instruments for Medical Diagnostics, 3rd ed.; SPIE Press: Bellingham, WA, USA, 2015. [Google Scholar]
- Prahl, S.A.; van Gemert, M.J.C.; Welch, A.J. Determining the optical properties of turbid media by using the adding–doubling method. Appl. Opt. 1993, 32, 559. [Google Scholar] [CrossRef] [Scilit]
- Lenz, A.J.M.; Arao, K.; Jauregui-Sánchez, Y.; Clemente, P.; Climent, V.; Lancis, J.; Tajahuerce, E. Imaging of the optical properties of turbid media with integrated detection based on the Kubelka-Munk model. In Proceedings of the European Conferences on Biomedical Optics (ECBO), SPIE-OSA, Munich, Germany, 23–25 June 2019; Volume 11074. [Google Scholar]
- Schweiger, M.; Arridge, S.R.; Hiraoka, M.; Delpy, D.T. The finite element method for the propagation of light in scattering media: Boundary and source conditions. Med. Phys. 1995, 22, 1779–1792. [Google Scholar] [CrossRef] [Scilit]
- Light Propagation Modelling Using Comsol Multiphysics. Available online: https://www.atomic.physics.lu.se/fileadmin/atomfysik/Biophotonics/Education/MultiphysicsExercise.pdf (accessed on 1 September 2026).
- Rehman, A.L.; Ahmad, I.; Qureshi, S.A. Biomedical Applications of Integrating Sphere: A Review. Photodiagn. Photodyn. Ther. 2020, 31, 101712. [Google Scholar] [CrossRef] [Scilit]
- Sheet, A.H.; Hamdy, O.; Abdel-Harith, M. Scattering and absorption properties modification of optically cleared skeletal muscles: An ex vivo study. J. Opt. Soc. Am. A 2023, 40, 1042–1050. [Google Scholar] [CrossRef] [Scilit]
- Adams, M.T.; Wang, Q.; Cleveland, R.O.; Roy, R.A. Thermal dose dependent optical property changes of ex vivo chicken breast tissues between 500 and 1100 nm. Phys. Med. Biol. 2014, 59, 3249–3260. [Google Scholar] [CrossRef] [Scilit]
- Iorizzo, T.W.; Jermain, P.R.; Salomatina, E.; Muzikansky, A.; Yaroslavsky, A.N. Temperature induced changes in the optical properties of skin in vivo. Sci. Rep. 2021, 11, 754. [Google Scholar] [CrossRef] [Scilit]
- Beek, J.F.; Blokland, P.; Posthumus, P.; Aalders, M.; Pickering, J.W.; Sterenborg, H.J.C.M.; Van Gemert, M.J.C. In vitro double-integrating-sphere optical properties of tissues between 630 and 1064 nm. Phys. Med. Biol. 1997, 42, 2255–2261. [Google Scholar] [CrossRef] [Scilit]
- Ritz, J.; Roggan, A.; Isbert, C.; Mu, G. Optical Properties of Native and Coagulated Porcine Liver Tissue Between 400 and 2400 nm. Lasers Surg. Med. 2001, 212, 205–212. [Google Scholar] [CrossRef] [Scilit]
- Heikal, F.N.; Ismail, T.; Alharbi, F.; El-Azab, J.; Hamdy, O. Burn Severity Classification Using Convolutional Neural Networks with Thermal Imaging and Diffuse Reflectance Spectroscopy. IEEE Access 2026, 14, 127784–127799. [Google Scholar] [CrossRef] [Scilit]
- Elsheshtawy, M.T.; Habib, G.E.; Elsheakh, D.N.; Hamdy, O.; Eldamak, A.R. Comparative Study of Narrowband and UWB Microwave Sensor Performance for Non-Invasive Blood Clot-Related Dielectric Change Detection. IEEE Access 2026, 14, 131445–131459. [Google Scholar] [CrossRef] [Scilit]
- Sheet, A.H.; Hamdy, O. Enhancing Laser Transmittance in Ex-Vivo Porcine Skin via Thermal Optical Clearing. In Proceedings of the Optics and the Brain, Fort Lauderdale, FL, USA, 26–29 April 2026; Optica Publishing Group: Washington, DC, USA, 2026; p. JM4A.3. [Google Scholar]
- Van Beers, R.; Kokawa, M.; Aernouts, B.; Watté, R.; De Smet, S.; Saeys, W. Evolution of the bulk optical properties of bovine muscles during wet aging. Meat Sci. 2018, 136, 50–58. [Google Scholar] [CrossRef] [Scilit]
- Farrell, T.J.; Patterson, M.S.; Wilson, B. A diffusion theory model of spatially resolved, steady-state diffuse reflectance for the noninvasive determination of tissue optical properties in vivo. Med. Phys. 1992, 19, 879–888. [Google Scholar] [CrossRef] [Scilit]
- Firbank, M.J.; Hiraoka, M.; Essenpreis, M.; Delpy, D.T. Measurement of the optical properties of the skull in the wavelength range 650–950 nm. Phys. Med. Biol. 1993, 38, 503–510. [Google Scholar] [CrossRef] [Scilit]
- Filatova, S.A.; Shcherbakov, I.A.; Tsvetkov, V.B. Optical properties of animal tissues in the wavelength range from 350 to 2600 nm. J. Biomed. Opt. 2017, 22, 035009. [Google Scholar] [CrossRef] [Scilit]
- Tuchin, V.V. Laser Light Scattering in Biomedical Diagnostics and Therapy. J. Laser Appl. 1993, 5, 43–60. [Google Scholar] [CrossRef] [Scilit]
- Setchfield, K.; Gorman, A.; Simpson, A.H.R.W.; Somekh, M.G.; Wright, A.J. Relevance and utility of the in-vivo and ex-vivo optical properties of the skin reported in the literature: A review. Biomed. Opt. Express 2023, 14, 3555–3583. [Google Scholar] [CrossRef] [Scilit]
- Hoffman, M.A.T.; Keppler, M.A.; Smith, A.L.; Fasci, A.; Macasadia, M.E.; Tijerina, A.J.; Lyle Hood, R.; DeLisi, M.P.; Bixler, J.N. Effects of cold storage on double integrating sphere optical property measurements of porcine dermis and subcutaneous fat from 400 to 1100 nm. J. Biomed. Opt. 2025, 30, 15001. [Google Scholar] [CrossRef] [Scilit]
- Rossmann, C.; Haemmerich, D. Review of temperature dependence of thermal properties, dielectric properties, and perfusion of biological tissues at hyperthermic and ablation temperatures. Crit. Rev. Biomed. Eng. 2014, 42, 467–492. [Google Scholar] [CrossRef] [Scilit]
- Cugmas, B.; Bregar, M.; Bürmen, M.; Pernuš, F.; Likar, B. Impact of contact pressure–induced spectral changes on soft-tissue classification in diffuse reflectance spectroscopy: Problems and solutions. J. Biomed. Opt. 2014, 19, 37002. [Google Scholar] [CrossRef] [Scilit]
- Granberg, H.; Edstrom, P. Quantification of the intrinsic error of the Kubelka-Munk model caused by strong light absorption. J. Pulp Pap. Sci. 2003, 29, 386. [Google Scholar]
- Hamdy, O. Simulating Light Diffusion in Human Brain Tissues Using Monte-Carlo Simulation and Diffusion Equation. Adv. Appl. Sci. 2018, 3, 28–33. [Google Scholar] [CrossRef] [Scilit]
- Hamdy, O.; Ismail, T. Study of optical power variations in multi-layer human skin model for monitoring the light dose. In Proceedings of the NILES 2019—Novel Intelligent and Leading Emerging Sciences Conference, Giza, Egypt, 28–30 October 2019. [Google Scholar]
- Hamdy, O.; Youssef, D.; El-Azab, J.; Soluma, N.H. Detection of Breast Diseases using Numerical Study of Light Propagation. In Proceedings of the 2018 9th Cairo International Biomedical Engineering Conference, CIBEC 2018, Cairo, Egypt, 20–22 December 2018. [Google Scholar]

Disclaimer/Publisher’s Note: The statements, opinions and data contained in all publications are solely those of the individual author(s) and contributor(s) and not of MDPI and/or the editor(s). MDPI and/or the editor(s) disclaim responsibility for any injury to people or property resulting from any ideas, methods, instructions or products referred to in the content. |
© 2026 by the authors. Licensee MDPI, Basel, Switzerland. This article is an open access article distributed under the terms and conditions of the Creative Commons Attribution (CC BY) license.