


Abstract
The closer a cancer model simulates the natural tumour environment, the more likely is a new therapeutic approach tested in this environment to succeed in clinical trials. A three-dimensional (3D) cell culture model provides several advantages over a simple, single-layer 2D cell culture: it can more closely simulate the cancer cell interactions occurring in a spontaneous tumour invading a living organism. The 3D cultures may be used to simulate a larger cancer cell load, thereby presenting a higher challenge for destruction by therapeutic intervention. In such a model, the nutritional support in the centre of the 3D structure would decrease with increasing diameter, similar to the situation found in a fast-growing tumour. For the purpose of experimental radiotherapy, we have designed a 3D cancer cell model in a two-layered agar matrix. Although this model does not represent a complex tumour microenvironment, we were able to visualise the three-dimensional growth utilising synchrotron-based microCT imaging of cancer cells loaded with gold nanoparticles (GNP) injected and proliferated in an agar matrix. We have also irradiated 3D cell cultures with microbeams, then embedded, sectioned and stained the agar matrices similarly to organic tissue samples. Thus, we have demonstrated the suitability of our in-vitro model for experimental radiotherapy.
1. Introduction
The advent of three-dimensional (3D) tumour models has increased the likelihood that, in the development of new therapeutic approaches, the expectations of tumour response based on results obtained in vitro will match those seen in vivo. Although not all aspects of a cancer invading a live organism can be simulated in vitro, the in-vitro model can be chosen to fit specific experimental logistics and to represent the most important aspect(s) required to answer a defined set of questions [1,2,3]. Examples are cancer cell spheroids, representing small, dense and avascular metastases [2,3,4,5,6], organs-on-a-chip in which blood flow can be simulated [7,8], 3D-printed tumours with or without matrices of normal, non-cancerous cells typical of the tumour environment [9,10] and organoids from mammalian organisms, which can represent a tumour-typical mix of normal and cancer cells with remainders of vasculature [11,12]. Drawbacks of using most of these in-vitro systems are the costly technical equipment required to prepare the samples or the access to spontaneous tumour samples. Also, they require considerable experience in order to deliver high sample throughput with reproducible results.
In clinical radiation oncology, one of the most important physical parameters is tumour size, because that is what matters for the cancer patients, who will accept a temporary decrease in their quality of life due to adverse effects of treatment, if only the tumour is getting smaller or, in the best-case scenario, disappears completely.
In experimental radiation oncology, physical parameters like size and tumour depth from surface are key parameters in medical physics treatment planning. It has been shown that the inclusion of 3D cancer cell models in life-sized phantoms can indeed change the cellular response to irradiation [13]. Where these developmental irradiation studies cannot be conducted at the researcher’s home institution but only at highly specialised research centres, careful advance planning and preparation of high sample numbers are necessary to make optimal use of the available experimental time. These samples should be sufficiently stable to allow repeated mechanical handling, like insertion into and extraction from a phantom. They should contain cells at a high density, forming a coherent, tumour-like mass, thus mimicking the tissue structure of a malignant tumour in vivo. For spatially fractionated irradiation (SFRT) studies, a high cell density is also required to make the specific irradiation pattern visible in subsequent histology and immunological staining. Ideally, the 3D samples should lend themselves to post-irradiation sectioning, mounting and subsequent histological and immunological staining, comparable to that described in previous microbeam radiotherapy (MRT) studies [14].
X-ray-based MRT is characterised by dose rates approx. one order of magnitude higher than those of clinically established conventional radiotherapy, where typical dose rates are between 6 Gy/min and 20 Gy/min. Thus, even doses much higher than those typical of an irradiation fraction in conventional radiotherapy can be deposited in seconds or fractions thereof, instead of minutes. Besides an overall shorter irradiation time as a bonus for the patient, fast dose deposition has been shown to protect normal-tissue function [15], which will translate into fewer adverse effects for the patient [16]. Furthermore, in the new SFRT techniques like minibeam and microbeam radiotherapy, where an array of quasi-parallel beams is generated by insertion of a multislit collimator in the incident broad beam, fast dose deposition decreases the risk of movement of the irradiation target due to physiologic movement like heartbeat and breathing or involuntary movements, like muscle twitching. The deposited irradiation dose thus stays confined to the peak (high-dose) zones. This is important because the ratio between peak and valley (low-dose) zones is an important determinant of normal-tissue damage: the higher the peak-to-valley ratio, the lower the normal-tissue damage [17].
One of the advantages of work in a phantom is that markers can be introduced into the tumour material to make the treatment success visible. In order to exclude the possibility that these markers bias the therapeutic result, the choice of markers is limited to those shown to not impact on the main study parameters. We have shown in previous studies that exposure to gold nanoparticles (GNP) in a concentration of 52 µg/mL in the growth medium does not significantly impact on cancer cell proliferation. Tumours grown from GNP-loaded cancer cells can be made visible in microCT [18,19]. We have now developed and tested the potential of a cost-effective 3D cell culture system generated from cancer cell lines of rodent as well as human origin, to suit the specific requirements of experimental radiobiological work at the synchrotron, a powerful particle accelerator well suited to developing new radiotherapy techniques.
2. Materials and Methods
Methods development was conducted in parallel for the 3D cell culture system and visualisation of the 3D cell cultures. For better readability, the methods are described in sequence.
2.1. Cell Culture
In this study, one human and two murine cancer cell lines were used: F98 glioma cells (Rattus norvegicus, undifferentiated malignant glioma, CRL-2397, ATCC), B16-F10 melanoma cells (Mus musculus, mixture of spindle-shaped and epithelial-like cells, melanoma of the skin, CRL-6475, ATCC) and human A549 lung carcinoma cells (Homo sapiens, epithelial-like lung carcinoma cells, ATCC-CRM-CCL-185, DSMZ, German Collection of Microorganisms and Cell Cultures GmbH, Braunschweig, Germany). Mycoplasma testing is regularly conducted in our laboratory.
The cells were seeded and maintained in T75 cm2 cell culture flasks and kept in a standard incubator at 37 °C in a humidified atmosphere of 5% CO2. Upon reaching a confluence of 70–80%, the cells were passaged. To detach the cells from the bottom of the cell culture flasks (cell harvest), the murine cells (F98 glioma and B16-10 melanoma) were incubated for approx. 20 min in calcium- and magnesium-free medium (DPBS, catalogue number P04-36500, PAN Biotech, Aidenbach, Germany) in the standard incubator and then washed off. The human lung cancer cells (A549) were trypsinised, using a 0.05% solution of trypsin/EDTA (Biochrom GmbH, Berlin, Germany, Darmstadt, Germany).
To prepare the injection of cancer cells into the agar matrix, the cells were harvested and counted, using an automated cell counter (Beckman Coulter GmbH, Krefeld, Germany). The number of cells seeded into the agar matrix depends on the design of the experiment, its overall duration and the time intervals between seeding and irradiation or irradiation and termination of the experiment, respectively. For the imaging study, a cell suspension was prepared at a concentration of 150,000 cells/5 µL medium, of which 5 µL each was injected into the agar in three different positions close to the centre of the agar. For the irradiation study, cell suspensions of each respective cell line were prepared at a concentration of 75,000 cells/µL growth medium, of which 10 µL was injected, then kept at room temperature until injection into the agar matrix. In our experience, the cells can be either harvested from proliferating cell cultures (culture flasks) or resuscitated directly from frozen cell stock.
2.2. Preparation of the Two-Layered Agar Gel Matrix
The main components of this 3D cell culture system are agar powder (Agar-Agar, Danish, Roth, Karlsruhe, Germany, catalogue number 4508.1) and purified water. The agar matrix combines a solid base layer made from 2% agar, providing the mechanical stability required for repeated handling of the structure, with a top layer of a lower agar concentration (typically 0.2–0.4%) to allow tumour cell proliferation. In this top layer, the cells are seeded in the desired number to produce 3D tumours in a reproducible size within the time period between seeding and irradiation. In our study, the cell-containing agar matrix was produced in the wells of 24-well cell culture plates. However, the agar volumes and cell numbers can be easily adapted for use in well plates with larger or smaller wells.
Step 1: To produce the base layer, a suspension of 2% agar in purified water was gradually heated in a sterile glass bottle until a clear, liquid agar gel was formed at a temperature of approx. 60 °C. Of this suspension, 250 µL was pipetted into each well of a 24-well plate under sterile conditions. In order to prevent clogging by solidifying gel, the pipette or pipette tip used needs to be flushed with hot water regularly. At room temperature, the agar gel was allowed to solidify for approx. 2 h. Alternatively, this step can be conducted one day in advance of the following preparation steps. The prepared base layers can be kept at room temperature or in the fridge.
Step 2: The top agar layer, in which the cell cultures are to grow three-dimensionally, was prepared by gradually heating a 0.2–0.4% suspension of agar powder to a maximum of 60 °C, while constantly stirring until a clear liquid was obtained. A drop of this mixture should solidify on a cold glass plate within a short time. The glass bottle containing the top-layer agar was placed into a warm water bath in order to prevent fast cooling and thus premature solidification in the bottle. A volume of 250 µL was pipetted quickly into each well of a 24-well plate, on top of the 2% agar base layer.
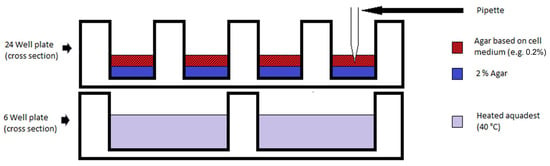
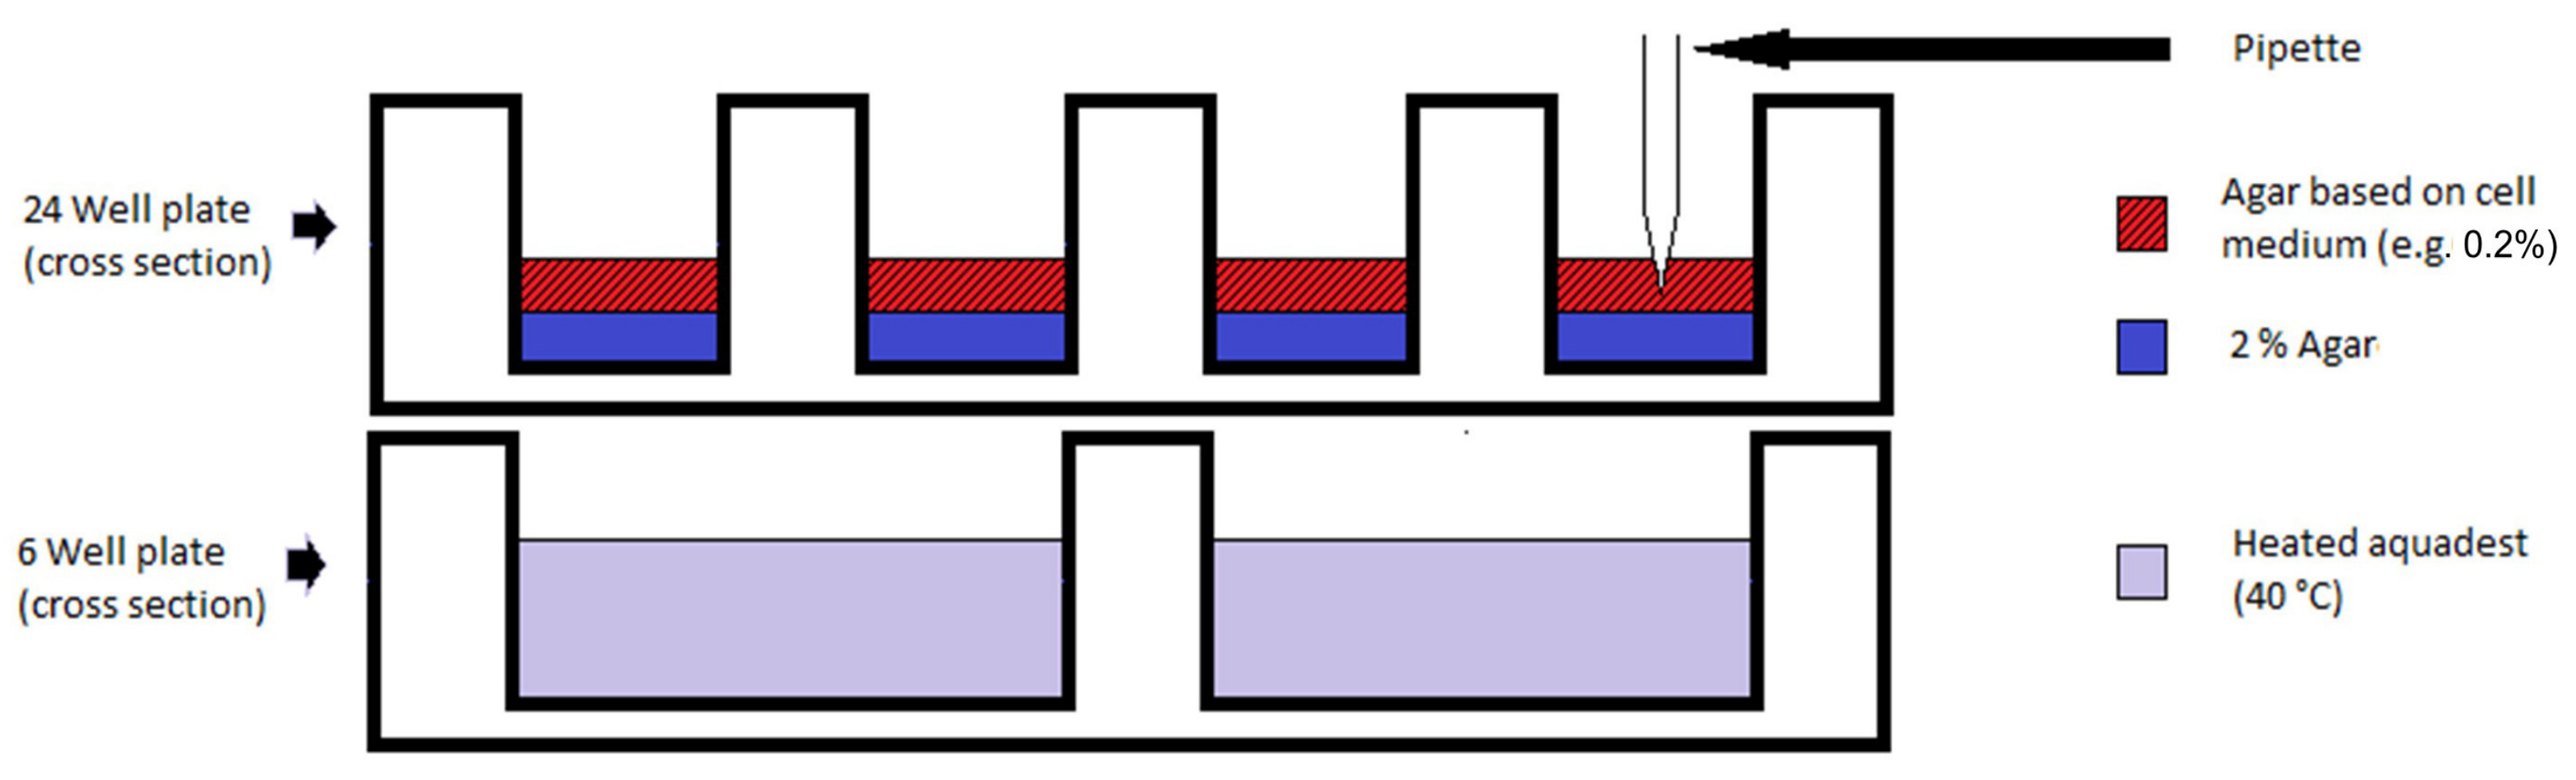
At the same time, purified water was heated to 40 °C in a sterile glass bottle. Just before pouring the top layer over the agar base layer, the hot water was filled into a 6-well plate up to 5 mm below the rim of the well plate. A well plate already containing the 2% agar layer was then placed on top of the 6-well plate containing the hot water (Figure 1). This gentle warming prevents premature solidification of the agar top layer, to ensure that the seeding of the cells into the cooling but still-liquid agar is successful.
Figure 1.
Schematic showing the setup for injection of cell-containing medium into the still-liquid agar top layer.
Step 3: The cancer cells were seeded into the top agar layer by injecting the cell suspension slowly in three positions close to the centre of the cooling but still-liquid agar top layer. The pipette tip was then used to slightly stir the seeded cells into the agar with six circular movements around the points of injection, across approx. half the radius of the well. This results in a more homogeneous solidification of the top layer matrix and an even distribution of cells at and around the points of injection. This step is repeated for each well.
To prevent uneven solidification of the agar surface, care should be taken to avoid tilting of the well plate before the agar is completely solid. The well plates were left in the sterile bench until the seeded agar top layer was completely solidified (approx. 2 h for 0.4% agar, longer for 0.2% agar). When gently tilted, solidified agar should keep its shape. The well plates with seeded two-layer agar matrices were transferred into a standard incubator.
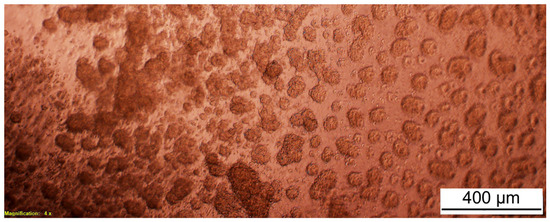
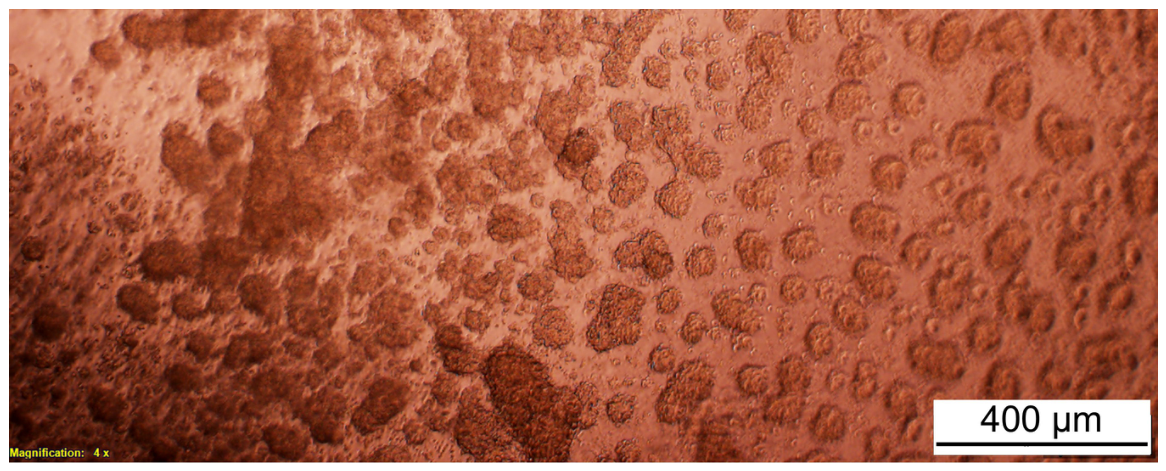
If the growth medium contains the pH indicator phenol red, the seeded top agar layer takes on a red colour (Figure 2). This colour fades with increasing cell proliferation. At 24 h after seeding, a first growth control was conducted, assessing cell morphology under the laser scanning t microscope (Leica DMI 6000, Wetzlar, Germany) and the discolouration of the agar gel. Following this, 500 µL growth medium was gently added to each well of a 24-well plate. Later, the colour of the growth medium was checked twice daily and the medium was exchanged as soon as a slight discolouration was noticed.
Figure 2.
A549 lung cancer cells in 0.2% agar gel at 60 h after injection. Injection volume: 3 × 150,000 cells/5 µL medium. Magnification: 40×, light microscope. Note: red hue due to fresh cell growth medium.
Depending on the number of cells initially seeded and on the duration of the experiment (number of days before and after irradiation), the growth medium was changed every 12–48 h by carefully aspirating the spent medium and replacing it with fresh medium. Care was taken to not disturb the agar top layer containing the cells.
2.3. Preparing and Characterising Gold Nanoparticles (GNP)
GNP of about 50 nm diameter were synthesised according to the chemical reduction method initially described by Frens [20]. Briefly, a 0.01% tetrachloroauric(III) acid solution, containing 46 mg tetrachloroauric(III) acid (Merck KGaA, Darmstadt, Germany) dissolved in 400 mL ultrapure water, was brought to the boil and kept boiling for 5 min, while the colour changed from a pale yellow to colourless. Then, 4 mL of a 1% sodium citrate solution was added, causing an immediate colour change towards grey. The solution was kept boiling for another 5 min until it reached a final deep Bordeaux-red colour. No further colour changes occurred when boiling time was extended. The solution was cooled on ice until it reached room temperature and a pH value of 5–6 after addition of 4 mL of a 0.1 M potassium carbonate solution. To this solution, 1 mL dialysed goat serum (catalogue number P30-10050, PAN Biotech, Germany) was added carefully dropwise under agitation, to prevent adhesion of the GNP to the bottle wall. The solution was centrifuged at 4 °C for 25 min at 9500 rpm. The supernatant was discarded carefully and the sediment was resuspended in 400 mL ultrapure water, after which the centrifugation was performed for a second time under the same conditions. After removing the supernatant again, the sediment was resuspended in 20 mL DMEM cell culture medium (Lonza Group Ltd., Basel, Switzerland) supplemented with 10% FBS (Merck KGaA, Darmstadt, Germany) and 1% penicillin/streptomycin (Merck KGaA, Darmstadt, Germany) and stored in 1 mL vials at −15 °C until use.
The concentration of gold in the GNP stock solution was measured using inductively coupled plasma optical emission spectrometry (ICP-OES; Thermo Electron ICP-OES-Spektrometer IRIS Intrepid II XUV, Thermo Fisher Scientific Inc., Waltham, MA, USA). The analysis was performed in triplicate, digesting 1 mL of the stock solution in 1.5 mL aqua regia (Morphisto GmbH, Frankfurt am Main, Germany). Of this solution, 0.5 mL was dissolved in 4.5 mL ultrapure water for ICP-OES analysis.
Additional measurements in aqua regia and the cell culture medium were prepared to register the background signals contributed by these two components. To determine the nanoparticle concentration in the stock solution, the blank values were subtracted from each sample, the mean value of the samples was calculated and multiplied by the dilution factor.
2.4. Image Acquisition by Synchrotron-Based microCT
In order to demonstrate the three-dimensional distribution of cancer cells throughout the agar matrix, an imaging study was conducted at the biomedical beamline SYRMEP of the Elettra Sincrotrone Trieste, based on the method initially described [19]. Briefly, the cancer cells were exposed to GNP in growth medium at a concentration of approx. 50 μg/mL for 24 h and then seeded into the agar matrix.
For synchrotron-based microCT imaging, a 2 mL cryotube, containing 450,000 GNP-loaded F98 glioma cells embedded in top-layer agar, was mounted vertically in the synchrotron beam. Imaging was conducted using a commercially available CCD Photonics Sciences CCD Camera, detecting X-rays at a pixel size of 9 µm (Photonic Science Ltd., East Sussex, UK). The dark- and flat-field-corrected data were reconstructed using an in-house filtered-back-projection application written in IDL (http://ittvis.com/idl/, accessed on 15 November 2010, Boulder, CO, USA). Slice data were analysed, manipulated and rendered using the Osirix 14.1 software package (http://www.osirix-viewer.com, accessed on 15 November 2010, Geneva, Switzerland), the VolView 2.0 software kit (http://www.kitware.com/products/volview.html, accessed on 15 November 2010, Clifton Park, NY, USA) and ImageJ v 1.52 (http://rsb.info.nih.gov/ij/, accessed on 15 November 2010, Bethesda, MD, USA).
2.5. Sample Irradiation
As part of this feasibility study, we irradiated agar cell matrices containing murine B16 melanoma and F98 glioblastoma cells using the microbeam irradiation technique at the white-beam beamline P61A of the PETRA III synchrotron on the DESY campus in Hamburg. The setup of the mobile insert for radiotherapy studies at this beamline has been described previously [21]. A multislit collimator [22], producing an array of quasi-parallel microbeams with an individual beam width of 50 µm and a centre-to-centre distance of 400 µm between the microbeams, was used to produce an inhomogeneous dose distribution at the irradiation target, with repetitive peak (high-dose) and valley (low-dose) zones. MRT peak doses of 400 Gy were delivered to the samples.
Immediately before the irradiation procedure, the growth medium was removed. The complete agar matrix (2% base layer and 0.2% top layer seeded with cells) was left in the wells of the 24-well plate for the irradiation procedure. The well plates were mounted in the irradiation beam in a vertical position. The agar matrix did not detach from the bottom of the wells during this process.
The 3D cell cultures were terminated at 24 h after irradiation, using 4% phosphate-buffered formalin (PBF). The growth medium covering the cell-containing agar matrix was removed completely. Then, 1 mL of 4% PBF was added to each well for 30 min, after which it was aspirated and replaced by 1 mL of 1× phosphate-buffered saline (PBS) to prevent dehydration of the agar matrix. In our experience, agar matrices thus fixed and suspended in PBS have been transported and stored for extended periods of time at ambient temperature without sustaining damage.
2.6. Embedding, Sectioning and Mounting
The complete agar matrices containing the irradiated cells and the non-irradiated controls were removed from their respective wells by sliding a flat spatula below the 2% agar base layer. Each complete matrix (base and top layers) was placed into a tissue embedding cassette, in which it was dehydrated in a series of ethanol solutions (Walter CMP (Kiel, Germany), WAL641 6025) of increasing concentration as follows: ethanol 70% for 15 min, ethanol 80% for 30 min, ethanol 96% for 60 min, ethanol 100% for 60 min. The dehydrated agar matrix was transferred into a staining dish containing xylol (Roth, 9713.4) for a duration of 60 min. Following this, the agar was embedded in paraffin (Merck, 1.07158.9025) at 57–60 °C.
Prior to cutting histological sections, the agar matrices embedded in paraffin were cooled on a cooling table. Microtome sections were cut at a thickness of 5 µm (Leica Microtome RM2255 (Leica Biosystems, Nußloch, Germany)). The fresh sections were first placed into cold water, then transferred to a warm water bath at 42 °C and finally mounted onto microscopy slides (Epredia Superfrost plus Slide, coated; Thermo Fisher Scientific, catalogue number 12312148). The slides were placed into a rack and dried at room temperature for several hours before being placed into a heating cabinet at 48 °C overnight.
2.7. Staining Procedures
Both haematoxylin–eosin stain (H&E) and Nissl stain were conducted according to standard protocols. Sections were deparaffinised in xylol (9713.3, C. Roth Germany, Karlsruhe, Germany), three times for 10 min each, followed by a decreasing ethanol series of 100% ethanol, 90% ethanol and 80% ethanol, for three minutes each. After that, the sections were rinsed three times for five minutes each in pure water.
For H&E staining, stain in Mayer’s haemalum solution (Merck, 1.09249.0500) for 10 min, dip in HCl alcohol and keep under running tap water for 15 min. Place into distilled water for two minutes, then into eosin (Merck, 1.15935.0025) for another two minutes. Wash in pure water for half a minute. For Nissl staining, deparaffinised sections were placed into 0.1% cresyl violet solution in a warming oven at 60 °C for 10 min and then briefly rinsed in pure water.
Finally, the stained sections were dehydrated in an ethanol series with increasing concentrations (70%, 80%, 96% and 100%, one minute each), placed into xylol three times for 10 min and coverslipped.
Stained images were loaded into the ImageJ software (http://rsb.info.nih.gov/ij/, accessed on 15 November 2010, Bethesda, USA) to measure distances between histologic features representing microbeams and to acquire profile plots across the histological image mirroring the beam geometry (peak- and valley-dose zones).
For γ-H2AX immunostaining, antigen retrieval was conducted by heat exposure, placing the microscopy slides onto a metal rack in a pressure cooker filled up to 2/3 height with citrate buffer. After boiling for 10 min, the pressure cooker cooled down, still containing the slides, which were then deparaffinised and washed in an alcohol series of decreasing concentrations. After incubation with normal goat serum (NGS, Invitrogen, 6666.S (Waltham, MA, USA)), the sections were incubated with the primary antibody against γ-H2AX (Phospho S139, abcam (Cambridge, UK), catalogue number 2893, dilution 1:200 in 1% NGS/PBS) overnight at 4 °C. After washing the sections with 1× PBS three times, they were incubated with Alexa Fluor 488, Goat Anti-Rabbit (abcam, catalogue number ab 150077, dilution 1:200) for 1 h at 37 °C in 1% NGS/PBS. After washing with 1× PBS three times again, the sections were covered with Prolong Gold antifade reagent with DAPI (Invitrogen (Thermo Fisher Scientific), P36931). Finally, the sections were coverslipped and the cover glasses were fixed with clear nail polish.
3. Results
We have developed a 3D cell culture system suitable for use in phantoms in experimental radiotherapy and imaging studies. To assess this suitability, we have
- Transferred the agar matrices between well plates after long-distance transport by plane, to test mechanical stability
- Visualised a 3D cell culture complex using microCT
- Irradiated 3D cell culture complexes
- Embedded and sectioned the irradiated samples similarly to irradiated tissue
- Conducted histological staining on these sections.
The initial methods development was conducted using murine cancer cells (F98 glioma and B16-F10 melanoma cells). Once the method had been established, we also demonstrated similar proliferation patterns and the capability to proliferate in the agar matrix in human cancer cells.
3.1. Mechanical Stability
During initial tests with agar in different concentrations, we found that agar gels at lower concentrations (0.2% or 0.4% agar) were not stable enough to be removed from the well plates undamaged. Only the addition of a 2% agar base layer into the wells eliminated the issue of mechanical instability. Across 120 samples in five 24-well plates, transfer stability between well plates, defined by the presence of a morphologically intact, unbroken sample at the time of fixation at 24 h after irradiation, was approx. 90%, even after those well plates containing seeded matrices had been shipped in a box by plane: 109 samples arrived unbroken after long-distance transport (90.8%), but two additional matrices broke during transfer into the irradiation dish, resulting in 89% intact samples. No further loss occurred during the experiment. There was no adhesion between the gel layers, regardless of the agar concentrations forming the matrix.
With a view to inserting the 3D cell cultures into a phantom, the agar matrix was found to be suitable for shaping into the desired dimensions. Segments of 7 mm diameter were cut from the agar matrix using sterilised cigar punches with an inner diameter of 7 mm. Where precision and reproducibility of size are less important, the matrix layers can be shaped using a scalpel. Even when separated from the 2% base layer, the gel proved stable enough to allow for repeated insertion into an animal phantom as well as transport without compromising its mechanical integrity. Matrix segments cut to shape were stored in well plates filled with growth medium until further use to ensure continued access of the cells to nutrients. To ensure standard cell growth conditions (37 °C, 5% CO2) for as long as possible during our irradiation experiments, the transport between the cell culture laboratory and the beamline (experimental station), where the irradiation procedure was performed, was conducted in a mobile incubator (Cellbox flight, Cellbox, Hamburg, Germany).
3.2. Visualisation of Cancer Cell Growth Pattern
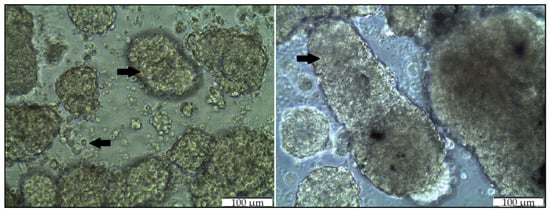
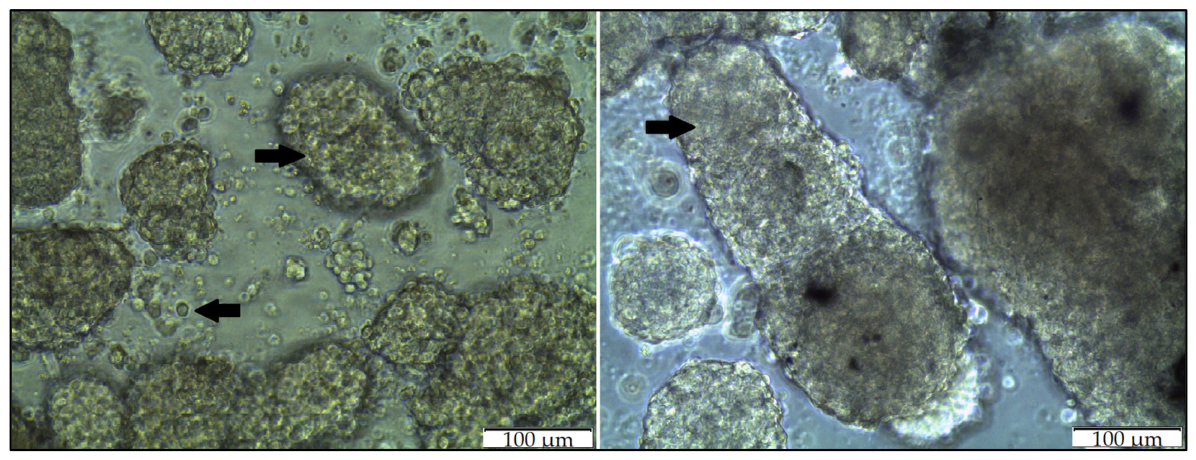
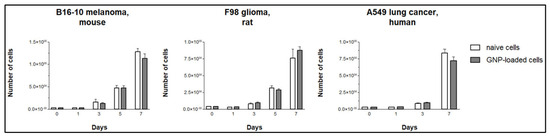
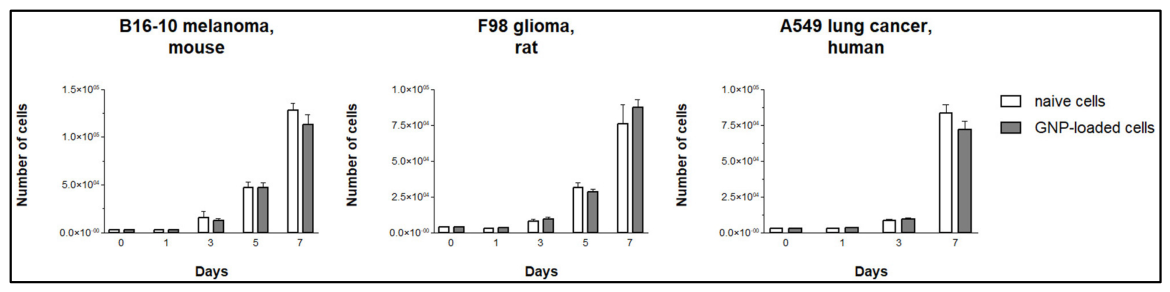
Cell proliferation studies were conducted in 2D but not in 3D cultures. Figure 3 provides a visual example of naive and GNP-loaded F98 glioma cells, in which no noticeable differences between naive and GNP-loaded cells are seen. In 2D cancer cell cultures, no statistically significant difference was seen between the proliferation of naive and GNP-loaded cancer cells (Figure 4). The p-values and corresponding 95% confidence intervals (CI) for B16-10 melanoma (mouse), F98 glioma (rat) and A549 lung cancer cells (human) were 0.196 (CI −21,000 to 15,600), 0.358 (CI −3510 to 7020) and 0.354 (CI −2310 to 4570) for day 3, and 0.292 (CI −45,800 to 4890), 0.344 (CI −18,800 to 42,000) and 0.277 (CI −32,400 to 9600) for day 7, respectively. The close similarity of proliferation between naive and GNP-loaded cancer cells in 2D cell cultures had been demonstrated previously [19]. The confidence intervals for the differences in numbers between naive and GNP-loaded cancer cells in our study were relatively wide and included zero across all compared experimental groups, indicating that the observed differences were not statistically significant at the 5% significance level. However, it should be noted that the sample numbers were small and the main purpose of using GNP in this study was the need for an optical marker to demonstrate 3D growth, rather than the provision of statistical evidence for the influence of GNP on cell proliferation.
Figure 3.
Example of F98 glioma cells in 0.2% agar top matrix at 72 h after injection with 3 × 150,000 cells/5 µL medium. Left: Naive F98 glioma cells. Right: GNP-loaded F98 glioma cells and conglomerates (GNP visible as black dots). Magnification: 200×, light microscope. Black arrows pointing at F98 glioma cells and cell conglomerates in the agar matrix.
Figure 4.
Proliferation in naive and GNP-loaded 2D cancer cell cultures. Of those, one cell line each is of mouse (B16-F10 melanoma), rat (F98 glioma) and human origin (A549 lung cancer), three biological replicates per sample. No statistically significant difference was seen between the proliferation of naive and GNP-loaded cancer cells in any of these cell lines. An unpaired t-test with Welch’s correction (GraphPad Prism 6, GraphPad Software, Inc., La Jolla, CA, USA) was used to analyse the data and assess their statistical significance. The error bars are SD. Raw data are provided in Supplementary Table S1.
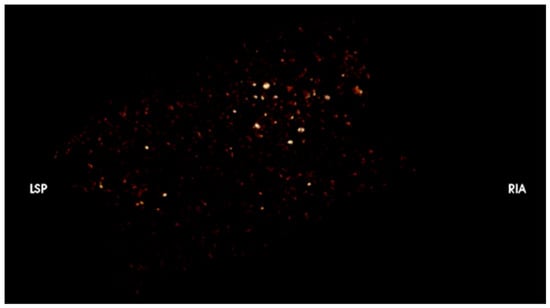
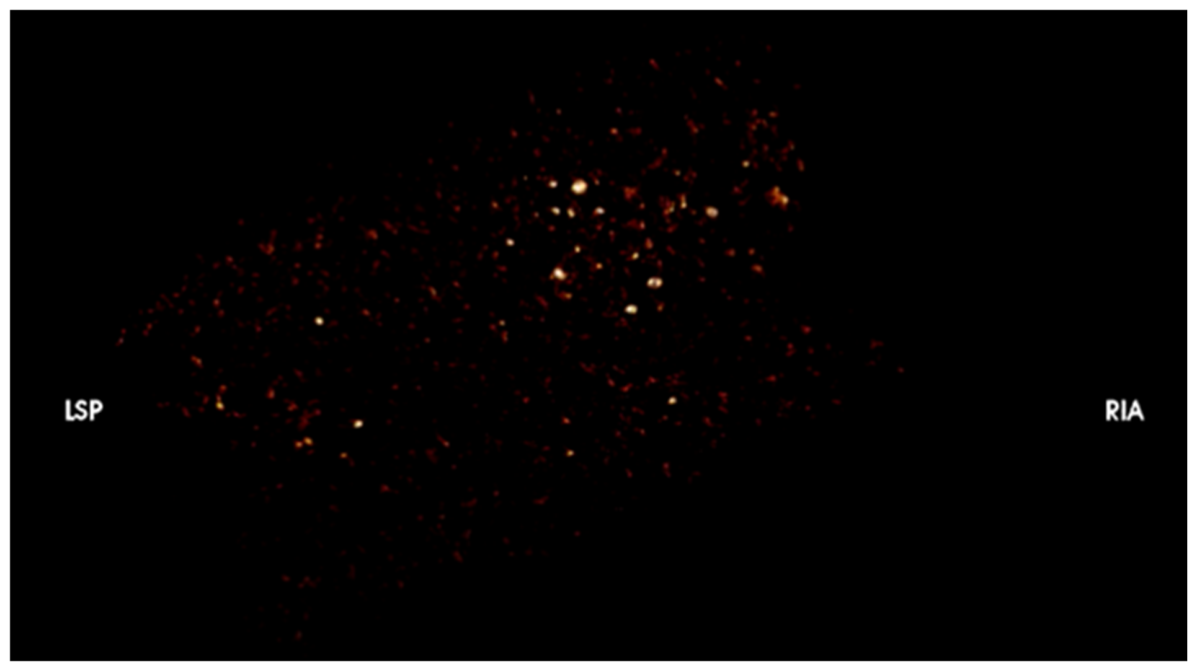
GNP-loaded cells were visible in synchrotron-based microCT images and thus allowed visualisation of the three-dimensional growth pattern of the injected cells (Figure 5 and Supplement Video S1). The diameter of the GNP (50 nm) was reported in the original paper describing the procedure [20]. The size was verified after intracellular uptake using Transmission Electron Microscopy (TEM) [23].
Figure 5.
Average intensity projection of GNP-loaded F98 murine glioma cells in agar matrix at 80 h after seeding. A total of 3 × 150,000 cells/5 µL growth medium was seeded into 0.2% agar. The image shown is a still from a video showing the three-dimensional cell distribution throughout the agar matrix. The link to the video is provided as Supplement Video S1. The 3D anatomical orientation codes LSP, for left superior posterior, and RIA, for right inferior anterior, are integrated into the image acquisition programme but are of little practical relevance when imaging round agar discs.
3.3. Histology and Immunofluorescence
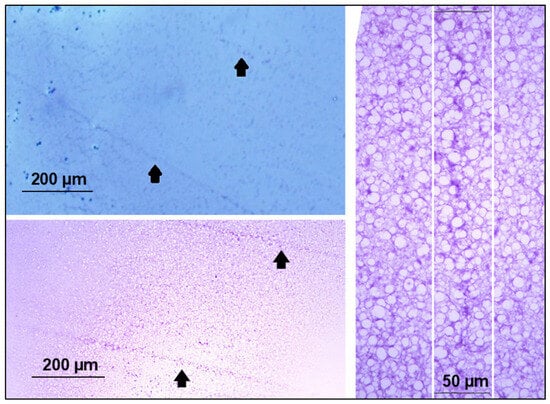
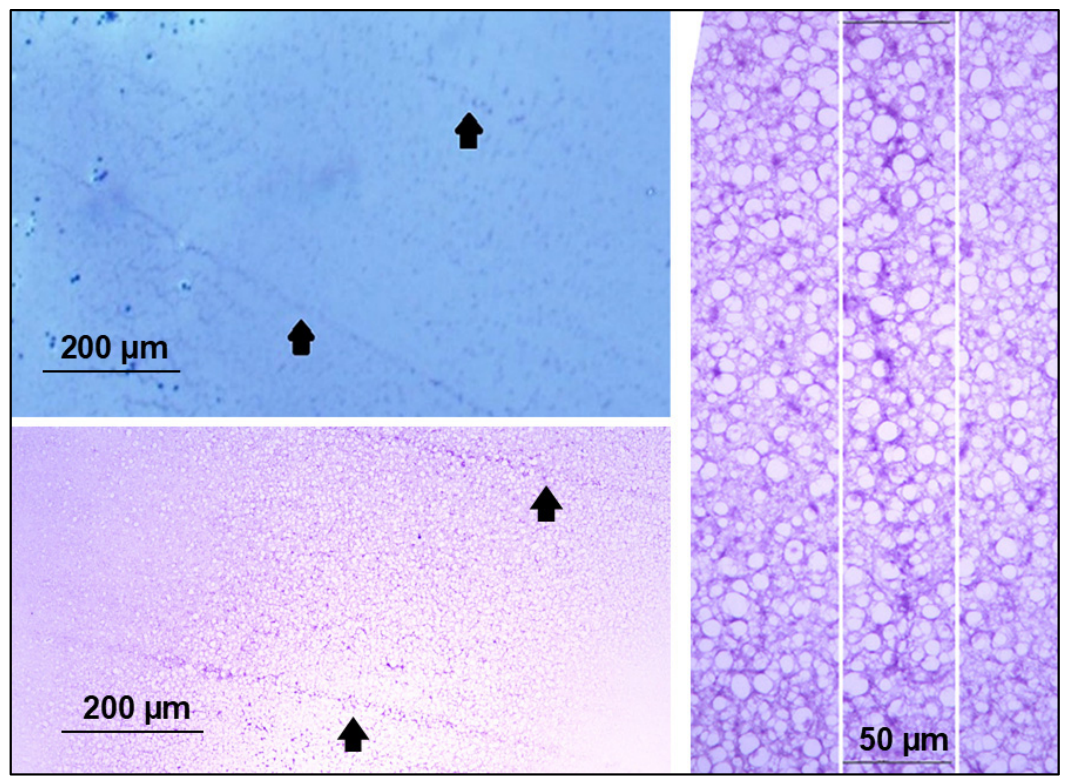
The suitability for post-irradiation sectioning, mounting and subsequent histological and immunological staining to obtain information about radiogenic changes in morphology and cellular function was one of the assessment criteria. The agar matrices were processed by analogy with tissue processing standards for microscopy, conducting morphological staining like H&E and Nissl (Figure 6), obtaining profiles across histological sections (Figure 7) and attempting immunofluorescence staining (γ-H2AX, Figure 8).
Figure 6.
Nissl stain of B16 melanoma and H&E stain of F98 glioma cell cultures. The white lines indicate the expected beam position. Nissl dyes are basic dyes, possessing a high affinity for acidic nucleic acids like DNA and RNA. In normal cells, nuclear DNA is loosely distributed (euchromatin). Damage to the nuclear DNA results in the condensation of chromatin. The compacted chromatin of the pyknotic nuclei appears optically much darker than euchromatin. While the H&E stain requires several more steps in the staining procedure, it nicely contrasts the blue or dark violet of the acidic components in the nucleus (haematoxylin) with the reddish hue caused by the counterstain eosin, targeting basic components in the cellular cytoplasm. A total of 750,000 cells in 10 µL medium was seeded in 0.2% agar. Irradiation with an MRT peak dose of 400 Gy at 40 h after seeding. Termination of the cell culture at 24 h post-irradiation. The arrows indicate the tracks of microbeams, visible as darker lines due to pyknotic cells subsequent to radiogenic cell damage.
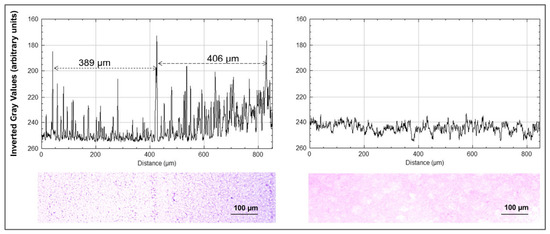
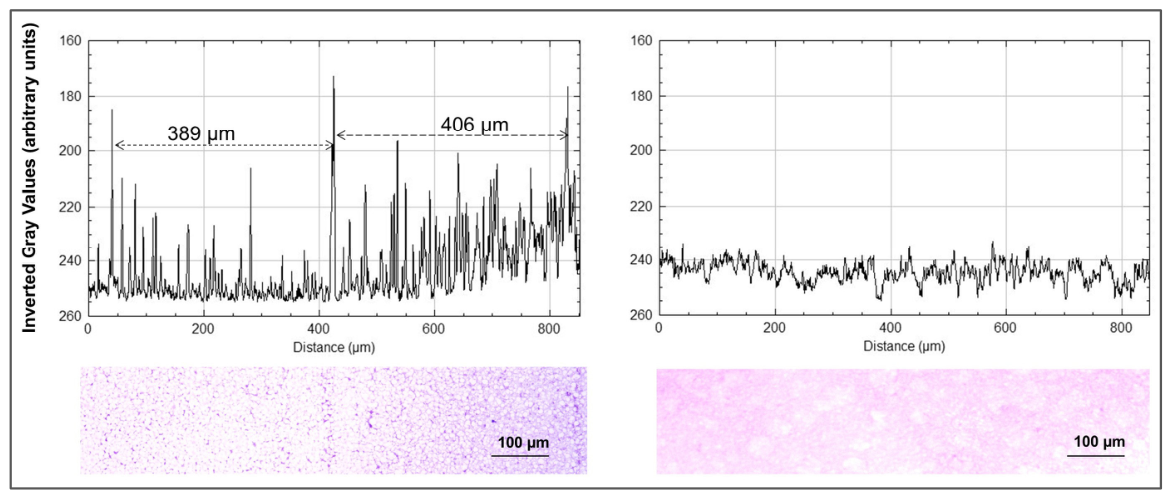
Figure 7.
Intensity plot profiles and microphotographs of gel sections, stained with H&E. Sample irradiated using the microbeam technique (left) and unirradiated control (right). Since the analytic software returns intensity in inverted grey values, smaller numbers equal higher intensity. The plot profiles across the irradiated gel section show the highest intensity in the centre of the microbeams, where the chromatin in the nuclei is already denser than in non-irradiated cells at 24 h after MRT. In the microphotograph, the centres of the microbeam tracks can be seen as darker lines caused by the condensed chromatin of pyknotic nuclei subsequent to radiogenic damage. The plot profile obtained along the midline of the microphotograph shows intensity values very similar to those in the dose valleys of the irradiated section, while peak-dose features are absent.
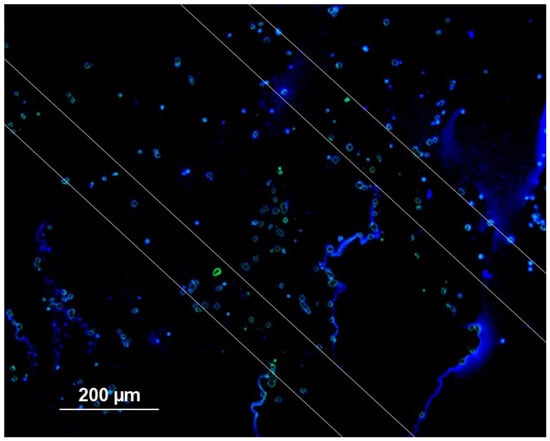
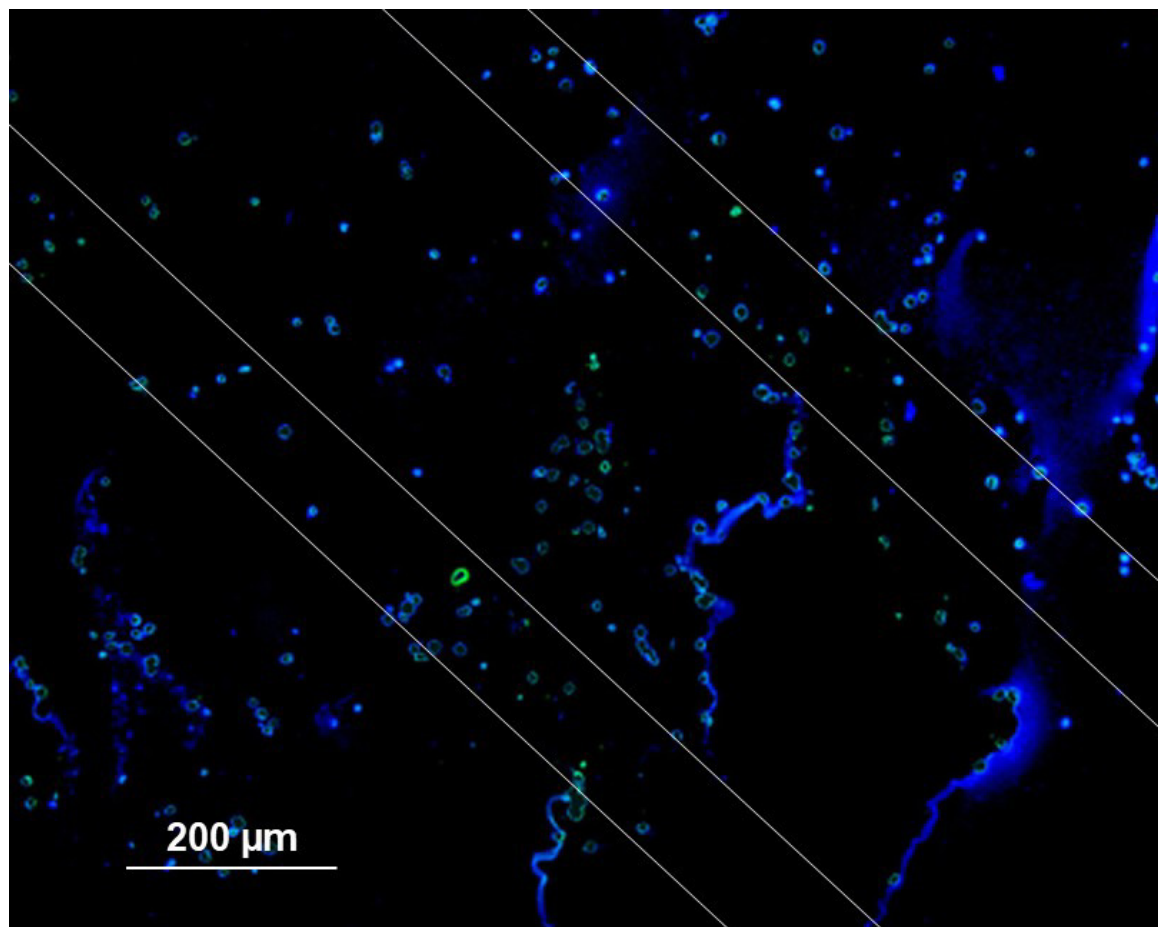
Figure 8.
γ-H2AX immunostain (green) of B16 melanoma cells. The white lines indicate the expected beam positions in this section adjoining the Nissl-stained section in Figure 6. The tracks of the microbeams are not seen as well as in the Nissl and H&E stains: they should have been seen between the parallel white lines. Blue immunofluorescence = DAPI.
Profile plots acquired across H&E sections reflect the typical microbeam geometry with peak (high-dose) and valley (low-dose) zones after microbeam irradiation and show the absence of peak-dose features in the non-irradiated control section (Figure 7). Unlike a registration of the microbeam field on radiochromic film, the line profile plot in the valley-dose zone (between the peaks) is not completely homogeneous. This can be explained by the fact that, in the valley zone, the dose is not high enough to lethally damage all cancer cells equally and immediately. They might either die a delayed cell death, within weeks or even months after irradiation, or require an additional irradiation dose.
The distances between the centres of the microbeams were measured in three different locations of the H&E section shown in Figure 6 and found to be 398.3 µm, 396.7 µm and 397.2 µm, respectively. This would correspond to a shrinkage of less than 1%, if we assume that the centre-to-centre distance of the microbeams was precisely 400 µm. The vertical white lines indicate the width of the microbeams. It should be mentioned, however, that the measurements in other samples varied between 389 µm and 407 µm. As in organic tissue, the precision of the visualised geometry depends on the angle of sectioning with respect to the central axis of the microbeam array.
In organic tissue, the tracks of the microbeams can be identified utilising γ-H2AX immunostain to highlight DNA double-strand breaks. The microbeam tracks would appear as parallel lines of the chosen immunofluorescent colour, spaced approximately 400 µm apart, thus mirroring the beam geometry/spatial dose distribution determined by the dimensions of the multislit collimator. However, as can be seen in Figure 8, a persuasive green line marking DNA double-strand breaks is missing in our samples.
4. Discussion
Tools frequently used in the testing of new therapeutic approaches include in-vitro and small-animal models. While the latter provide biological feedback mechanisms similar to those seen in veterinary and human patients with spontaneous cancers, their use is ethically questionable, even if it sometimes appears unavoidable. In-vitro models, on the other hand, lack the feedback mechanisms typical of mammalian organisms but avoid most of the ethical questions associated with small-animal models and can be designed to represent the tumour aspects most important in the question to be solved.
In bench-to-bedside studies not fulfilling the high expectations based on the results from in-vitro and in-vivo studies, therapeutic failure can often be attributed to experimental tumour environments failing to reflect real-world parameters which might, perhaps unexpectedly, contribute to the therapeutic success in the model and the lack thereof in real patients. These parameters can include extracellular matrix components and architecture, intercellular interactions and feedback mechanisms. In experimental radiotherapy, size and depth from surface are key parameters.
3D cell culture models have become established in cancer research with increasing success because they can simulate some relevant aspects of in-vivo systems better than the historically used 2D cell cultures [24,25]. Work in 3D cell culture matrices has correctly predicted therapeutic success in vivo [26,27]. Histological sections have been produced from spheroids embedded in agar, as described by Pinto et al. [4]. This model has been used in cancer research for preclinical screening and testing of new drug candidates before moving on to the more expensive and time-consuming animal models.
To support the development of a new radiotherapy technique like MRT, for instance, we are especially interested in anatomic mimicry and tumour environment. Anatomic mimicry is important because the shape and dimensions of a whole body or a body part determine the extent of X-ray absorption. The same applies to tumour depth from surface. With regard to tumour environment, the aspects most easily simulated physically are three-dimensionality and tumour size. The combination of tumour environment and anatomic mimicry can be achieved best in an anthropomorphic phantom or a veterinary phantom with slots for insertion of 3D samples. These phantoms should be produced from tissue-equivalent materials, to reproduce a real-life scenario of X-ray absorption, a key parameter in radiotherapy planning. 3D cell cultures based on an agar matrix are cost efficient and easy to produce, allowing a high sample throughput while testing different test scenarios. Mechanical stability is one of the requirements for sample handling, including fast sample turnover.
Radiobiological studies at the synchrotron, a powerful particle accelerator well suited to developing new radiotherapy techniques, typically require a high number of samples to be irradiated and processed within a very limited time period, because user time is awarded in a highly competitive process. Most synchrotron users have to travel long distances between their home institution and the synchrotron. Logistically, this leaves little time to prepare the samples for the irradiation experiment. Therefore, the first requirement for the 3D cell culture system to be developed was a fast and uncomplicated preparation process.
In our study, we have tested the suitability of agar to produce a mechanically stable matrix for three-dimensional growth of murine and human cancer cells with the future aim of inserting these structures into animal phantoms. Other research groups have already established the use of agar as a three-dimensional matrix for cell cultures of non-cancerous tissue [4]. The cells were described as showing a spherical growth pattern in different concentrations of agar. This is in agreement with our own observations (Figure 2).
We have shown that two-layered agar matrices can be used to produce 3D cancer cell cultures for the specific requirements of experimental radiotherapy at the synchrotron. As with mammalian tissues, we were able to produce sections from these 3D cultures and succeeded in histological staining.
In the analysis of organic tissues, the γ-H2AX immunostain can be used to directly visualise DNA double-strand breaks caused in the irradiation process, while H&E stain and Nissl stain provide morphological information visualising the results of DNA damage presenting, for instance, as pyknotic nuclei. It has been shown before that γ-H2AX immunostain is suitable for outlining DNA double-strand breaks as a consequence of irradiation [28,29,30]. Fernandez-Palomo et al. have described how H2AX foci can be used as a biomarker for targeted and non-targeted DNA damage after synchrotron microbeam irradiation [31]. In the sections of agar matrices in our study, after γ-H2AX immunostaining, some DNA damage was visible. However, no microbeam tracks highlighted green as a result of DNA double-strand breaks were identified. This is a clear limitation of this study. One reason could be a lack of sufficient cell density at the time of irradiation. As in mammalian tissues, an area of sufficient cell density would be needed to visualise microbeam tracks. In the case of tumour samples, this requires a stringent calculation of the number of cells injected, based on the cell-line-specific doubling time and the time intervals between seeding, irradiation and termination of the culture.
In the histological sections prepared with H&E and Nissl stain, linear traces of the microbeam tracks were visible as condensed chromatin in pyknotic nuclei. As a consequence of the dehydration process, which is part of the embedding procedure preceding the histological sectioning, the original shape of the matrix is slightly altered. Shrinking processes are well known from work with human or animal tissues. Overall, it seems that the preparation process for agar matrices is somewhat more demanding with regard to reproducibility, because the mechanical stability of the agar matrices is not as good as that of mammalian tissue.
5. Conclusions
We have produced and tested the potential of a new 3D cell culture model for use in experimental radiotherapy, specifically for MRT studies. It has been confirmed that both murine and human cells are suited to forming three-dimensional cell cultures in two-layered agar matrices. Like mammalian tissues, these samples can be sectioned and mounted for histological staining. As with mammalian tissue sections, dehydration in ethanol and embedding in paraffin can cause structural changes and subsequent partial loss of morphological information regarding the irradiation geometry. The samples are sufficiently mechanically stable to allow for removal from the well plates in which they are produced. They can be cut into shape according to the requirements of the experiment. They can be inserted into a phantom as needed. The agar matrix will remain intact even during transport under non-optimal conditions. It is thus a useful tool in irradiation studies, fast and easy to prepare at low cost.
6. Patents
Title: Method for long-term tracking of cells in vivo. # PD2008A000187 (Italy)
Patent holders: Ralf Menk, Elisabeth Schültke, Bernhard Juurlink and Chris Hall
Short description: Method for the tracking of living cells loaded with gold nanoparticles (GNP) to visualise migration patterns utilising X-ray techniques.
Comment: This patent was submitted in 2008 and has since expired.
Supplementary Materials
The following supporting information can be downloaded at: https://www.mdpi.com/article/10.3390/bioengineering13111242/s1, S1: Instruments and materials required to prepare 3D cell cultures; S2: Materials used for γ-H2AX immunofluorescence; Table S1: Cell numbers of naive and GNP-loaded cancer cells on days 3 and 7. The confidence interval is provided in brackets. Calculated in GraphPad Prism software as an unpaired t-test with Welch’s correction; Video S1: 3D visualisation of F98 glioma cells with GNP.
Author Contributions
Conceptualisation, M.L.S. and E.S.; methodology, M.L.S., S.F. and E.S.; software, S.F., R.M., J.K. and G.A.F.; validation, M.L.S., G.H. and E.S.; formal analysis, E.S.; investigation, M.L.S., J.S., F.J., L.K., S.F., C.M., F.A., R.M., J.K., G.A.F. and E.S.; resources, S.F., F.A., R.M., G.H. and E.S.; data curation, M.L.S. and E.S.; writing—original draft preparation, M.L.S. and E.S.; writing—all authors; visualisation, M.L.S., J.S. and R.M.; supervision, E.S. and G.H.; funding acquisition, S.F. and E.S. All authors have read and agreed to the published version of the manuscript.
Funding
DFG grant to E.S. (SCHU 2589/7-3).
Institutional Review Board Statement
Not applicable.
Informed Consent Statement
Not applicable.
Data Availability Statement
The original contributions presented in this study are included in the article.
Acknowledgments
Frauke Winzer, Department of Anatomy, University of Rostock, and Simone Rackow, Oscar Langendorf Institute of Physiology, University of Rostock, are thanked for the assistance in and teaching of histological processing. Tina Sellmann, Oscar Langendorf Institute of Physiology, University of Rostock, is thanked for recalibrating the microscope for image acquisition supporting the manuscript revision.
Conflicts of Interest
The authors declare no conflicts of interest.
Abbreviations
The following abbreviations are used in this manuscript:
| 2D/3D | Two-dimensional and three-dimensional, respectively |
| DESY | Deutsches Elektronen-Synchrotron |
| DNA | Deoxyribonucleic acid |
| GNP | Gold nanoparticles |
| MRT | Microbeam radiotherapy |
| MSC | Multislit collimator |
| PBF | Phosphate-buffered formalin |
| PBS | Phosphate-buffered saline |
| RNA | Ribonucleic acid |
| SFRT | Spatially fractionated radiotherapy |
| TEM | Transmission Electron Microscopy |
References
- Ding, Y.; Zhao, P.; Jin, Y.; Li, Y.; Wang, Z.; Lu, Y.; Zhang, Y.; Chen, H.; Zhang, W.; Luan, X.; et al. Biofabrication and artificial intelligence strategies for investigating solid- and fluid-pressure mechanobiology in pancreatic ductal adenocarcinoma. Cancer Metastasis Rev. 2026, 45, 60. [Google Scholar] [CrossRef] [Scilit]
- Aal, M.C.E.; Fioretto, M.N.; da Silva, T.D.; Guimarães, I.C.; Goldoni, A.C.S.; Rios, V.L.A.S.; Chuffa, L.G.A.; Delella, F.K. Three-dimensional cell cultures as an in vitro tool for ovarian cancer modeling and natural product discovery. Biomed. Pharmacother. 2026, 202, 119823, Corrigendum in Biomed. Pharmacother. 2026, 119967. [Google Scholar] [CrossRef] [Scilit]
- Kim, S.; Lam, P.Y.; Jayaraman, A.; Han, A. Uniform sized cancer spheroids production using hydrogel-based droplet microfluidics: A review. Biomed. Microdevices 2024, 26, 26. [Google Scholar] [CrossRef] [Scilit]
- Pinto, B.; Henriques, A.C.; Silva, P.M.A.; Bousbaa, H. Three-dimensional spheroids as in vitro preclinical models for cancer research. Pharmaceutics 2020, 12, 1186. [Google Scholar] [CrossRef] [Scilit]
- Friedrich, J.; Seidel, C.; Ebner, R.; Kunz-Schughart, L.A. Spheroid-based drug screen: Considerations and practical approach. Nat. Protoc. 2009, 4, 309–324. [Google Scholar] [CrossRef] [Scilit]
- Wang, J.; Annio, G.; Duwa, R.; Suryadevara, V.; Chang, E.; Daldrup-Link, H. Enhanced glioblastoma targeting and penetration: Extracellular matrix remodeling by collagenase-functionalized ferumoxytol nanoparticles. Nano Lett. 2026, 26, 10607–10616. [Google Scholar] [CrossRef] [Scilit]
- Tesfamariam, B.; Miller, N.J. Advances in microfluidic endothelium-on-chip for assessing endothelial function. J. Pharmacol. Toxicol. Methods 2026, 140, 108562. [Google Scholar] [CrossRef] [Scilit]
- Kempuraj, D.; Shi, H.; Truong, T.D.; Kong, D.; Sharma, A.; Ramesh Babu, P.R.; Belur, M.G.; Kothuru, S.P.; Chinnappan, B.; Pena, C.; et al. Brain-on-a-chip and blood-brain barrier-on-a-chip modeling for neurodegenerative disorders: Recent progress. Neuroscientist 2026, 32, 253–269. [Google Scholar] [CrossRef] [Scilit]
- Wu, M.; Yeo, M.; Derman, I.D.; Zhang, J.; Hou, Z.; Sang, H.; Ozbolat, I.T.; Wu, Y. Engineering heterogeneous tissues and organs via multi-material bioprinting: Advances, challenges, and opportunities. Acta Biomater. 2026, 22, 67–94. [Google Scholar] [CrossRef] [Scilit]
- Germain, N.; Dhayer, M.; Dekiouk, S.; Marchetti, P. Current advances in 3D bioprinting for cancer modeling and personalized medicine. Int. J. Mol. Sci. 2022, 23, 3432. [Google Scholar] [CrossRef] [Scilit]
- Choudhery, M.S.; Niaz, A.; Arif, T.; Mahmood, R. From monolayer to organoids and multi-organ microphysiological systems: Advancing regenerative medicine and precision therapies. Stem Cell Res. Ther. 2026, 17, 327. [Google Scholar] [CrossRef] [Scilit]
- Zhang, Y.; Huang, Z.; Wang, B.; Li, B.; Yang, Y. Three-dimensional bioprinted organoids: Advances and clinical translation. Regen. Biomater. 2026, 13, rbag142. [Google Scholar] [CrossRef] [Scilit]
- Mei, Y.; Lakotsenina, E.; Wegner, M.; Hehne, T.; Krause, D.; Hakimeh, D.; Wu, D.; Schültke, E.; Hausmann, F.; Kurreck, J.; et al. Three-dimensional-bioprinted non-small cell lung cancer models in a mouse phantom for radiotherapy research. Int. J. Mol. Sci. 2024, 25, 10268. [Google Scholar] [CrossRef] [Scilit]
- Jaekel, F.; Bräuer-Krisch, E.; Bartzsch, S.; Laissue, J.; Blattmann, H.; Scholz, M.; Soloviova, J.; Hildebrandt, G.; Schültke, E. Microbeam irradiation as a simultaneously integrated boost in a conventional whole-brain radiotherapy protocol. Int. J. Mol. Sci. 2022, 23, 8319. [Google Scholar] [CrossRef] [Scilit]
- Favaudon, V.; Caplier, L.; Monceau, V.; Pouzoulet, F.; Sayarath, M.; Fouillade, C.; Poupon, M.-F.; Brito, I.; Hupé, P.; Bourhis, J.; et al. Ultrahigh dose-rate FLASH irradiation increases the differential response between normal and tumor tissue in mice. Sci. Transl. Med. 2014, 6, 245ra93, Erratum in Sci. Transl. Med. 2019, 11, eaba4525. [Google Scholar] [CrossRef] [Scilit]
- Eling, L.; Verry, C.; Balosso, J.; Flandin, I.; Kefs, S.; Bouchet, A.; Adam, J.-F.; Laissue, J.A.; Serduc, R. Neurologic changes induced by whole-brain synchrotron microbeam irradiation: 10-month behavioral and veterinary follow-up. Int. J. Radiat. Oncol. Biol. Phys. 2024, 120, 178–188. [Google Scholar] [CrossRef] [Scilit]
- Siegbahn, E.A.; Stepanek, J.; Bräuer-Krisch, E.; Bravin, A. Determination of dosimetrical quantities used in microbeam radiation therapy (MRT) with Monte Carlo simulations. Med. Phys. 2006, 33, 3248–3259. [Google Scholar] [CrossRef] [Scilit]
- Schültke, E.; Menk, R.; Pinzer, B.; Astolfo, A.; Stampanoni, M.; Arfelli, F.; Harsan, L.-A.; Nikkhah, G. Single-cell resolution in high-resolution synchrotron X-ray CT imaging with gold nanoparticles. J. Synchrotron Radiat. 2014, 21, 242–250. [Google Scholar] [CrossRef] [Scilit]
- Menk, R.H.; Schültke, E.; Hall, C.; Arfelli, F.; Astolfo, A.; Rigon, L.; Round, A.; Ataelmannan, K.; MacDonald, S.R.; Juurlink, B.H.J. Gold nanoparticle labeling of cells is a sensitive method to investigate cell distribution and migration in animal models of human disease. Nanomedicine 2011, 7, 647–654. [Google Scholar] [CrossRef] [Scilit]
- Frens, G. Controlled nucleation for the regulation of the particle size in monodisperse gold suspensions. Nat. Phys. Sci. 1973, 241, 20–22. [Google Scholar] [CrossRef] [Scilit]
- Schültke, E.; Fiedler, S.; Mewes, C.; Gargioni, E.; Klingenberg, J.; Abreu Faria, G.; Lerch, M.; Petasecca, M.; Prehn, F.; Wegner, M.; et al. The Microbeam Insert at the White Beam Beamline P61A at the Synchrotron PETRA III/DESY: A New Tool for High Dose Rate Irradiation Research. Cancers 2022, 14, 5137. [Google Scholar] [CrossRef] [Scilit]
- Bräuer-Krisch, E.; Requardt, H.; Brochard, T.; Berruyer, G.; Renier, M.; Laissue, J.A.; Bravin, A. New technology enables high precision multislit collimators for microbeam radiation therapy. Rev. Sci. Instrum. 2009, 80, 74301. [Google Scholar] [CrossRef] [Scilit]
- Juurlink, B.H.; Devon, R.M. Macromolecular translocation--a possible function of astrocytes. Brain Res. 1990, 533, 73–77. [Google Scholar] [CrossRef] [Scilit]
- Pal, S.; Mhatre, S.; Sandbhor, P. Nanotechnology-stem cell strategies in 3D glioblastoma organoid: Targeting glioma stem cells within a complex tumor microenvironment. Methods Mol. Biol. 2026, 1–23. [Google Scholar] [CrossRef] [Scilit]
- Yao, L.J.; Xie, P.L.; Huang, T.X.; Xiao, J.S.; Zhu, Z.T.; Liu, S.; Wang, T.Y.; Qi, T. 3D bioprinting for tumor microenvironment reconstruction: Advances, challenges, and future perspectives. Biotechnol. J. 2026, 21, e70267. [Google Scholar] [CrossRef] [Scilit]
- Park, C.C.; Zhang, H.J.; Yao, E.S.; Park, C.J.; Bissell, M.J. β1 Integrin inhibition dramatically enhances radiotherapy efficacy in human breast cancer xenografts. Cancer Res. 2008, 68, 4398–4405. [Google Scholar] [CrossRef] [Scilit]
- Eke, I.; Deuse, Y.; Hehlgans, S.; Gurtner, K.; Krause, M.; Baumann, M.; Shevchenko, A.; Sandfort, V.; Cordes, N. β1 Integrin/FAK/cortactin signaling is essential for human head and neck cancer resistance to radiotherapy. J. Clin. Investig. 2012, 122, 1529–1540. [Google Scholar] [CrossRef] [Scilit]
- Mah, L.-J.; El-Osta, A.; Karagiannis, T.C. γ-H2AX: A sensitive molecular marker of DNA damage and repair. Leukemia 2010, 24, 679–686. [Google Scholar] [CrossRef] [Scilit]
- Kuo, L.J.; Yang, L.-X. Gamma-H2AX—A novel biomarker for DNA double-strand breaks. In Vivo 2008, 22, 305–309. [Google Scholar]
- Luczak, M.W.; Zhitkovich, A. Monoubiquitinated γ-H2AX: Abundant product and specific biomarker for non-apoptotic DNA double-strand breaks. Toxicol. Appl. Pharmacol. 2018, 355, 238–246. [Google Scholar] [CrossRef] [Scilit]
- Fernandez-Palomo, C.; Mothersill, C.; Bräuer-Krisch, E.; Laissue, J.; Seymour, C.; Schültke, E. γ-H2AX as a marker for dose deposition in the brain of Wistar rats after synchrotron microbeam radiation. PLoS ONE 2015, 10, e0119924. [Google Scholar] [CrossRef] [Scilit]
Disclaimer/Publisher’s Note: The statements, opinions and data contained in all publications are solely those of the individual author(s) and contributor(s) and not of MDPI and/or the editor(s). MDPI and/or the editor(s) disclaim responsibility for any injury to people or property resulting from any ideas, methods, instructions or products referred to in the content. |
© 2026 by the authors. Licensee MDPI, Basel, Switzerland. This article is an open access article distributed under the terms and conditions of the Creative Commons Attribution (CC BY) license.