


Abstract
Drought persistence and delayed recovery remain major challenges for drought monitoring in semi-arid environments, where precipitation variability interacts with slowly evolving land-surface conditions. Although precipitation-based indicators effectively characterize meteorological drought, they often provide limited information on the persistence and recovery of integrated dry land-surface states. This study investigates soil moisture persistence and coupled drought-state variability in a semi-arid mountainous region of the southern Peruvian Andes using long-term satellite and reanalysis datasets of precipitation (CHIRPS), root-zone soil moisture (ERA5-Land), vegetation conditions (NDVI), and land surface temperature (LST). Soil moisture persistence was characterized using percentile-based metrics, duration analysis, and temporal persistence diagnostics to evaluate the continuity of dry conditions beyond precipitation anomalies. To synthesize hydroclimatic forcing and land-surface variability within a common framework, an Integrated Drought State (IDS) was developed by combining standardized precipitation, soil moisture, vegetation, and thermal indicators into a simplified diagnostic representation of coupled drought-state variability. The results show measurable temporal persistence in soil moisture together with distinct temporal responses in vegetation and surface thermal conditions, indicating that drought-state continuity reflects coupled land-surface behavior beyond precipitation anomalies alone. Persistent thermal anomalies and reduced vegetation activity co-evolve with soil moisture depletion, indicating that land-surface responses adjust more slowly than atmospheric forcing. The IDS captures the coherent temporal evolution of precipitation, soil moisture, vegetation, and surface thermal conditions during prolonged dry periods, providing an integrated representation of drought-state variability across the study region. Overall, the findings emphasize the importance of incorporating slowly varying land-surface conditions, particularly soil moisture persistence, alongside hydroclimatic forcing to improve the interpretation of drought persistence and recovery in semi-arid mountainous environments.
1. Introduction
Droughts are among the most complex hydrological hazards due to their slow onset, prolonged persistence, and strong coupling between atmospheric forcing and land surface processes. Unlike floods, droughts emerge from cumulative deficits across multiple components of the hydrological cycle, including precipitation, evapotranspiration, soil moisture, and vegetation dynamics. As a consequence, drought impacts often lag behind meteorological anomalies and may persist even after rainfall conditions recover, posing major challenges for drought monitoring and interpretation [1,2].
Drought characterization has traditionally relied on precipitation-based indicators such as the Standardized Precipitation Index (SPI) and related metrics [3]. These indices are effective for identifying meteorological drought conditions and precipitation deficits across multiple timescales. However, precipitation anomalies alone often provide limited insight into drought persistence, delayed recovery, and the temporal continuity of land-surface impacts, particularly at sub-seasonal to seasonal timescales. Numerous studies have shown that the duration and severity of drought impacts cannot be explained solely by precipitation forcing, especially in regions where land–atmosphere interactions and soil–vegetation processes exert strong controls on surface hydrological states [4,5].
Among the different components of the terrestrial water cycle, soil moisture occupies a particularly important role because it integrates antecedent precipitation, atmospheric demand, soil properties, and vegetation activity over time. Through its inherent memory, soil moisture can sustain dry conditions well beyond the cessation of meteorological anomalies, thereby modulating drought duration, recovery, and ecosystem response [6,7]. This persistence effect is especially relevant in water-limited and semi-arid environments, where limited storage capacity and strong evaporative demand amplify land–atmosphere coupling and prolong dry states [8,9].
The importance of soil moisture persistence has motivated increasing interest in integrated drought representations that combine multiple hydroclimatic and land-surface variables. Previous studies have developed composite and multivariate drought frameworks incorporating precipitation, soil moisture, vegetation activity, and thermal conditions to better characterize drought evolution and impacts. These include composite drought indices (CDI) developed to integrate multiple drought-related variables [10], multivariate composite drought indices (MCDI) that additionally account for lagged and cumulative drought effects [11] and coupled soil moisture–vegetation approaches that seek to represent drought as a multidimensional process rather than as a purely precipitation-driven phenomenon. While such approaches improve drought characterization, many remain primarily event-oriented or static representations and often provide limited insight into the temporal persistence and lagged behavior of coupled land-surface states.
Recent advances in remote sensing now provide consistent observations of soil moisture, vegetation dynamics, and land surface temperature (LST) at spatial and temporal scales relevant for drought analysis [12,13]. These datasets offer opportunities to move beyond forcing-based drought characterization toward state-based analyses that explicitly account for persistence and delayed recovery in land-surface conditions. In particular, jointly analyzing precipitation, soil moisture, vegetation activity, and thermal dynamics can provide insight into how drought conditions evolve and persist in water-limited environments.
Semi-arid mountainous regions of the Peruvian Andes provide a particularly relevant setting for examining these dynamics. These environments are characterized by strong hydroclimatic seasonality, limited soil water storage, high evapotranspirative demand, and strong sensitivity of vegetation and surface energy balance to antecedent moisture conditions. Despite their hydrological and ecological importance, drought persistence dynamics in these regions remain comparatively understudied, particularly from an integrated land-surface perspective.
In this context, this study investigates the persistence characteristics of precipitation, soil moisture, vegetation activity, and land-surface thermal conditions in a semi-arid Andean region of Peru. Using long-term satellite-derived precipitation, root-zone soil moisture, normalized difference vegetation index (NDVI), and land surface temperature (LST), we analyze how antecedent soil moisture conditions contribute to the temporal continuity of integrated dry-state conditions beyond what is captured by precipitation anomalies alone. To support this analysis, we employ an Integrated Drought State (IDS) representation as a simplified diagnostic framework for examining coupled land-surface drought dynamics and persistence across the study domain.
2. Materials and Methods
2.1. Study Area and Hydroclimatic Context
The study focuses on a semi-arid mountainous region located in the southern Peruvian Andes, within the department of Ayacucho (Figure 1). The study domain covers approximately 43,598 km2 and consists of high-elevation terrain characterized by strong hydroclimatic seasonality, complex topography, and limited water storage capacity. These conditions are representative of semi-arid Andean environments where hydrological behavior is strongly influenced by antecedent moisture conditions and seasonal precipitation variability.
Figure 1.
Location and physiographic setting of the study domain in the southern Peruvian Andes (Ayacucho, Peru). The map shows the administrative boundary and regional elevation gradient (m a.s.l.), while the inset indicates the location of the study area within South America and Peru. Photographic panels illustrate representative environmental conditions and drought-related land-surface impacts across the study region.
The analyses presented here were designed to characterize temporal variability at the regional, study-domain scale rather than spatially resolved drought behavior within individual landscapes. Accordingly, the persistence and recovery metrics reported below refer to domain-aggregated hydroclimatic and land-surface states and should not be interpreted as spatially uniform properties throughout Ayacucho.
The regional climate is dominated by a marked wet–dry seasonal cycle, with most annual precipitation concentrated during the austral summer months (approximately December to March), while the remainder of the year is characterized by limited rainfall and enhanced atmospheric drying conditions. Based on the CHIRPS v2.0 precipitation dataset used in this study (1996–2025; Section 2.2), mean annual precipitation across the study domain ranges approximately from 1200 to 1600 mm, reflecting pronounced spatial heterogeneity associated with the region’s complex topography. This strong seasonality promotes recurrent dry antecedent conditions that influence soil moisture depletion, recharge dynamics, and the temporal persistence of land-surface dry states [14].
The study region is characterized by steep terrain, shallow soils, sparse vegetation cover in some sectors, and limited surface and subsurface storage capacity. These characteristics favor relatively rapid soil moisture depletion during dry periods and gradual recovery following precipitation events. In addition, the combination of strong seasonality, thin soils, and high evaporative demand enhances interactions between soil moisture, vegetation conditions, and surface thermal dynamics. Similar characteristics have been widely associated with enhanced drought persistence and nonlinear hydrological responses in semi-arid mountainous environments [2,5].
From a hydrological perspective, the study region provides an appropriate natural laboratory to investigate drought persistence and land-surface memory processes beyond precipitation anomalies alone. In water-limited mountainous systems with limited buffering capacity, antecedent soil moisture conditions can exert an important influence on drought duration, delayed recovery, and the temporal continuity of dry states [6,7]. Although the analysis is conducted for a specific regional domain, the processes examined are relevant to drought research in other semi-arid Andean environments; however, the magnitude and persistence timescales reported here are specific to the domain-aggregated behavior of the present study area and should not be assumed to characterize individual landscapes or other mountainous regions directly.
Given the scarcity of long-term in situ observations in the region, satellite and reanalysis datasets provide a consistent and spatially explicit basis for characterizing hydroclimatic forcing and land-surface conditions across the study domain. The integration of these datasets enables the analysis of soil moisture dynamics and coupled land-surface variability at spatial and temporal scales relevant to drought persistence studies in data-scarce mountainous regions [12,15].
2.2. Hydroclimatic Forcing and Antecedent Conditions
Hydroclimatic forcing was characterized through the joint analysis of precipitation and atmospheric demand, which together define the primary external drivers influencing soil moisture dynamics and antecedent land-surface conditions. Rather than treating these components independently, they were analysed as coupled forcings regulating moisture accumulation, depletion, and persistence at the study-domain scale.
Precipitation was represented using the Climate Hazards Center InfraRed Precipitation with Station data (CHIRPS, version 2.0), which provides long-term, spatially continuous daily precipitation estimates at approximately 0.05° (~5.6 km) spatial resolution over the study area for the period 1996–2025.
The use of CHIRPS in complex mountainous terrain is subject to uncertainty associated with strong orographic precipitation gradients, elevation-dependent biases, and the sparse distribution of rain gauges used to constrain satellite-based estimates. Validation studies across the Andes have shown that CHIRPS can reproduce seasonal and interannual precipitation variability and broad spatial patterns, while its performance and precipitation magnitude may vary with elevation, topographic complexity, and gauge availability. Accordingly, CHIRPS is used here primarily to characterize regional-scale temporal precipitation variability and drought anomalies rather than as an exact representation of local precipitation amounts [16,17].
To characterize precipitation variability and identify prolonged dry conditions, precipitation anomalies were standardized using the Standardized Precipitation Index [3]. The SPI was calculated at multiple accumulation timescales to characterize precipitation deficits across different temporal scales. SPI-6 was retained for the descriptive characterization of seasonal meteorological drought conditions, whereas SPI-1 and SPI-3 were used in the lagged hydroclimatic analyses. SPI-3 was selected as the meteorological component of the IDS because it represents short-term accumulated precipitation conditions at a timescale relevant to land-surface drought development [2,18].
The SPI was calculated by fitting a gamma distribution to accumulated precipitation totals and subsequently transforming the cumulative probability to the standard normal distribution. The calculation was performed separately for each calendar month and accumulation timescale. For each calendar-month sample, the gamma distribution was fitted only to positive precipitation totals, with the location parameter fixed at zero. Zero-precipitation observations were explicitly accommodated through their empirical probability, q0. Thus, the cumulative probability was calculated as:
and the SPI was subsequently obtained as:
Here, G(x) denotes the cumulative distribution function of the gamma distribution fitted to positive accumulated precipitation values, q0 is the empirical probability of zero precipitation, and Φ−1 is the inverse standard normal distribution. The available monthly precipitation record for the analysis period was used as the reference sample, with distributions fitted separately for each calendar month and accumulation timescale. Negative SPI values indicate drier-than-normal conditions, whereas positive values indicate wetter-than-normal conditions.
Land surface thermal conditions were represented using land surface temperature (LST) derived from the MODIS Terra MOD11A1 v061 product, which provides daily observations at 1 km spatial resolution for 2000–2025. LST was interpreted as an indicator of surface thermal conditions rather than as a direct measurement of atmospheric evaporative demand. Daily observations were quality controlled and subsequently aggregated to calendar-month means for all analyses requiring comparison with precipitation, soil moisture, and NDVI. Monthly LST anomalies were calculated relative to the corresponding calendar-month climatology, thereby reducing the influence of the recurrent annual cycle [13,15]. Consequently, all quantitative comparisons of temporal persistence among hydroclimatic and land-surface variables were performed at a common monthly resolution.
Antecedent hydroclimatic conditions were examined through lagged statistical relationships between precipitation indicators, surface thermal conditions, and subsequent land-surface states. These temporal relationships were evaluated independently of IDS construction and were not embedded as lagged terms within the composite indicator. Instead, lag analyses were used to examine whether hydroclimatic anomalies were statistically associated with subsequent changes in soil moisture and vegetation conditions over monthly timescales.
By jointly characterizing precipitation deficits and surface thermal conditions, this framework provides a complementary representation of hydroclimatic and land-surface conditions associated with soil moisture depletion and delayed recovery. These antecedent conditions form the basis for subsequent analyses of soil moisture persistence and integrated dry-state dynamics.
2.3. Soil Moisture Persistence and Temporal Dynamics
Soil moisture was analyzed as a land-surface state variable associated with drought persistence and land-surface susceptibility at the study-domain scale. Rather than treating soil moisture as a passive response to precipitation anomalies, the analysis focused explicitly on its temporal dynamics, persistence, and memory, which reflect the combined influence of antecedent precipitation, surface thermal conditions, soil properties, and vegetation modulation over time.
Root-zone soil moisture was obtained from the ERA5-Land Monthly Aggregated reanalysis product (ECMWF). ERA5-Land represents volumetric soil water in four soil layers: 0–7 cm, 7–28 cm, 28–100 cm, and 100–289 cm. To characterize root-zone soil moisture over the upper 1 m of the soil profile, we combined the first three layers (0–7, 7–28, and 28–100 cm) using a depth-weighted mean. Specifically, monthly root-zone soil moisture was calculated as:
where SM1, SM2, and SM3 are the volumetric soil-water contents (m3 m−3) of ERA5-Land layers 1, 2, and 3, respectively. Because the combined thickness of these layers is exactly 1.0 m, the coefficients correspond directly to their fractional contributions to the 0–1 m profile. Monthly estimates covering 2000–2025 were subsequently aggregated over the study domain using area-weighted averaging.
This aggregation was intentionally used to characterize the regional temporal signal rather than local spatial variability. Area-weighted averaging reduces sensitivity to unequal grid-cell representation across the domain but necessarily smooths localized anomalies associated with elevation, slope, aspect, soil depth, vegetation cover, and other landscape controls. Consequently, all soil-moisture persistence metrics derived from the aggregated series represent domain-mean temporal behavior and are not interpreted as persistence estimates for individual grid cells or local environments.
Sensitivity of the categorical soil-moisture classification was evaluated using three alternative dry/wet percentile pairs (P10/P90, P15/P85, and P25/P75) relative to the P20/P80 reference classification. For each alternative, we quantified the overall monthly classification agreement and the temporal overlap of dry and wet states using the Jaccard index. Because these percentile thresholds define categorical soil-moisture states only, this sensitivity analysis does not alter the continuous SMz component used in the IDS formulation. Detailed results are provided in the Supplementary Materials.
Temporal resolution was standardized to monthly values to match the characteristic timescales of drought propagation and persistence in semi-arid systems [4,7].
To characterize soil moisture variability under both dry and wet conditions, soil moisture time series were transformed into a non-parametric standardized framework based on empirical percentiles. Percentile ranks were calculated non-parametrically from the empirical distribution of soil-moisture observations, without assuming an underlying theoretical probability distribution. Tied observations were assigned the average of the ranks that they would otherwise occupy (mid-rank treatment). The resulting empirical percentile PSM,t was subsequently transformed to a standard-normal score using the inverse standard-normal cumulative distribution function,
For each calendar month, the empirical cumulative distribution function (ECDF) was computed, and soil moisture values were mapped to percentile ranks ():
where is the soil moisture value at time , represents the historical soil moisture observations for the same calendar month, is the sample size, and is the indicator function. This approach avoids assumptions regarding distributional form and allows a consistent comparison of soil moisture states across seasons.
Dry and wet soil-moisture states were defined using month-specific empirical percentile thresholds. Anomalously dry conditions were classified as percentile values ≤ 0.20, normal conditions as values > 0.20 and <0.80, and anomalously wet conditions as values ≥ 0.80. These thresholds were used only for the categorical characterization of soil-moisture states and were not directly used in the continuous IDS formulation. For IDS construction, the month-specific empirical percentile was transformed through the inverse standard-normal cumulative distribution function to obtain SMz. Persistence of categorical dry states was characterized from continuous periods below the dry threshold.
Seasonal soil-moisture variability was removed using a calendar-month climatological anomaly approach. For each calendar month, the long-term monthly mean was calculated over the common analysis period and subtracted from the corresponding monthly observations, thereby removing the recurrent mean annual cycle while retaining interannual and lower-frequency variability. For the revised persistence analysis, these deseasonalized monthly anomalies were additionally linearly detrended prior to autocorrelation estimation. Autocorrelation was therefore calculated from the deseasonalized and detrended monthly series rather than from a seasonal component obtained through a separate decomposition algorithm. This procedure was applied consistently to the monthly variables used in the common-resolution persistence comparison.
Temporal persistence was quantified using autocorrelation analysis at a common monthly resolution. For direct comparison, monthly precipitation anomalies, SPI, root-zone soil moisture, NDVI, and LST were evaluated using the same lag unit, such that lag k represents k months for every variable. Prior to persistence estimation, the recurrent calendar-month climatology was removed where applicable, and linear detrending was used as a robustness test to distinguish short-term temporal dependence from persistence associated with long-term trends.
The lag autocorrelation coefficient () was computed as:
Persistence was summarized using the lag-1 autocorrelation coefficient (ACF1) and the number of consecutive monthly lags for which autocorrelation remained statistically distinguishable from zero. This common-resolution framework prevents direct comparison of persistence estimates obtained from incompatible sampling intervals. In particular, the original daily LST autocorrelation was not used for quantitative comparison with monthly soil moisture, precipitation, or vegetation persistence. SPI-3 was interpreted separately because consecutive 3-month accumulation windows share observations; therefore, part of its autocorrelation is structurally induced by the overlapping accumulation procedure and should not be interpreted as purely physical land-surface memory [6,7].
To further examine drying and recovery dynamics, standardized soil moisture anomalies and their temporal increments (\Delta SM) were analyzed to identify asymmetric behavior between depletion and rewetting phases, indicative of nonlinear responses commonly observed in semi-arid environments [9]. Additional methodological details are provided in the Supplementary Materials.
Together, the percentile-based characterization, deseasonalized persistence metrics, and memory diagnostics quantify soil moisture persistence and temporal continuity of dry states across the study domain. These analyses form the basis for examining the relationship between antecedent hydroclimatic conditions and drought persistence in subsequent sections.
2.4. Land Surface Modulation of Soil Moisture
Land-surface conditions were analyzed to evaluate their influence on soil moisture dynamics and persistence through vegetation cover and surface energy balance. Vegetation conditions and atmospheric energy availability affect both the rate of soil moisture depletion during dry periods and the pace of recovery following precipitation, particularly in semi-arid environments characterized by strong seasonal water limitation.
Vegetation conditions were represented using the Normalized Difference Vegetation Index (NDVI) derived from the MODIS Terra MOD13Q1 Collection 6.1 (MOD13Q1.061) vegetation-index product, acquired by the Moderate Resolution Imaging Spectroradiometer (MODIS) onboard the Terra satellite. The native product provides vegetation-index observations at 250 m spatial resolution and 16-day temporal resolution. Observations covering 2000–2025 were aggregated to calendar-month means over the study domain, and only the common February 2000–November 2025 period was used in the integrated IDS and comparative persistence analyses. NDVI was interpreted as an indicator of vegetation greenness and canopy condition rather than as a direct measure of ecosystem productivity or vegetation water use.
No additional pixel-level filtering based on the MOD13Q1 quality-assurance layers was applied prior to the domain-level temporal aggregation. Consequently, residual effects associated with clouds, aerosols, or other retrieval-quality limitations may remain in the NDVI record. The use of spatially aggregated monthly values and subsequent calendar-month normalization reduces the influence of isolated anomalous observations but does not constitute an explicit quality-assurance filter; this limitation is therefore considered when interpreting NDVI-based drought signals.
To reduce the influence of the strong seasonal vegetation cycle, NDVI was normalized separately within each calendar month. For each month of the year, valid NDVI observations were converted to empirical percentile ranks based on their historical month-specific distribution, with tied observations assigned their average rank. The resulting percentiles were transformed using the inverse standard-normal cumulative distribution function to obtain NDVIz. This procedure produces negative values for vegetation conditions below the corresponding seasonal norm and positive values for comparatively greener conditions, while preserving a common approximately standardized scale for integration with the other IDS components. NDVI was interpreted as an indicator of vegetation greenness and structural land-surface condition rather than as a direct measure of productivity or vegetation water use.
Surface thermal conditions associated with drought development were characterized using land surface temperature (LST). LST was treated as an indicator of the thermal state of the land surface, reflecting interactions among surface energy balance, vegetation condition, and moisture availability, rather than as a direct measure of atmospheric evaporative demand or potential evapotranspiration. Temporal persistence and seasonal patterns in LST anomalies were therefore analyzed to characterize sustained surface thermal anomalies associated with soil-moisture variability and dry-state persistence.
Lagged associations among hydroclimatic and land-surface variables were evaluated at monthly lags from 0 to 12 months, with positive lag k indicating that the predictor preceded the response by k months. The analysis included monthly precipitation anomaly → soil moisture, SPI-1 → soil moisture, SPI-3 → soil moisture, soil moisture → NDVI, and soil moisture → LST drought-state relationships. To reduce the influence of low-frequency trends on cross-correlation estimates, the standardized analysis series were linearly detrended before lagged inference. Pearson correlation coefficients were calculated at each lag. Because conventional correlation significance tests can be anticonservative for serially autocorrelated time series, statistical inference was corrected using an effective sample size based on the temporal dependence of the paired series. In addition, 95% confidence intervals for each lagged correlation were estimated using a moving-block bootstrap with 2000 resamples and a block length of six months, thereby preserving short-range temporal dependence within resampled sequences. To account for multiple comparisons across the 13 evaluated lags within each predictor–response relationship, p-values were adjusted using the Benjamini–Hochberg false-discovery-rate procedure at α = 0.05. A lagged association was considered robust only when the FDR-adjusted test remained significant and the moving-block-bootstrap 95% confidence interval excluded zero. Lag values corresponding to maximum correlation were treated descriptively and were not interpreted as causal response times.
This lagged framework was used to characterize the temporal ordering and persistence of statistical associations among precipitation forcing, soil moisture, vegetation conditions, and surface thermal state. Because correlation does not establish causation, the resulting lag structure was interpreted as evidence of temporal association rather than formal process attribution. The analysis was therefore used to identify robust periods of statistical coupling and delayed land-surface response while explicitly accounting for serial dependence and multiple testing.
2.5. Integrated Drought-State Representation
To synthesize meteorological forcing and land-surface conditions within a common diagnostic framework, an Integrated Drought State (IDS) was constructed from four monthly components: the 3-month Standardized Precipitation Index (SPI-3), root-zone soil moisture, NDVI, and land surface temperature (LST). The IDS was not intended as a new operational drought index or forecasting product, but as a standardized representation of the contemporaneous state of coupled hydroclimatic and land-surface conditions.
Because the input datasets have unequal temporal coverage, all integrated analyses were restricted to their common period of availability. Although the precipitation and vegetation records extend back to 1996, the availability of the MODIS LST record constrained the common analysis period. Accordingly, IDS construction and all direct monthly comparisons among precipitation, soil moisture, NDVI, and LST were performed from February 2000 through November 2025 (n = 310 months). Observations outside this common interval were retained only for dataset-specific descriptive analyses and were not used to construct the IDS. No temporal extrapolation or padding was applied to extend shorter records.
Because the objective was to examine regional temporal drought dynamics, the IDS components represent spatially aggregated conditions over the common study domain. The resulting IDS therefore describes the integrated domain-mean drought state through time; it is not a spatial drought map and does not imply that all locations within the domain experienced the same drought magnitude, timing, or persistence.
Spatial harmonization.
The study-domain boundary was uploaded to Google Earth Engine (GEE) and used as a common spatial mask for all datasets. CHIRPS precipitation, MODIS NDVI, MODIS LST, and ERA5-Land soil moisture were processed within this same geographic domain while retaining their native spatial resolutions. No common-grid reprojection or resampling was performed for cross-dataset harmonization. Instead, domain-representative values were extracted independently from each product over the shared study-area polygon at its native spatial resolution and subsequently aggregated to the temporal resolution required for analysis. Daily or submonthly products were aggregated to calendar-month values, whereas monthly products were used directly. This approach avoided unnecessary spatial interpolation among datasets with different native resolutions and ensured that all variables represented the same geographic domain before integration. All direct cross-variable comparisons and IDS calculations were restricted to the common February 2000–November 2025 period.
Before aggregation, all components were transformed to a common approximately standardized scale and oriented such that negative values consistently represented drought-like conditions. SPI-3 was obtained by fitting a gamma distribution to 3-month accumulated precipitation separately for each calendar month and transforming cumulative probabilities to the standard-normal distribution. Soil moisture was ranked separately within each calendar month using empirical percentile ranks, with tied observations assigned their average rank. Percentiles were subsequently transformed using the inverse standard-normal cumulative distribution function to obtain SMz. NDVI was processed analogously, producing a month-wise normalized NDVIz. LST was standardized separately for each calendar month using its climatological mean and standard deviation and multiplied by −1, such that anomalously warm surface conditions were represented by negative LSTdrought values. Thus, all four components shared the same directional interpretation: negative values indicated increasingly drought-like conditions and positive values indicated comparatively wetter or more favorable states.
Because these transformed IDS components are expressed as standard-normal-type quantities, they are theoretically unbounded on the real-number scale. Their empirical ranges over the finite February 2000–November 2025 analysis period are necessarily finite and reflect only the values observed during the study interval rather than fixed bounds imposed by the transformations.
The baseline IDS at month t was calculated using equal weights:
Equal weighting was selected as the primary formulation because no independent evidence was available to prescribe a priori unequal physical weights, and because equal contributions provide a transparent diagnostic representation without optimizing the index against the same variables used to construct it. The resulting continuous IDS was subsequently standardized over the common analysis period to obtain IDSz, which was used for drought-state thresholding and event analysis.
Robustness to the weighting and variable-selection assumptions was evaluated through a structured sensitivity analysis. Four alternative formulations assigned a weight of 0.40 to one component while assigning 0.20 to each of the remaining components. Additional leave-one-component-out formulations were calculated by excluding SPI-3, soil moisture, NDVI, or LST individually. A data-driven alternative was also generated from the first principal component (PC1) of the four standardized inputs, with its sign oriented to agree with the baseline IDS. Each alternative formulation was compared with the equal-weight IDS using Pearson correlation, Spearman rank correlation, RMSE, mean absolute error, bias, drought-month agreement, event characteristics, and persistence metrics. This analysis was used to determine whether the temporal behavior and drought classification of the IDS were robust to reasonable changes in weighting and formulation rather than artifacts of the baseline equal-weight specification.
Drought events were identified from the standardized baseline IDS (IDSz) using a threshold of IDSz ≤ −1.0. An event began with the first month of a sequence containing at least three consecutive months at or below this threshold and ended with the last consecutive month satisfying the same criterion. Internal interruptions above the threshold were not permitted; therefore, any return above −1.0 terminated the event. Events shorter than three consecutive months were excluded from event-level analyses. For each event, duration was calculated as the number of consecutive drought months, peak severity as the absolute value of the minimum IDSz, mean intensity as the mean absolute IDSz during the event, and cumulative severity as the sum of absolute IDSz values over the complete event duration. Six events satisfied these criteria during the common analysis period.
Relationships between event duration and drought severity were evaluated separately using peak severity, mean event intensity, and cumulative severity. Pearson correlation, Spearman rank correlation, and simple linear regression were calculated for each relationship. Because only six qualifying events were available, uncertainty was additionally evaluated using 10,000 event-level bootstrap resamples, and interpretation emphasized effect sizes and confidence intervals rather than binary significance alone. Cumulative severity was interpreted cautiously because it increases mathematically with both event duration and drought magnitude; consequently, the duration–cumulative-severity relationship was not treated as independent evidence that longer events were intrinsically more intense. Peak severity and mean intensity were used as the primary checks for a potential duration-dependent sampling effect.
Particular attention was given to a formulation excluding soil moisture (IDSnoSM), calculated from SPI-3, NDVI, and inverted LST anomalies only. This formulation was used specifically as a circularity test to determine whether the persistence and delayed recovery of the integrated land-surface state remained detectable when soil moisture was not mathematically embedded in the composite.
All component values entered the IDS contemporaneously; temporal lags were not embedded in the composite itself. Persistence, delayed responses, and lagged associations were instead evaluated independently using the time-series procedures described in the subsequent analyses. This separation prevents temporal-memory assumptions from being imposed directly on the construction of the integrated state.
Event termination and post-drought recovery were treated as distinct concepts. Threshold recovery was defined as the first month after the event minimum for which IDSz > −1.0, whereas neutral recovery was defined as the first month reaching IDSz ≥ 0. Neutral recovery was searched for up to 24 months after the event minimum.
2.6. IDS Validation Against Meteorological Drought and Documented Events
The IDS was evaluated against independent drought information using two complementary strategies. First, SPI-1 and SPI-3 were used as established meteorological drought references. This comparison was not intended to treat SPI as a perfect ground truth because the IDS represents an integrated land-surface state and therefore need not reproduce every precipitation-defined drought month. Associations between SPI and the standardized baseline IDS (IDSz) were quantified using Pearson and Spearman correlations. Threshold agreement was additionally evaluated using a common drought criterion of ≤−1.0, from which overlap months, meteorological-only months, IDS-only months, Jaccard similarity, SPI-event capture, and IDS drought-month overlap were calculated.
Second, event-level correspondence was evaluated for consecutive SPI-3 drought episodes defined by SPI-3 ≤ −1.0. For each meteorological drought event, IDS behavior was examined over the event duration and the subsequent three months to determine whether the integrated land-surface state crossed the drought threshold and to quantify the delay between meteorological drought onset and the minimum IDS value. A superposed-event analysis was also performed from three months before to six months after SPI-3 drought onset to characterize the mean evolution of both the baseline IDS and the soil-moisture-independent formulation.
As an additional independent validation, the modeled drought-state series was compared with regional drought episodes identified from SENAMHI documentary evidence prior to inspection of the IDS results. Two externally documented episodes for which sufficiently specific temporal information was available were evaluated: the July–September 2005 precipitation-deficit episode affecting the Huanta–Ayacucho sector and the severe November 2022 Andean rainfall-deficit episode affecting Ayacucho. These documented intervals were treated as independent validation windows rather than as complete definitions of regional drought duration. Validation therefore assessed whether the IDS crossed the drought-state threshold during the externally documented periods without redefining event timing from the modeled IDS itself.
These comparisons were designed as diagnostic consistency and event-based validation tests rather than as calibration of a new operational drought index. Accordingly, agreement with SPI was interpreted as evidence of meteorological consistency, whereas departures from SPI were examined as potentially informative differences in integrated land-surface state rather than automatically classified as model error.
2.7. Methodological Limitations
Several methodological limitations inherent to drought analysis in data-scarce mountainous environments should be acknowledged, as they define the scope within which the results should be interpreted rather than compromising their validity.
First, the analysis relies primarily on satellite-based and reanalysis products to characterize hydroclimatic forcing, land-surface conditions, and soil moisture variability. While these datasets provide spatially continuous and temporally consistent information, they are subject to uncertainties associated with retrieval algorithms, spatial resolution, and model parameterizations, particularly in complex mountainous terrain [12,19].
In particular, no additional pixel-level filtering based on the MOD13Q1 quality-assurance layers was applied to NDVI, so residual retrieval-quality effects may contribute to short-term variability in the vegetation signal.
Second, soil moisture and the other land-surface variables were interpreted at the aggregated study-domain scale. Area-weighted aggregation is appropriate for examining regional temporal coherence, persistence, and integrated drought-state variability, but it necessarily suppresses part of the spatial variability associated with the pronounced topographic and ecological heterogeneity of the study region. Local differences in elevation, slope, aspect, soil depth, vegetation structure, land cover, and subsurface storage may generate drought trajectories that differ substantially from the regional mean. Consequently, the persistence timescales, lagged relationships, event characteristics, and recovery metrics reported in this study should be interpreted as properties of the domain-mean signal and not as spatially uniform behavior throughout Ayacucho. Spatially distributed analyses at grid-cell, elevation-band, catchment, or landscape-unit scales would be required to quantify local variations in drought persistence and represent an important direction for future work.
Third, LST and NDVI were employed as indicators of surface thermal and vegetation conditions, respectively. Although physically informative, LST is not equivalent to atmospheric evaporative demand or potential evapotranspiration, and NDVI does not directly measure vegetation water use or ecosystem productivity. Their interpretation in this study is therefore restricted to surface thermal anomalies and structural vegetation variability rather than direct estimates of atmospheric demand, evapotranspiration, or plant water use [15].
Finally, the Integrated Drought State (IDS) representation was designed as a simplified diagnostic framework for examining coupled dry-state variability and persistence rather than as an operational drought monitoring system. The IDS further relies on equal weighting of component variables to preserve interpretability and avoid performance-driven tuning. Validation of the IDS remains necessarily limited by the scarcity of long-term, spatially representative in situ drought observations in the study region. SPI provides an established meteorological reference but is not an independent representation of land-surface drought because precipitation is also a component of the IDS. The two SENAMHI-documented episodes provide genuinely external event-based evidence, but their small number precludes comprehensive estimates of detection skill. Accordingly, the validation presented here is intended to establish consistency and plausibility rather than operational predictive performance.
Although the sensitivity analysis demonstrated strong temporal agreement among alternative IDS formulations, differences in drought-month classification remained across weighting schemes. The IDS should therefore be interpreted as a diagnostic synthesis rather than as a uniquely parameterized drought index.
Consequently, the inferred persistence characteristics and integrated drought-state dynamics should be interpreted as representative of dominant regional-scale behavior and may not be directly transferable to hydroclimatic regimes with substantially different environmental conditions.
3. Results
3.1. Hydroclimatic Variability and Precipitation-Driven Droughts
Meteorological dry conditions represented by the 6-month Standardized Precipitation Index (SPI-6) exhibit frequent alternation between wetter and drier periods throughout the study interval (Figure 2a). Negative SPI-6 anomalies occur recurrently across the record, with considerable variability in both duration and intensity, reflecting the strong temporal variability of precipitation in the study region.
Figure 2.
Hydroclimatic variability and precipitation-based characterization of dry conditions. (a) SPI-6 time series showing temporal variability in precipitation anomalies and seasonal meteorological drought conditions. (b) Monthly precipitation variability across the study period, illustrating strong hydroclimatic seasonality and relatively stable long-term precipitation conditions. (c) Monthly precipitation anomalies and accumulated anomaly, showing recurrent short-term deficits and recovery phases.
Precipitation exhibits a pronounced seasonal cycle, with most annual rainfall concentrated during the austral summer months (December–March), while the remainder of the year is characterized by limited rainfall and enhanced atmospheric drying conditions (Figure 2b). Despite this marked seasonality, long-term mean precipitation remains comparatively stable over the study period, without evidence of a pronounced monotonic trend in accumulated precipitation.
Analysis of monthly precipitation anomalies revealed repeated sequences of short-term deficits followed by partial recovery (Figure 2c). In the common-resolution persistence analysis, monthly precipitation anomalies exhibited weak lag-1 temporal dependence (ACF1 = 0.116), substantially lower than that observed for several land-surface variables. This result provides a quantitative basis for distinguishing the relatively rapid variability of precipitation forcing from the more persistent temporal structure present in some components of the land-surface drought state.
Transitions from dry to near-normal SPI conditions frequently occur over relatively short timescales, even when accumulated precipitation deficits have not fully recovered. This temporal mismatch indicates that precipitation-based metrics effectively capture meteorological forcing but provide limited information regarding the persistence and delayed recovery of coupled land-surface dry states. These characteristics motivate the subsequent analysis of soil moisture persistence and land-surface variability across the study domain.
3.2. Land Surface Thermal Dynamics
Land surface temperature (LST) exhibited a pronounced and recurrent seasonal structure throughout the study period, reflecting the gradual evolution of surface thermal conditions in the semi-arid Andean environment (Figure 3). The seasonal thermal calendar (Figure 3a) reveals a highly consistent annual cycle across years, with relatively cooler conditions predominating during the austral autumn and winter months, followed by a progressive warming during late winter and spring that culminates in the highest temperatures during austral spring and early summer. Although interannual variability is evident, the persistence of this seasonal thermal pattern indicates that land-surface energy conditions evolve gradually rather than fluctuating randomly between consecutive observations.
Figure 3.
Seasonal persistence of land surface thermal conditions across the study domain. (a) Seasonal thermal calendar illustrating the recurrent annual evolution of land surface temperature (LST) from 2000 to 2025. (b) Autocorrelation function of calendar-month standardized and linearly detrended monthly LST, evaluated at the common monthly resolution used for comparison with precipitation, soil moisture, and vegetation. Lag-1 autocorrelation was 0.613, and autocorrelation remained continuously significant through lag 8 months. Shading indicates the 95% Bartlett confidence bounds. The corresponding lag-1 autocorrelation before detrending was 0.654.
For direct comparison with the other drought components, LST persistence was recomputed after aggregation to monthly resolution and removal of the calendar-month climatology. Monthly LST anomalies exhibited substantial temporal dependence, with a lag-1 autocorrelation of 0.654. This result remained comparatively stable after linear detrending (ACF1 = 0.613), indicating that the observed short-term persistence was not primarily attributable to a long-term trend. After detrending, statistically significant autocorrelation remained contiguous through approximately eight monthly lags. Thus, LST persistence is reported quantitatively at the common monthly resolution rather than described using the previous qualitative statement that autocorrelation approached zero after approximately three months.
Because the recurrent calendar-month climatology was removed before autocorrelation estimation, longer-lag oscillations in the residual ACF were not interpreted as evidence of seasonal phase reversal; interpretation was instead focused on the short-lag persistence structure of the deseasonalized series.
The persistence of deseasonalized LST anomalies indicates that the regional surface thermal state retains temporal coherence beyond individual monthly fluctuations. This persistence is interpreted as a property of land-surface thermal conditions rather than as a direct measure of atmospheric evaporative demand. Accordingly, LST provides complementary information on the temporal evolution of surface thermal conditions during drought, alongside precipitation, soil moisture, and vegetation variability.
Overall, the seasonal thermal structure and temporal persistence identified in LST indicate that atmospheric energy availability constitutes an important component of integrated drought-state evolution. These results provide the thermal context for the subsequent analysis of soil moisture persistence and coupled drought-state dynamics across the study domain.
3.3. Soil Moisture Dynamics and Hydrological Memory
Soil moisture exhibited prolonged residence within relatively dry states, indicating substantial temporal persistence across the study domain (Figure 4). The soil moisture exceedance curve (Figure 4a) shows a gradual distribution of observed moisture conditions, with the median soil moisture occurring at approximately 0.296 m3 m−3, while the global P20 and P80 values were approximately 0.221 and 0.378 m3 m−3, respectively. Rather than displaying abrupt shifts between dry and wet conditions, the smooth decline of the exceedance curve suggests progressive transitions between moisture states and sustained occupancy of intermediate-to-dry conditions.
Figure 4.
Soil-moisture persistence and state dynamics during the common monthly analysis period (February 2000–November 2025; n = 310). (a) Empirical exceedance distribution of monthly volumetric soil moisture, showing the global P20, median, and P80 as descriptive references. (b) Month-wise standardized soil-moisture anomalies (SMz) with P20/P80 reference thresholds. (c) Phase-space representation of monthly soil moisture and month-to-month change (ΔSM), illustrating drying (ΔSM < 0) and wetting/recovery (ΔSM > 0) trajectories.
The categorical identification of dry and wet soil-moisture states was also evaluated under alternative percentile thresholds (Table S2). Relative to the P20/P80 reference classification, overall monthly agreement was 0.832 for P10/P90, 0.910 for P15/P85, and 0.887 for P25/P75. Dry-state Jaccard similarity was 0.600, 0.767, and 0.779, respectively, whereas wet-state Jaccard similarity was 0.548, 0.774, and 0.775. The P15/P85 alternative showed the highest overall agreement with the reference classification, changing 28 of 310 monthly classifications. As expected, the more restrictive P10/P90 thresholds identified fewer extreme dry and wet months. These results indicate that the temporal classification of soil-moisture states remained broadly consistent across reasonable percentile choices, although the number of months assigned to the extreme categories varied with threshold stringency.
Temporal evolution of standardized soil moisture anomalies (Figure 4b) further demonstrates that dry conditions occurred recurrently throughout the study period, with repeated episodes of moderate and severe moisture deficits interspersed with relatively short recovery periods. Although substantial short-term variability is evident, the smoothed anomaly series indicates multi-year fluctuations rather than a persistent monotonic drying trend, highlighting the influence of antecedent moisture conditions on the evolution of soil moisture variability.
The phase-space representation of monthly soil moisture and its temporal change (Figure 4c) suggested event-to-event differences between drying and wetting trajectories. However, explicit event-based quantification did not support a systematic drying–recovery asymmetry. Across the six IDS drought events, the median absolute drying rate was 0.495 IDS-z month−1, compared with a median recovery rate of 0.723 IDS-z month−1, corresponding to a median recovery-to-drying rate ratio of 1.56. The paired difference was not statistically significant (Wilcoxon test, p = 0.688), and bootstrap uncertainty was broad (95% CI for the recovery-to-drying ratio: 0.43–3.86). Thus, transition asymmetry varied among individual drought events rather than exhibiting a consistent directional pattern across the study period.
Quantitative persistence analysis confirmed short-term memory in the deseasonalized and detrended soil-moisture series. At the common monthly resolution, persistence was characterized using the lag-1 autocorrelation coefficient and the decay of the autocorrelation function with increasing lag, with uncertainty evaluated using a moving-block bootstrap. These metrics provide an explicit measure of temporal dependence rather than relying solely on the visual persistence of dry states. In the complementary lag-response analysis, precipitation–soil-moisture coupling was strongest contemporaneously (r = 0.840 for monthly precipitation anomalies and r = 0.844 for SPI-1), remained significant at lags of 1 and 2 months after effective-sample-size and false-discovery-rate corrections, and was no longer robust at longer lags. SPI-3 showed a similarly concentrated response, with robust associations at lags 0–1 months. These results indicate measurable but finite short-term soil-moisture dependence on antecedent meteorological conditions rather than an indefinitely persistent response.
The soil-moisture persistence results were obtained independently of the IDS formulation and therefore provide a separate characterization of the temporal behavior of root-zone moisture. These results indicate that soil moisture retains short-term temporal dependence after removal of the seasonal cycle and linear trend, but they do not by themselves establish soil moisture as a dominant causal control on integrated drought persistence. Its relationship with the broader land-surface drought state was therefore evaluated separately using the IDS robustness analyses described below.
Comparison at the common monthly resolution further showed that temporal dependence differed among the hydroclimatic and land-surface variables. Lag-1 autocorrelation was 0.116 for monthly precipitation anomalies, 0.115 for SPI-1, 0.385 for soil moisture, 0.511 for NDVI, and 0.654 for LST. Linear detrending had little effect on soil-moisture persistence (ACF1 = 0.382) and only a modest effect on LST (ACF1 = 0.613), whereas NDVI persistence decreased substantially (ACF1 = 0.297; contiguous significant memory from 25 to 4 months). The latter result indicates that part of the apparent long-term NDVI persistence reflected low-frequency trend structure rather than short-term ecological memory. SPI-3 showed substantially greater autocorrelation than SPI-1, but this difference was interpreted cautiously because adjacent SPI-3 values share precipitation observations through their overlapping three-month accumulation windows.
Lagged analyses further revealed distinct temporal relationships among the hydroclimatic and land-surface variables after accounting for serial dependence and multiple testing (Table S1). Monthly precipitation anomalies were most strongly associated with soil moisture contemporaneously (r = 0.840), with robust positive associations persisting through lags +1 (r = 0.391) and +2 months (r = 0.232). SPI-1 showed an almost identical structure, with a contemporaneous correlation of r = 0.844 and robust associations through +2 months. SPI-3 was also strongly associated with soil moisture at lag 0 (r = 0.765), although only lags 0 and +1 remained robust after effective-sample-size correction, moving-block bootstrap inference, and FDR adjustment. Because SPI-3 uses overlapping three-month precipitation windows, this relationship was interpreted cautiously and was not treated as an independent estimate of physical response time.
Land-surface responses exhibited different lag structures. The contemporaneous association between soil moisture and NDVI was weak (r = 0.024), whereas positive associations emerged at lags +3 and +4 months (r = 0.178 and r = 0.177, respectively); both remained robust after FDR correction and moving-block-bootstrap inference. In contrast, soil moisture and the LST drought-state anomaly were most strongly associated contemporaneously (r = 0.640), with a robust association also present at +1 month (r = 0.245). These patterns indicate that vegetation anomalies were statistically associated with antecedent soil-moisture conditions several months earlier, whereas soil moisture and surface thermal conditions exhibited predominantly contemporaneous coupling. The lag maxima are interpreted as descriptive features of the temporal association structure rather than as causal response times.
3.4. Integrated Drought Dynamics (IDS)
To integrate hydroclimatic forcing, soil moisture conditions, vegetation dynamics, and land-surface thermal variability within a common framework, an Integrated Drought State (IDS) was derived by combining standardized precipitation, soil moisture, NDVI, and land surface temperature indicators.
Sensitivity analyses indicated that the temporal behavior of the IDS was not strongly dependent on the equal-weight formulation (Table S3). Increasing the weight of individual components to 40% produced correlations with the baseline IDS ranging from r = 0.963 to 0.988, while leave-one-component-out formulations remained strongly correlated with the baseline (r = 0.937–0.962). A PCA-based formulation also reproduced the principal temporal structure (r = 0.950), with PC1 explaining 55.9% of the variance in the standardized components (Table S3b). Agreement in drought-month classification remained substantial across the alternative 40%-weight formulations (Jaccard = 0.709–0.800), indicating that the main temporal patterns were not an artifact of a single weighting configuration.
To test whether persistence of the integrated drought state was an artifact of including soil moisture in the composite, the IDS was recalculated after excluding the soil-moisture component (Table S3c). The resulting IDSnoSM retained strong temporal correspondence with the baseline formulation (Pearson r = 0.962; Spearman ρ = 0.959), with a drought-month Jaccard similarity of 0.712 and retention of 86.1% of baseline drought months. Persistence also remained comparable after linear detrending: lag-1 autocorrelation was 0.597 for the baseline IDS and 0.649 for IDSnoSM, corresponding to three and four months of contiguous significant memory, respectively. Thus, removal of soil moisture did not eliminate the persistent temporal structure of the integrated drought state.
This conclusion was also supported by the response of the soil-moisture-independent formulation around meteorological drought onset. Across 20 SPI-3 drought events, the mean IDSnoSM reached −0.981 at drought onset and remained negative during the following four months (−0.585, −0.495, −0.264, and −0.192 at lags +1 to +4 months, respectively), approaching neutral conditions by month +5. The corresponding baseline IDS showed a similar trajectory. Therefore, delayed adjustment of the integrated land-surface state relative to meteorological forcing remained evident even when soil moisture was excluded from the composite.
Comparison with established meteorological drought indicators showed substantial but incomplete correspondence, as expected for an index that also incorporates land-surface state. The baseline IDS was positively associated with both SPI-1 (Pearson r = 0.695; Spearman ρ = 0.694) and SPI-3 (Pearson r = 0.827; Spearman ρ = 0.835). Using a common drought threshold of −1.0, SPI-3 identified 51 drought months, and the IDS identified 43, of which 32 overlapped, corresponding to a drought-month Jaccard similarity of 0.516. The IDS captured 62.7% of SPI-3 drought months, while 74.4% of IDS drought months coincided with SPI-3 drought conditions. These results indicate substantial meteorological consistency without implying that the integrated land-surface diagnostic should reproduce all precipitation-defined drought months.
Event-level comparison provided additional evidence of correspondence between meteorological drought and integrated land-surface response. Twenty SPI-3 drought episodes were identified over the common analysis period. The baseline IDS crossed the drought threshold during the SPI event or within the subsequent three months for 14 of the 20 episodes (70%), compared with 13 events (65%) for the IDS formulation excluding soil moisture. Across all SPI-3 events, the mean delay from meteorological drought onset to the minimum baseline IDS was 0.9 months, with a median delay of 0 months. The superposed-event analysis showed that mean IDS decreased from −0.610 one month before SPI-3 drought onset to −1.219 at onset, remained negative during the subsequent four months, and approached neutral conditions thereafter. The corresponding soil-moisture-independent formulation exhibited a similar temporal trajectory.
The event-based comparison with independent SENAMHI documentary evidence provided a second validation layer. During the documented July–September 2005 Huanta–Ayacucho drought episode, the minimum SPI-3 was −1.428, and the minimum baseline IDS was −1.395; the IDS crossed the drought-state threshold during two of the three documented months. During the independently documented November 2022 Andean drought episode, SPI-3 reached −3.250, and the IDS reached −1.946, again crossing the drought threshold. The soil-moisture-independent IDS also detected both externally documented episodes, with minima of −1.559 in 2005 and −1.626 in 2022. Thus, both externally identified drought episodes were reproduced by the integrated drought-state framework, including when soil moisture was excluded from the composite.
The joint temporal evolution of precipitation, NDVI, land surface temperature (LST), soil moisture, and IDS demonstrates a coherent coupling among the principal components of the land–atmosphere system (Figure 5). Negative IDS values generally coincide with periods characterized by reduced soil moisture, elevated land surface temperatures, and suppressed vegetation activity, whereas positive IDS values occur under wetter and cooler conditions. Importantly, several drought episodes persisted despite short-term increases in precipitation, indicating that land-surface conditions responded more slowly than atmospheric forcing. This temporal decoupling highlights the role of antecedent soil moisture and thermal persistence in sustaining integrated drought states beyond the duration of individual precipitation deficits.
Figure 5.
Joint monthly time series of precipitation, NDVI, land surface temperature (LST), soil moisture, and the Integrated Drought State (IDS) across the study domain. Precipitation is shown as monthly accumulated precipitation in its original units, NDVI as the monthly mean vegetation index, LST as monthly mean surface temperature in °C, and soil moisture as monthly mean volumetric soil-water content (m3 m−3). These four component series are displayed in their original physical or index scales for interpretability. In contrast, IDS is shown in its standardized form (IDS z-score), with negative values indicating relatively dry integrated conditions and positive values indicating relatively wet conditions; dashed lines at IDS = −1 and +1 indicate standardized dry and wet thresholds, respectively.
The annual IDS heatmap reveals a pronounced seasonal organization of integrated drought conditions (Figure 6a). Negative IDS values consistently concentrate during the austral dry season, whereas positive values predominate during wetter months. Although the magnitude of individual events varies between years, the recurrence of this seasonal pattern indicates that integrated drought states exhibit a persistent annual structure rather than occurring randomly throughout the observational period.
Figure 6.
Integrated drought-state characteristics across the study period. (a) Annual heatmap of monthly standardized IDS values illustrating the recurrent seasonal organization of integrated drought conditions. (b–d) Event-level relationships between drought duration and peak severity, mean event intensity, and cumulative severity, respectively, for the six IDS drought events (n = 6), defined as IDS z ≤ −1.0 for at least three consecutive months. Points represent individual drought events (E1–E6), solid lines indicate linear regressions, and shaded areas represent 95% confidence bands. Associations between duration and peak severity (Pearson r = 0.691, p = 0.129) and mean event intensity (r = 0.224, p = 0.670) were statistically uncertain, whereas cumulative severity increased strongly with event duration (r = 0.987, p < 0.001). Because cumulative severity integrates drought magnitude over time, this strong relationship should not be interpreted as evidence that longer events necessarily exhibit greater instantaneous intensity. Bootstrap confidence intervals and complementary Spearman correlations are reported within each panel.
Six IDS drought events satisfied the event criterion of IDSz ≤ −1.0 for at least three consecutive months. Event duration ranged from 3 to 8 months, with a mean duration of 4.0 months. Duration showed a positive but statistically uncertain association with peak severity (Pearson r = 0.691, p = 0.129; Spearman ρ = 0.169), and the event-level bootstrap 95% confidence interval for Pearson correlation included zero (−0.881 to 0.984). The relationship between duration and mean event intensity was weaker (Pearson r = 0.224, p = 0.670; Spearman ρ = 0.101), with similarly broad bootstrap uncertainty. These results do not support the interpretation that longer drought events were necessarily more intense.
In contrast, duration was strongly associated with cumulative drought severity (Pearson r = 0.987, p = 0.0003; Spearman ρ = 0.845, p = 0.034), with a bootstrap Pearson 95% confidence interval of 0.482–1.000. However, cumulative severity is mathematically dependent on event duration because it integrates drought magnitude over all months of the event. This strong association was therefore interpreted as an expected property of the cumulative metric rather than as independent evidence that longer events reached intrinsically stronger drought states.
Across the six detected events, mean peak severity was 1.893 standardized IDS units, and mean event intensity was 1.601, while mean cumulative severity was 6.470. The longest event lasted 8 months, whereas the median duration was 3 months. These event-level characteristics provide a quantitative description of drought persistence while avoiding inference based solely on the most extreme monthly IDS value.
Overall, the IDS provides a concise representation of the coupled temporal evolution of hydroclimatic forcing and land-surface responses across the study domain. By integrating precipitation, soil moisture, vegetation, and thermal conditions within a common standardized framework, the IDS provides information complementary to precipitation-based indicators, particularly where the integrated land-surface state remains anomalous despite partial meteorological recovery.
4. Discussion
4.1. Soil Moisture Persistence and Drought Continuity
The revised analyses distinguish the temporal persistence of soil moisture from the persistence of the integrated drought-state representation. Soil moisture exhibited temporal dependence when analyzed independently, supporting its interpretation as a state variable that integrates antecedent hydroclimatic conditions. However, persistence of the IDS cannot itself be regarded as independent evidence for a dominant soil-moisture influence because soil moisture is one of its constituent variables. We therefore evaluated a parallel IDS formulation excluding soil moisture. The persistence and delayed recovery of the integrated state remained evident under this formulation, indicating that these characteristics arise from the combined temporal behavior of the land-surface system rather than from the mathematical inclusion of soil moisture alone.
At the same time, removing soil moisture was not interpreted as demonstrating that soil moisture is unimportant. Rather, the comparison separates two complementary findings: soil moisture exhibits its own temporal dependence independently of the IDS, while the integrated drought-state signal remains persistent even when soil moisture is excluded. Together with the lagged relationships among precipitation, soil moisture, vegetation, and thermal conditions, these results support a coupled interpretation of drought persistence in which no single component is treated as an independently established causal regulator.
The robust lagged analyses further clarify this coupled interpretation. Precipitation anomalies and SPI-1 were strongly associated with soil moisture contemporaneously (r ≈ 0.84), with weaker but statistically robust associations extending through the following two months. By contrast, the soil-moisture–NDVI relationship was weak at lag 0 but reached its strongest robust association after approximately three to four months (r ≈ 0.18). This difference suggests that vegetation anomalies may reflect accumulated antecedent moisture conditions rather than only contemporaneous soil-water variability. Soil moisture and surface thermal conditions showed a stronger contemporaneous association (r = 0.640), consistent with close coupling between surface moisture availability and thermal state. Importantly, these lag structures persisted after accounting for autocorrelation, moving-block-bootstrap uncertainty, and false-discovery-rate correction, but they are interpreted as temporal associations rather than evidence of causal response times.
Soil-moisture variability reflects the combined influence of precipitation history, soil characteristics, vegetation processes, and surface energy conditions operating over multiple timescales. In the semi-arid mountainous environment examined here, the observed temporal dependence of soil moisture is consistent with gradual adjustment of subsurface water storage following hydroclimatic anomalies. Persistent LST anomalies additionally indicate sustained departures in surface thermal conditions, although LST is not interpreted as a direct measure of atmospheric evaporative demand. Together, these results support a coupled interpretation in which precipitation forcing and land-surface variables adjust over different timescales. Previous conceptual and modeling studies likewise identify soil moisture as an important state variable in drought evolution and recovery [6,7], but the present analyses are interpreted in terms of temporal association and persistence rather than formal causal attribution.
Event-level drying and recovery transitions showed substantial variability among the six identified drought events. Using symmetric transition definitions, the median absolute drying rate was 0.495 IDS-z units month−1, compared with 0.723 IDS-z units month−1 for recovery, corresponding to a median recovery-to-drying ratio of 1.56. However, the paired difference was not statistically distinguishable from zero (Wilcoxon p = 0.688), and bootstrap confidence intervals were broad. The revised analysis therefore does not support a general claim that drought recovery is systematically slower than drought development. Instead, transition rates appear event-dependent, and the small number of events warrants cautious interpretation [2].
Overall, the findings indicate that the continuity and recovery of domain-mean drought conditions are associated with the coupled temporal evolution of precipitation forcing, soil moisture, vegetation, and surface thermal states. Soil moisture retains information on antecedent hydroclimatic conditions and therefore remains an important component of this coupled response, but the present analyses do not establish it as a uniquely dominant or causal control. Rather than representing a simple response to precipitation deficits, drought persistence emerges from the interaction between atmospheric forcing and slowly evolving land-surface states, emphasizing the importance of incorporating soil moisture into assessments of drought persistence and recovery.
4.2. Differences Between Precipitation Anomalies and Dry-State Persistence
A principal finding of the revised persistence analysis is that precipitation and land-surface variables exhibit distinct degrees of temporal dependence when evaluated at the same monthly resolution. Monthly precipitation anomalies and SPI-1 showed weak lag-1 dependence (ACF1 = 0.116 and 0.115, respectively), whereas soil moisture and LST retained stronger temporal dependence (ACF1 = 0.385 and 0.654). These differences are interpreted as contrasts in temporal persistence rather than as directly equivalent physical memory timescales because the variables represent different processes and transformations. Moreover, detrending demonstrated that the initially high NDVI persistence contained an important low-frequency trend component, whereas soil-moisture and LST persistence were comparatively robust. The revised results therefore support a coupled interpretation of drought persistence without assuming that all land-surface components possess a single or directly comparable characteristic memory timescale.
The magnitude and duration of the soil-moisture dependence identified here are broadly consistent with the short-memory behavior reported in previous observational and modeling studies, although direct numerical comparison depends on the memory definition, soil depth, season, and climatic setting. Previous studies commonly report soil-moisture persistence on timescales of several weeks to a few months, with observational estimates in some regions extending to approximately 40 days and model-based estimates varying seasonally and spatially. In the present study, soil-moisture dependence on meteorological forcing remained statistically robust for approximately 1–2 subsequent months, placing the regional response within the broad short-term memory range reported elsewhere [6,7]. Because our estimate is based on monthly, deseasonalized, detrended domain-mean root-zone soil moisture, it should not be interpreted as directly equivalent to memory estimates derived from different depths, sampling intervals, or memory definitions.
This temporal decoupling is particularly evident during transitions from dry to near-normal precipitation conditions. Several periods identified in the joint time series (Figure 5) show that precipitation recovered while soil moisture remained depleted and the Integrated Drought State (IDS) continued to indicate persistent dry conditions. The persistence of negative IDS values despite short-term precipitation fluctuations reflects the comparatively slow adjustment of land-surface conditions and demonstrates that hydrological recovery does not occur simultaneously with meteorological recovery. Similar delays between atmospheric forcing and land-surface response have been widely reported in studies of drought propagation and hydrological drought development [4].
The persistence analyses further reinforce this distinction. The prolonged residence of soil moisture within dry states, together with the event-to-event variability in drying and recovery trajectories identified in the phase-space analysis, indicates that recovery dynamics cannot be inferred from precipitation anomalies alone. However, the event-based analysis did not provide evidence of a systematic directional asymmetry between drying and recovery rates across the six identified drought events.
These findings help explain why precipitation-based indicators may underestimate the duration of drought impacts, particularly at sub-seasonal and seasonal timescales in semi-arid mountainous environments. Limited soil water storage, sustained atmospheric demand, and progressive recharge collectively extend the persistence of dry land-surface conditions beyond the period represented by precipitation anomalies alone.
Overall, the results demonstrate that meteorological drought termination and land-surface drought recovery represent distinct stages of drought evolution. Incorporating slowly varying state variables such as soil moisture alongside precipitation therefore provides a more realistic representation of drought persistence and recovery in water-limited environments.
4.3. Influence of Land-Surface Conditions on Dry-State Persistence
Land-surface responses exhibited distinct temporal structures rather than a uniform delayed response to meteorological forcing. At the common monthly resolution, soil moisture and LST retained greater lag-1 temporal dependence than precipitation, whereas the NDVI response was characterized primarily by a delayed association with antecedent soil-moisture conditions. These differences indicate that drought-state persistence reflects multiple land-surface processes operating over different timescales.
LST showed the strongest lag-1 dependence among the detrended land-surface variables (ACF1 = 0.613), compared with 0.382 for soil moisture.
Because LST represents surface thermal state rather than atmospheric evaporative demand, this persistence is interpreted as sustained thermal anomaly structure rather than as direct evidence of persistent atmospheric forcing. Importantly, these values were obtained using the same monthly deseasonalization, detrending, and autocorrelation framework applied to the other variables, avoiding comparisons between incompatible temporal resolutions [5,15].
Vegetation exhibited a different temporal response. The contemporaneous soil-moisture–NDVI association was weak (r = 0.024), whereas statistically robust positive associations emerged at lags +3 and +4 months (r = 0.178 and r = 0.177, respectively) after correction for serial dependence and multiple testing. Although the effect size was modest, the delayed association is consistent with gradual vegetation adjustment to antecedent moisture conditions reported for semi-arid ecosystems [2,9]. The comparatively weak correlation also indicates that NDVI variability cannot be interpreted as a simple function of soil moisture alone.
4.4. Integrated Drought State as an Integrated Diagnostic Framework
The IDS provides a diagnostic synthesis of the contemporaneous hydroclimatic and land-surface state rather than an attribution model of drought persistence. Its principal analytical value in this study is therefore to examine whether the combined drought-state signal is robust to alternative weighting schemes, component exclusion, and comparison with independent meteorological and documentary drought information.
Unlike precipitation-based indicators, which primarily characterize meteorological forcing and drought onset, the IDS represents the evolving condition of the land surface by integrating precipitation, soil moisture, vegetation, and thermal anomalies within a common standardized framework. The joint temporal analyses demonstrate that negative IDS values frequently persist beyond short-term precipitation recovery, reflecting the slower adjustment of soil moisture, vegetation, and thermal conditions. This behavior indicates that drought persistence is better represented by the combined temporal evolution of multiple land-surface variables than by precipitation variability alone.
The persistence of the no-soil-moisture formulation provides an important robustness check in this interpretation: temporal persistence was retained when the soil-moisture component was removed, indicating that the IDS persistence signal cannot be attributed solely to mathematical inheritance from the soil-moisture series.
Several multivariate drought indicators have been proposed to integrate hydroclimatic variables into composite drought metrics [18,20]. The IDS differs from these approaches in that its primary objective is not operational drought classification or forecasting, but the interpretation of coupled drought-state dynamics. Equal weighting was adopted to preserve transparency and avoid introducing subjective assumptions regarding the relative contribution of individual variables. Consequently, the IDS should be regarded as a diagnostic synthesis of integrated land-surface conditions rather than as an optimized operational drought index.
The event-level analysis also illustrates the importance of separating duration from intensity. Although cumulative severity increased strongly with event duration, neither peak severity nor mean intensity showed a statistically robust relationship with duration across the six detected events. The strong duration–cumulative-severity association is therefore primarily interpreted as a consequence of temporal accumulation rather than evidence that longer droughts are intrinsically more intense. Given the small event sample, these relationships should be regarded as descriptive rather than as general scaling laws for Andean drought behavior.
The validation analyses indicate that the IDS is meteorologically coherent while retaining behavior that is not identical to SPI. Its relatively strong association with SPI-3 (r = 0.827) confirms sensitivity to meteorological drought forcing, whereas incomplete drought-month overlap indicates that incorporation of soil moisture, vegetation, and thermal conditions modifies the integrated state relative to precipitation alone. Event-level analyses further showed that the IDS detected 70% of SPI-3 drought episodes within the event-plus-three-month response window and reproduced both independently documented drought periods evaluated here. Importantly, similar behavior was retained in the formulation excluding soil moisture, reducing the likelihood that these results arise solely from the mathematical inheritance of that component.
These findings support the interpretation of the IDS as a diagnostic synthesis rather than as an optimized or operational drought index. Differences between SPI and IDS should therefore not automatically be interpreted as improved detection by the IDS; instead, they reflect the distinction between meteorological forcing and the contemporaneous integrated land-surface state. The external validation is also limited to two independently documented episodes and should be regarded as supportive event-based evidence rather than a comprehensive validation of all drought conditions in Ayacucho.
4.5. Relevance to Other Semi-Arid Mountainous Environments
Although this study focuses on a semi-arid mountainous region of the southern Peruvian Andes, the persistence mechanisms identified here are likely applicable to other water-limited environments that share similar hydroclimatic and physiographic characteristics. The findings should not be interpreted as universally transferable; rather, they are most relevant to mountainous regions characterized by pronounced hydroclimatic seasonality, shallow soils, and limited water storage capacity, where antecedent soil-moisture conditions may be closely associated with drought persistence and recovery.
The analyses presented here suggest that the interaction between seasonal precipitation regimes, persistent land-surface thermal conditions, and gradual soil moisture recovery represents a common mechanism capable of sustaining dry states beyond the duration of individual precipitation deficits. Similar processes have been documented in other semi-arid environments, where drought persistence depends not only on meteorological forcing but also on the delayed adjustment of soil moisture and vegetation conditions [21,22].
Strong seasonal concentration of precipitation may further enhance these persistence dynamics. In regions where rainfall is restricted to relatively short wet-season periods, soil moisture availability during the dry season becomes increasingly dependent on antecedent recharge and progressive depletion rather than on isolated precipitation events. The seasonal organization of the Integrated Drought State observed in this study supports this interpretation and is consistent with previous observations from water-limited mountainous systems [23,24].
Local environmental characteristics will nevertheless influence the magnitude and duration of drought persistence. Soil depth, vegetation structure, rooting characteristics, subsurface storage capacity, and topographic complexity all regulate the rate at which soil moisture is depleted and replenished following precipitation events [22,25,26]. Consequently, although the persistence mechanisms identified here are likely to be broadly relevant across semi-arid mountainous environments, their temporal expression will depend on local hydroclimatic and landscape conditions.
These controls also imply that the domain-mean persistence characteristics identified here may encompass contrasting local responses that cannot be resolved from the aggregated time series. Accordingly, transferability is considered at the level of processes and conceptual behavior rather than as a direct transfer of the numerical persistence timescales estimated for Ayacucho.
The framework may be applicable to other water-limited mountainous environments, but its transferability should be considered conditional rather than universal. The persistence characteristics identified here represent domain-mean behavior within a topographically heterogeneous Andean region and were not explicitly stratified by elevation, slope, aspect, soil depth, or vegetation type. These factors can modify water storage, radiation exposure, evapotranspiration, rooting conditions, and vegetation responses, and may therefore alter both the magnitude and duration of drought persistence at local scales. Consequently, transferability is expected to be greatest in seasonally water-limited mountain regions with pronounced hydroclimatic seasonality and comparable land-surface constraints, whereas application to wetter environments, deeper-soil systems, densely forested landscapes, or markedly different topographic settings would require independent evaluation and, potentially, recalibration of the integrated framework.
4.6. Implications for Drought Monitoring and Hydrological Interpretation
The results presented here have practical implications for drought monitoring in semi-arid mountainous environments. The persistence analyses demonstrate that precipitation anomalies alone do not adequately represent the duration or recovery of drought conditions because land-surface variables respond over substantially longer timescales. Consequently, the termination of meteorological drought should not be interpreted as evidence of complete hydrological or ecological recovery.
From a hydrological perspective, soil moisture functions as an integrative state variable that links atmospheric forcing with subsequent land-surface responses. The prolonged residence of soil moisture within dry states, together with the persistence of elevated land surface temperatures and reduced vegetation activity, indicates that drought recovery depends on the gradual restoration of land-surface conditions rather than on precipitation recovery alone. This distinction is consistent with conceptual models of drought propagation emphasizing the different response times of atmospheric and terrestrial components [11,27].
Precipitation-based indices characterize meteorological drought but do not explicitly represent the persistence of subsurface water storage, vegetation condition, or surface thermal anomalies. Consequently, meteorological drought recovery inferred from precipitation alone may not coincide temporally with recovery of land-surface conditions, particularly where antecedent soil-moisture deficits and delayed vegetation responses persist after precipitation anomalies weaken [28,29].
Such temporal decoupling has been quantified in previous drought-propagation studies; for example, soil-moisture drought has been shown to persist beyond the termination of meteorological drought in a substantial proportion of events, with recovery timing influenced by antecedent soil-moisture conditions and meteorological forcing [28,29].
Within this context, the Integrated Drought State (IDS) offers a practical diagnostic framework for visualizing the combined evolution of these variables through time. Although it is not intended to replace established drought indices or operational monitoring systems, the IDS facilitates interpretation of persistence, delayed recovery, and temporal decoupling between precipitation and land-surface response, thereby complementing conventional drought assessments.
These implications extend beyond the specific study area and support the incorporation of slowly varying land-surface variables into future drought analyses in semi-arid mountainous regions. Accounting for both atmospheric forcing and land-surface persistence provides a more realistic basis for interpreting drought evolution, identifying prolonged dry states, and evaluating recovery following precipitation deficits.
5. Conclusions
This study investigated the temporal persistence of drought-related land-surface conditions in a semi-arid mountainous region of the southern Peruvian Andes through the integrated analysis of precipitation, soil moisture, vegetation dynamics, and land surface temperature. At the common monthly resolution, precipitation anomalies showed weak lag-1 temporal dependence (ACF1 = 0.116), whereas soil moisture (ACF1 = 0.385), NDVI (ACF1 = 0.511), and LST (ACF1 = 0.654) exhibited stronger persistence. After linear detrending, soil moisture and LST persistence remained similar (ACF1 = 0.382 and 0.613, respectively), while NDVI persistence decreased to 0.297. Lagged analyses further showed that the soil-moisture response to meteorological forcing remained statistically robust for approximately 1–2 subsequent months, whereas the soil-moisture–NDVI association was weak contemporaneously (r = 0.024) but became significant at lags +3 and +4 months (r = 0.178 and 0.177, respectively). These results demonstrate distinct temporal responses among hydroclimatic and land-surface components without attributing drought persistence to a single dominant control.
The Integrated Drought State (IDS) provided a standardized representation of the coupled temporal evolution of precipitation, soil moisture, vegetation, and surface thermal conditions. The baseline IDS showed strong correspondence with SPI-3 (Pearson r = 0.827), while sensitivity analyses showed that its principal temporal behavior was retained under alternative weighting, component-exclusion, and data-driven formulations. Event-level evaluation identified six IDS drought events, with durations of 3–8 months (mean = 4.0 months). Both independently documented drought periods evaluated in 2005 and 2022 were detected by the IDS and remained detectable when soil moisture was excluded. These results support the use of IDS as a diagnostic representation of integrated drought-state behavior, while its application as an operational drought index would require substantially broader independent validation.
Although the analyses were conducted for a semi-arid Andean environment, the coupled persistence patterns identified here may also be relevant to other seasonally water-limited mountainous regions. However, their transferability should be evaluated explicitly across differences in topography, soil depth, vegetation structure, and hydroclimatic regime. The results highlight that effective drought assessment requires integrating atmospheric forcing with slowly varying land-surface conditions to better represent drought evolution and recovery.
Overall, the findings show that drought evolution and recovery in the study domain cannot be represented completely by precipitation variability alone. Soil moisture retains information on antecedent hydroclimatic conditions, while vegetation and surface thermal conditions exhibit distinct contemporaneous and delayed responses. The revised analyses therefore characterize drought persistence as the coupled temporal behavior of multiple hydroclimatic and land-surface components rather than as the consequence of a uniquely dominant or causal regulator.
Supplementary Materials
The following supporting information can be downloaded at: https://www.mdpi.com/article/10.3390/hydrology13090237/s1, Figure S1: Precipitation variability and precipitation-based drought characterization (1996–2025); Table S1: Robust lagged relationships among hydroclimatic and land-surface variables; Table S2: Sensitivity of soil-moisture classification to alternative percentile thresholds; Table S3: Robustness and sensitivity of the Integrated Drought State (IDS), including alternative weighting schemes, component-exclusion formulations, PCA loadings, and the soil-moisture-exclusion circularity assessment.
Author Contributions
Conceptualization, B.K.C.M. and L.D.L.S.V.; methodology, B.K.C.M., M.M.C., J.C.T.L., E.M.T.L., S.A.L.C., J.L.P.M., R.Ñ.M., S.D.C.I., F.G.R.G. and L.D.L.S.V.; validation, B.K.C.M. and L.D.L.S.V.; formal analysis, B.K.C.M.; investigation, B.K.C.M., M.M.C., J.C.T.L., E.M.T.L., S.A.L.C., J.L.P.M., R.Ñ.M., S.D.C.I. and F.G.R.G.; resources, B.K.C.M., M.M.C., J.C.T.L., E.M.T.L., S.A.L.C., J.L.P.M., R.Ñ.M., S.D.C.I. and F.G.R.G.; data curation, B.K.C.M., M.M.C., J.C.T.L., E.M.T.L., S.A.L.C., J.L.P.M., R.Ñ.M., S.D.C.I. and F.G.R.G.; writing—original draft preparation, B.K.C.M., M.M.C., J.C.T.L., E.M.T.L., S.A.L.C., J.L.P.M., R.Ñ.M., S.D.C.I. and F.G.R.G.; writing—review and editing, B.K.C.M., M.M.C., J.C.T.L., E.M.T.L., S.A.L.C., J.L.P.M., R.Ñ.M., S.D.C.I., F.G.R.G. and L.D.L.S.V.; visualization, B.K.C.M.; supervision, L.D.L.S.V.; project administration, B.K.C.M. and L.D.L.S.V. All authors have read and agreed to the published version of the manuscript.
Funding
This research received no external funding.
Data Availability Statement
Data will be made available on request.
Acknowledgments
The authors thank the Collaboration Agreement between the Universidad Nacional Autonoma de Huanta (Peru) and the University of Cambridge (UK), Agreement number G117323. The authors declare that no generative artificial intelligence (AI) tools or AI-assisted technologies were used in the writing, analysis, interpretation, or preparation of this manuscript. All scientific content, data analyses, figures, interpretations, and conclusions were produced solely by the authors.
Conflicts of Interest
The authors declare no conflicts of interest.
Abbreviations
The following abbreviations are used in this manuscript:
| SPI | Standardized Precipitation Index |
| SPEI | Standardized Precipitation Evapotranspiration Index |
| LST | Land Surface Temperature |
References
- Mishra, A.K.; Singh, V.P. A review of drought concepts. J. Hydrol. 2010, 391, 202–216. [Google Scholar] [CrossRef] [Scilit]
- Van Loon, A.F. Hydrological drought explained. WIREs Water 2015, 2, 359–392. [Google Scholar] [CrossRef] [Scilit]
- McKee, T.B.; Doesken, N.J.; Kleist, J. The relationship of drought frequency and duration to time scales. In Proceedings of the 8th Conference on Applied Climatology, Anaheim, CA, USA, 17–22 January 1993; pp. 179–184. [Google Scholar]
- Van Loon, A.F.; Van Lanen, H.A.J.; Hisdal, H.; Tallaksen, L.M.; Fendeková, M.; Oosterwijk, J.; Horvát, O.; Machlica, A. Understanding hydrological winter drought in Europe. In Global Change: Facing Risks and Threats to Water Resources; IAHS Press: Wallingford, UK, 2010; pp. 189–197. [Google Scholar]
- Seneviratne, S.I.; Corti, T.; Davin, E.L.; Hirschi, M.; Jaeger, E.B.; Lehner, I.; Orlowsky, B.; Teuling, A.J. Investigating soil moisture–climate interactions in a changing climate: A review. Earth-Sci. Rev. 2010, 99, 125–161. [Google Scholar] [CrossRef] [Scilit]
- Koster, R.D.; Suarez, M.J. Soil moisture memory in climate models. J. Hydrometeorol. 2001, 2, 558–570. [Google Scholar] [CrossRef] [Scilit]
- Orth, R.; Seneviratne, S.I. Analysis of soil moisture memory from observations in Europe. J. Geophys. Res. Atmos. 2012, 117, D15. [Google Scholar] [CrossRef] [Scilit]
- Seneviratne, S.I.; Wilhelm, M.; Stanelle, T.; Hurk, B.v.D.; Hagemann, S.; Berg, A.; Cheruy, F.; Higgins, M.E.; Meier, A.; Brovkin, V.; et al. Impact of soil moisture-climate feedbacks on CMIP5 projections: First results from the GLACE-CMIP5 experiment. Geophys. Res. Lett. 2013, 40, 5212–5217. [Google Scholar] [CrossRef] [Scilit]
- Teuling, A.J.; Van Loon, A.F.; Seneviratne, S.I.; Lehner, I.; Aubinet, M.; Heinesch, B.; Bernhofer, C.; Grünwald, T.; Prasse, H.; Spank, U. Evapotranspiration amplifies European summer drought. Geophys. Res. Lett. 2013, 40, 2071–2075. [Google Scholar] [CrossRef] [Scilit]
- Waseem, M.; Ajmal, M.; Kim, T.-W. Development of a new composite drought index for multivariate drought assessment. J. Hydrol. 2015, 527, 30–37. [Google Scholar] [CrossRef] [Scilit]
- Yuan, M.; Gan, G.; Bu, J.; Su, Y.; Ma, H.; Liu, X.; Zhang, Y.; Gao, Y. A new multivariate composite drought index considering the lag time and the cumulative effects of drought. J. Hydrol. 2025, 653, 132757. [Google Scholar] [CrossRef] [Scilit]
- Dorigo, W.A.; Wagner, W.; Albergel, C.; Albrecht, F.; Balsamo, G.; Brocca, L.; Chung, D.; Ertl, M.; Forkel, M.; Gruber, A.; et al. ESA CCI Soil Moisture for improved Earth system understanding. Remote Sens. Environ. 2017, 203, 185–215. [Google Scholar] [CrossRef] [Scilit]
- Mu, Q.; Zhao, M.; Running, S.W. Improvements to a MODIS global terrestrial evapotranspiration algorithm. Remote Sens. Environ. 2011, 115, 1781–1800. [Google Scholar] [CrossRef] [Scilit]
- Cardenas Morales, B.K.; Forrest, J.; Castro Aponte, W.V.; Sánchez Cornejo, H.E.; La Torre, B.; Jhoncon Kooyip, J.; Byrne, P.; Nguyen, T.T.; Barnes, C.H.W.; Valladares, L.D.L.S. Geochemical, hydrochemical and remote sensing study of an Andean calcareous wetland in Huanta, Peru. J. Hydrol. Reg. Stud. 2025, 62, 102767. [Google Scholar] [CrossRef] [Scilit]
- Miralles, D.G.; Teuling, A.J.; van Heerwaarden, C.C.; Vilà-Guerau de Arellano, J. Mega-heatwave temperatures due to combined soil desiccation and atmospheric heat accumulation. Nat. Geosci. 2014, 7, 345–349. [Google Scholar] [CrossRef] [Scilit]
- Rivera, J.A.; Marianetti, G.; Hinrichs, S. Validation of CHIRPS precipitation dataset along the Central Andes of Argentina. Atmos. Res. 2018, 213, 437–449. [Google Scholar] [CrossRef] [Scilit]
- López-Bermeo, C.; Montoya, R.D.; Caro-Lopera, F.J.; Díaz-García, J.A. Validation of the accuracy of the CHIRPS precipitation dataset at representing climate variability in a tropical mountainous region of South America. Phys. Chem. Earth 2022, 127, 103184. [Google Scholar] [CrossRef] [Scilit]
- Vicente-Serrano, S.M.; Beguería, S.; López-Moreno, J.I. A multiscalar drought index sensitive to global warming: The SPEI. J. Clim. 2010, 23, 1696–1718. [Google Scholar] [CrossRef] [Scilit]
- Gruber, A.; Scanlon, T.; van der Schalie, R.; Wagner, W.; Dorigo, W. Evolution of the ESA CCI Soil Moisture climate data records and their underlying merging methodology. Earth Syst. Sci. Data 2019, 11, 717–739. [Google Scholar] [CrossRef] [Scilit]
- Hao, Z.; AghaKouchak, A. A nonparametric multivariate multi-index drought monitoring framework. J. Hydrometeorol. 2014, 15, 89–101. [Google Scholar] [CrossRef] [Scilit]
- Ivanov, V.Y.; Bras, R.L.; Vivoni, E.R. Vegetation–hydrology dynamics in complex terrain of semiarid areas: I. A mechanistic approach to modeling dynamic feedbacks. Water Resour. Res. 2008, 44, W03429. [Google Scholar] [CrossRef] [Scilit]
- Peters, E.; Torfs, P.J.J.F.; van Lanen, H.A.J.; Bier, G. Propagation of drought through groundwater—A new approach using linear reservoir theory. Hydrol. Process. 2003, 17, 3023–3040. [Google Scholar] [CrossRef] [Scilit]
- Trambauer, P.; Werner, M.; Winsemius, H.C.; Maskey, S.; Dutra, E.; Uhlenbrook, S. Hydrological drought forecasting and skill assessment for the Limpopo river basin, Southern Africa. Hydrol. Earth Syst. Sci. 2015, 19, 1695–1711. [Google Scholar] [CrossRef] [Scilit]
- Van Loon, A.F.; Van Huijgevoort, M.H.J.; Van Lanen, H.A.J. Evaluation of drought propagation in an ensemble mean of large-scale hydrological models. Hydrol. Earth Syst. Sci. 2012, 16, 4057–4078. [Google Scholar] [CrossRef] [Scilit]
- Tallaksen, L.M.; Hisdal, H.; Van Lanen, H.A.J. Space–time modelling of catchment-scale drought characteristics. J. Hydrol. 2009, 375, 363–372. [Google Scholar] [CrossRef] [Scilit]
- Van Loon, A.F.; Laaha, G. Hydrological drought severity explained by climate and catchment characteristics. J. Hydrol. 2015, 526, 3–14. [Google Scholar] [CrossRef] [Scilit]
- Blöschl, G.; Hall, J.; Viglione, A.; Perdigão, R.A.P.; Parajka, J.; Merz, B.; Lun, D.; Arheimer, B.; Aronica, G.T.; Bilibashi, A.; et al. Changing climate both increases and decreases European river floods. Nature 2019, 573, 108–111. [Google Scholar] [CrossRef] [Scilit] [PubMed]
- Deng, S.; Tan, X.; Tan, X.; Wu, X.; Huang, Z.; Liu, Y.; Liu, B. On the development and recovery of soil moisture deficit drought events. J. Hydrol. 2024, 632, 130920. [Google Scholar] [CrossRef] [Scilit]
- Nie, M.; Huang, S.; Zeng, X.-M.; Peng, J.; Bai, G. Spatiotemporal desynchronization in the propagation from meteorological to soil moisture drought in the Loess Plateau, China. J. Hydrol. Reg. Stud. 2024, 56, 102025. [Google Scholar] [CrossRef] [Scilit]
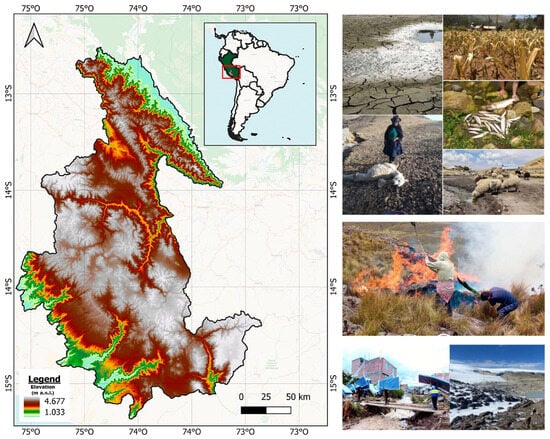
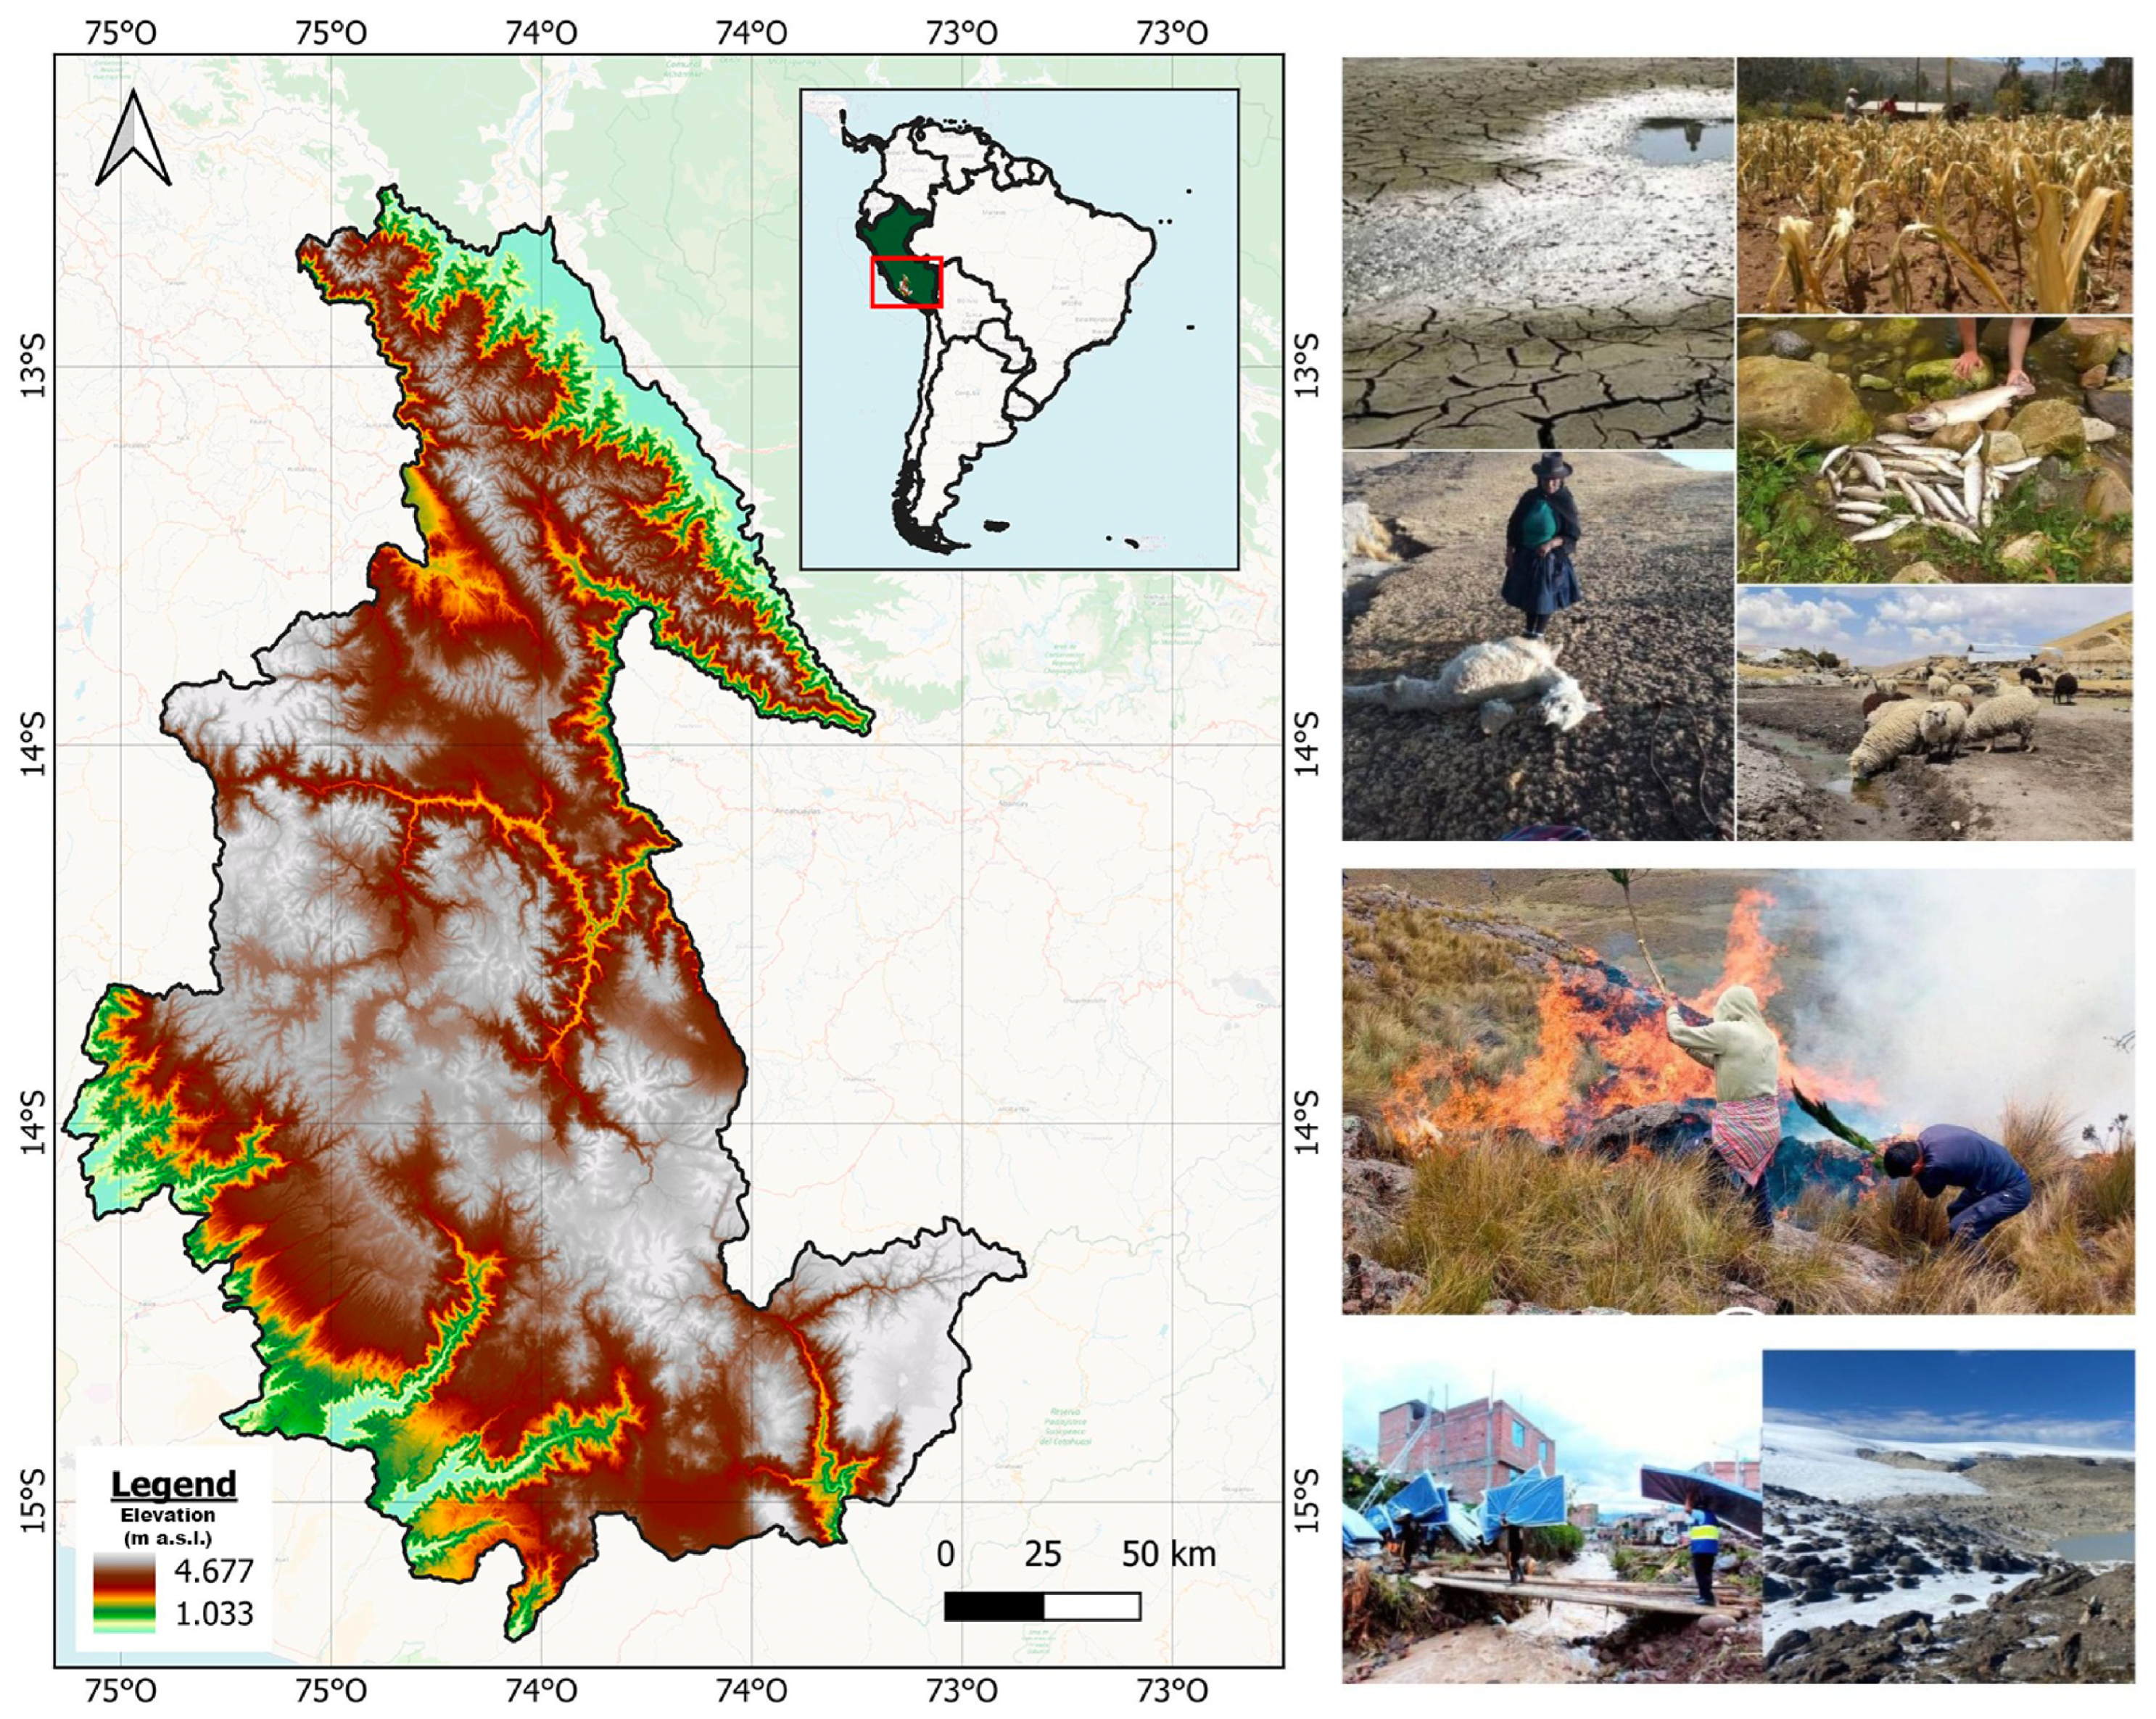
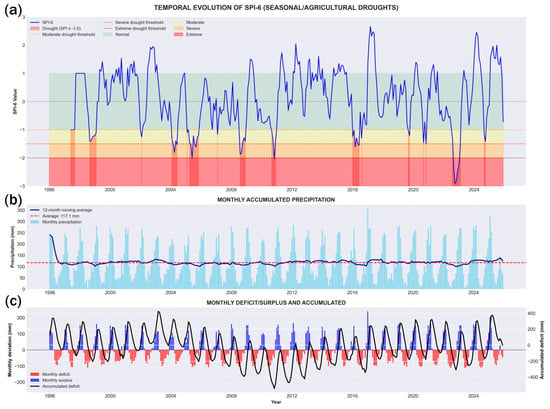
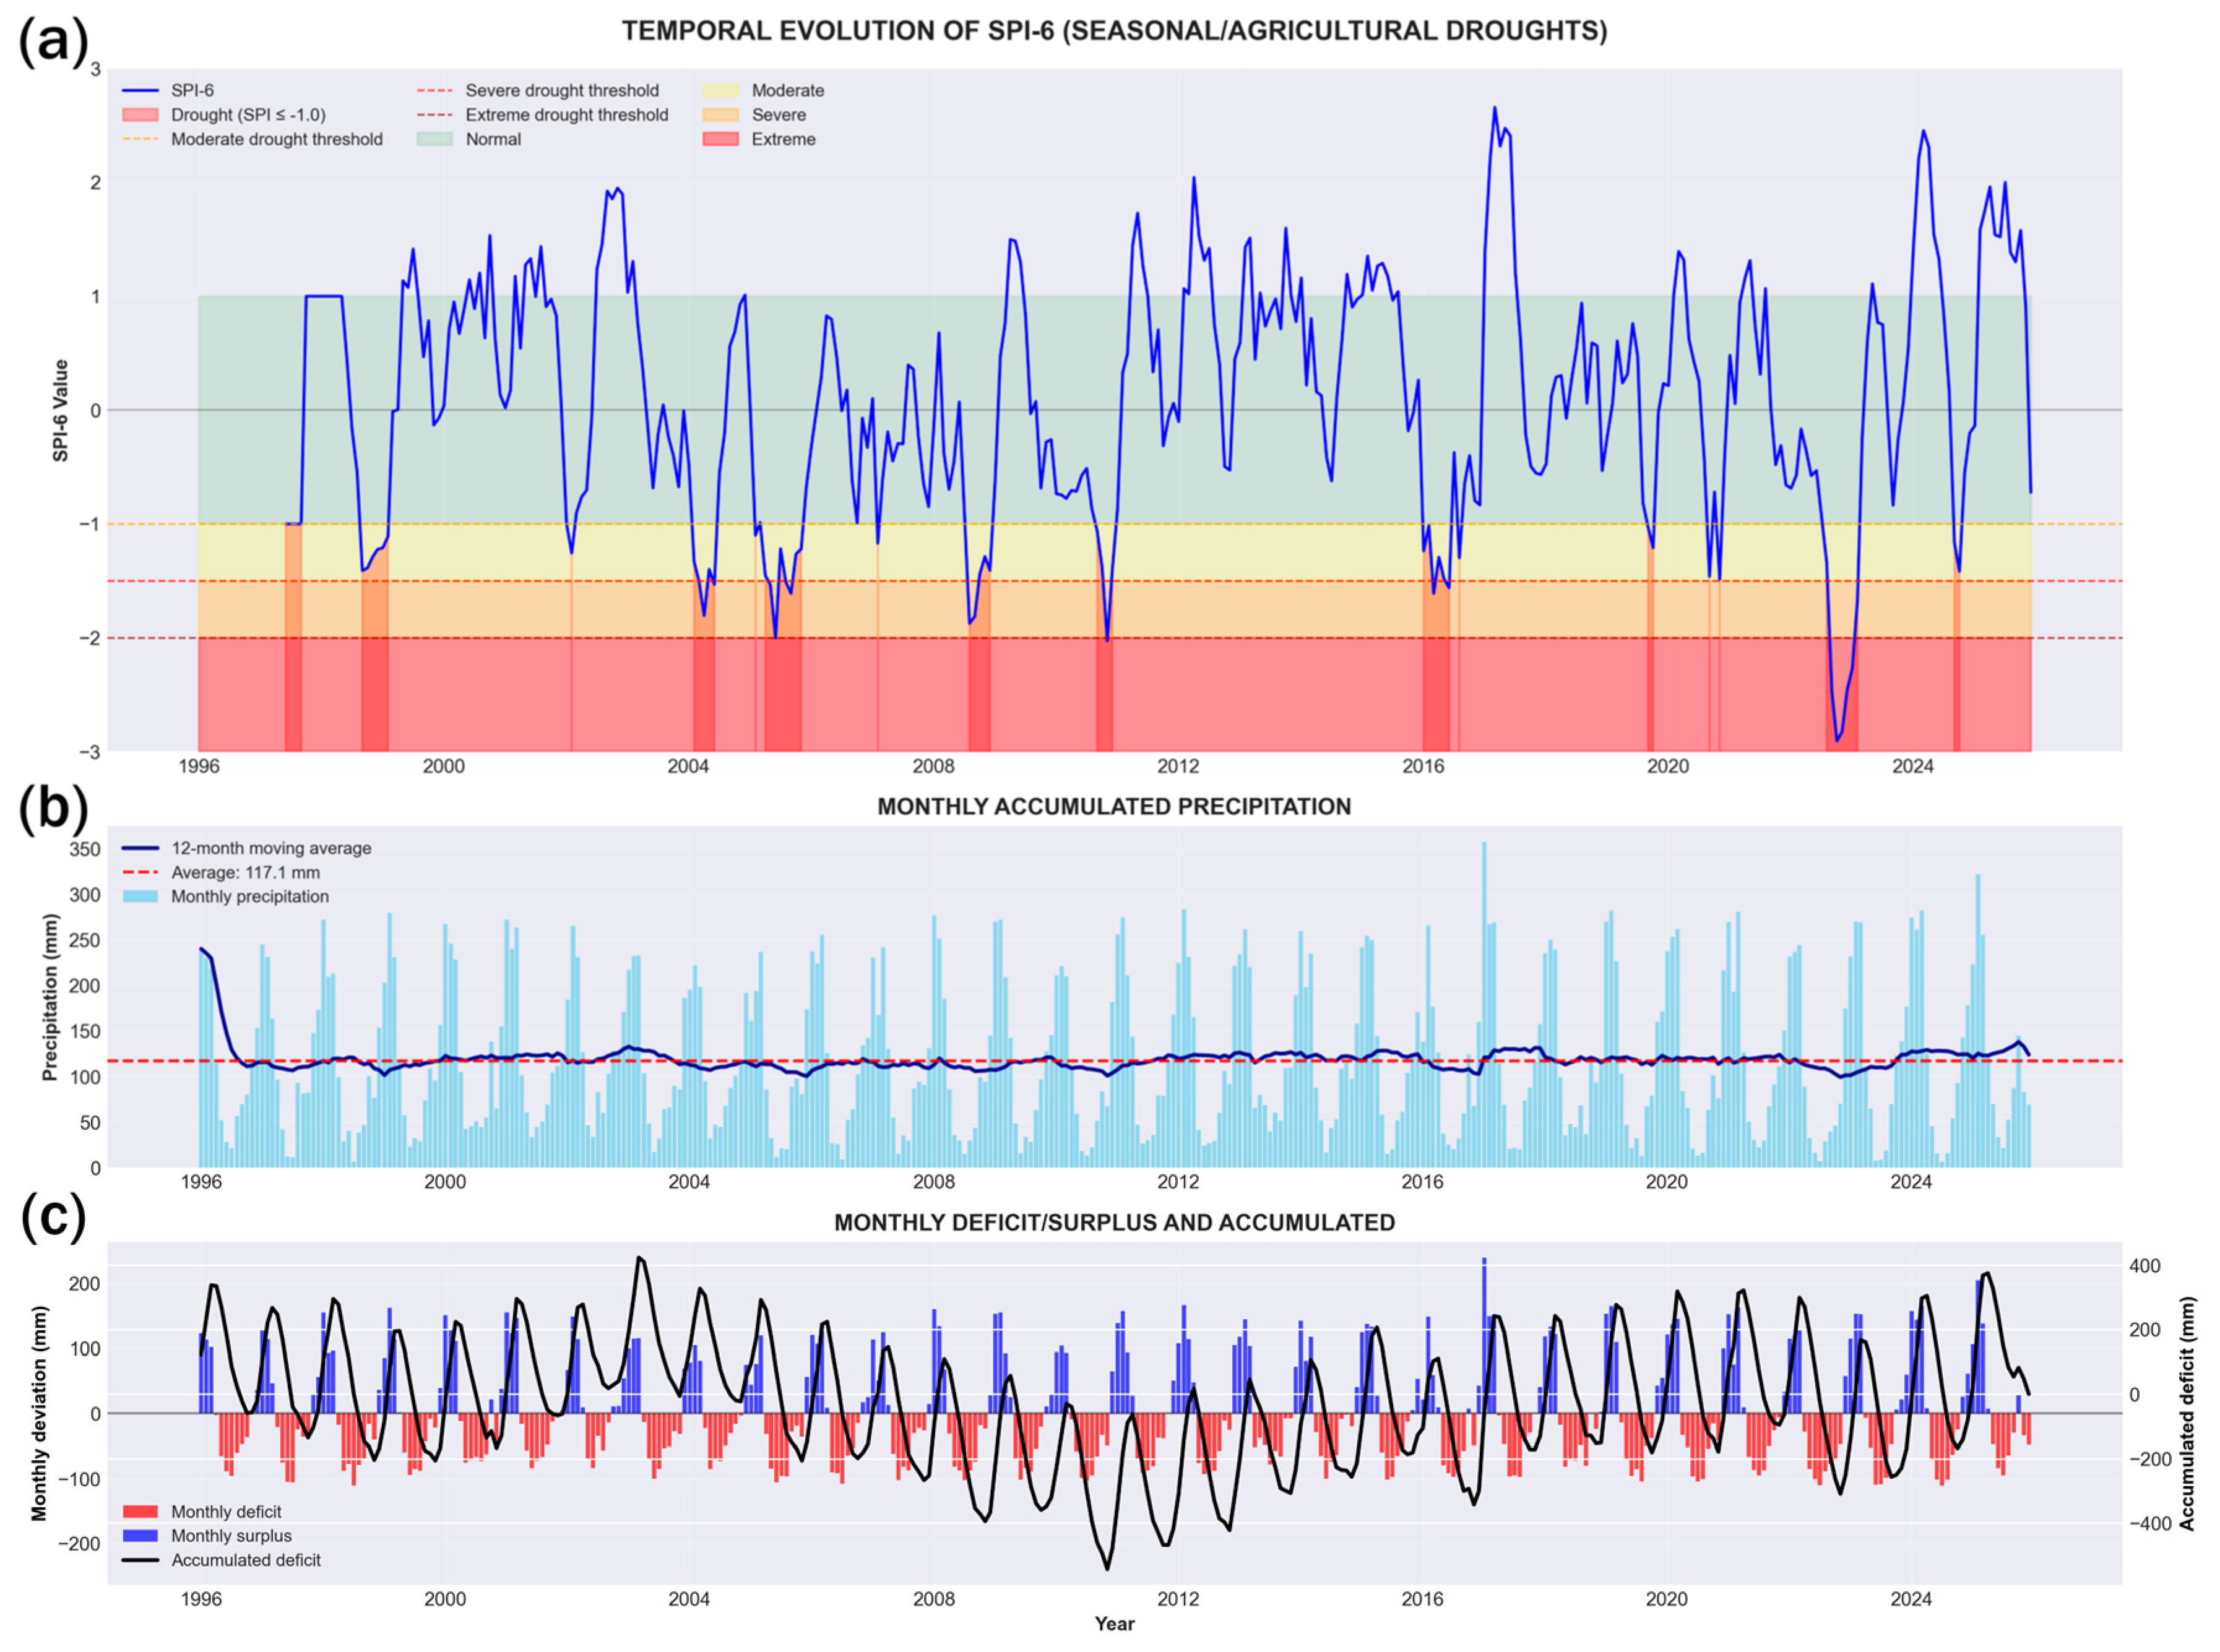
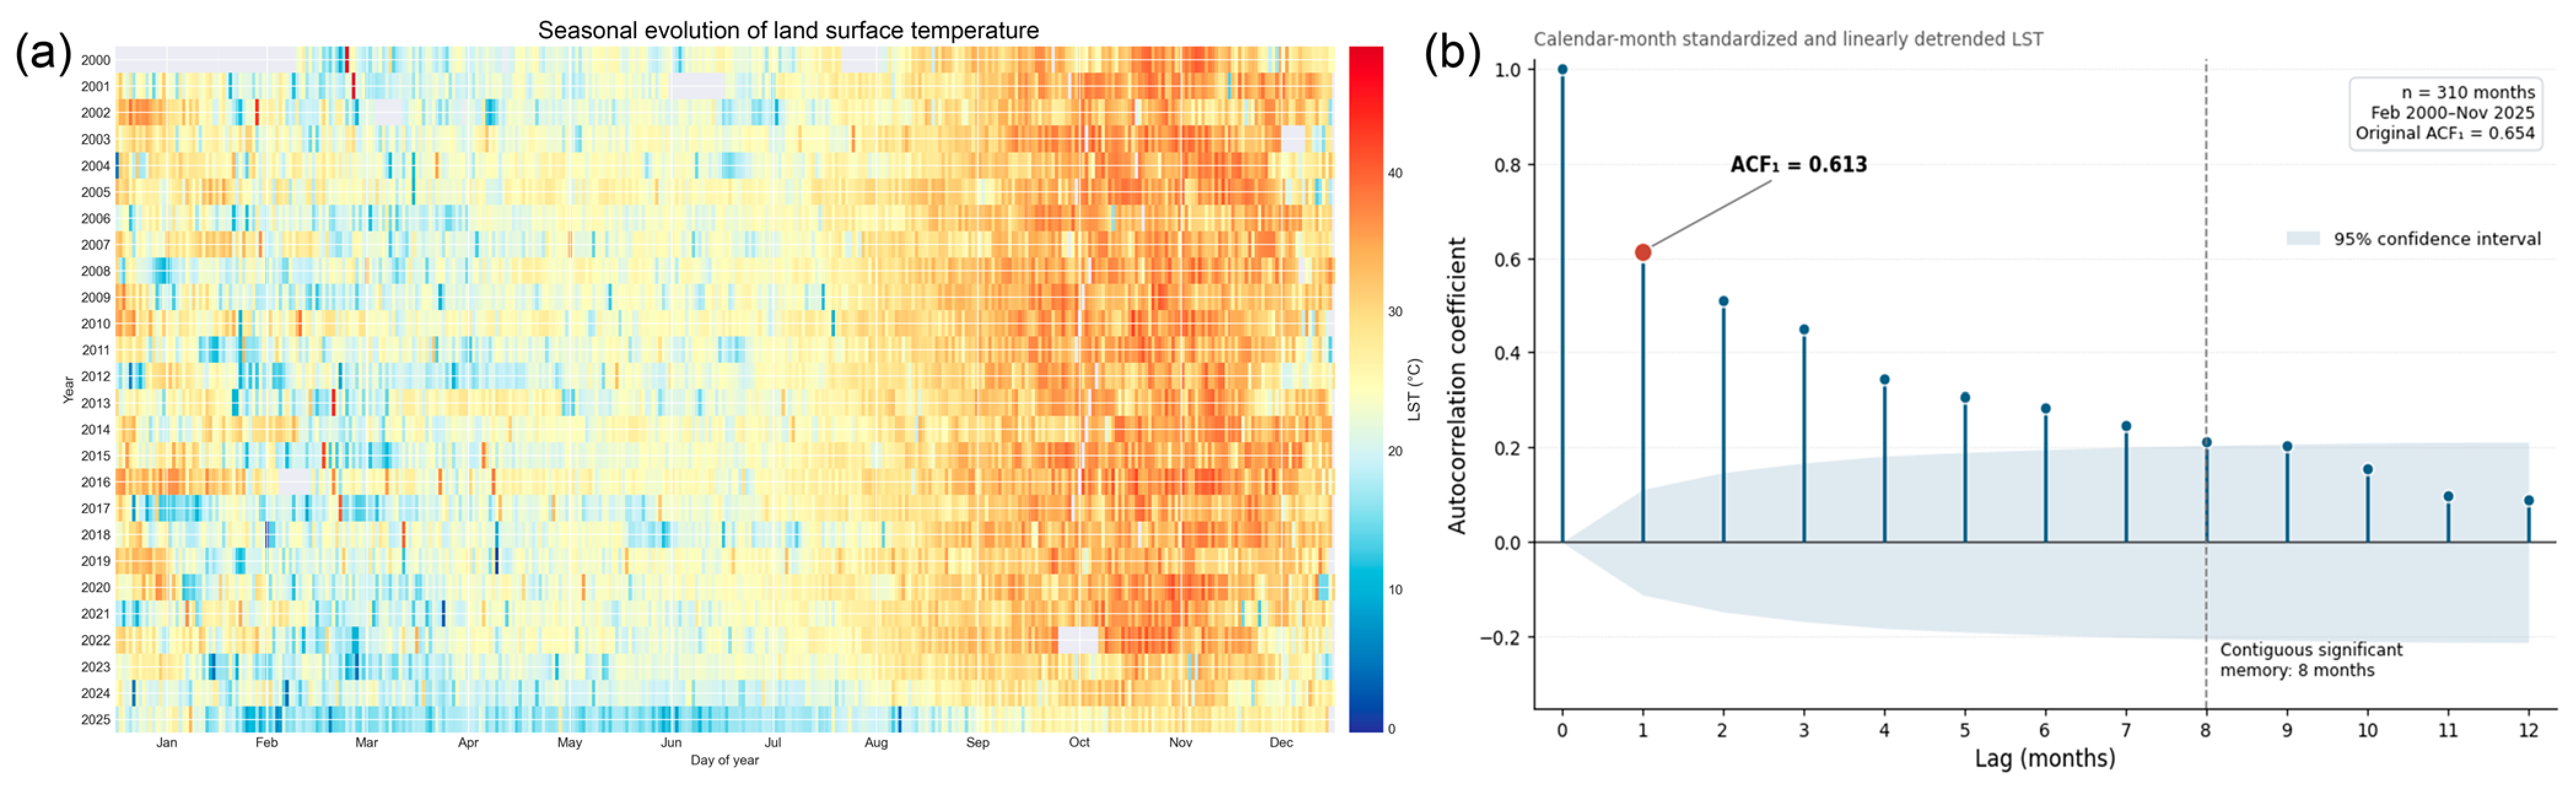
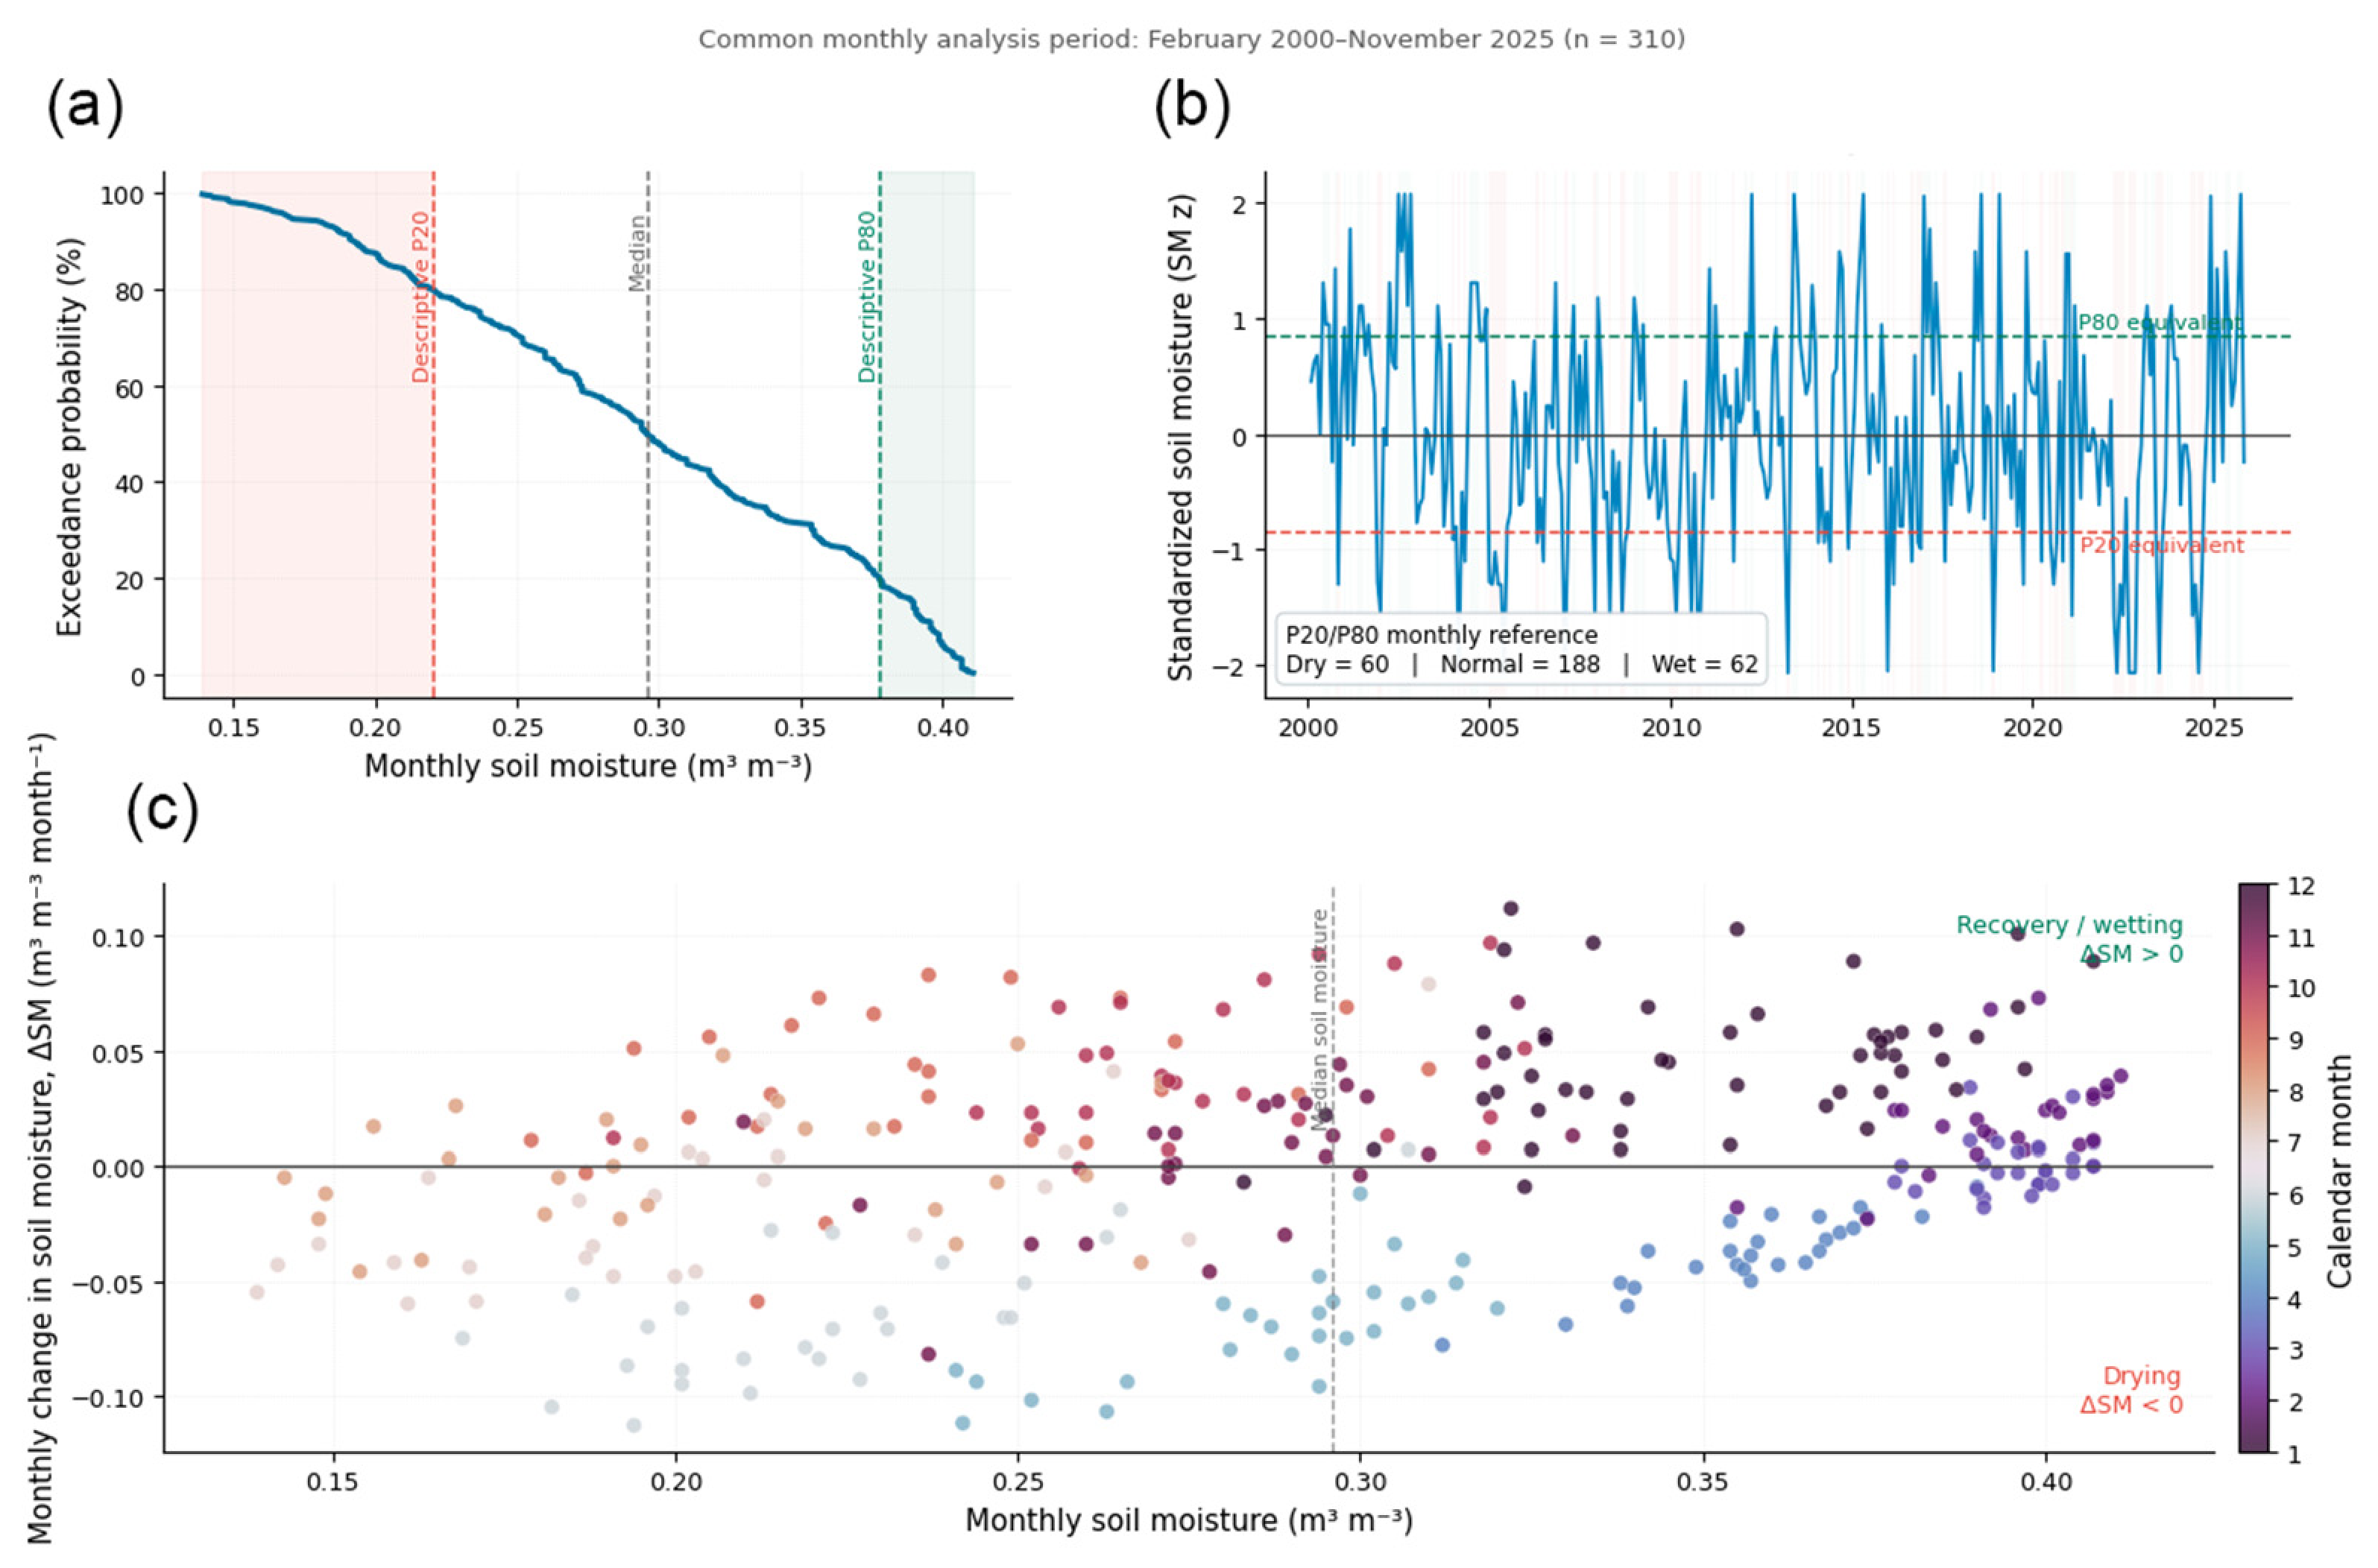
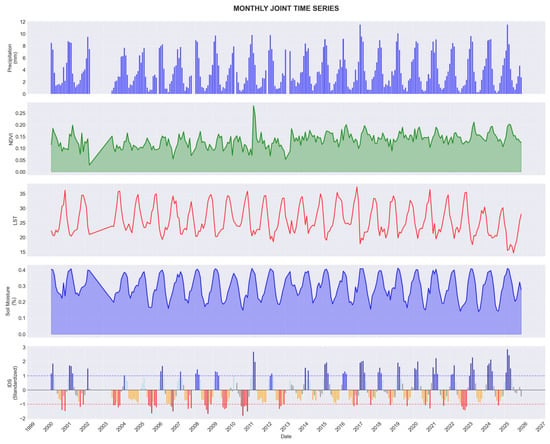
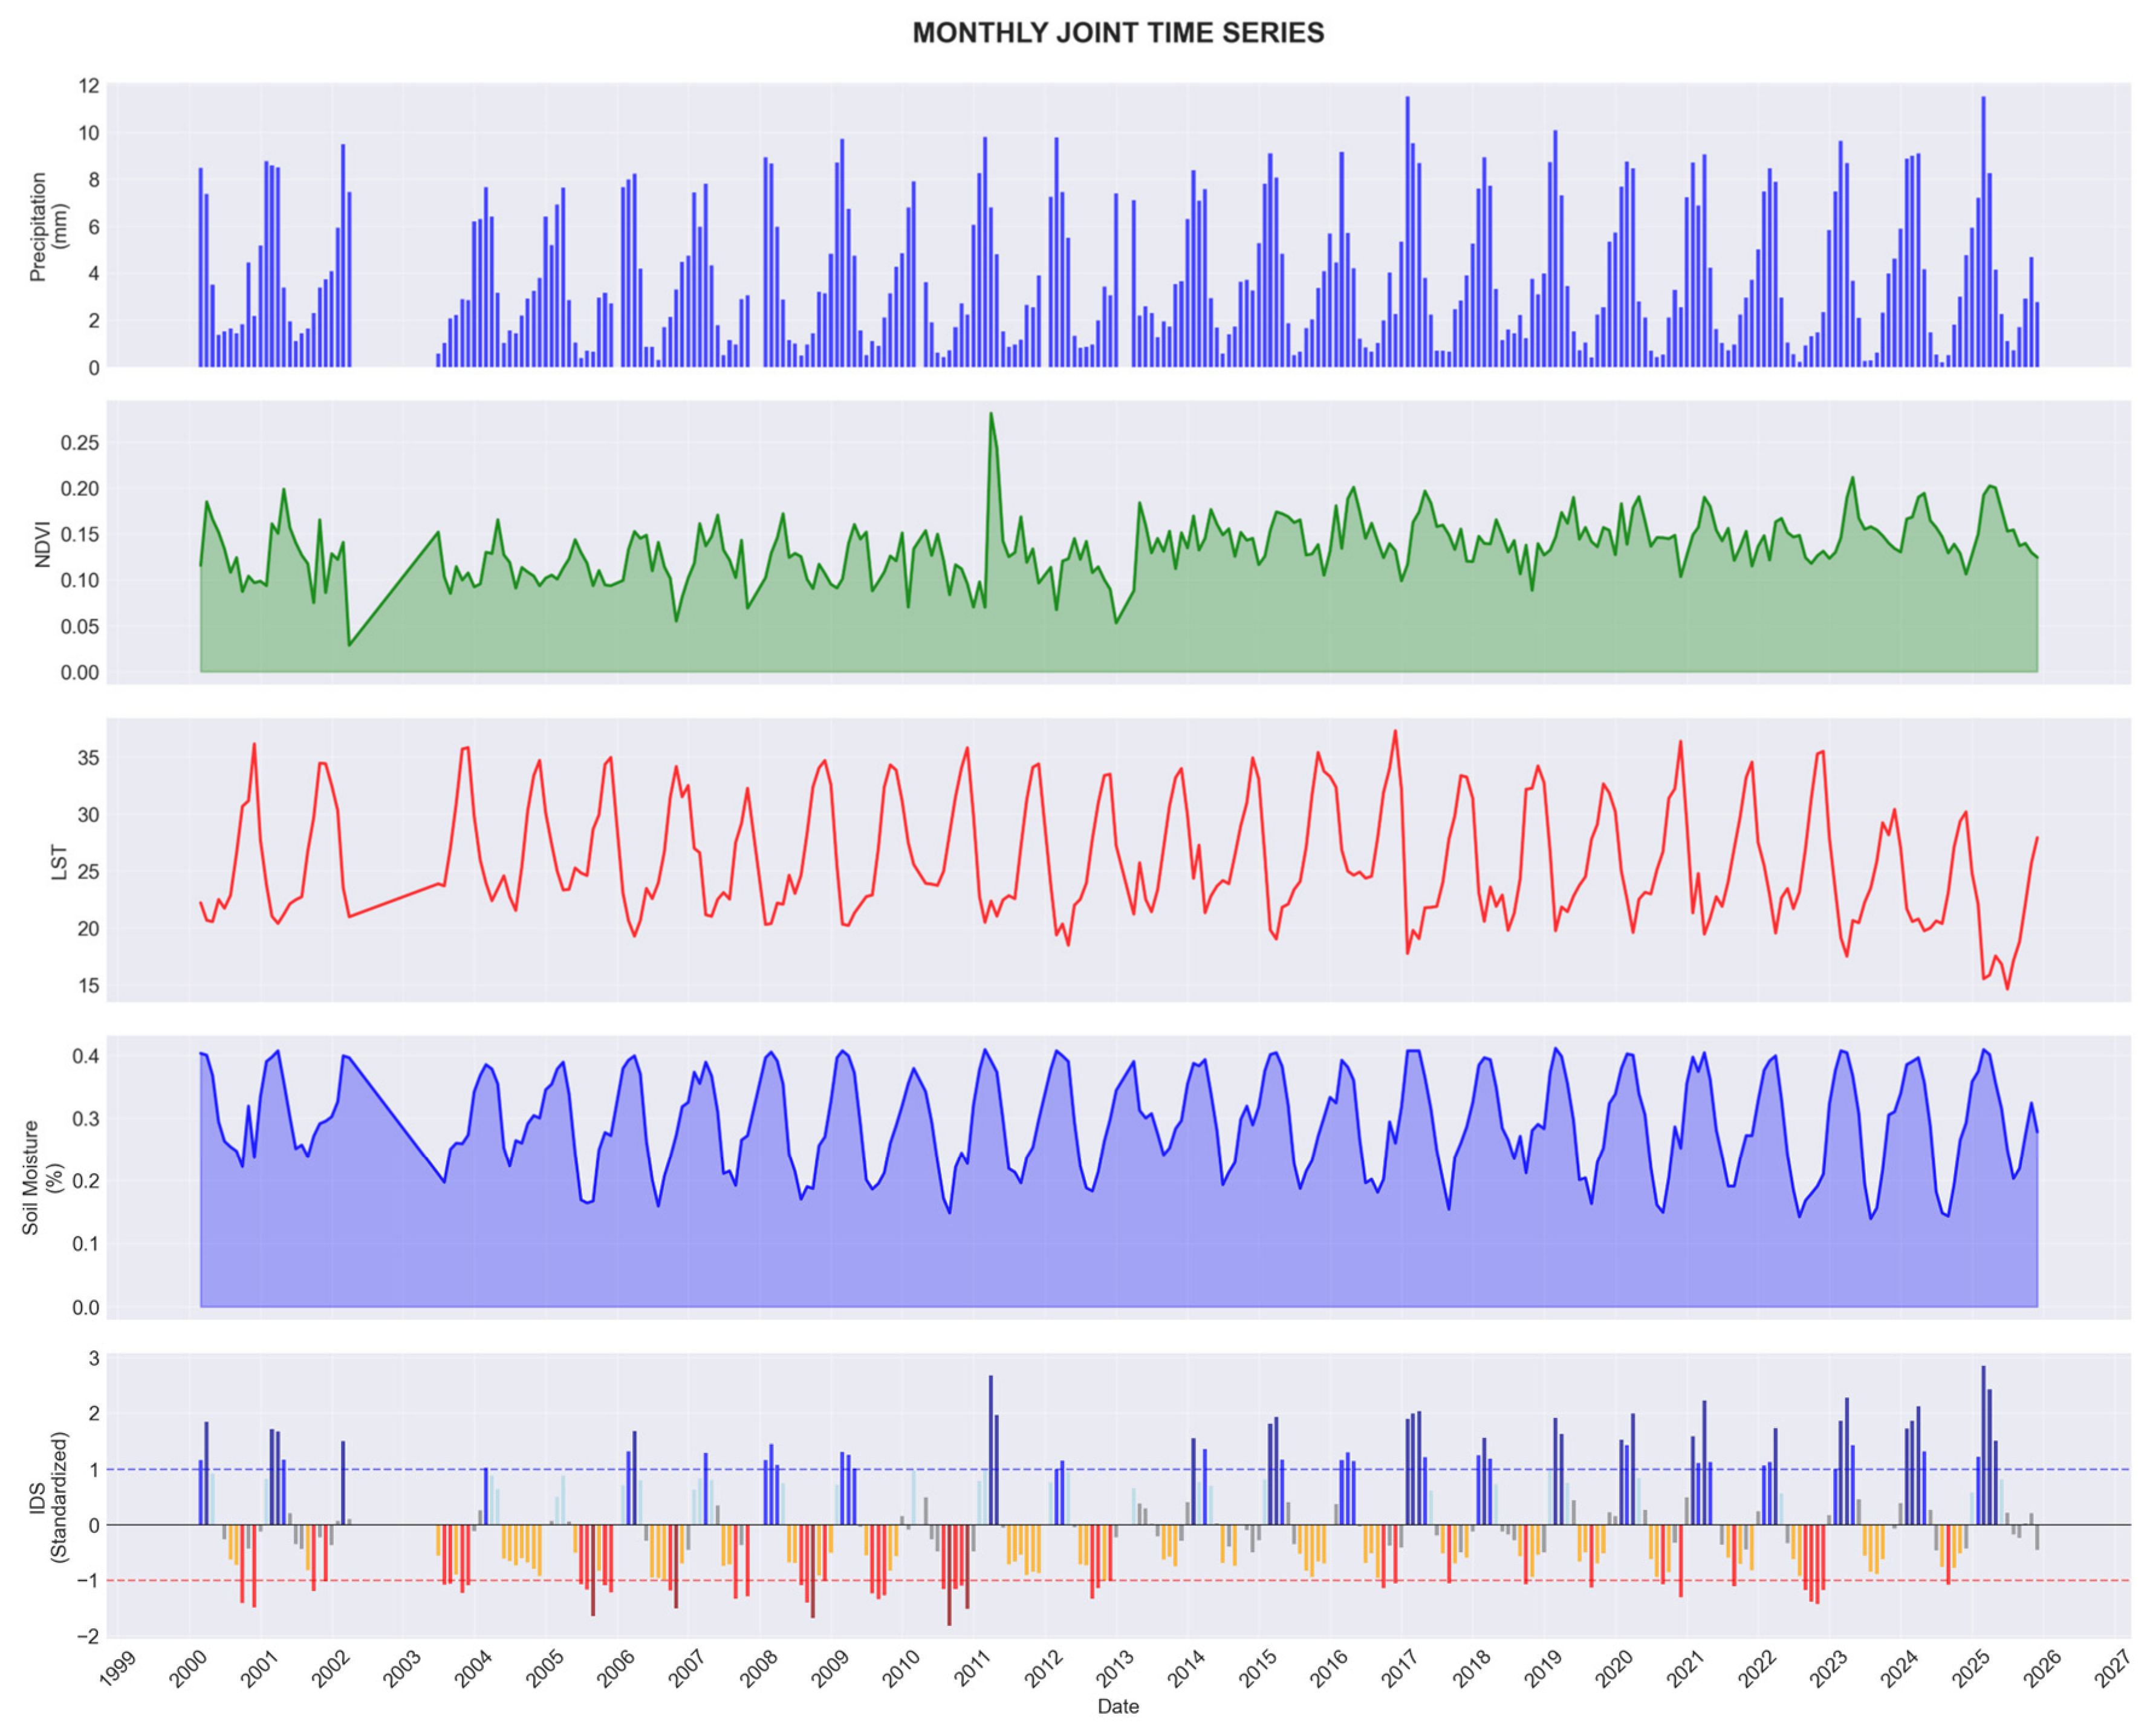
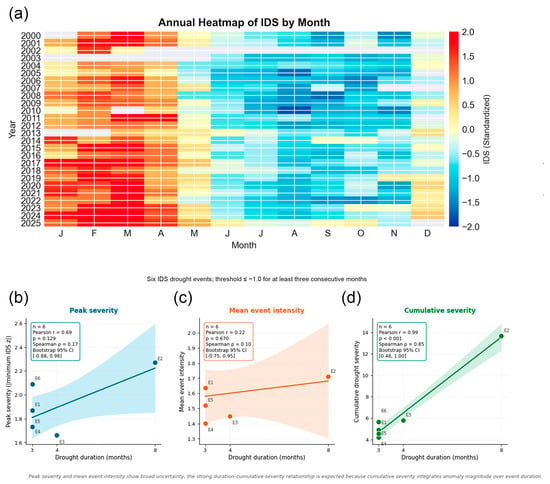
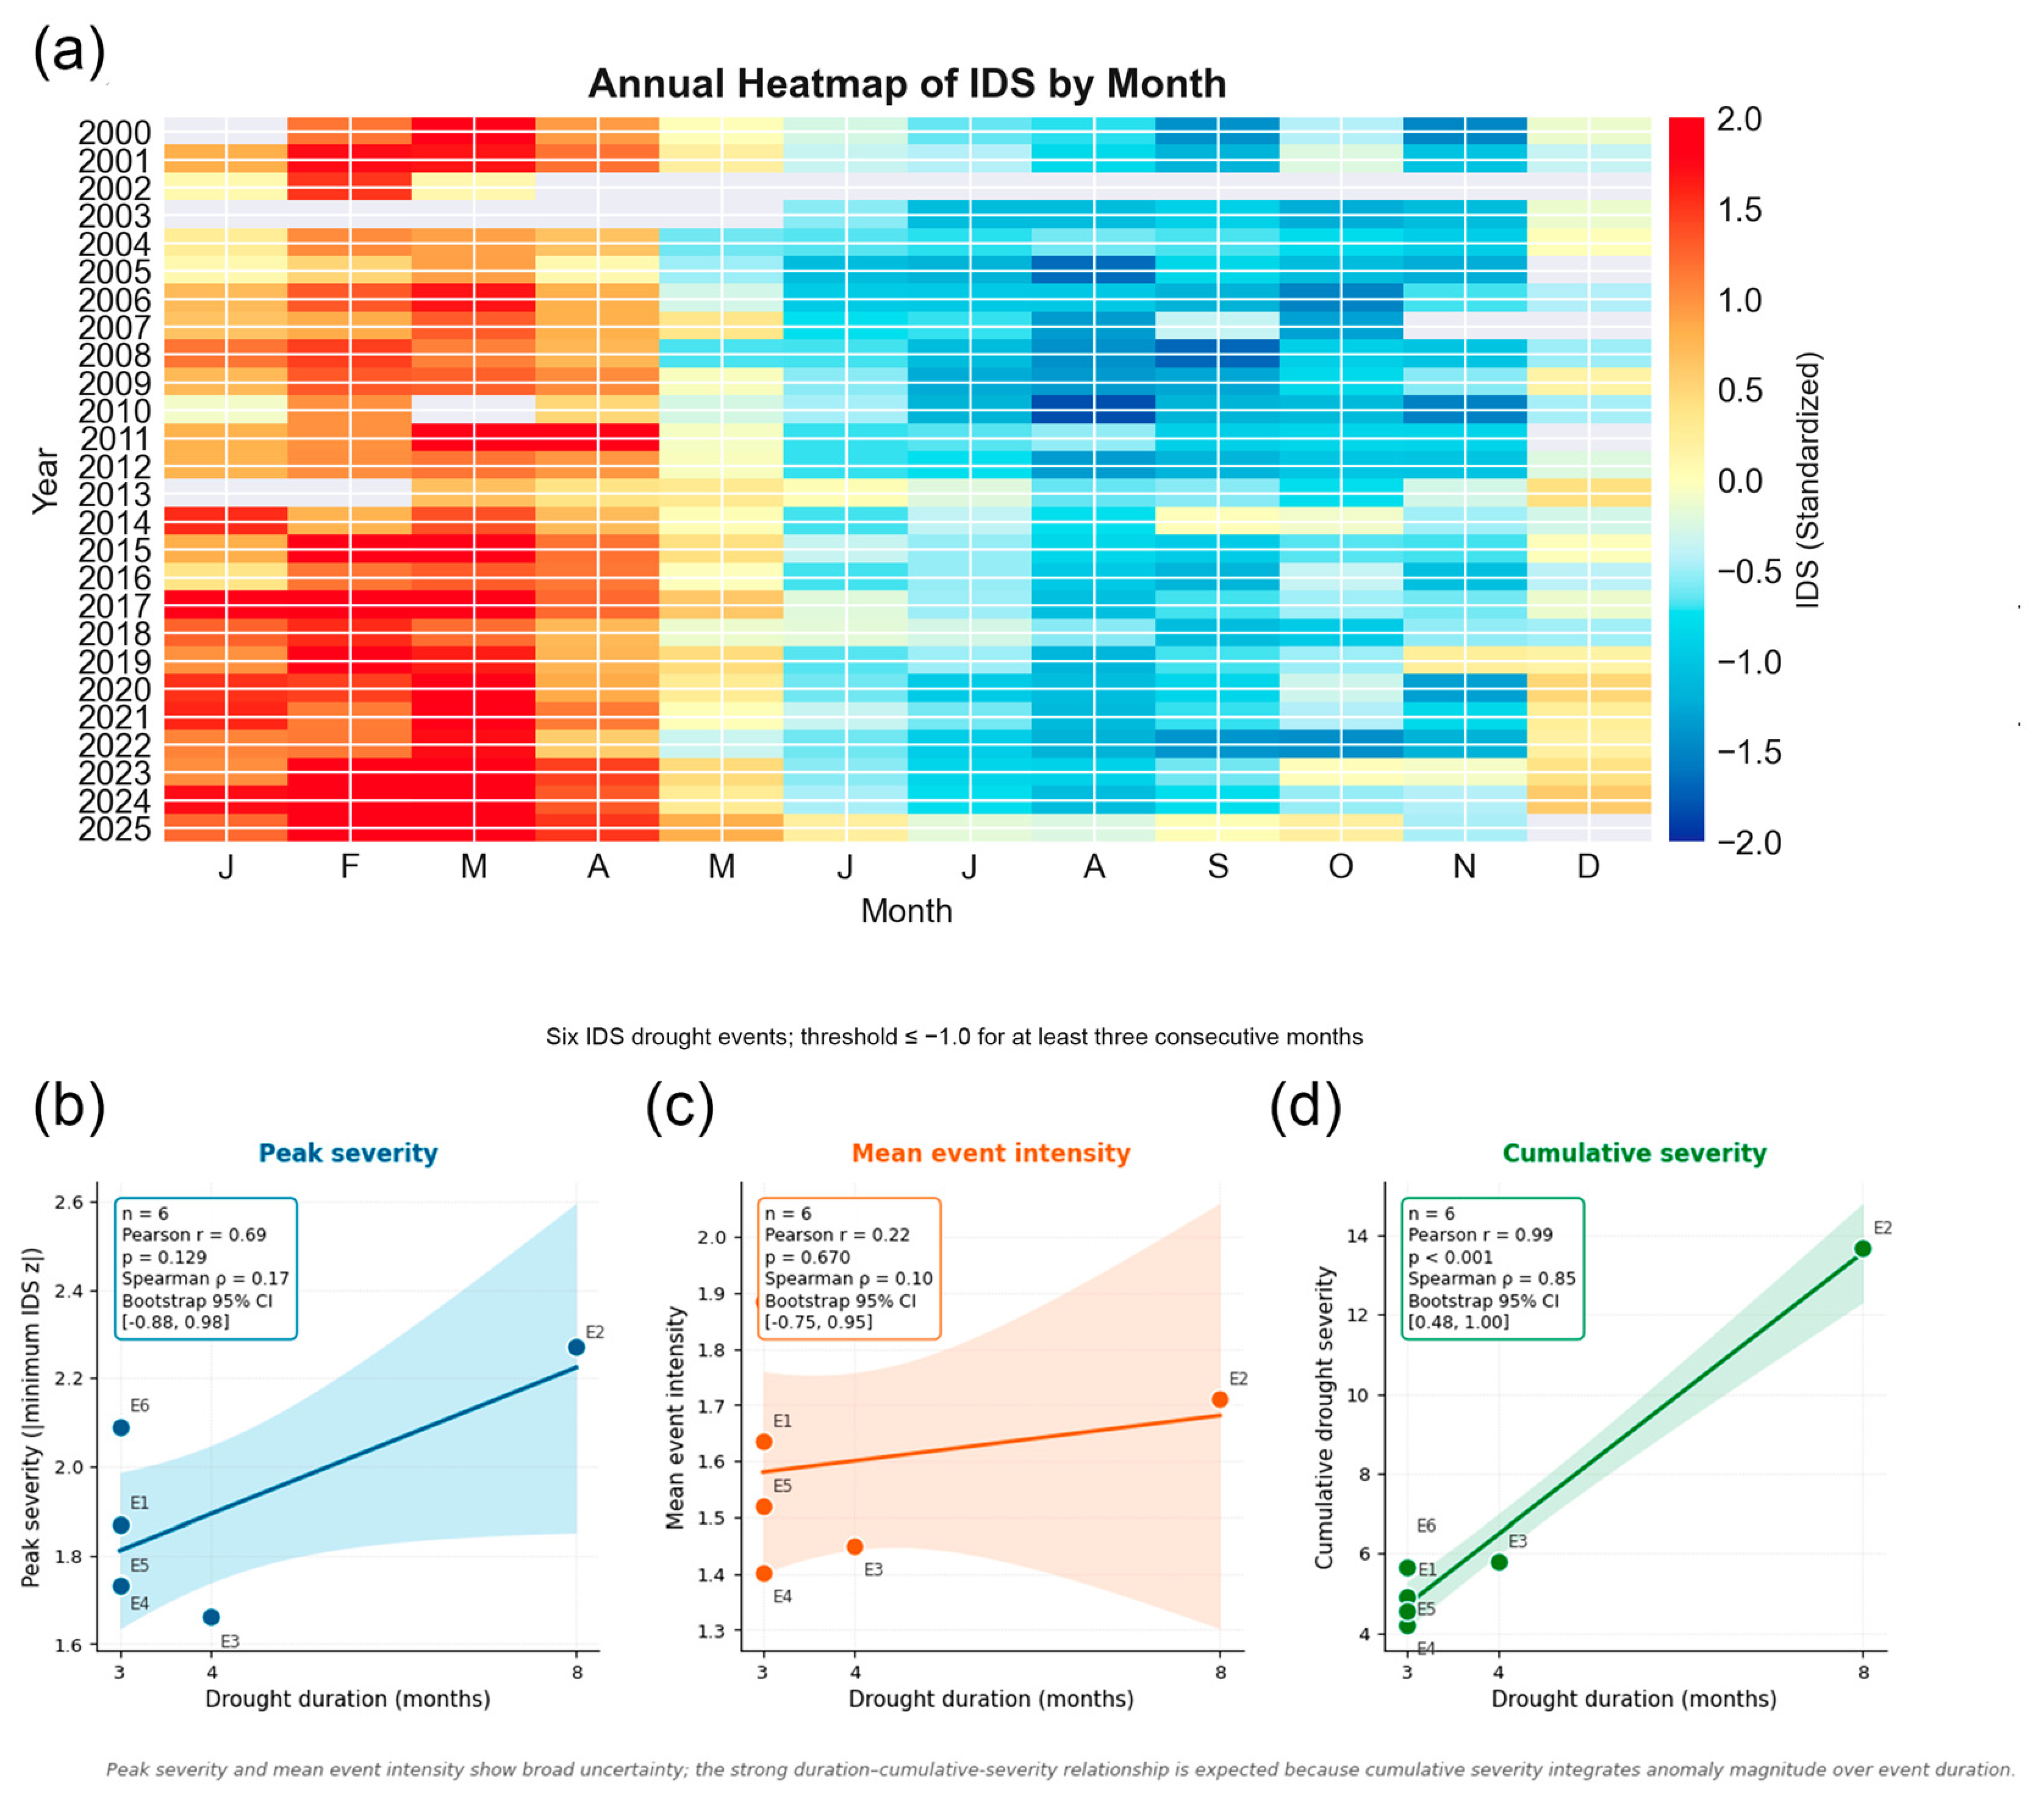
Disclaimer/Publisher’s Note: The statements, opinions and data contained in all publications are solely those of the individual author(s) and contributor(s) and not of MDPI and/or the editor(s). MDPI and/or the editor(s) disclaim responsibility for any injury to people or property resulting from any ideas, methods, instructions or products referred to in the content. |
© 2026 by the authors. Licensee MDPI, Basel, Switzerland. This article is an open access article distributed under the terms and conditions of the Creative Commons Attribution (CC BY) license.