


Abstract
Freely meandering rivers flow through gently sloping plains composed of loess and fluvial sediments. Low-gradient alluvial plains are formed without the influence of landscape features such as rock outcrops or other features that distort the flow path. The channel configurations of such rivers, and in particular the size of meanders and oxbow lakes, depend on the average long-term water discharge. Large rivers form large meanders, while small rivers form correspondingly small ones. Morphological analysis of river channel configurations can offer a metric for estimating the average long-term water discharge of a river based solely on the sinuosity of its channel. The study examined six freely meandering rivers in Kazakhstan, with discharges ranging from 4.5 to 760 m3/s and channel slopes from 0.005 to 0.06%. The morphological analysis of river channels was based on the Relative Elevation Model, specifically its version based on the Copernicus Global Digital Elevation Model, with a spatial resolution of 30 m. River channel configurations were approximated using a set of inscribed circles, the diameters of which formed the basis for the river’s average long-term water discharge metric. The largest diameter circles, which could support the river channel with a sector of at least 135°, were expertly inscribed into river bends. The diameters of the inscribed circles within these sets varied from four times for small rivers to ten times for large rivers. These sets of circles, sorted by size, can characterize the average long-term water discharge of the analyzed rivers. For example, a sample of average median values of inscribed circle diameters has a high correlation with the average long-term water discharge, with a linear approximation reliability of R2 = 0.997. The scope of the developed method for assessing the average long-term water discharge of freely meandering rivers includes retrospective analysis of changes in average long-term average long-term water discharge. This can provide significant historical depth of analysis, spanning centuries and millennia, since the analysis is based on describing the results of very slow processes of natural deformation of river channels. Thus, the method proposed in this study for assessing the average long-term water discharge of freely meandering rivers based on morphological analysis of their channel configurations expands the arsenal of tools for reconstructing certain paleoclimate elements related to the hydrology of territories.
1. Introduction
River average long-term water discharge is an important component of terrestrial hydrology. Any spatial and temporal scale of consideration is of great practical interest. Detailed information on river average long-term water discharge is particularly scarce in timescales of centuries or longer. Historical sites and chronicles sometimes contain information about anomalous river flow events. Low water levels or floods occasionally appear in historical records [1,2], but the most interesting average characteristics from a climatological perspective typically go unmentioned. In today’s warming climate, long-term river flow forecasts, especially in water-stressed regions of the world, are crucial for strategic planning of regional economic development, including ensuring water and food security for the populations living there.
Some rivers flow through gently sloping plains composed of loess rocks without the distorting influence of bedrock outcrops. Under such conditions, rivers transport large amounts of suspended material, which leads to natural deformation of their channels. River channels bend, forming meanders and oxbow lakes. The patterns of river channel deformation have been described in numerous studies [3,4]. The spatial scale of river channel deformation primarily depends on the magnitude of average long-term water discharge [5,6,7,8]. Thus, the morphology of freely meandering river channels carries information about their average long-term water discharge, which was described in classical scientific publications on this topic [9,10,11]. The rate of channel deformation is relatively low. Therefore, diagnosing the average long-term water discharge of meandering rivers based on morphological analysis of their channel configurations concerns time scales characteristic of the oxbow lake formation cycle, which typically lasts centuries. For traces of old dry river channels, the historical depth of river flow analysis can extend to a thousand years or more, determined by the activity of surface erosion processes (water and wind), which mask the traces of old river channels.
The most important characteristic of rivers is the average long-term water discharge. This is a key parameter in describing the hydrology of territories. Essentially, it represents a certain approximation of the fluctuating time function of river flow. This period, lasting centuries, includes periods of low and high-water levels, dry and wet long-term periods, and individual seasons with abnormal water levels. Within a season, distinct weather events associated with river flow always occur, such as spring floods, flash floods, and so on. All of this creates a river flow that is unstable over time and of varying magnitude, resulting in continuous channel deformation. Thus, meandering river channels are morphodynamic entities that, over a sufficiently large stretch of river channel, experience various phases of meander development at any given time, from the onset of deformation in a straight section of the channel to the separation of a river loop from the main channel, resulting in the formation of an oxbow lake [12,13].
River discharge monitoring is typically based on data from a ground-based network of gauging stations. The archive of such data rarely exceeds 100–150 years. It should also be noted that ground-based measurements of discharge in meandering rivers carrying large amounts of suspended material present a complex technical challenge. The hydrological profiles of such rivers are unstable. During periods of high water, sandbanks can form and disappear quite quickly, and the riverbed depth can change. Rarely does the river’s route change. New riverbeds emerge, and old ones dry up. High water periods can be accompanied by a significant increase in riverbed width due to flooding of floodplains. Estimating river discharge in flooded floodplains is extremely difficult. Therefore, ground-based information on discharge in lowland rivers carrying large amounts of suspended material is rather tentative.
An additional complexity of the approach to assessing river average long-term water discharges based on morphological analysis of their channel configurations is the potential incompatibility between the time of ground-based hydrological monitoring and the time required for the characteristic sinuosity of a river channel to develop. Thus, existing ground-based monitoring of river discharge may often only cover part of the time of river meander formation. Obtaining simple empirical relationships between river channel configuration features and average long-term discharge, with high reliability and low error rates, then requires synchronicity in long-term changes in the average long-term water discharge of all analyzed rivers. In this case, ground-based monitoring data, regardless of whether the current period is high-flow or low-flow, will provide simple empirical relationships between the morphological characteristics of river channels and the recorded average long-term river water discharge, with low error rates. This requirement is more easily met when the rivers being analyzed are located in the same region, have similar river valley geomorphology, the same type of drainage, and collect water in the same orographic mountainous region.
The goal of this study was to develop a methodology for the morphological analysis of freely meandering river channel configurations to assess average long-term water discharge. The information content of this approach is limited to relative and comparative assessments over large time scales, including comparisons of river discharges over different time periods, which is of interest for retroclimate studies.
2. Materials and Methods
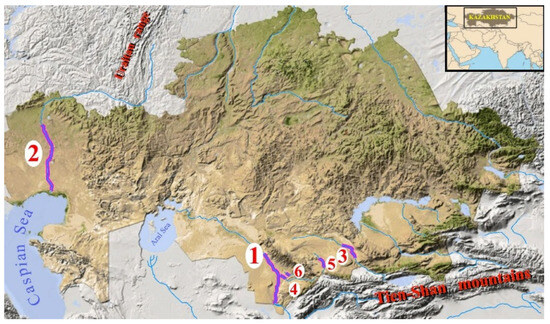
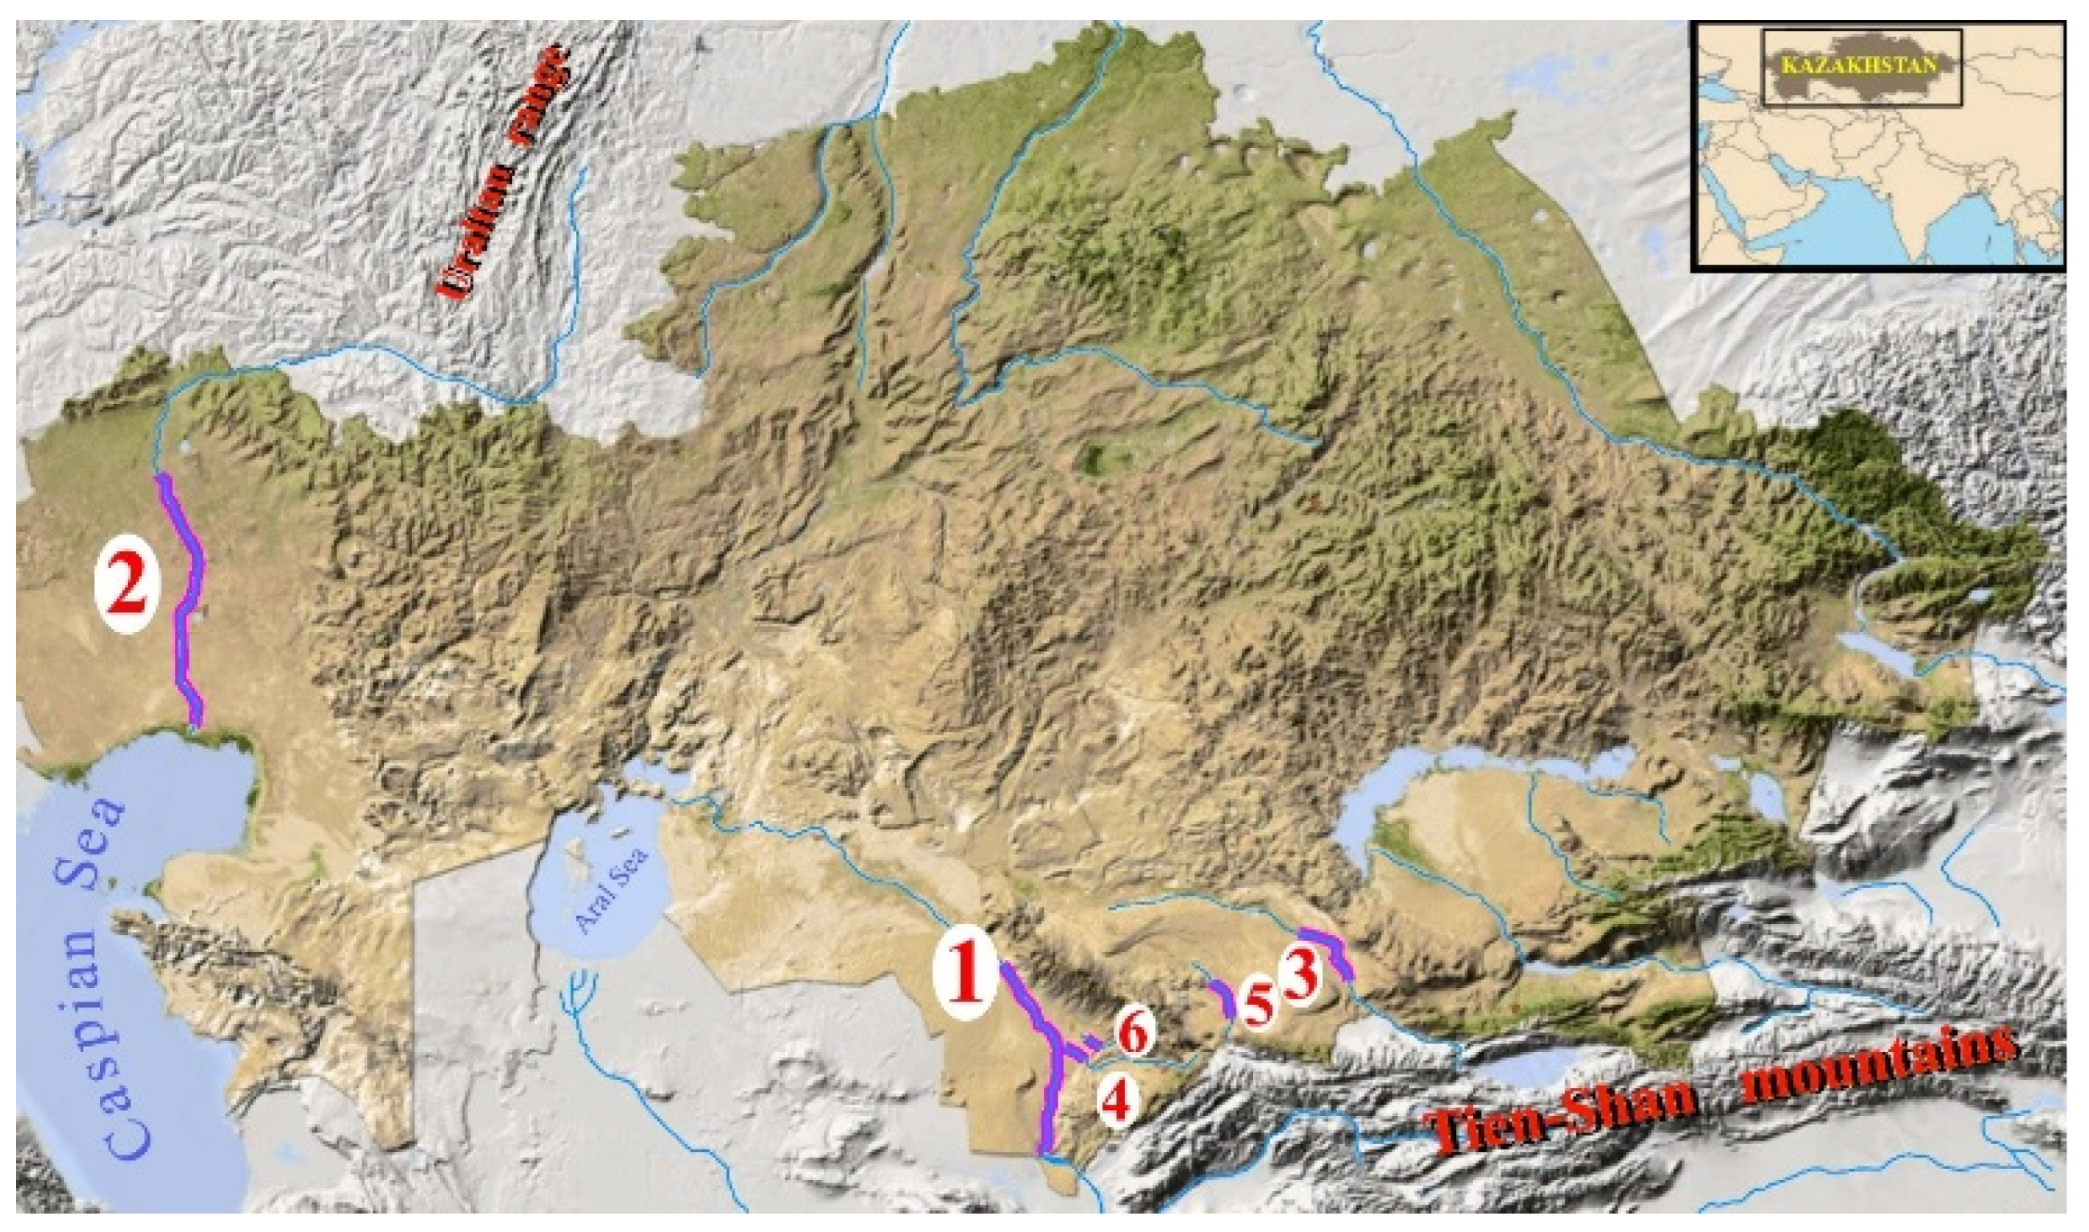
A freely meandering river, in our understanding, is one that flows through a gently sloping plain composed of loess and fluvial sediments, the channel shape of which is not distorted by outcrops of more stable rocks (such as bedrock) and lacks fragments of canyon formations due to excessive water erosion. The modern channel of such a river is surrounded by drying oxbow lakes and old channel traces, indicating that the river’s trajectory was previously somewhat different. In other words, the river flow is free to vary its trajectory in most sections of the analyzed channel, on a spatial scale exceeding the dimensions of the largest meanders. The study analyzed six meandering rivers in Kazakhstan (Figure 1).
Figure 1.
Relief of the territory of Kazakhstan, with marked test sections of the rivers selected for analysis (1–6): 1. Syr Darya River; 2. Ural River; 3. Chu River; 4. Arys River; 5. Talas River; 6. Bugun River.
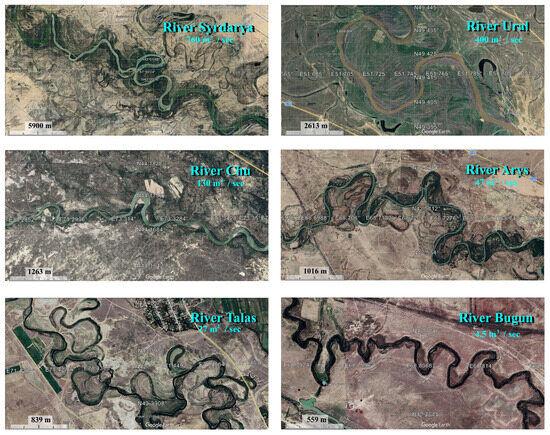
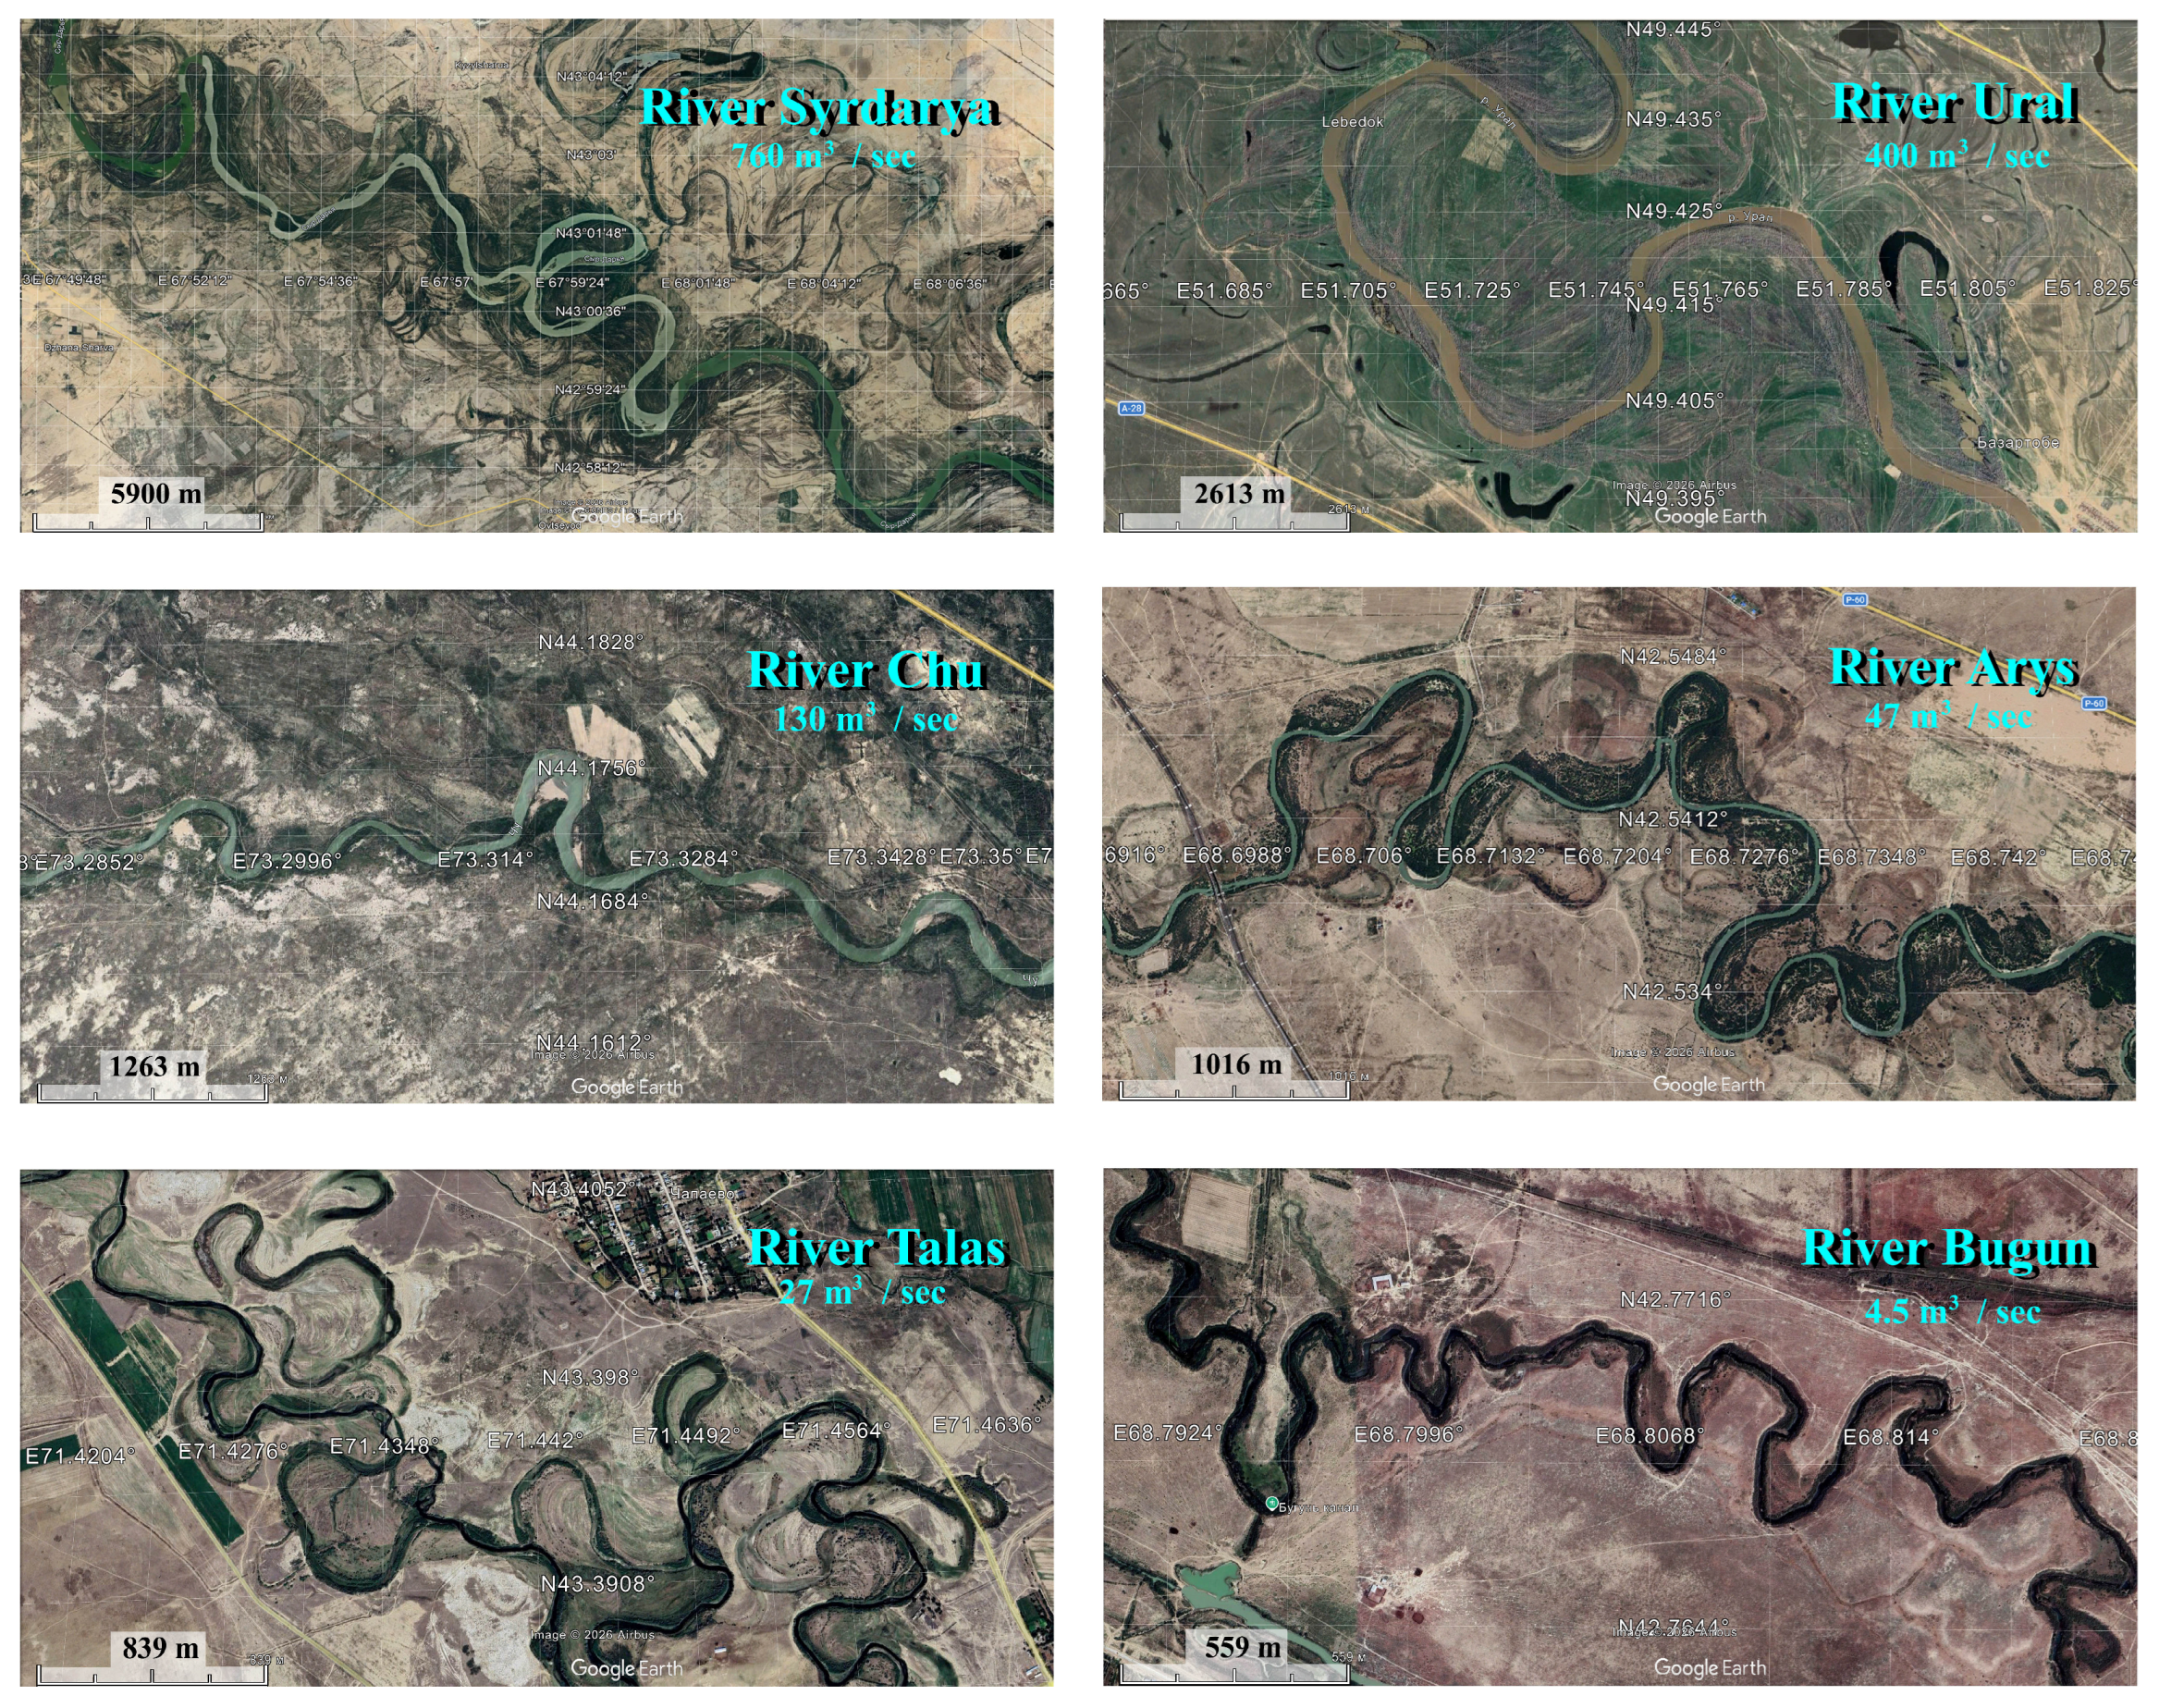
Five of them collect their waters in the Tien Shan ranges (7439 m). The Ural River, which originates in the Ural Mountains (1068 m) in the Russian Federation, was also analyzed. The rivers selected for analysis had certain characteristics [14]. Specifically, in the lower parts of their valleys, the rivers transited (without receiving tributaries) gently sloping plains composed of loess rocks and river sediments, with a channel slope of 0.005 to 0.06%. Furthermore, in the test section, the rivers were able to meander freely, without interacting with landscape features that limit natural channel deformation. Freely meandering rivers are quite rare, which limited the sample to only six rivers. Freely meandering rivers form numerous bends and loops (Figure 2), which served as the subjects of morphological analysis. The length of the test section was chosen to ensure, if possible, an equal and statistically significant number of river meanders suitable for morphological analysis. In this study, a set of 150 well-formed meanders was used as the benchmark for statistical sufficiency.
Figure 2.
Fragments of the channels of six test rivers in Kazakhstan. Submeter-resolution satellite images from Google Earth.
The Syr Darya River (average long-term water discharge 760 m3/s) is over 2000 km long with a basin area over 200,000 km2. The river collects water in the Inner and Western Tien Shan ranges and eventually flows into the Aral Sea. The river is fed by snow and partly by ice. The maximum flood level is observed in June. After the Shardara Reservoir (Kazakhstan), the river flows through flat territory, forming numerous bends. A 360 km-long section of the riverbed, starting from the tailwater of the Shardara Reservoir, was used for the analysis. The elevation difference in the test section was 50 m, from 230 m to 180 m above sea level, with an average riverbed slope of 0.012%.
The Ural River (average long-term water discharge of 400 m3/s) is over 2400 km long and has a drainage basin area of approximately 230,000 km2. It originates in the Ural Range and flows into the Caspian Sea. It is fed by snow, with the maximum flood in May. In the lower part of its valley, the river flows through the Caspian Lowland, forming numerous meanders and backwaters. A 724 km-long section of the riverbed, starting from Atyrau and going upstream, was selected as the test site. It had an elevation difference of 39 m, ranging from −27 m to 12 m above sea level. The average slope was 0.005%.
The Chu River (average long-term water discharge of 130 m3/s) is approximately 1200 km long and has a drainage basin area of 67,500 km2. The river collects its waters in the Northern Tien Shan ranges. After emerging from the mountains, it flows through the Chuya Valley, forming numerous meanders before disappearing into the salt marshes of the Ashikol Depression. It is fed by glacial and underground waters, with flooding occurring in July and August. A 200 km-long section of the riverbed, from the lower pool of the Tasutkol Reservoir, was used as a test site. The river’s elevation difference is 118 m, from 478 m to 360 m above sea level, with an average slope of 0.059%.
The Arys River (discharge 47 m3/s). Its length is 378 km, and its basin area is 14,900 km2. It is an orographically right tributary of the Syr Darya River, collecting its waters in the Talla Alatau and Karatau mountain ranges (Western Tien Shan). The river is fed by snow, with the highest flood season occurring in April. A 111 km-long section of the riverbed, upstream from its confluence with the Syr Darya River, was chosen as the test site. The riverbed has a 23 m elevation difference, ranging from 194 m to 217 m above sea level, and an average slope of 0.02%.
The Talas River (discharge of 26 m3/s). Its length is 661 km, and its basin area is 52,700 km2. The river collects water from the Talas Alatau and the Kyrgyz Alatau ridge (Northern Tien Shan). After emerging from the mountains, it flows through the Muyunkum sands, where it is lost. It is fed by glaciers and snow, with the maximum flood in July–August. A 177 km-long section of the riverbed, from the lower pool of the Kirov Reservoir downstream, was selected as the test section. The elevation difference in the test section was 76 m, from 455 m to 379 m above sea level, with an average riverbed slope of 0.043%.
The Bugun River (discharge of 4.5 m3/s). Its length is 164 km, and its basin area is 4700 km2. The river collects its waters in the Karatau Range (Western Tien Shan). It is fed by snow and groundwater, with peak flooding in March and April. A 68 km-long section of the riverbed was chosen as the test site, from the tailwater of the Bugun Reservoir downwards, with an elevation difference of 34 m, from 241 m to 207 m above sea level. The average riverbed slope was 0.05%.
The average long-term water discharge was calculated based on all available historical data on instrumental discharge measurements. This period varied for different rivers. Large rivers (the Ural and Syr Darya rivers), where gauging stations have been in operation since 1910, had the longest periods. Monitoring of other, smaller rivers has not been as extensive. When selecting a gauging station, preference was given to those with the highest average long-term water discharges. Currently, all the rivers under consideration experience significant anthropogenic pressure in the form of irrigation of arable land. Therefore, average long-term water discharge in the lower parts of the basins drops significantly. Typically, data on average long-term water discharge as the river exits the mountainous zone of runoff formation are used. In our opinion, the instrumental period for river flow monitoring is significantly shorter than the period during which its current channel shape was formed. Furthermore, the current flow regime is generally regulated and significantly reduced by anthropogenic water use. Therefore, current rates of channel transformation have likely decreased significantly. Consequently, the available discharge estimates represent only a diagnostic of the river’s average long-term water discharge, a partial reflection of the regime that shaped the river’s current shape. Therefore, the location of the gauging stations used and the synchronization of the time of discharge data accumulation appear to be of little significance. The influence of these factors on the empirical dependence of average long-term river discharge on the average meander size is much smaller than the discharge variability of the analyzed rivers (4.5 to 760 m3/s). Discrepancies of 20–50% in the river discharge estimates used will not fundamentally change the results obtained. The application of the developed methodology is focused on a comparative analysis of the sizes of modern meanders against their historical traces, with the goal of obtaining qualitative estimates (higher/lower) of average long-term water discharge in different eras. Quantitative estimates of river discharge in past eras are less reliable, since their reliable validation is not possible.
Optical satellite images record spectrally contrasting features of the underlying surface. In the sharply continental, dry, and hot climate of Kazakhstan, the most contrasting features in river valleys are vegetation patches. The density of such vegetation is entirely determined by soil moisture conditions and has no direct or unambiguous relationship with the morphological details of the riverbed and adjacent areas. This complicates the use of optical and near-infrared satellite data for morphological analysis of riverbed configurations.
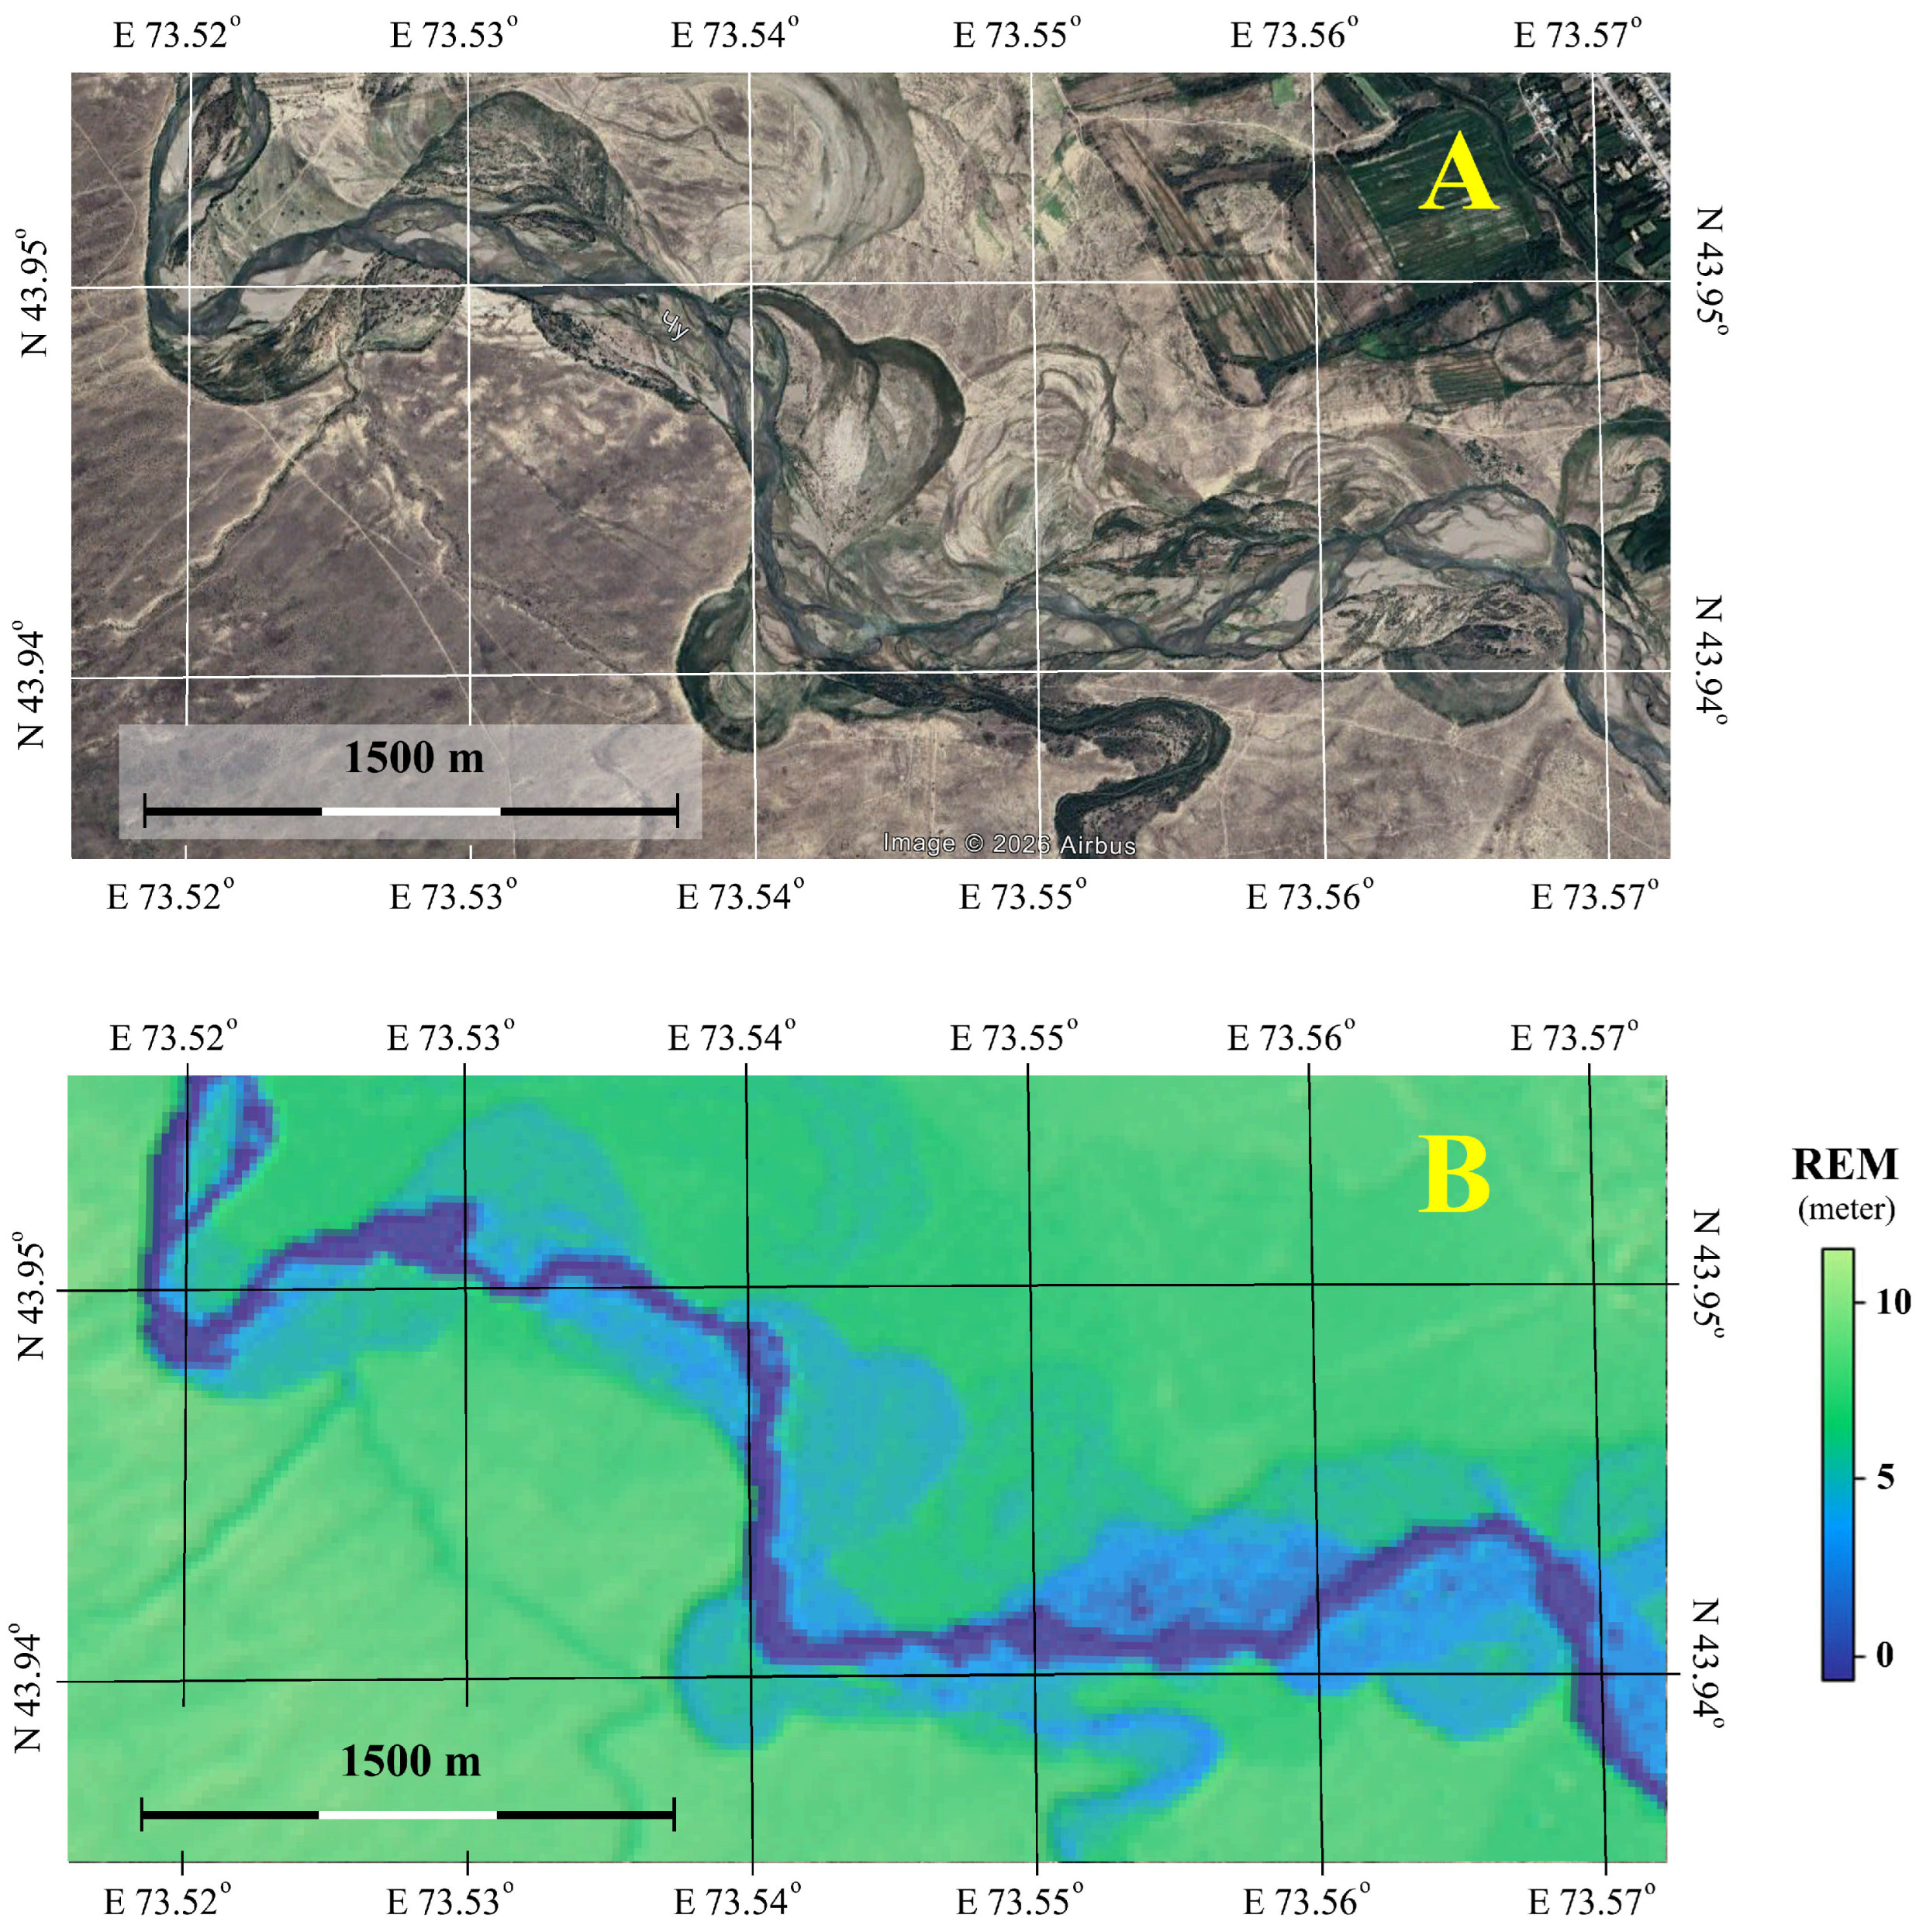
A more informative digital elevation model (DEM), particularly one that takes into account the general slope of the terrain, is the Relative Elevation Model (REM) [15] (Figure 3).
Figure 3.
A fragment of the Chu River valley. (A)—a submeter image in the format of a pseudocolor RGB composite in a natural palette, dated 29 August 2024, from the Google Earth service; (B)—a REM (CGDEM) scene.
REM is a standard method for visualizing river floodplains by detrending (removing the slope) a digital elevation model (DEM) [16]. After removing the general trend of decreasing elevation above sea level along the river direction, only local variations in the relief relative to the river channel remain in the scene, which allows for the effective recognition and mapping of river channels by their traces in the 3D terrain (Figure 3). To create REM for the test river sections, the RiverREM package (version 1.1.0) from the OPENTOPOGRAPHY library (https://github.com/OpenTopography/RiverREM (accessed on 8 June 2026)) was used. RiverREM is a Python package for automatically generating a river relative elevation model (REM). The package uses the OpenStreetMap API to retrieve river centerline geometries over the DEM extent. Interpolation of river elevations is automatically handled using a sampling scheme based on raster resolution and river sinuosity to create striking high-resolution visualizations out of the box and without the need for additional manual steps (https://opentopography.github.io/RiverREM/ (accessed on 12 April 2026)).
This study analyzed only currently flooded channels, excluding cliffs and paleochannels. The inscribed circle arc should run approximately along the midpoint of the meandering channel. It is desirable for the inscribed circle to always be within the channel, thus forming a circular sector with an angle of at least 135°. Clearly, the expert procedure introduces subjectivity into the assessment methodology. However, in our view, the inscription criteria and their accuracy are not particularly important. It is essential that the expert always approach all analyzed sections uniformly. Furthermore, it is assumed that the methodology is primarily intended for comparative analysis of the same river, its current state, and traces of past eras. Therefore, comparison of results generated by different experts is not planned.
The Copernicus Global Digital Elevation Model (CGDEM) with a spatial resolution of 30 m and a height resolution of 0.25 m, available on the OpenTopography data portal (https://portal.opentopography.org/datasetMetadata?otCollectionID=OT.032021.4326.1 (accessed on 15 April 2026)) [17], was used as a digital 3D terrain model (Figure 3). Rivers flowing through gently sloping plains composed of loess deposits and fluvial sediments transport large quantities of suspended particles, leading to channel deformation and the formation of meanders and oxbow lakes. Over a sufficiently long stretch of river channel, various phases of meander development are always present, from the initial deformation of a straight section to the separation of channel loops from the main channel, with the formation of oxbow lakes. The spatial size of meanders is related to the river width and, consequently, to the average long-term water discharge [3,18,19]. Thus, the channel of a freely meandering river is a set of meanders of various shapes and sizes (Figure 2), which are related to the average long-term water discharge [20].
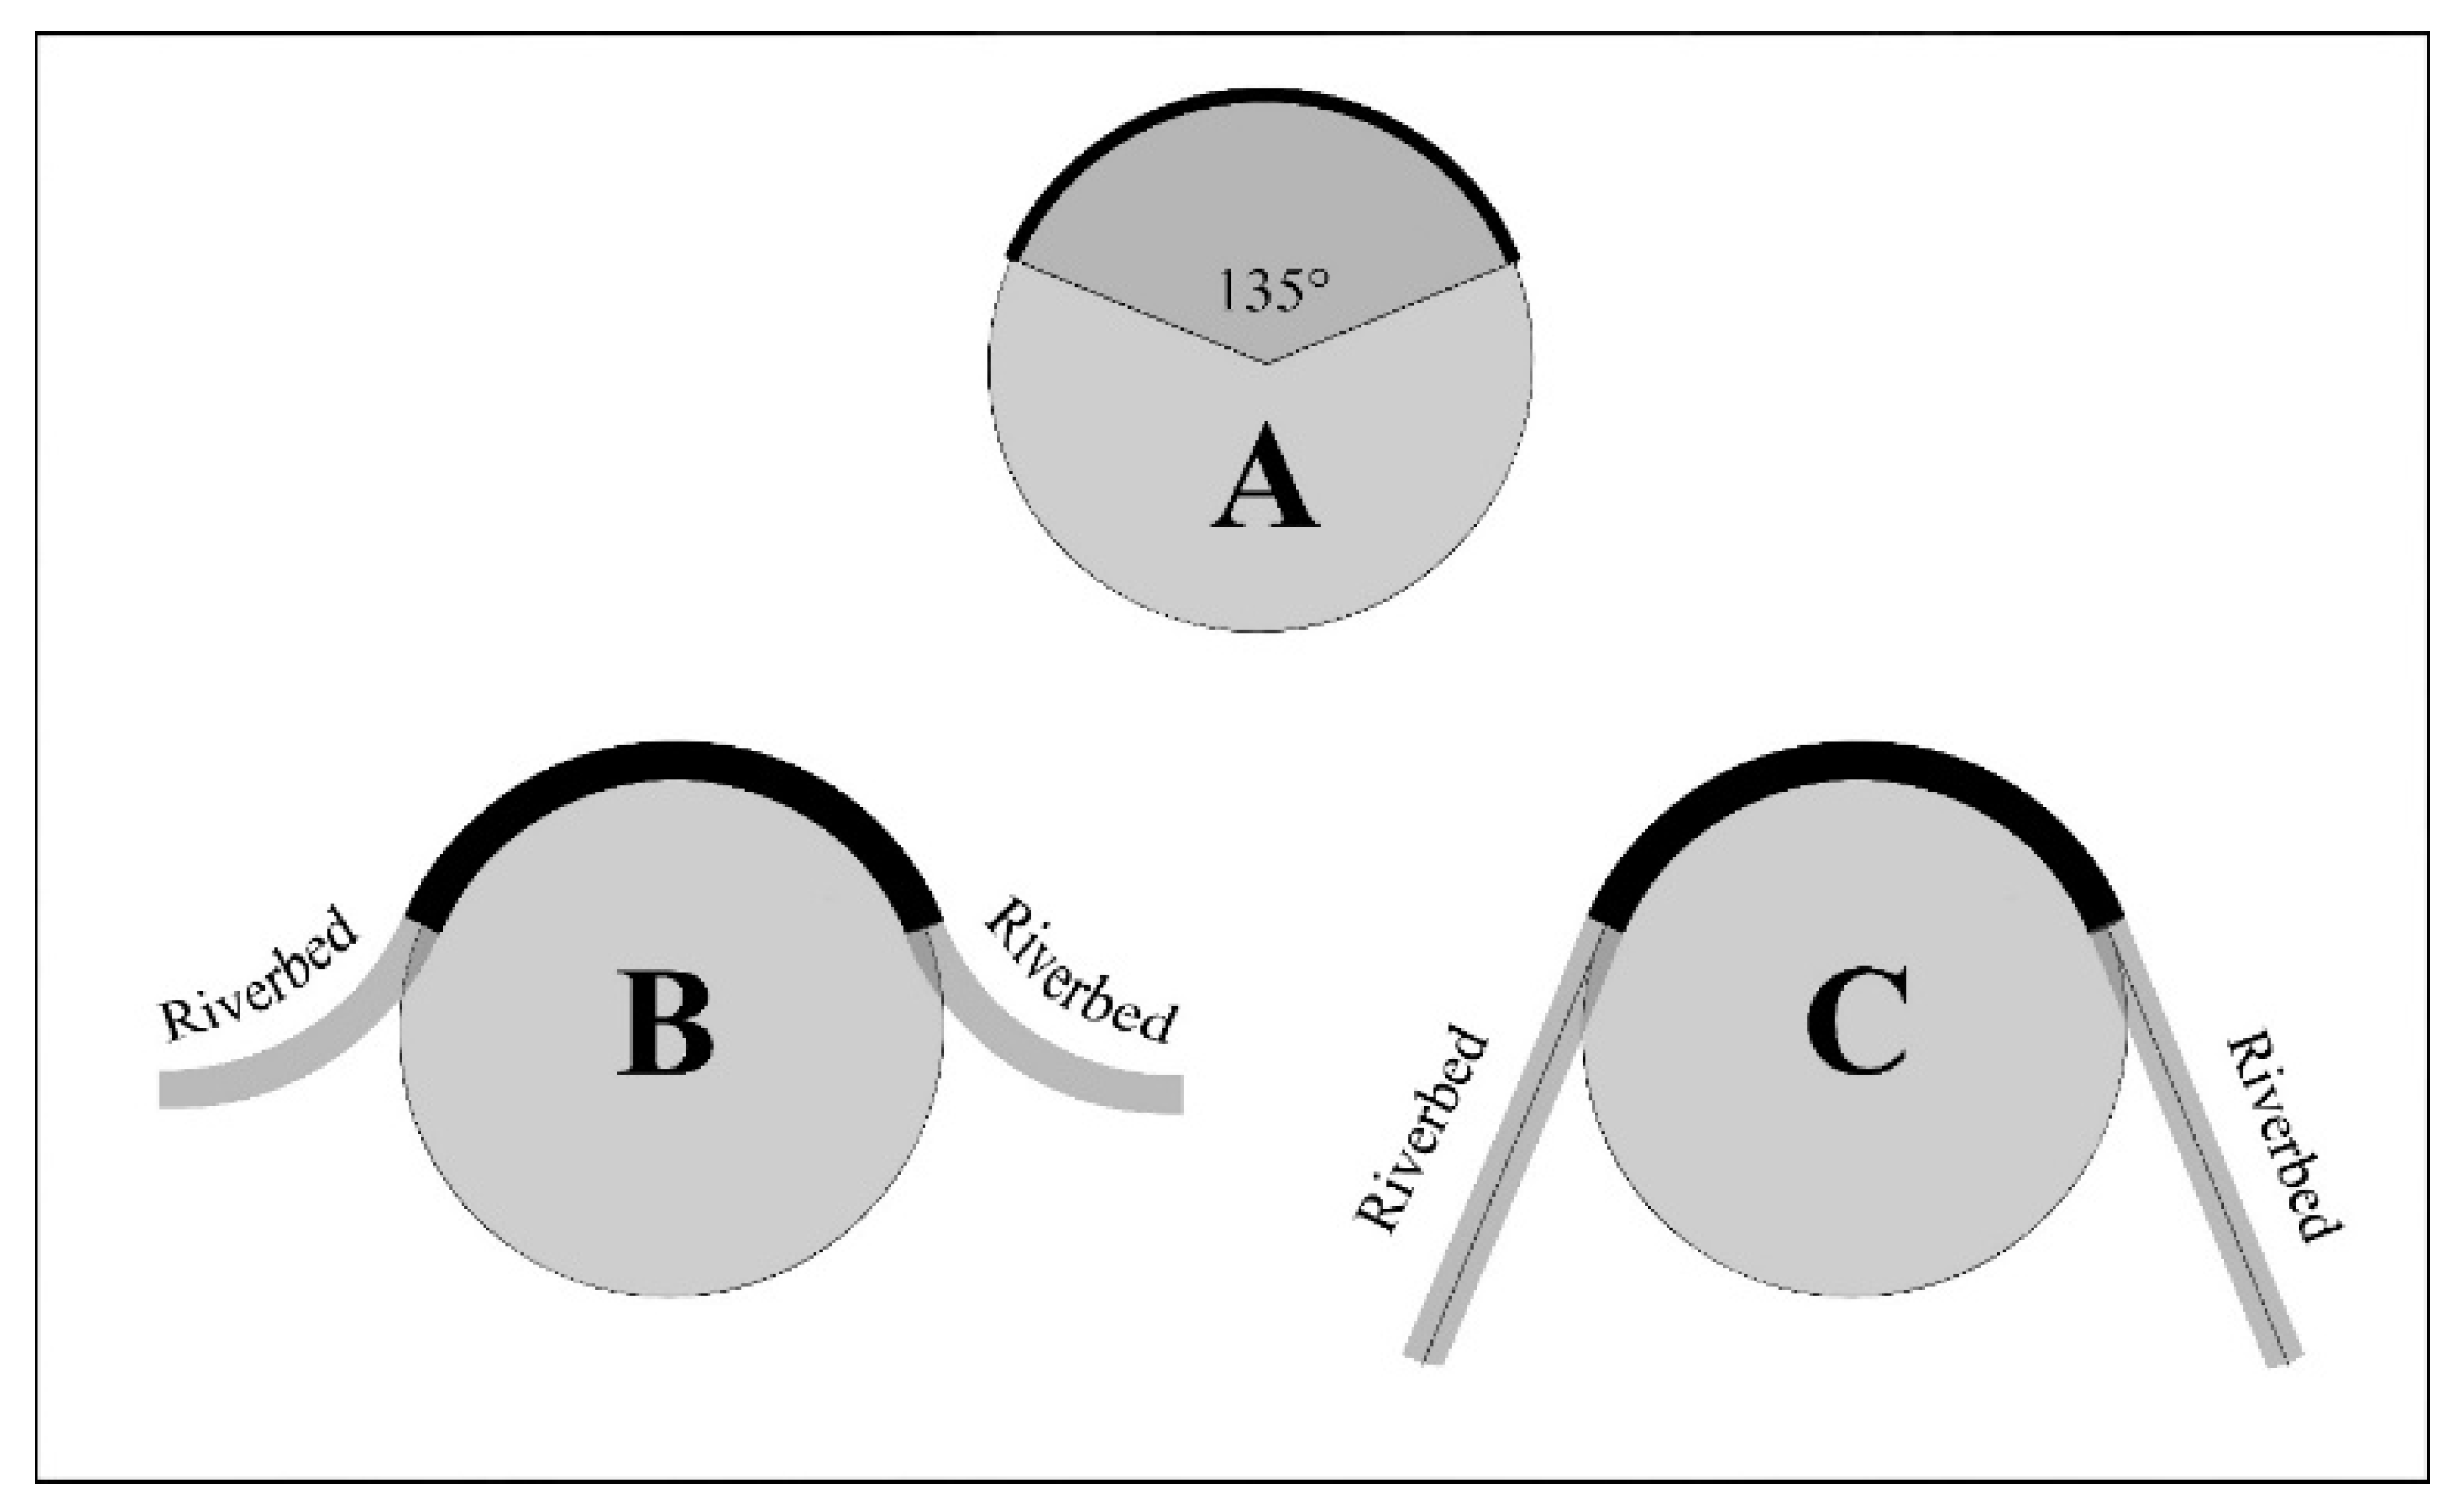
The simplest way to estimate the size of a bend is to inscribe a circle with the largest possible diameter within it. The diameter of such a circle can serve as a simple metric for estimating the bend’s size. Clearly, riverbed bend configurations do not form perfect circles. In any case, the inscribed circle can only rest on the river bend’s bed by a portion of itself, a certain sector. The size of this sector is selected expertly as a threshold value, typically “not less than.” In this study, a sector with a size of at least 135° was chosen as such a threshold (Figure 4).
Figure 4.
(A) is the minimum required sector of a circle to fit into the river’s bends. (B,C) are the most typical configurations of river channels with circles inscribed in the bends.
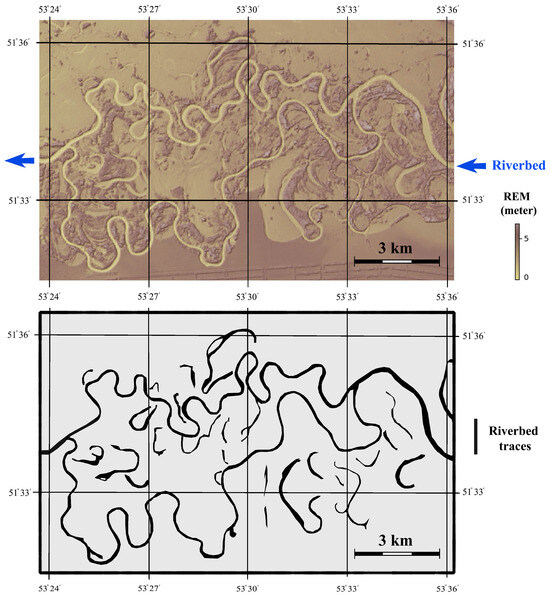
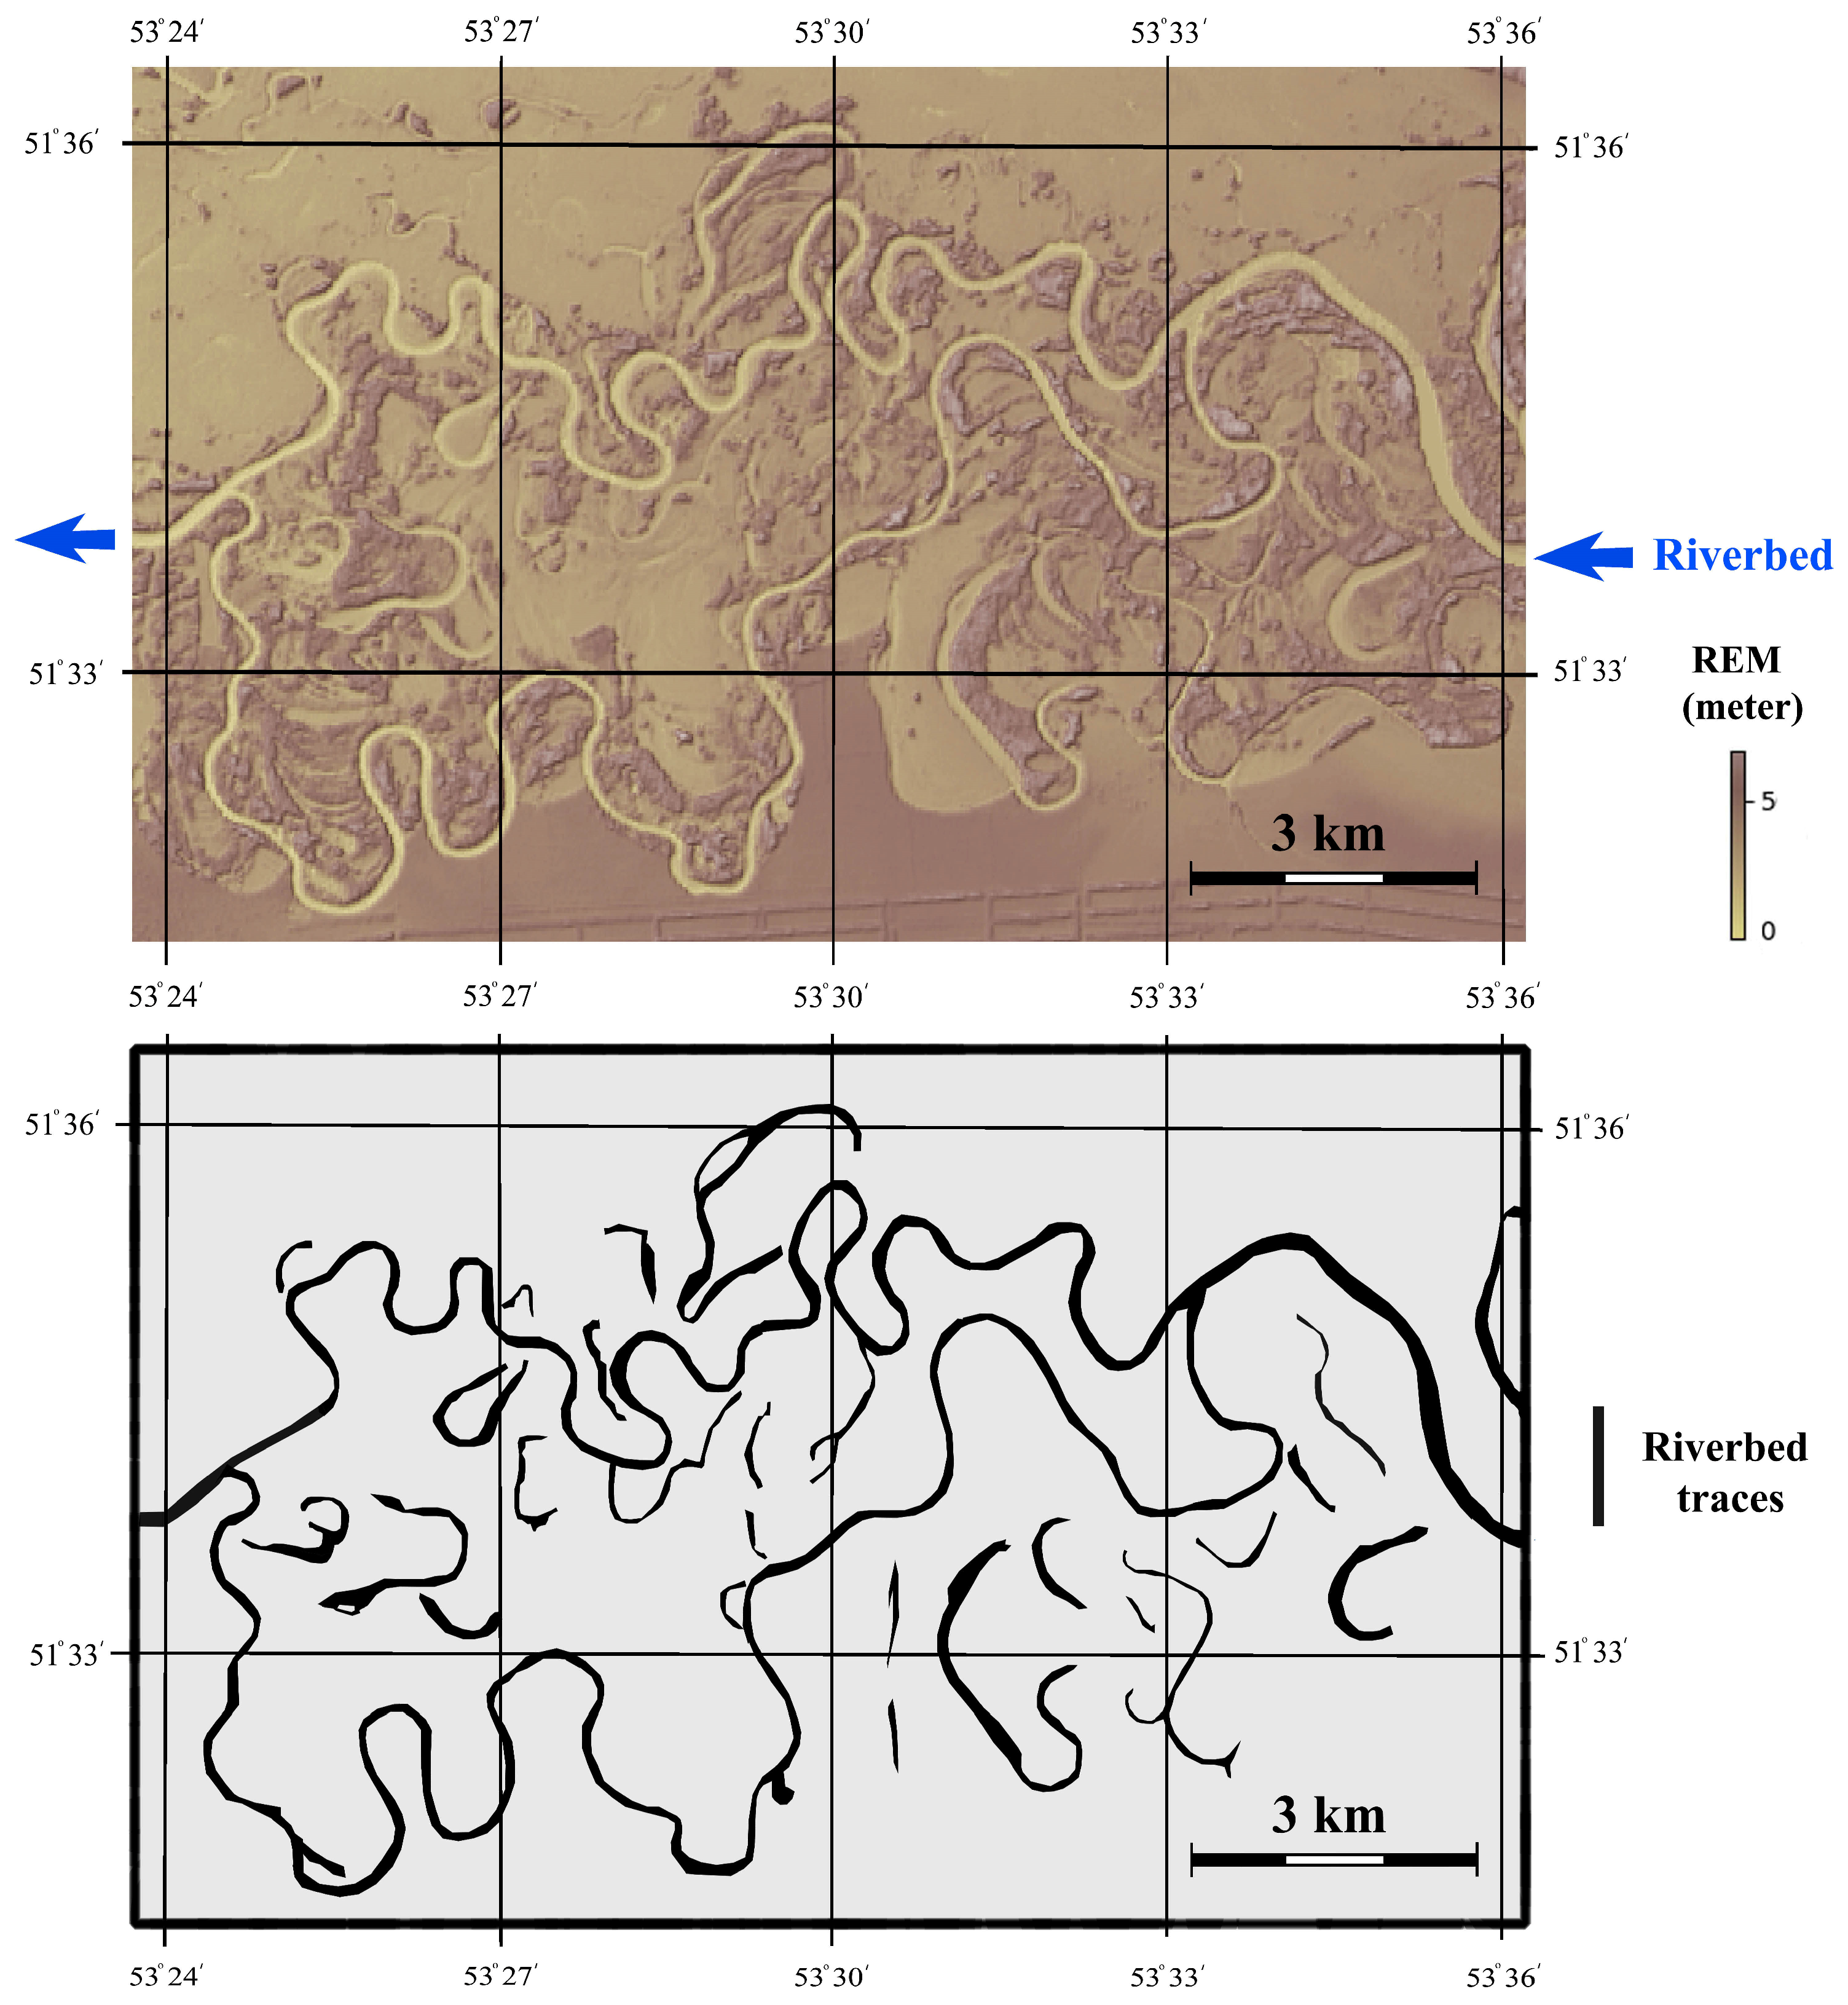
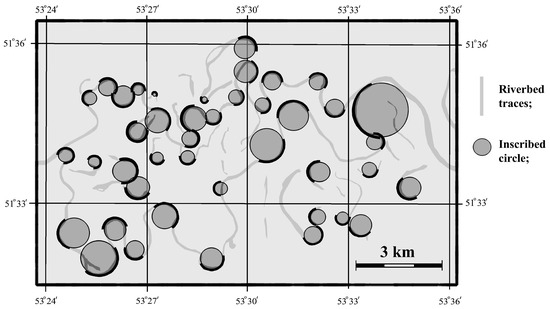
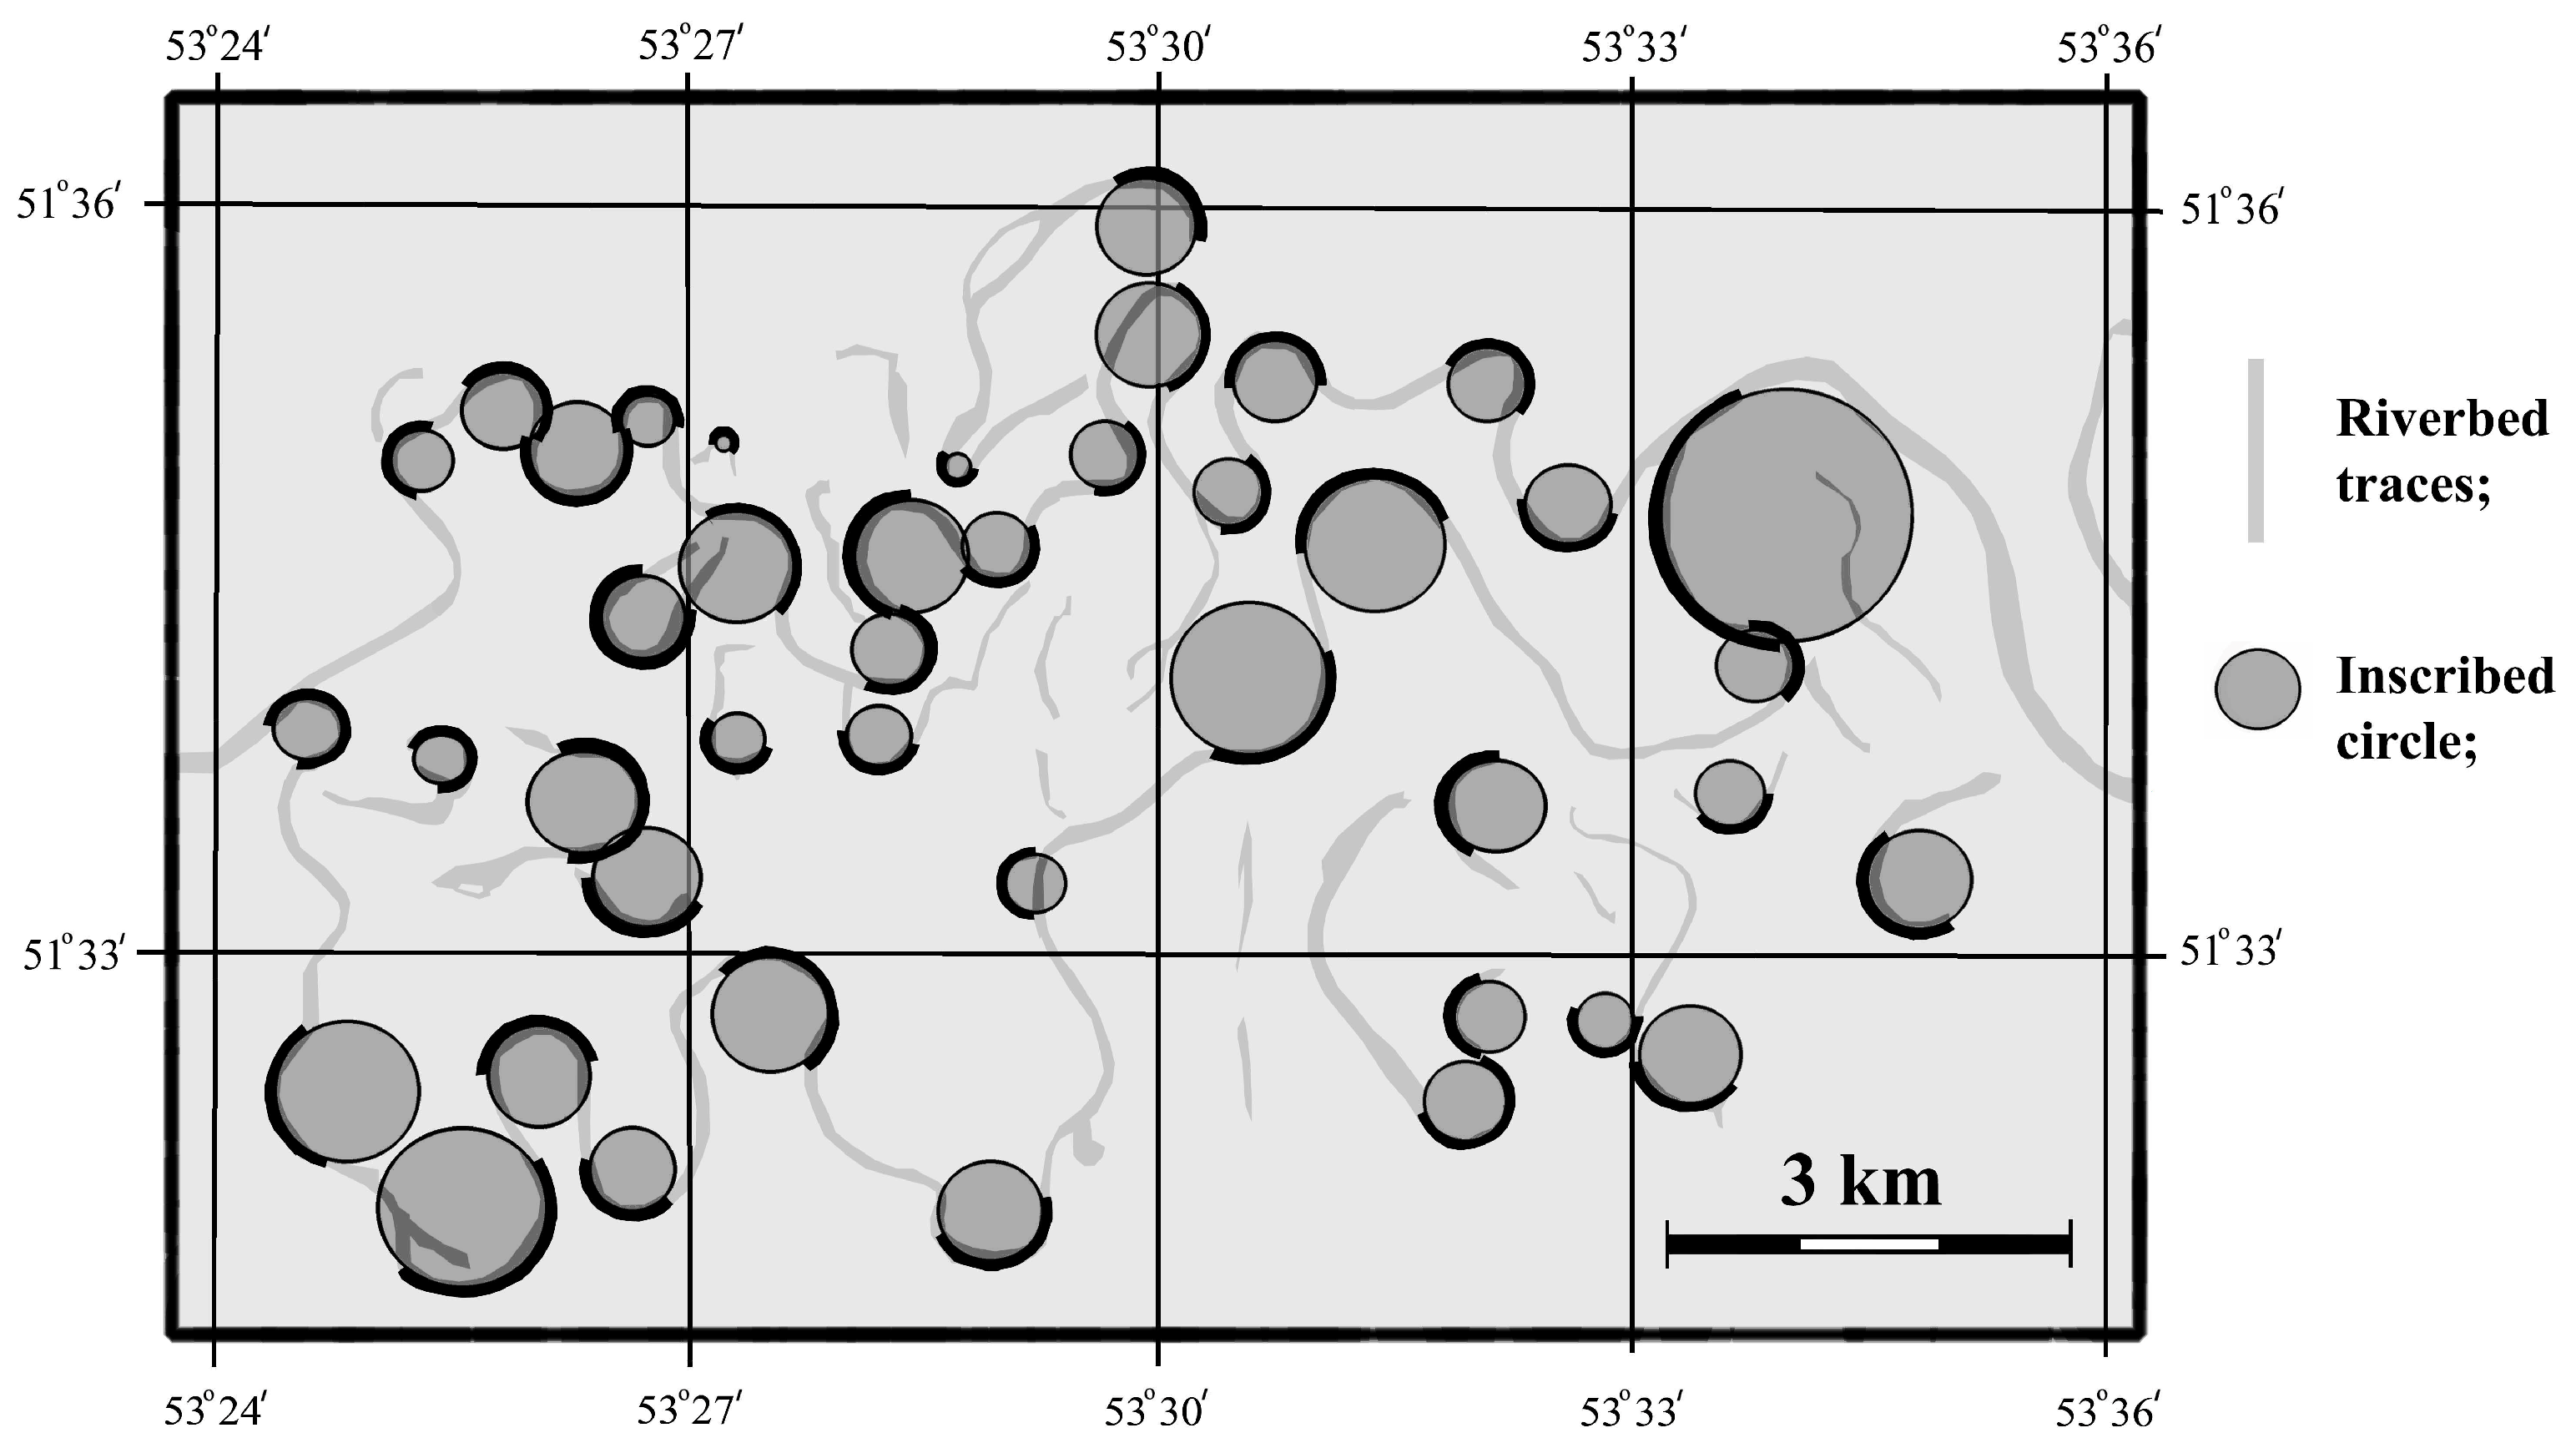
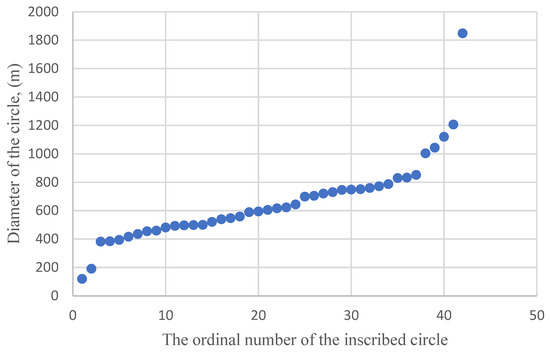
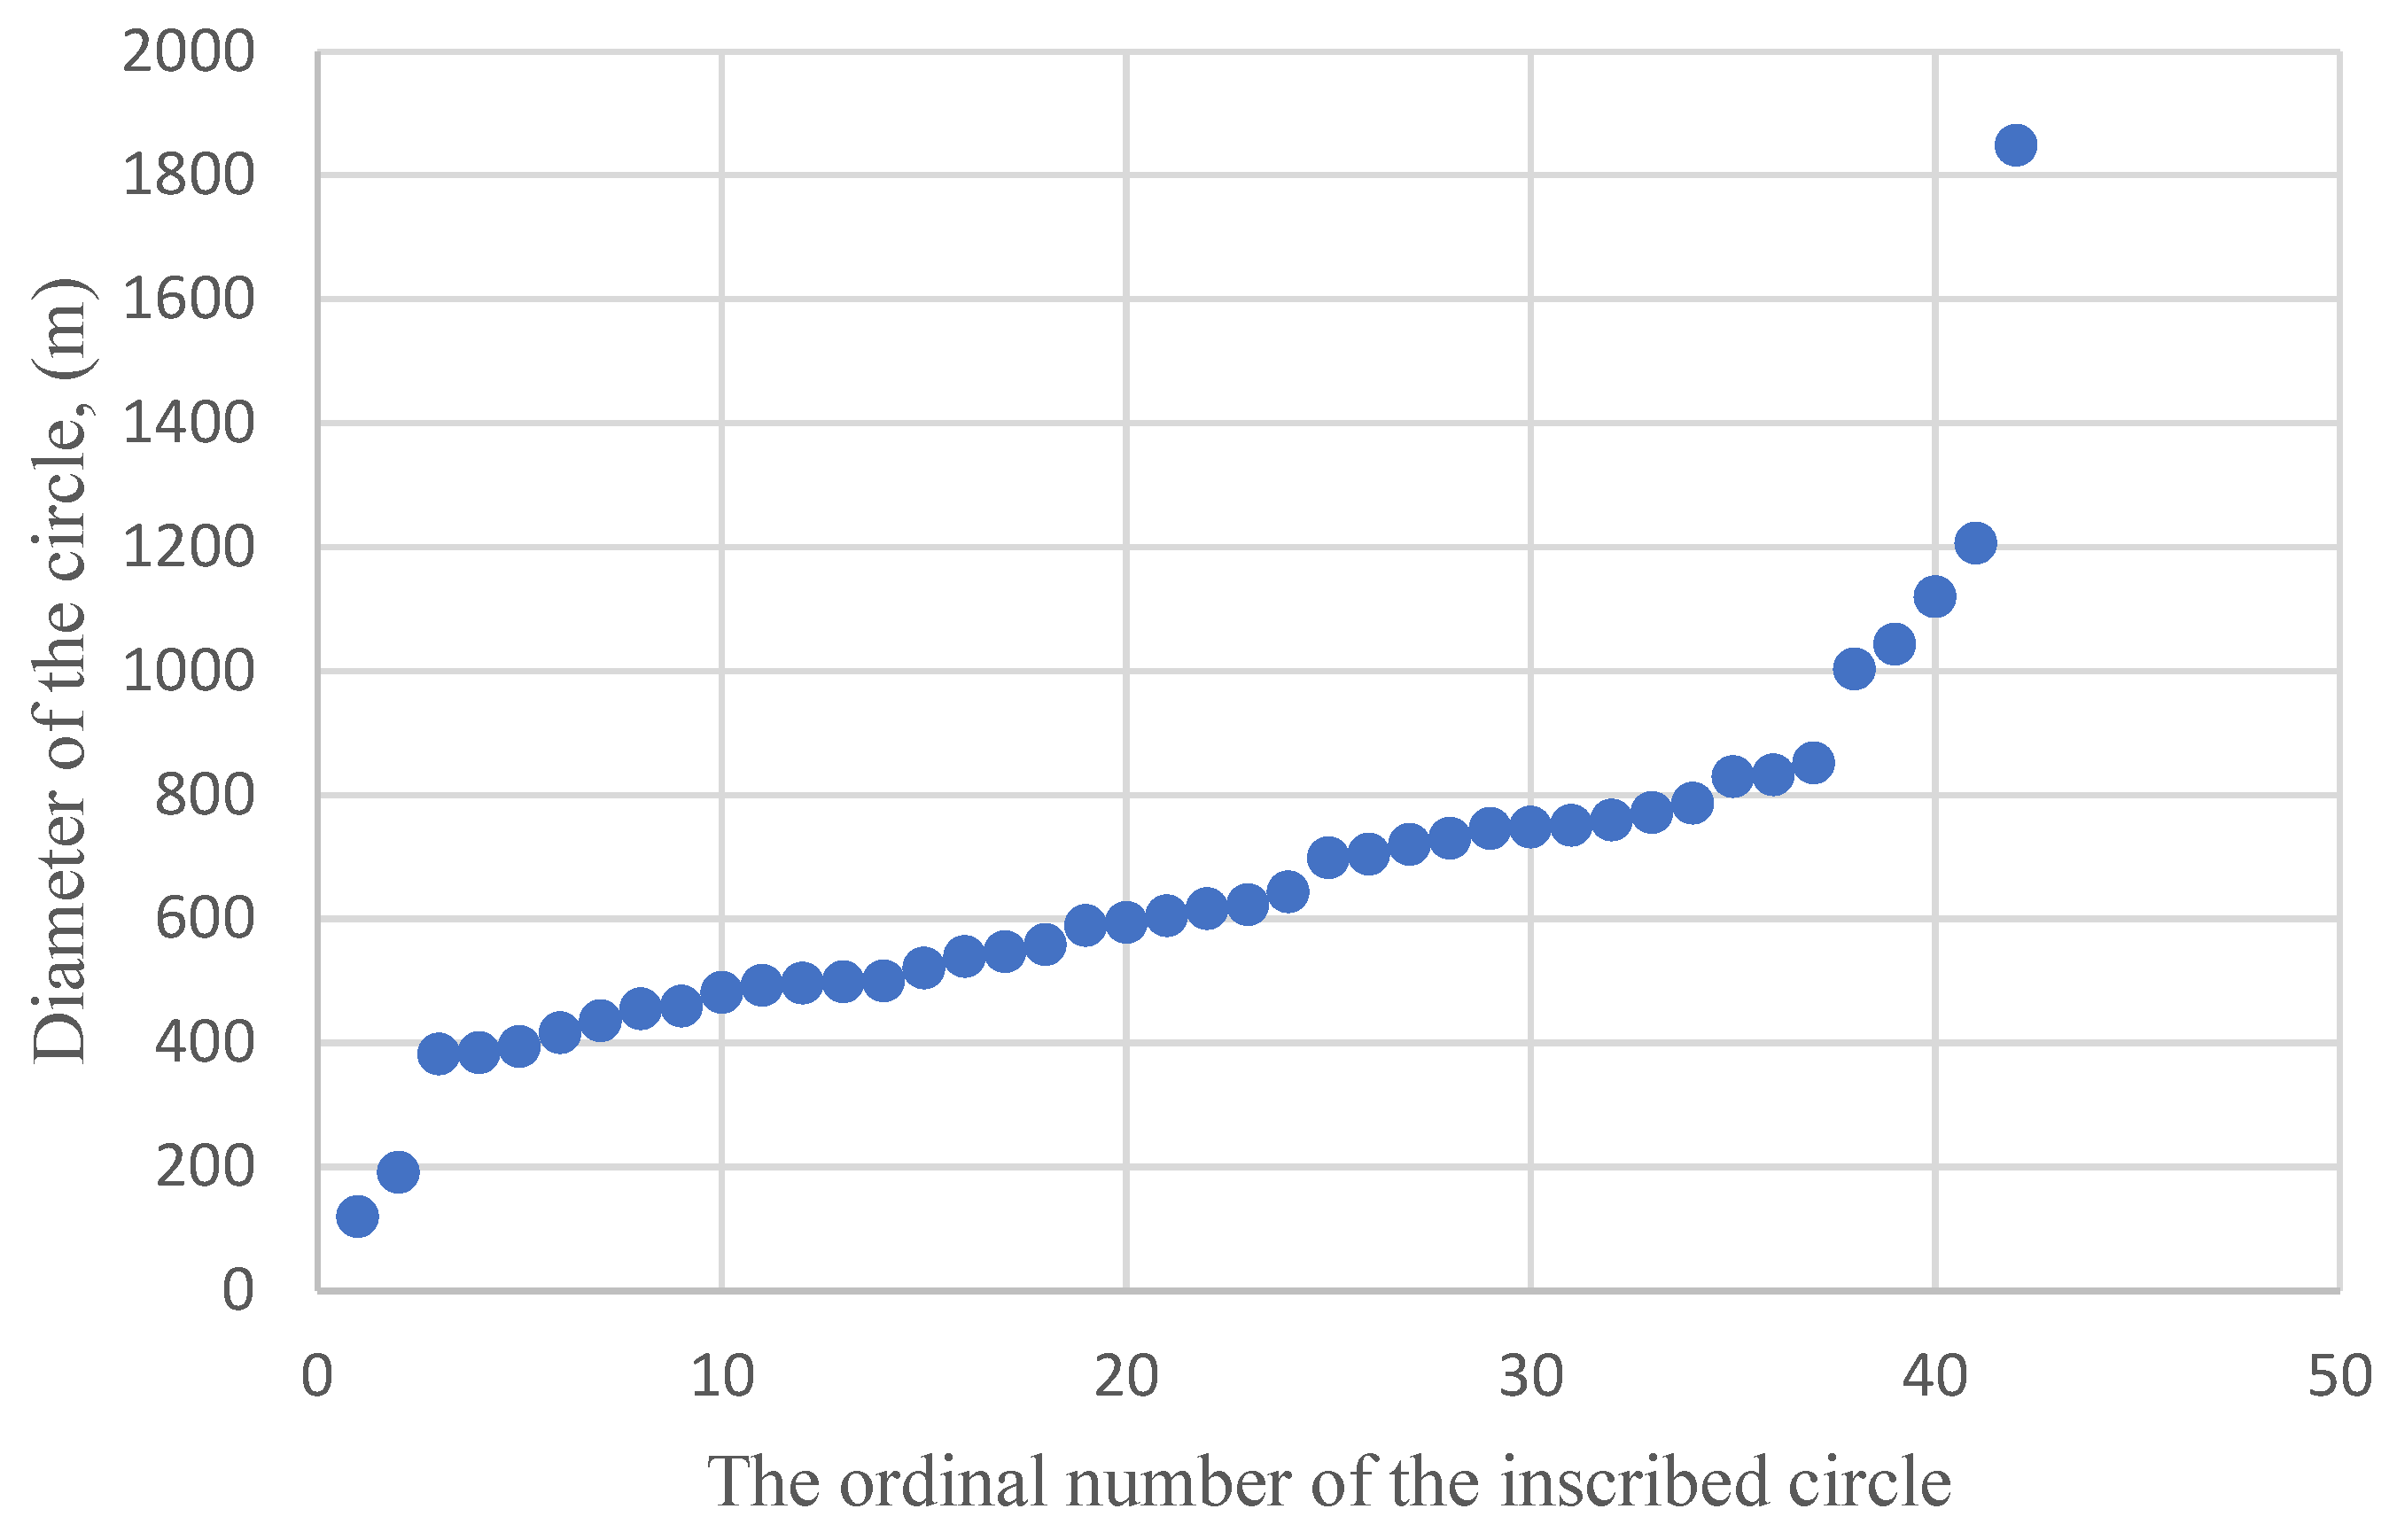
As an illustrative example of REM data processing principles, a small section of the Ural River valley was considered (Figure 5). After expert mapping of the riverbed, using a criterion of at least 135°, 42 circles with diameters ranging from 120 to 1850 m were inscribed within the channel (Figure 6). Preliminary testing has shown that smaller sector angles lead to the accumulation of circles with larger diameters; larger sector angles reduce the possible number of inscribed circles. The chosen threshold is an expert choice based on the apparent harmony of the description of the complex, curvilinear channel shape when transitioning to a numerical, statistical (mean, median, inscribed circle diameter, in a series of 150 constructed circles) estimate of the average long-term river discharge. Thus, morphological analysis of the configuration of the test section of a freely meandering riverbed yields a set of circles of varying diameters.
Figure 5.
A fragment of the Ural River valley as represented by REM and the result of expert interpretation of river channels.
Figure 6.
Circles inscribed in the traces of the riverbed of the analyzed test section of the Ural River.
After sorting this set of circles by diameter, a distribution is formed that, in our opinion, can characterize the river’s average long-term water discharge (Figure 7).
Figure 7.
Distribution of the sizes of the diameters of circles inscribed in the traces of the riverbed of the analyzed test section of the Ural River.
3. Results
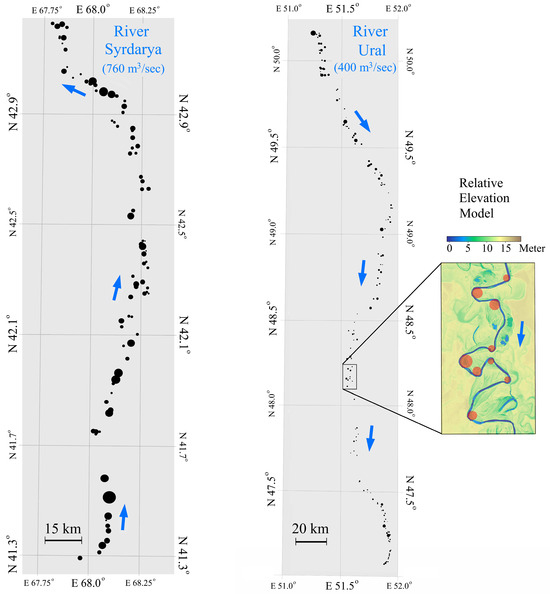
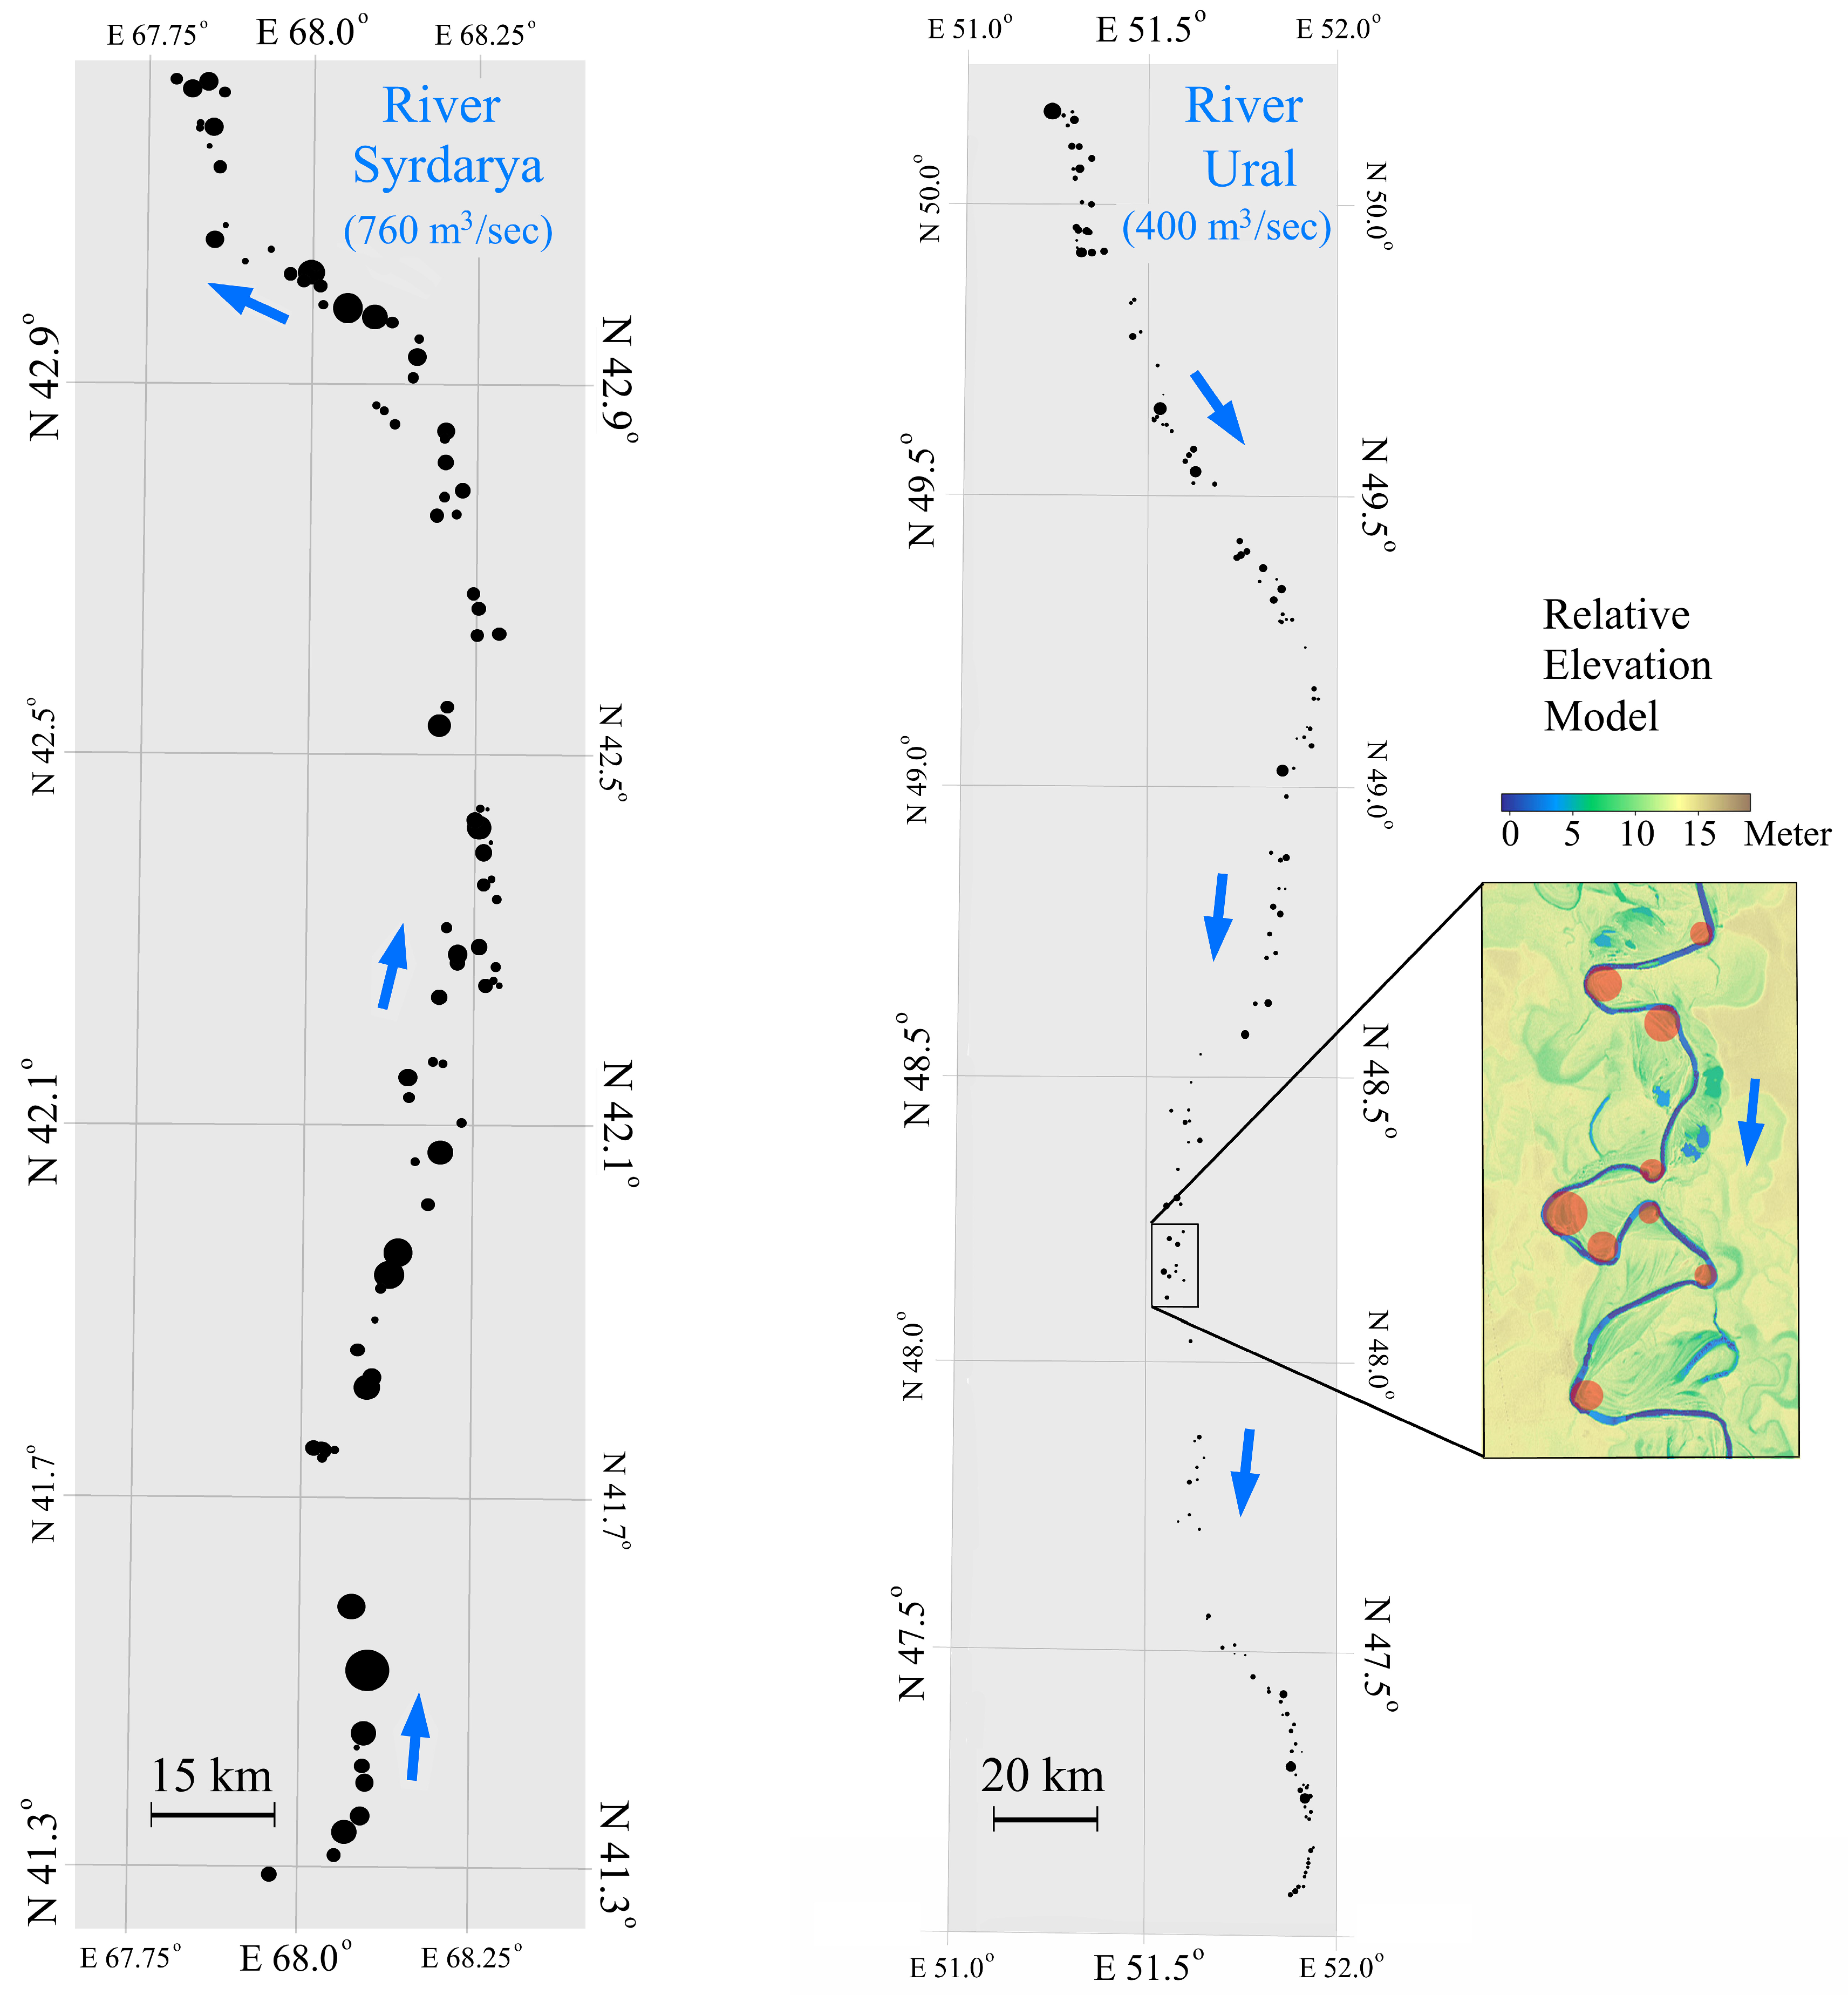
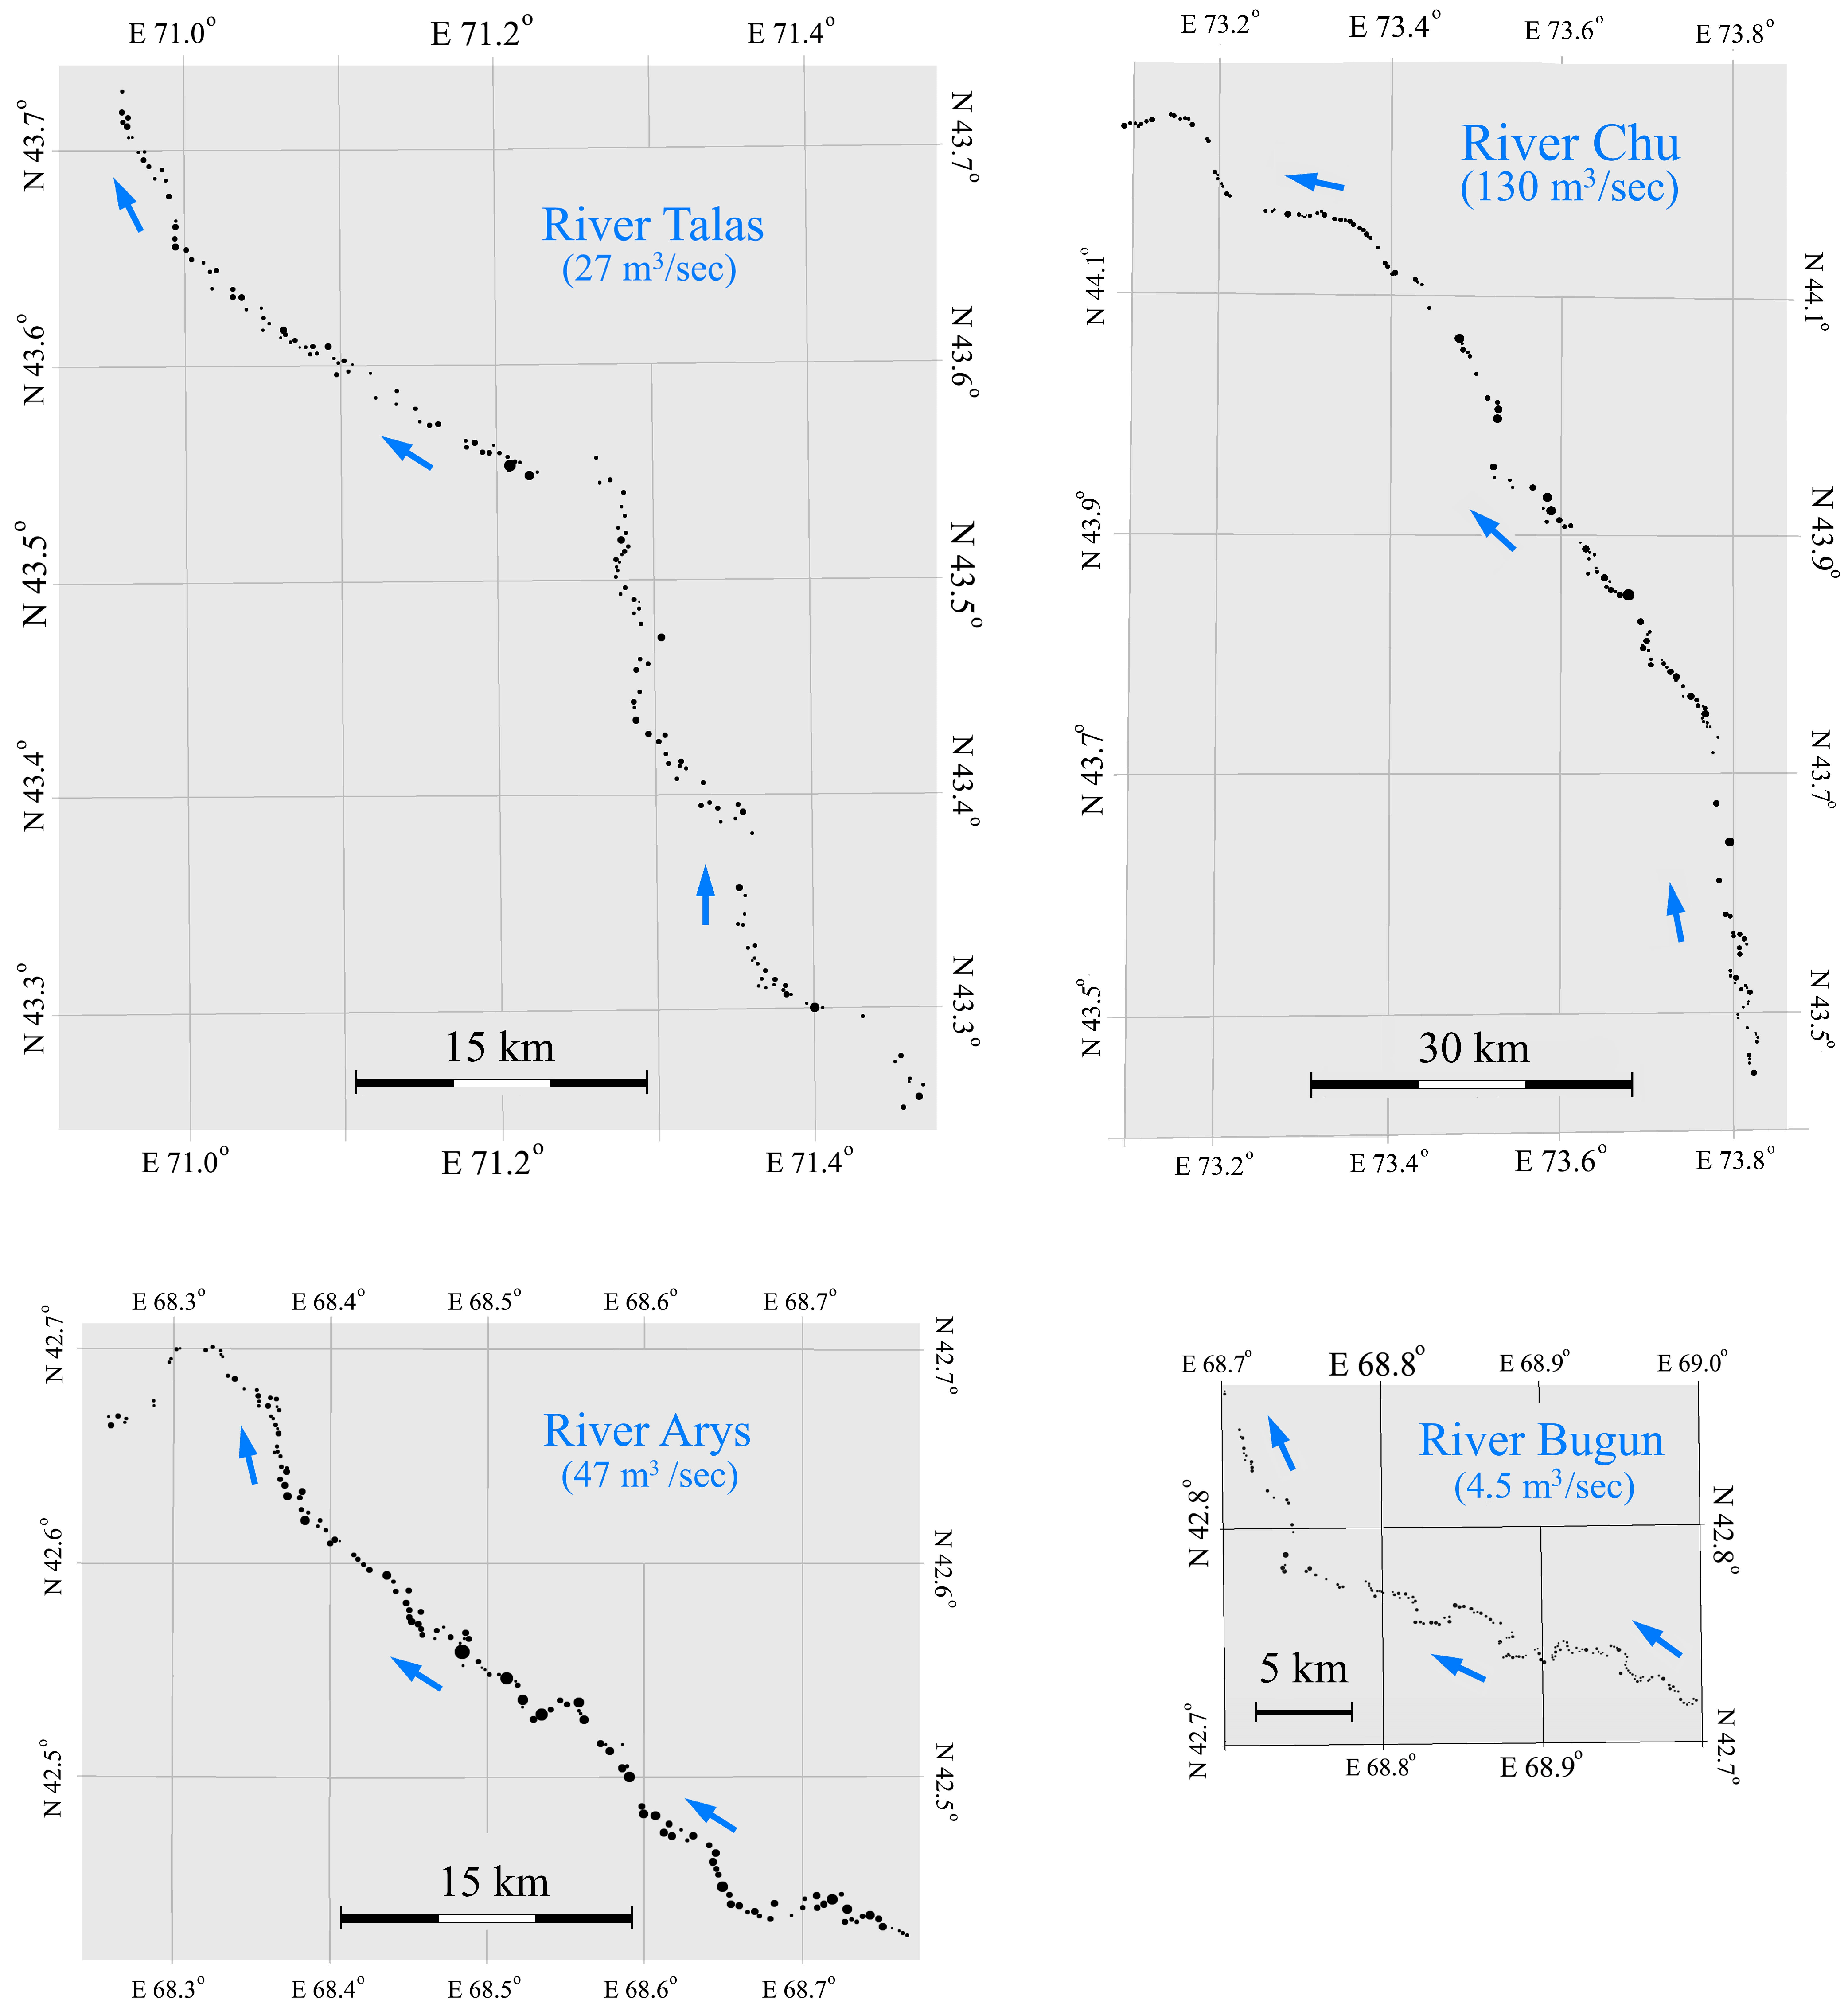
The above-described algorithm for morphological analysis of freely meandering river channel configurations yielded corresponding sets of circles along the test route sections for each of the six selected rivers in Kazakhstan (Figure 8, Figure 9 and Figure 10).
Figure 8.
Circles inscribed in the riverbeds of the test sections of the Syr Darya and Ural rivers (blue arrow indicates a flow direction).
Figure 9.
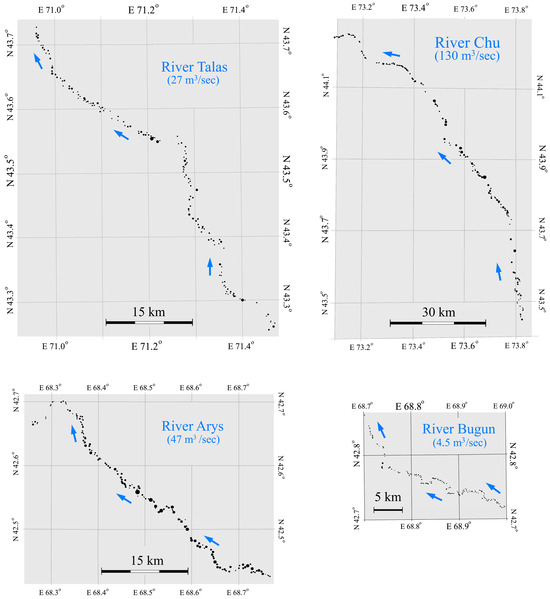
Circles inscribed in the riverbeds of the test sections of the rivers: Talas, Chu, Arys and Bugun (blue arrow indicates a flow direction).
Figure 10.
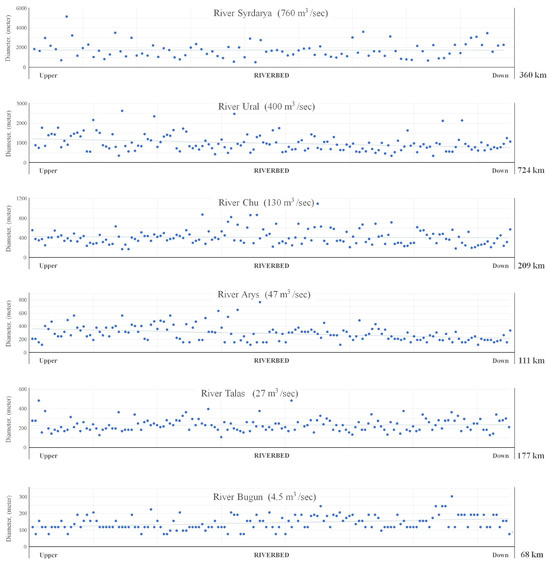
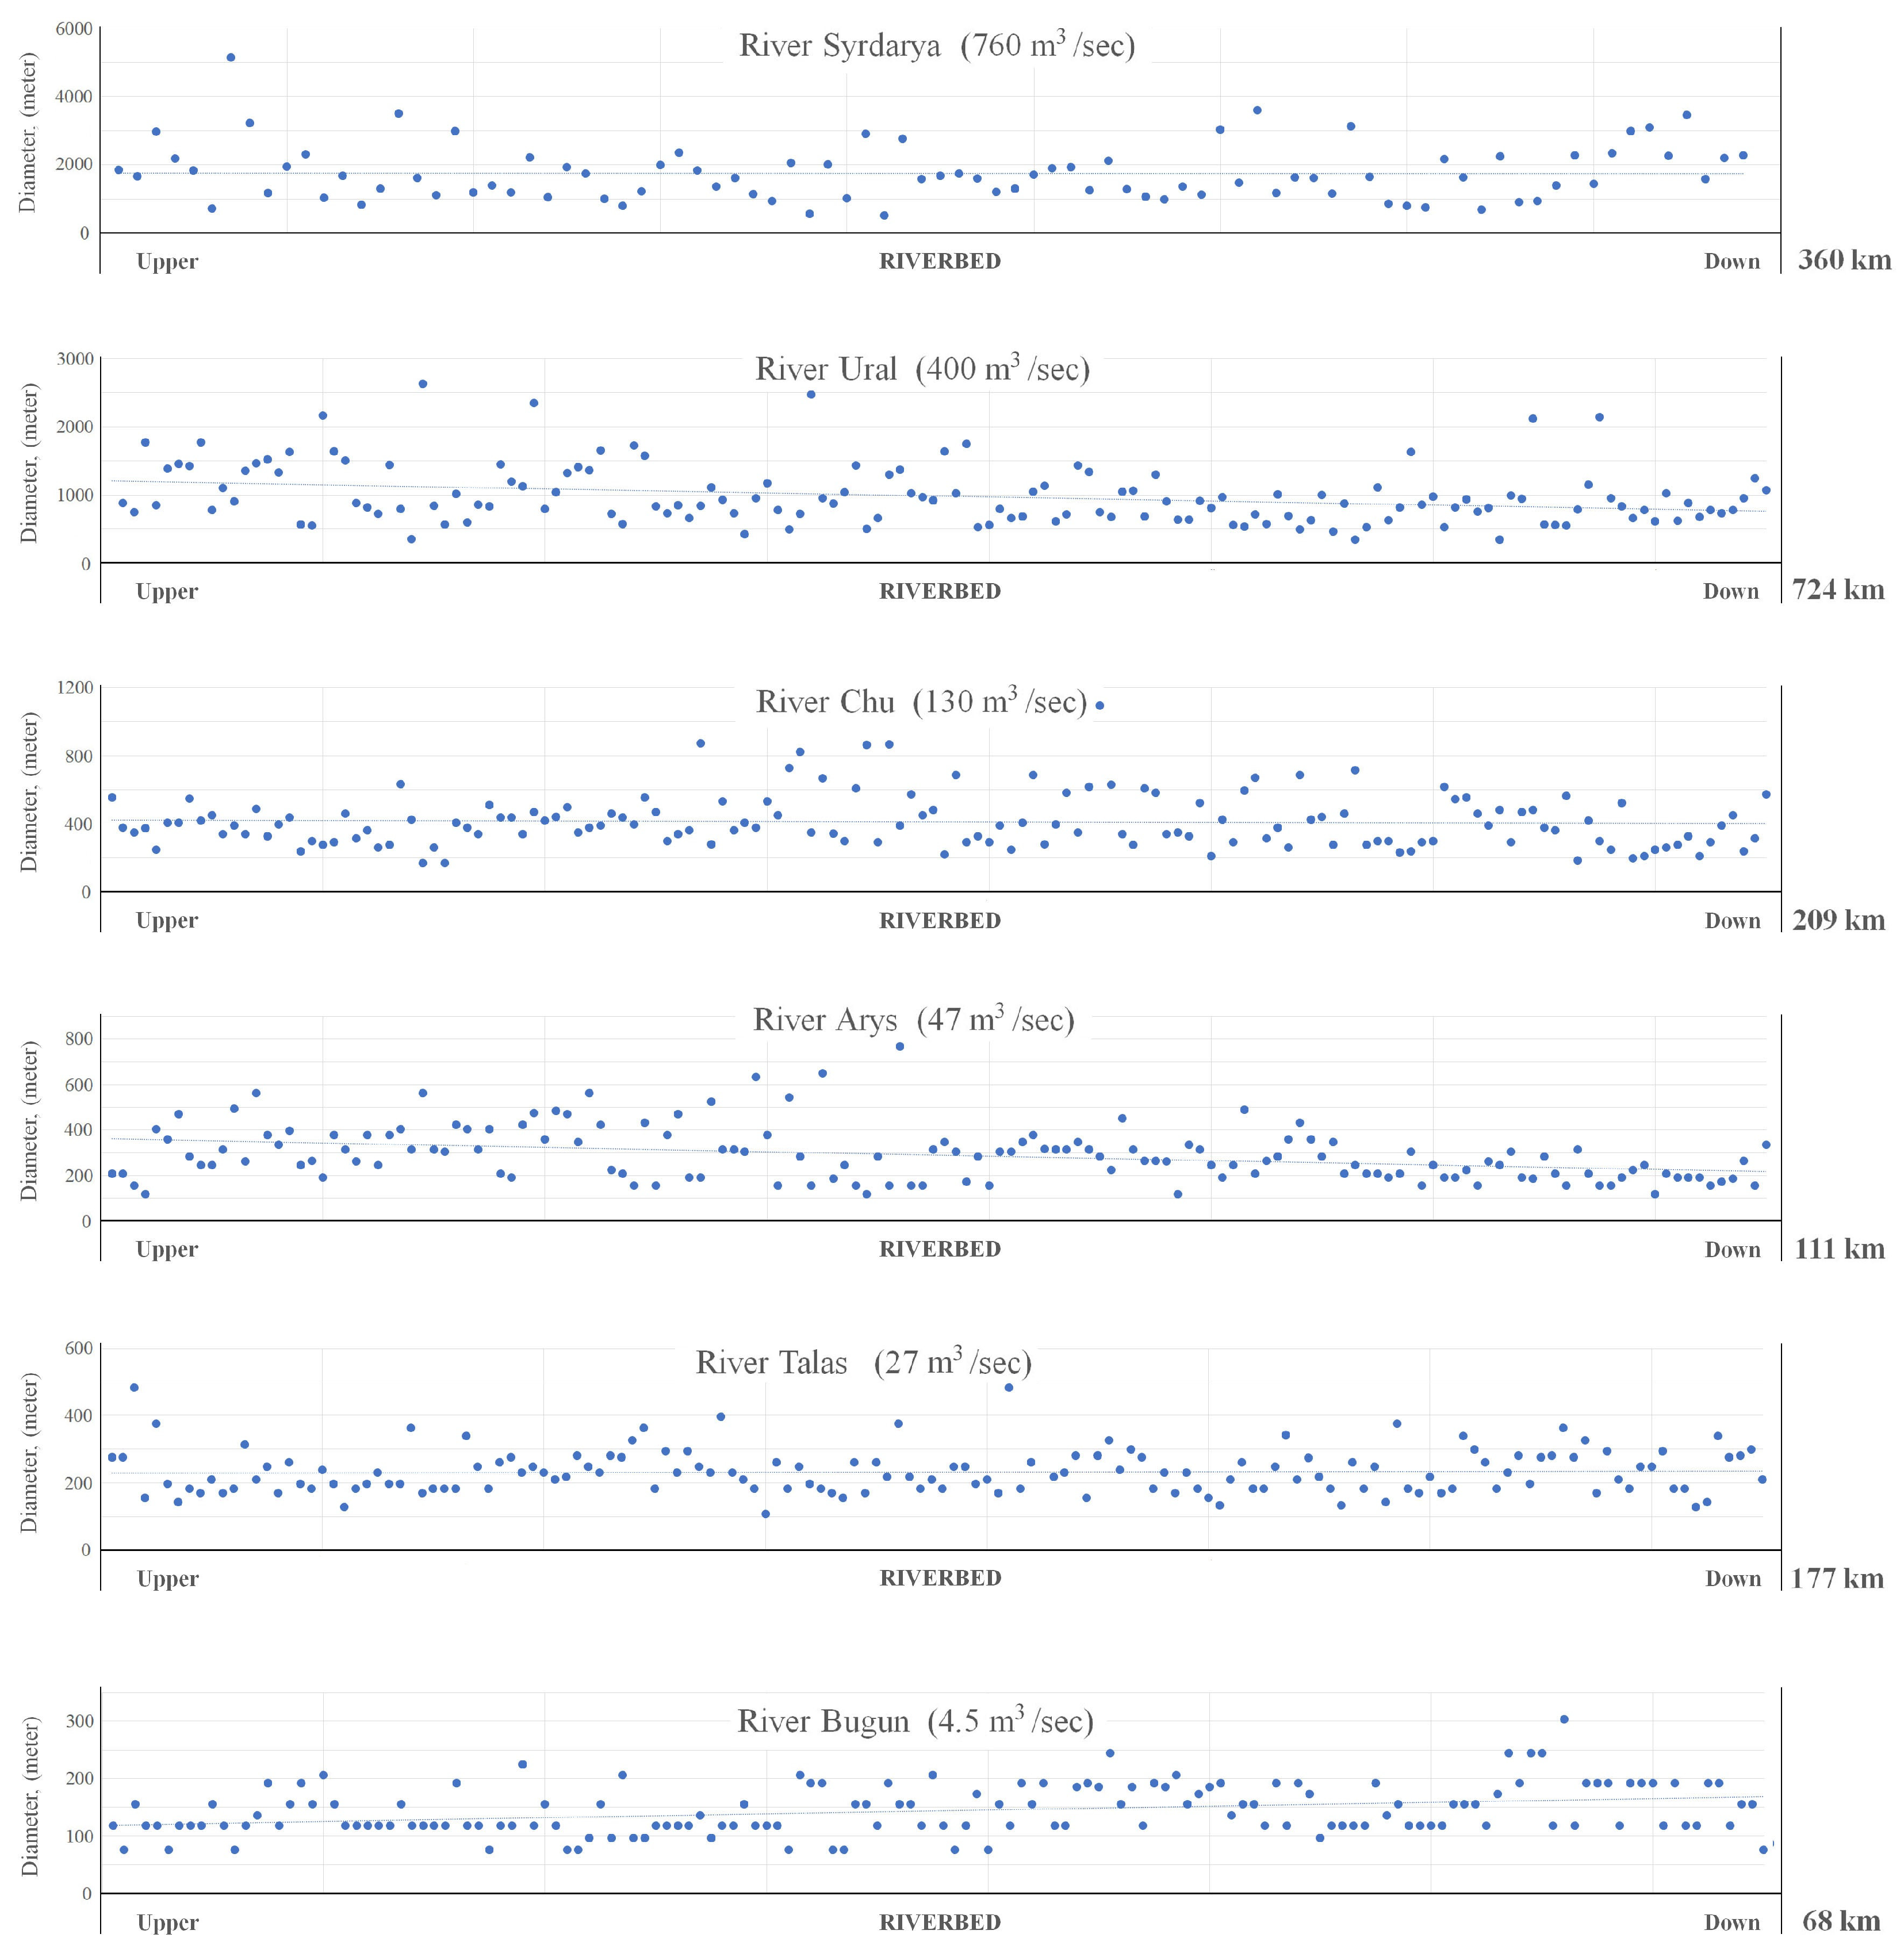
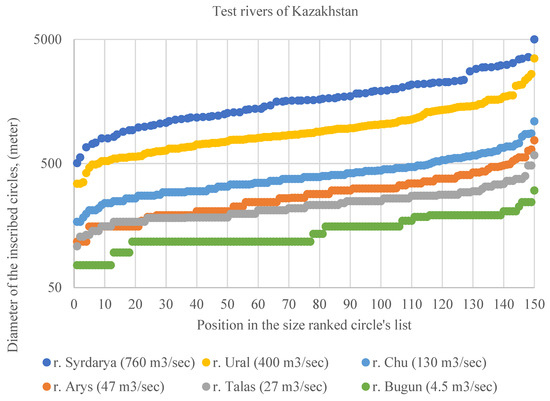
Distribution of the dimensions of the circles inscribed in river channels along the river’s route, from the upper to the lower part of the river valley. Six analyzed rivers in Kazakhstan are presented.
These sets of circles represent the flow characteristics of freely meandering rivers, with average long-term discharge ranging from 4.5 to 760 m3/s.
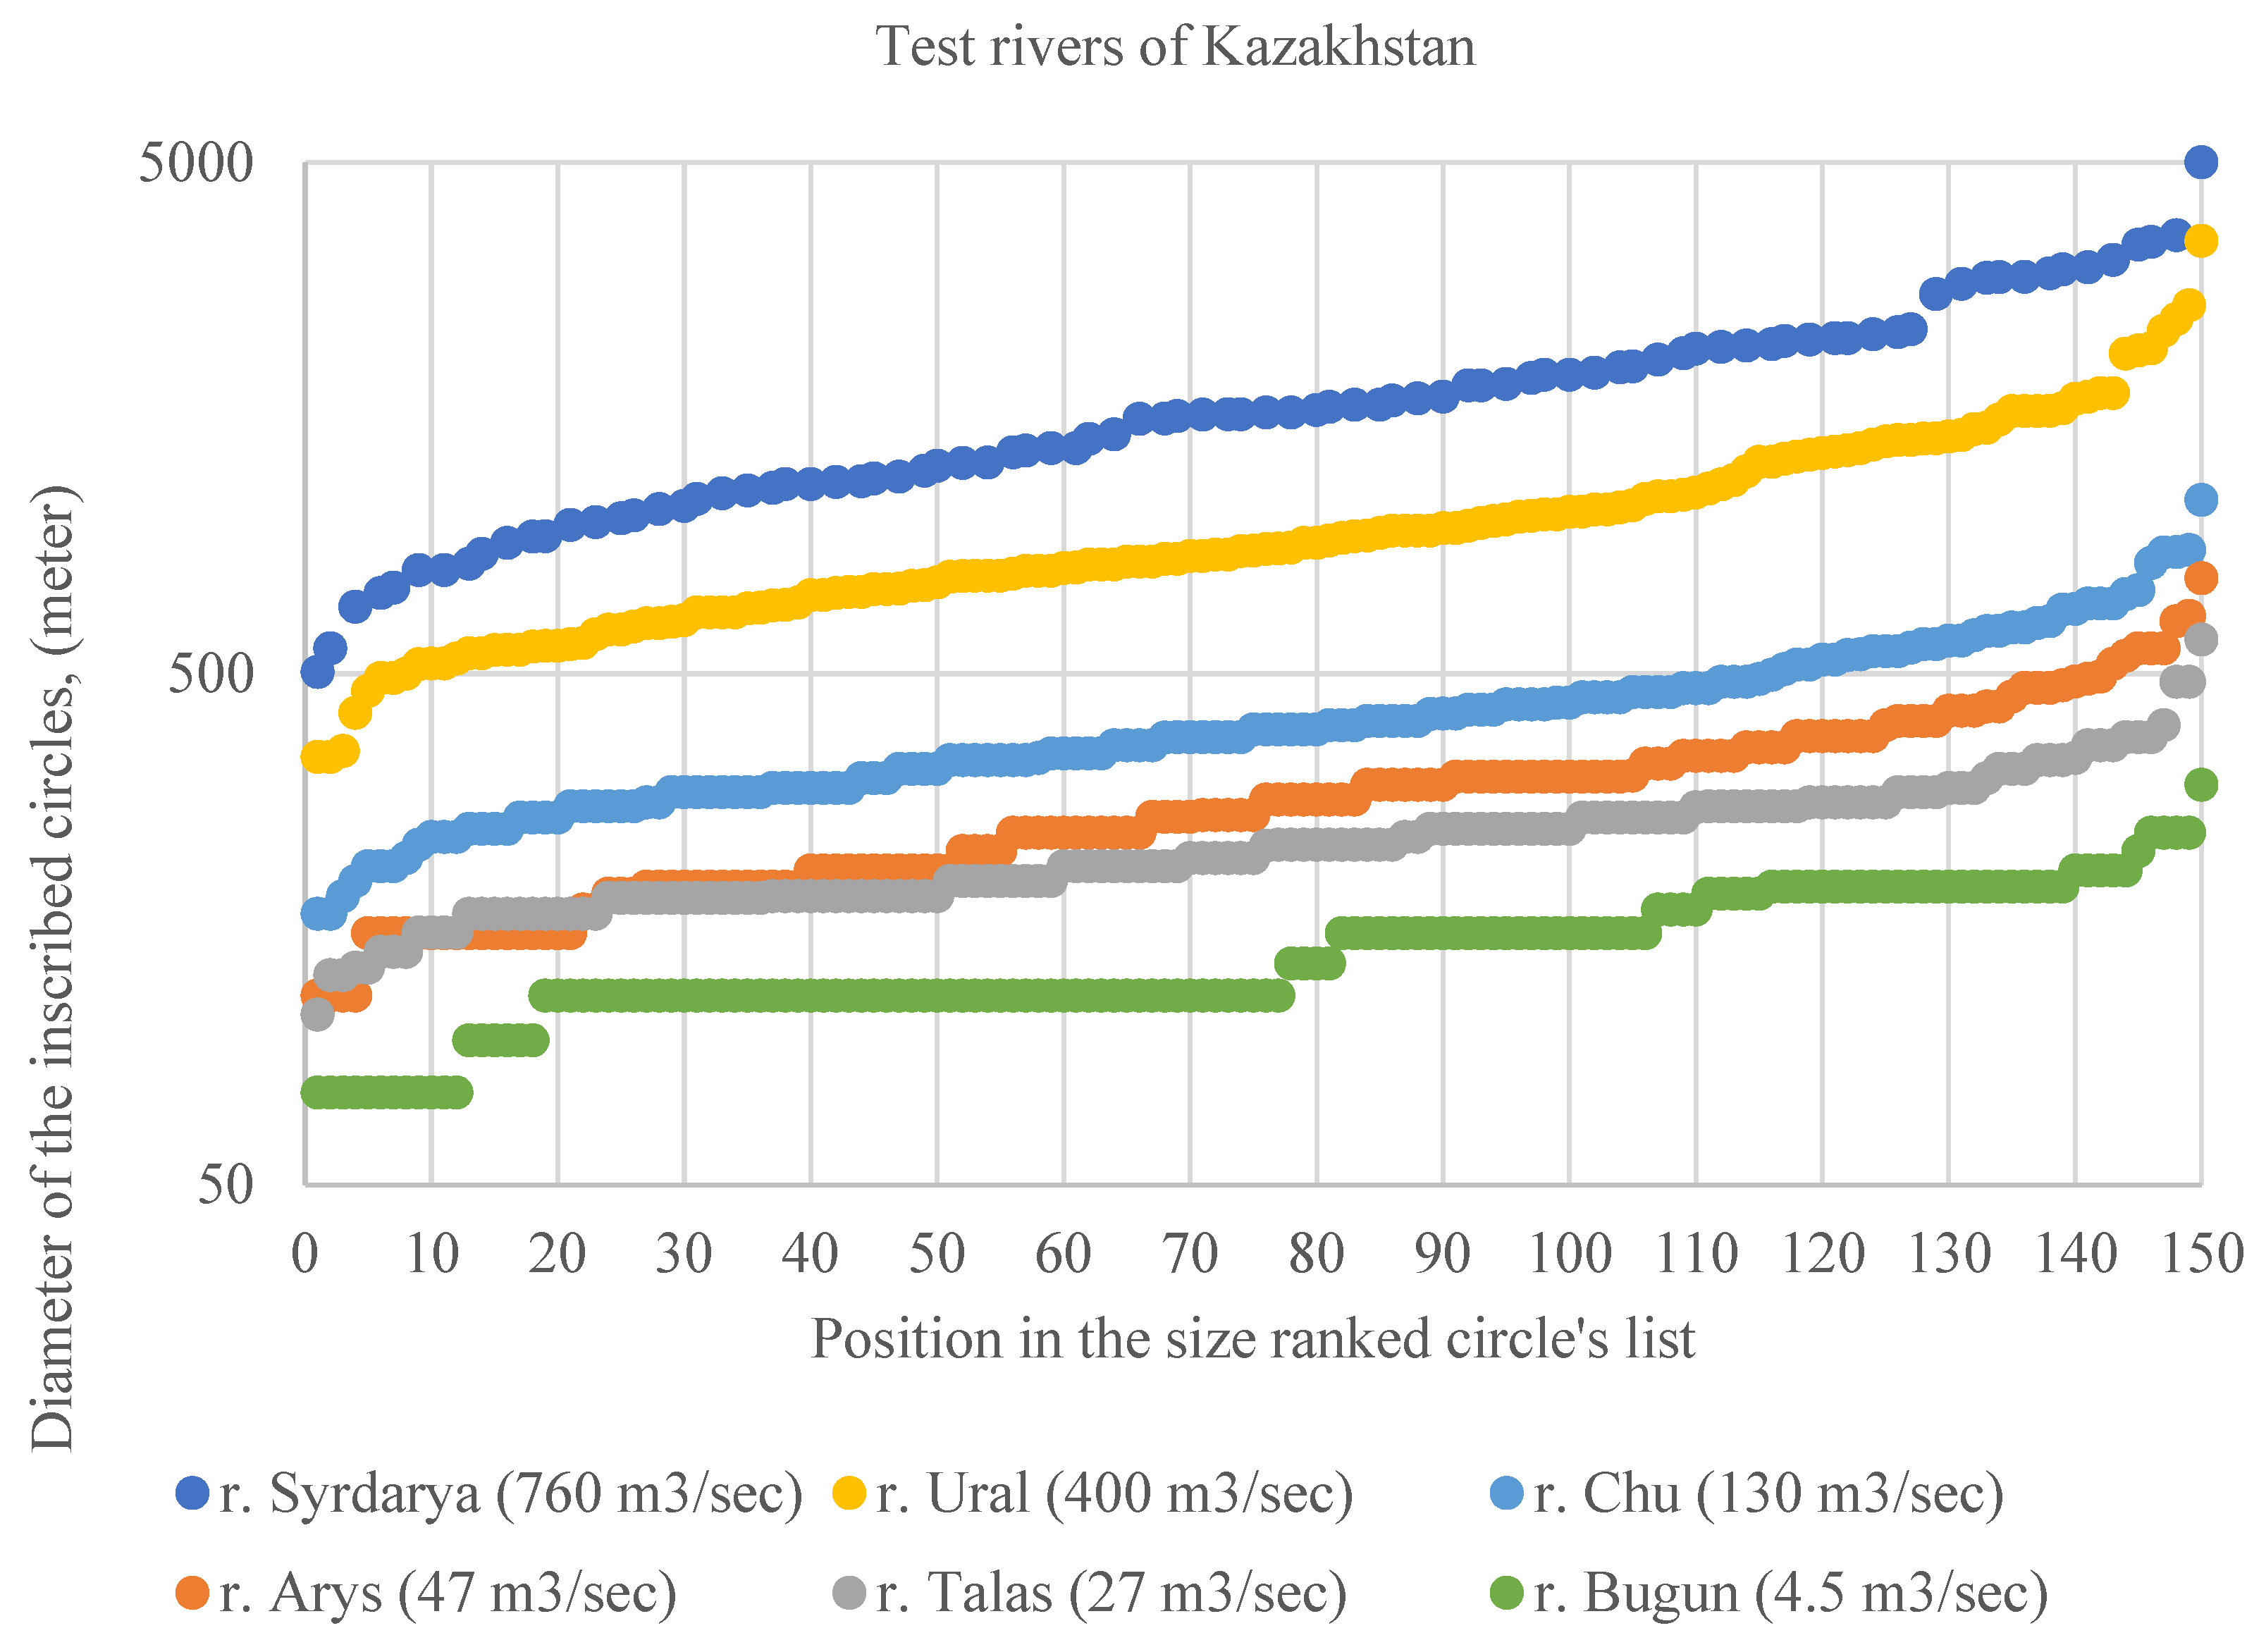
The variability of diameter sizes in each of these sets is quite large, ranging from 4 to 10 times. The larger the river, the greater the variability. For the smallest of the rivers considered, the Bugun River (4.5 m3/s), the inscribed circle diameters range from 76 to 303 m. For the largest river, the Syr Darya River (760 m3/s), these range from 503 to 5000 m3/s.
The distribution of inscribed circles by their diameters leads to an orderly representation of the relationship between the morphological characteristics of river bends and the average long-term water discharge in them (Figure 11).
Figure 11.
Distribution of circles inscribed in river channels, sorted by size. Six analyzed rivers of Kazakhstan are presented.
The number of inscribed circles and standard deviations of the time series of average sizes of inscribed circles in the meanders are presented in Table 1.
Table 1.
Number of inscribed circles and standard deviations of the time series of average sizes of inscribed circles in the meanders.
It can be noted that for the original series of reports, the standard deviation is approximately one-third of the mean value. However, if we transform the original series of values for the diameters of circles inscribed in the meanders into a series of mean values obtained by averaging several readings, the standard deviation will decrease significantly. That is, the random variability (standard deviation) of the average value of the inscribed circle diameter, when analyzing 150 meanders, can be estimated at approximately 10%. An uncertainty of 10% for individual data on the average diameter of inscribed circles, in the overall range of diameters in the analyzed dependence from 117 m to 1608 m, seems of little significance.
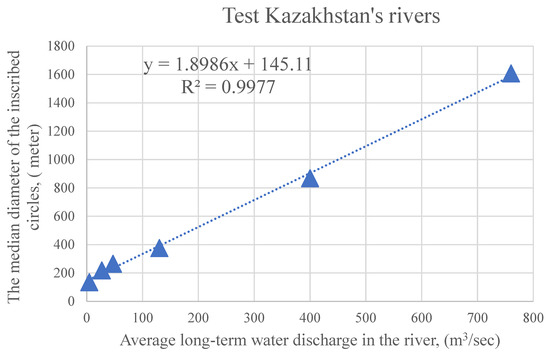
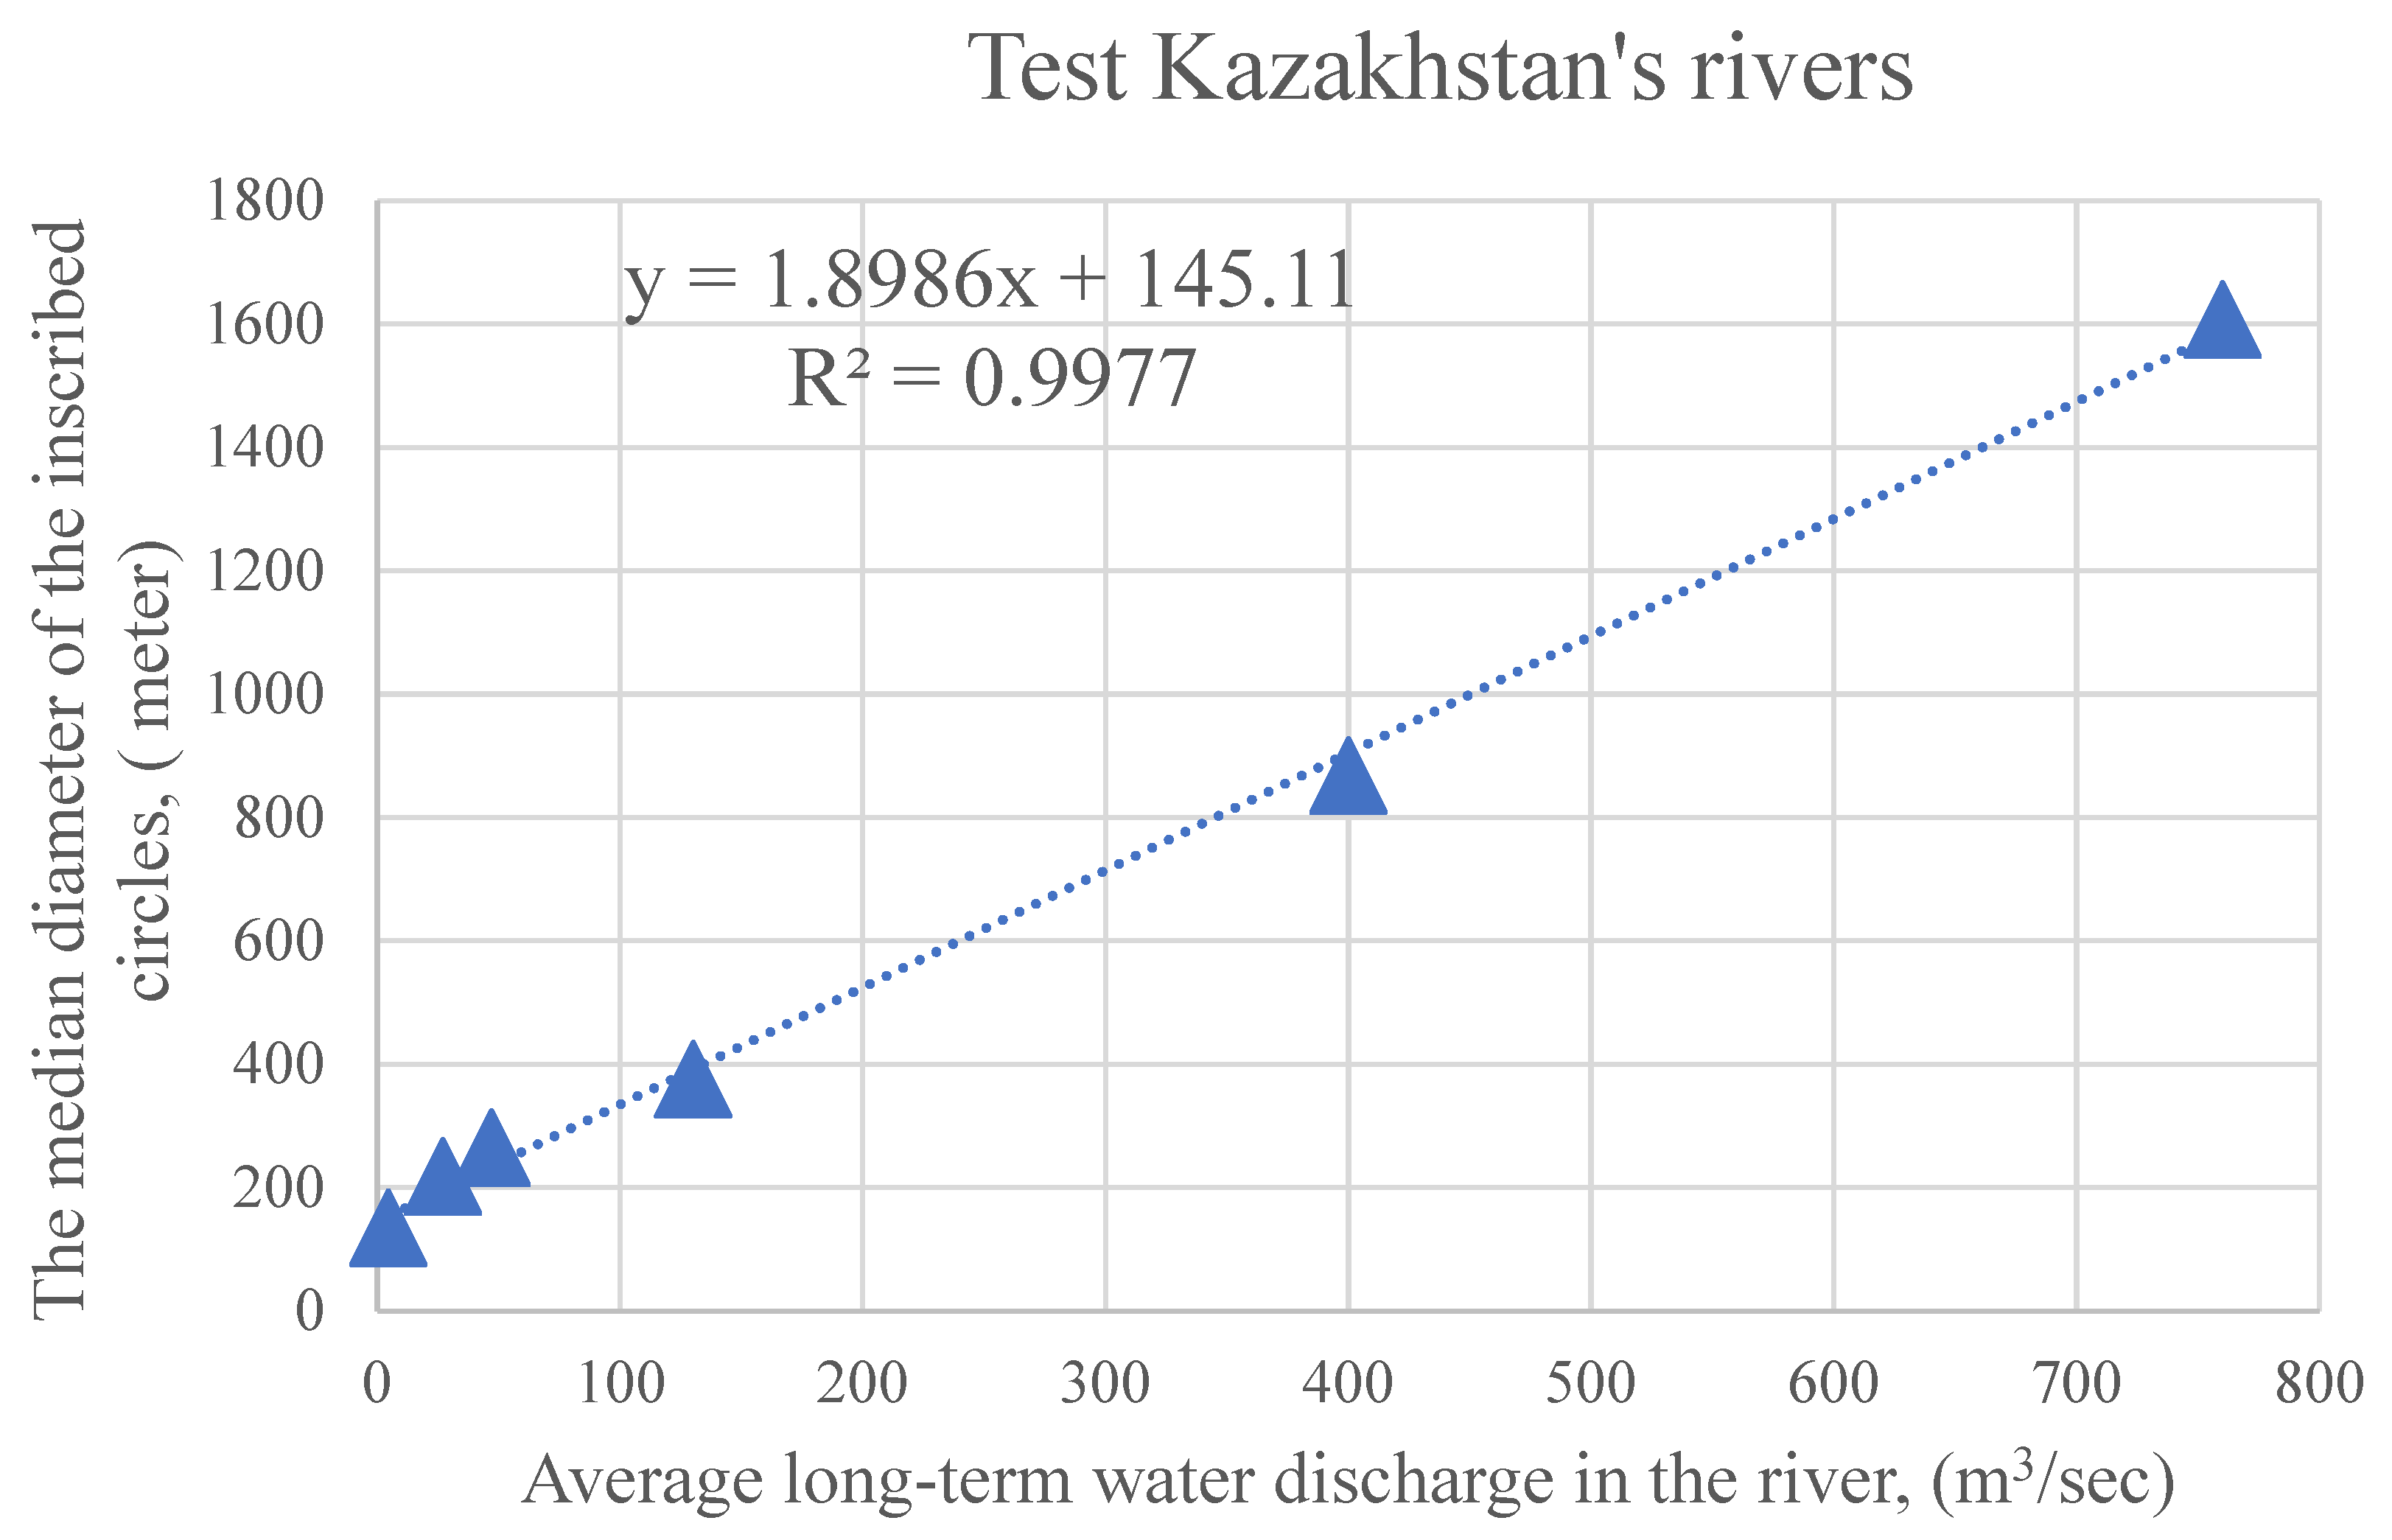
The mathematical representation of such dependencies can be simplified by considering, for example, the average median values of the diameter of inscribed circles in each set against the average long-term water discharge in the corresponding river, see Figure 12. The reliability of the linear approximation obtained in this way is exceptionally high and amounts to R2 = 0.997. However, the statistically insignificant number of rivers analyzed, only six, does not allow us to reasonably assume that such a strict functional relationship actually exists.
Figure 12.
The relationship between the average median sizes of circles inscribed in the bends of test sections of six rivers in Kazakhstan and the average long-term water discharge.
The obtained results demonstrate the availability of good capabilities for diagnosing the average long-term water discharge of freely meandering rivers. Moreover, the distribution of the inscribed circle diameters along the routes of the test river sections, in general, does not show pronounced trends Figure 10. That is, the statistical characteristics are stable. A slight decrease in the inscribed circle diameters in the lower parts of the valleys is recorded for the Ural (400 m3/s) and Arys (47 m3/s) rivers, with stable characteristics for the Syr Darya (760 m3/s), Chu (130 m3/s), and Talas (27 m3/s) rivers.
For the Bugun River (4.5 m3/s), an inverse relationship is observed; the inscribed circle diameters show a weak trend of increasing in the lower part of the valley. However, the river has very low average long-term water discharge, and the sizes of its meanders are not clearly described within the REM (CGDEM) scene with a spatial resolution of 30 m. Therefore, this anomalous trend in the inscribed circle sizes is likely due to the influence of random factors.
4. Discussion
Numerous methods exist for estimating river average long-term water discharges [21]. However, most are labor-intensive and expensive. Moreover, they typically only characterize current average long-term water discharges and do not provide information on past average long-term water discharges. Our proposed approach expands on a group of methods based on remote sensing data [22,23], but it is based on a new approach that allows estimating the average long-term water discharge of freely meandering rivers using satellite information on relative terrain elevation [16].
The developed methodology estimates the average long-term river average long-term average long-term water discharge over a long-time scale, representing the formation of an extended channel section containing numerous meanders. Based on our expert assumption, this time scale is approximately 100–1000 years. Unlike other approaches, our approach does not attempt to obtain short-term and long-term average river water discharge estimates based on empirical relationships between river discharge and the geometry of individual meanders or channel width. Long-term estimates based on the proposed approach are only applicable to climate studies, including retroclimate assessments.
The proposed analysis framework is focused on freely meandering river channels. Large channel slopes intensify erosion processes, leading to the formation of canyon forms. The presence of canyons fixes the channel position in certain places (the steepest) and, accordingly, prevents the river from freely meandering in a given location. The presence of canyons removes a river from the freely meandering category. Therefore, the morphological class of the selected rivers (freely meandering) automatically limits the upper limit of the permissible slope. The numerical values of the maximum possible river channel slope will obviously depend on the granulometric composition of river sediments and the river’s average long-term water discharge, so it is difficult to determine it numerically and unambiguously.
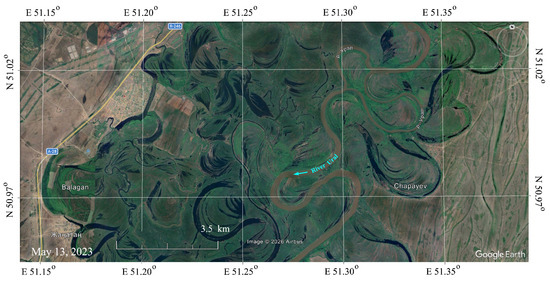
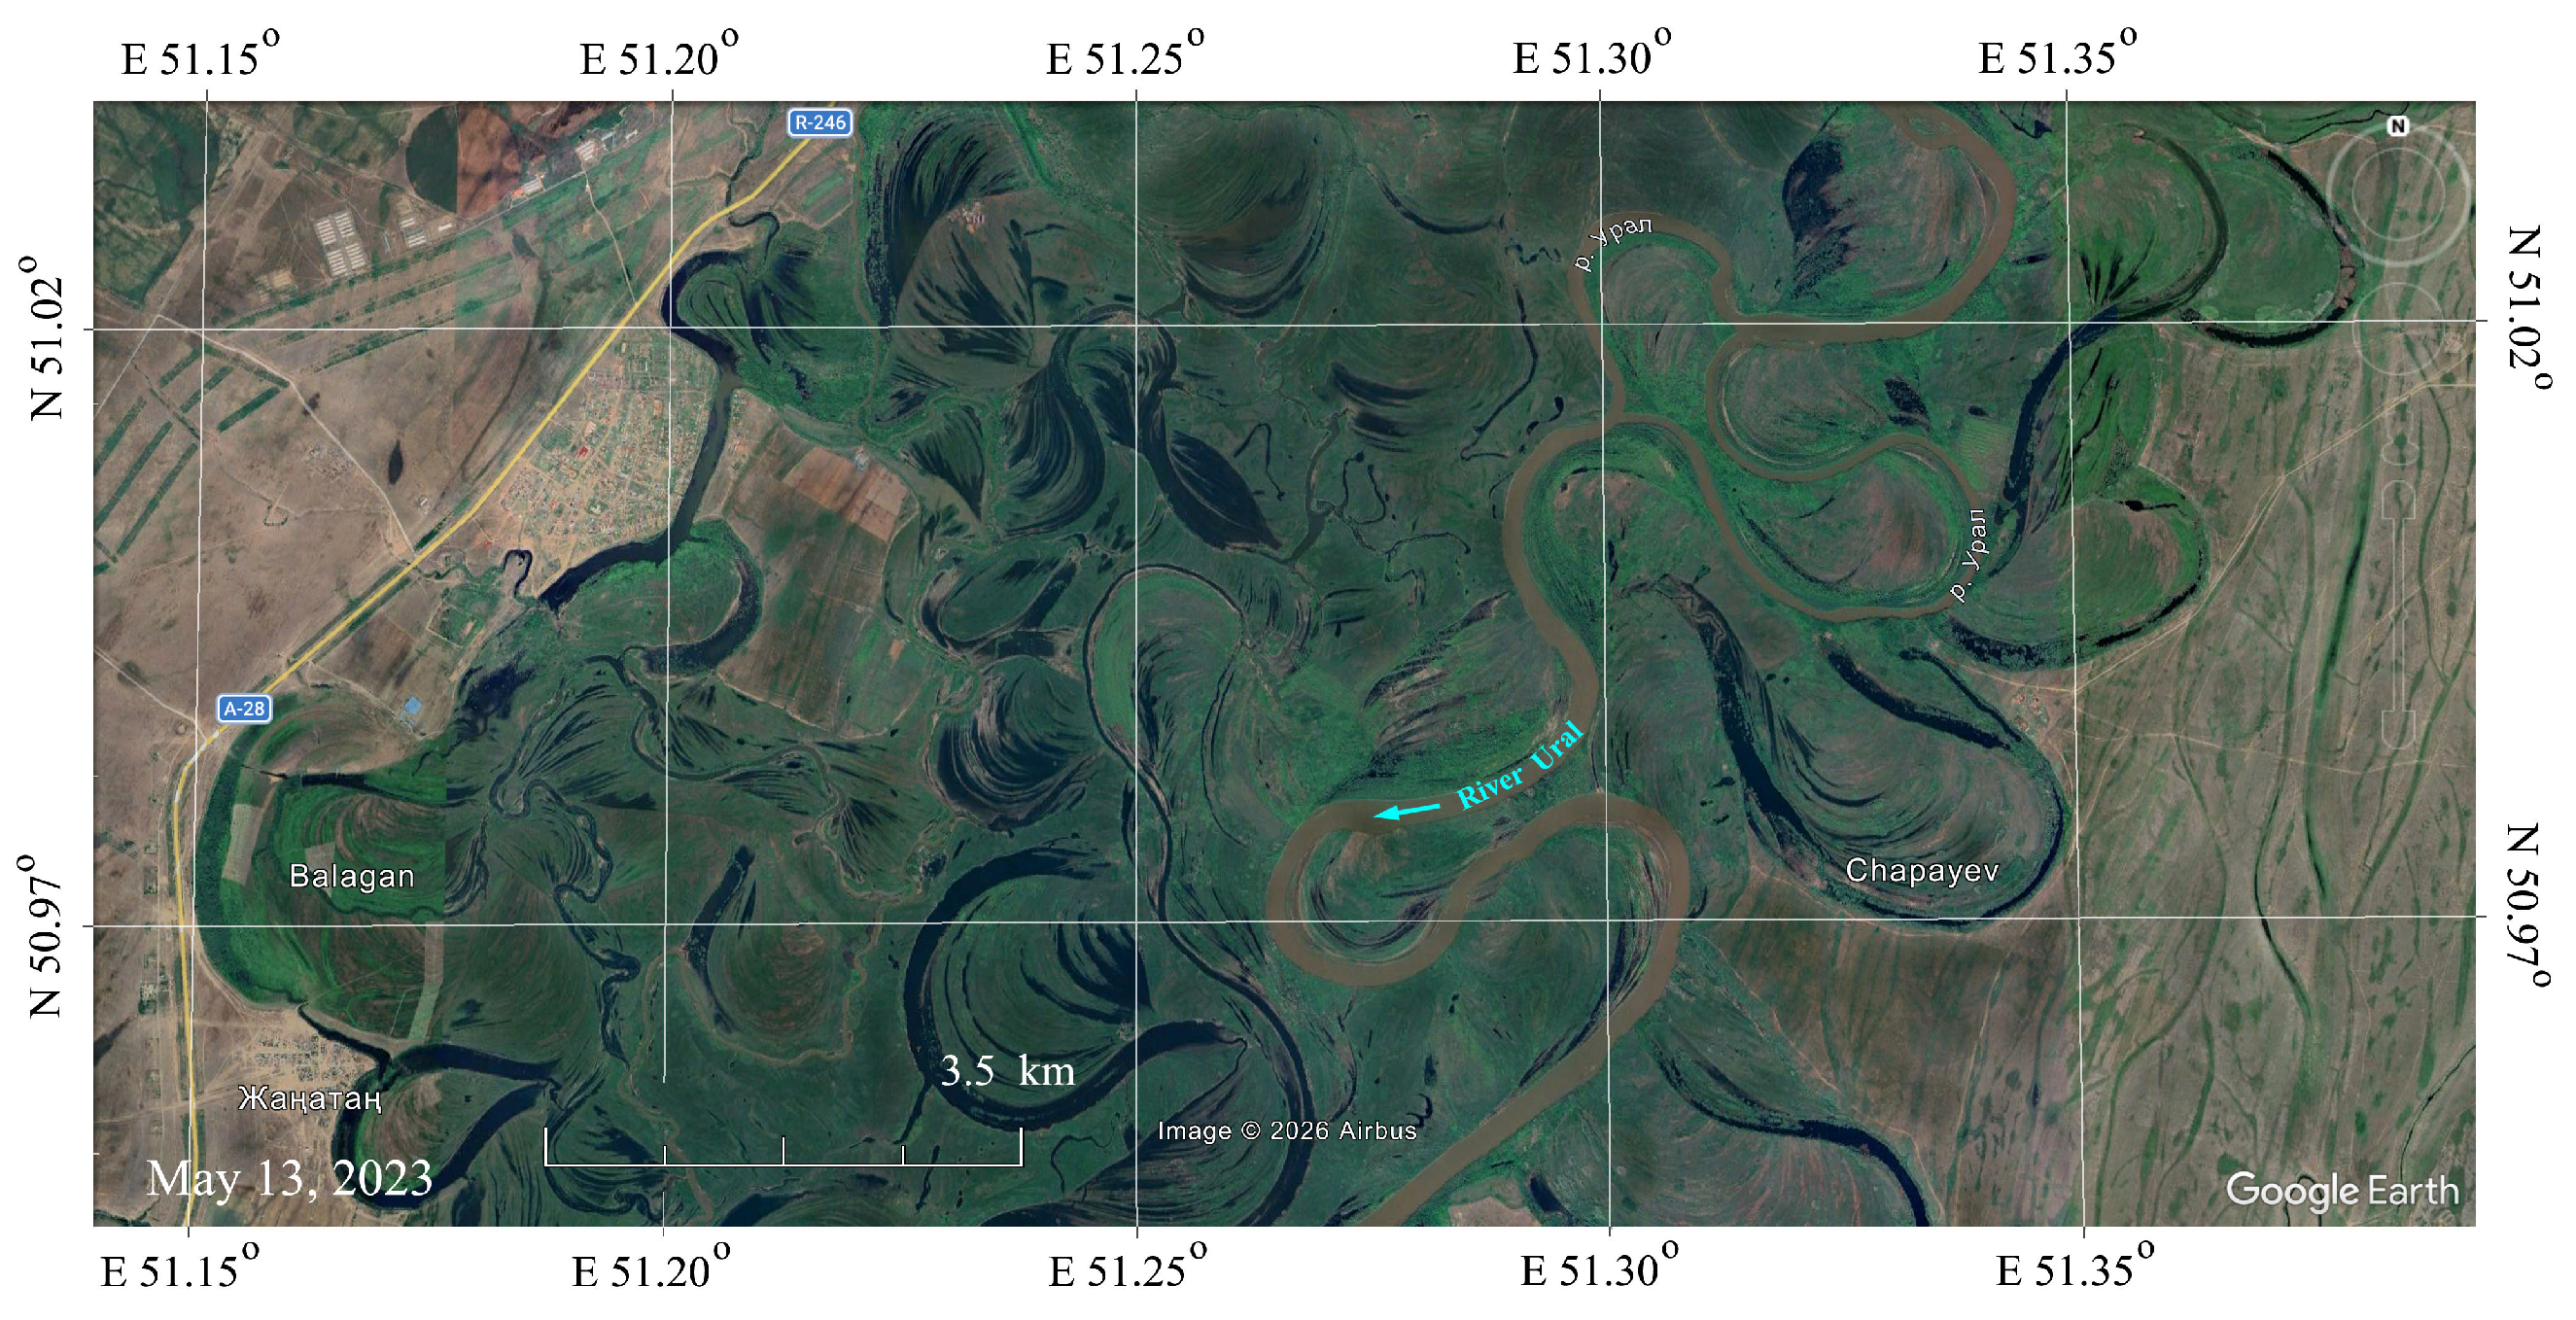
It seems interesting to note that the proposed approach slightly differs from the theory of fluid mechanics [12,24]. The process of river meandering represents a stable, long-term dynamic of channel shape changes that does not have a stable outcome in the form of a specific, fixed river shape. Hydromechanics typically describes the dynamics of the emergence and development of an individual meander. In this case, there is a finite time course, from the onset of channel deformation to the separation of the oxbow lake from the main channel. In fact, the river channel is constantly deformed, producing a set of meanders simultaneously present in different phases of their development over an extended section. We believe that statistical analysis of the shapes of simultaneously existing phases of meander development on an extended river channel fragment currently lies beyond the practical interest of hydromechanics theory. We are also unaware of any studies detailing the rates of meander shape change, which may be related to methods for estimating the dynamics of their curvature (in this case, describing curvature through the diameter of the inscribed circle (135-degree sector). The approach we describe is undoubtedly linked to the theory of hydromechanics, but this connection appears to be statistical and partly indirect. Descriptions of channel curvature (meandering) typically do not include calculations of the time factor, in the sense of describing how quickly the meander shape evolves. The rate of channel curvature depends on average long-term water discharge, and river discharge is a pulsating function. Real rivers contain meanders of varying sizes, indicating the obvious presence of minor but important parameters determining their size. For example, variations in slope, the grain size distribution of river sediments, and the possible influence of upstream and downstream meanders, characteristics of suspended material transport processes, the regime of average long-term water discharge pulsations (seasonality, individual events caused by weather phenomena), etc. The developed method is based on morphological analysis of their river channel configurations and appears to be primarily useful for retrospective assessments of changes in river average long-term water discharge. Typically, meandering rivers flow for relatively long periods within specific corridors, which only occasionally undergo significant changes through erosion and the formation of a new river route. These corridors contain both currently flooded meanders and traces of old channels in the form of oxbow lakes (Figure 13). Comparative information on flooded meanders and oxbow lakes can be readily obtained separately, which is undoubtedly of significant interest for understanding the characteristics of the regional retroclimate.
Figure 13.
A fragment of the Ural River valley (400 m3/s) with a developed structure of old oxbow lakes and meanders. Submeter-resolution satellite image from Google Earth. RGB composite in natural pseudo-colors (blue arrow indicates a flow direction).
Regional retroclimate analysis typically relies on modeling and retroforecasting results from direct climate measurement data [25,26,27], which are typically of poor quality [28]. Our proposed method can improve the reliability of regional climate retroanalysis models by obtaining additional information not related to direct climate modeling.
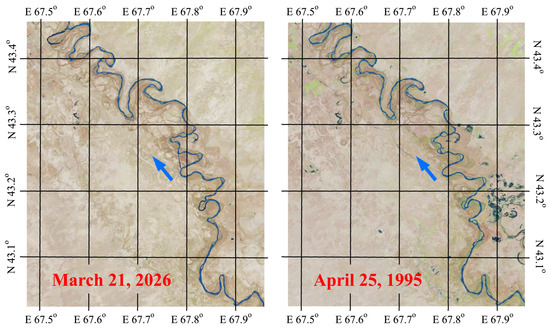
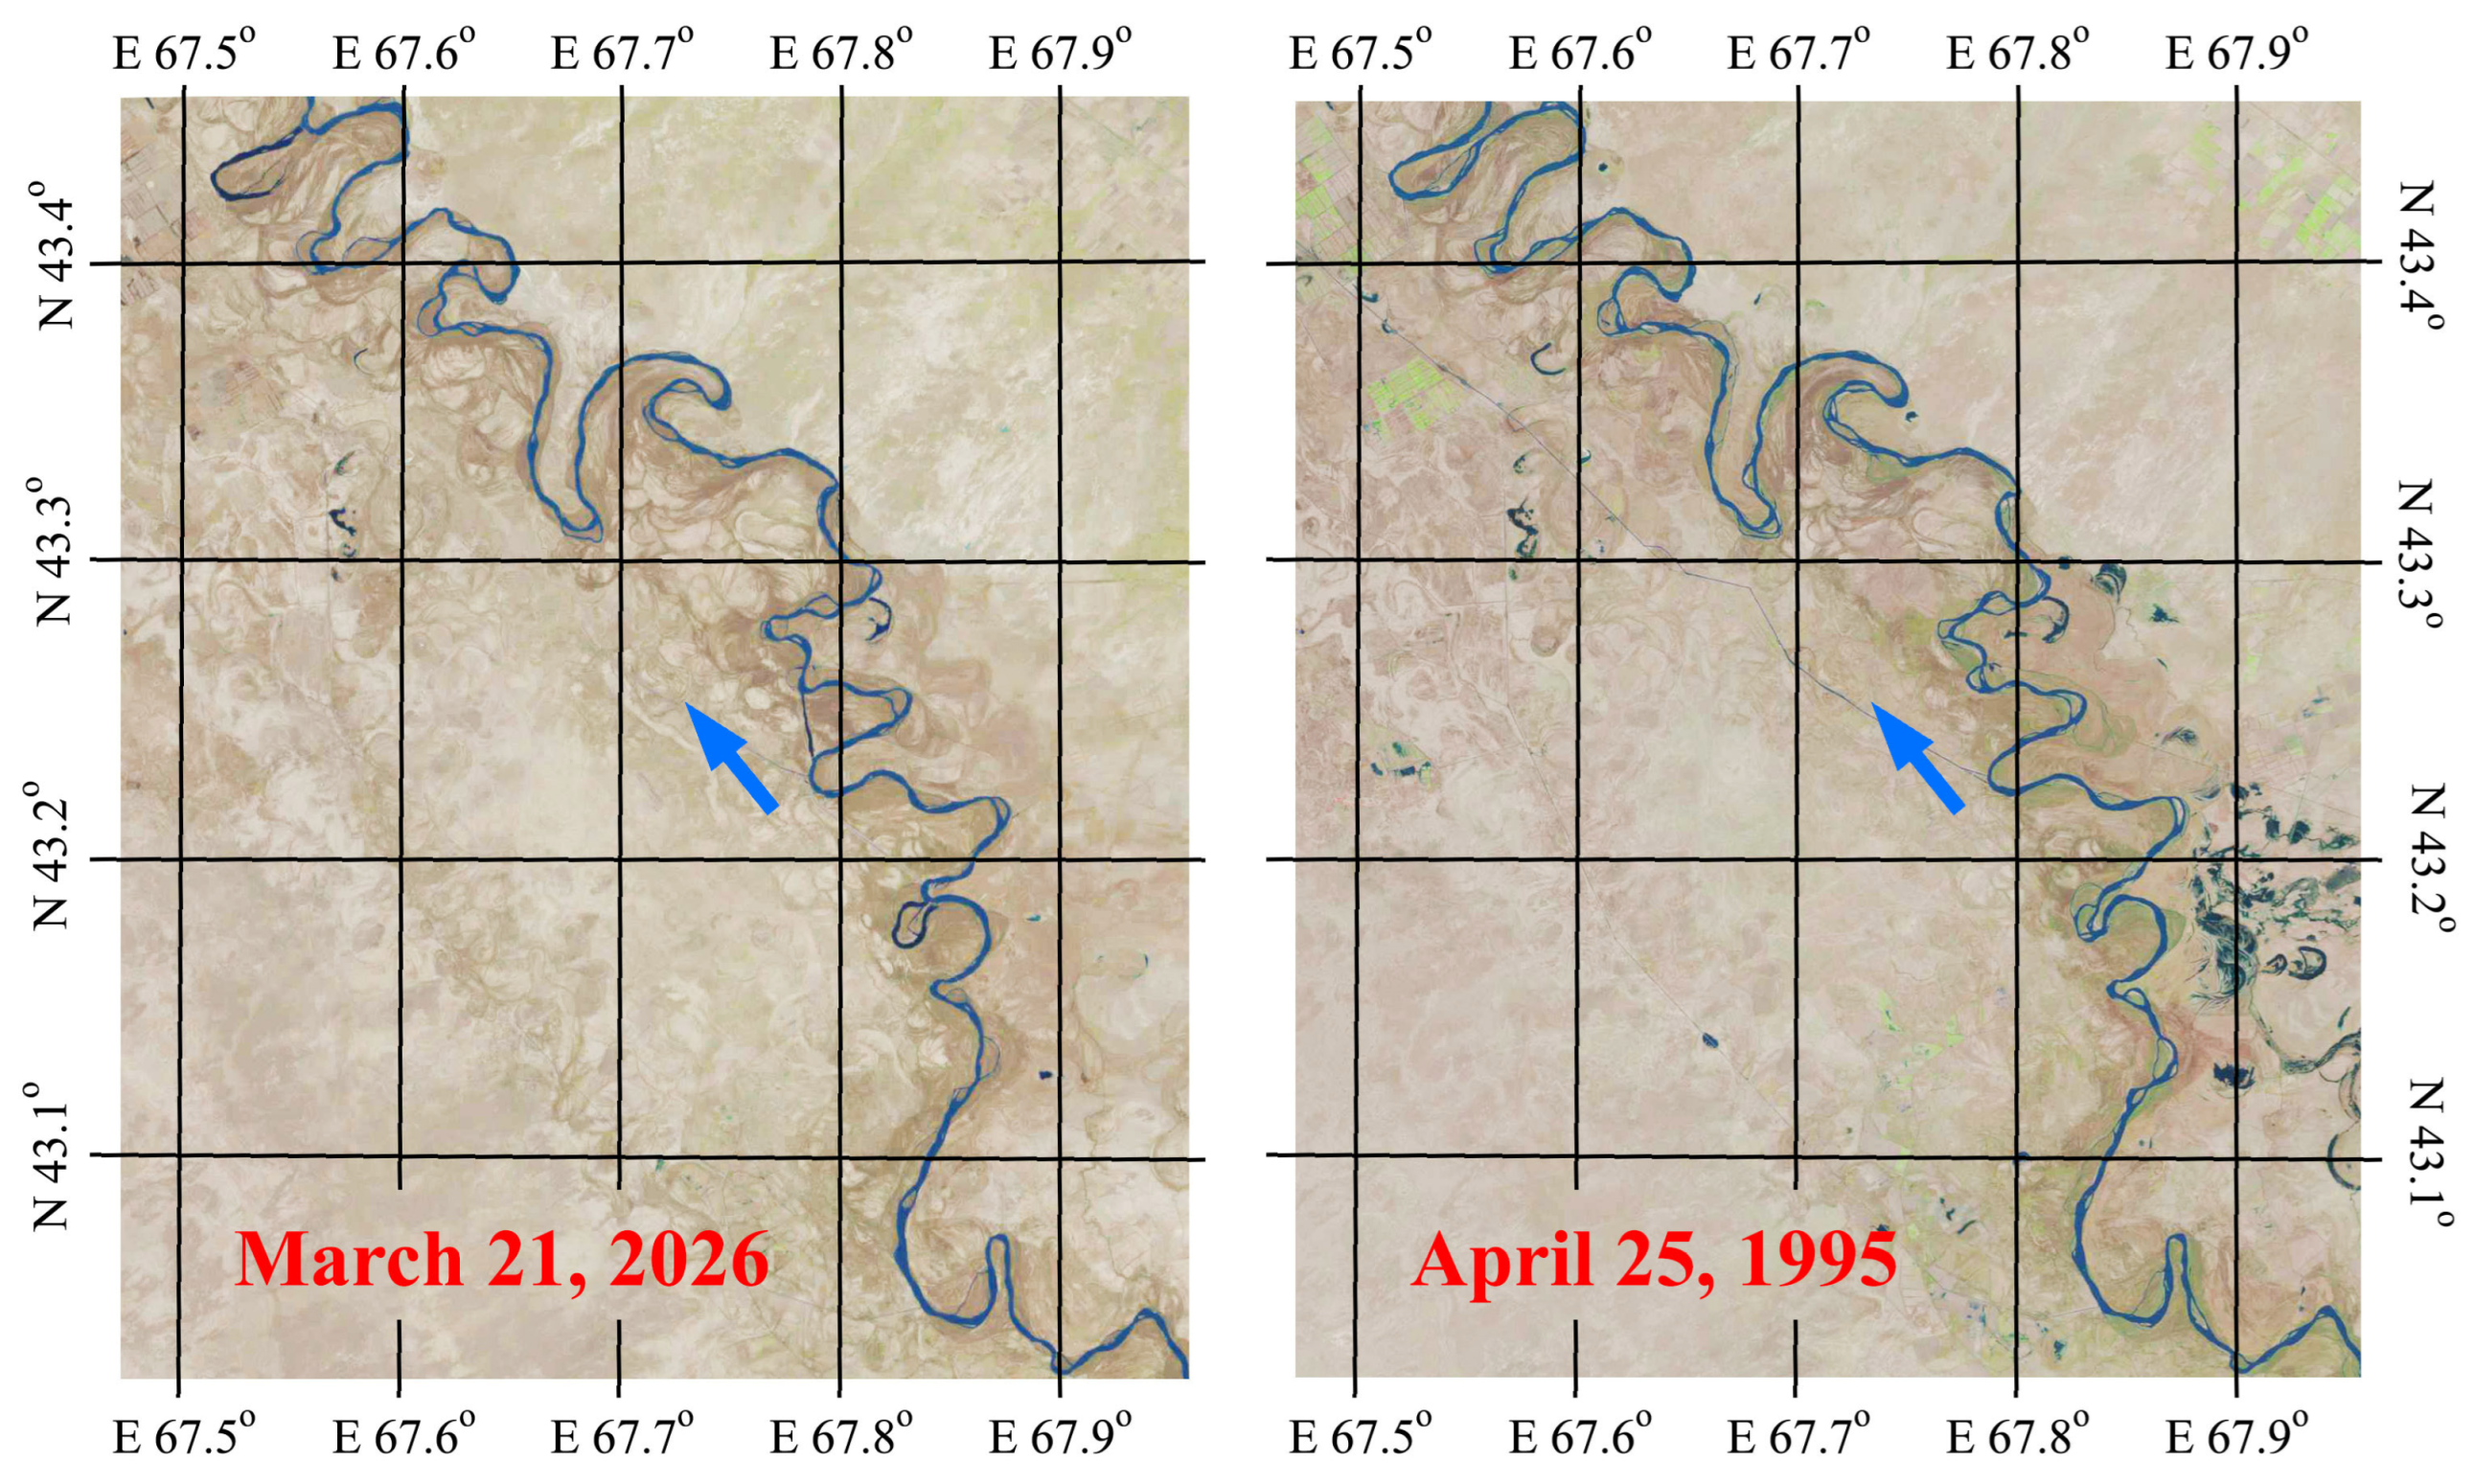
Multi-temporal satellite imagery can be used to assess the rate of formation of river channel sinuosity [29,30]. For example, LANDSAT images with a large time lag, over 30 years, for the Syr Darya River show virtually no changes in the configuration of meanders (Figure 14). This means that the time scale for assessing river average long-term water discharges based on morphological analysis of river configurations could easily span hundreds of years. It is also possible to analyze traces of extremely old riverbeds that once existed in various locations [28]. In these cases, the historical horizon for assessing average long-term water discharges extends over millennia. Archaeological finds with known dates can provide a more precise attribution to time periods.
Figure 14.
Illustration of the temporal stability of the Syr Darya River meander configurations based on multi-temporal LANDSAT satellite data (30 m resolution). Satellite images taken from the USGS GLOVIS resource (blue arrow indicates a flow direction).
5. Conclusions
Using six freely meandering rivers in Kazakhstan, we demonstrated a strong correlation between meander size and average long-term water discharge, allowing us to estimate the average long-term water discharge of these rivers based solely on their channel configurations. The range of average long-term water discharges for the tested rivers exceeded two orders of magnitude, from 4.5 m3/s (Bugun River) to 760 m3/s (Syr Darya River), with channel slopes ranging from 0.005 to 0.06%. The method for morphological analysis of river channels within this framework was based on approximating the river meanders using sets of inscribed circles. The average median diameters of these circles were closely correlated with average long-term water discharges. The reliability of the linear approximation for the six rivers examined was R2 = 0.997.
This method for assessing meandering river discharge is most suitable for retrospective analysis of changes in average long-term water discharge. Including not only currently flooded meanders but also traces of oxbow lakes in the analysis can provide significant historical depth of analysis, spanning several centuries. Analysis of old riverbed traces from past eras can assess the discharge patterns of previously existing rivers over a historical timescale of thousands of years or more. Thus, the method proposed in this study for assessing the discharge of freely meandering rivers based on morphological analysis of their channel configurations expands the arsenal of tools for reconstructing certain paleoclimate elements relevant to the hydrology of territories.
The proposed method is based on satellite data on absolute elevation. The availability of this information for other areas with meandering rivers can be considered as a basis for conducting a similar analysis there.
In the future, it will be necessary to develop an automated procedure for estimating meander sizes in such studies.
Author Contributions
Conceptualization, A.T. and R.M.; methodology, A.T.; formal analysis, G.S.; data curation, G.S.; writing—original draft preparation, A.T.; writing—review and editing, R.M., I.S.; visualization, G.S.; funding acquisition, A.T. All authors have read and agreed to the published version of the manuscript.
Funding
This research was funded by the Science Committee of the Ministry of Science and Higher Education of the Republic of Kazakhstan Grant No. BR24992908 and AP26104709.
Data Availability Statement
Dataset available on request from the authors.
Conflicts of Interest
The authors declare no conflict of interest.
Abbreviations
The following abbreviations are used in this manuscript:
| DEM | Digital Elevation Model |
| REM | Relative Elevation Model |
References
- Matishov, G.G.; Titov, V.V. Climate changes in the sea of Azov region over the last 126 thousand years and the problem of low flow. Her. Russ. Acad. Sci. 2023, 93, 1127–1135. [Google Scholar] [CrossRef] [Scilit]
- Merz, R.; Tarasova, L.; Basso, S. The flood cooking book: Ingredients and regional flavors of floods across Germany. Environ. Res. Lett. 2020, 15, 114024. [Google Scholar] [CrossRef] [Scilit]
- Chalov, R.S.; Chalova, E.R. Geographical patterns of river channel meandering in Russia. Geogr. Nat. Resour. 2023, 44, 198–207. [Google Scholar] [CrossRef] [Scilit]
- Phillips, J.D. River Meanders, Tributary Junctions, and Antecedent Morphology. Hydrology 2025, 12, 101. [Google Scholar] [CrossRef] [Scilit]
- Ackers, P.; Charlton, F.G. Meander geometry arising from varying flows. J. Hydrol. 1970, 11, 230–252. [Google Scholar] [CrossRef] [Scilit]
- Kurakova, A.A. Assessing hazardous manifestations of horizontal channel deformations in rivers of the Ob–Irtysh basin. Water Resour. 2023, 50, 828–841. [Google Scholar] [CrossRef] [Scilit]
- Opekunova, M.Y.; Kichigina, N.V.; Rybchenko, A.A.; Silaev, A.V. Channel Deformations and Hazardous Processes of the Left-Bank Tributaries of The Angara River (Eastern Siberia). Water 2023, 15, 291. [Google Scholar] [CrossRef] [Scilit]
- Han, S.; Zhao, L.; Chang, A.; Liu, B.; Wang, J.; Li, J. Overbank Flow, Sediment Transport, and Channel Morphology in the Lower Yellow River: A Review. Water 2024, 16, 1213. [Google Scholar] [CrossRef] [Scilit]
- Leopold, L.B.; Wolman, M.G. River meanders. Bull. Geol. Soc. Am. 1960, 71, 6. [Google Scholar] [CrossRef] [Scilit]
- Carlston, C.W. The relation of free meander geometry to stream discharge and its geomorphic implications. Am. J. Sci. 1965, 263, 864–885. [Google Scholar] [CrossRef] [Scilit]
- Frasson, R.P.M.; Pavelsky, T.M.; Fonstad, M.A.; Durand, M.T.; Allen, G.H.; Schumann, G.; Lion, C.; Beighley, R.E.; Yang, X. Global Relationships Between River Width, Slope, Catchment Area, Meander Wavelength, Sinuosity, and Discharge. Geophys. Res. Lett. 2019, 46, 3252–3262. [Google Scholar] [CrossRef] [Scilit]
- Yalin, M.S. River Mechanics; Elsevier: Amsterdam, The Netherlands, 2015; p. 218. [Google Scholar]
- Hooke, J.M. Changes in river meanders: A review of techniques and results of analyses. Prog. Phys. Geogr. Earth Environ. 1984, 8, 473–508. [Google Scholar] [CrossRef] [Scilit]
- State Water Cadastre. Long-Term Data on the Regime and Resources of Surface Waters of the Land, Kazakh SSR; Gidrometeoizdat: Leningrad, Russia, 1987; Volume 5, p. 232. [Google Scholar]
- Larrieu, K. RiverREM (Version 1.1.0) [Computer Software]. 2022. Available online: https://github.com/OpenTopography/RiverREM (accessed on 8 June 2026).
- Olson, P.L.; Legg, N.T.; Abbe, T.B.; Reinhart, M.A.; Radloff, J.K. A Methodology for Delineating Planning-Level Channel Migration Zones; Washington State Department of Ecology Publication No. 14-06-025; Washington State Department of Ecology: Olympia, WA, USA, 2014; p. 83. [Google Scholar]
- European Space Agency. Copernicus Global Digital Elevation Model. Distributed by OpenTopography. 2024. Available online: https://doi.org/10.5069/G9028PQB (accessed on 9 June 2026). [CrossRef]
- Brice, J.C. Evolution of Meander Loops. GSA Bull. 1974, 85, 581–586. [Google Scholar] [CrossRef] [Scilit]
- Hey, R. Geometry of river meanders. Nature 1976, 262, 482–484. [Google Scholar] [CrossRef] [Scilit]
- Crosato, A. Analysis and Modelling of River Meandering; IOS Press: Amsterdam, The Netherlands, 2008; p. 251. [Google Scholar]
- Dobriyal, P.; Badola, R.; Tuboi, C.; Hussain, S.A. A review of methods for monitoring streamflow for sustainable water resource management. Appl. Water Sci. 2017, 7, 2617–2628. [Google Scholar] [CrossRef] [Scilit]
- Immerzeel, W.W.; Droogers, P.; Jong, S.M.D.; Bierkens, M.F.P. Remote sensing of environment large-scale monitoring of snow cover and runoff simulation in Himalayan river basins using remote sensing. Remote Sens. Environ. 2009, 113, 40–49. [Google Scholar] [CrossRef] [Scilit]
- Revilla-Romero, B.; Thielen, J.; Salamon, P.; De Groeve, T.; Brakenridge, G.R. Evaluation of the satellite-based global flood detection system for measuring river discharge: Influence of local factors. Hydrol. Earth Syst. Sci. 2014, 18, 4467–4484. [Google Scholar] [CrossRef] [Scilit]
- Liu, P. A General Theory of Fluid Mechanics; Springer: Singapore, 2021; p. 649. [Google Scholar] [CrossRef] [Scilit]
- Doblas-Reyes, F.J.; Sörensson, A.A.; Almazroui, M.; Dosio, A.; Gutowski, W.J.; Haarsma, R.; Hamdi, R.; Hewitson, B.; Kwon, W.-T.; Lamptey, B.L.; et al. Linking global to regional climate change. In Climate Change 2021: The Physical Science Basis; Masson-Delmotte, V., Zhai, P., Pirani, A., Connors, S.L., Péan, C., Berger, S., Caud, N., Chen, Y., Goldfarb, L., Gomis, M.I., et al., Eds.; Cambridge University Press: Cambridge, UK, 2021; pp. 1363–1512. [Google Scholar]
- Eyring, V.; Gillett, N.P.; Rao, K.M.A.; Barimalala, R.; Parrillo, M.B.; Bellouin, N.; Cassou, C.; Durack, P.J.; Kosaka, Y.; McGregor, S.; et al. Human influence on the climate system. In Climate Change 2021: The Physical Science Basis; Masson-Delmotte, V., Zhai, P., Pirani, A., Connors, S.L., Péan, C., Berger, S., Caud, N., Chen, Y., Goldfarb, L., Gomis, M.I., et al., Eds.; Cambridge University Press: Cambridge, UK, 2021; pp. 1363–1512. [Google Scholar]
- Tapiador, F.J.; Navarro, A.; Moreno, R.; Sánchez, J.; García-Ortega, E. Regional climate models: 30 years of dynamical downscaling. Atmos. Res. 2020, 235, 104785. [Google Scholar] [CrossRef] [Scilit]
- Garcia-Molsosa, A.; Orengo, H.A.; Petrie, C.A. Reconstructing long-term settlement histories on complex alluvial floodplains by integrating historical map analysis and remote-sensing: An archaeological analysis of the landscape of the Indus River Basin. Herit. Sci. 2023, 11, 141. [Google Scholar] [CrossRef] [Scilit]
- Wahiduzzaman, M.; Yeasmin, A. An Observation of the Changing Trends of a River Channel Pattern in Bangladesh Using Satellite Images. Appl. Sci. 2022, 12, 11604. [Google Scholar] [CrossRef] [Scilit]
- Suresh, A.; Chanda, A.; Rahaman, Z.A.; Al Kafy, A.; Rahaman, S.N.; Hossain, M.I.; Rahman, M.T.; Yadav, G. A geospatial approach in modelling the morphometric characteristics and course of Brahmaputra river using sinuosity index. Environ. Sustain. Indic. 2022, 15, 100196. [Google Scholar] [CrossRef] [Scilit]

Disclaimer/Publisher’s Note: The statements, opinions and data contained in all publications are solely those of the individual author(s) and contributor(s) and not of MDPI and/or the editor(s). MDPI and/or the editor(s) disclaim responsibility for any injury to people or property resulting from any ideas, methods, instructions or products referred to in the content. |
© 2026 by the authors. Licensee MDPI, Basel, Switzerland. This article is an open access article distributed under the terms and conditions of the Creative Commons Attribution (CC BY) license.