


Abstract
PFAS-laden fluid-filled porous media may be subjected to various mechanical loads which induce solid deformation and fluid flow and hence PFAS transport. This work employs a poroelasticity theory for unsaturated porous media to address the coupled solid deformation, fluid flow and PFAS transport in the vadose zone subjected to a mechanical load. The governing equation of the aqueous PFAS concentration is derived based on the PFAS mass balance that also considers the water content variation in the pores due to the solid deformation. Vertical PFAS transport in a finite soil layer under mechanical compression is studied using a finite difference method and the solutions of the pore fluid pressures and volumetric strain. Numerical results of the aqueous concentrations of perfluorooctane sulfonic (PFOS) in loamy sand and clay loam indicate that mechanical compression has pronounced effects on the spatial distribution of PFOS. In a loamy sand with relatively higher permeability, mechanical compression at the top drained surface leads to movement of PFOS from the topsoil to the surface thereby reducing the PFOS concentration in the topsoil especially at higher water saturations. The PFOS concentration in the subsoil, however, is not significantly influenced. The effect of mechanical compression on the PFOS concentration distribution in a clay loam can also be observed but is not as significant as in the loamy sand. The mechanical loading effects may be further explored to develop new technologies for PFAS risk assessment and remediation strategies.
1. Introduction
The unsaturated vadose zone filled by water and air has now been considered a reservoir for the perfluoroalkyl and polyfluoroalkyl substances (PFAS) [1,2,3]. High PFAS concentrations have been found in farmlands and in soils near industrial sites, airports, and landfills. It is known that PFAS have great adverse impacts on the environment such as groundwater and agricultural soil contaminations [4,5,6], and on the human health including immune function and various organ health concerns [7]. PFAS initially distributed in the topsoil of the vadose zone can migrate downward and eventually reach the groundwater table and contaminate groundwater [8]. Transport of PFAS in the vadose zone has received increasing attention in recent years due to its importance in PFAS risk assessment and contamination prevention. Under the steady state transport conditions, Shin et al. [9,10] simulated PFAS migration in the vadose zone using the EPA Pesticide Root Zone Model version 3 (PRZM-3) without considering adsorption of PFAS at the air–water interface (AWI). Brusseau [11] considered interfacial PFAS adsorption in a one-dimensional (1D) solute transport model but also assumed steady state transport. To address the time-dependent transport behavior, Guo et al. [12] developed a 1D transient transport model that couples the porous water flow model described by the Richards equation [13] and the PFAS transport model. Their 1D model was later extended to deal with general three-dimensional (3D) PFAS transport in the vadose zone [14]. Biesek et al. [15] numerically simulated PFAS migration in the vadose zone considering the effects of plant water uptake and soil organic carbon distribution. Most recently, Guo and Brusseau [8] reviewed the challenges and opportunities in understanding PFAS transport in the vadose zone. Although significant progress has been made to understand PFAS transport in the vadose zone, as reviewed above, investigations on PFAS transport so far have been based on the Richards equation [13] for porous water flow in soils without considering soil deformations.
The surface of a PFAS contaminated porous medium may be subjected to various mechanical loads, for example, gradual loading on the soil below a landfill, cargo at contaminated industrial sites, and vehicle traffic on a farmland. Moreover, buildings on PFAS contaminated sites exert permanent consolidation forces on the soil/rock through the foundation. Mechanical loadings on a fluid-filled porous medium including soil and rock cause both solid deformation and porous fluid flow [16]. Because advection is one of the major mechanisms for contaminant transport in the vadose zone [17], it becomes important to study transport of PFAS when the contaminated zone is subjected to mechanical loads. Mechanical load-induced PFAS transport, however, has not been addressed in the literature.
The purpose of this paper is to fill this knowledge gap by presenting a PFAS transport equation with consideration of solid deformation and numerically investigating the PFAS transport behavior in a mechanically compressed soil layer. A Biot-type poroelasticity is employed to address the coupled solid deformation and fluid flow in the vadose zone. In the remainder of the paper, Section 2 first summarizes the governing equations of a Biot-type poroelasticity for partially saturated porous media [18]. Next, the transport equation is derived by considering the contribution of water content variation to the PFAS mass balance due to solid deformation. PFAS transport in a finite soil layer under a constant mechanical compression on the top drained surface is then studied by means of a finite difference method using the solutions of pore water and air pressures in the porous layer. In Section 3, numerical results of the spatial distribution of the aqueous PFAS concentration in a loamy sand and a clay loam are presented. Finally, concluding remarks on the effects of mechanical loads on PFAS transport are provided in Section 4.
2. Methods
2.1. Basic Equations of Poroelasticity of Unsaturated Porous Media
PFAS transport in a deformable unsaturated porous medium under mechanical loads depends on the pore fluid pressures, fluid fluxes, and deformation of the solid matrix. We use a Biot-type poroelasticity theory for unsaturated porous media [18] to study the solid deformation and pore fluid flows in the medium. This theory assumes that the medium is isotropic and homogeneous, the deformation is small, fluid flows follow Darcy’s law, and the solid matrix behaves elastically. The effect of PFAS on the pore fluid flows and solid deformation may not be significant and hence can be ignored if the PFAS concentration is low [19]. The basic equations satisfied by the solid displacements and pore water and air pressures are [18]
where ui denotes the solid displacement vector; pw and pnw are the pore pressures of water (wetting fluid) and air (nonwetting fluid), respectively; indices i, j and k take values of 1, 2 and 3; a comma followed an index i implies partial differentiation with respect to xi; a repeated index implies summation over the range of the index; t is time; G is the shear modulus; ν is the drained Poisson’s ratio; α is the Biot–Willis coefficient; Sw and Snw = 1 − Sw are the degrees of water and air saturation, respectively; k is the soil permeability; μw and μnw are the dynamic viscosity of water and air, respectively; Mw, Mnw and Mwnw are Biot’s moduli given by [18]
and krw and krnw are the relative permeability of water and air, respectively, given by
In Equation (3), φ is the soil porosity, Ks, Kw and Knw are the bulk moduli of the solid, water and air, respectively, and Kc is the capillary modulus given by
In Equations (4) and (5), αc, nc, mc = 1 − (1/nc) are material constants, Srw is the residual water saturation, Ssw is the saturated water content divided by the porosity, and Se is an effective saturation given by [20]
Equations (4) and (5) are based on the water retention curve of van Genuchten [21] and Mualem’s hydraulic conductivity model [22]. It is noted that the van Genuchten–Mualem model in Equation (4) may produce numerical instability near full water saturation, i.e., Se approaches one [23,24].
Once the solid displacements and pore fluid pressures are obtained, the fluid content variations, i.e., the fluid volume changes in a unit porous medium volume, due to solid deformation and compression of the fluids can be calculated using the following equation [18]
where ζw and ζnw are the water and air content variations, respectively.
The water and air content variations and the water and air fluxes satisfy the following continuity equations
where qwi and qnwi are the water and air flux vectors, respectively. They are related to the gradients of the pore fluid pressures by Darcy’s law
The mechanical stresses can be calculated from the displacements and pore fluid pressures by
where δij is the Kronecker delta.
Biot’s poroelasticity for fluid-saturated media [25] is a standard theory to study consolidation of saturated soil and general hydromechanical behavior of soils, rocks and other fluid-saturated porous materials [16]. Equations (1)–(10) are the extensions of Biot’s poroelasticity for unsaturated porous media including unsaturated soils and rocks.
2.2. Transport Equation of PFAS in Unsaturated Porous Media
In this section, we derive the PFAS transport equation considering soil deformation. PFAS move in an unsaturated porous medium via molecular diffusion, advection and mechanical dispersion. The PFAS flux due to the combined diffusion and dispersion in porous media obeys a form of extended Fick’s law [17]
where C is the mass of PFAS per unit solvent volume, i.e., the aqueous PFAS concentration, and Dij is the diffusion-dispersion coefficient tensor given by [26]
where D0 is the diffusion coefficient of PFAS in free water; αL and αT are the dispersivity values in the longitudinal and transverse directions, respectively; and τt is a tortuosity parameter which may be calculated using the following formula [12]
For transport of surfactants including most PFAS, we also need to consider the constitutive relations for the interfacial concentration variation of the chemicals. Denote by Cs the mass of PFAS adsorbed to the solid matrix per unit mass of the porous medium, and by Caw the mass of PFAS adsorbed to AWI per unit volume of the porous medium. Assuming equilibrium sorption, the Freundlich model can be used to relate Cs to the solvent concentration by [17]
where Kf and N are parameters determined by experiment. It is noted that the above model is valid for dilute solutions, which is the case of the present study.
Caw is related to the solvent concentration by
where Aaw is the air–water interfacial area per unit porous medium and may be approximated by [12]
where ai (i = 1, 2, 3) are fitting parameters. Kaw in Equation (15) may be approximated by [12,27]
where bi (i = 0, 1) are constants, R = 8.314 (J/K/mol) is the universal gas constant, T is the absolute temperature, and γ is the surface tension.
In deriving the PFAS transport equation from mass conservation, besides the mass transfer by diffusion, dispersion, advection and interfacial adsorption, the change in mass of PFAS in a representative volume element due to the water content variation caused by the solid deformation and water compressibility should also be considered. This term equals ∂(Cζw)/∂t during a unit period of time where ζw is the water content change per unit porous medium volume given in Equation (7). The PFAS transport equation can thus be derived as follows
where ρ is the soil density. Equation (18) is the same as that in Zeng and Guo [14] except for the term related to the water content variation on the left-hand side of the equation, i.e., ∂(ζwC)/∂t. This term vanishes for an incompressible fluid flowing in a rigid porous medium, an assumption used by the existing PFAS transport studies. Equation (18) can be simplified using Equations (7) and (8) as follows
Under the conditions of mechanically induced small perturbations of fluid saturations and PFAS concentration around their base values, the above nonlinear equation may be reduced to the following linear equation for the aqueous PFAS concentration
where C0 is a constant base value of the PFAS concentration.
2.3. Pore Fluid Pressures and PFAS Transport Equation in a Porous Layer
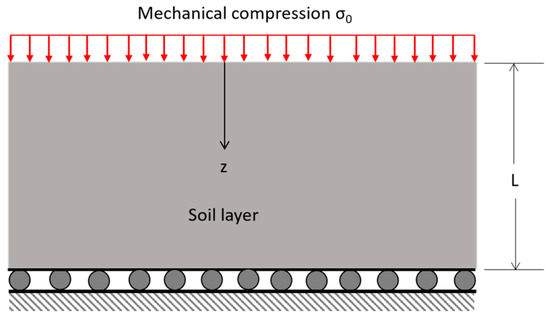
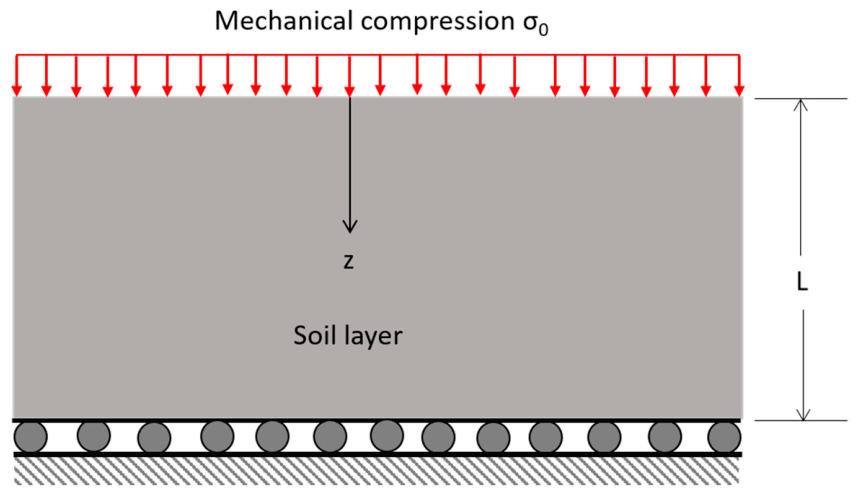
In the solution part of this work, we consider mechanically induced vertical PFAS transport in a soil layer of infinite lateral dimensions subjected to a uniform compressive stress at the top surface as shown in Figure 1. The thickness of the soil layer is denoted by L. The bottom of the layer is mechanically fixed and a constant compressive stress σ0 is suddenly applied to the top surface z = 0 at t = 0. The top surface is assumed to be drained, and the bottom surface is assumed to be impermeable. Finding the deformation and pore fluid pressures in the layer corresponds to the classical Terzaghi’s consolidation problem for saturated soil [16]. For unsaturated soil, the analytical expressions of the pore water and air pressures and the volumetric strain are given by [19].
where
Figure 1.
An unsaturated porous layer subjected to a compressive axial stress at the top drained surface. The bottom of the layer is rigidly constrained and impermeable.
The above solution of pore water pressure was partially validated by Jin [19] because it reduces to the well-known Terzaghi’s solution of consolidation of saturated soil [16] in the limit of Sw → 1.
For the vertical PFAS transport under small perturbations of water saturation and PFAS concentration, Equation (20) reduces to
where
the dispersivity is determined by [28]
and the soil density is calculated by
where ρs, ρw and ρnw are the densities of the solid, water and air, respectively.
The following initial condition is employed
where C10 are C20 are the initial PFAS concentrations in the topsoil and subsoil, respectively, and h is the topsoil thickness. Generally, the initial PFAS concentration is not constant or piecewise constant as assumed in Equation (31). This simplification is used as the present work is concerned with mechanically induced PFAS transport.
The boundary condition at the top and bottom surfaces are assumed as
When the soil is subjected to pure mechanical compression with drained top surface, water flows to the surface thereby maintaining a constant PFAS concentration just above and below the surface. The derivative of the PFAS concentration thus vanishes at the top surface. It is noted that the PFAS flux is not zero at the top surface because of advection. The zero PFAS gradient at the bottom surface is due to the impermeable condition in the Terzaghi’s consolidation theory.
3. Numerical Results
This section presents the numerical results of PFAS concentration variations in the porous layer shown in Figure 1 induced by the mechanical stress σ0 on the top surface. Both a loamy sand and a clay loam are considered. The material properties are listed in Table 1. The soil properties are taken from [29,30]. The properties were determined using the experimentally measured data and represent typical values of the two soil textures. The residual water saturations are estimated using the data in Lo and Lee [29] and Ochsner [31] by dividing the residual water content by the porosity. The saturated water content is assumed to be 95% of the porosity in both soil textures. The PFAS compound is perfluorooctane sulfonic (PFOS) and the related properties are taken from Brusseau et al. [32] and Guo et al. [12] and are listed in Table 2. In all numerical examples, the total layer thickness is L = 2 m and the topsoil layer thickness is taken as h = L/10. The initial PFOS concentration is assumed to be C10 = 1.0 g/m3 for 0 ≤ z ≤ h = 0.2 m (topsoil) and C20 = 0.2 g/m3 for h < z ≤ L (subsoil). These initial values are near the lower bound of the simulated PFOS concentrations in the contaminated Accusand and Vinton soil [12] in a fire-training area. The dispersivity αL is calculated as 0.046 m using the column length L and Equation (29).
Table 1.
Material properties of loamy sand and clay loam.
Table 2.
PFOS transport parameters.
An explicit finite difference method is employed to solve Equation (27) using a dimensionless time t* = D0t/h2, where D0 is the diffusion coefficient of PFAS in free water. The spatial step size is taken as d = h/20 = 0.01 m. Corresponding to this spatial step size, it is found that a dimensionless time step of τ* = 10−5 (dimensional time of 740 s) leads to stable and converged results.
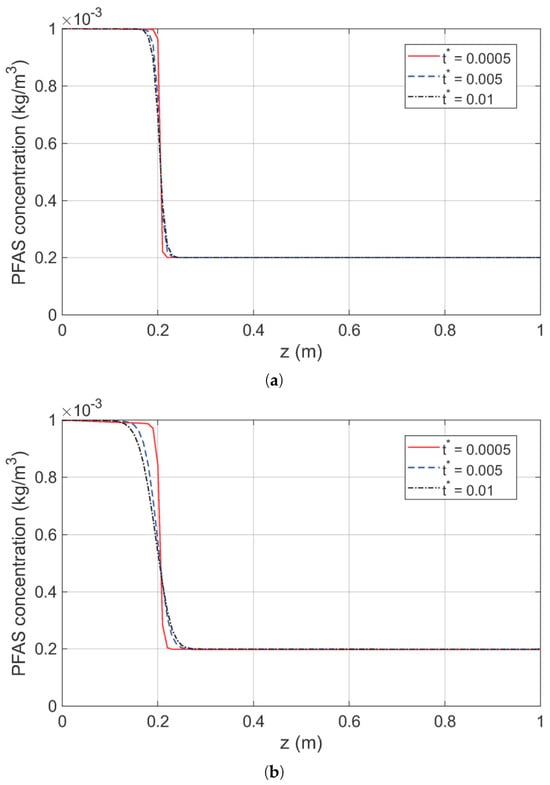
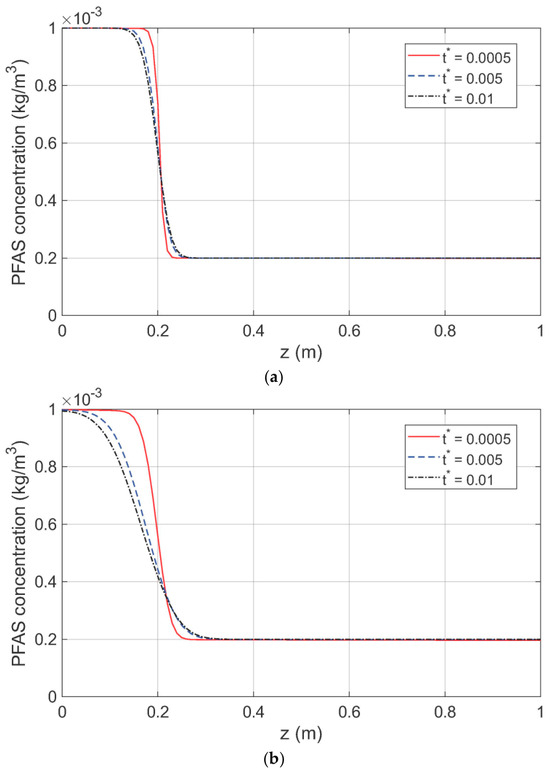
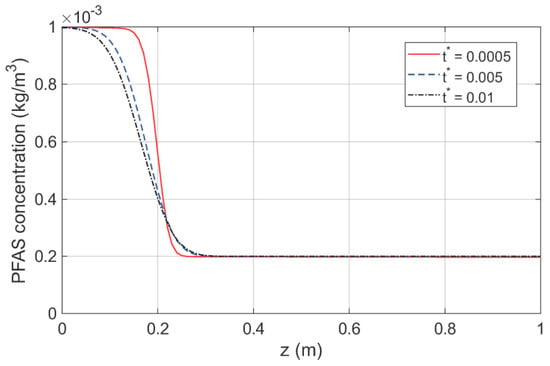
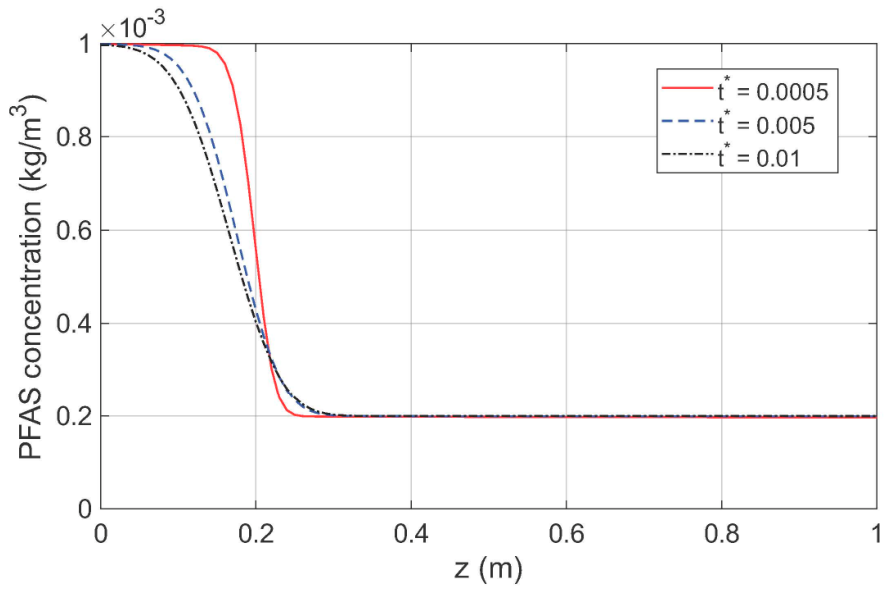
Figure 2a shows the spatial distribution of the aqueous PFOS concentration in a loamy sand at various dimensionless time t* = D0t/h2. The degree of water saturation is taken as Sw = 0.6. The applied top surface compressive stress is 0.5 MPa which represents a typical value in soil consolidation tests [33] and is also consistent with the pressures exerted on the surface by heavy trucks including agricultural machinery [34]. It is seen that the PFOS concentration basically remains at the initial values in both topsoil (0 < z ≤ 0.2 m) and subsoil (0.2 m < z ≤ 1.0 m) with steep transition occurring at the topsoil–subsoil interface. The PFOS concentration near the interface becomes lower than the initial value of 0.001 kg/m3 in the topsoil but is higher than the initial value of 0.0002 kg/m3 in the subsoil at longer times. Figure 2b shows the spatial distribution of the aqueous PFOS concentration at a higher level of applied load of 3 MPa which is close to the maximum applied compressive stress in soil consolidation tests [33]. Applied compressive stress levels up to 3 MPa represent load levels in various geotechnical and agricultural engineering applications such as foundation settlement estimates, highway and airport design, and soil behavior evaluations. Now the PFOS concentration in the topsoil near the topsoil–subsoil interface (z = 0.2 m) is significantly lower than the initial value (0.001 kg/m3) at longer times. For example, the PFOS concentration drops to 54% of the initial value near the interface at t* = 0.01. On the other hand, the PFOS concentration in the subsoil near the topsoil–subsoil interface is higher than the initial value (0.0002 kg/m3) indicating PFOS moving into the subsoil by diffusion. The area under the PFOS concentration curve over the depth is smaller than that at the initial state indicating reduced average PFOS concentration in the soil. This is because the contaminated pore water moves from the topsoil to the drained top surface. The results show that a higher mechanical load drives movement of a larger amount of PFOS to the top drained surface.
Figure 2.
(a) Vertical distribution of the aqueous PFOS concentration at a water saturation of Sw = 0.6 in a loamy sand (σ0 = 0.5 MPa). (b) Vertical distribution of the aqueous PFOS concentration at a water saturation of Sw = 0.6 in a loamy sand (σ0 = 3.0 MPa).
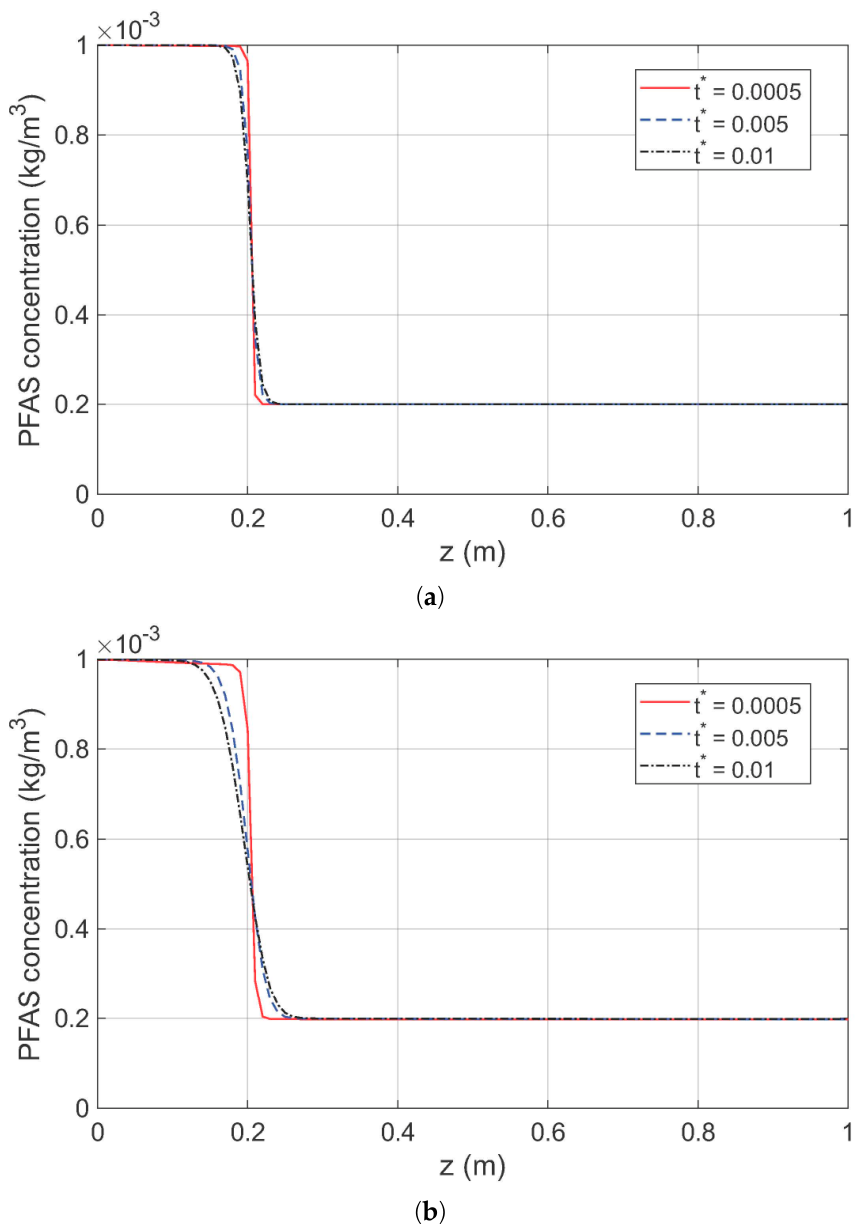
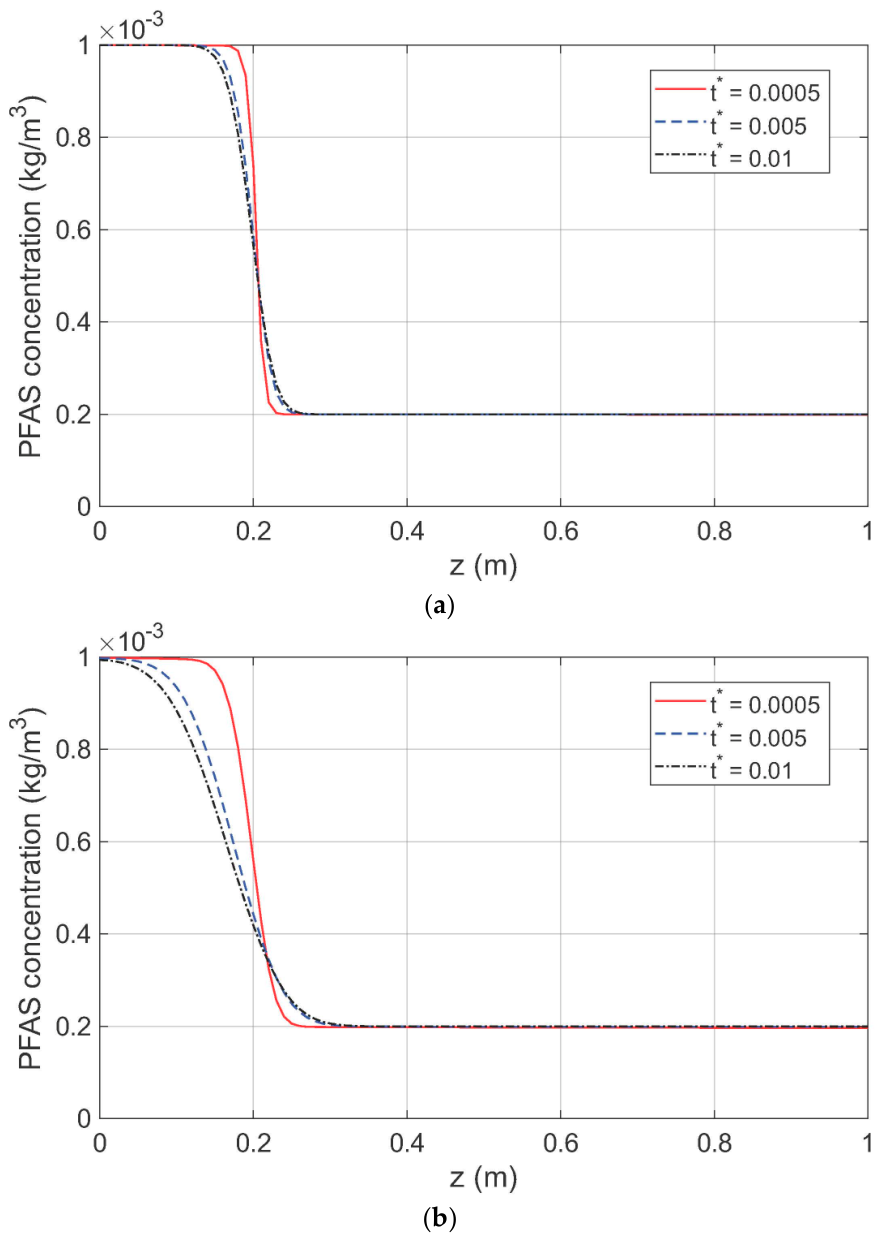
Figure 3a,b show the spatial distribution of the aqueous PFOS concentration at a higher degree of water saturation of Sw = 0.85 in the loamy sand. The PFOS concentration has a similar spatial distribution profile to that at a lower water saturation shown in Figure 2a,b. However, the reduction in PFOS concentration is much more pronounced, especially at the higher mechanical compression of 3 MPa shown in Figure 3b. At a compression of 3 MPa and a dimensionless time of t* = 0.01, Figure 3b shows that in the topsoil, the PFOS concentration drops to 81% of the initial value at a depth of z = 0.12 m, to 62% of the initial value at z = 0.16 m, and to 42% of the initial value at the topsoil–subsoil interface (z = 0.2 m). The PFOS concentration reduction from the initial value in the topsoil is mostly due to advection, i.e., the mechanical compression induced pore water flow to the drained top surface, although a much smaller amount of PFOS moves to the subsoil via diffusion. The mechanical load is more effective to drive PFOS migration to the surface of the soil with higher water content.
Figure 3.
(a) Vertical distribution of the aqueous PFOS concentration at a water saturation of Sw = 0.85 in a loamy sand (σ0 = 0.5 MPa). (b) Vertical distribution of the aqueous PFOS concentration at a water saturation of Sw = 0.85 in a loamy sand (σ0 = 3.0 MPa).
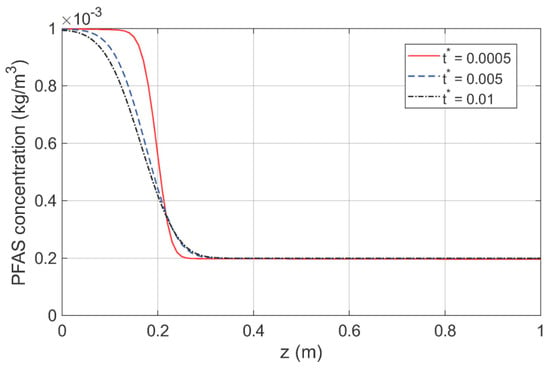
Figure 4 shows the spatial distribution of the aqueous PFOS concentration in the loamy sand at a lower residual water saturation of Srw = 0.09. Other parameters are the same as those in Figure 3b. The purpose is to examine the sensitivity of the PFOS concentration to the residual water saturation. Figure 4 indicates that a 20% reduction in the residual water saturation (from 0.11 in Figure 3b) does not affect the PFOS concentration distribution. For example, at a dimensionless time of t* = 0.01, the PFOS concentration is 0.884378 × 10⁻³ kg/m3 at z = 0.1 m, 0.674646 × 10⁻³ kg/m3 at z = 0.15 m, and 0.418625 × 10⁻³ kg/m3 at z = 0.2 m (topsoil–subsoil interface). These concentration values are essentially the same as those for Srw = 0.11 at the respective locations in Figure 3b. Similar results are obtained for a 20% higher residual water saturation, which are not shown.
Figure 4.
Vertical distribution of the aqueous PFOS concentration at a water saturation of Sw = 0.85 in a loamy sand (Srw = 0.09, σ0 = 3.0 MPa).
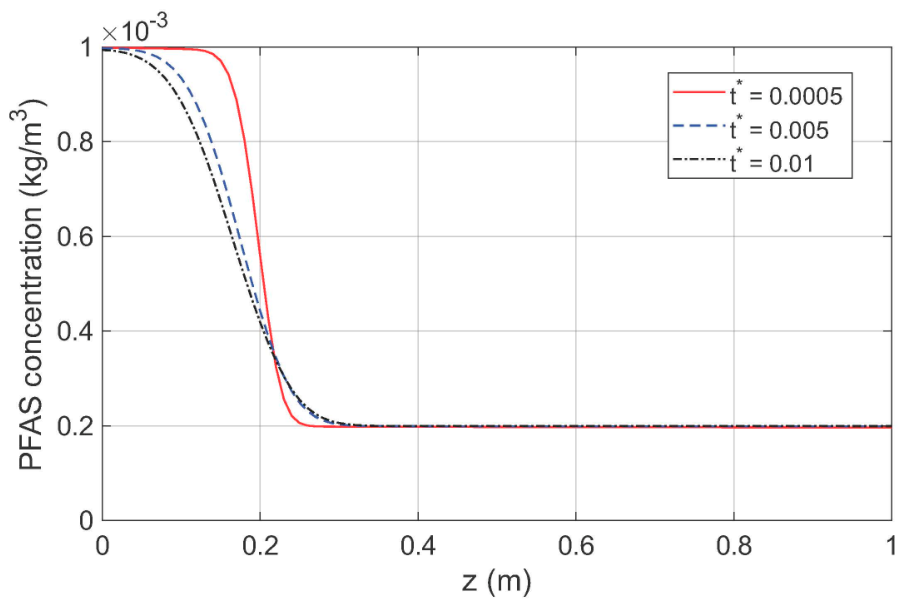
Figure 5 shows the spatial distribution of the aqueous PFOS concentration in the loamy sand at a smaller dispersivity of αL = 0.037 m. Other parameters are the same as those in Figure 3b. The aim is to examine the sensitivity of the PFOS concentration to the dispersion characteristic parameter. Figure 5 indicates that a 20% reduction in the dispersivity (from 0.046 m in Figure 3b) does not significantly influence the PFOS concentration distribution. For example, at a dimensionless time of t* = 0.01, the PFOS concentration is 0.905206 × 10⁻³ kg/m3 at z = 0.1 m, 0.684950 × 10⁻³ kg/m3 at z = 0.15 m, and 0.403114 × 10⁻³ kg/m3 at z = 0.2 m (topsoil–subsoil interface). These concentration values compare to those of 0.884377 × 10⁻³ kg/m3 at z = 0.1 m, 0.674648 × 10⁻³ kg/m3 at z = 0.15 m, and 0.418625 × 10⁻³ kg/m3 at z = 0.2 m for αL = 0.046 m in Figure 3b. The differences are less than 4%, much smaller than the 20% difference in the dispersivity value. Similar differences are obtained for a 20% higher dispersivity, which are not shown.
Figure 5.
Vertical distribution of the aqueous PFOS concentration at a water saturation of Sw = 0.85 in a loamy sand (αL = 0.037 m, σ0 = 3.0 MPa).
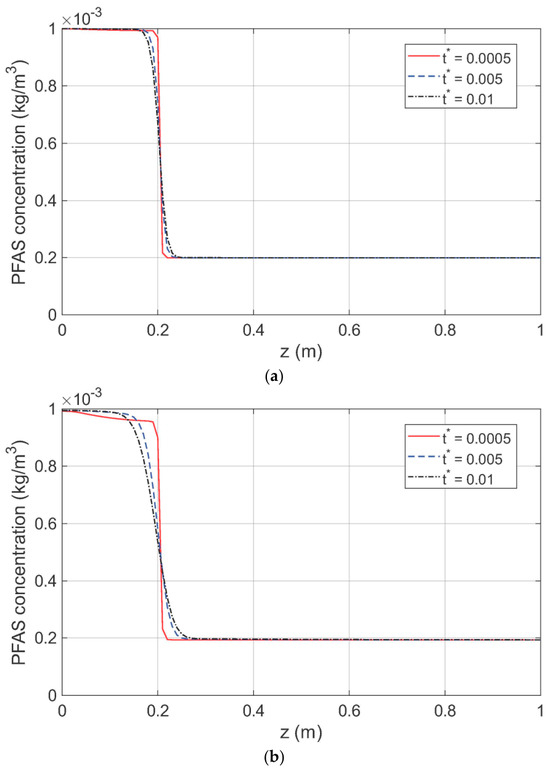
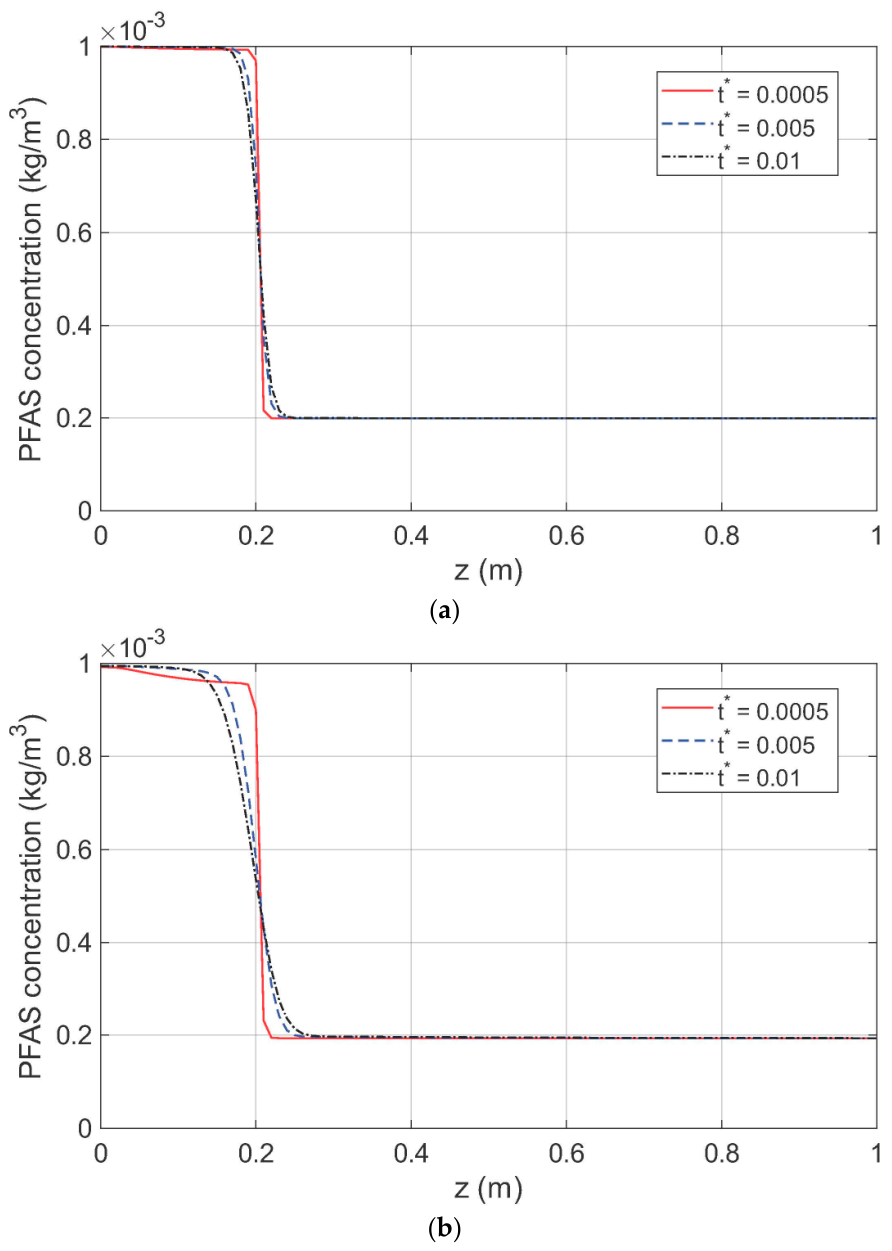
Figure 6a,b show the spatial distribution of the aqueous PFOS concentration in a different soil texture, i.e., clay loam. The degree of water saturation is taken as Sw = 0.85. Compared with the results for the loamy sand shown in Figure 3a,b, the PFOS concentration in the topsoil remains higher than that in the loamy sand under the same loading conditions indicating that a less amount of PFOS in the topsoil is transported to the top drained surface. This may be due to the lower permeability of the clay loam that results in lower water flux, and hence less amount of PFOS transported to the top drained surface due to advection.
Figure 6.
(a) Vertical distribution of the aqueous PFOS concentration at a water saturation of Sw = 0.85 in a clay loam (σ0 = 0.5 MPa). (b) Vertical distribution of the aqueous PFOS concentration at a water saturation of Sw = 0.85 in a clay loam (σ0 = 3.0 MPa).
4. Concluding Remarks
This paper presents a modified governing equation for PFAS transport in the unsaturated vadose zone by considering the contribution of soil deformation-induced pore water content variation to the PFAS mass balance. The equation couples the aqueous PFAS concentration with the mechanically induced solid deformation and pore water and air pressures. The equation together with the poroelasticity of unsaturated porous media allows a quantitative study of mechanical load-induced PFAS transport in the vadose zone. The modified transport equation is employed to study vertical PFAS transport in a soil layer under mechanical compression at the top drained surface. Numerical results of the aqueous PFOS concentration distributions in loamy sand and clay loam indicate that mechanical compression significantly influences the PFOS transport behavior. Specifically, (1) mechanical compression leads to reduced PFOS concentration in the topsoil especially at higher water saturations in the loamy sand which has a relatively higher permeability. For example, at a degree of water saturation of Sw = 0.85, the PFOS concentration at the middle of the topsoil layer reduces to 88% of the initial concentration value, and further reduces to 42% of the initial value at the topsoil–subsoil interface at a dimensionless time of 0.01 and under a mechanical compression of 3 MPa; (2) The effects of mechanical compression on the PFOS distribution in the clay loam with a lower permeability can also be observed but are not as pronounced as in the loamy sand; (3) The PFOS concentration in the subsoil which has an initially lower concentration is not significantly influenced by the mechanical compression. Based on the poroelasticity theory, mechanical compression causes the PFAS-laden pore water in the topsoil to flow to the drained top surface, which leads to reduced PFOS concentration in the topsoil by advection. In the meantime, the pore water in the subsoil with lower PFAS concentration flows into the topsoil thereby diluting the solvent in the pores of the topsoil.
The above quantitative conclusions on the effect of mechanical compression on the PFAS transport behavior are based on the assumptions of a 1D model of fluid and PFOS transport in the vertical direction, linear poroelasticity, small spatial perturbations of water saturation and PFAS concentration, and equilibrium adsorption of PFOS. The numerical PFAS concentration solution in this study can thus be regarded as a first-order approximation considering the above assumptions. Future improvements of the model include consideration of 3D fluid and PFAS transport, nonlinear poromechanical behavior of soil, nonuniform degree of water saturation, and nonequilibrium PFAS adsorption.
Understanding the behavior of PFAS transport in porous media under mechanical loads is of importance to the overall design of PFAS remediation measures and groundwater contamination prevention. The PFAS transport equation considering the soil deformation effect presented in this paper provides a theoretical tool for investigating PFAS transport in the soil near the contaminated sites subjected to various mechanical loads. The theoretical framework and numerical results presented in this paper may be further explored to develop new technologies for PFAS risk assessment and remediation strategies.
Funding
This work was supported in part by the USDA Agricultural Research Service (agreement 58-8030-4-015).
Data Availability Statement
Data is contained within the article.
Acknowledgments
The author thanks three anonymous reviewers for their helpful comments on improving upon the presentation of the work.
Conflicts of Interest
The author declares no conflicts of interest.
References
- Strynar, M.; Lindstrom, A.; Nakayama, S.; Egeghy, P.; Helfant, L. Pilot scale application of a method for the analysis of perfluorinated compounds in surface soils. Chemosphere 2012, 86, 252–257. [Google Scholar] [CrossRef] [Scilit] [PubMed]
- Anderson, R.H.; Long, G.C.; Porter, R.C.; Anderson, J.K. Occurrence of select perfluoroalkyl substances at U.S. Air Force aqueous film-forming foam release sites other than fire-training areas: Field-validation of critical fate and transport properties. Chemosphere 2016, 150, 678–685. [Google Scholar] [CrossRef] [Scilit] [PubMed]
- Brusseau, M.L.; Anderson, R.H.; Guo, B. PFAS concentrations in soils: Background levels versus contaminated sites. Sci. Total Environ. 2020, 740, 140017. [Google Scholar] [CrossRef] [Scilit] [PubMed]
- Abunada, Z.; Alazaiza, M.Y.D.; Bashir, M.J.K. An Overview of Per- and Polyfluoroalkyl Substances (PFAS) in the Environment: Source, Fate, Risk and Regulations. Water 2020, 12, 3590. [Google Scholar] [CrossRef] [Scilit]
- Swain, E.D.; Landmeyer, J.E.; Singletary, M.A.; Provenzano, S.E. Insight into Sources of Benzene, TCE, and PFOA/PFOS in Groundwater at Naval Air Station Whiting Field, Florida, through Numerical Particle-Tracking Simulations. Hydrology 2024, 11, 37. [Google Scholar] [CrossRef] [Scilit]
- Carter, L.J.; Mordechay, E.B.; Chefetz, B.; Chen, Z.; Cui, X.; Gan, J.; Li, H.; Moores, A.; Gao, X. Contaminants of emerging concern in agricultural soils: Current understanding, overlooked issues, and future priorities. Plants People Planet 2026, 8, 792–810. [Google Scholar] [CrossRef] [Scilit]
- Fenton, S.E.; Ducatman, A.; Boobis, A.; DeWitt, J.C.; Lau, C.; Ng, C.; Smith, J.S.; Roberts, S.M. Per- and polyfluoroalkyl substance toxicity and human health review: Current state of knowledge and strategies for informing future research. Environ. Toxicol. Chem. 2021, 40, 606–630. [Google Scholar] [PubMed]
- Guo, B.; Brusseau, M.L. Challenges and opportunities for porous media research to address PFAS groundwater contamination. InterPore J. 2024, 1, ipj240824. [Google Scholar] [CrossRef] [Scilit]
- Shin, H.-M.; Ryan, P.B.; Vieira, V.M.; Bartell, S.M. Modeling the air–soil transport pathway of perfluorooctanoic acid in the mid-Ohio Valley using linked air dispersion and vadose zone models. Atmos. Environ. 2012, 51, 67–74. [Google Scholar] [CrossRef] [Scilit]
- Shin, H.-M.; Vieira, V.M.; Ryan, P.B.; Detwiler, R.; Sanders, B.; Steenland, K.; Bartell, S.M. Environmental fate and transport modeling for perfluorooctanoic acid emitted from the Washington Works Facility in West Virginia. Environ. Sci. Technol. 2011, 45, 1435–1442. [Google Scholar] [CrossRef] [Scilit] [PubMed]
- Brusseau, M.L. Simulating PFAS transport influenced by rate-limited multi-process retention. Water Res. 2020, 168, 115179. [Google Scholar] [CrossRef] [Scilit] [PubMed]
- Guo, B.; Zeng, J.; Brusseau, M.L. A mathematical model for the release, transport, and retention of per- and polyfluoroalkyl substances (PFAS) in the vadose zone. Water Resour. Res. 2020, 56, e2019WR026667. [Google Scholar] [CrossRef] [Scilit] [PubMed]
- Richards, L.A. Capillary conduction of liquids through porous mediums. Physics 1931, 1, 318–333. [Google Scholar] [CrossRef] [Scilit]
- Zeng, J.; Guo, B. Multidimensional simulation of PFAS transport and leaching in the vadose zone: Impact of surfactant-induced flow and subsurface heterogeneities. Adv. Water Resour. 2021, 155, 104015. [Google Scholar] [CrossRef] [Scilit]
- Biesek, B.J.; Szymkiewicz, A.; Simůnek, J.; Gumuła-Kawęcka, A.; Jaworska-Szulc, B. Numerical modeling of PFAS movement through the vadose zone: Influence of plant water uptake and soil organic carbon distribution. Sci. Total Environ. 2024, 935, 173252. [Google Scholar] [CrossRef] [Scilit] [PubMed]
- Wang, H.F. Theory of Linear Poroelasticity; Princeton University Press: Princeton, NJ, USA, 2000. [Google Scholar]
- Fetter, C.W. Contaminant Hydrogeology; Macmillan Publishing Company: New York, NY, USA, 1993. [Google Scholar]
- Cheng, A.H.D. A linear constitutive model for unsaturated poroelasticity by micromechanical analysis. Int. J. Numer. Anal. Methods Geomech. 2020, 44, 455–483. [Google Scholar]
- Jin, Z.H. Consolidation of surfactant-laden unsaturated porous media. Forces Mech. 2026, 24, 100375. [Google Scholar] [CrossRef] [Scilit]
- Li, P.; Schanz, M. Time domain boundary element formulation for partially saturated poroelasticity. Eng. Anal. Bound. Elem. 2013, 37, 1483–1498. [Google Scholar] [CrossRef] [Scilit]
- Van Genuchten, M.T. A closed-form equation for predicting the hydraulic conductivity of unsaturated soils. Soil Sci. Soc. Am. J. 1980, 44, 892–898. [Google Scholar] [CrossRef] [Scilit]
- Mualem, Y. A new model for predicting the hydraulic conductivity of unsaturated porous media. Water Resour. Res. 1976, 12, 513–522. [Google Scholar] [CrossRef] [Scilit]
- Vogel, T.; van Genuchten, M.T.; Cislerova, M. Effect of the shape of the soil hydraulic functions near saturation on variably-saturated flow predictions. Adv. Water Resour. 2001, 24, 133–144. [Google Scholar] [CrossRef] [Scilit]
- Oh, S.; Kim, Y.K.; Kim, J.-W. A Modified van Genuchten-Mualem Model of Hydraulic Conductivity in Korean Residual Soils. Water 2015, 7, 5487–5502. [Google Scholar] [CrossRef] [Scilit]
- Biot, M.A. General theory of three-dimensional consolidation. J. Appl. Phys. 1941, 12, 155–164. [Google Scholar] [CrossRef] [Scilit]
- Bear, J.; Cheng, A.H.D. Modeling Groundwater Flow and Contaminant Transport; Springer: London, UK, 2010. [Google Scholar]
- Kim, H.; Rao, P.S.C.; Annable, M.D. Determination of effective air-water interfacial area in partially saturated porous media using surfactant adsorption. Water Resour. Res. 1997, 33, 2705–2711. [Google Scholar] [CrossRef] [Scilit]
- Xu, M.; Eckstein, Y. Use of weighted least-squares method in evaluation of the relationship between dispersivity and field scale. Groundwater 1995, 33, 905–908. [Google Scholar] [CrossRef] [Scilit]
- Lo, W.C.; Lee, J.W. Effect of water content and soil texture on consolidation in unsaturated soils. Adv. Water Resour. 2015, 82, 51–69. [Google Scholar] [CrossRef] [Scilit]
- Rawls, W.J.; Ahuja, L.R.; Brakensiek, D.L. Estimating soil hydraulic properties from soils data. In Proceedings of the International Workshop on Indirect Methods for Estimating the Hydraulic Properties of Unsaturated Soils, Riverside, CA, USA, 11–13 October 1989; pp. 329–340. [Google Scholar]
- Ochsner, T. Rain or Shine: An Introduction to Soil Physical Properties and Processes; Oklahoma State University: Stillwater, OK, USA, 2019. [Google Scholar]
- Brusseau, M.L.; Khan, N.; Wang, Y.; Yan, N.; Van Glubt, S.; Carroll, K.C. Nonideal transport and extended elution tailing of PFOS in soil. Environ. Sci. Technol. 2019, 53, 10654–10664. [Google Scholar] [CrossRef] [Scilit] [PubMed]
- Reddy, K.R. Engineering Properties of Soils Based on Laboratory Testing; University of Illinois at Chicago: Chicago, IL, USA, 2002. [Google Scholar]
- Kukharets, S.; Zabrodskyi, A.; Sheludchenko, B.; Jasinskas, A.; Domeika, R.; Šarauskis, E. Assessment of changes in soil contact stress depending on tractor tire parameters. Sci. Rep. 2025, 15, 172. [Google Scholar] [CrossRef] [Scilit] [PubMed]

Disclaimer/Publisher’s Note: The statements, opinions and data contained in all publications are solely those of the individual author(s) and contributor(s) and not of MDPI and/or the editor(s). MDPI and/or the editor(s) disclaim responsibility for any injury to people or property resulting from any ideas, methods, instructions or products referred to in the content. |
© 2026 by the author. Licensee MDPI, Basel, Switzerland. This article is an open access article distributed under the terms and conditions of the Creative Commons Attribution (CC BY) license.