


Abstract
Uncertainty in soil hydraulic properties is a major source of hydrological and flood-modeling error, especially in data-scarce, heterogeneous arid soils. In ephemeral stream watersheds, infiltration strongly controls runoff generation and flash-flood response, yet soil parameters are often treated as deterministic, ignoring their inherent variability. This study characterizes the probabilistic and spatial variability of infiltration-related soil hydraulic parameters using in situ double-ring infiltration tests at 25 sites in Jazan Province, Saudi Arabia, during a single field campaign. Data were interpreted using the Horton, Philip, and Green–Ampt models to estimate hydraulic conductivity (K), storage suction factor (ΨΔθ), and soil sorptivity (Sp), with distributions selected via the Kolmogorov–Smirnov (K-S) test. K showed high, log-normal variability, with means of 5.27, 4.59, and 4.92 m/day (CV = 1.21, 1.34, 1.29), respectively; ΨΔθ was even more variable (mean = 0.09 m, CV = 1.63, log-normal), while Sp was less variable (mean = 0.47 m/day0.5, CV = 0.66, Gamma). Directional variogram analysis revealed anisotropic spatial structure, with short along-coast ranges (~4–10 km) and weaker inland structure, supporting nearly independent sites. The novelty lies in the statistically robust, previously unreported probability and spatial-correlation models for infiltration parameters in arid ephemeral streams, enabling direct use in stochastic watershed modeling.
1. Introduction
Accurate representation of soil hydraulic properties is a critical factor in hydrological and flood modeling, particularly in arid and semi-arid regions where soils are highly heterogeneous and field observations are scarce. In ephemeral stream watersheds, infiltration processes strongly influence runoff generation and flash flood response. However, most hydrological models rely on deterministic soil parameters, neglecting the inherent spatial variability and uncertainty of key hydraulic properties. This simplification can lead to substantial errors in predicting runoff, peak discharge, and flood risk because parameter uncertainty often propagates through to large variability in model outputs [1,2].
Soil hydraulic properties can be obtained through direct laboratory and field measurements. Moreover, they can be estimated using various methods, among which infiltration models are considered the most important for interpreting infiltration data. Several field measurement techniques can be used to determine soil hydrological parameters, including double-ring and single-ring infiltrometers and tension permeameters [3,4]. The double-ring infiltrometer is a relatively accurate technique [5,6]. Measuring soil hydrological parameters in undisturbed soil can be challenging in gravelly, rocky, and sandy soils due to the challenges of undisturbed soil sampling. The most popular method of taking a soil sample is driving a cylinder into the ground. However, in gravelly soil, this can result in the displacement of rock fragments or the destruction and compaction of soil channels, which can cause measurement errors [7,8]. Vertical variability in alluvial soil affects the estimation of hydraulic parameters, which may vary substantially between soil layers [9]. However, deeper soil and vertical variability have received little attention [10,11]. Because of the challenges associated with field measurement and sampling, which necessitate lengthy and highly labor-intensive fieldwork [12].
Hydraulic conductivity (K) is one of the most important soil hydrological parameters widely used in hydrological studies. Several studies estimated hydraulic conductivity using infiltration models from infiltration data measured in the field, e.g., [13,14,15,16,17]. Also, Hydraulic conductivity is one of the most important parameters in wadi hydrology and hydrological modeling, as it plays an important role in hydrological processes such as soil moisture storage and runoff [12,18]. Ref. [19] estimated the soil hydraulic conductivity in the field using three devices: a mini-disk infiltrometer, a modified Philip–Dunne infiltrometer, and a double-ring infiltrometer to compare their accuracy. The results showed that the double-ring infiltrometer obtained the most accurate estimate of hydraulic conductivity. Also, Ref. [13] gathered data from field and laboratory testing conducted in India and the USA to examine and contrast 14 infiltration models. The outcomes demonstrated that the Holtan, Horton, and Singh-Yu models outperform the other models in performance. Furthermore, four infiltration models were investigated by [14]: Horton, Philip, SCS, and Morel-Seytoux. Fourteen events were used to validate the models after they had been calibrated. According to the results, the Morel-Seytoux model outperformed the other models, while the SCS model produced the worst outcomes. It has been demonstrated that Horton’s model performs more consistently than the Philip model. Additionally, Ref. [15] evaluates five infiltration models: Green–Ampt, Horton, Phillip, Holtan, and Kostiakov, to identify the model that best forecasts infiltration rates based on simulated rainfall events at two locations. Parameters were developed using measured infiltration data and analyses of soil samples in the laboratory. The best estimates of infiltration rates were given by the Green–Ampt, Holtan, and Philip models, respectively.
Several studies have used statistical criteria to determine the best-performing infiltration model. Ref. [16] evaluated three infiltration models: Kostiakov, Modified Kostiakov, and SCS, to assess infiltration rates in the Kurukshetra district of Haryana, India. A total of 109 observations were gathered from infiltration testing utilizing the double-ring filtration gauge at ten locations. Also, a novel infiltration model was developed from field test data using a nonlinear regression model. Statistical criteria were applied to compare infiltration models to select the best-performing model. The results showed that the novel infiltration model is the most appropriate to estimate the infiltration rate. Moreover, Ref. [17] compared the Philip, Kostiakov, modified Kostiakov, and novel infiltration models to assess the rates of infiltration of Davood Rashid, Kelat, and Honam in Iran. A total of 155 observations were gathered by conducting field infiltration tests at 16 locations using a double-ring infiltrometer. To determine the best-performing model, a statistical comparison was used. Although a new infiltration model is proposed, the results indicate that there are no significant differences between traditional and soft computing-based infiltration models.
Despite the importance of soil variability, few studies have systematically quantified the statistical characteristics of infiltration parameters in arid ephemeral streams. Existing research often focuses on temperate or humid regions or reports single-case measurements without establishing robust probability distributions for model input. Spatial variability of soil hydraulic conductivity and related properties is well documented, with coefficients of variation often exceeding unity in field studies, indicating high heterogeneity [1,20]. This lack of statistical characterization limits the ability to incorporate uncertainty in stochastic hydrological and flood modeling frameworks. In several basins of the Kingdom of Saudi Arabia (KSA), some researchers have obtained soil parameters by performing infiltration tests utilizing a double-ring infiltrometer to model infiltration test data with infiltration models. For example, Ref. [21] used an artificial infiltration experiment to mimic the natural infiltration process that occurs during floods in the Tabalah basin, which is located in the southwest of the Kingdom of Saudi Arabia. They employed two infiltration models, UNSAT1 and CHEMFLOW, which were derived from the numerical solution of the one-dimensional unsaturated Richards equation. A neutron probe and a double-ring infiltrometer were used to gather field data from several sites in the Tabalah basin. The results demonstrated a correlation between the field infiltration data and the simulation results. Furthermore, Ref. [22] estimated the parameters of the ephemeral channel bed and flood risk by conducting infiltration tests in the alluvium of Wadi Itwad in southwest KSA. The infiltration tests were modeled using the Philip and Horton models. The results showed that saturated hydraulic conductivity varies greatly within one model or between the two models. Refs. [23,24] tested Horton, Philip, Green–Ampt, and Kostiakov infiltration models in beds of ephemeral streams in the Medina region of KSA. Infiltration data, in their study, were collected using double-ring infiltrometer testing at fourteen locations in the Medina region. Using simple statistical analysis, the results showed that each model’s parameters varied significantly. With just two empirical parameters, the Kostiakov model provided the best description of the fourteen infiltration tests.
Water resources in the Middle East are extremely limited; the region faces severe constraints on water availability and exhibits significant spatial and temporal variability in groundwater storage [25]. Accordingly, this research gap highlights the need for a better characterization of hydrological processes at both the regional and basin scales. Also, infiltration represents a crucial connection among episodic precipitation, runoff, soil water retention, and groundwater recharge in arid wadi systems; thus, it is necessary to quantify the spatial variability and uncertainty of infiltration-related hydraulic parameters to enhance hydrological evaluations in these environments [26]. Therefore, this study addresses the limited field-based characterization of the probability distributions and spatial variability of infiltration-related soil hydraulic parameters in arid ephemeral-stream environments. In particular, the availability of model-consistent probability distributions for hydraulic conductivity (), storage suction factor (), and soil sorptivity (), together with their directional spatial correlation, remains limited. To address these gaps, in situ double-ring infiltration tests were conducted at 25 sites along ephemeral streams in Jazan Province, Kingdom of Saudi Arabia. Three widely used infiltration models, Green–Ampt, Horton, and Philip, were applied because they represent complementary descriptions of infiltration and provide estimates of , , and . Statistical analyses were then used to quantify parameter variability and identify suitable probability distributions, while directional variogram analysis was used to characterize their spatial dependence.
The main contributions of this study are as follows:
- Probabilistic characterization: derivation and evaluation of probability distributions for , , and obtained from three commonly used infiltration models.
- Spatial characterization: quantification of directional spatial variability and identification of the principal correlation structure of these parameters.
- Integrated uncertainty assessment: combining parameter distributions and spatial correlation to provide a more complete representation of infiltration uncertainty in arid ephemeral streams.
- Modeling applicability: providing field-based statistical information that can be incorporated into stochastic watershed, flash-flood, and risk-based hydrological modeling.
The remainder of the paper is organized as follows. Section 2 describes the study area, field measurements, infiltration models, statistical distribution analysis, and directional variogram methodology. Section 3 presents the results of the infiltration analysis, probability distributions, and spatial variability assessment. Section 4 discusses the results, limitations, and identifies recommendations and directions for future research. Finally, Section 5 summarizes the main conclusions and practical implications for hydrological modeling.
2. Materials and Methods
2.1. Study Area
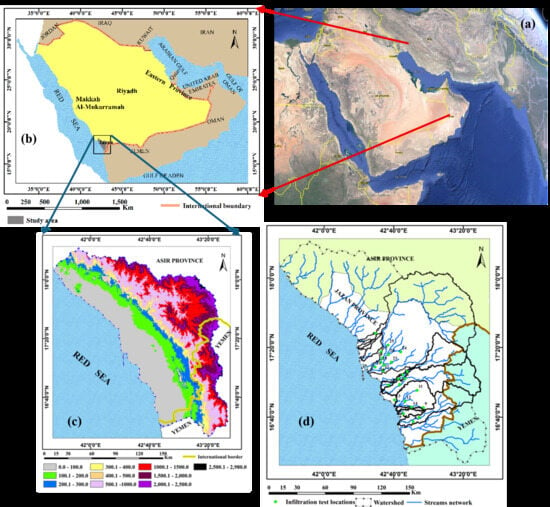
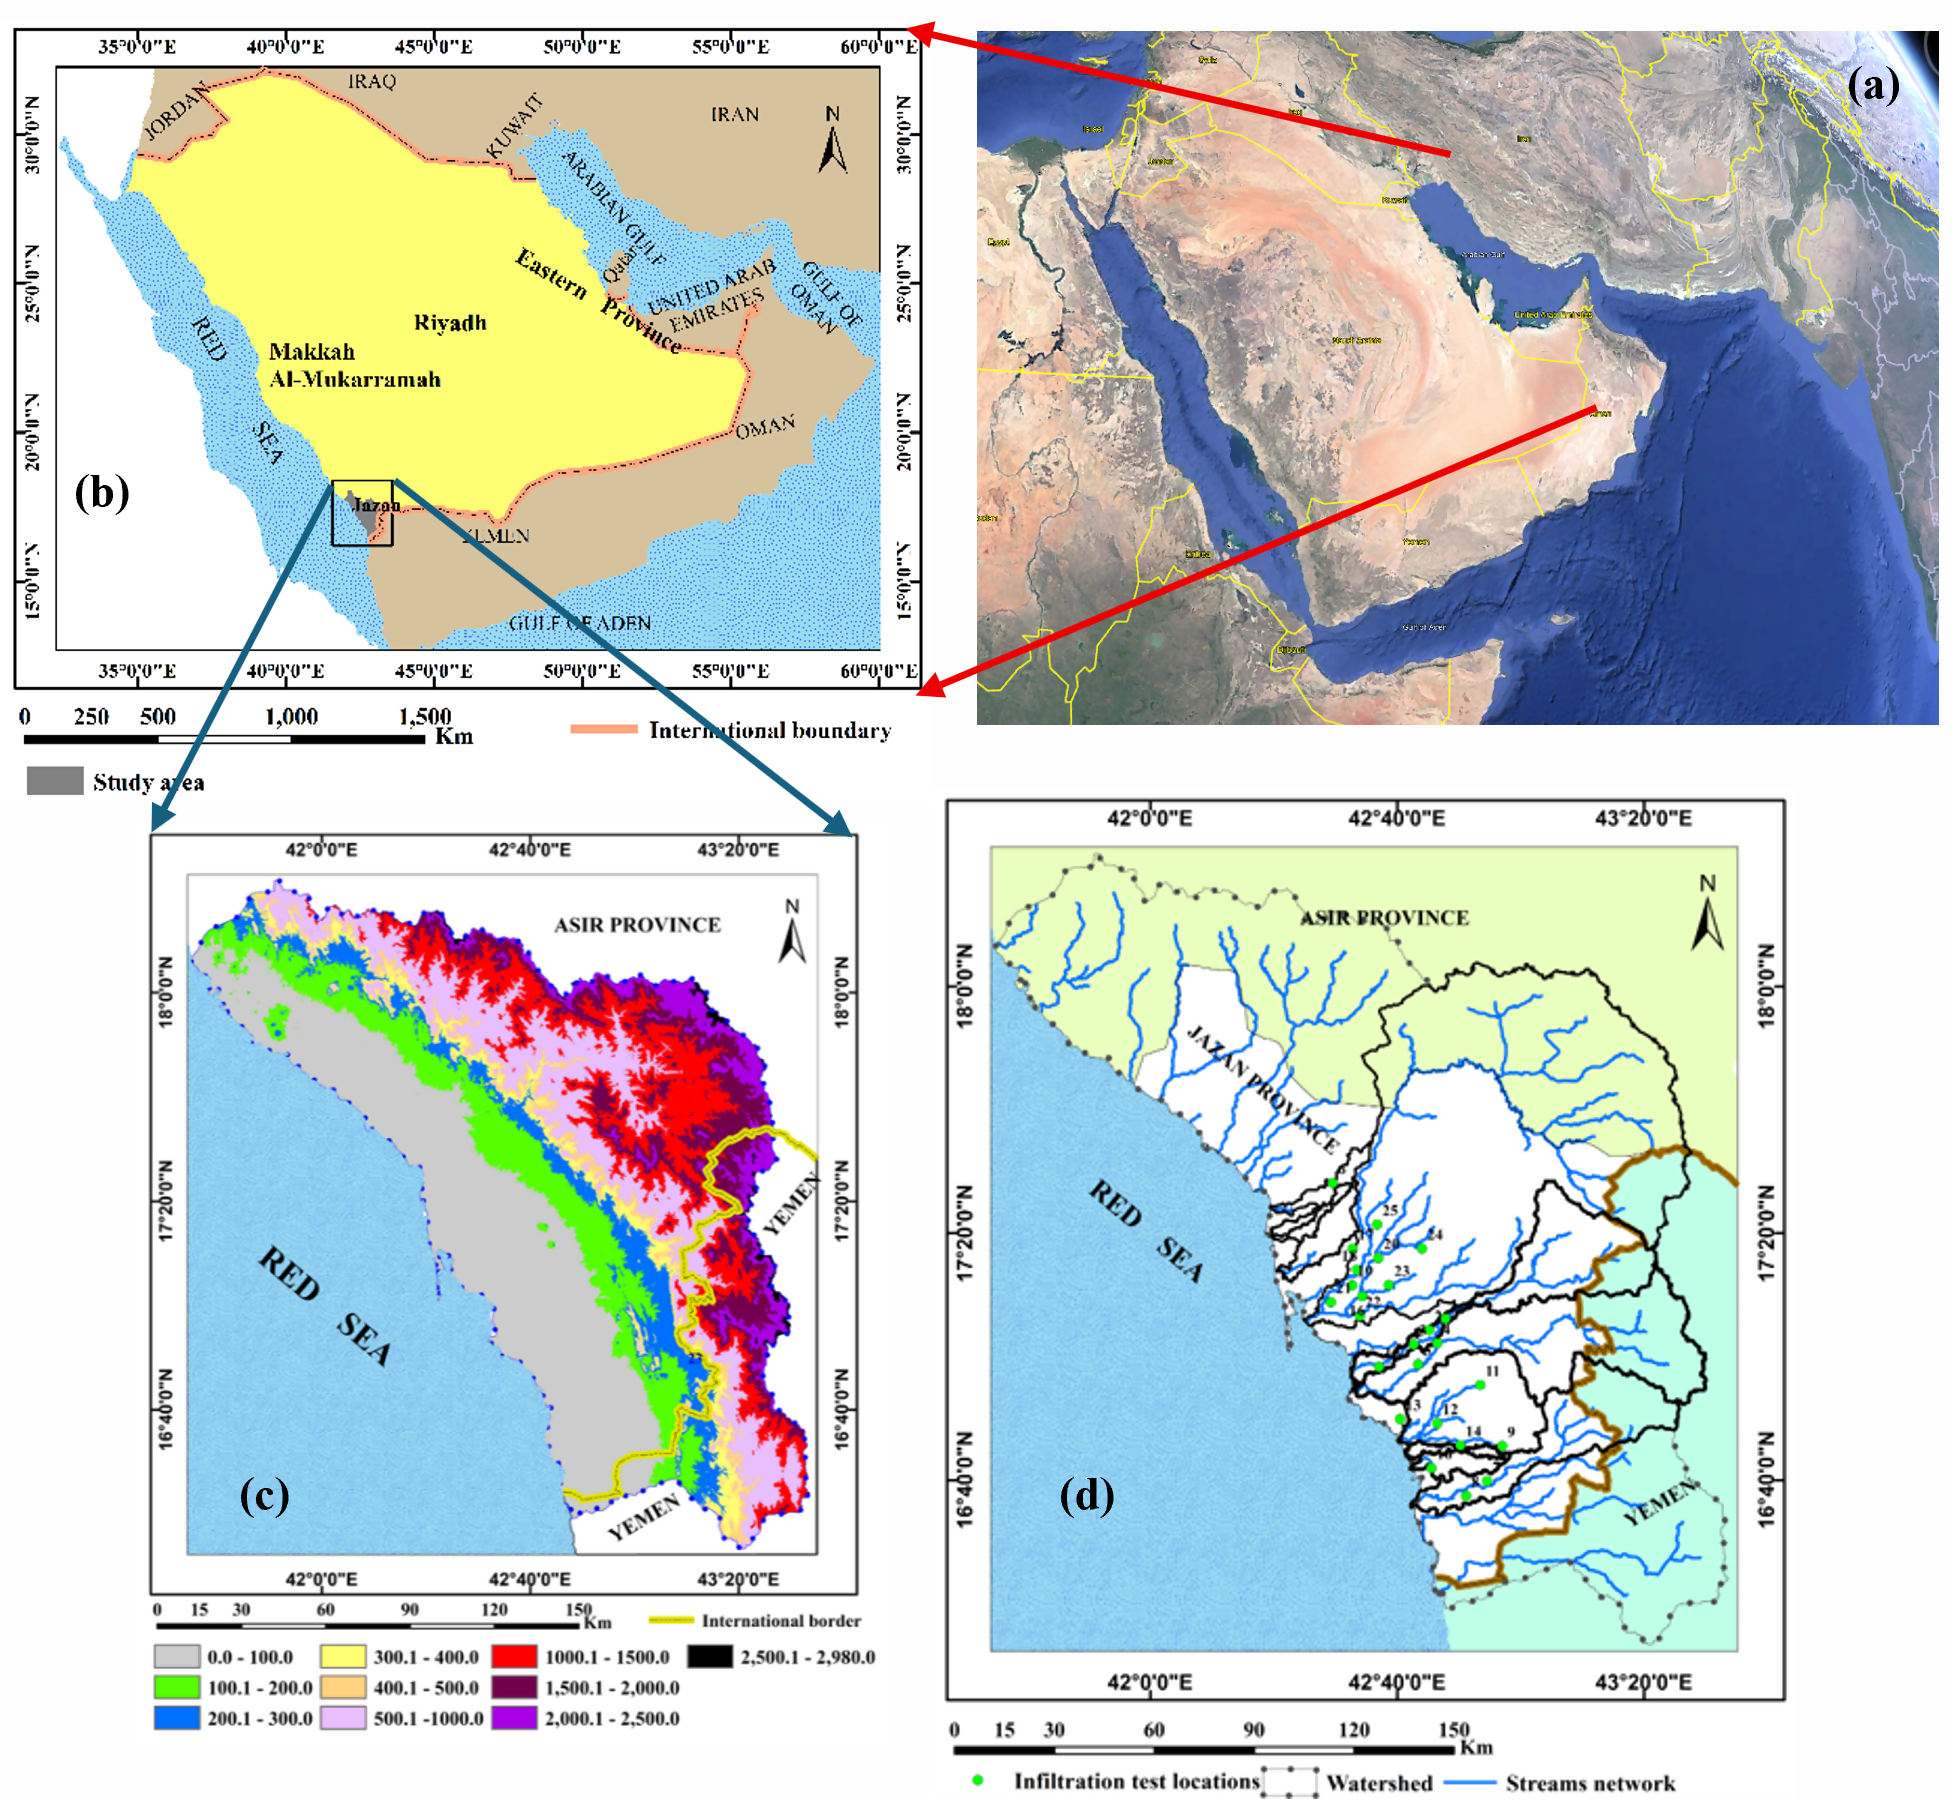
Except for the southwest, the KSA is one of the world’s driest nations. As shown in Figure 1, the study location is in Jazan Province in southwest KSA. According to [27,28], the Jazan Province is situated between latitudes 16°45′ N and 17°30′ N and longitudes 42°15′ E and 43°00′ E. It stretches 300 km just north of Yemen along the Red Sea’s southern coast. Its total area is 11,671 km2 [29]. The Jazan Province can be divided into three areas: (1) the Asir Mountains, which stretch east of the coastal plain from north to south along the Red Sea, with a sudden rise of more than 3000 m; (2) the foothills between the coastal plain and the mountain range, with an elevation ranging from 0 to 300 m above sea level; and (3) the coastal plain, which is situated between the foothills and the marshes along the coast of the Red Sea. Even though the Jazan Province receives the highest rainfall, only a small portion replenishes groundwater resources. In addition, the region receives a large amount of surface runoff from the surrounding mountainous areas; however, a large part of it is lost to the Red Sea. The average annual rainfall in the region is between 200 and 500 mm on the coastal plain and between 500 and 700 mm in the eastern highlands. It experiences year-round heat and humidity [27]. This shows the effect of topography. Spring and summer are when rainfall occurs; the average annual evaporation rate is roughly 2000 mm [28].
Figure 1.
Location map of the study area in the Jazan Province in the southwestern part of KSA: Google Earth (a), KSA (b), Digital Elevation Map (DEM) (c), and location of the infiltration tests (d).
Geologically, the Jazan Province is between the eastern boundary of the Cenozoic Red Sea basin and the western margin of the Proterozoic Arabian Shield. It consists of Precambrian rocks, which include metamorphic volcanic-sedimentary sequences in which granite and gabbro are intruded [30,31]. Moreover, about half of the Jazan Province is covered by Quaternary deposits in the coastal plain and the beds. It is made up of interbedded sand and clay, silt, cobble, and Wadi-bed gravel [28]. Additionally, alluvial deposits can range in thickness from a few meters covering lava flows to 100 m in the center. Also, the original rock in the mountain highlands is covered with a thin layer of smooth soil consisting of sand, silt, and gravel. Downstream of the basin, the thickness of the soil increases, ranging from sandy to clay loam [32].
Hydrogeologically, the Quaternary Wadi deposits (gravels, sand, silt, and heterogeneous unconsolidated cobbles) make up the shallow alluvial aquifers in Jazan [33,34]. The aquifer’s transmissivity value, which ranges from 540 to 5400 m2/day with an average of 2190 m2/day, indicates that it has good conductive and storage properties [28]. Additionally, the aquifer is recharged by infiltration through the beds from runoff and rainfall that fall directly over the high areas on the eastern and southeastern sides or by infiltration of local surface water. It has been found that the recharge rate represents between 10 and 45% of the total surface runoff [35]. The drainage system appears straight-lined, with some of its tributaries paralleling the Red Sea. The basins of drainage discharge runoff and accumulated sediments from the high mountains upstream of the basin, where the runoff crosses the coastal plain to the Red Sea [32]. Also, the coefficients of runoff range between 3.7 and 13%, and the average runoff in Wadi Dhamad and Wadi Jazan is 59.7 × 10⁶ and 80 × 106 m3/year, respectively [36]. In addition, the main Wadi channel’s width typically ranges from 100 to 1000 m [37].
2.2. Field Infiltration Tests
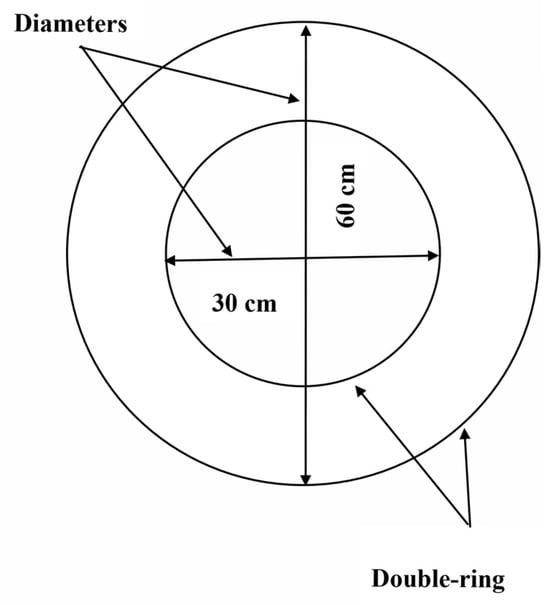
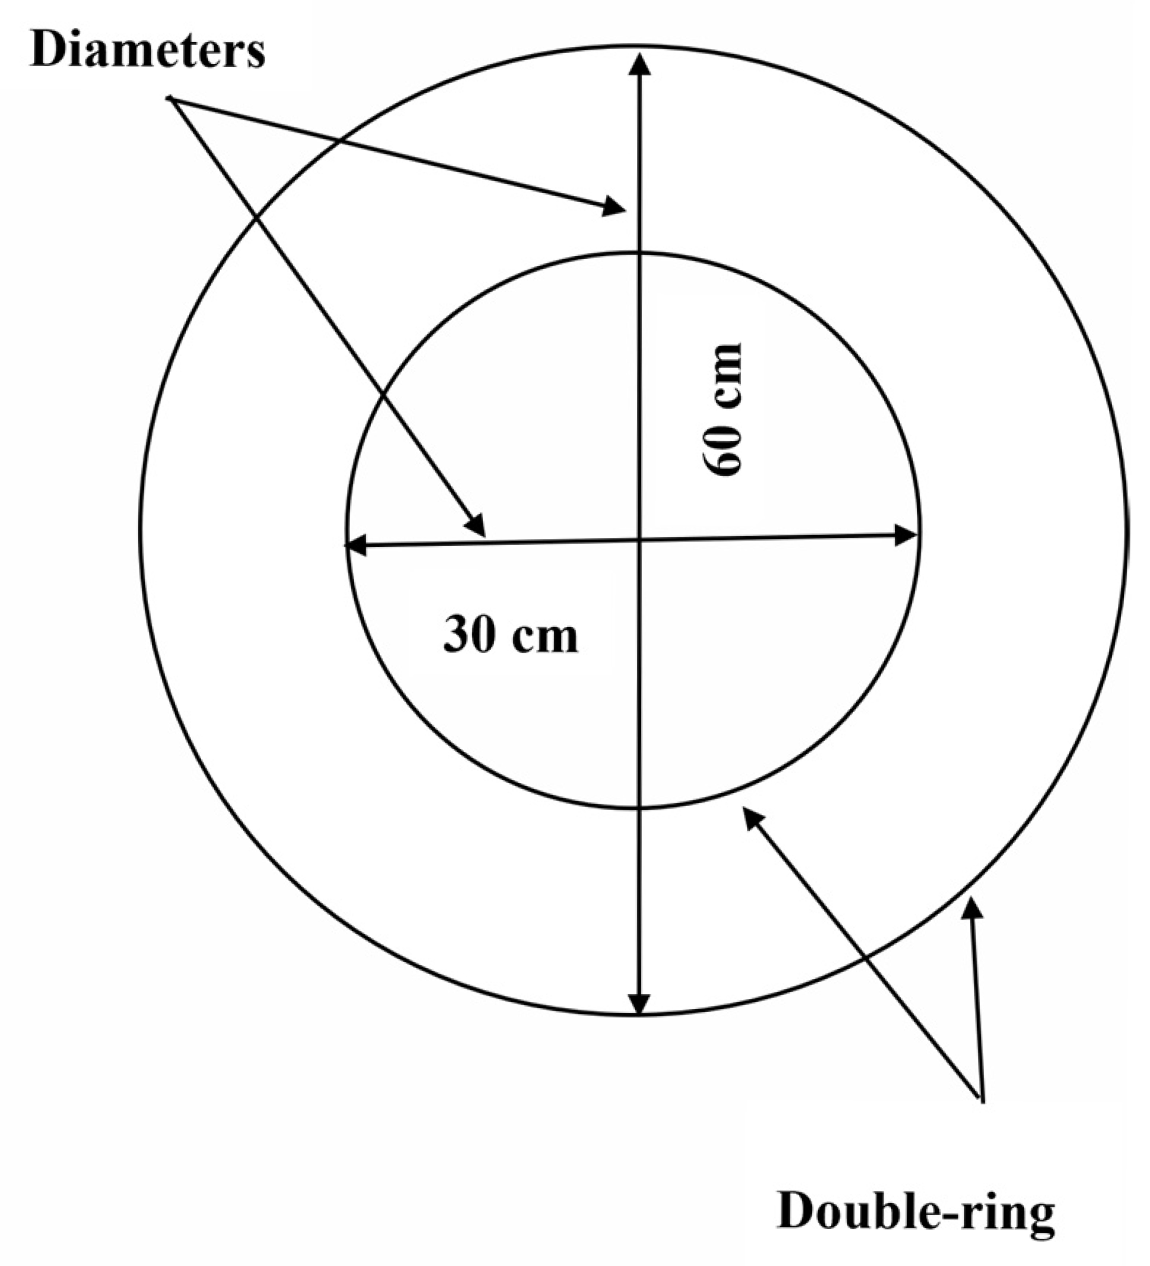
Twenty-five locations in the ephemeral stream beds of the Jazan Province basins were selected for field infiltration tests using a double-ring infiltrometer, according to the method described in the ASTM International Standard [38]. These sites were selected based on the presence of Quaternary deposits, where the recharge of the groundwater aquifer has more potential. The double-ring infiltrometer was used as shown in Figure 2.
Figure 2.
Schematic showing the dimensions of the double-ring infiltrometer.
2.3. Infiltration Models Used in the Analysis
In this study, three widely used infiltration models: Green–Ampt, Horton, and Philip are applied to estimate soil hydraulic parameters. These models were selected not only because they represent different conceptual approaches to infiltration: Green–Ampt provides a physically based wetting-front analysis, Horton captures time-dependent infiltration decay, and Philip accounts for both sorptivity and steady-state flow, but also because together they allow estimation of multiple key parameters (hydraulic conductivity, storage suction, and soil sorptivity), enabling a more comprehensive characterization of infiltration variability.
The Horton, Philip, and Green–Ampt models are among the most widely used equations in hydrological research, applications of engineering, and irrigation due to their simplicity and ability to fit field infiltration data.
2.3.1. Horton Model
The Horton infiltration formula was tested to fit the infiltration data that will be obtained. This model is given by formula [39],
where fo is the initial infiltration rate, fc is the ultimate infiltration rate (equilibrium infiltration rate after the soil has been saturated), and k is the decay coefficient. The Horton cumulative infiltration depth F(t) is given by
The least squares method (LSM) is used by the following function to estimate the parameters fo, fc, and k:
where is the observed cumulative infiltration (cm), ti is the time corresponding to the observed cumulative infiltration (min), and n is the number of observations.
2.3.2. Philip Model
The Philip infiltration formula is given by [40]
where f(t) is the infiltration rate at time t, Sp is the soil sorptivity, Kp is the hydraulic conductivity of the soil, and t is the time since infiltration started. The Philip cumulative infiltration depth F(t) is given by
The least squares method (LSM) is used to estimate the parameters Sp and Kp:
2.3.3. Green–Ampt Model
The Green–Ampt infiltration formula is expressed as [41],
where K1 is the saturated hydraulic conductivity of the soil, ψ is the matric potential, Δθ is the change in volumetric water content from the initial water content to the porosity, and F(t) is the cumulative infiltration depth. The Green–Ampt cumulative infiltration depth F(t) is expressed as
To estimate the parameters K1, ψ and Δθ, the least squares method (LSM) is used. The formula is expressed as
The LSM was applied using the Excel solver in Microsoft Excel. The application of the optimized procedure in the Excel solver provides for finding parameters.
2.4. The Statistical Analysis
To quantify the variability of the estimated soil hydraulic parameters, descriptive statistics were first calculated, including the arithmetic mean, median, standard deviation (SD), variance, skewness, kurtosis, and coefficient of variation (CV). In addition, several probability distributions, normal, log-normal, Gumbel, Gamma, Beta, and Exponential (Table 1), were evaluated to represent the data. These distributions were selected based on their mathematical properties and their common application in hydrological and soil studies. The normal distribution is suitable for parameters with symmetric variability around the mean, while the log-normal distribution is appropriate for positively skewed variables such as hydraulic conductivity, which cannot be negative and often spans several orders of magnitude. The Gamma and Beta distributions offer flexibility for skewed or bounded data, whereas the Gumbel distribution is commonly used in extreme value analyses. The exponential distribution is suitable for parameters representing rates or waiting times.
Table 1.
Summary of common probability density function formulas (pdf) for distributions used in the analysis.
By testing multiple candidate distributions, the best-fitting probability model was identified for each parameter, providing a statistically robust characterization of variability. This approach enables the derived distributions to be directly applied in stochastic hydrological and flood modeling frameworks, allowing a realistic representation of the inherent uncertainty in soil hydraulic properties.
2.5. Test of the Best Distribution That Fits the Data
Kolmogorov–Smirnov Test (K-S Test)
This test compares the cumulative distribution function of a specified distribution and the empirical cumulative distribution function for a sample size n. The K-S test [42,43] looks at the max difference as given by
where is the assumed cumulative distribution function with parameters , and is the empirical cumulative distribution function. The suitable distribution is selected by comparing the K-S sample values and the K-S critical value. When the K-S statistic is lower than the K-S critical value, it indicates that the sample distribution closely fits the reference distribution.
2.6. Directional Variogram Analysis of the Soil Parameters
Principal component analysis (PCA) of the 25 site locations indicated that 91.8% of the spatial variance is aligned with N155° E, approximately parallel to the Jazan coastline, while the remaining 8.2% lies along the orthogonal N65° E axis toward the Asir foothills. The 300 unique site pairs were assigned to the direction whose connecting vector was closest to either axis (±45° sectors), yielding 244 along-coast and 56 inland pairs. For each of the 7 infiltration parameters, there are experimental semi-variances,
where is the empirical semi-variogram at separation distance ; and are the parameter values at sites and , respectively; and n(h) is the no. of pairs with lag h.
The semi-variogram was calculated for each directional subset and grouped into distance-lag classes. Eight lag classes were used along the coast and five inland, reflecting the smaller number of inland pairs. Lag semi-variances were weighted by the number of contributing pairs. An exponential variogram model was fitted separately for each direction using weighted non-linear least squares. The variogram model has the form
where is the model semi-variogram, is the nugget, is the partial sill, is the total sill, and is the fitted range.
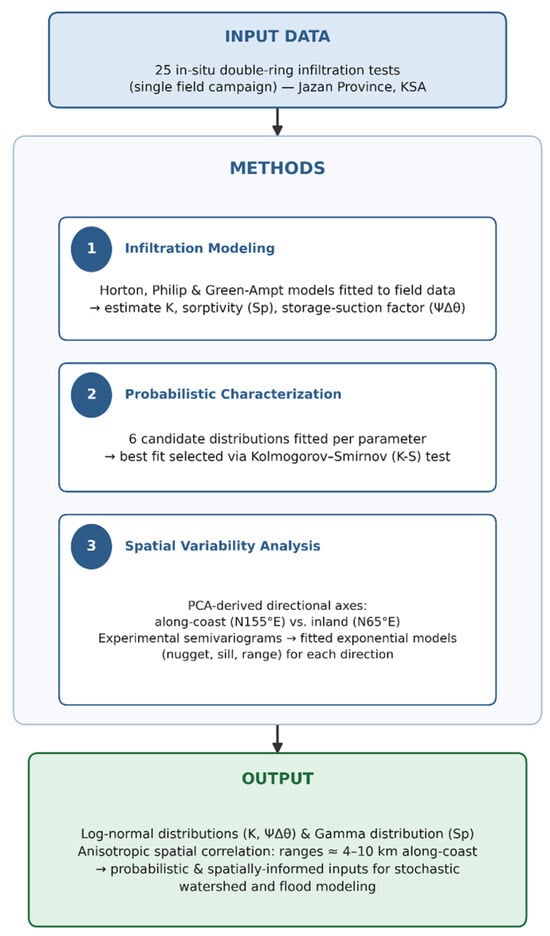
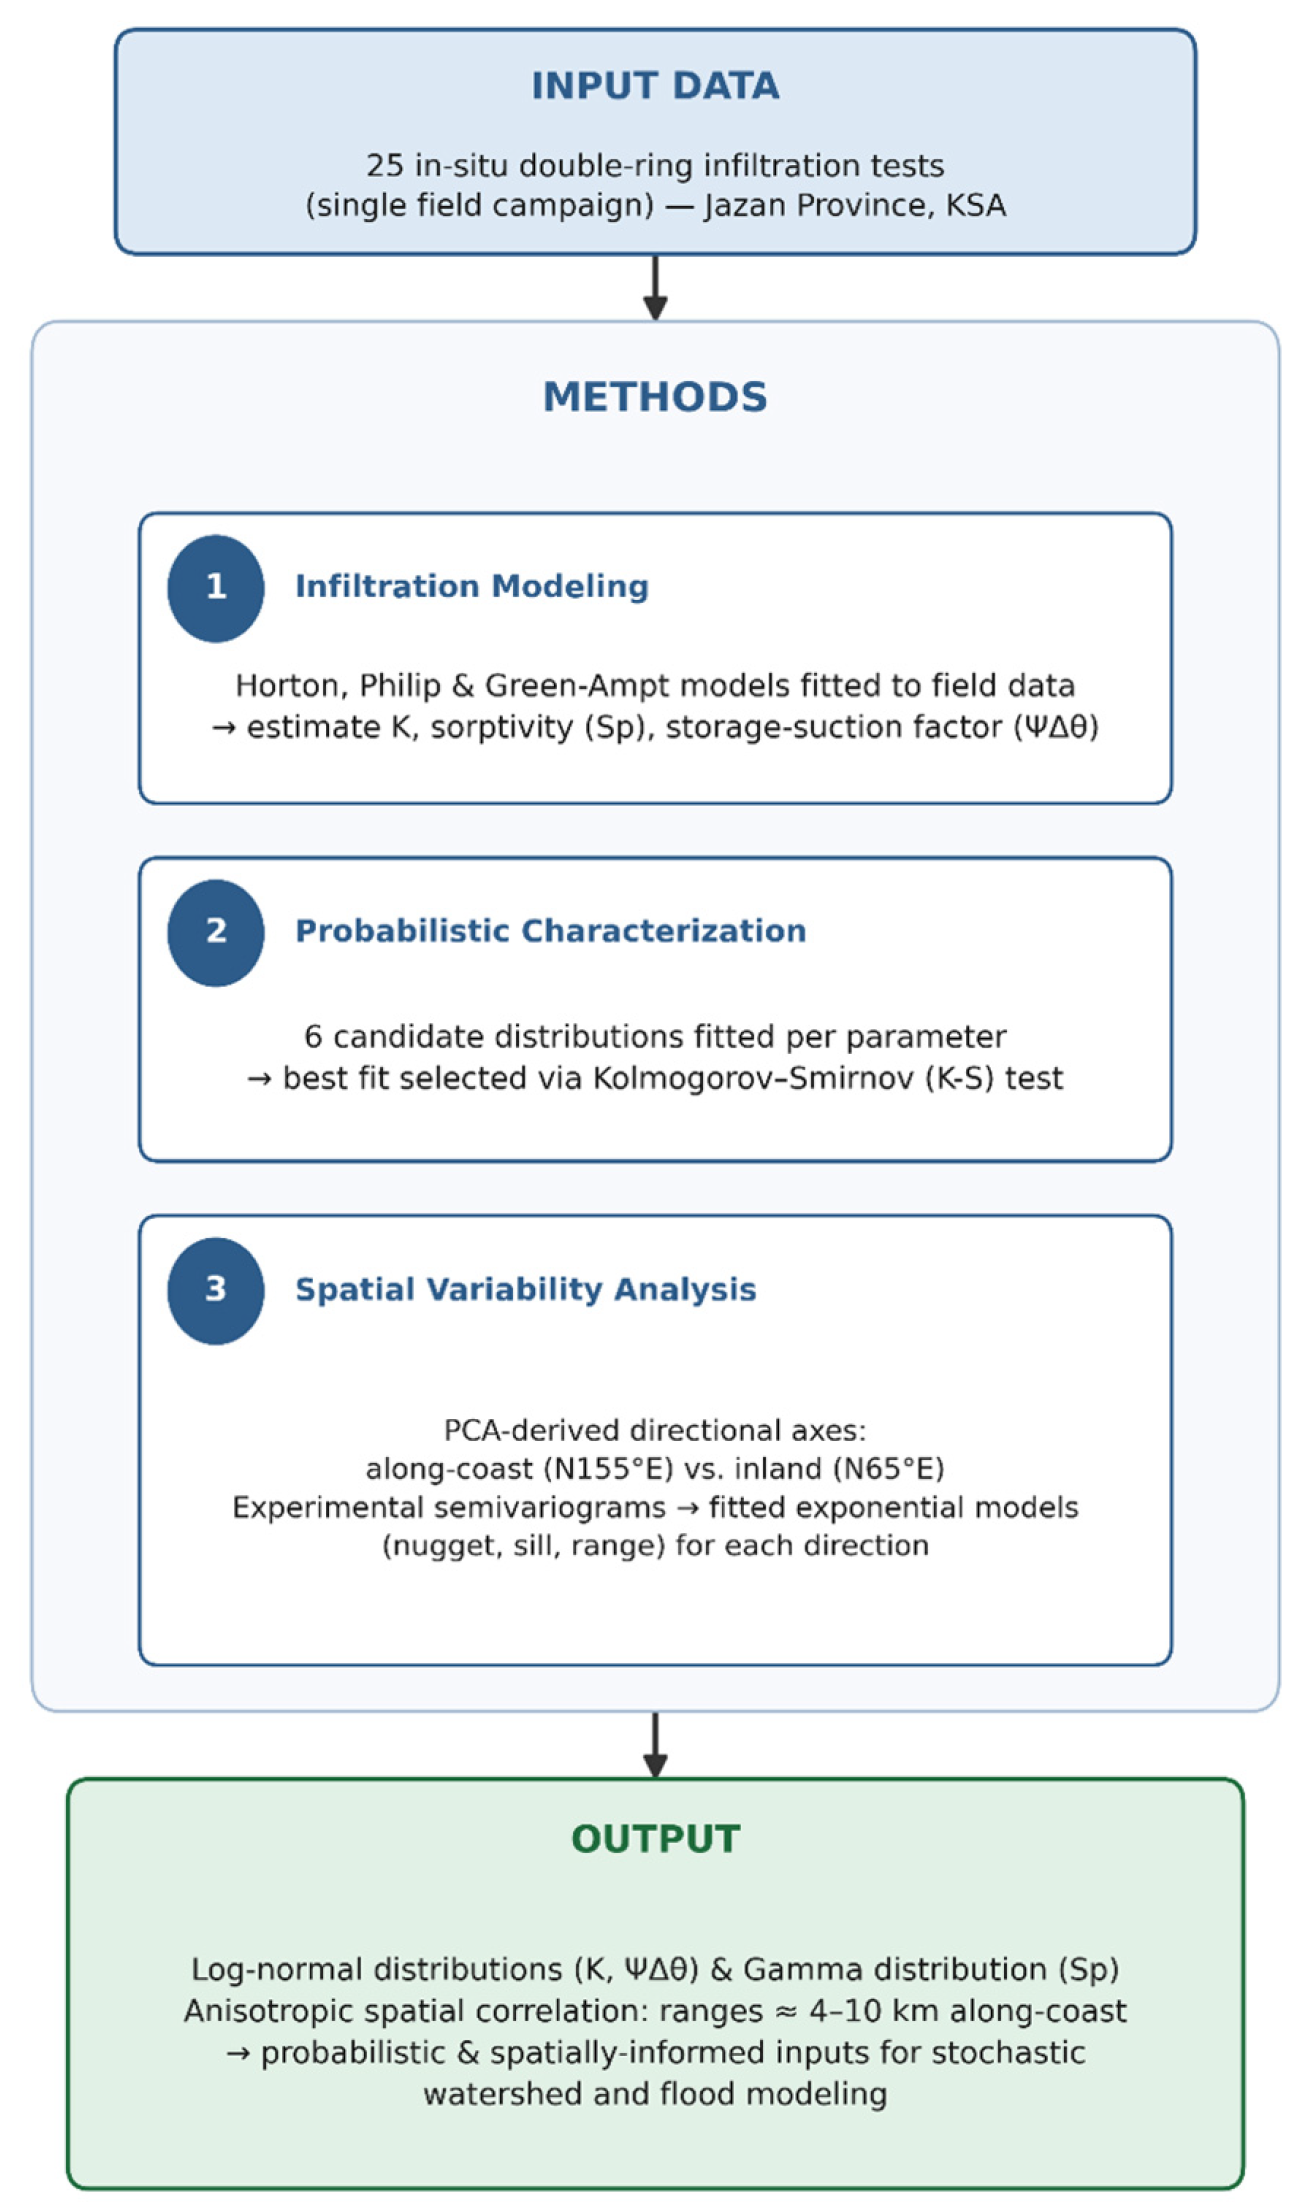
Figure 3 summarizes the methodological framework of the study, beginning with 25 in situ double-ring infiltration tests conducted in Jazan Province, Saudi Arabia. The analysis proceeded through three stages: infiltration modeling using the Horton, Philip, and Green–Ampt formulations to estimate key hydraulic parameters; probabilistic characterization through fitting and Kolmogorov–Smirnov testing of six candidate probability distributions; and spatial variability analysis based on PCA-derived directional axes and experimental semi-variograms fitted with exponential models. The resulting parameter distributions and anisotropic spatial-correlation ranges provide probabilistic and spatially informed inputs for subsequent stochastic watershed and flood modeling.
Figure 3.
A flowchart summarizing the study methodology in three stages.
3. Results
3.1. Analysis of Soil Parameters from the Different Infiltration Models
Table 2 summarizes the estimation of soil parameters using three infiltration models: Horton with two parameters (fc and fo), Philip with two parameters (Sp and Kp), and Green–Ampt with two parameters (K1 and Ψ∆θ). For the Horton model, the initial infiltration rates (fo) ranged from 3.72 to 240.40 m/day with a mean of 30.23 m/day and CV = 1.64. The ultimate infiltration capacity (fc) ranged from 0.44 to 26.24 m/day, with a mean of 5.27 m/day and CV = 1.21. fc refers to the saturated hydraulic conductivity K in the vertical direction of the topsoil. The results indicate high variability in fo and fc, where the variability in fc was lower than fo, indicating various soil types in wadi beds. Regarding the Philip model, the soil sorptivity (Sp) ranged from 0.14 to 1.21 m/day0.5 with a mean of 0.47 m/day0.5 and CV = 0.66. The saturated hydraulic conductivity (Kp) ranged from 0.13 to 24.70 m/day with a mean of 4.59 m/day and CV = 1.34. The results show a relatively low variability in Sp (less than 1, see Table 2).
Table 2.
Summary of soil parameters (from the 25 infiltration tests) estimation by different infiltration models with summary statistics.
Concerning the Green–Ampt model, the saturated hydraulic conductivity (K1) ranged from 0.25 to 25.88 m/day with a mean of 4.92 m/day and CV = 1.29. The multiplication of the storage suction factor (Ψ∆θ) ranged from 0.01 to 0.73 m with a mean of 0.09 m and CV = 1.63. The results show high variability in K1 and Ψ∆θ. Comparison of K estimated by Horton (fc), Philip (Kp), and Green–Ampt (K1) models shows relative agreement, with CV values for fc, Kp and K1 being 1.21, 1.34, and 1.29, respectively. This enhances the reliability of the K estimates from infiltration tests.
Kurtosis shows the peak of the distribution w.r.t the normal distribution. It is noted from Table 2 that the statistical criterion kurtosis gave values higher than three for the soil parameters fo, fc, Kp, K1, and Ψ∆θ. This means that kurtosis is leptokurtic, which is high-peaked. While it gave values less than three for the soil parameter Sp, the kurtosis is platykurtic, which is low-peaked. All soil parameters are positively skewed.
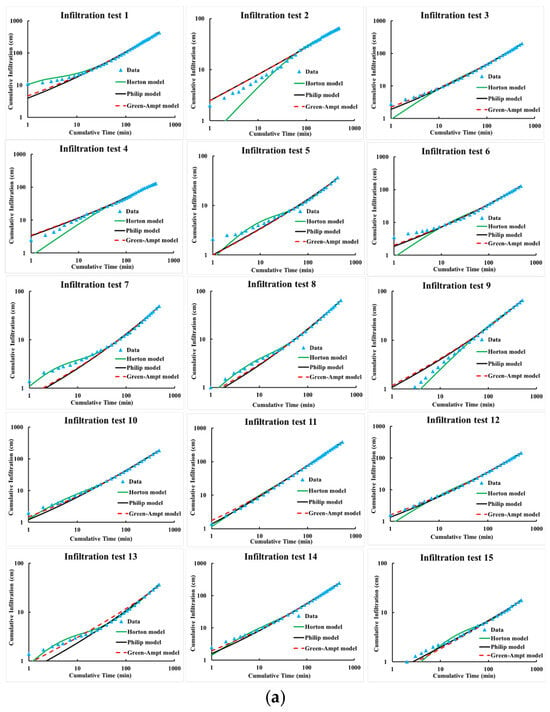
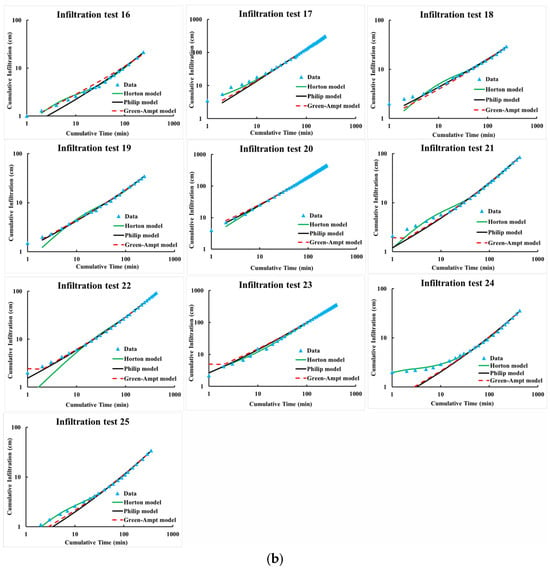
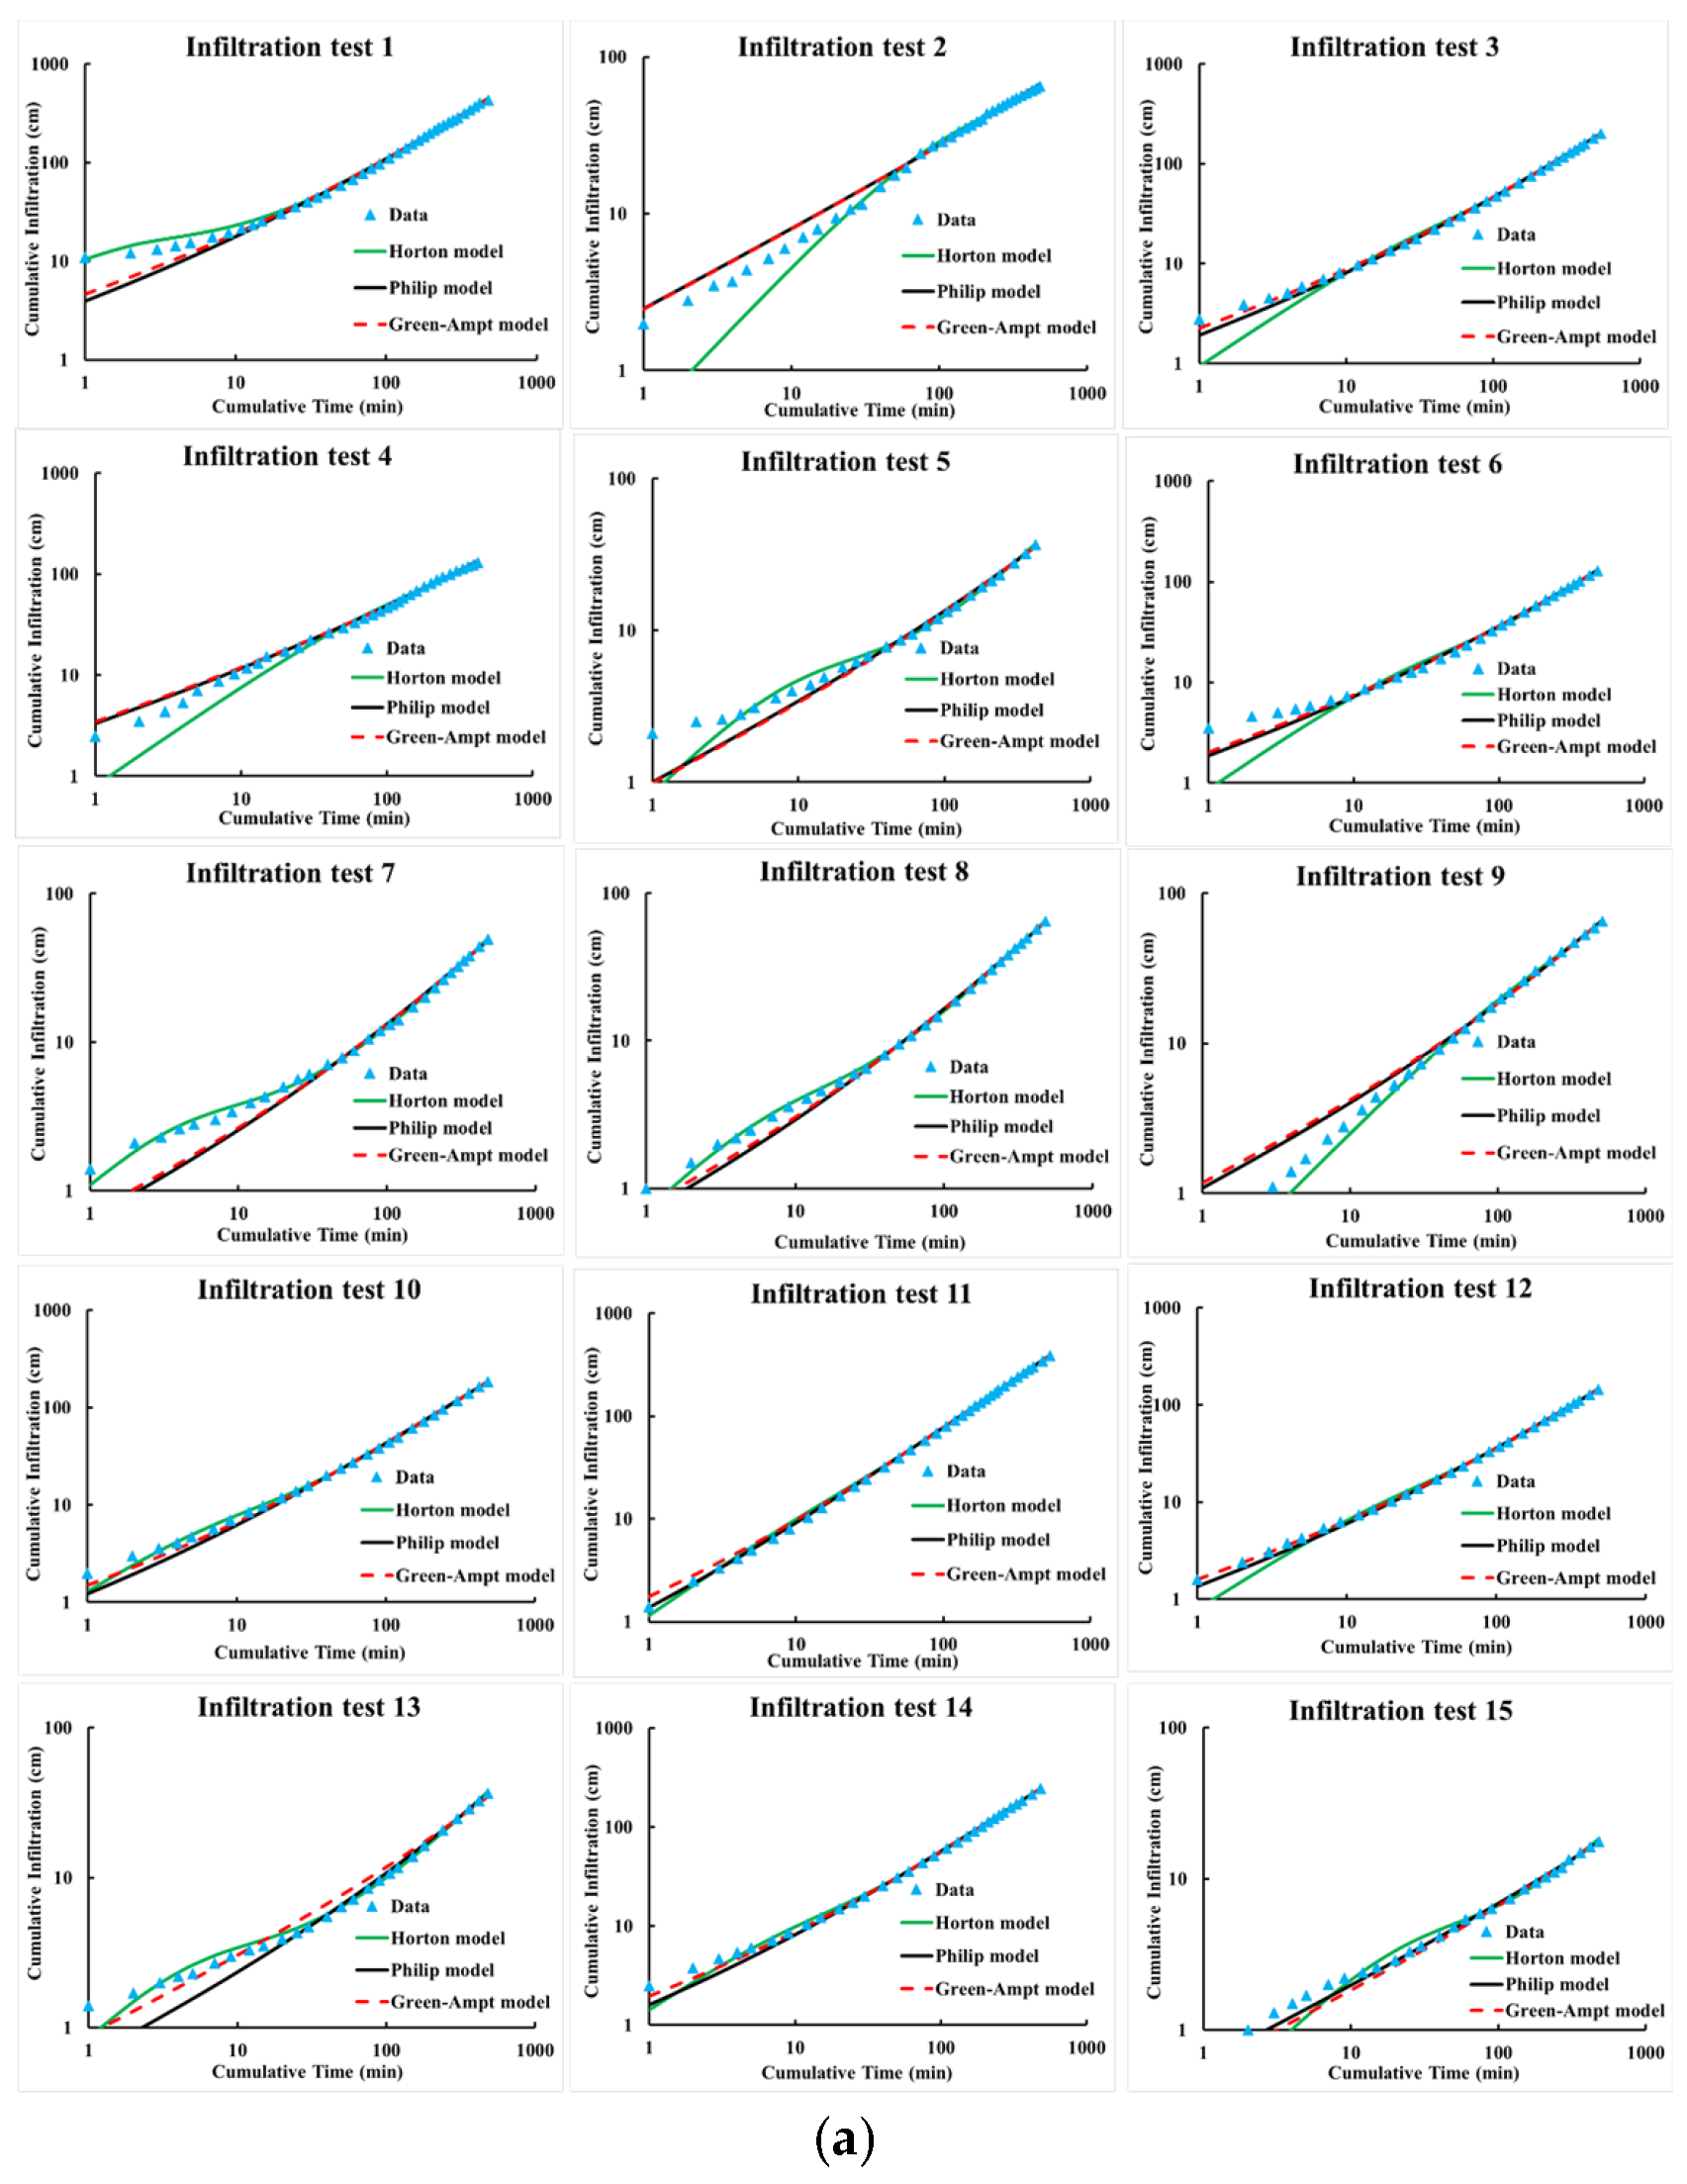
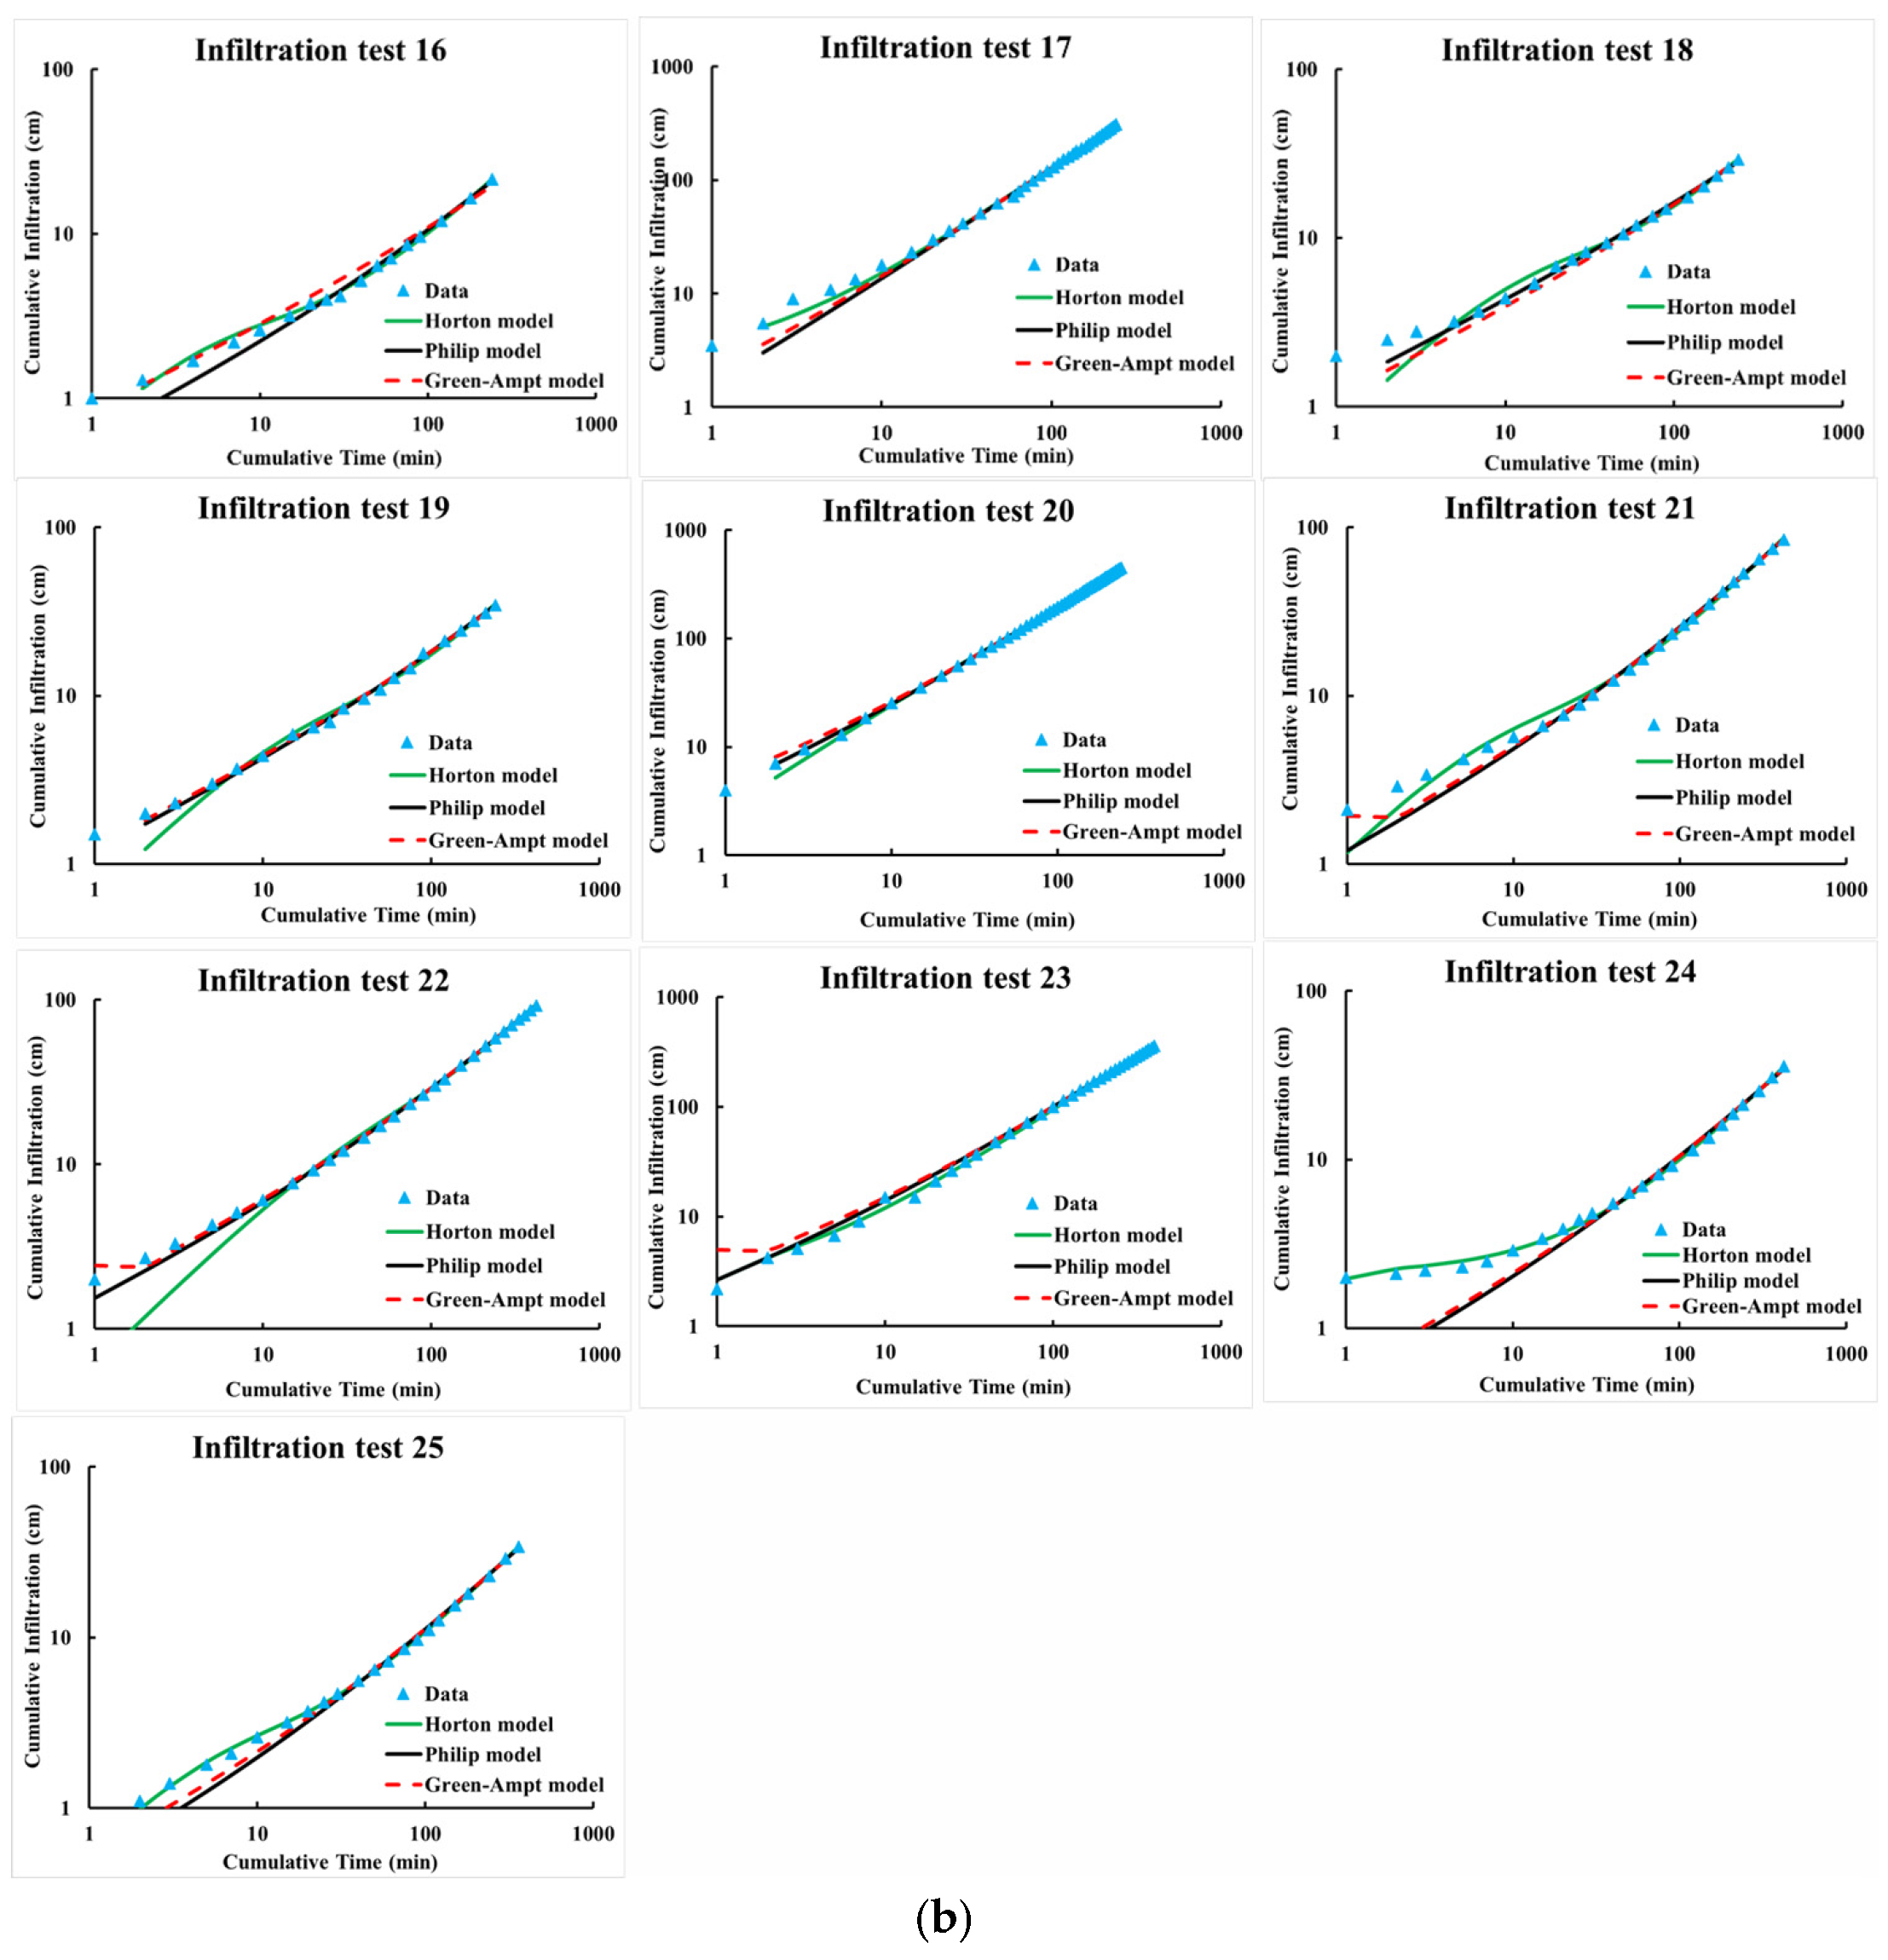
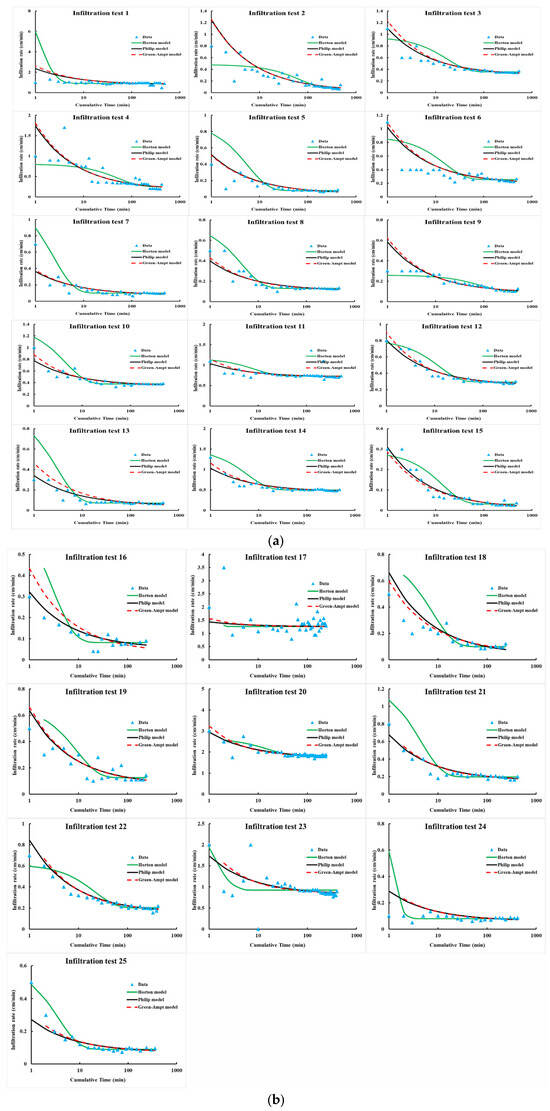
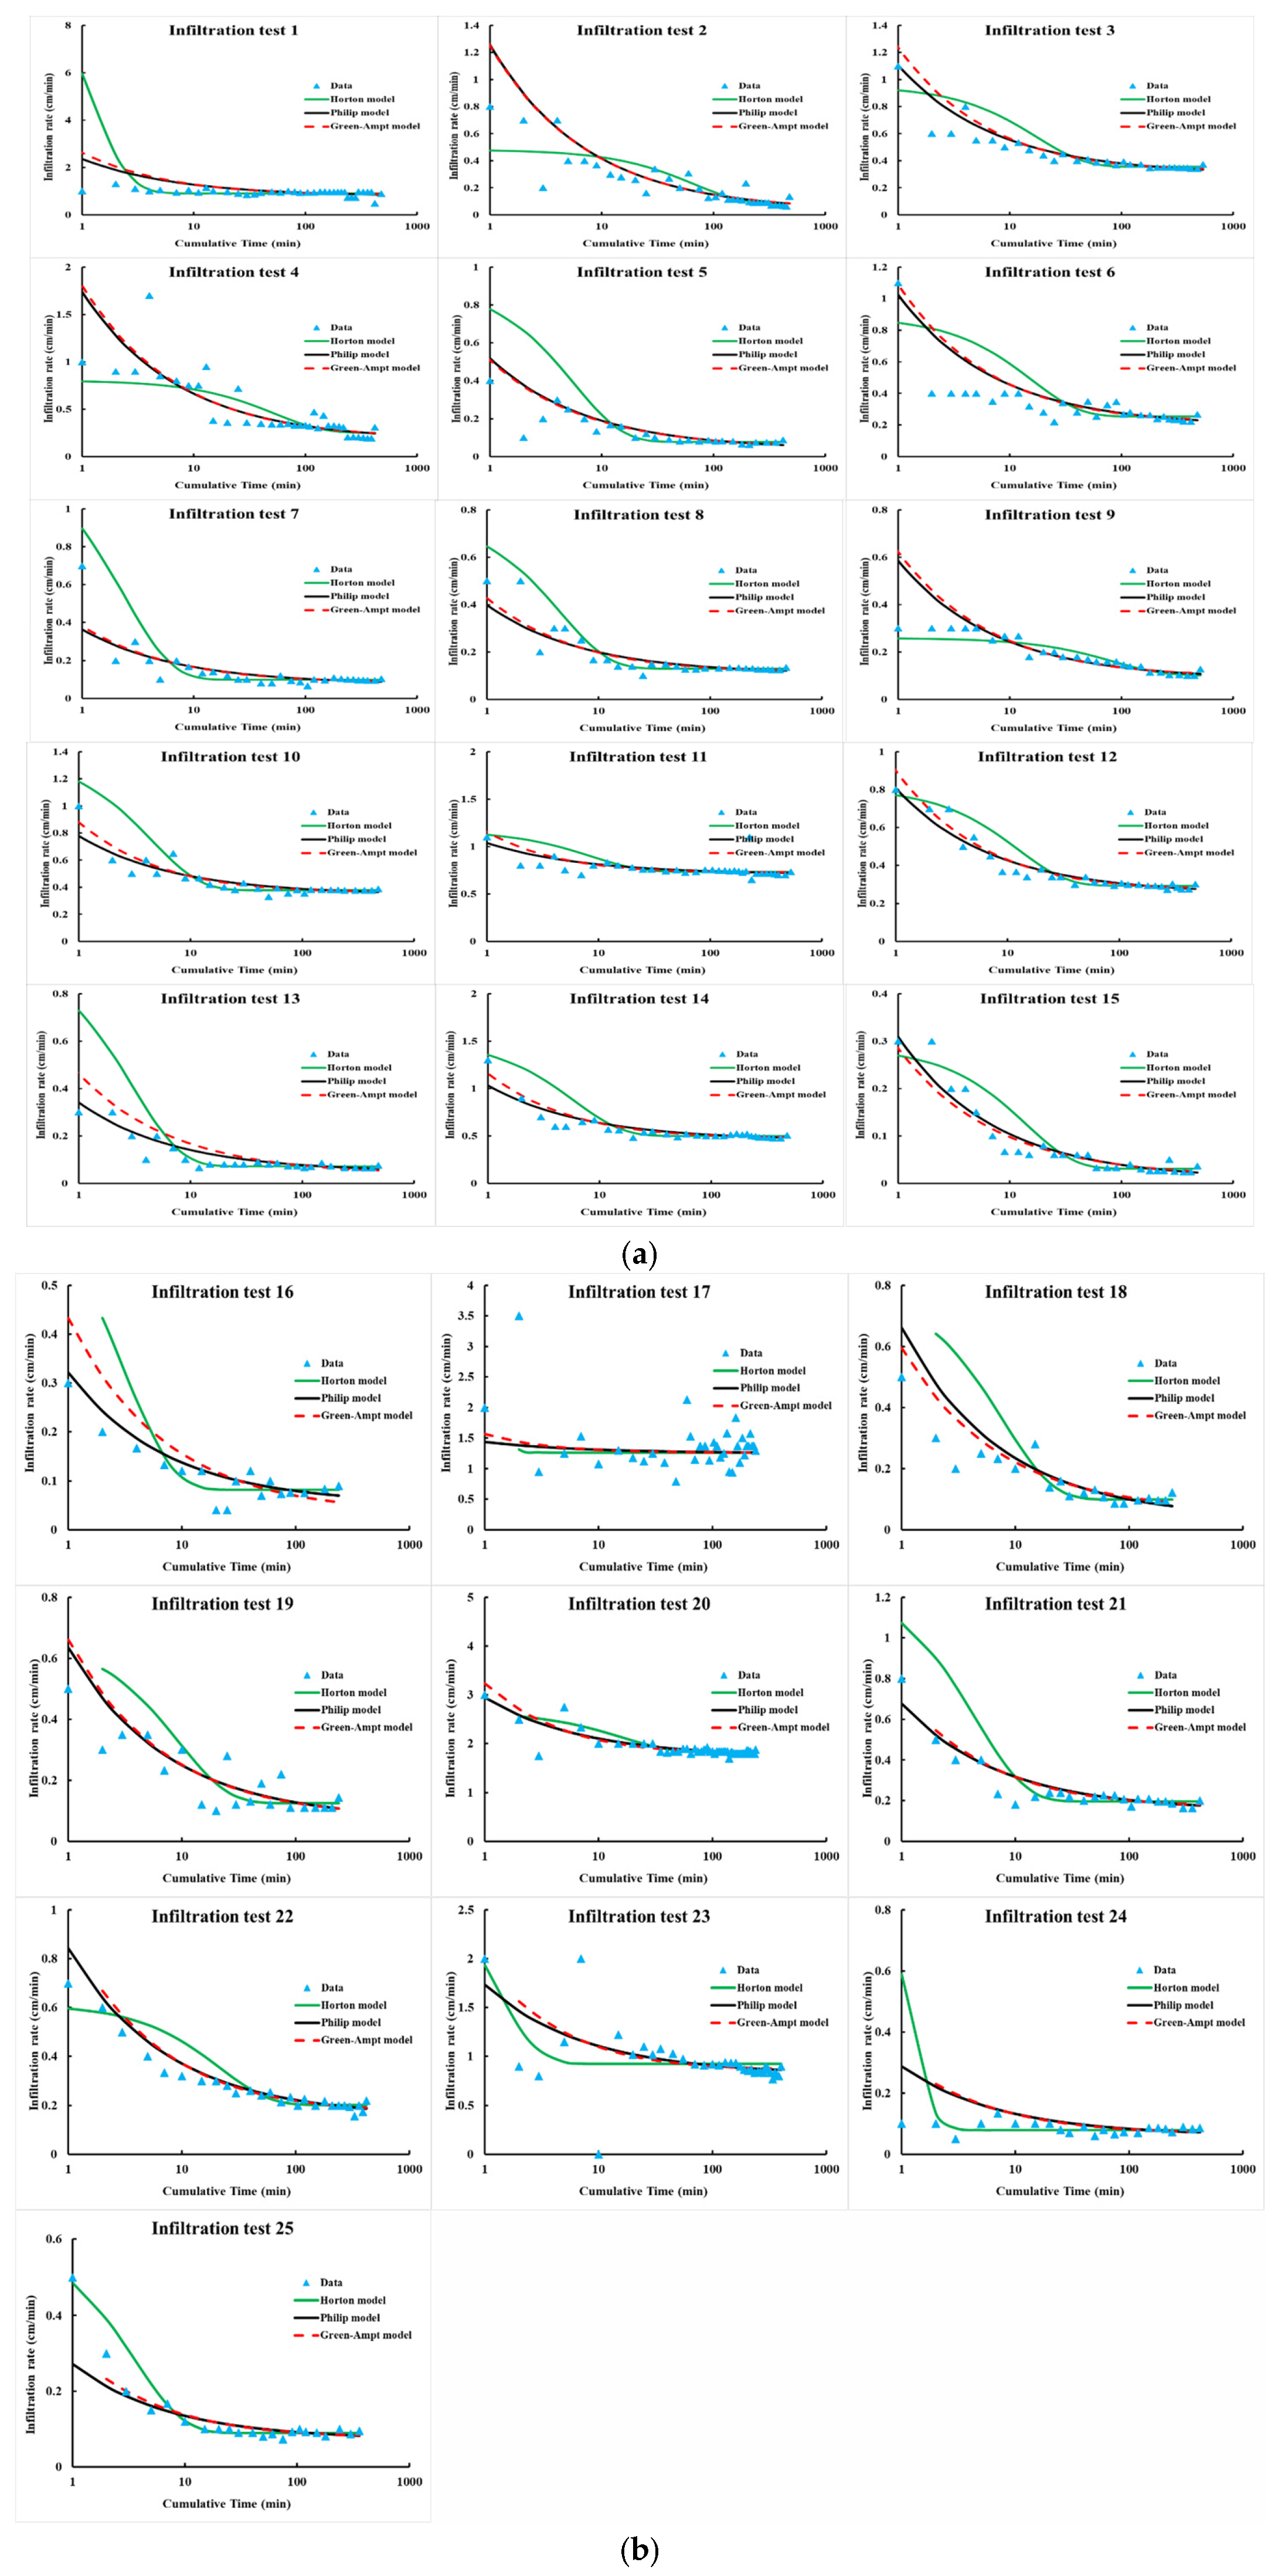
Figure 4 compares the estimated cumulative infiltration depth using three models with the cumulative infiltration depth measured in the field (from Test 1 to 25). Figure 5 shows a comparison of infiltration rate–time curves in the basin alluvium using the three models with measured infiltration rates from the field (from Test 1 to 25). In Figure 4, the data appear to fit all the infiltration models, with a slight advantage over the Horton model. Looking at Figure 4 and Figure 5, it is noted that cumulative infiltration depth was a better fit for the infiltration models than infiltration rates. This is confirmed by the correlation coefficient, r, and the coefficient of determination, R2 values for the various infiltration models in Table 3. This is because cumulative infiltration depth is an integral of infiltration rates and therefore appears to fit the data better.
Figure 4.
(a) Comparison between the estimated cumulative infiltration depth using different models and the measured cumulative infiltration depth in the field (infiltration tests from 1 to 15). (b) Comparison between the estimated cumulative infiltration depth using different models and the measured cumulative infiltration depth in the field (infiltration tests from 16 to 25).
Figure 5.
(a) Comparison between infiltration rate–time curves of different models in the basin alluvium (infiltration tests from 1 to 15). (b) Comparison between infiltration rate–time curves of different models in the basin alluvium (infiltration tests from 16 to 25).
Table 3.
Summary of correlation coefficient (r) and coefficient of determination (R2) values for cumulative infiltration depth; infiltration rate estimated by different infiltration models, with summary statistics.
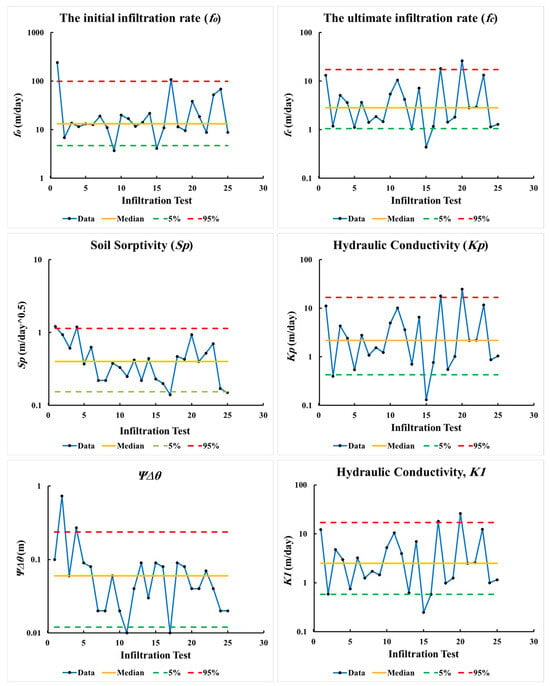
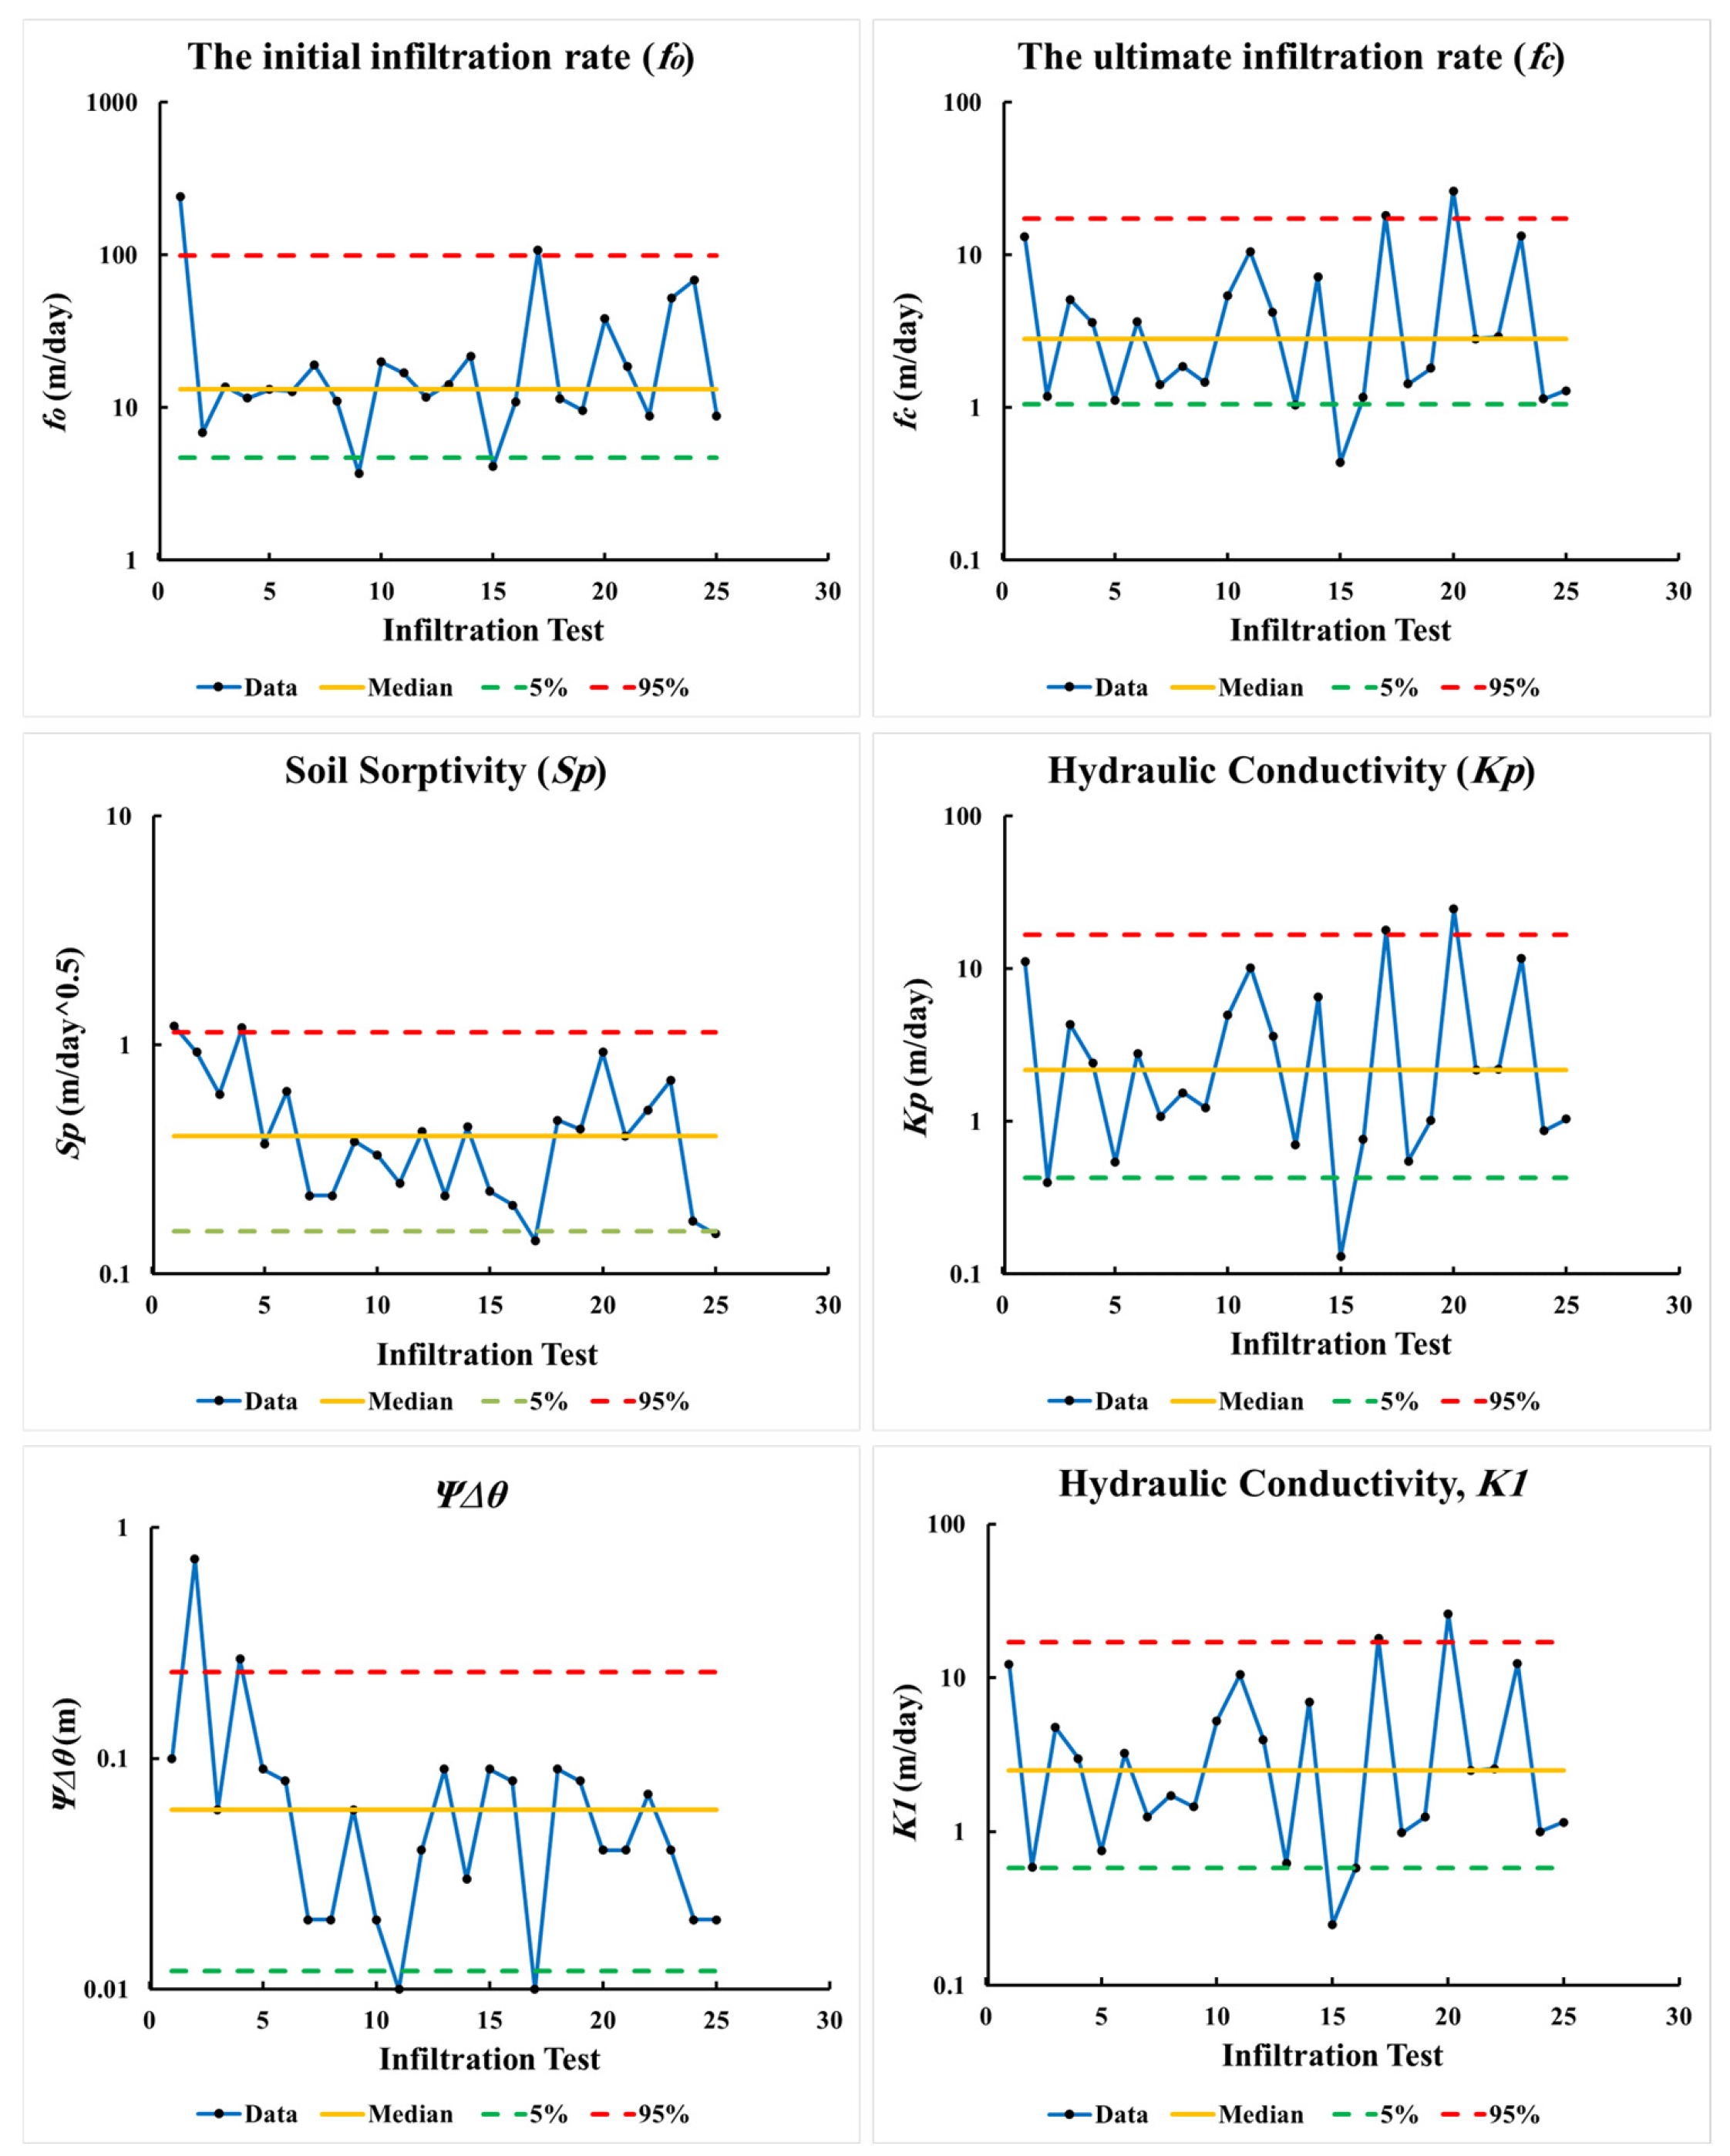
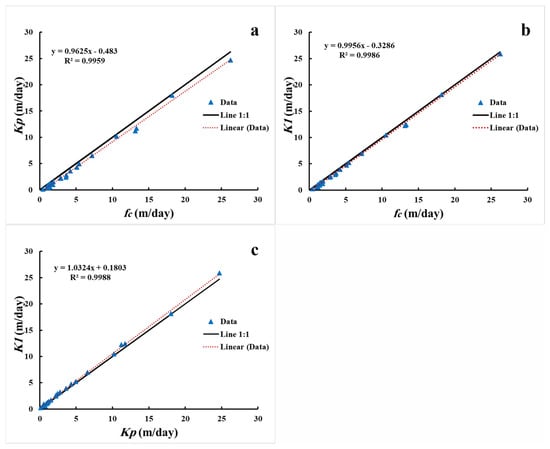
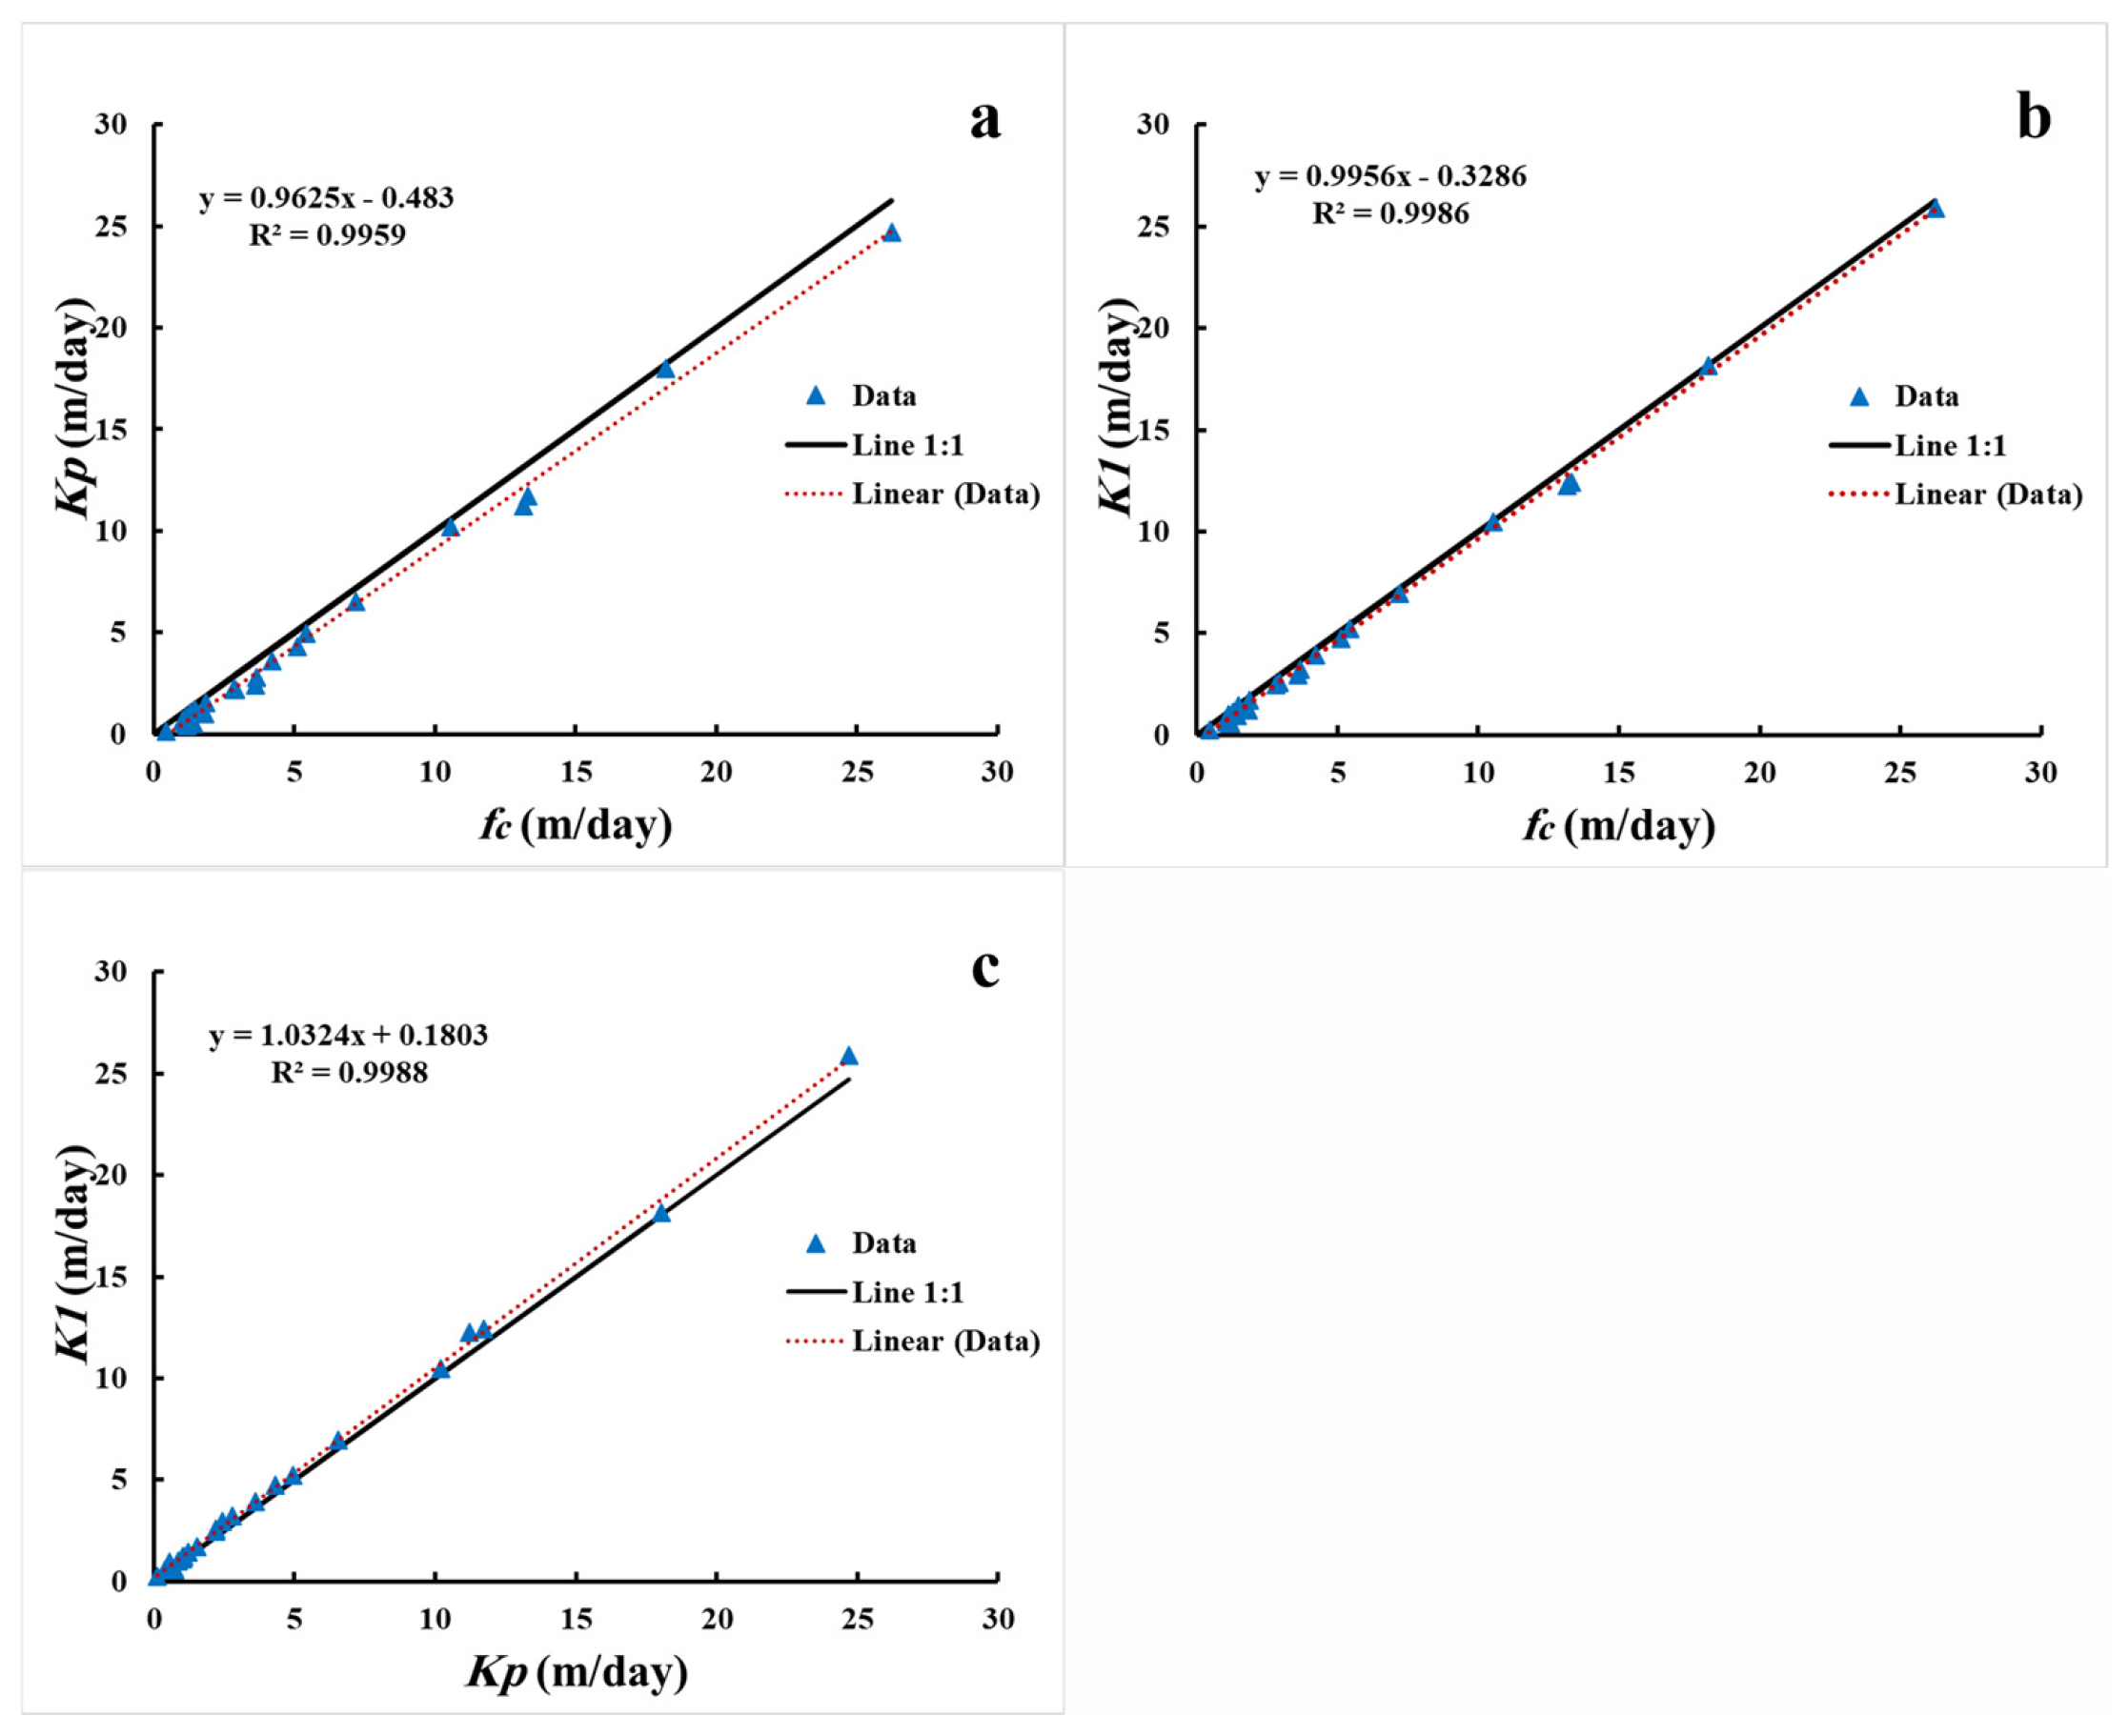
Figure 6 shows fitting soil parameters from infiltration test data using different infiltration models with 5% lower and 95% upper bounds. In addition, Figure 7 shows the relationship between K parameters estimated by different models: (a) the relationship between fc and Kp with the coefficient of determination (R2 = 9959); (b) the relationship between fc and K1 with the R2 is 9986; and (c) the relationship between Kp and K1 with the R2 is 9988. The R2 values indicate the existence of strong relationships that confirm the validity of the estimates resulting from the analysis.
Figure 6.
Variability of soil parameters estimated from infiltration test data using different infiltration models with 5% lower and 95% upper bounds.
Figure 7.
Comparison between the K parameter estimated by different models: (a) fc (Horton) and Kp (Philip), (b) fc (Horton) and K1 (Green–Ampt), and (c) Kp (Philip) and K1 (Green–Ampt).
Moreover, the slopes of the fitted regression lines (0.96, 1.00, and 1.03 for Kp–fc, K1–fc, and K1–Kp, respectively) are close to unity, and the intercepts are small relative to the measured range, indicating that the three models agree closely with the 1:1 identity line and not merely with one another in a correlative sense.
3.2. Probability Distribution of Soil Parameters
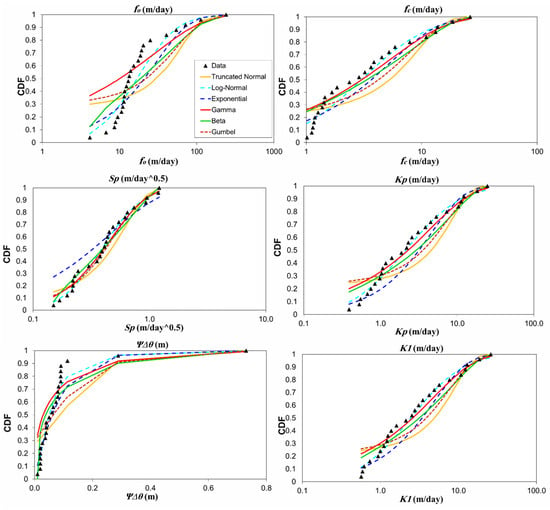
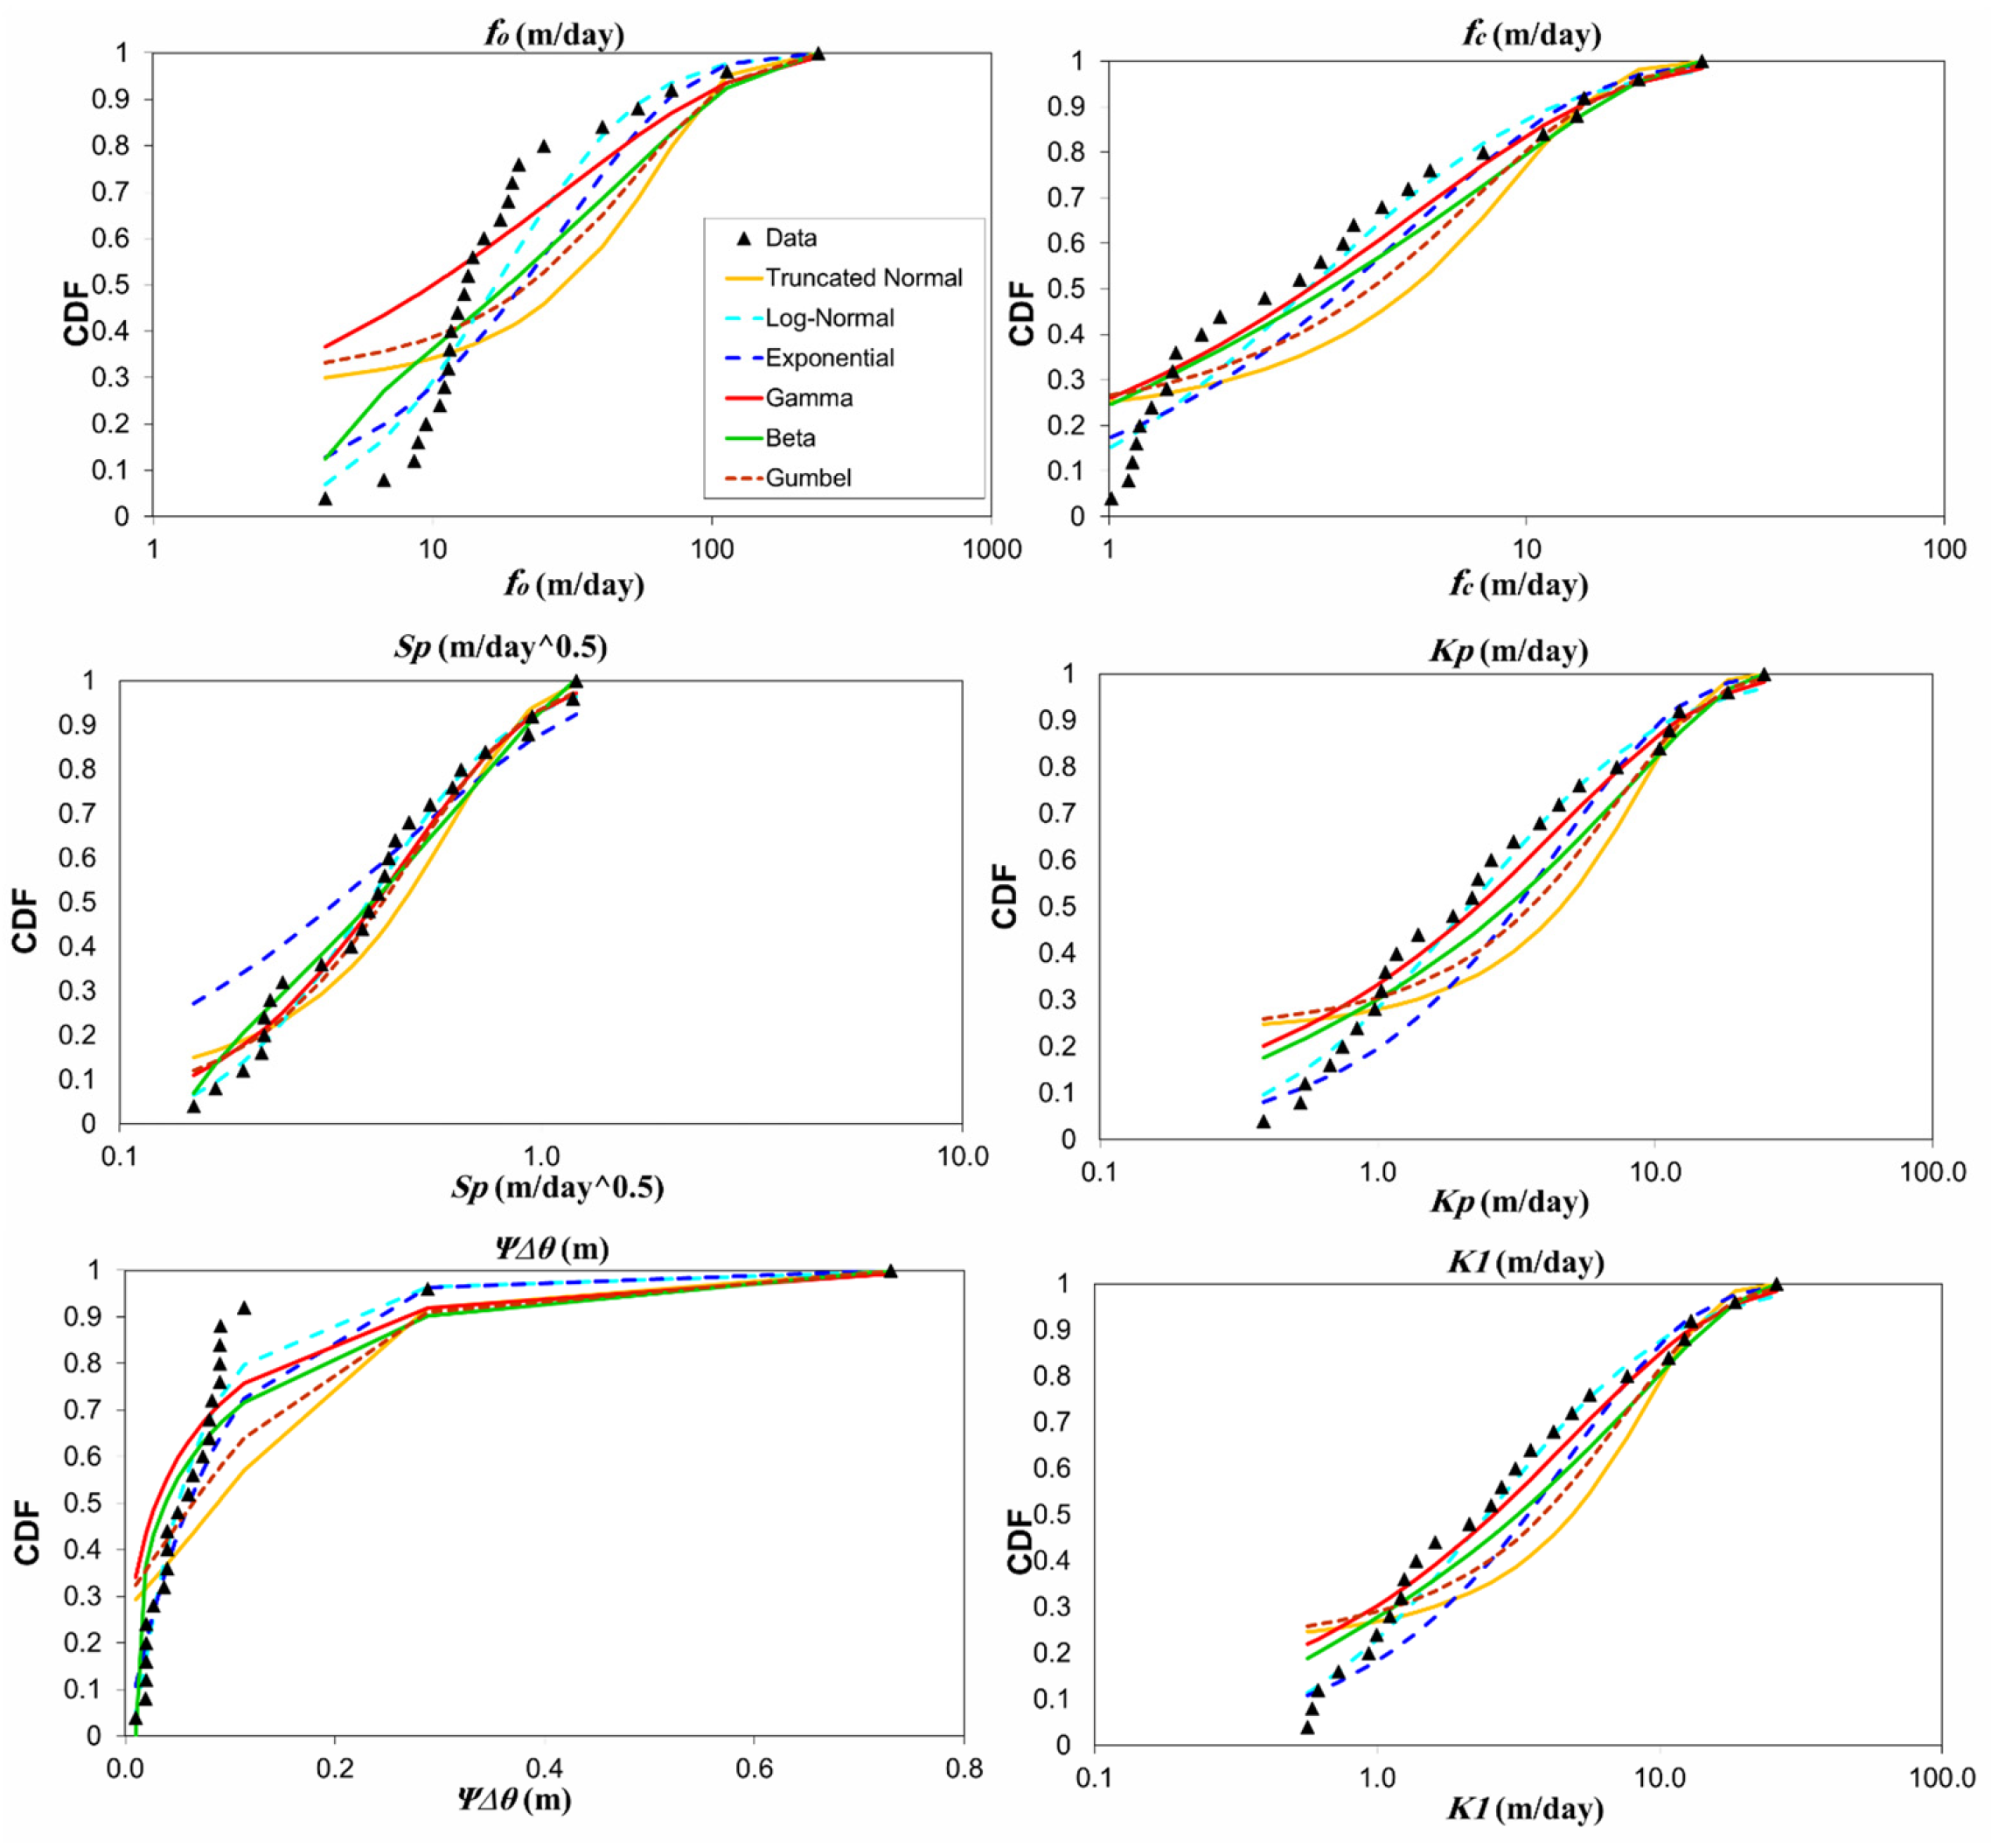
The estimated soil parameters are tested utilizing several probability distribution functions: Gaussian, log-normal, exponential, gamma, beta, and Gumbel. The results of the Kolmogorov–Smirnov (K-S) test show the acceptance of some distributions, as displayed in Table 4. The table shows that most of the tests provide multiple distributions. The appropriate distribution can be determined by comparing the K-S tabulated critical value and K-S sample values. The distribution is optimal when the K-S sample value is less than the K-S critical value. The K-S test at the 5% significance level indicates that the log-normal distribution is considered the best distribution for soil parameters: fo, fc, Kp, K1, and Ψ∆θ, and the Gamma distribution is the best distribution for soil sorptivity (Sp), as shown in Figure 8. It is observed that the data fit the best distribution.
Table 4.
K-S test values of soil parameters compared with critical values.
Figure 8.
Fitting the cumulative distribution function (CDF) of soil parameters estimated by different models.
3.3. Results of the Directional Variogram
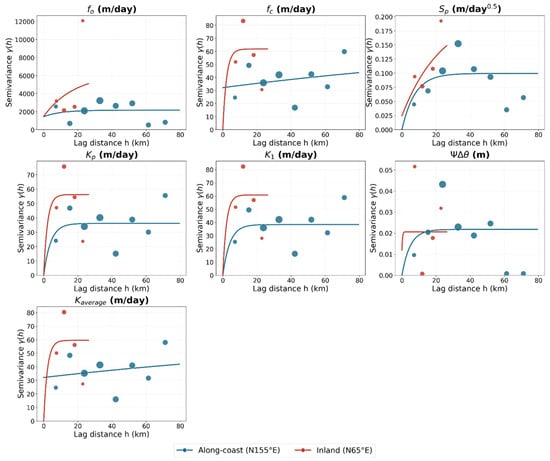
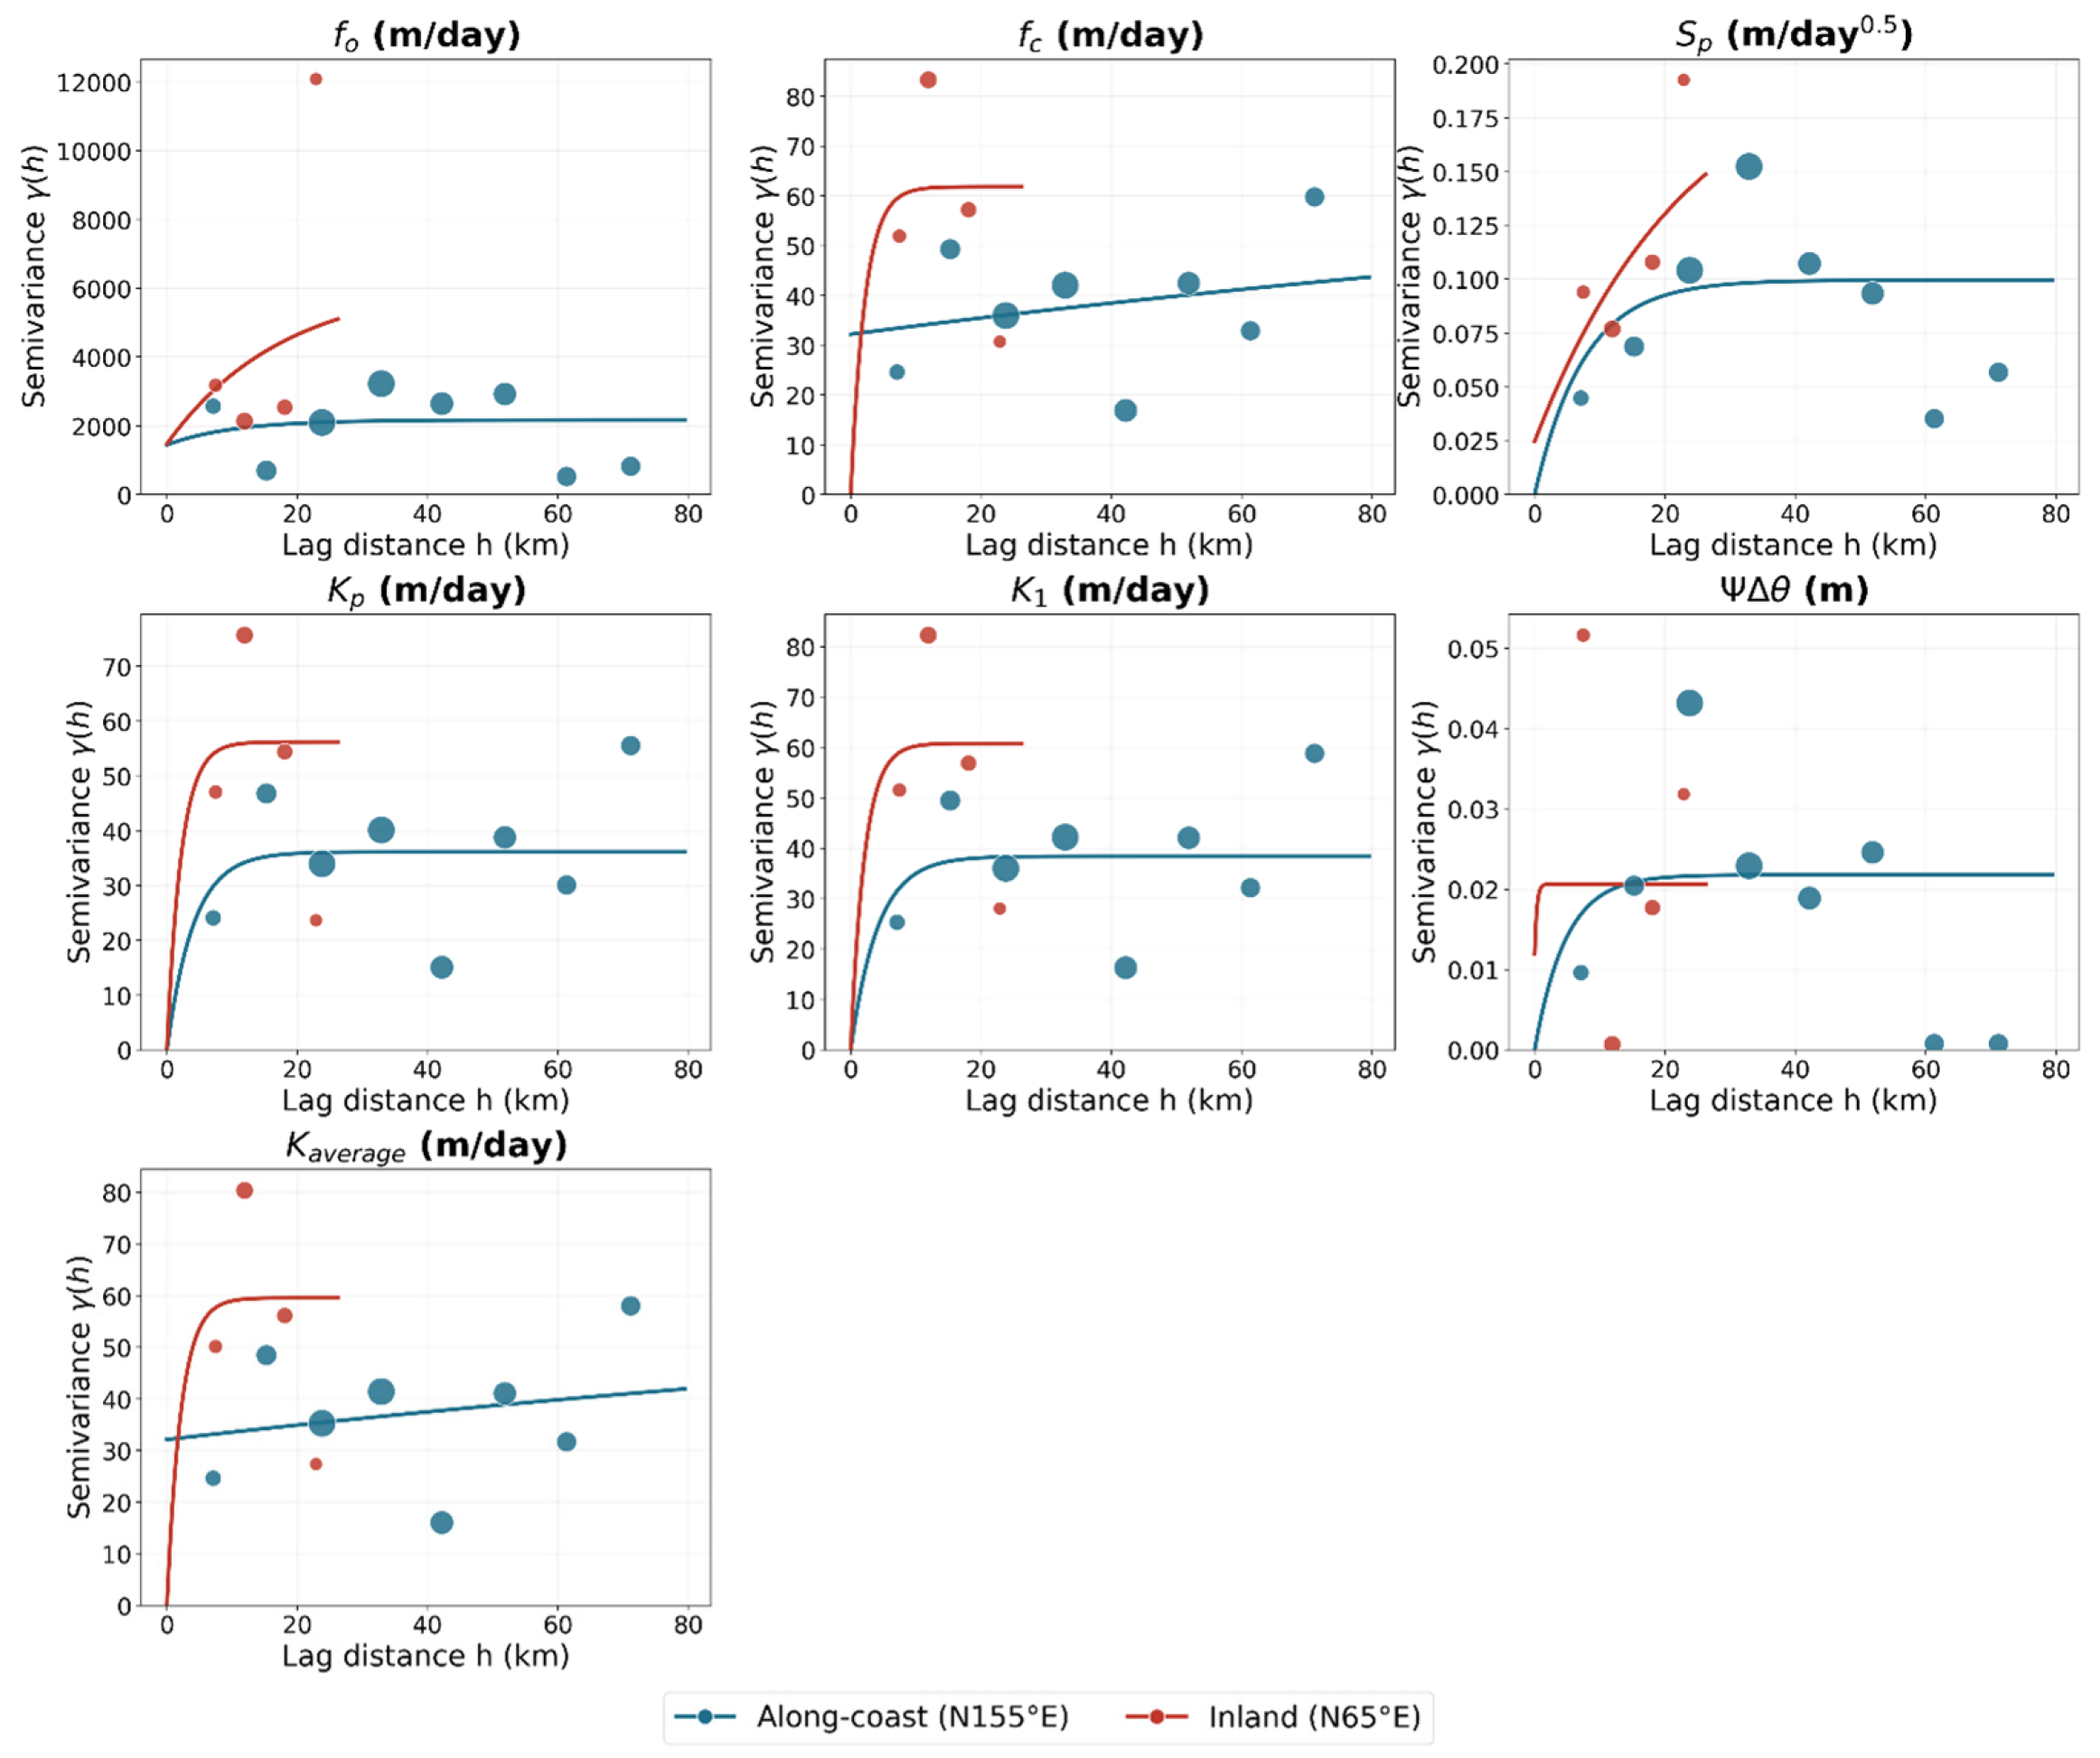
To assess directional differences in the spatial correlation of the infiltration parameters, directional (anisotropic) semi-variograms were calculated along the two principal axes identified from the sampling-network geometry: N155° E, approximately parallel to the Jazan coastline and accounting for 91.8% of the spatial variance among the 25 sites, and the orthogonal N65° E axis, extending inland toward the Asir foothills. Experimental semi-variograms were constructed separately for the two directions and fitted with exponential models to compare their nugget, sill, and range characteristics (Table 5). The resulting directional variograms are shown in Figure 9. The comparison reveals a clear directional contrast in the strength and scale of spatial variability.
Table 5.
Directional exponential variogram fitting results (nugget, partial sill, total sill, and range) for soil hydraulic parameters along-coast (N155° E) vs. inland (N65° E), Jazan Province, KSA.
Figure 9.
Directional experimental semi-variograms (points, sized by pair count per lag bin) with fitted exponential models (lines) for infiltration parameters at 25 test sites, Jazan Province, KSA. Along-coast = N155° E (site-spread principal axis); inland = N65° E (orthogonal axis).
In the inland direction (N65° E; 56 pairs; maximum separation 33 km), semivariance is generally higher than along the coast, indicating greater short-distance spatial variability. This pattern is consistent with increasing sedimentological heterogeneity from the relatively uniform Tihama coastal alluvium toward the more variable Asir foothill sediments. ΨΔθ has a very short and unstable range (0.3 km). Given the limited number of inland pairs, these results should be interpreted primarily as evidence of greater inland heterogeneity rather than precise estimates of spatial correlation ranges.
Along the coast-parallel axis (N155° E; 244 pairs), most parameters show near-zero nuggets and short ranges of approximately 4–10 km (Kp, K1, ΨΔθ), indicating spatial correlation that decays over relatively short distances across the coastal plain. Sp shows similar ranges of 7.6 and 9.9 km, respectively. In contrast, fc and K average yield unstable ranges of ~227 km, which likely reflect weak spatial structure rather than meaningful long-range correlation and should therefore be interpreted cautiously.
4. Discussion
4.1. Comparison with Previous Studies
The three infiltration models used in this study Horton, Philip, and Green–Ampt offer complementary approaches for estimating soil hydraulic parameters, each with specific strengths and limitations. This multi-model strategy parallels other recent work on alluvial soils in arid and semi-arid settings, where several independent parameter-estimation approaches: pedotransfer functions, analytical retention-curve fitting, and inverse modeling, were likewise compared to assess hydraulic-parameter reliability under data-scarce field conditions [9]. In the current study, the Horton model, the initial infiltration rate (fo), and ultimate infiltration (fc, corresponding to saturated hydraulic conductivity) describe infiltration from the start of a rainfall event until ponding occurs. The Philip model provides interpretable parameters, sorptivity (Sp) and steady-state hydraulic conductivity (Kp), reflecting the soil’s capacity to absorb water and the combined influence of capillarity and gravity. Sorptivity is particularly important in arid and semi-arid regions, where short-duration rainfall events dominate; lower Sp values reduce cumulative infiltration, and its effect is most pronounced during brief storms [44]. Also, soil sorptivity (Sp) plays an important role in determining the nature of rainfall and runoff processes and the risk of runoff generation [45]. Despite its critical role in controlling infiltration and runoff, sorptivity (Sp) has rarely been measured systematically, and major soil databases, such as USDA-NRCS, do not provide Sp data [46]. Compared to saturated hydraulic conductivity (K), Sp has received considerably less attention in hydrological studies. The present study addresses this gap by providing systematic field-based measurements of Sp, offering data that are rarely available in the literature.
Similarly, the Green–Ampt model incorporates the storage suction factor (Ψ∆θ), which governs the wetting front and strongly influences rainfall-runoff processes, yet its importance is often understated [47]. In addition to Sp and K, this study provides systematic estimates of Ψ∆θ, contributing valuable data for arid-region watershed modeling and enabling a more comprehensive characterization of soil hydraulic variability.
The statistical analysis confirms the high variability of hydraulic conductivity, with CV values of 1.21, 1.34, and 1.29 for Horton, Philip, and Green–Ampt models, respectively, while Sp shows lower variability (mean = 0.47 m/day0.5, CV = 0.66) and Ψ∆θ has a CV of 1.63. The CV value of the parameter Sp is low (less than 1) compared to the hydrological parameters (fc, fo, Kp, K1, Ψ∆θ) that gave high CV values. This has been supported by [48,49]. These results are consistent with previous studies in arid regions [20,23] and highlight that K and Ψ∆θ variability should be explicitly accounted for in watershed models, whereas Sp may have a more localized effect.
Probability distribution analysis indicates that K and Ψ∆θ follow log-normal distributions, while Sp is best represented by a Gamma distribution, providing a statistically sound framework for stochastic or distributed hydrological modeling. Most studies indicate that saturated hydraulic conductivity follows a log-normal distribution, e.g., [50,51,52]. This is consistent with the findings of the current study that a log-normal distribution is the most appropriate for K. The literature review does not provide any results related to the distribution of Sp and Ψ∆θ. It has been shown from the analysis that the Gamma distribution is the best for Sp and the log-normal distribution is the most suitable for Ψ∆θ.
4.2. Uncertainties in Input Data and Model Parameters
Several sources of uncertainty affect the reported estimates beyond the natural spatial variability of soil hydraulic properties. On the input-data side, double-ring infiltrometer measurements are inherently sensitive to ring-insertion disturbance, lateral seepage beneath the ring, and the precision of manual head/time readings during the test; because each of the 25 sites was tested once, the measured variability reflects a combination of genuine spatial heterogeneity and measurement noise that cannot be formally separated without replicate testing at individual sites.
On the model-parameter side, the Horton, Philip, and Green–Ampt parameters were each obtained by nonlinear least-squares fitting to the recorded infiltration curves. While the strong pairwise agreement between the K-type parameters of the three models (R2 = 0.9959–0.9988; Figure 7) indicates good consistency, nonlinear curve fitting of this kind is known to be sensitive to the chosen initial parameter values and to the portion of the curve used for fitting, and some degree of parameter equifinality among the models cannot be ruled out. A formal sensitivity analysis of the infiltration model parameters was beyond the scope of the present field campaign and was not performed here.
The directional variogram parameters carry an additional, more clearly identified layer of uncertainty tied to the geometry and density of the sampling network. The strongly coast-oriented network produces an uneven number of directional pairs (244 along-coast versus 56 inland), leaving the inland range estimates substantially less constrained than the along-coast ones. The fitted sill is also sensitive to the unusually high value recorded at site T1, and several parameters exhibit weak or nearly flat experimental semivariograms for which the exponential range is poorly constrained or not physically meaningful. Consequently, the reported directional ranges should be interpreted as approximate indicators of spatial correlation strength rather than definitive parameters for interpolation, particularly along the inland direction.
4.3. Limitations
The 25 measurements were collected during a single field campaign and therefore characterize spatial, not temporal, variability in soil hydraulic parameters; temporal effects such as seasonal crusting, antecedent soil moisture, or sediment reworking following major flood events were beyond the scope of this study, and repeated, multi-temporal measurements at the same sites are recommended as a direction for future research to quantify this additional dimension of variability. This sample size is also modest for both distribution fitting and spatial-variability estimation. Ref. [53] found that variograms computed from fewer than 50 data points are “of little worth,” recommending at least 100–150 well-distributed points for reliable estimation. Compounding this, the site network is unevenly distributed, being strongly elongated along the coast (244 along-coast pairs versus only 56 inland pairs), so the inland spatial-correlation estimates carry greater uncertainty than the along-coast ones. In addition, a single high hydraulic conductivity value at one site noticeably influences the fo statistics and should be verified as genuine rather than an outlier. Finally, the results are specific to the alluvial ephemeral-streambed setting of Jazan Province, so their transferability to other arid regions with different soil textures or depositional histories remains to be tested. Nevertheless, the study demonstrates a practical methodology for quantifying variability in key hydraulic parameters, including rarely reported values of Sp and Ψ∆θ, and for characterizing their directional spatial structure.
4.4. Future Research Directions and Recommendations
Future research should prioritize a more spatially balanced sampling network, particularly in the inland direction, to improve the reliability of the directional variogram estimates, and should include additional sampling to verify influential observations (such as the high fo value at site T1) and better constrain the spatial correlation structure before the variograms are applied for interpolation. Repeating infiltration surveys across seasons, or after significant rainfall events, would help capture temporal variability alongside the spatial variability characterized here, while extending the sampling coverage to deeper soil layers and to other arid regions would help validate and generalize the findings. A formal sensitivity and uncertainty analysis of the infiltration model parameters, together with propagation of the fitted parameter and variogram uncertainties, would help quantify how these uncertainties carry through to downstream hydrological predictions. Overall, this work provides critical insights into the variability and spatial structure of soil hydraulic parameters in ephemeral stream watersheds and offers actionable, if provisional, guidance for improving stochastic hydrological and flood modeling in arid environments.
An additional consideration is the potential phase lag between soil hydraulic variability and the climatic and other environmental drivers that shape it. Soil hydraulic properties do not necessarily respond synchronously with rainfall, temperature, or antecedent moisture conditions; rather, they reflect the cumulative, lagged imprint of prior wetting–drying cycles, surface crusting, vegetation dynamics, and sediment reworking by earlier flood events. Because the present dataset was collected as a single snapshot, the measured hydraulic parameters may partly reflect climatic and hydrologic conditions that preceded the sampling campaign rather than concurrent ones, and such a lag could obscure or bias any apparent relationship between soil hydraulic behavior and current climatic forcing. Disentangling this phase lag would require a time series of paired soil-hydraulic and climatic measurements, which was beyond the scope of the present study; we recommend this as a valuable direction for future research, particularly in ephemeral-stream settings where episodic flood events can abruptly reset near-surface soil structure and, for a period, decouple it from the prevailing climatic regime.
A direct way to separate measurement error from genuine spatial variability would be to repeat the double-ring infiltration test at a subset of sites (e.g., 5–6 of the 25), placing the second ring a short distance (1–2 m) from the original and testing on the same day to minimize confounding from larger-scale spatial differences or changing soil-moisture conditions. Comparing the two measurements at each site would give a direct estimate of how much of the observed variability is simply measurement/instrument noise versus genuine soil heterogeneity, helping to clarify how much confidence can be placed in the fine-scale variability reported in this study.
5. Conclusions and Practical Implications for Hydrological Modeling
5.1. Conclusions
This study statistically characterizes key soil hydraulic parameters in the ephemeral stream channels of the Jazan region. Hydraulic conductivity (K) was the most variable parameter, following a log-normal distribution with mean values of 5.27, 4.59, and 4.92 m/day (CV = 1.21, 1.34, 1.29) for the Horton, Philip, and Green–Ampt models, respectively, underscoring the need to represent K probabilistically rather than as a single deterministic value. Soil sorptivity (Sp) showed lower variability (mean = 0.47 m/day0.5, CV = 0.66, Gamma-distributed), suggesting limited influence on watershed-scale response, while the storage suction factor (ΨΔθ) showed substantial, log-normally distributed variability (mean = 0.09 m, CV = 1.63), reflecting its importance in capturing soil heterogeneity.
The three infiltration models agreed closely, indicating that any can be reliably used to derive these parameters for stochastic modeling. The resulting distributions—log-normal for K and ΨΔθ, Gamma for Sp—provide a sound statistical basis for representing soil variability in distributed or stochastic watershed models.
A directional variogram analysis further showed anisotropic spatial correlation, with short ranges of ~4–10 km along the coast-parallel direction and weaker structure inland; since these ranges are short relative to the sampling network’s extent, the 25 measurements can reasonably be treated as approximately independent for the province-wide distributions reported here.
Together, these findings highlight the importance of both probabilistic and spatial variability in soil hydraulic properties in arid ephemeral watersheds, offering transferable guidance for stochastic hydrological and flood modeling in similar data-scarce regions.
5.2. Practical Implications for Hydrological Modeling
These findings have several practical implications for hydrological and flood modeling in arid, data-scarce regions. First, the identified log-normal and Gamma distributions provide a practical basis for representing , , and as random variables in Monte Carlo and stochastic rainfall–runoff models, rather than relying on single deterministic values that may not capture soil heterogeneity. Second, the short anisotropic correlation ranges (~4–10 km along the coast and less-defined structure inland) provide useful guidance for spatial interpolation and simulation. Along the coast, measurements may provide information over relatively short distances, whereas inland extrapolation should be treated more cautiously. Finally, the use of simple, field-based double-ring infiltration tests makes the approach relatively easy to apply in other arid ephemeral watersheds where extensive monitoring is not feasible. Together, these findings provide a practical basis for incorporating soil variability and uncertainty into regional flood and water-resources assessments.
Author Contributions
Conceptualization, B.N., M.M., A.M.E., and M.M.F.; fieldwork, M.M., and B.N.; methodology, M.M., A.M.E., B.N., and M.M.F.; software, B.N., M.M.F., and A.M.E.; validation, A.M.E., M.M., and B.N.; formal analysis, M.M., A.M.E., and B.N.; investigation, M.M., A.M.E., and M.M.F.; resources, M.M., M.M.F., and B.N.; Data curation, M.M.F., A.M.E., and M.M.; writing original draft, M.M.F., M.M., and B.N.; writing—review and editing, M.M., A.M.E., B.N., and M.M.F.; Visualization, A.M.E., M.M., and M.M.F.; supervision, B.N. and M.M.; project administration, M.M., and B.N., Funding acquisition, M.M., and B.N. All authors have read and agreed to the published version of the manuscript.
Funding
The authors gratefully acknowledge the Deanship of Scientific Research (DSR) at King Abdulaziz University, Jeddah, Saudi Arabia, for funding this project under grant No. (IPP: 1196-155-2026) and for technical and financial support.
Data Availability Statement
The authors elect not to share data because the data are part of an ongoing study.
Conflicts of Interest
The authors declare no conflicts of interest.
Abbreviations
The following abbreviations are used in this manuscript:
| KSA | Kingdom of Saudi Arabia |
| K, Kp, K1 | Saturated hydraulic conductivity of the soil |
| fo | Initial infiltration rate |
| fc | Ultimate infiltration rate |
| k | Decay coefficient |
| Sp | Soil sorptivity |
| ΨΔθ | Storage suction factor |
| Ψ | Matric potential |
| Δθ | The change in volumetric water content from the initial water content to the porosity |
| f(t) | Infiltration rate at time t |
| F(t) | Cumulative infiltration depth (cm) |
| Observed cumulative infiltration (cm) | |
| t | Time since infiltration started |
| ti | Time corresponding to the observed cumulative infiltration (min) |
| n | Number of observations |
| LSM | Least squares method |
| SD | Standard deviation |
| CV | Coefficient of variation |
| K-S test | Kolmogorov–Smirnov test |
| The assumed cumulative distribution function with parameters | |
| The empirical cumulative distribution function | |
| The empirical semi-variogram at separation distance h | |
| The model semi-variogram | |
| The parameter values at sites | |
| The parameter values at sites | |
| n(h) | The no. of pairs with lag h |
| The nugget | |
| The partial sill | |
| The total sill | |
| The fitted range |
References
- Descroix, L.; Barrios, J.G.; Vandervaere, J.P.; Viramontes, D.; Bollery, A. An Experimental Analysis of Hydrodynamic Behaviour on Soils and Hillslopes in a Subtropical Mountainous Environment (Western Sierra Madre, Mexico). J. Hydrol. 2002, 266, 1–14. [Google Scholar] [CrossRef] [Scilit]
- Baroni, G.; Facchi, A.; Gandolfi, C.; Ortuani, B.; Horeschi, D.; Van Dam, J.C. Uncertainty in the Determination of Soil Hydraulic Parameters and Its Influence on the Performance of Two Hydrological Models of Different Complexity. Hydrol. Earth Syst. Sci. 2010, 14, 251–270. [Google Scholar] [CrossRef] [Scilit]
- Morbidelli, R.; Saltalippi, C.; Flammini, A.; Cifrodelli, M.; Picciafuoco, T.; Corradini, C.; Govindaraju, R.S. In Situ Measurements of Soil Saturated Hydraulic Conductivity: Assessment of Reliability through Rainfall–Runoff Experiments. Hydrol. Process. 2017, 31, 3084–3094. [Google Scholar] [CrossRef] [Scilit]
- Jiang, X.J.; Liu, W.; Wu, J.; Wang, P.; Liu, C.; Yuan, Z.Q. Land Degradation Controlled and Mitigated by Rubber-Based Agroforestry Systems through Optimizing Soil Physical Conditions and Water Supply Mechanisms: A Case Study in Xishuangbanna, China. Land Degrad. Dev. 2017, 28, 2277–2289. [Google Scholar] [CrossRef] [Scilit]
- Fatehnia, M.; Paran, S.; Kish, S.; Tawfiq, K. Automating Double Ring Infiltrometer with an Arduino Microcontroller. Geoderma 2016, 262, 133–139. [Google Scholar] [CrossRef] [Scilit]
- Picciafuoco, T.; Morbidelli, R.; Flammini, A.; Saltalippi, C.; Corradini, C.; Strauss, P.; Blöschl, G. On the Estimation of Spatially Representative Plot Scale Saturated Hydraulic Conductivity in an Agricultural Setting. J. Hydrol. 2019, 570, 106–117. [Google Scholar] [CrossRef] [Scilit]
- Chappell, N.A.; Lancaster, J.W. Comparison of Methodological Uncertainties within Permeability Measurements. Hydrol. Process. 2007, 21, 2504–2514. [Google Scholar] [CrossRef] [Scilit]
- Ilek, A.; Kucza, J. A Laboratory Method to Determine the Hydraulic Conductivity of Mountain Forest Soils Using Undisturbed Soil Samples. J. Hydrol. 2014, 519, 1649–1659. [Google Scholar] [CrossRef] [Scilit]
- Abdennour, E.; Guellouz, L.; Dahmouni, M.; Hachicha, M. Estimation of the Hydraulic Parameters of a Stratified Alluvial Soil in the Region of El Haouareb—Central Tunisia. Experiments, Empirical, Analytical and Inverse Models. Hydrology 2024, 11, 181. [Google Scholar] [CrossRef] [Scilit]
- Fu, T.; Chen, H.; Zhang, W.; Nie, Y.; Wang, K. Vertical Distribution of Soil Saturated Hydraulic Conductivity and Its Influencing Factors in a Small Karst Catchment in Southwest China. Environ. Monit. Assess. 2015, 187, 92. [Google Scholar] [CrossRef] [Scilit] [PubMed]
- Tian, J.; Zhang, B.; He, C.; Yang, L. Variability in Soil Hydraulic Conductivity and Soil Hydrological Response under Different Land Covers in the Mountainous Area of the Heihe River Watershed, Northwest China. Land Degrad. Dev. 2017, 28, 1437–1449. [Google Scholar] [CrossRef] [Scilit]
- Pan, T.; Hou, S.; Wu, S.; Liu, Y.; Liu, Y.; Zou, X.; Herzberger, A.; Liu, J. Variation of Soil Hydraulic Properties with Alpine Grassland Degradation in the Eastern Tibetan Plateau. Hydrol. Earth Syst. Sci. 2017, 21, 2249–2261. [Google Scholar] [CrossRef] [Scilit]
- Mishra, S.K.; Tyagi, J.V.; Singh, V.P. Comparison of Infiltration Models. Hydrol. Process. 2003, 17, 2629–2652. [Google Scholar] [CrossRef] [Scilit]
- Chahinian, N.; Moussa, R.; Andrieux, P.; Voltz, M. Comparison of Infiltration Models to Simulate Flood Events at the Field Scale. J. Hydrol. 2005, 306, 191–214. [Google Scholar] [CrossRef] [Scilit]
- Turner, E. Comparison of Infiltration Equations and Their Field Validation by Rainfall Simulation. Order No. 1439164 ed. Master’s Thesis, University of Maryland, College Park, MD, USA, 2006. Available online: https://www.proquest.com/dissertations-theses/comparison-infiltration-equations-their-field/docview/305300546/se-2 (accessed on 7 October 2026).
- Sihag, P.; Tiwari, N.K.; Ranjan, S. Estimation and Intercomparison of Infiltration Models. Water Sci. 2017, 31, 34–43. [Google Scholar] [CrossRef] [Scilit]
- Vand, A.S.; Sihag, P.; Singh, B.; Zand, M. Comparative Evaluation of Infiltration Models. KSCE J. Civ. Eng. 2018, 22, 4173–4184. [Google Scholar] [CrossRef] [Scilit]
- Trinh, T.; Kavvas, M.L.; Ishida, K.; Ercan, A.; Chen, Z.Q.; Anderson, M.L.; Ho, C.; Nguyen, T. Integrating Global Land-Cover and Soil Datasets to Update Saturated Hydraulic Conductivity Parameterization in Hydrologic Modeling. Sci. Total Environ. 2018, 631–632, 279–288. [Google Scholar] [CrossRef] [Scilit] [PubMed]
- Nestingen, R.; Asleson, B.C.; Gulliver, J.S.; Hozalski, R.M.; Nieber, J.L. Laboratory Comparison of Field Infiltrometers. J. Sustain. Water Built Environ. 2018, 4, 04018005. [Google Scholar] [CrossRef] [Scilit]
- Han, T.; Liu, L.; Li, G. The Influence of Horizontal Variability of Hydraulic Conductivity on Slope Stability under Heavy Rainfall. Water 2020, 12, 2567. [Google Scholar] [CrossRef] [Scilit]
- Sorman, A.U.; Abdulrazzak, M.J.; Ugas, M.A.S. Application of Infiltration Models to Field Data from Wadi Tabalah, Saudi Arabia. In Application of Tracers in Arid Zone Hydrology; IAHS Publication: Wallingford, UK, 1995; pp. 305–315. Available online: https://www.cabidigitallibrary.org/doi/full/10.5555/19961903237 (accessed on 7 October 2026).
- Elfeki, A.; Masoud, M.; Basahi, J.; Zaidi, S. A Unified Approach for Hydrological Modeling of Arid Catchments for Flood Hazards Assessment: Case Study of Wadi Itwad, Southwest of Saudi Arabia. Arab. J. Geosci. 2020, 13, 490. [Google Scholar] [CrossRef] [Scilit]
- Niyazi, B.; Masoud, M.; Elfeki, A.; Rajmohan, N.; Alqarawy, A.; Rashed, M. A Comparative Analysis of Infiltration Models for Groundwater Recharge from Ephemeral Stream Beds: A Case Study in Al Madinah Al Munawarah Province, Saudi Arabia. Water 2022, 14, 1686. [Google Scholar] [CrossRef] [Scilit]
- Niyazi, B.; Masoud, M.; Elfeki, A.; Rajmohan, N.; Alqarawy, A.; Rashed, M. Modeling Variability of Infiltration Tests in Ephemeral Stream Beds as a Random Function for Uncertainty Quantification. Appl. Water Sci. 2023, 13, 87. [Google Scholar] [CrossRef] [Scilit]
- Youssefi, F.; Khorrami, B.; Ali, S.; Soltani, S.S.; Zoej, M.J.V.; Li, J.; Ghaderpour, E. Open data analysis of terrestrial water storage and water availability in the Middle East: Spatiotemporal trends, hydroclimatic drivers, and socio-ecological implications. Ecol. Inform. 2026, 93, 103571. [Google Scholar] [CrossRef] [Scilit]
- Sherif, M.; Sefelnasr, A.; Al Rashed, M.; Alshamsi, D.; Zaidi, F.K.; Alghafli, K.; Baig, F.; Al-Turbak, A.; Alfaifi, H.; Loni, O.A.; et al. A review of managed aquifer recharge potential in the Middle East and North Africa Region with examples from the Kingdom of Saudi Arabia and the United Arab Emirates. Water 2023, 15, 742. [Google Scholar] [CrossRef] [Scilit]
- Saad, M.; Awni, B.; Eslam, E.; Abdulaziz, A.-B.; Elkhedr, I.; Saleh, Q. Aquifer Boundaries Explored by Geoelectrical Measurements in the Red Sea Coastal Plain of Jazan Area, Southwest Saudi Arabia. Int. J. Phys. Sci. 2011, 6, 3688–3696. [Google Scholar] [CrossRef]
- Abdalla, F. Ionic Ratios as Tracers to Assess Seawater Intrusion and to Identify Salinity Sources in Jazan Coastal Aquifer, Saudi Arabia. Arab. J. Geosci. 2016, 9, 40. [Google Scholar] [CrossRef] [Scilit]
- Mahmoud, S.H.; Alazba, A.A.; T, A.M. Identification of Potential Sites for Groundwater Recharge Using a GIS-Based Decision Support System in Jazan Region—Saudi Arabia. Water Resour. Manag. 2014, 28, 3319–3340. [Google Scholar] [CrossRef] [Scilit]
- Al-Bassam, A.M.; Hussein, M.T. Combined Geo-Electrical and Hydro-Chemical Methods to Detect Salt-Water Intrusion: A Case Study from Southwestern Saudi Arabia. Manag. Environ. Qual. 2008, 19, 179–193. [Google Scholar] [CrossRef] [Scilit]
- Elawadi, E.; Mogren, S.; Ibrahim, E.; Batayneh, A.; Al-Bassam, A. Utilizing Potential Field Data to Support Delineation of Groundwater Aquifers in the Southern Red Sea Coast, Saudi Arabia. J. Geophys. Eng. 2012, 9, 327–335. [Google Scholar] [CrossRef] [Scilit]
- El Alfy, M.; Lashin, A.; Al-Arifi, N.; Al-Bassam, A. Groundwater Characteristics and Pollution Assessment Using Integrated Hydro-Chemical Investigations GIS and Multivariate Geostatistical Techniques in Arid Areas. Water Resour. Manag. 2015, 29, 5593–5612. [Google Scholar] [CrossRef] [Scilit]
- Abdalla, F.; Al-Turki, A.; Al Amri, A. Evaluation of Groundwater Resources in the Southern Tihama Plain, Saudi Arabia. Arab. J. Geosci. 2015, 8, 3299–3310. [Google Scholar] [CrossRef] [Scilit]
- Mogren, S. Saltwater Intrusion in Jizan Coastal Zone, Southwest Saudi Arabia Inferred from Geoelectric Resistivity Survey. Int. J. Geosci. 2015, 6, 286–297. [Google Scholar] [CrossRef]
- Al-Turki, S. Water Resources in Saudi Arabia with Reference to Tihama Asir Province. Ph.D. Thesis, Durham University, Durham, UK, 1995. Available online: https://etheses.durham.ac.uk/id/eprint/5127/ (accessed on 7 October 2026).
- Wagner, W. Groundwater in the Arab Middle East; Springer: Berlin/Heidelberg, Germany, 2011. [Google Scholar] [CrossRef] [Scilit]
- Hussain, M.; Ibrahim, K. Electric Resistivity, Geochemical and Hydrogeological Study of Wadi Deposits, Western Saudi Arabia. J. King Abdulaziz Univ.-Earth Sci. 1996, 9, 55–72. Available online: https://api.semanticscholar.org/CorpusID:127929012 (accessed on 7 October 2026). [CrossRef] [Scilit]
- ASTM D3385-18; Standard Test Method for Infiltration Rate of Soils in Field Using Double-Ring Infiltrometer. ASTM International: West Conshohocken, PA, USA, 2018. [CrossRef] [Scilit]
- Horton, R.E. The Interpretation and Application of Runoff Plat Experiments with Reference to Soil Erosion Problems. Soil Sci. Soc. Am. J. 1939, 3, 340–349. [Google Scholar] [CrossRef] [Scilit]
- Philip, J.R. The theory of infiltration: 2. The profile of infinity. Soil Sci. 1957, 83, 435–448. Available online: https://www.ovid.com/jnls/soilsci/fulltext/00010694-195706000-00003~the-theory-of-infiltration-2-the-profile-of-infinity (accessed on 7 October 2026).
- Heber Green, W.; Ampt, G.A. Studies on Soil Phyics. J. Agric. Sci. 1911, 4, 1–24. [Google Scholar] [CrossRef] [Scilit]
- Kolmogorov, A.N. Sulla Determinazione Empirica di una Legge di Distribuzione. G. Ist. ital. Attuari 1933, 4, 83–91. Available online: https://www.scirp.org/reference/referencespapers?referenceid=2552411 (accessed on 7 October 2026).
- Hamed, K.; Rao, A.R. Flood Frequency Analysis; CRC Press: Boca Raton, FL, USA, 1999; Available online: https://www.routledge.com/Flood-Frequency-Analysis/Hamed-Rao/p/book/9780849300837 (accessed on 7 October 2026).
- Shillito, R.M. Infiltration into Water-Repellent Sand: The Role of Sorptivity. PhD Thesis, University of Nevada, Las Vegas, NV, USA, 2020. Available online: https://www.proquest.com/dissertations-theses/infiltration-into-water-repellent-sand-role/docview/2437577219/se-2 (accessed on 7 October 2026).
- Angulo-Jaramillo, R.; Vandervaere, J.-P.; Roulier, S.; Thony, J.-L.; Gaudet, J.-P.; Vauclin, M. Field Measurement of Soil Surface Hydraulic Properties by Disc and Ring Infiltrometers: A Review and Recent Developments. Soil Tillage Res. 2000, 55, 1–29. [Google Scholar] [CrossRef] [Scilit]
- NRCS. Soil Survey Field and Laboratory Methods Manual, version 2; Soil Survey Investigations Report No. 51; U.S. Department of Agriculture, Natural Resources Conservation Service: Washington, DC, USA, 2014. Available online: https://www.nrcs.usda.gov/sites/default/files/2023-01/SSIR51.pdf (accessed on 7 October 2026).
- Hsu, S.-Y.; Huang, V.; Park, S.W.; Hilpert, M. Water Infiltration into Prewetted Porous Media: Dynamic Capillary Pressure and Green-Ampt Modeling. Adv. Water Resour. 2017, 106, 60–67. [Google Scholar] [CrossRef] [Scilit]
- Moosavi, A.A.; Sepaskhah, A.R. Spatial Variability of Physico-chemical Properties and Hydraulic Characteristics of a Gravelly Calcareous Soil. Arch. Agron. Soil Sci. 2012, 58, 631–656. [Google Scholar] [CrossRef] [Scilit]
- Azadmard, B.; Mosaddeghi, M.R.; Ayoubi, S.; Chavoshi, E.; Raoof, M. Spatial Variability of Near-Saturated Soil Hydraulic Properties in Moghan Plain, Northwestern Iran. Arab. J. Geosci. 2018, 11, 452. [Google Scholar] [CrossRef] [Scilit]
- Jarvis, N.J.; Messing, I. Near-Saturated Hydraulic Conductivity in Soils of Contrasting Texture Measured by Tension Infiltrometers. Soil Sci. Soc. Am. J. 1995, 59, 27–34. [Google Scholar] [CrossRef] [Scilit]
- Clausnitzer, V.; Hopmans, J.W.; Starr, J.L. Parameter Uncertainty Analysis of Common Infiltration Models. Soil Sci. Soc. Am. J. 1998, 62, 1477–1487. [Google Scholar] [CrossRef] [Scilit]
- Mesquita, M.D.G.B.D.F.; Moraes, S.O.; Corrente, J.E. More Adequate Probability Distributions to Represent the Saturated Soil Hydraulic Conductivity. Sci. Agric. 2002, 59, 789–793. [Google Scholar] [CrossRef] [Scilit]
- Webster, R.; Oliver, M.A. Sample adequately to estimate variograms of soil properties. Eur. J. Soil Sci. 1992, 43, 177–192. [Google Scholar] [CrossRef] [Scilit]

Disclaimer/Publisher’s Note: The statements, opinions and data contained in all publications are solely those of the individual author(s) and contributor(s) and not of MDPI and/or the editor(s). MDPI and/or the editor(s) disclaim responsibility for any injury to people or property resulting from any ideas, methods, instructions or products referred to in the content. |
© 2026 by the authors. Licensee MDPI, Basel, Switzerland. This article is an open access article distributed under the terms and conditions of the Creative Commons Attribution (CC BY) license.