


Abstract
Optimizing chitosan recovery from shrimp shells is one of the most effective measures in shrimp waste management. Incorporating machine learning-based models will significantly impact the optimization process. This research aimed to evaluate the optimization of chitosan extraction from Litopenaeus vannamei shrimp shells using deproteinization and exploratory machine learning-based similarity model approaches. Chitosan extraction from shrimp shells was optimized using a deproteinization method, where various NaOH concentrations (1, 2, 3, 4, 5, and 10%) were applied at room temperature (RT) and 50 ± 2 °C, while maintaining controlled conditions for demineralization and deacetylation. The chitosan products were characterized by ash content, moisture, yield percentage, deproteinization efficiency, FTIR, deacetylation degree (DD), XRD, crystallinity index (CI%), and scanning electron microscopy (SEM). A machine learning random forest regressor model was developed to evaluate the similarities between the laboratory-synthesized and commercial chitosan (CC) samples. The results confirmed the formation of chitosan with semi-complete deacetylation (DD% from 98.84 ± 0.1% to 99.27 ± 0.004%). Deproteinization efficacy was in the range of 93.39 ± 0.083% to 97.0 ± 0.31%. XRD and SEM analyses demonstrated that commercial chitosan (CC) possessed a predominately amorphous structure, whereas the isolated chitosan samples exhibited low crystallinity, with increased amorphism at higher NaOH concentrations and temperatures. The machine learning-based similarity model indicated that Ch3 and Ch4 samples exhibited the highest resemblance degrees to commercial chitosan, while the S1 sample showed the lowest similarity. However, most of the recovered chitosan samples showed low similarity to commercial chitosan; they retained their higher degree of deacetylation (DD%), structural integrity, and quality parameters, indicating the success of the deproteinization route in enhancing chitosan production.
1. Introduction
Chitosan is a derivative of chitin, the second most abundant biopolymer in nature, found in shrimp shells. Chitin and chitosan have gained significant attention due to their diverse applications across various industries. The isolation of chitosan from shrimp waste involves partial or full deacetylation of chitin [1]. The FTIR spectroscopic analysis can determine the presence of functional groups either for chitin or chitosan based on the conversion rate of the acetyl glucosamine chain into glucosamine. Chitosan can be used in biomedical applications such as drug delivery systems, tissue engineering, and vaccine carriers [2]. Also, chitosan exhibits wide-range antimicrobial activity against several pathogenic species of bacteria and fungi, due to the interaction of its positively charged amino groups with negatively charged microbial cell surfaces which promotes its use in agriculture as a bio-based plant protection solution against pathogenic microorganisms [2,3,4,5]. Furthermore, chitosan can be applied as a natural preservative in the food industry [6]. Chitosan recovered from shrimp shells has also been found to effectively adsorb heavy metals and dyes, demonstrating its potential for environmental remediation in wastewater treatment [7]. Moreover, chitosan has attracted considerable attention in agriculture due to its ability to stimulate plant growth, enhance seed germination, improve tolerance to abiotic stresses such as drought, and suppress certain plant pathogenic microorganisms [8].
The use of shrimp shell waste to produce chitosan not only addresses environmental concerns through successful waste management but also provides economic benefits by obtaining economically valuable products [9]. The conversion of shrimp waste into chitosan offers an alternative, sustainable, eco-friendly solution to waste management of the shrimp aquaculture industry while producing materials that have diverse biomedical, environmental, industrial, and agricultural applications [10].
Chitosan recovery from various sources such as shrimp shells, snail shells, crab shells, and fish scales generally involves three main extraction stages: demineralization, deproteinization, and deacetylation [11,12,13]. Among these steps, deproteinization plays a particularly vital role in determining the purity and structural properties of the final chitosan, as it removes residual proteins bound to the chitin matrix. Together with demineralization and deacetylation, these processes eliminate proteins, minerals, and acetyl groups, respectively, to obtain high-purity chitosan [7,14,15]. Previous studies have shown that deproteinization and demineralization strongly influence chitosan yield, ash content, and degree of deacetylation, since the removal of proteins and minerals reduces the residual non-chitosan fraction and affects the final mass of the recovered material [16,17,18].
Optimal deproteinization and demineralization conditions, such as acid and alkali concentrations, temperature, and duration, are necessary to maximize the yield and quality of chitosan [9,17,19,20]. Moreover, the deacetylation degree (DD) of chitosan, which depends on the deproteinization process, plays a significant role in determining the physicochemical properties of chitosan [21,22,23]. A high degree of deacetylation is associated with better solubility and lower susceptibility to biodegradation [20,24,25,26,27,28].
Optimizing chitosan recovery and quality requires careful control of the extraction conditions across the three main processing stages: demineralization, deproteinization and deacetylation. Previous studies have reported that the efficiency of these stages is strongly influenced by extraction processing parameters such as alkali concentration and temperature during deproteinization, as well as acid concentration and treatment frequency during demineralization [16,29,30,31]. Although the importance of alkali concentration and temperature during the deproteinization phase of chitosan extraction has been widely reported, the influence of this stage on the physicochemical and structural characteristics of the resulting chitosan remains less clearly discussed [20,32].
Our previously published papers have addressed distinct aspects of chitosan extraction from shrimp shells. In our previous contribution, chitosan yield was assessed through a combination of literature research and artificial neural network modeling to identify key extraction parameters [33]. Subsequently, an experimental feasibility study was conducted to optimize the acidic demineralization stage through different HCl concentrations while keeping deproteinization and deacetylation conditions constant [34]. Building on these findings, the present research focuses on optimizing the deproteinization stage to find the optimal conditions for removing residual proteins and determining the structural characteristics and purity of chitosan isolated from shrimp shells (Litopenaeus vannamei). Moreover, the current study provides a deterministic similarity scoring framework and an exploratory machine learning framework based on purity and structural characteristics to evaluate the similarity between the extracted chitosan samples and commercial chitosan. The similarity framework introduces multiple physicochemical and structural descriptors which include moisture content, ash content, FTIR spectra and crystallinity index to create a unified scoring system. The study used exploratory machine learning to determine if measured descriptors maintained the same similarity grouping pattern.
Therefore, the objectives of this study include (i) the manipulation of different deproteinization alkali concentrations at room temperature and 50 ± 2 °C temperature at stabilized demineralization and deacetylation conditions to optimize chitosan extraction and (ii) the investigation of the effect of the deproteinization step on the physicochemical and structural characteristics of the obtained chitosan. Furthermore, (iii) the innovative approach of a deterministic similarity scoring and exploratory machine learning-based similarity model combined with advanced visualization techniques will be leveraged to evaluate the resemblance of extracted chitosan samples to commercial chitosan.
2. Materials and Methods
2.1. Material
Ashless filter paper grade 440, sodium hydroxide pellets (98%), and hydrochloric acid (37%), from Merk (Darmstadt, Germany), PanReac AppliChem (Barcelona, Spain), and Frisenette (Knebel, Denmark), respectively, were used. All the necessary solutions for eliminating minerals, proteins, and acetyl groups were made using high-purity double distilled water. Commercial chitosan (91.6% deacetylated) was supplied by Santa Cruz Biotechnology, located in TX, USA. Shrimps (Litopenaeus vannamei) subjected to this study were purchased from the local market in Lithuania.
2.2. Methods
2.2.1. Shrimp Shells Pre-Treatment
Shrimps (Litopenaeus vannamei) were collected from the Lithuanian local market. Afterwards, they were carefully packaged and delivered to the Lithuanian Research Centre for Agriculture and Forestry’s Agrobiology Laboratory at the Institute of Agriculture (LAMMC). Shrimps were peeled, the exoskeleton shells were collected, prepared by washing them several times with distilled water, sorting them to remove impurities, and then drying them at 105 °C in the oven. The collected shrimp shells were cleaned to remove residual tissues, dried, and mechanically ground using a laboratory grinder. The ground material was then sieved to obtain particles with an approximate size of 0.25 mm. The resulting shell powder was boiled in double distilled water for 1 h, after which the suspension was filtered, and the filtrate was oven-dried at 75 °C for 24 h. The shrimp shell composition was analyzed according to AOAC (2005) [35]. Protein content was determined using elemental analyzer (ECS 4010, COSTECH, Santa Clarita, CA, USA) [33]. The mineral content of raw shells was determined using an inductively coupled plasma, conjugated with optical emission spectroscopy (ICP-OES, PerkinElmer, Waltham, MA, USA) [36]. A scanning electron microscope (SEM Hitachi S-3400N, Hitachi High-Technologies Corporation, Tokyo, Japan) [37] was employed to examine the topography of the shell surface.
2.2.2. Optimization Design for Extraction Process
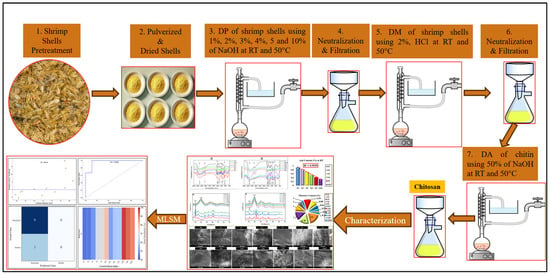
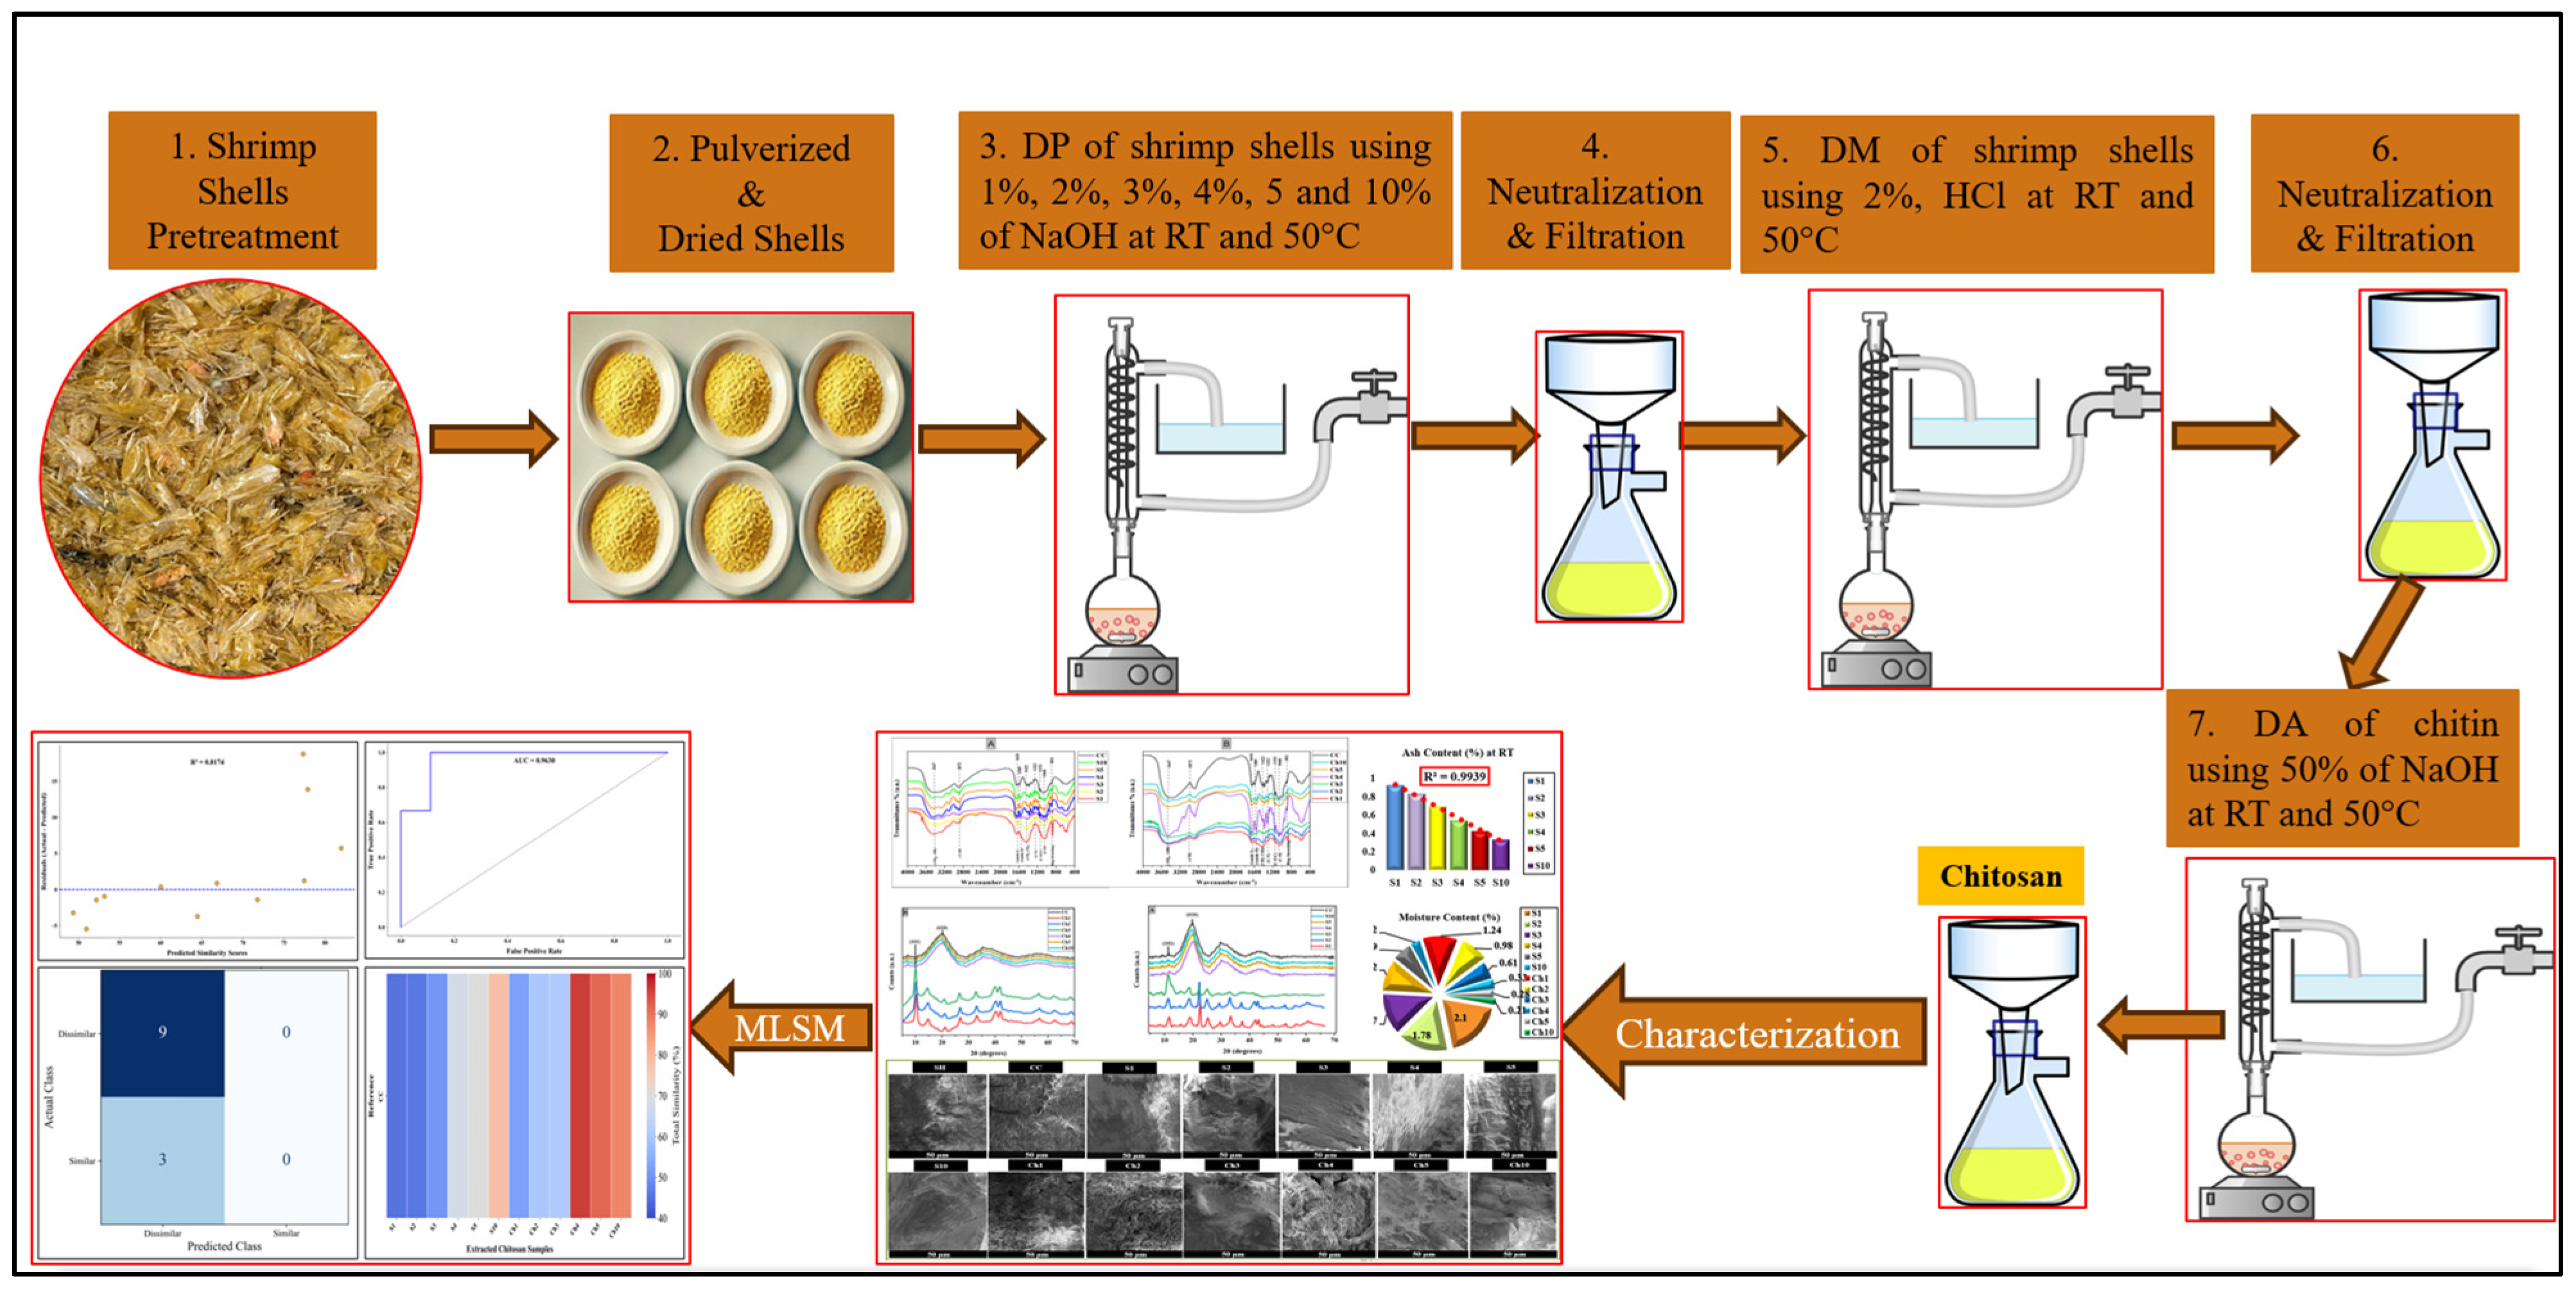
The experimental design in this study utilized a 6 × 2 factorial structure, incorporating the testing of six NaOH concentrations during the deproteinization phase (1, 2, 3, 4, 5, and 10%) evaluated at two temperatures (23 ± 2 °C and 50 ± 2 °C). This study utilized these two factors as the main variables. All other extraction parameters were kept constant to minimize confounding influences, including the demineralization and deacetylation reagent concentrations (2% HCl and 50% NaOH, respectively), reaction duration (2 h for each stage), and solid-to-solvent ratio (1:10, w/v). This research employed 12 treatment combinations duplicated to generate a complete set of 24 experimental units. The graphical scheme in Figure 1 illustrates the enhancement of the extraction process through the deproteinization and similarity modeling method. Ambient temperature (23 ± 2 °C) was selected through all extraction phases as a baseline test condition to assess the extraction process efficiency without any thermal energy input. In contrast, a temperature of 50 ± 2 °C was selected as a moderate elevated temperature to enhance the removal efficiency of protein, minerals and acetyl groups while maintaining below temperatures likely to promote polymer degradation. Previous studies have reported that extraction efficiency and chitosan purity can be improved when extraction temperatures are in the range between 40 and 60 °C under controlled processing conditions [21,33,38,39].
Figure 1.
Graphical scheme of chitosan extraction using deproteinization and (MLSM) machine learning-based similarity model approaches.
Twelve samples were classified based on the experimental design matrix, as shown in Table 1. A constant solid-to-solvent ratio of 1:10 (w/v) was applied in the extraction process for all extraction stages to provide sufficient solvent to fully submerge the shell material while allowing proper contact between solid and liquid phases. The study used this specific ratio as a fixed operating condition for all treatment combinations to ensure comparable reaction conditions across all extraction phases rather than an independently optimized parameter [33,34].
Table 1.
Experimental design and classification of chitosan samples.
2.2.3. Chitosan Recovery
Deproteinization
Six samples of dried shell powder were treated with sodium hydroxide solutions at concentrations of 1, 2, 3, 4, 5, and 10% for protein removal. A solid-to-solvent ratio of 1:10 (w/v) was maintained for all treatments. The deproteinization stage was carried out at room temperature (23 ± 2 °C) and 50 ± 2 °C under continuous stirring at 150 rpm for 2 h; after this period, the samples were left standing in the alkaline medium for an additional 24 h at room temperature without agitation. The treated shells were then filtered and rinsed repeatedly with double distilled water to reach neutrality, followed by air drying for 24 h at room temperature. Nitrogen content in the recovered samples was determined using an elemental analyzer (ECS 4010, COSTECH, USA), and protein content was estimated using the stoichiometric method suggested by Díaz-Rojas et al. [40]. The percentage of protein removal was calculated for all samples in duplicate using the following equation [33].
where Psh and Pdp are protein concentrations in percentages in raw and deproteinized shells, respectively, and Bsh and Bdp are biomass in grams of raw and deproteinized shells, respectively.
Protein Removal (%) = ((Psh × Bsh) − (Pdp × Bdp))/(Psh × Bsh) × 100
Demineralization
Shrimp shells contain several mineral components with calcium occurring mainly as calcium carbonate. For the demineralization stage, the deproteinized shell powder was treated with 2%HCl using a solid-to-solvent ratio of 1:10 (w/v). The demineralization reaction was carried out at room temperature and 50 ± 2 °C, under continuous stirring conditions at 150 rpm for 2 h. The release of carbon dioxide was an indicator of effective acidic demineralization. After completion of the reaction, the material was filtered and washed thoroughly with double distilled water until neutrality was reached, followed by oven-drying at 75 °C for 12 h to obtain chitin [34].
Deacetylation
The chitin obtained after demineralization was converted to chitosan by treatment with 50% NaOH at a solid-to-solvent ratio of 1:10 (w/v). The reaction was performed at room temperature (23 ± 2 °C) and 50 ± 2 °C with continuous stirring at 150 rpm for 2 h. Afterward, the reaction mixture was kept in the alkaline medium for an additional 24 h. at room temperature without agitation. The resulting chitosan was then filtered and washed repeatedly with double distilled water until neutral pH was reached to remove excess alkali. Afterwards, the washed samples were subsequently dried at 105 °C for 12 h. The dried chitosan samples were then subjected to characterization [34].
2.2.4. Chitosan Characterization
Determination of Ash and Moisture Content
In this study, the recovered chitosan samples were determined among ash and moisture contents in duplicate using an AOAC [35] and gravimetric standard methods [41], respectively, as expressed in the following equations:
Ash Content (%) = (Weight of Ash)/(Initial Sample Weight) × 100
Moisture Content (%) = (Initial Chitosan Weight-Dried Chitosan Weight)/(Initial Chitosan Weight) × 100
Determination of Chitosan Yield
Chitosan yield was calculated for all extracted samples in duplicate as the ratio of the recovered chitosan mass to the initial mass of raw shrimp shells, multiplied by 100 [35].
FTIR (Fourier Transform Infrared) Analysis
FTIR (Alpha spectrometer (BRUKER, Ettlingen, Germany) with RT-DLATGS detector, 64 scans, and 6 cm−1 resolution) was performed to confirm the formation of chitosan by analyzing the functional groups present in commercial and isolated chitosan samples. For pellet preparation, 3 mg of each dried chitosan sample was mixed with 200 mg of KBr, while a pure KBr pellet served as the blank reference. Spectral acquisition was performed over the range of 4000–400 cm−1. FTIR spectra provided detailed insights into the vibrational modes and functional groups of commercial and isolated samples. The deacetylation degree of the recovered chitosan products was estimated in duplicate from the FTIR spectra using the equation proposed by [42]:
where A1655 corresponds to the absorbance of the amide I band and A3450 corresponds to the absorbance of the hydroxyl (-OH) band, and the factor of 1.33 expresses the ratio of the A1655 to A3450 for fully deacetylated chitin.
DD (%) = (100 − {(A1650/A3450) × 100/1.33} %
SEM (Scanning Electronic Microscopy) Analysis
SEM (Hitachi S-3400N, Hitachi High-Technologies Corporation, Tokyo, Japan) was employed to examine the surface topography of commercial and recovered chitosan samples. Images were acquired at magnification modes of ×50, ×100, ×500, and ×1000, using a secondary electron detector at an accelerating voltage of 3 kV to obtain high-resolution surface topography images [43].
XRD (X-Ray Diffraction) Analysis
The crystalline structure of commercial and extracted chitosan samples was analyzed using an X-ray diffractometer (XRD, Bruker D8, Bruker AXS GmbH, Karlsruhe, Germany) operating with Cu Kα radiation in a theta–theta configuration over a 2θ range of 10–70° with a step size of 0.01°. Prior to crystallinity analysis, the diffractograms were subjected to baseline correction and complete peak deconvolution in order to separate the crystalline and amorphous contributions. The relative crystallinity of each sample was then determined from the areas of the deconvoluted crystalline peaks. The crystallinity index (CI%) was calculated using the ratio of the crystalline area (CrA) to the total diffractogram area (TDA), as described by [44] and according to the following equation:
CI (%) = 100 × CrA/TDA
2.2.5. Statistical Analysis
All statistical analyses were performed using IBM SPSS Statistics for Windows, Version 25.0. (Armonk, NY, USA). The data were analyzed by analysis of variance (ANOVA), and differences between means were assessed using 95% confidence intervals. Statistical significance was at a level of p ≤ 0.05.
2.2.6. Similarity Modeling Approach
The similarity framework was designed to compare the extracted chitosan samples (S1, S2, S3, S4, S5, S10, Ch1, Ch2, Ch3, Ch4, Ch5, and Ch10) with commercial chitosan (CC) as reference material. The comparison of similarity was based on selected characteristics including moisture content, ash content, the wavenumber of the hydroxyl (-OH) band, the transmittance of the hydroxyl (-OH) band, the wavenumber of the amide I bands, the transmittance of the amide I bands, and the crystallinity index (CI) of each sample. The selected parameters describe the isolated chitosan’s structural properties, purity, and its primary chemical features relative to the commercial chitosan. The design included data preprocessing, similarity percentage calculation, exploratory machine learning modeling, and multiple graphical visualization, which involved receiver operating characteristic (ROC) curve, residual plot, heatmap, and confusion matrix. The design and functionality of each component are detailed below [45].
- Dataset preprocessing: To provide numerical data demonstrating various characteristics of the reference commercial chitosan (CC) and isolated chitosan samples to ensure they are properly formatted and scaled for similarity analysis and regression modeling.
- Data structure: Each row corresponds to a chitosan sample, with the first row representing the commercial chitosan (CC) as a reference, and the dataset included the following:
- Moisture content (%) representing the water content in each sample.
- Ash content (%) indicating the inorganic content in each chitosan sample.
- The (FTIR) wavenumbers and transmittances of the hydroxyl (-OH) and amide I bands reflected the chemical properties and deacetylation degree of the chitosan material.
- The crystallinity index (CI) of each sample indicated the structural order characteristics of each chitosan material.
- iii.
- Similarity calculation: The feature-wise similarity and the overall similarity percentage between each extracted chitosan sample and commercial chitosan as a reference were calculated using a deterministic scoring function based on the selected measured features according to the following steps:
Sample Feature Wise Similarity = 1 − |Sample Feature − CC Feature|/(CC Feature)
Overall Similarity % = 1 − |Sum of Sample Feature Similarities|/(Number of Features) × 100
Although the applied deterministic similarity scoring formula may theoretically yield negative values for large deviations, all feature-wise similarities in the present dataset remained within a reasonable range. Therefore, the metric was used as a relative dataset-specific comparison tool rather than as a universal index. All selected features were treated with equal weight in order to provide a transparent first-order comparison among chitosan samples. The equal-weighting assumption demonstrates simplification because it assumes that all parameters have the same weight while different physicochemical and structural parameters might differently affect chitosan quality depending on various applications. This method enables a practical integrated comparison between the obtained samples and commercial chitosan by using the major measured characteristics.
- iv.
- Similarity threshold: The similarity threshold of 85% was used to classify samples into two groups which were designated as “similar” and “dissimilar” based on their relative resemblance to commercial chitosan. The threshold functioned as an empirical criterion to identify the resemblance of physicochemical and structural properties of extracted samples to commercial chitosan reference samples found in the existing dataset.
- v.
- Exploratory machine learning random forest regression: Because the total number of samples was limited, a random forest regression model was employed only as an exploratory step following the similarity deterministic calculation [38,39,40,41,42] to verify whether the selected descriptors reproduced the same pattern obtained from similarity framework. The data was split into a training 80% and a test 20% subset. The model was trained using the training data, and the overall similarity scores were predicted for the entire dataset.
- vi.
- Visualization: The results of the model and similarity calculations were represented using the receiver operating characteristic curve (ROC) to evaluate the binary classification of chitosan samples as similar or dissimilar, and the area under the curve (AUC) was calculated to estimate the classification performance of the model and the residual plot of differences between predicted and actual similarities was applied to identify whether the exploratory model has potential biases or inaccuracies [46,47,48]. Furthermore, the heatmap was performed within the color range of blue and red to display the total similarity percentages between the extracted chitosan sample and commercial chitosan as a reference and to easily identify the low and high similarity samples [49,50]. Additionally, the exploratory model performance was summarized using the confusion matrix to distinguish between similar and dissimilar samples by displaying counts of true positives, false positives, true negatives, and false negatives [51,52,53,54].
3. Results and Discussion
3.1. Raw Shell Analysis
In the present study, chitosan was recovered from shrimp shells using varying concentrations of NaOH (1, 2, 3, 4, 5, and 10%) for alkaline deproteinization as an initial step. Deproteinization reaction was carried out at ambient temperature (23 ± 2 °C) and 50 ± 2 °C, while demineralization and deacetylation steps were kept under fixed conditions. The analysis of raw shell composition showed 47.485 ± 0.835% moisture content on a wet basis, while the protein (30.48 ± 0.29%) and ash contents (57.45 ± 0.12%) were determined on a dry weight basis. The protein content of shrimp shells observed in this study was lower than the value (38.49%) reported by [21], even though that study reported lower moisture and ash contents (11.39% and 35.02%) compared to the present research. Mineral profiling by ICP-OES, indicated that calcium is the predominant mineral in the raw shells (14.83 ± 0.22%), followed by phosphorus (2.58 ± 0.04%) and magnesium (1.35 ± 0.01%). The calcium content in this study was lower than the calcium content (41.21%) found in shrimp material reported by [55].
3.2. Ash and Moisture Contents
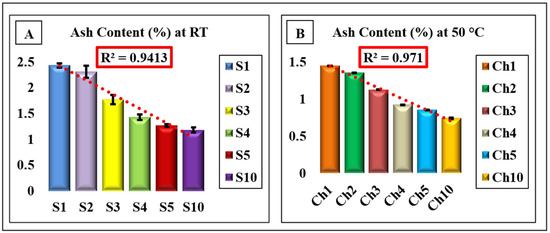
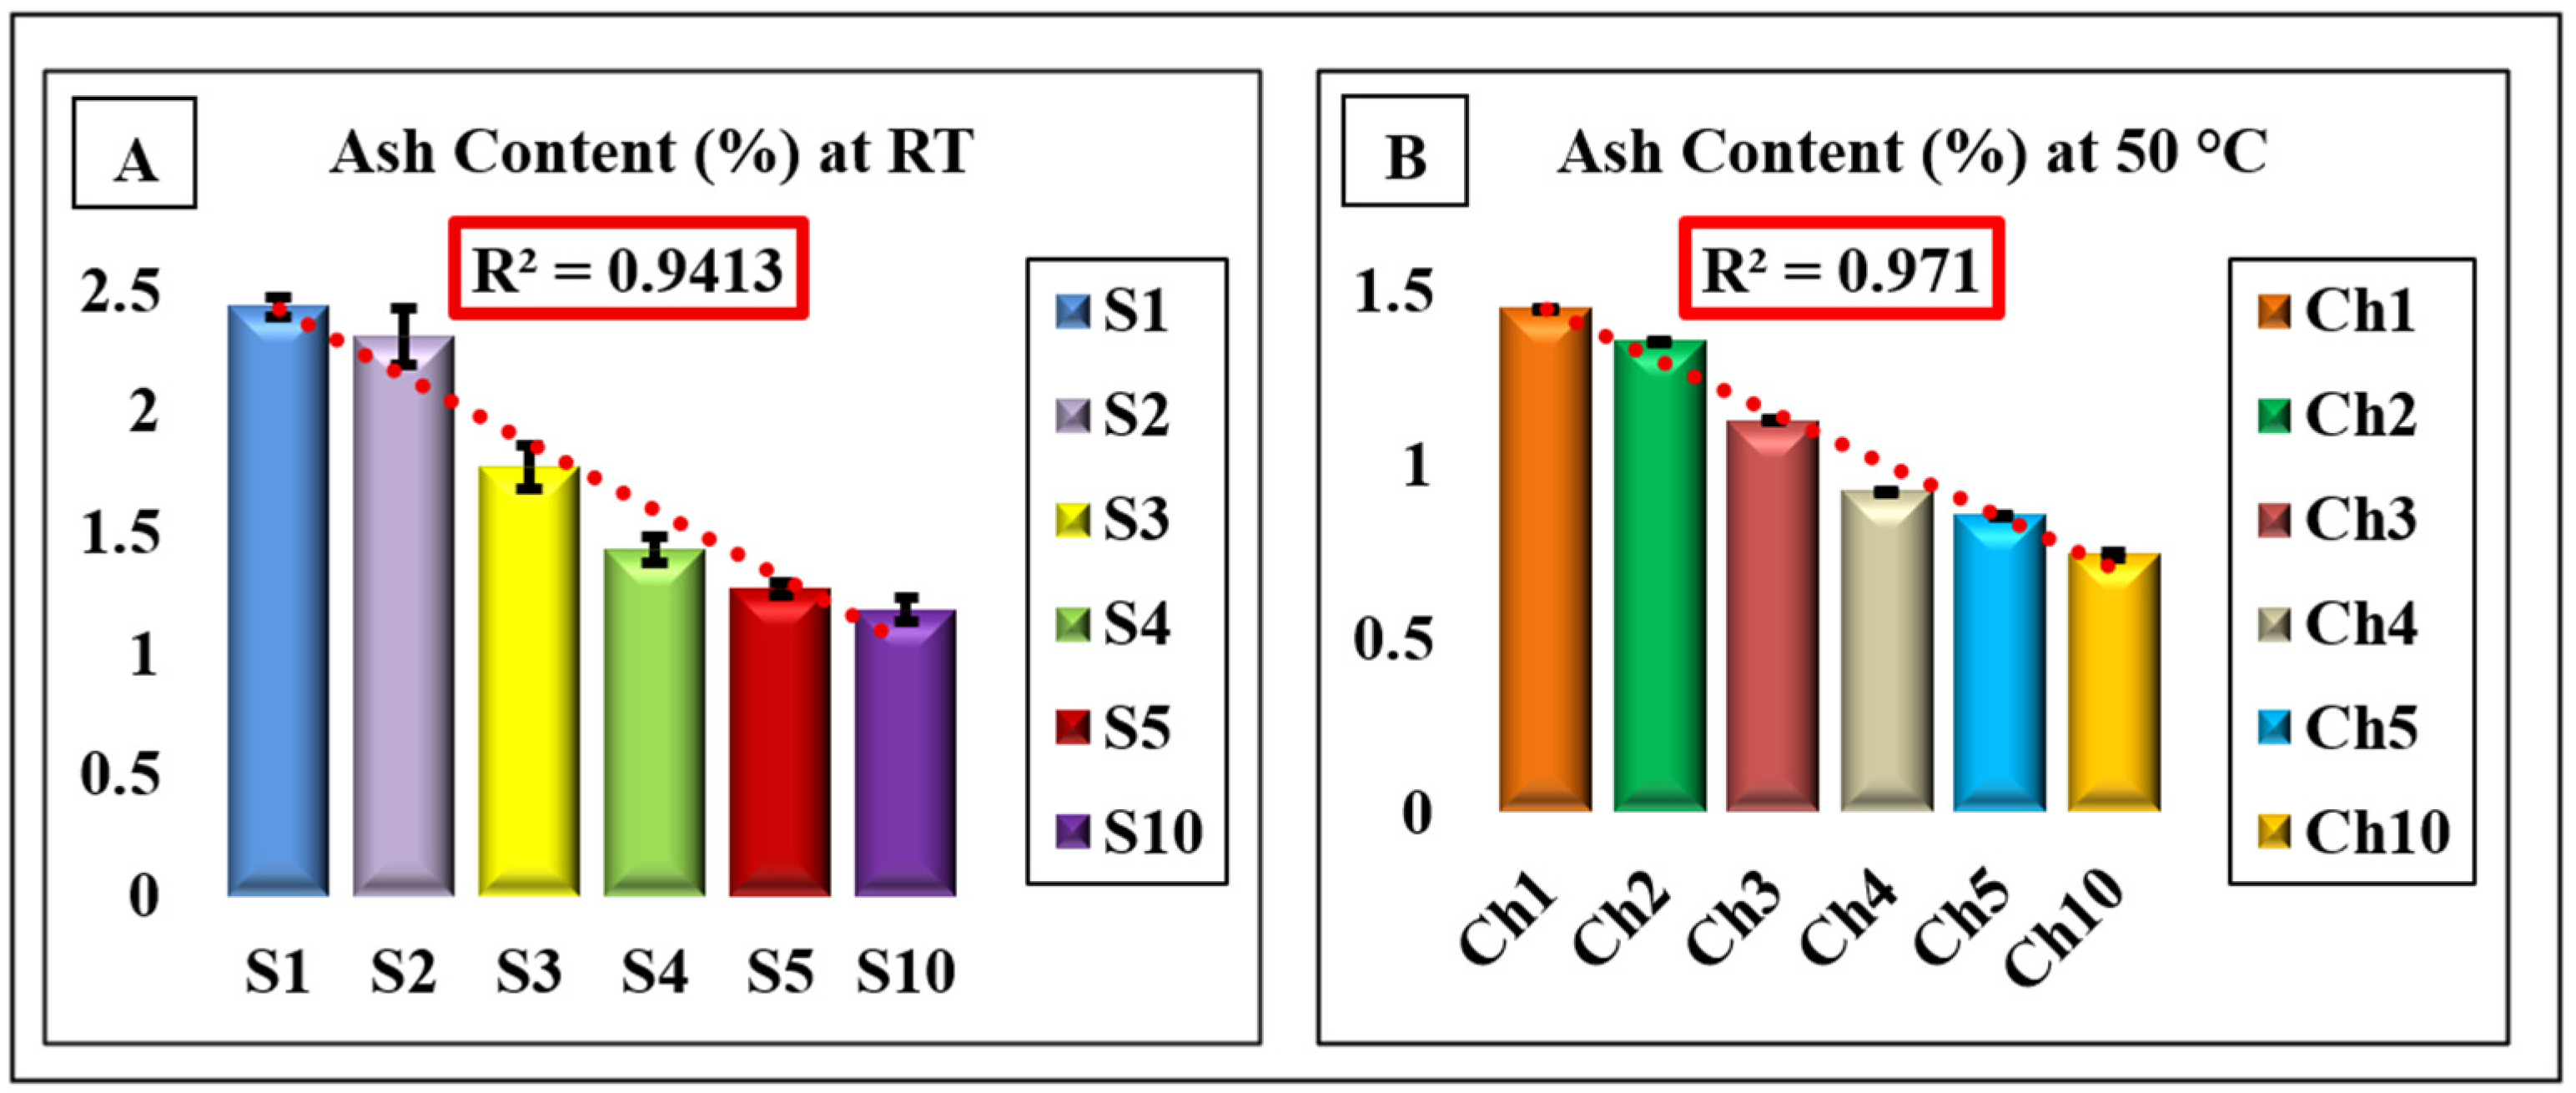
Low ash content is one of the main indicators of successful acidic demineralization because it reflects efficient mineral removal and improved chitosan purity. The ash content of commercial chitosan was 1.2 ± 0.05%, whereas chitosan obtained in the current research varied from 2.43 ± 0.042% to 1.18 ± 0.07% for chitosan recovered at room temperature (23 ± 2 °C), and from 1.44 ± 0.16 to 0.74 ± 0.05% for chitosan extracted at 50 ± 2 °C (see Figure 2A and Figure 2B, respectively), indicating the effectiveness of removing minerals under elevated temperature (50 ± 2 °C). The statistical analysis (ANOVA) indicated that the concentration of NaOH (p < 0.001), temperature (p < 0.001), and their interaction (p < 0.001) had a significant effect on ash content. Ash decreased from 2.43% at 1% NaOH to 1.18% at 10% NaOH at room temperature, whereas at 50 °C the reduction was more pronounced from 1.45% at 1% NaOH to only 0.74% at 10% NaOH. This trend suggests improved demineralization with increasing NaOH concentration and temperature during the deproteinization stage.
Figure 2.
Ash content (%) of recovered chitosan samples under different deproteinization conditions at (A) at ambient temperature (RT) and (B) at 50 ± 2 °C. Data are shown as mean ± SD (n = 2).
This study’s results are in agreement with Sagheer et al. [56], who stated that an increase in alkali concentration and higher extraction temperatures caused a significant drop in ash and favored the removal of calcium carbonate from crustacean shells. Therefore, 10% NaOH at 50 °C seems to be the best combination to remove ash, providing material suitable for high-value applications. In contrast, other previous studies reported that multi-stage demineralization is more effective at eliminating minerals compared to the single-stage method [57]. However, the application of multiple bath demineralization could result in elevating environmental degradation through increasing the disposal of acidic waste [58]. The present results suggest that effective acidic demineralization can still be achieved using a single-stage HCl treatment after deproteinization stage.
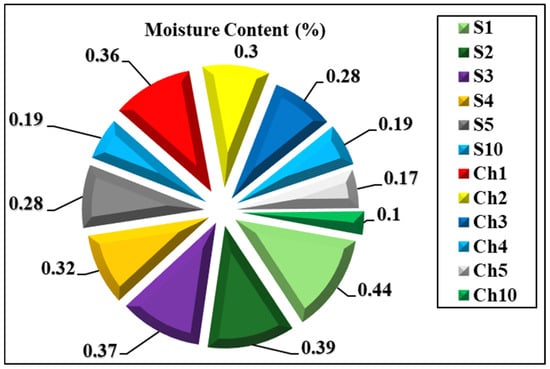
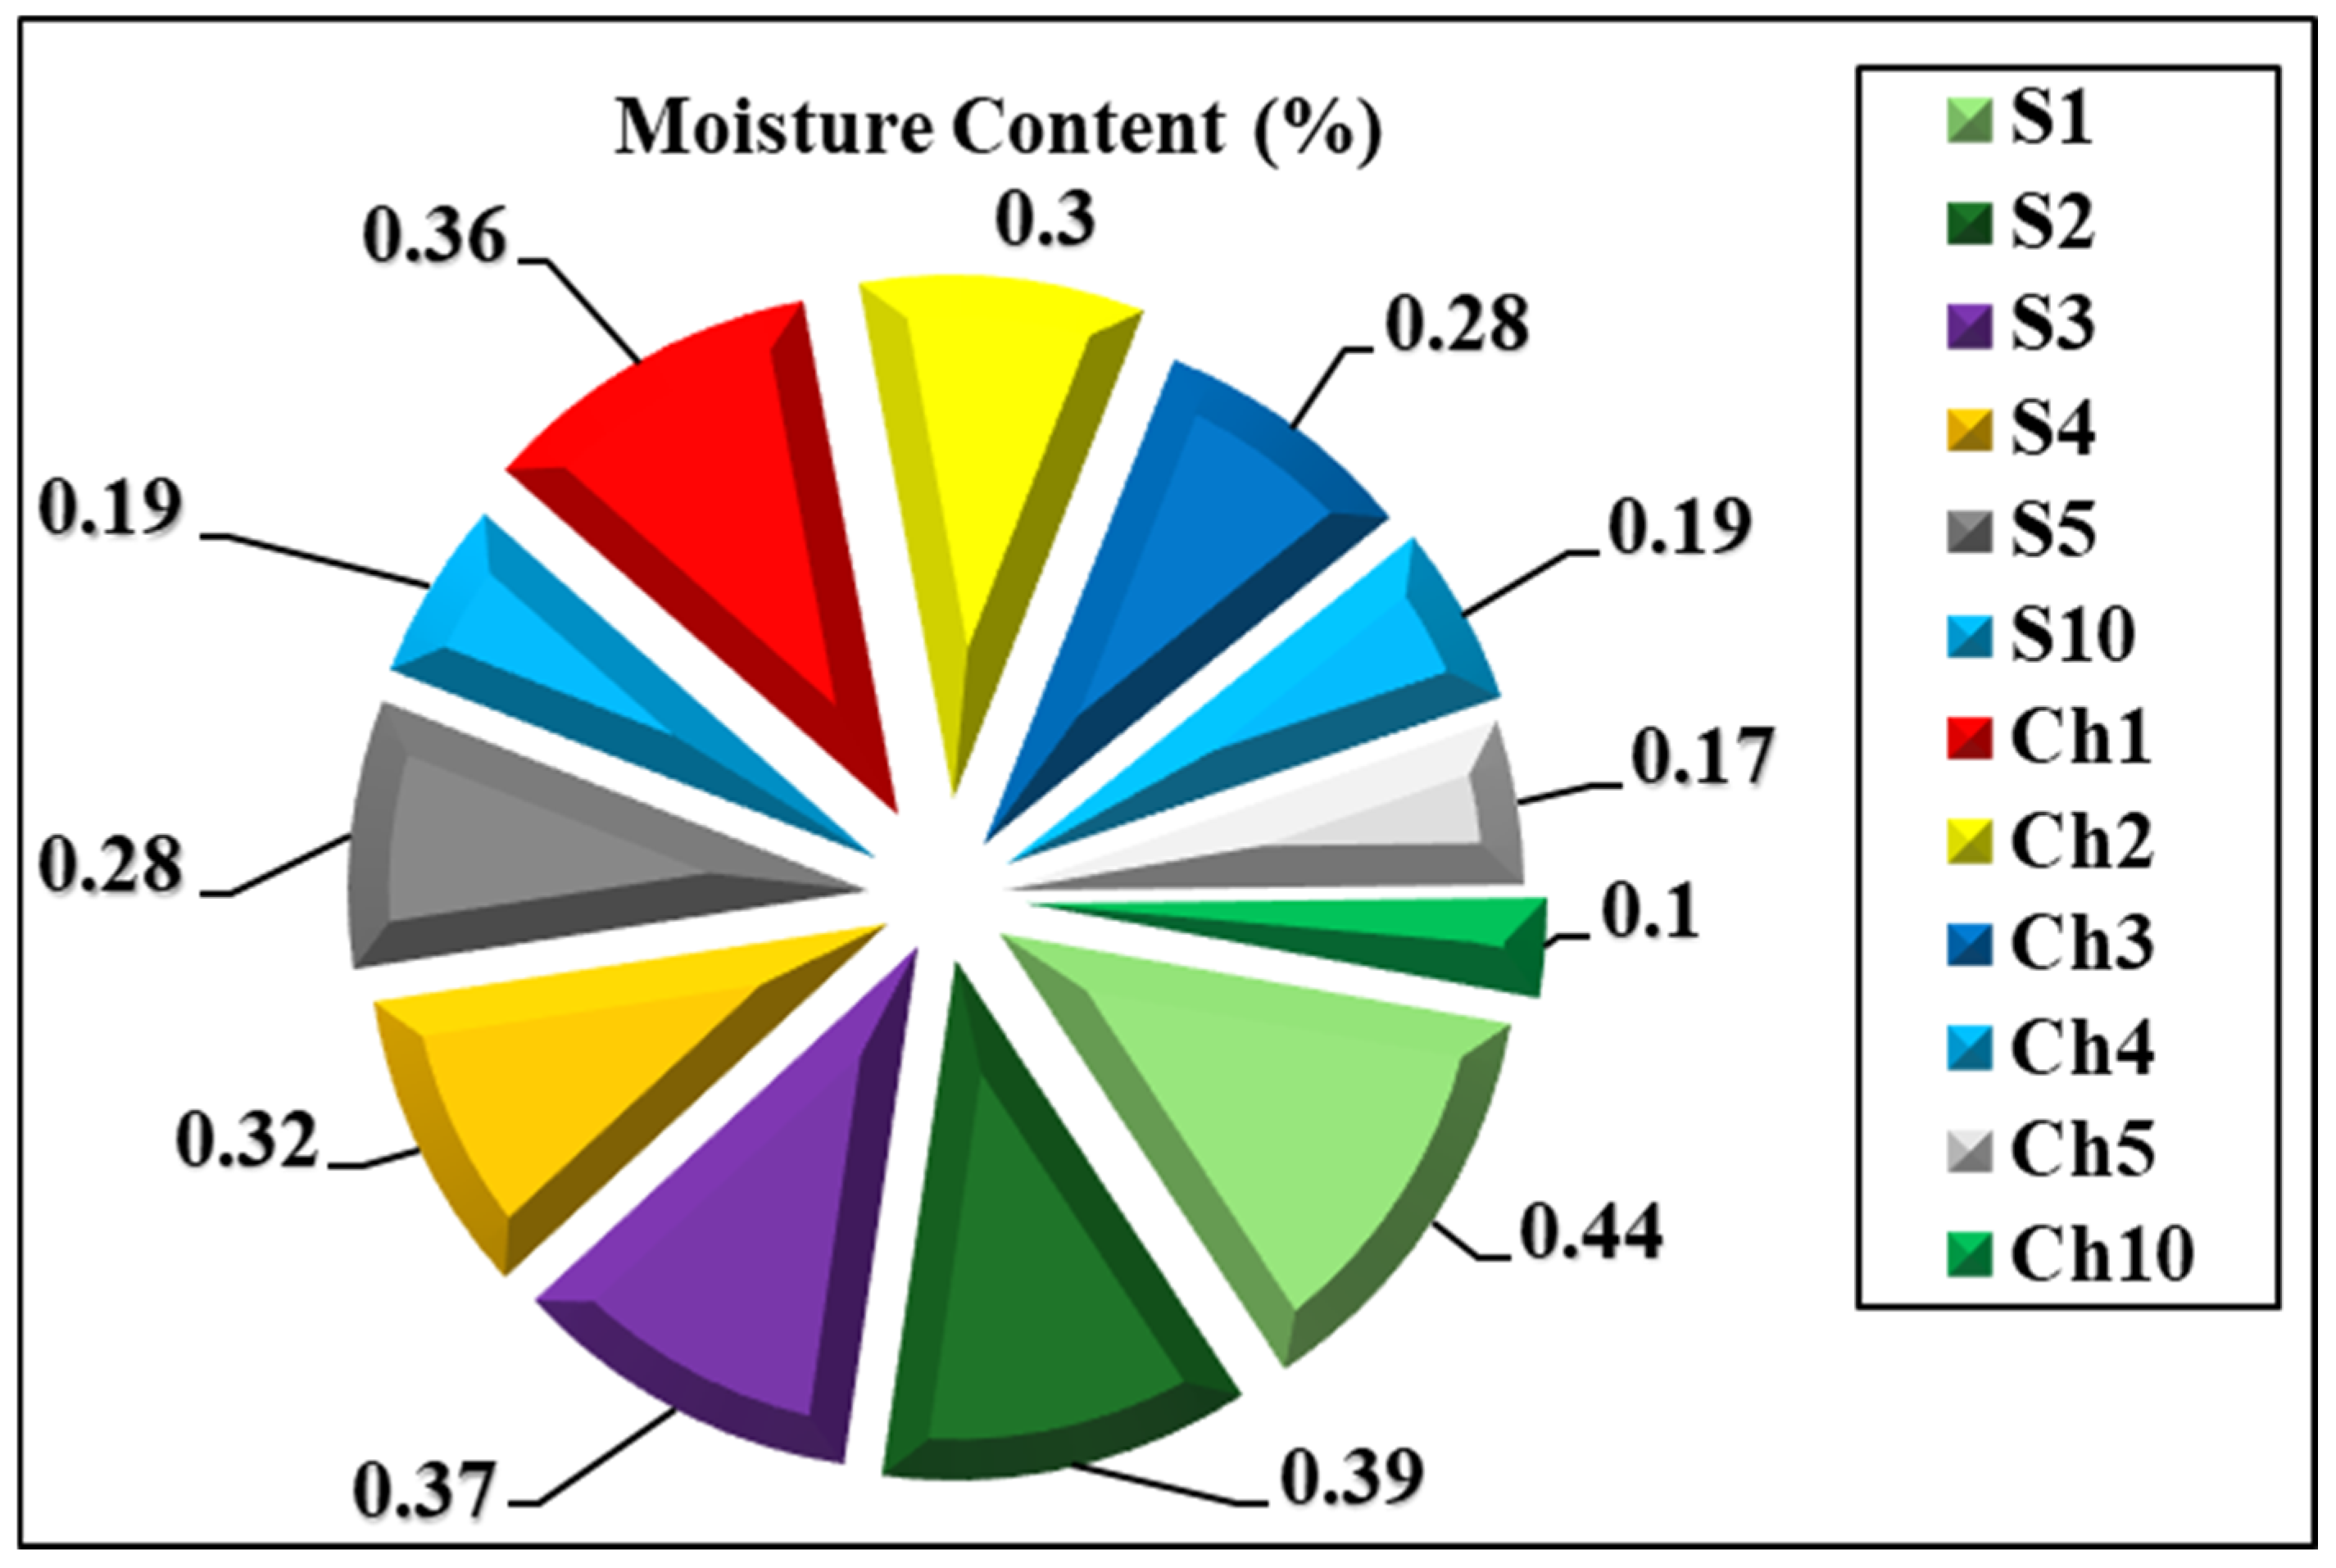
In contrast, the moisture content of commercial chitosan was 0.25 ± 0.02, while the extracted samples showed values ranging from 0.1 ± 0.02% to 0.44 ± 0.01% (Figure 3) Specifically, the moisture content decreases from 0.44% to 0.1% as NaOH concentration increases from 1% to 10% in both chitosan samples isolated at ambient and elevated temperatures. This pattern agrees with the statement that higher NaOH concentrations can enhance the deproteinization process and can lead to reducing the water-retaining groups in the chitosan matrix, resulting in lower moisture content [57,58]. Furthermore, when comparing the moisture content of chitosan samples isolated at room temperature and 50 °C with equivalent NaOH concentrations, the latter showed lower moisture content. This may be because the elevated temperatures can effectively enhance the breakdown of proteins and hydrophilic groups and thereby reduce the overall moisture content [56,59]. The moisture content values obtained in this work (7.24–7.85%) were considerably lower than those reported by [60] and align with the statement reported by [61] that high-purity chitosan correlates with a lower moisture content of less than 10%.
Figure 3.
Moisture content (%) of extracted chitosan samples under varied deproteinization conditions at ambient temperature (RT) and 50 ± 2 °C.
3.3. The Influence of Deproteinization Conditions on Chitosan Yield
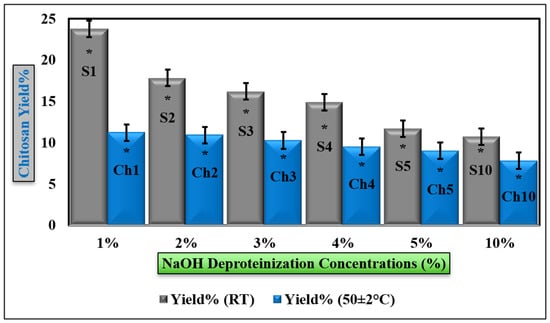
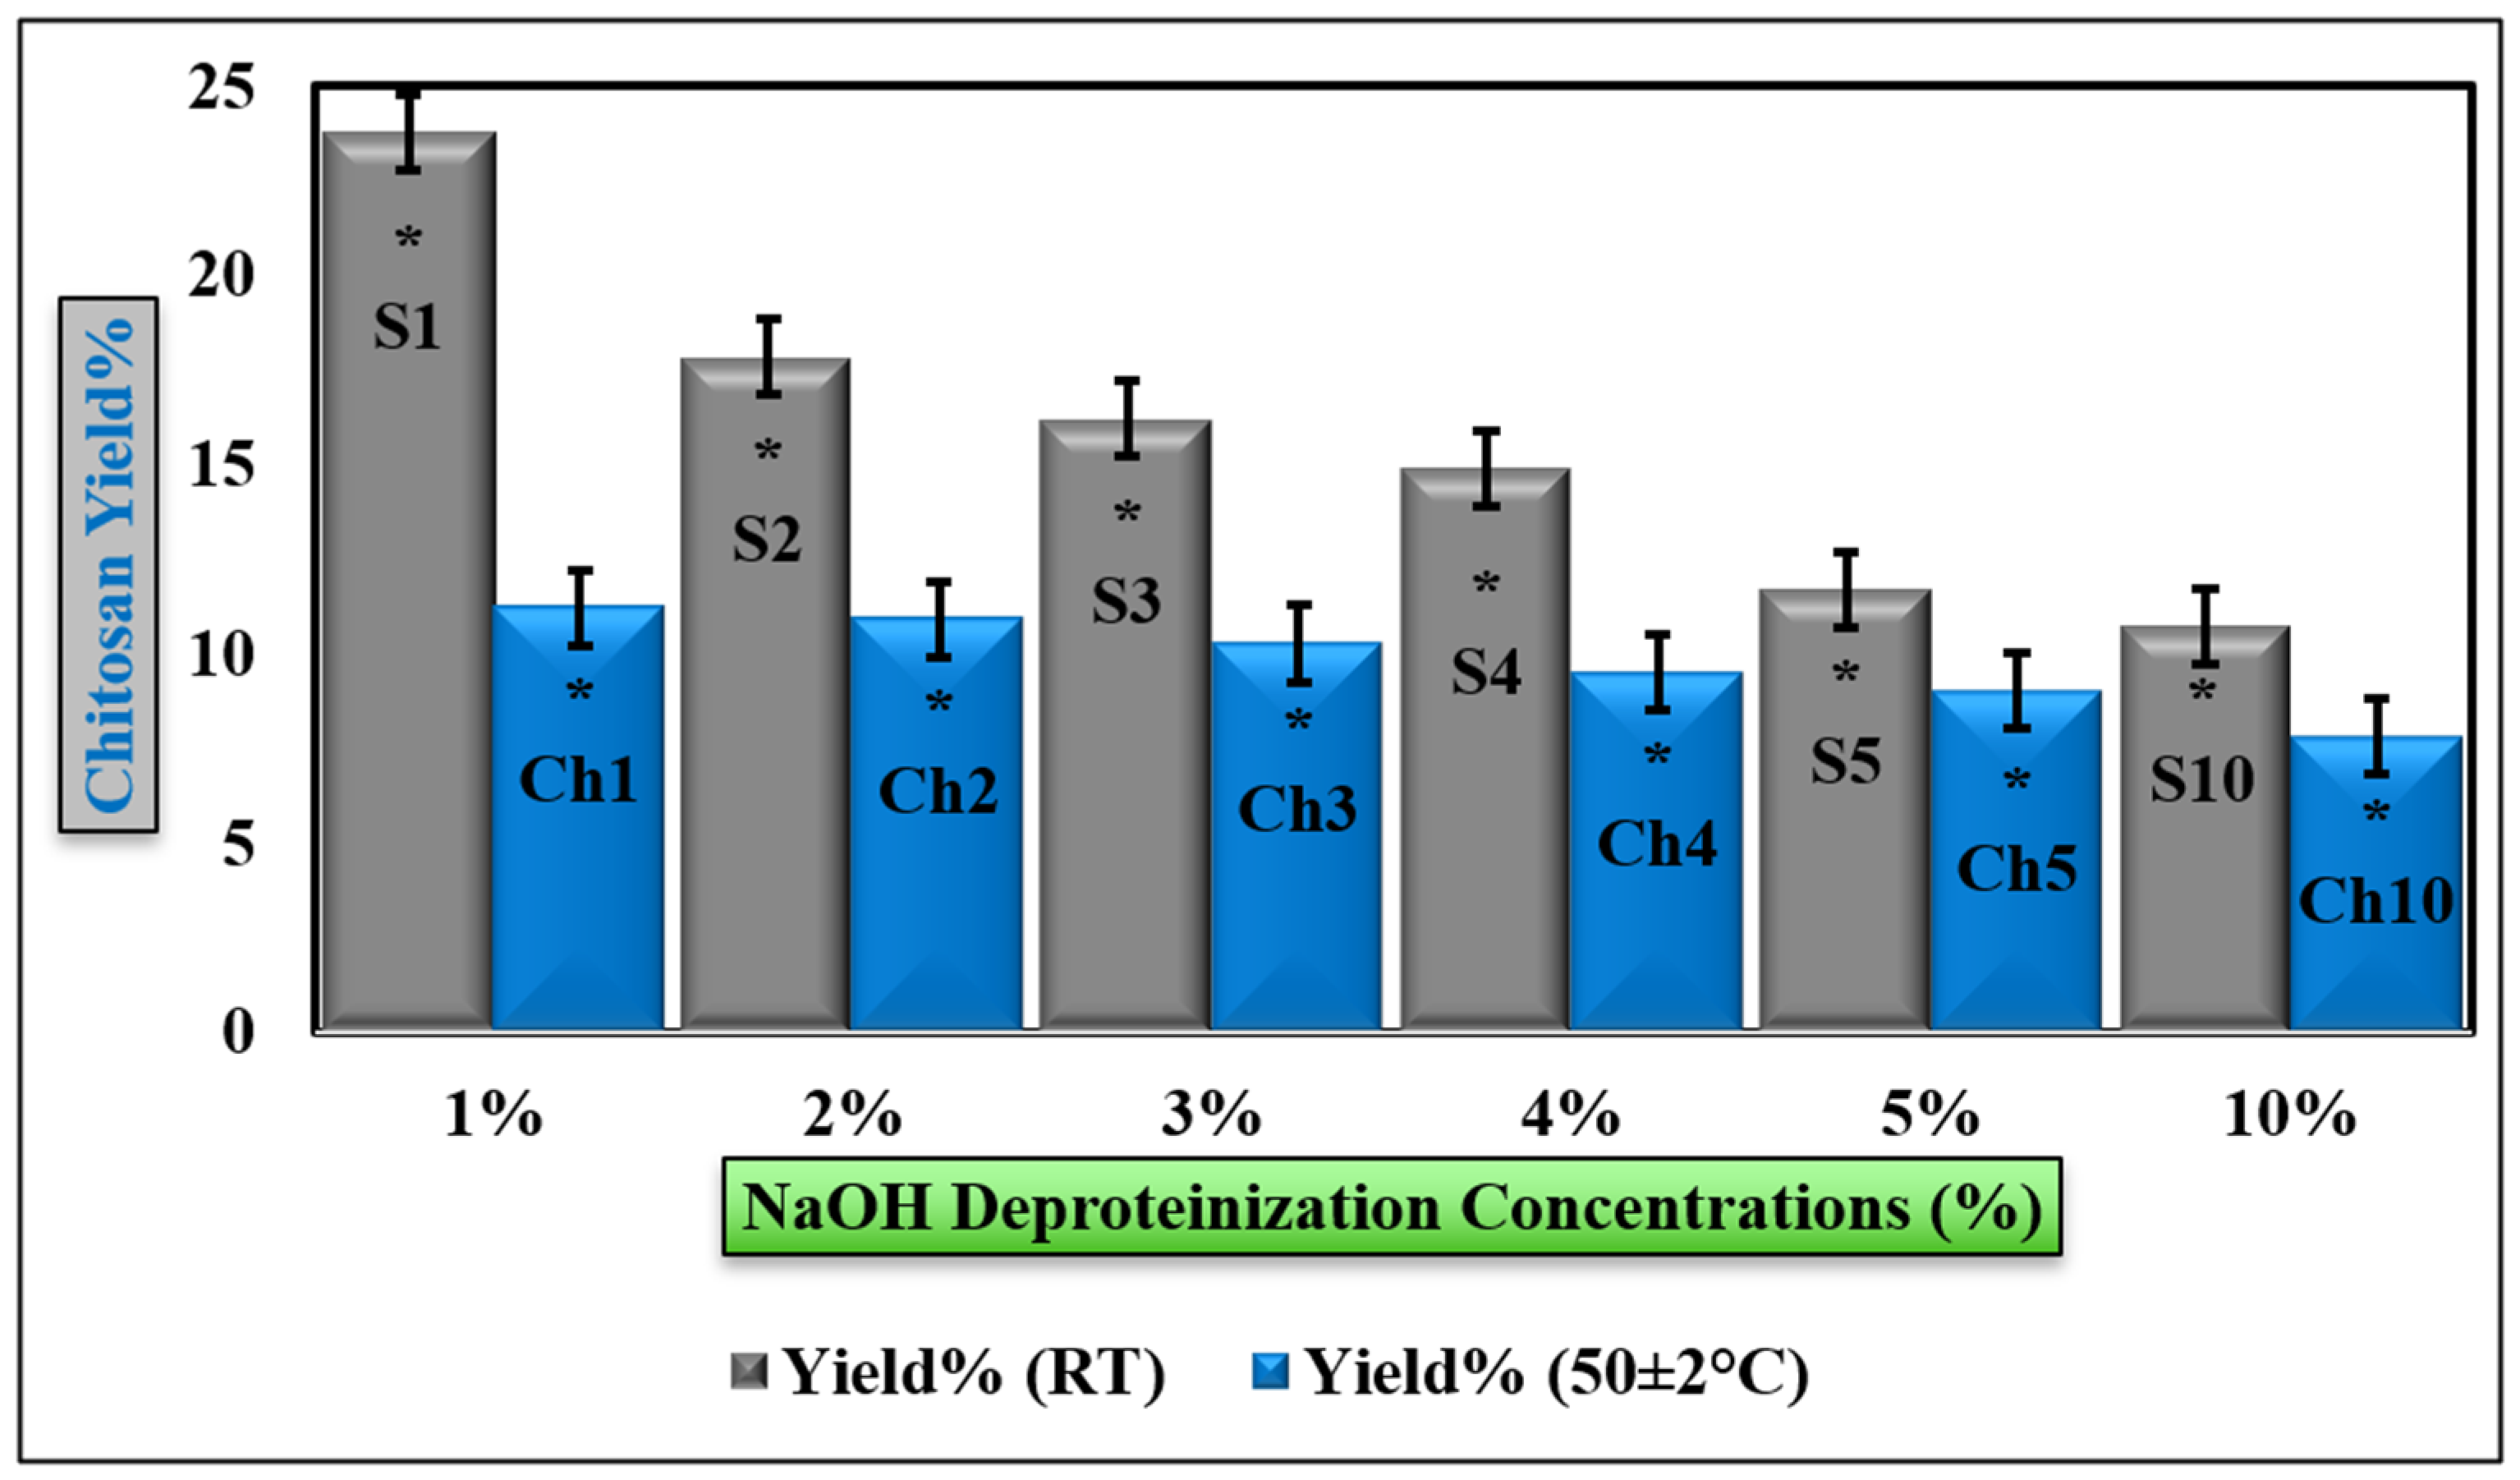
Figure 4 shows the chitosan yield obtained from Litopenaeus vannamei shrimp shells, depending on the deproteinization conditions used. The chitosan yield decreased as the NaOH concentration increased in both temperature groups. This decrease was more pronounced at higher temperatures. At ambient temperature, the yield varied from 24.1 ± 0.03% with 1% NaOH to 10.7 ± 0.08% with 10% NaOH.
Figure 4.
Chitosan yield percentages of extracted chitosan samples under varied concentrations of NaOH for alkaline deproteinization at ambient temperature (RT) and 50 ± 2 °C. Data are shown as mean ± SD (n = 2) and asterisk (*) is the significance level at p-value < 0.05.
At 50 ± 2 °C, the yield ranged from 11.2 ± 1.13% at 1% NaOH to 7.8 ± 0.85% at 10% NaOH. Two-way ANOVA indicated that NaOH concentration, temperature, and their interaction had statistically significant effects on yield (p < 0.05). The findings suggest that more extreme alkaline concentration and higher temperatures facilitate protein elimination, while promoting partial polymer degradation and the solubilization of resultant degradation products, which ultimately diminishes chitosan recovery. These findings surpass those reported by [28,62,63], but are below the yield range (50.39–88.25%) reported by [64]. Variations in chitosan yield are likely due to differences in the species source, extraction conditions, particularly concentration, time, and temperature during extraction [65].
From a process optimization perspective, these results reveal a clear yield–quality trade-off. The highest yield was obtained at 1% NaOH and room temperature, but these conditions were associated with higher ash content and lower similarity to commercial chitosan. In contrast, samples Ch3 and Ch4 produced at 50 ± 2 °C and moderate NaOH concentrations showed the highest similarity to commercial chitosan and favorable structural quality, but their yields were substantially lower. Therefore, although Ch3 and Ch4 represent the most favorable conditions when priority is given to purity, high DD%, and structural resemblance to commercial chitosan, intermediate conditions such as S3–S5 may represent a more realistic compromise for industrial implementation because they retain higher chitosan yield while still achieving acceptable physicochemical quality. Thus, the most suitable processing conditions depend on whether the target application prioritizes maximum product recovery or higher structural order and purity.
3.4. The Effect of NaOH Concentrations and Temperature on Deproteinization Efficiency
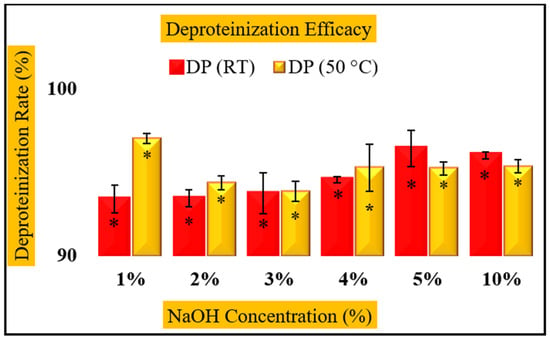
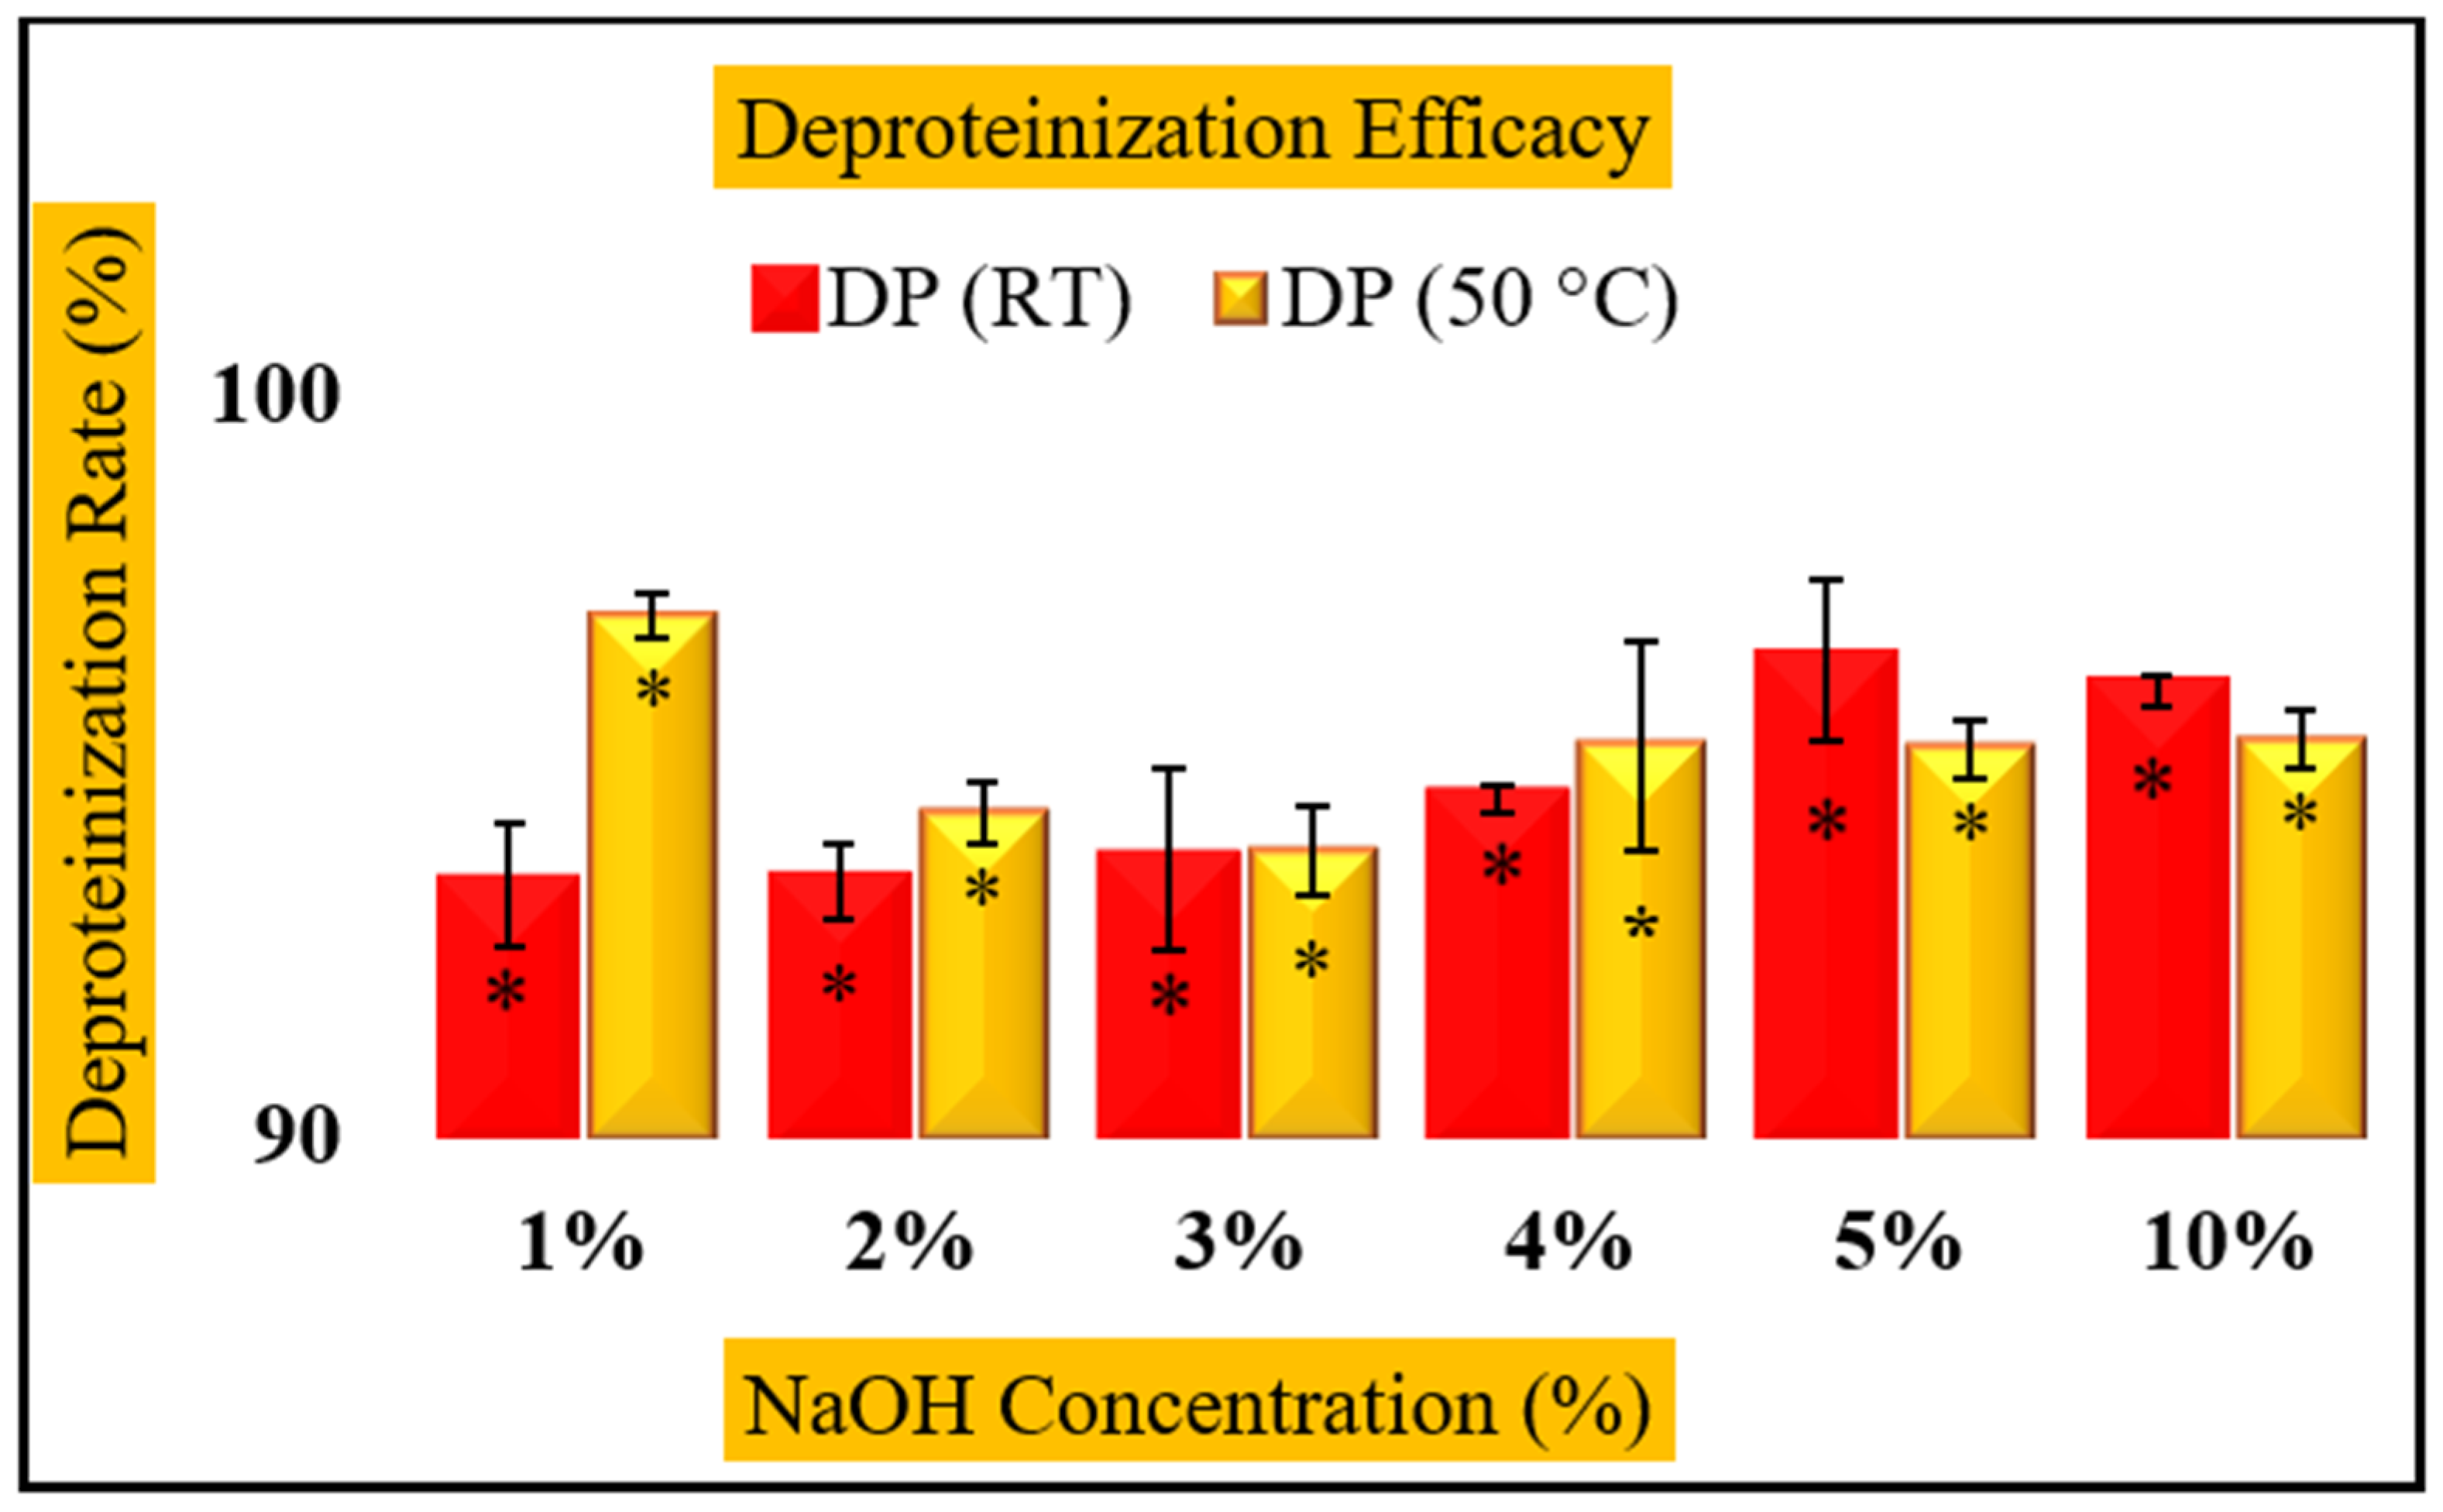
Deproteinization efficiency is a key factor in optimizing chitosan recovery from shrimp shells. Protein removal from shrimp shells depends on the shrimp species, the initial protein content in shrimp shells, the alkali concentration, and the deproteinization conditions. Our current study shows that deproteinization efficacy is significantly influenced by both NaOH concentration and temperature, leading to enhanced protein removal from shrimp shells. Figure 5 shows the effect of different concentrations of NaOH, followed by constant acidic demineralization with 2% hydrochloric acid at both ambient temperature (RT) and 50 °C, on removing protein from shrimp shells to obtain chitin. The results from the analysis of variance (ANOVA) for each group of samples, independently at RT and 50 °C, showed that increasing the temperature and NaOH concentration from 1 to 10% significantly enhanced deproteinization efficacy (p-value < 0.05) with a noticeable interaction effect between the two factors; however, the trend was not strictly linear. The deproteinization rates of the obtained samples were (93.39 ± 0.083–96.41 ± 1.07%) and (95.22 ± 0.38%–97.0 ± 0.31%) for the samples deproteinized at ambient temperature (RT) and 50 °C, respectively. The higher deproteinization rates (>93.0%) achieved in this study using the deproteinization routes at RT and 50 °C were higher than the deproteinization rates (38−85%) reported in previous research [11,16,17] and lower than the results obtained by [21,26]. The current results suggest that starting with the deproteinization phase before demineralization, using NaOH concentrations from 1 to 10% at ambient temperature (RT) or 50 °C, can achieve efficient deproteinization over 90%.
Figure 5.
Deproteinization rate under varied concentrations of NaOH at ambient temperature (RT) and 50 ± 2 °C. Data are shown as mean ± SD (n = 2) and asterisk (*) is the significance level at p-value < 0.05.
3.5. Fourier Transform Infrared Spectroscopic Analysis (FTIR)
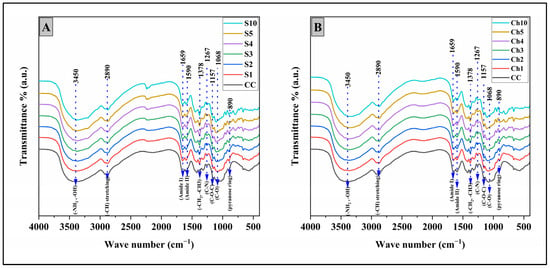
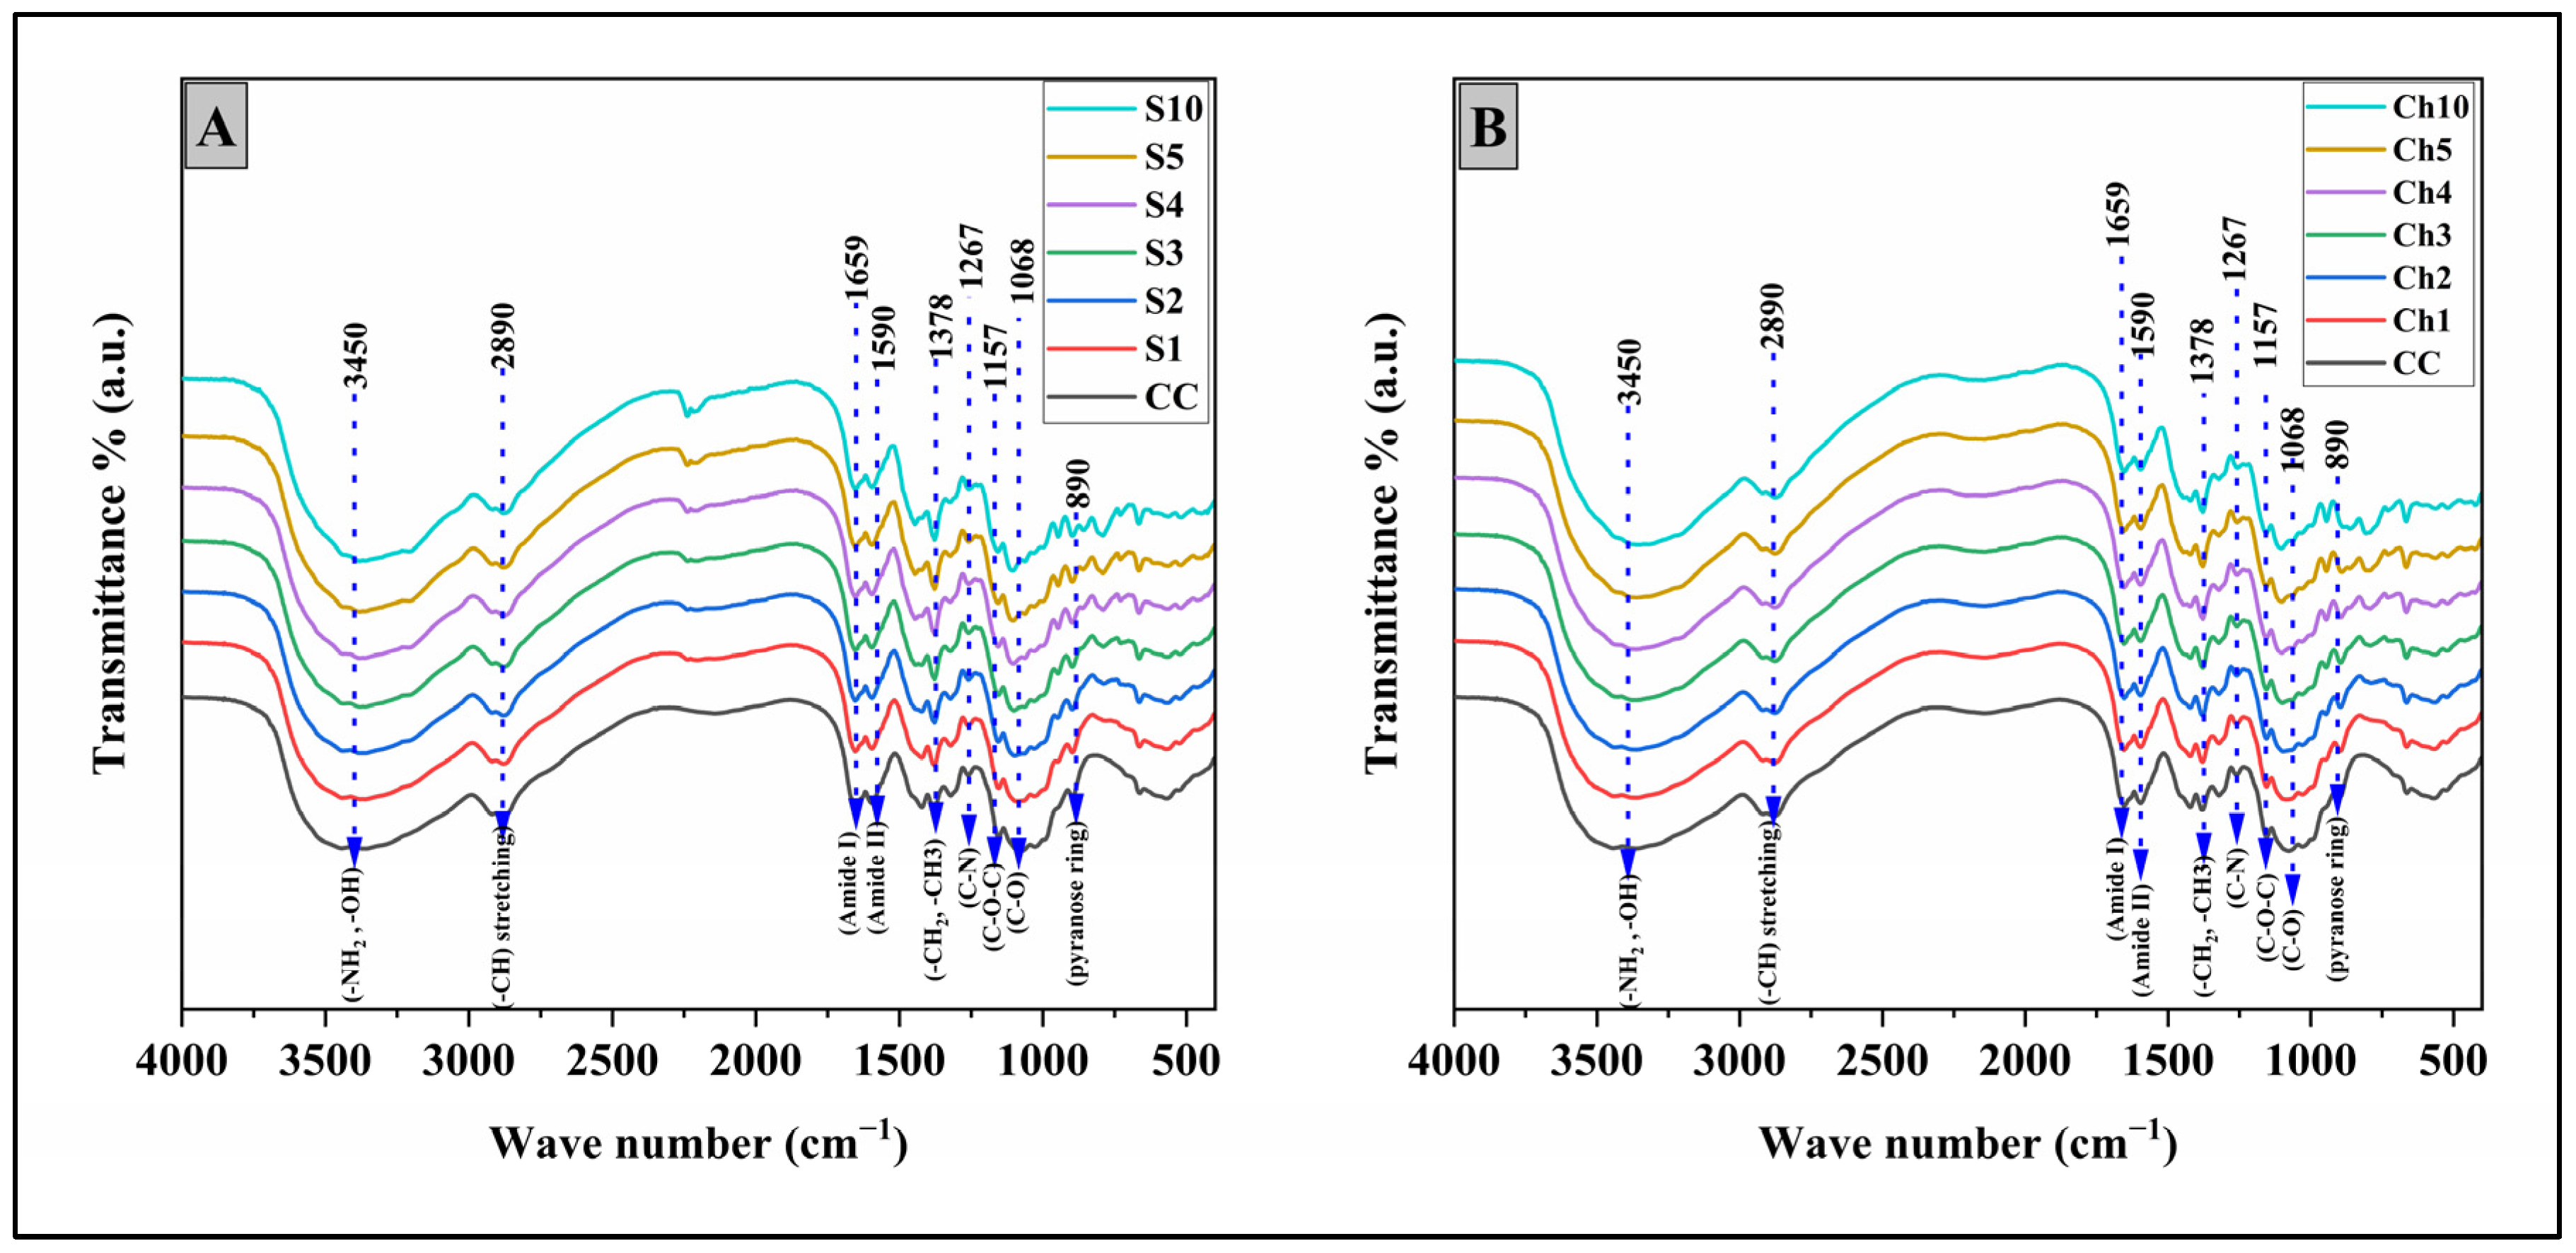
The characteristics of the vibrational modes of the functional groups of commercial and extracted chitosan samples are depicted in Figure 6. Panel (A) in Figure 6 represents the analysis of commercial chitosan (CC) and chitosan samples isolated using varied NaOH concentrations at ambient temperature (23 ± 2 °C) at stabilized demineralization and deacetylation conditions, while Panel (B) in Figure 6 demonstrates the FTIR spectra of commercial chitosan compared to chitosan samples extracted under distinctive concentrations of NaOH at 50 ± 2 °C. The spectral data showed that significant absorption bands of chitosan polysaccharide backbone were observed between ~3450 cm−1 and ~1068 cm−1, which represents the existence of the free amino group (-NH2) at the position of C2 in the glucosamine chain due to partial or complete elimination of acetyl groups in chitin [66].
Figure 6.
FTIR vibrational modes of commercial and extracted chitosan samples under varied deproteinization conditions (A) at ambient temperature (RT) and (B) at 50 ± 2 °C.
The spectra of all extracted chitosan samples at RT in Figure 6A and at 50 ± 2 °C in Figure 6B exhibited a broad absorption band at around 3450 cm−1, which is assigned to overlapping O-H stretching vibrations with N-H stretching of primary amines typical of the polysaccharide backbone and hydrogen bonding network. This broad band appeared more intense in chitosan samples (Ch1–Ch10) spectra, suggesting the presence of more free amino groups after extraction at 50 °C, whereas the bands observed at 2890 cm−1 are assigned to C-H stretching vibrations of aliphatic -CH2 types [10]. The intensities of both series were similar in that region, suggesting that temperature did not alter the hydrocarbon framework of the polysaccharide. Interestingly, a weak band was observed between 2200 and 2250 cm−1 in the samples (S3–S5). This band corresponds to C≡N stretching vibrations, perhaps from type impurities or nitrile groups generated under strong alkaline conditions or CO2 overtones [8,67]. Weak intensity and absence in commercial chitosan could suggest that this band arises from certain slight modifications of structure during alkaline extraction rather than due to inherent vibrations of chitosan. Such features have occasionally been reported in alkaline-treated biopolymers [31,68,69], even if they do not have significant importance for the functional performance of extracted chitosan.
In the amide region, bands of 1654–1659 cm−1 (amide I, C=O stretching) and 1590–1560 cm−1 (amide II, N-H bending coupled with C-N stretching) were significantly reduced in both series when compared with CC. This reduction is indicative of efficient deacetylation, as fewer acetamido groups remain [30]. The samples extracted at 50 °C displayed weakened amide II absorption, corresponding to a high degree of deacetylation. A weak amide III vibration (C-N stretching and N-H deformation) appeared around ~1267 cm−1, further supporting that residual acetyl groups were lost. The vibrational modes around ~1370–~1378 cm−1 correspond to the symmetric deformation of C-H in the CH3 group. The observed peaks of primary and secondary amides of the FTIR results of recovered chitosan samples (S1–S10) and (Ch1–Ch10) showed similar ranges to those obtained in recent studies [21,33]. These observations correlate well with the DD% values obtained chemically and confirm near-complete deacetylation in both series. Furthermore, the intense absorption at ~1157 cm−1 (C-O-C asymmetric stretching of the β-(1 → 4)-glycosidic linkage) and ~1068 cm−1 (C-O stretching of secondary alcohols) are the markers of chitosan’s saccharide structure. Moreover, the peak observed at ~890 cm−1 corresponds to the skeletal vibration of the β-pyranose ring, thereby confirming the preservation of the polysaccharide backbone following treatment. Both series of obtained chitosan products exhibited these bands with little shifts, when compared to CC, signifying that the carbohydrate framework maintained its structural integrity.
3.6. Deacetylation Degree (DD)
Deacetylation degree (DD) is a key parameter that reflects the number of acetyl groups removed from the chitosan polysaccharide structure during subsequent processing, which impacts its functionality, solubility, chemical, and biological reactivity [70]. The results showed small variations in DD across different extracted chitosan samples, which may result from different NaOH concentrations during the deproteinization phase, followed by constant demineralization and deacetylation steps at room temperature and 50 ± 2 °C. The degree of deacetylation (DD) of commercial chitosan and chitosan samples isolated from shrimp shells was determined by FTIR spectra according to the literature, based on the absorption band of the amide I band compared to –OH bands [71]. According to the product certificate of analysis, the value of the deacetylation degree of commercial chitosan was 91.6% ± 0.71. The deacetylation degree values of the isolated chitosan samples in the present study are summarized in Table 2. The DD% values revealed that the chitosan samples isolated at ambient temperature have shown values between 98.84 and 99.05%. The commercial chitosan reference is only 91.6%, indicating that alkali treatment effectively removes acetyl groups at ambient temperature, which might be because of maintaining the samples overnight in the alkaline solution without stirring to enhance the deacetylation kinetics. The variations in the group of samples recovered at RT were minimal, with less than 0.25% difference across concentrations. The DD was slightly lower than that of chitosan samples isolated at 50 ± 2 °C, which reflects the effective deacetylation at room temperature treatment, possibly leaving some traces of acetyl groups behind. Such a high degree of deacetylation signifies a prominent level of reactivity for functionalization and solubility improvement, which is in accordance with previous studies suggesting that DD > 95% is a threshold for biomedical-grade chitosan [38,57,61].
Table 2.
Deacetylation degree DD (%) of commercial and isolated chitosan samples.
On the other hand, the DD% values of chitosan products obtained at 50 ± 2 °C were in the range of 99.24–99.27%, maintaining a status of being marginally but slightly higher than corresponding values for the S-series. Increasing the extraction temperature from ambient temperature to 50 °C, therefore, resulted in a slight improvement in deacetylation efficiency. Higher solubilization and diffusion rates of NaOH into the polymeric matrix at higher temperatures were responsible for increased DD% values to reach near-complete deacetylation, resulting in greater cleavage of acetamido groups. The results are comparable to those reported by Nguyen et al., who achieved 99% DD from shrimp shell chitosan under optimized alkaline conditions [20]. The low variability across the replicates of samples obtained at 50 °C (SD< 0.01%) indicates the high reproducibility and stability of the process. The degrees of deacetylation of extracted chitosan samples in the present study were higher than the DD (39.1–72.92%) reported by [27,31,62] and lower than the results of DD (100%) obtained by [72].
3.7. X-Ray Diffraction (XRD) Pattern
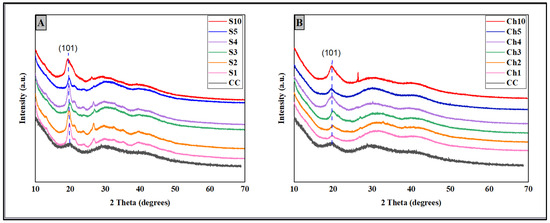
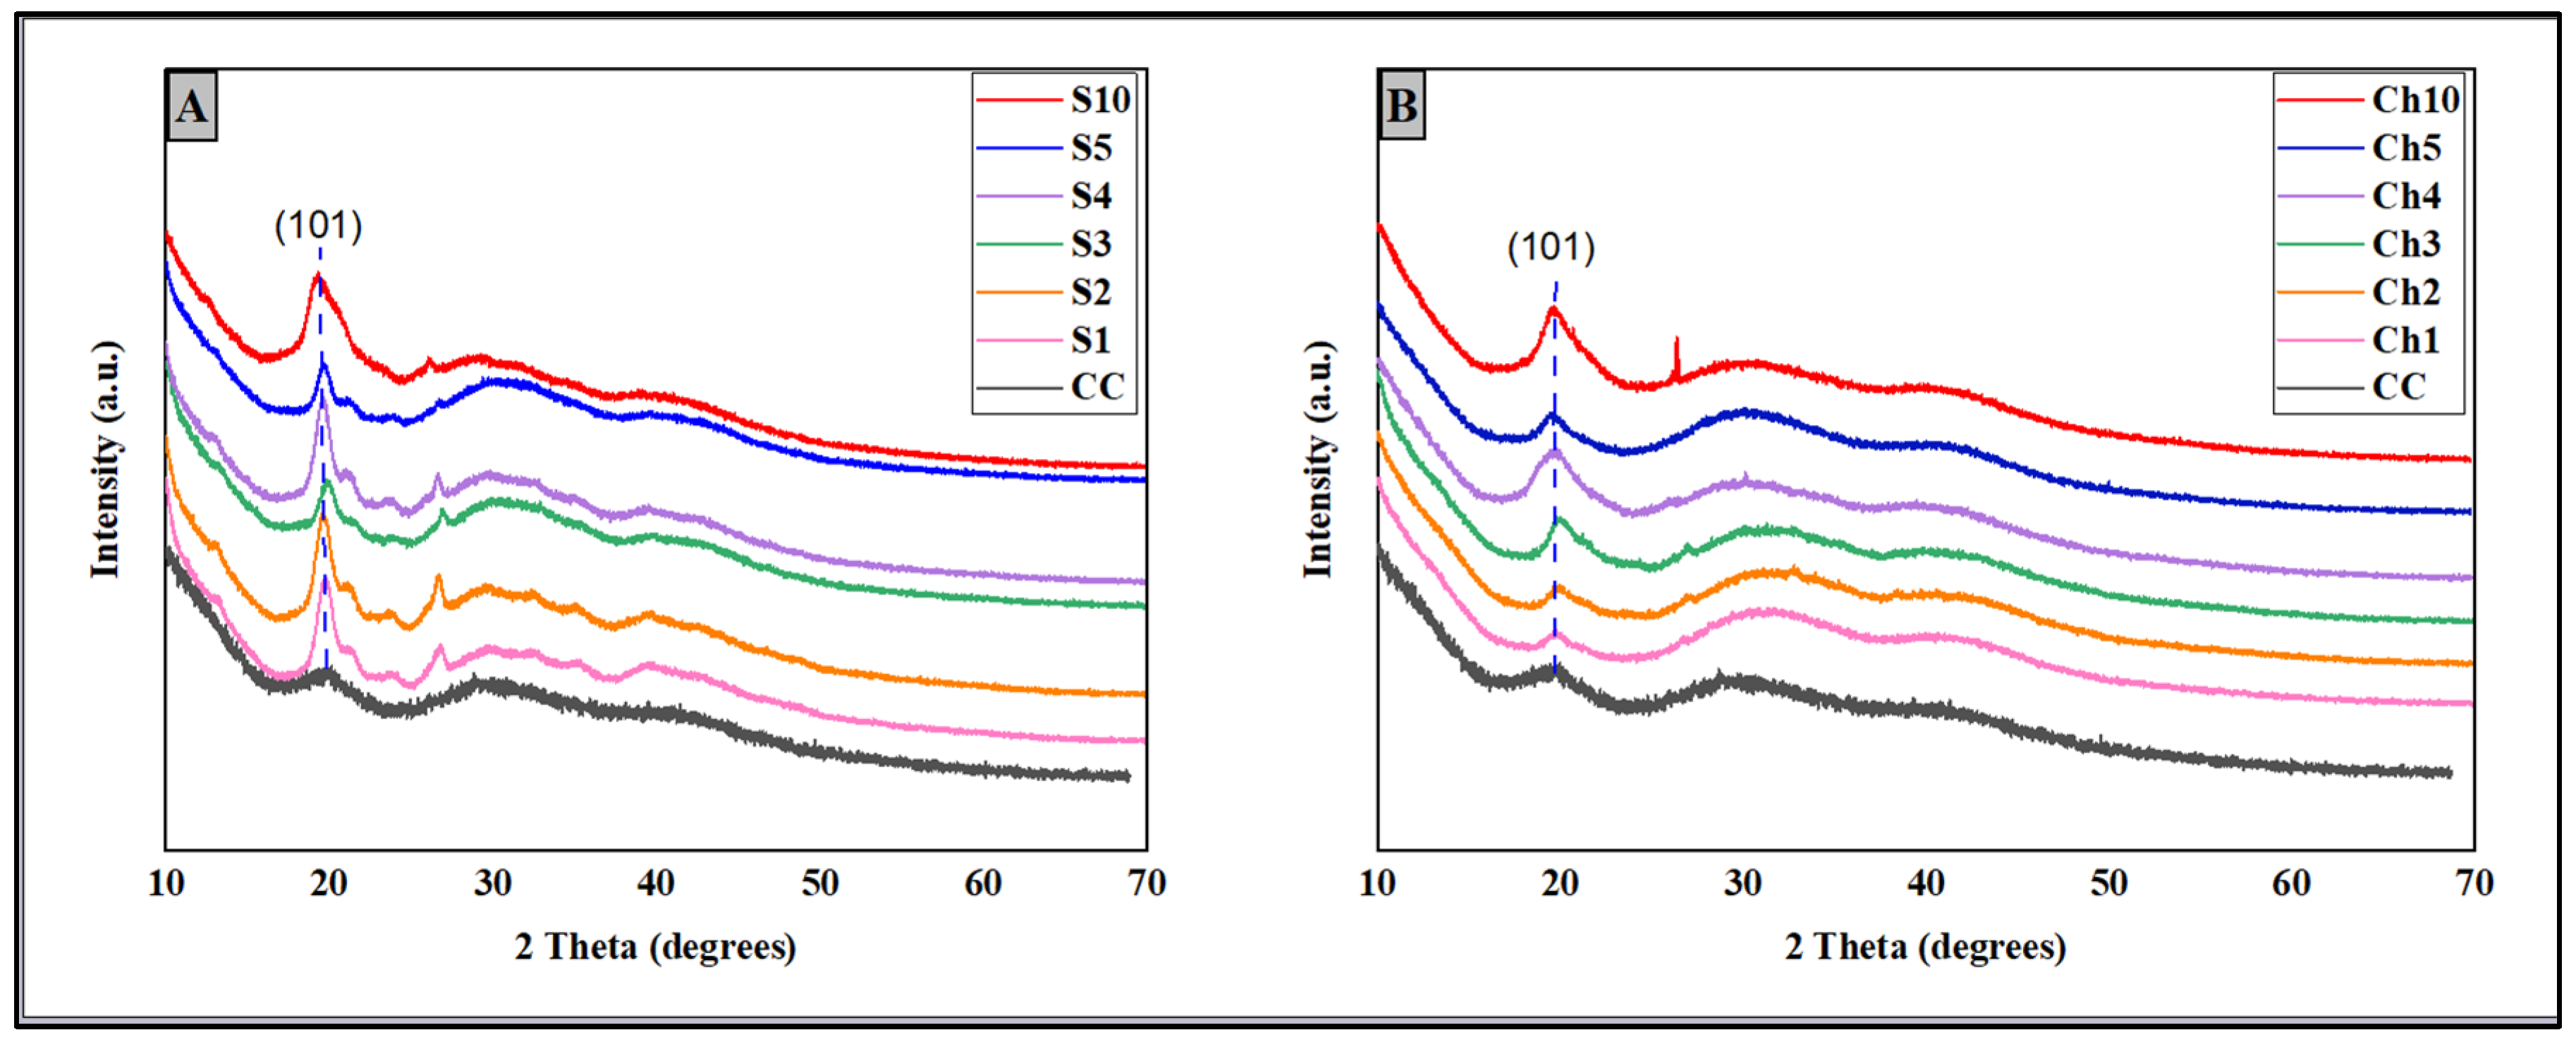
The X-ray diffraction technique is widely used to determine crystal planes and provides convincing evidence of polymorphic differences to identify whether a polymer has an amorphous or crystalline structure [37]. Additionally, it allows precise measurement of the degree of crystallinity, a key factor that significantly influences the morphological, physical, and biological properties of chitosan polymers [10]. The crystalline structure of commercial and isolated chitosan samples was determined using X-ray diffraction, as shown in Figure 7. The XRD diffractograms of extracted chitosan samples S1–S10 (Figure 7A) and Ch1–Ch10 (Figure 7B), obtained using 1, 2, 3, 4, 5, and 10% NaOH at RT and 50 ± 2 °C respectively, exhibited a broad diffraction peak around 20° (2theta) corresponding to the (110) reflection of low-crystalline chitosan [73,74]. This reflection is often used to calculate the crystallinity index (CI), which measures molecular ordering and is strongly affected by deacetylation, impurities, and processing conditions. Besides the main peak at approximately 20°, a smaller shoulder between 2θ ≈ 10° was observed in some samples. This peak indicates the hydrated crystalline form in which chitosan exists; it diminishes with increased deacetylation (DD) as the structure becomes less hydrated [75], suggesting that higher DD% (>98%) disrupts the hydrated crystalline domains. This supports the FTIR evidence of diminished amide bands. Most samples showed additional low-intensity peaks between 26° and 28° in 2θ, attributable to crystalline mineral impurities rather than chitosan. The presence of these reflections in RT samples with ash content exceeding 2% implies residual minerals in those crystallites. This aligns with ash content data, as RT samples retained more minerals compared to those processed at 50 ± 2 °C.
Figure 7.
XRD of commercial chitosan (CC) and extracted chitosan samples (A) at ambient temperature (RT) and (B) at 50 ± 2 °C.
The crystallinity index of recovered chitosan samples was determined to analyze structural changes induced by varying NaOH concentrations and extraction temperatures, as shown in Table 3. CI (%) values for the RT samples ranged from 4.84% (S5) to 10.50% (S1), indicating low crystallinity, while commercial chitosan appeared fully amorphous. S1 (10.50%) and S2 (7.54%) had the highest CI values, implying that lower NaOH concentrations at RT retained more crystalline domains. The increased apparent CI values observed in some RT samples may reflect the presence of additional crystalline components or differences in chitosan structural ordering; however, definitive phase attribution would require further phase-specific confirmation. Conversely, chitosan samples (Ch1–Ch10) recovered at 50 ± 2 °C showed lower crystallinity, ranging from 0.37% (Ch1) to 5.27% (Ch3). Despite this, these samples had near-complete DD% (~99.2%) and lower ash content (<1.45%). The elevated temperature caused chain scission and subsequent rearrangement into more amorphous structures, reducing crystallinity. The highest CI in this group (Ch3, 5.27%) remained lower than the RT-extracted samples, indicating that thermal deacetylation increases DD% but compromises crystalline order [76]. This reduced crystallinity index might be due to increased NaOH concentrations and temperatures during deproteinization, which enhances protein removal and facilitates acetyl group elimination, thereby altering the organized crystalline structure. In this study, the crystallinity indexes of chitosan samples derived from shrimp shells were lower than those reported in previous studies [60,77,78].
Table 3.
Crystallinity index (CI) of extracted chitosan samples.
3.8. Scanning Electron Microscopy (SEM)
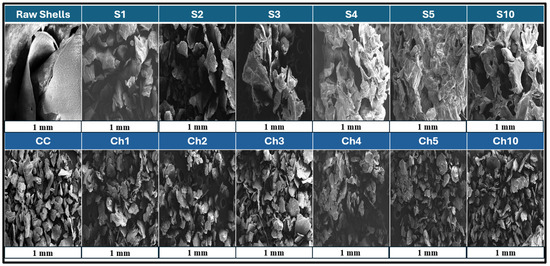
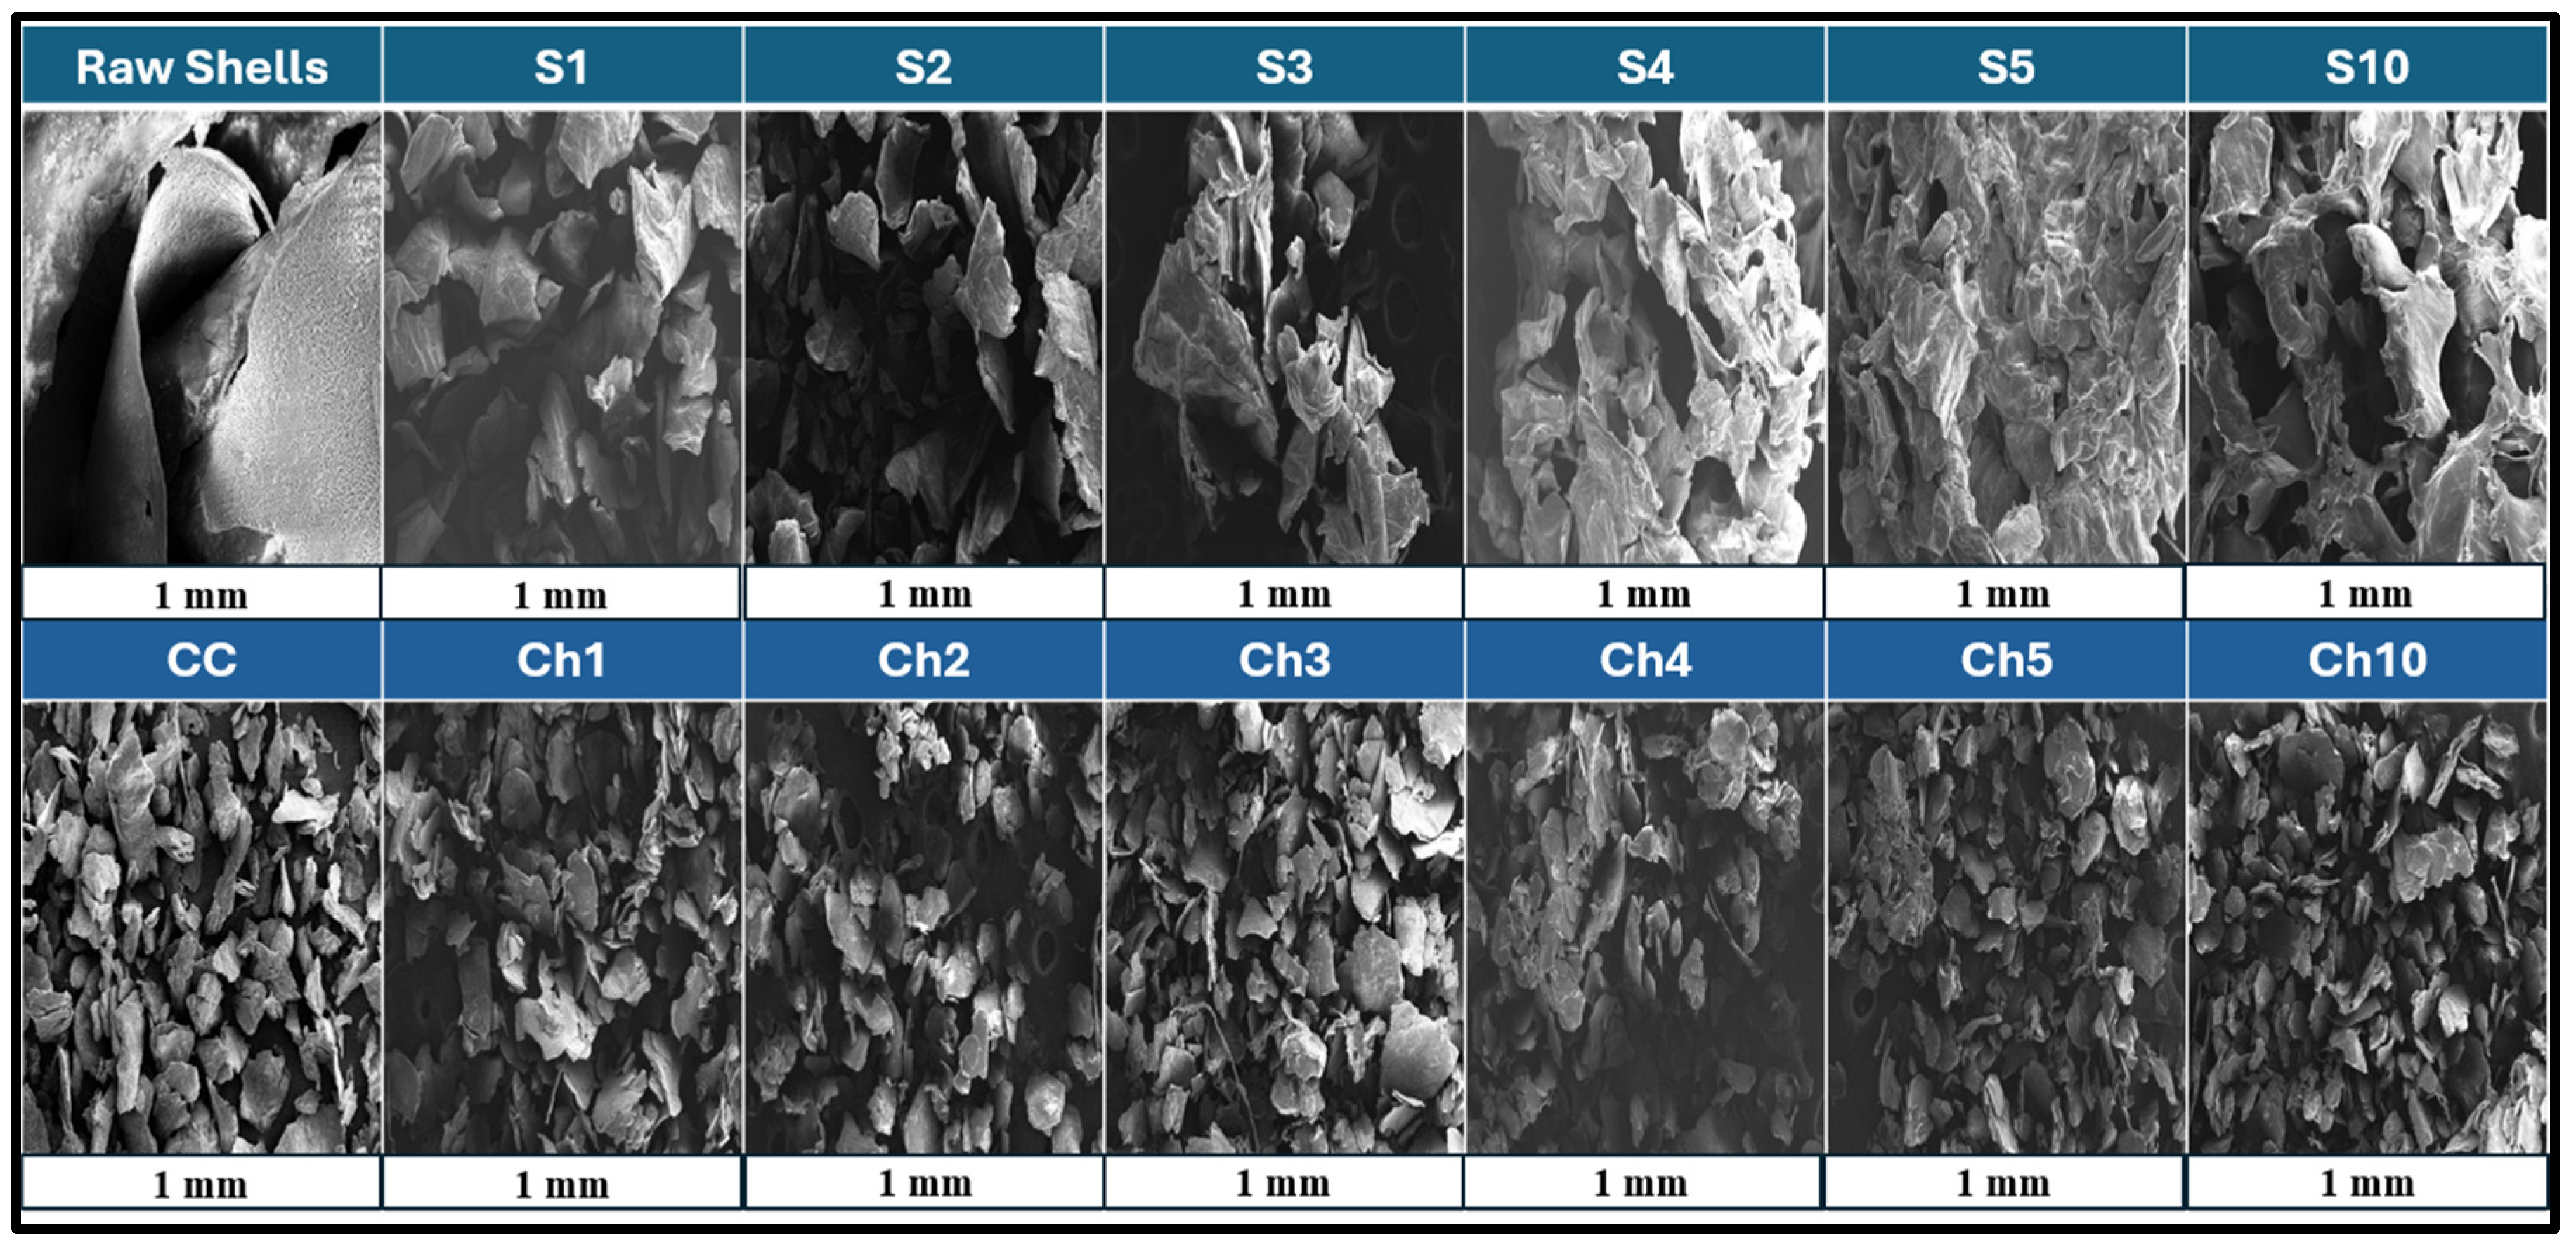
SEM analysis was employed to provide an overview of morphology, including surface structure, porosity, and macrostructural characteristics [78]. Five different magnification regimes, ×50, ×100, ×500, ×1000, and ×3000, were applied. The morphological images at a magnification power of ×50 with 1 mm scale (Figure 8) showed that raw shrimp shells exhibited dense, layered, and compact structures with a lack of porosity, representing the intact shell matrix composed of a chitin chain linked with calcium carbonate and proteins. In contrast, commercial chitosan (CC) exhibited a highly fragmented, porous, unstable surface with small particles, indicating substantial structural modification of chitosan obtained by industrial processing, which agrees with the results reported by Ibitoye et al. [16]. Meanwhile, chitosan samples (S1–S10) extracted at RT demonstrated a progressive increase in surface disruption, fragmentation, porosity, and irregular lamellar structures with increasing NaOH concentration. S1 and S2 samples exhibited compact and rigid fragments with lower porosity, reflecting their higher ash content (2.43% and 2.30%) and moisture levels. In contrast, S3–S5 exhibit much more disrupted and porous surface morphologies and greater roughness with irregular edges consistent with increased deproteinization and lower ash content (~1.26–1.77%). This is consistent with their progressive structural changes and moderate quantitative similarity (72–82%). Lastly, S10 was more fragmented and thinner than S1–S5, which correlates with its decreased ash content (1.18%) and remarkably high deacetylation degree (>99.0%).
Figure 8.
SEM at magnification power ×100 of raw shells, commercial chitosan (CC), and recovered chitosan samples at ambient temperature (RT) and 50 ± 2 °C.
On the other hand, chitosan samples (Ch1–Ch10) recovered at 50 ± 2 °C exhibited a remarkably different morphology with increasing porosity, surface roughness and flakiness, suggesting that proteins and minerals were preferentially removed at higher temperatures. Ch1 and Ch2 were compact, although porous, consistent with slightly higher ash residues (1.35–1.44%). Interestingly, Ch3 and Ch4 samples displayed much more pronounced lamellar morphologies with finer flakes, which correspond to their lower ~0.92–1.12% ash content and low crystallinity (3.4–5.3%) with high resemblance to commercial chitosan. Therefore, these results suggest that controlled alkali deproteinization at 50 °C (at 3–4% NaOH) affords morphologies closest to those of CC, as would be recorded by the higher structural order of FTIR bands and lower impurities. Conversely, Ch5 and Ch10 demonstrated more compact structures with moderate porosity, reflecting the trade-off between structural purity and morphological resemblance to commercial chitosan.
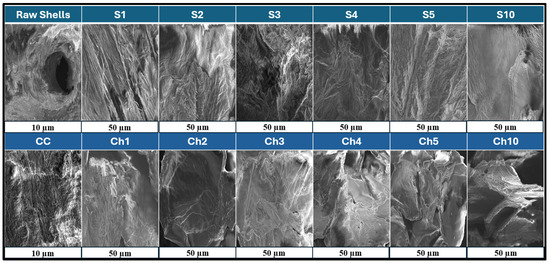
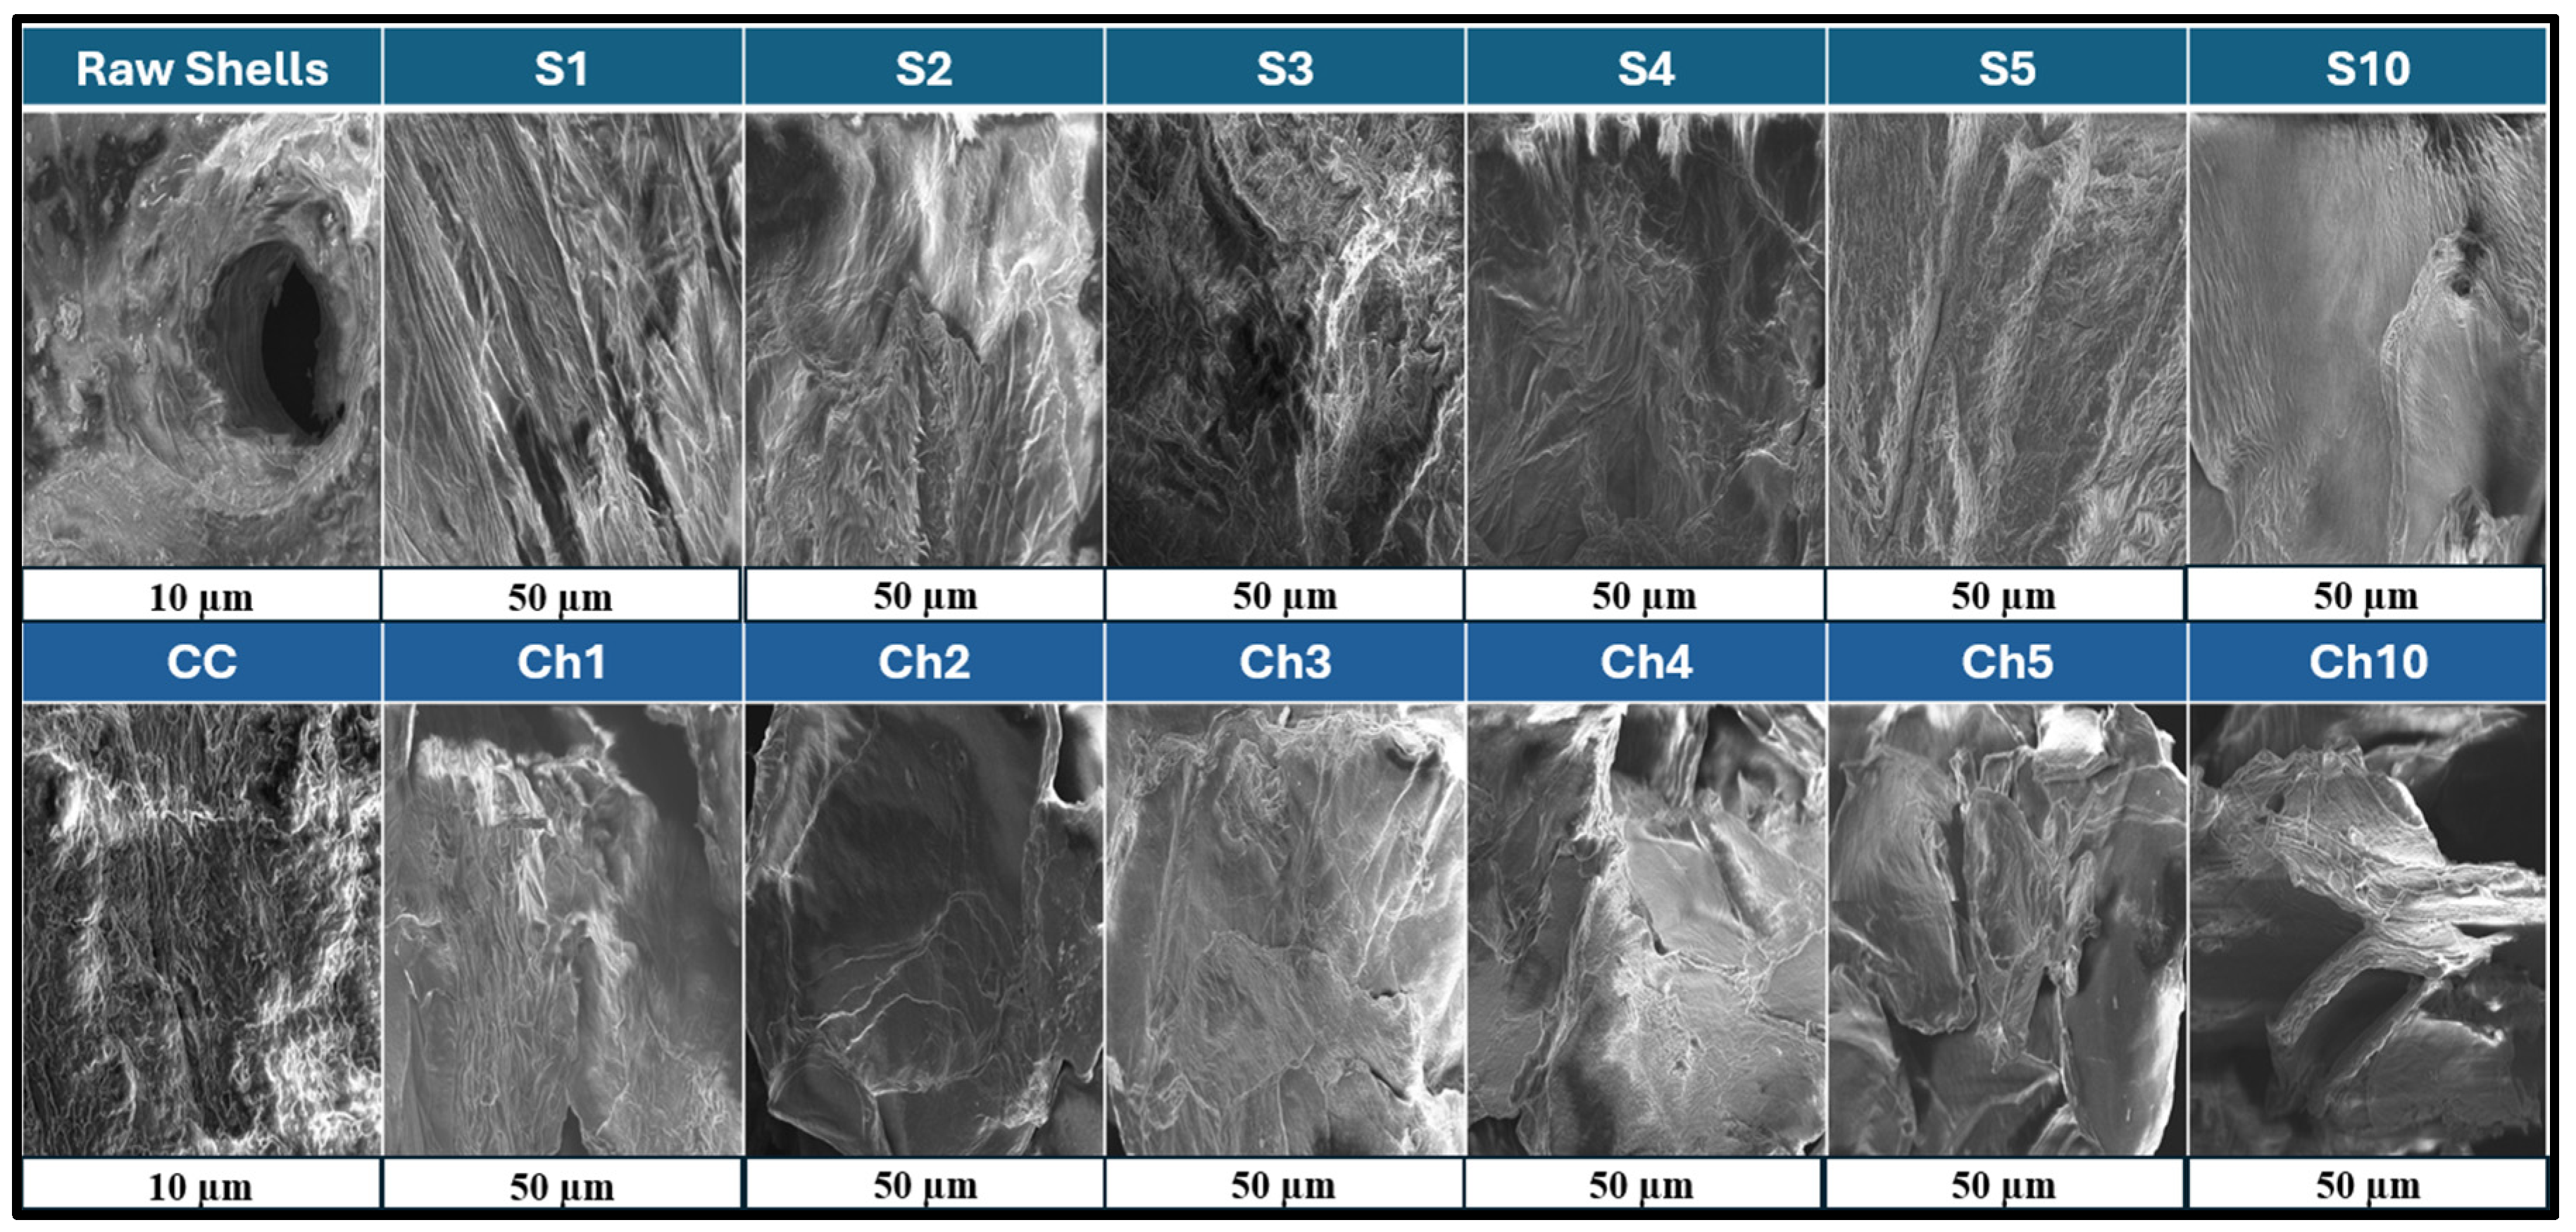
The SEM analysis at a higher magnification level of ×3000 and ten µm scale (Figure 9) showed that raw shrimp shells had a dense fibrillar network with mineral inclusions, protein cavities, and compact lamellae. This morphology explains the high initial ash content and protein residues visible before treatment. The literature confirms that untreated crustacean shells showed a composition of chitin fibers embedded into a CaCO3 and protein matrix [38,78]. In contrast, commercial chitosan exhibited a fragmented and disordered porous surface with irregular ridges and grooves lacking distinct layers. Meanwhile, ×1000 and fifty µm scale SEM images of chitosan samples isolated at RT showed a gradual increase in surface fragmentation, roughness, and disorder with increasing NaOH concentration. S1 and S2 samples exhibited dense layers, were fibril-like with aligned lamellae, and had few pores, whereas samples of S3 and S4 showed higher roughness and porous surfaces with a fibrous-thread-like structure, featuring early pore formations. Some cracks and openings appear, indicating improved alkali penetration and better deproteinization. Moreover, S5–S10 had much more porous and disturbed surfaces, with manifest micro-cavities and cracks. The fibrils lose alignment, indicating the total breakdown of the original structure. In particular, S10 showed flat, collapsed flakes instead of fibers, demonstrating substantial structural disruption under alkali treatment at RT.
Figure 9.
SEM at magnification power ×1000 of raw shells, commercial chitosan (CC), and recovered chitosan samples at ambient temperature (RT) and 50 ± 2 °C.
In contrast, chitosan samples (Ch1–Ch10) recovered at 50 ± 2 °C demonstrated higher porosity and roughness than CC and S1–S10 samples. Ch1–Ch2: The surfaces look flaky, smoother than S1–S2, and yet relatively compact. Some small pores and fibril separations are visible, confirming slight increases in their ash values (~1.3 ± 0.1–1.4 ± 0.1%). Ch3 and Ch4 showed the most disturbed and porous microstructures, indicating good lamellar separations with fibril fragmentation and micro-cavities development, whereas Ch5 and Ch10 represented denser and more aggregated microstructures with fewer pores than Ch3 and Ch4. These may be because of stronger alkaline treatment at elevated temperatures. This result is consistent with earlier results reported by [25,79]. SEM provides only qualitative data about surface morphology which means that it cannot directly quantify crystallinity. Therefore, the SEM together with XRD results were used to interpret the observations rather than to prove crystalline or amorphous structures separately. Furthermore, complementary methods such as differential scanning calorimetry (DSC) and solid-state NMR might be applied in the future to provide insightful interpretation of the structural organization of the extracted chitosan samples.
3.9. Similarity Scoring and Exploratory Machine Learning Modeling Results
Chitosan samples prepared under various deproteinization conditions were evaluated for similarity to commercial chitosan (CC) using a deterministic similarity scoring framework based on multiple physicochemical and structural characteristics, such as moisture content, ash content, degree of deacetylation (DD%), functional group vibrations (FTIR), and the X-ray diffraction crystallinity index (CI). The results of the overall similarity percentage are summarized in Table 4. Chitosan samples recovered at room temperature (S1–S2) showed the lowest similarity to CC (34.6–59.1%). Therefore, these samples are categorized as dissimilar, showing significant deviations in key properties like high residual moisture and ash content, along with differences in crystallinity compared to CC. However, they performed better than the reference chitosan in some quality parameters, especially higher DD%, indicating that their purity might be lower, but their structure is better refined. Samples S3, S4, S5, Ch1, Ch2, Ch5, and Ch10 showed moderate similarity to commercial chitosan (72.3–82.1%), reflecting partial feature agreement. In contrast, Ch3 and Ch4 exhibited the highest similarity percentages (87.3% and 89.7%), exceeding the similarity threshold and indicating the closest match to CC, with Ch4 reaching a maximum similarity of 89.7%. These results suggest that using 4% NaOH for deproteinization, along with consistent concentrations of demineralization (2% HCl) and deacetylation (50% NaOH) at 50 ± 2 °C, provides optimal conditions to produce chitosan with physicochemical and structural properties comparable or superior to CC. Although most samples were not similar to commercial chitosan, they all had higher DD% than CC and remained within acceptable ranges regarding functional group integrity, moisture, and ash content. This indicates promising potential for improving industrial chitosan quality. Overall, the findings demonstrate that extracted chitosan has significant potential for various industrial applications and could be enhanced to produce higher-grade chitosan products, even if it does not fully resemble commercial-grade chitosan.
Table 4.
Similarity (%) of chitosan samples extracted at ambient temperature (RT) and 50 ± 2 °C compared to commercial chitosan as a reference.
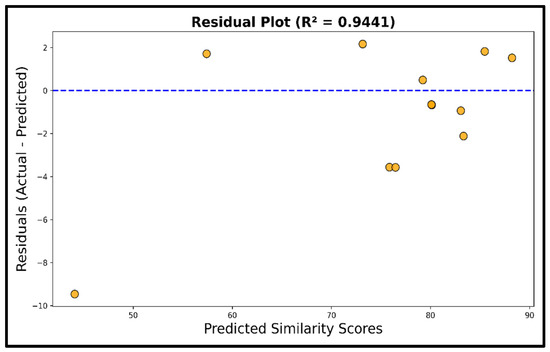
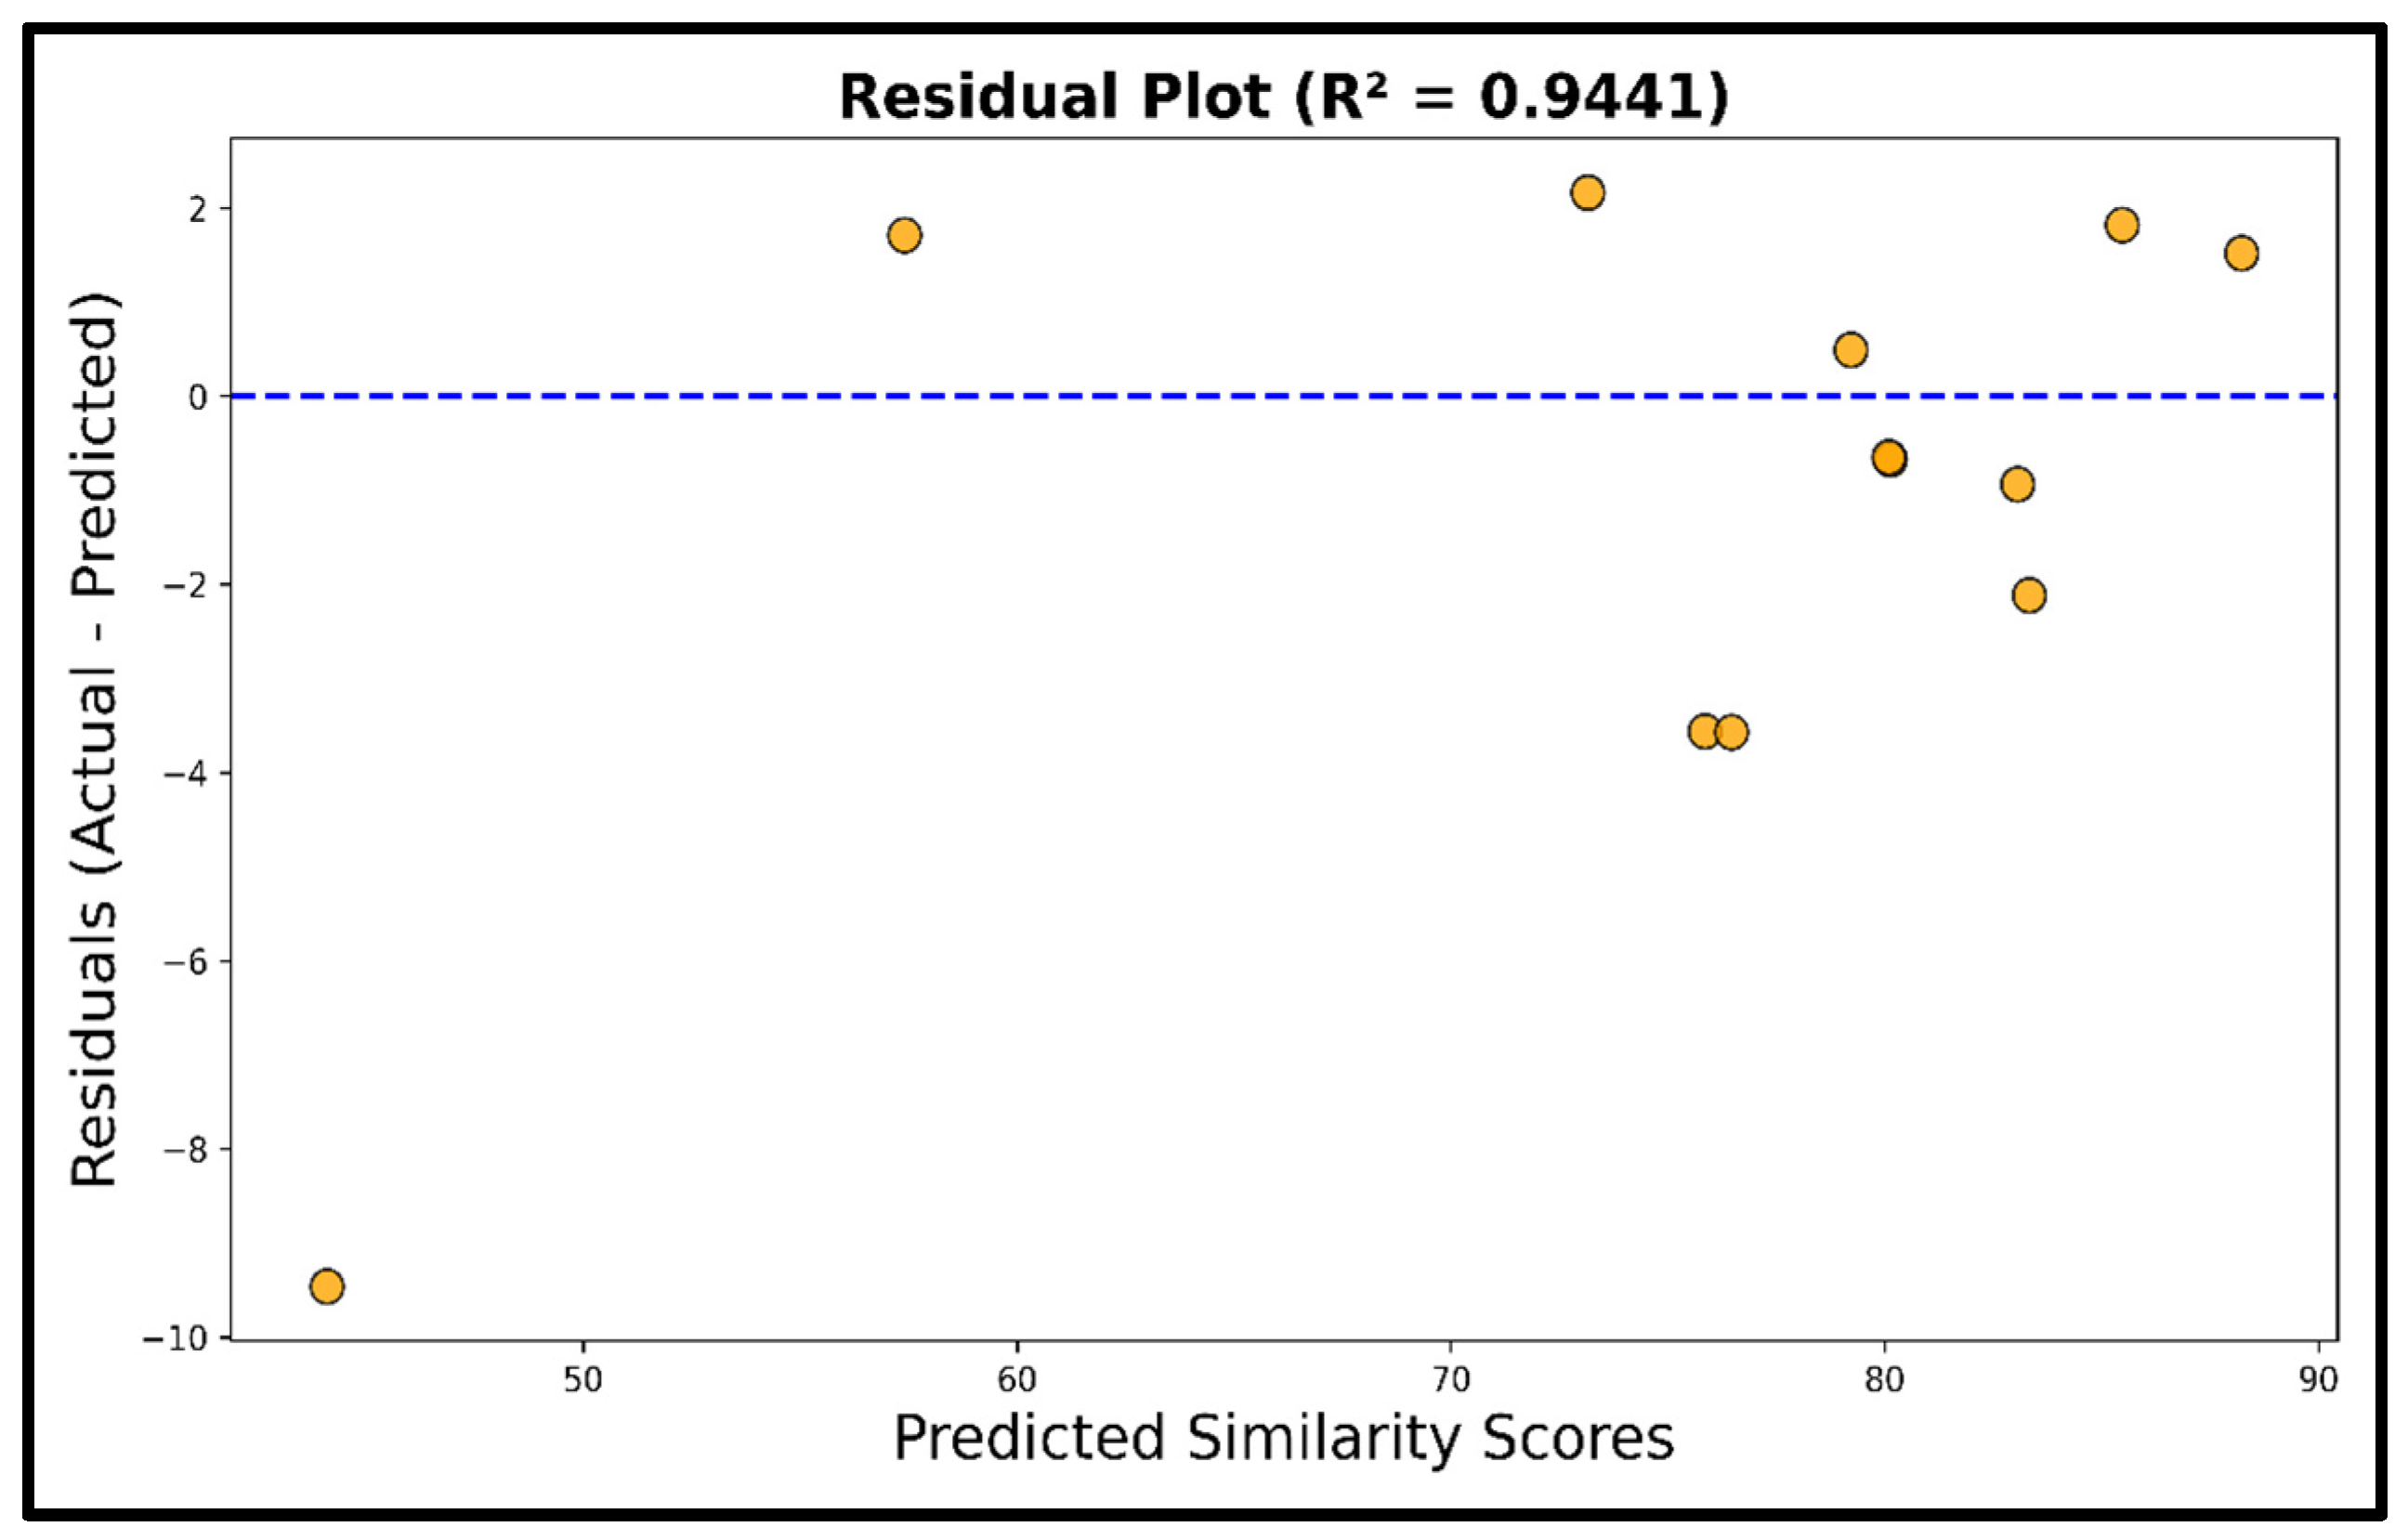
The random forest regressor was employed as an exploratory model to verify the overall pattern produced by deterministic similarity scores. The residual plot depicted in (Figure 10) showed minimal deviation between actual and predicted similarity percentages, demonstrating good exploratory predictive accuracy of R2 of 0.9441, indicating that the exploratory similarity model can be explained by 94.44% of the variance in similarity scores with no clear biases; however, incorporating more additional characteristics will enhance the exploratory model reliability in predicting similarity.
Figure 10.
Residual plot of differences between predicted and actual similarities of extracted chitosan samples and commercial chitosan as a reference.
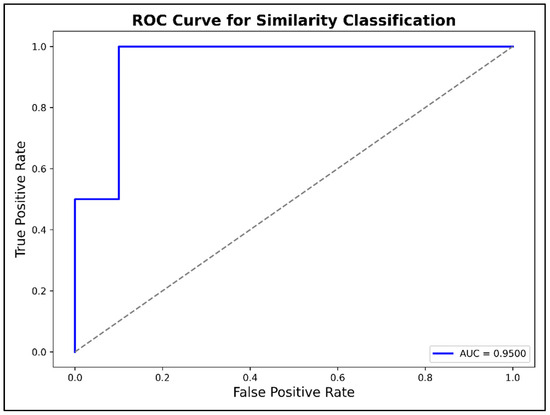
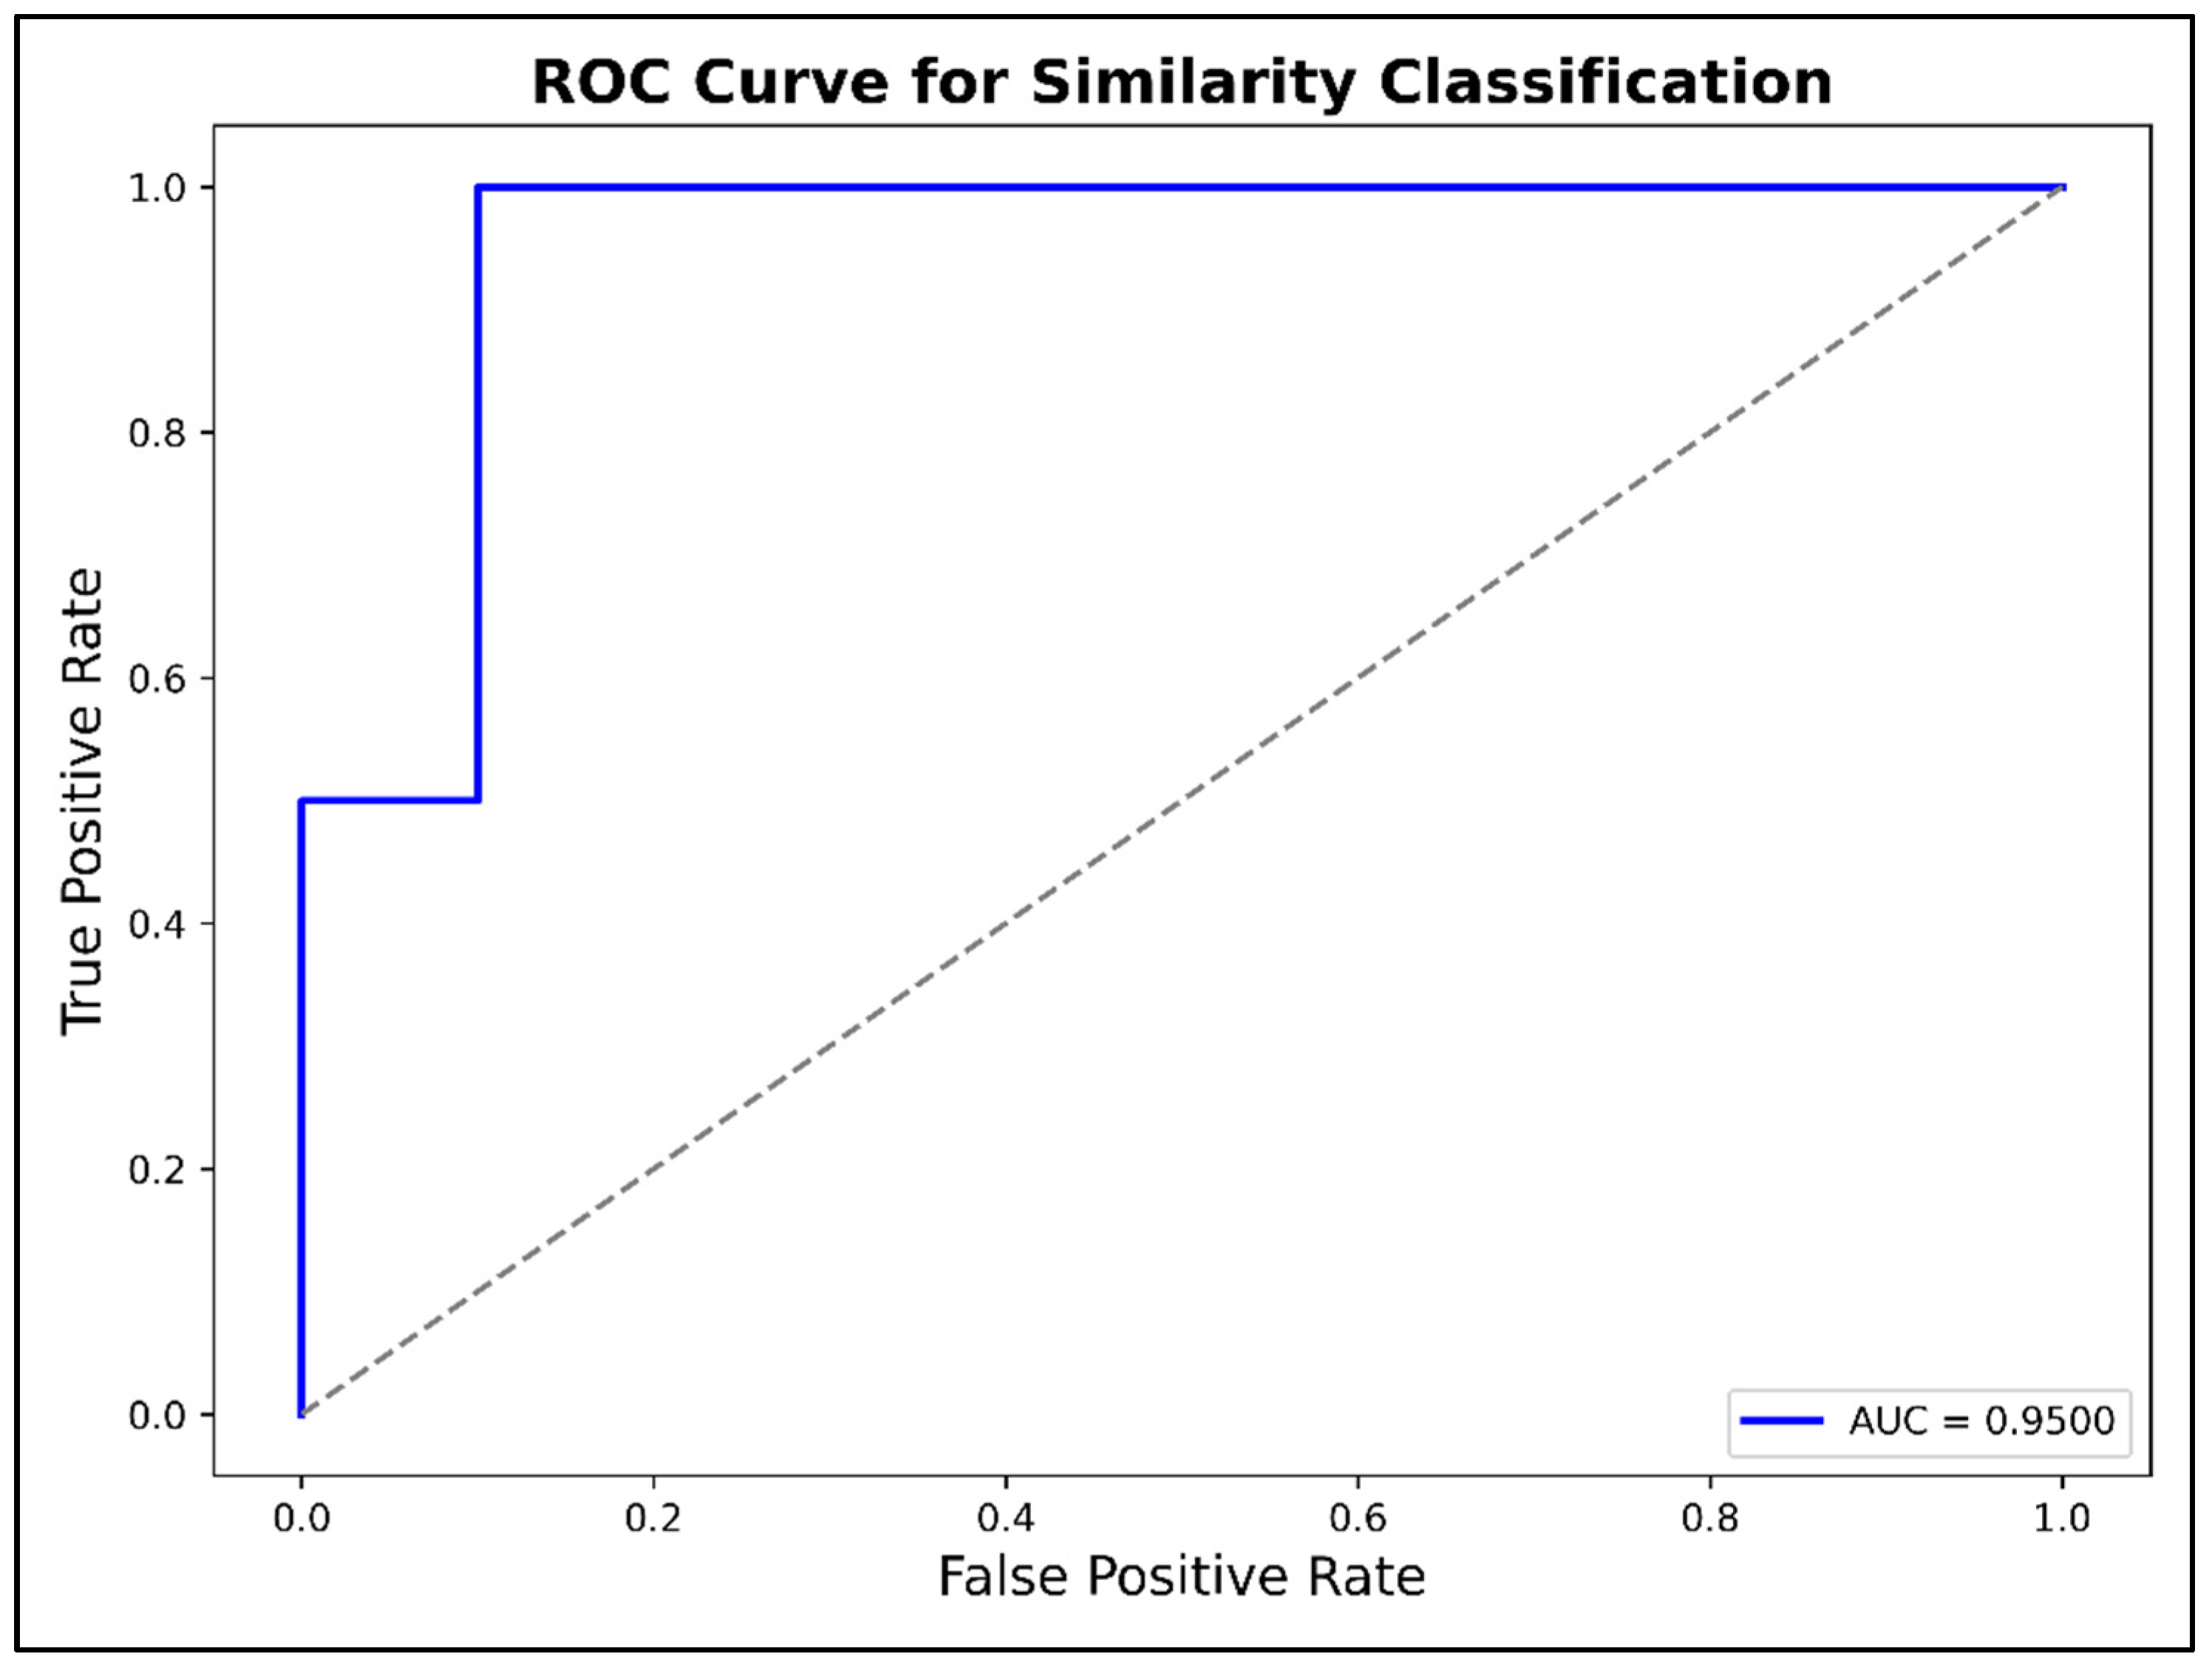
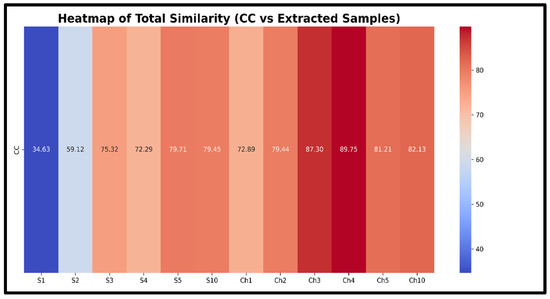
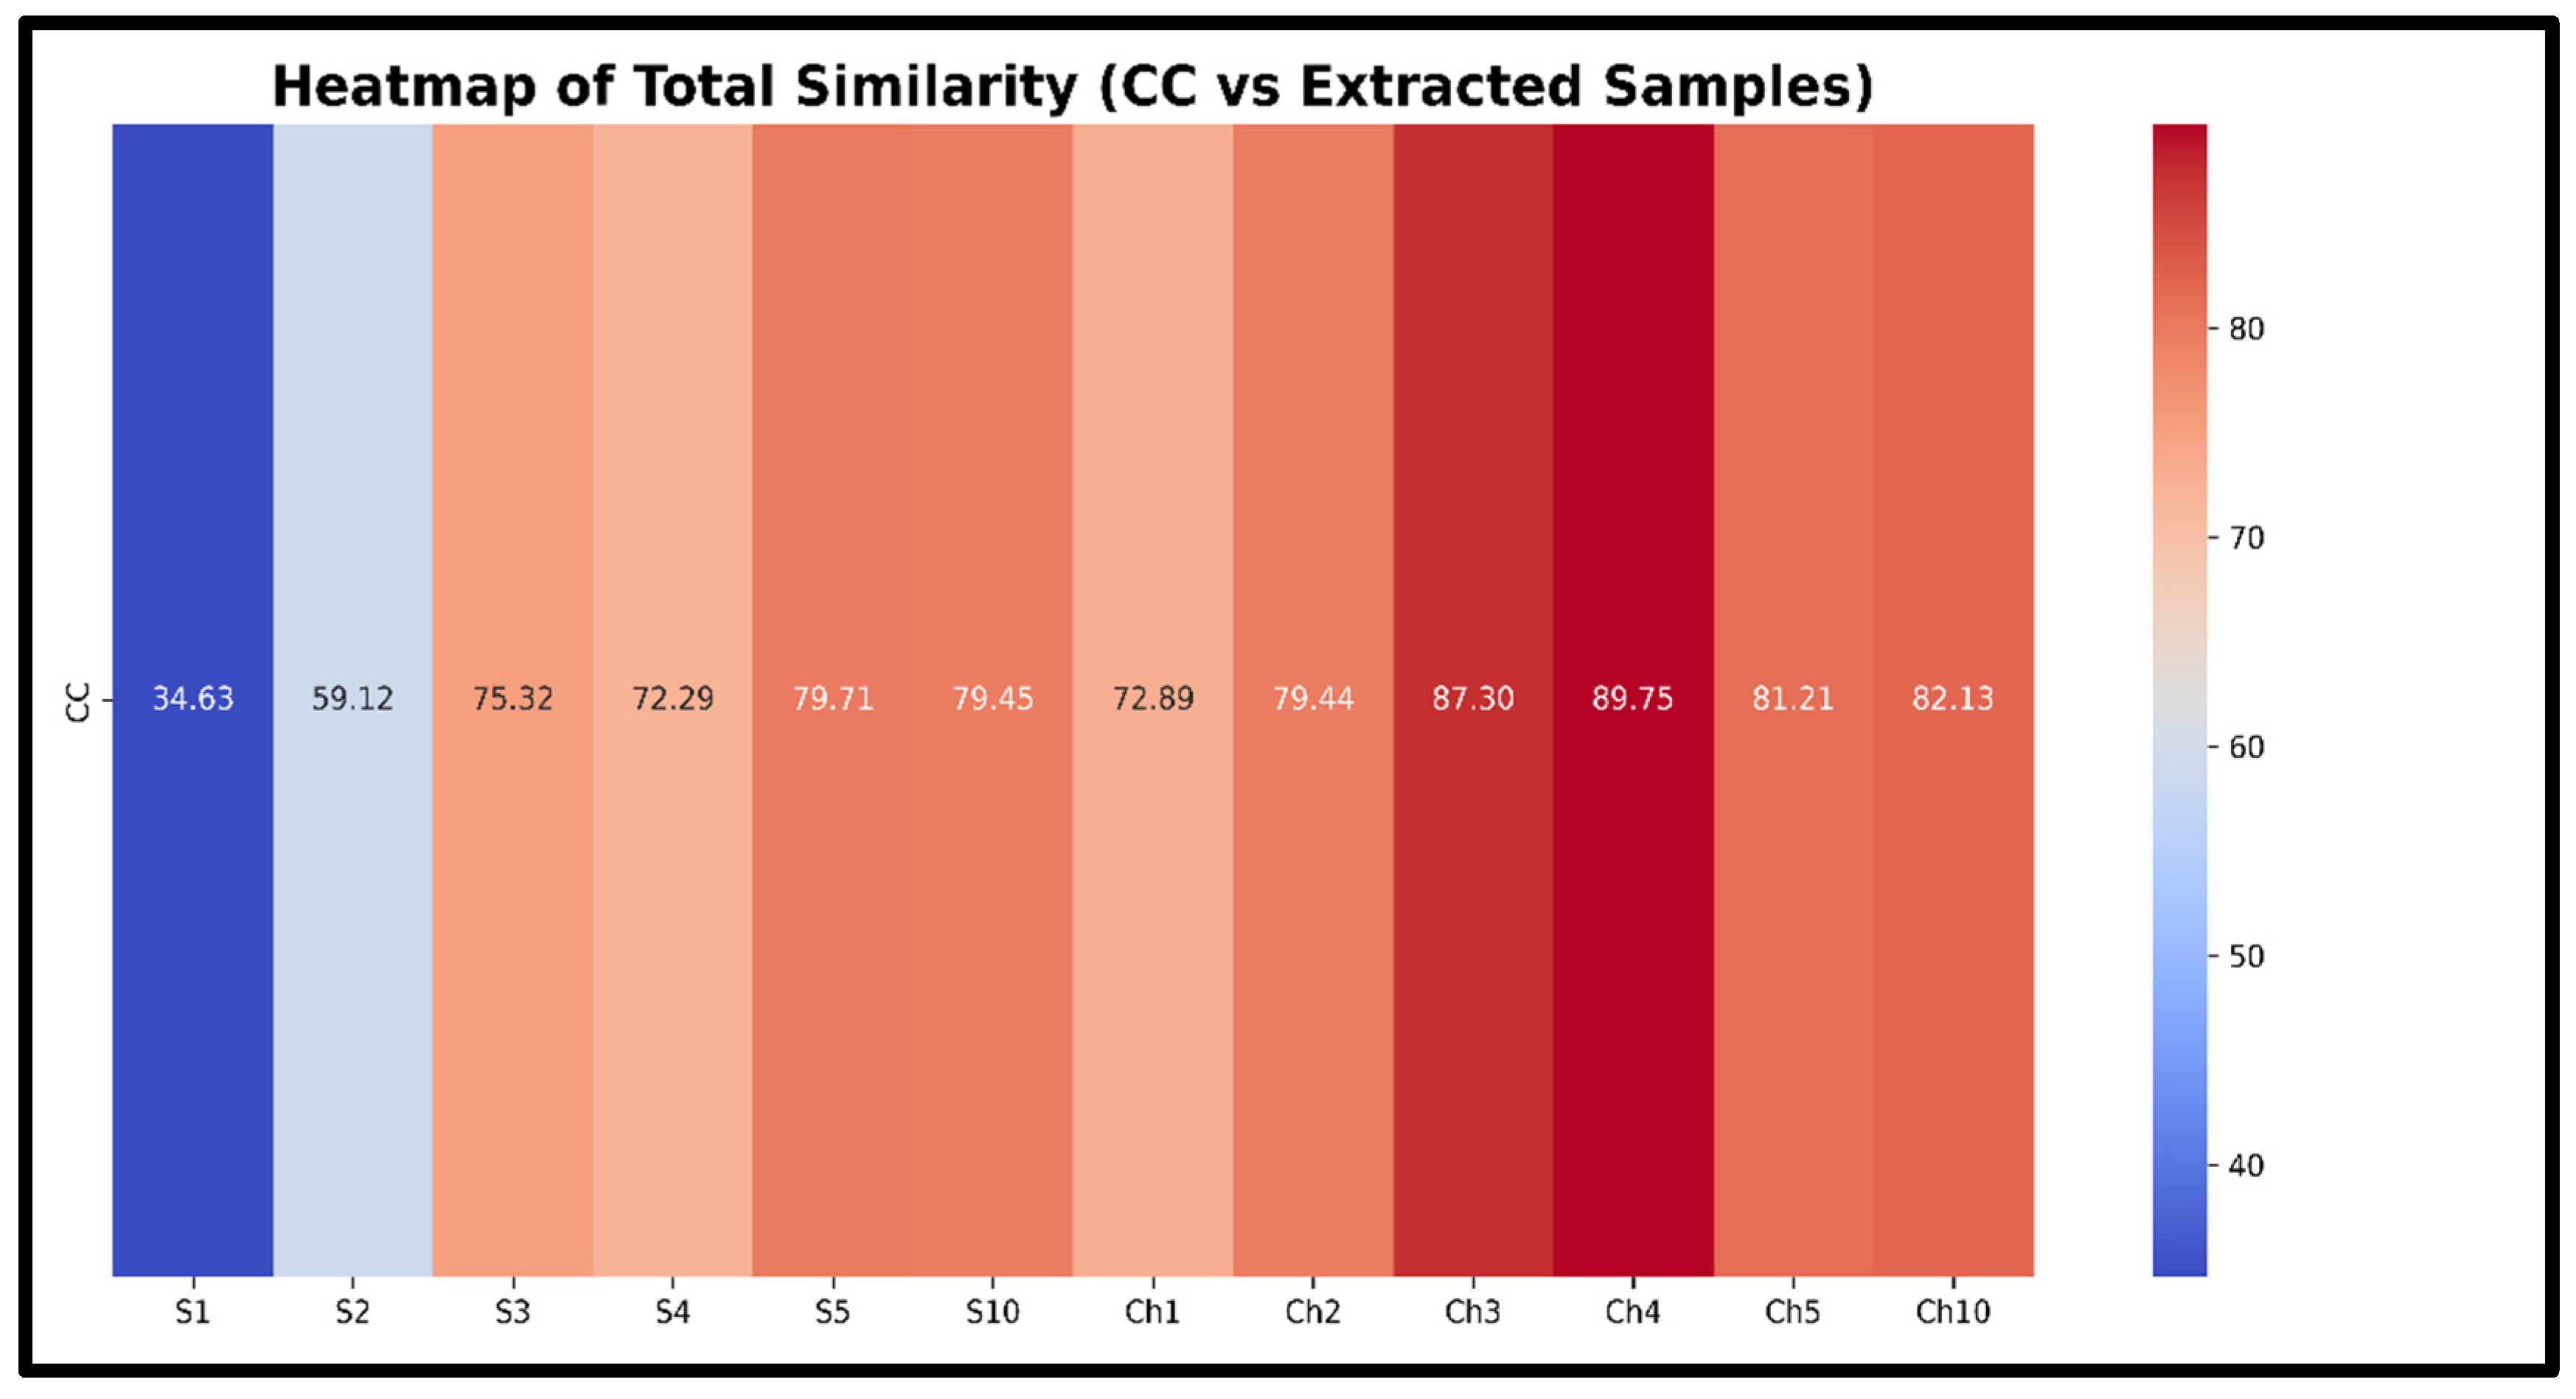
On the other hand, the performance of the model classification was evaluated by the exploratory ROC curve as represented in Figure 11. The result of the area under the curve (AUC) of 0.95 from the ROC curve showed excellent classification performance, indicating the exploratory model efficiency in distinguishing similar and dissimilar chitosan samples to commercial chitosan with a high true positive rate and a low false positive rate. Additionally, the heatmap visually demonstrates the overall similarity relationship between the extracted chitosan samples and commercial chitosan (Figure 12). Isolated chitosan samples with high similarity scores, such as Ch4 (89.75%) and Ch3 (87.3%), are represented in deep red, reflecting a strong agreement in physicochemical and structural parameters. In contrast, the low similarity values are represented by the samples S1 (34.63%) and S2 (59.12%) displayed in blue, indicating a substantial deviation from the commercial reference. This heatmap visualization effectively highlights the similarities between recovered and commercial chitosan samples.
Figure 11.
ROC of similarity binary classification of recovered chitosan samples and commercial chitosan as a reference.
Figure 12.
Heatmap of the total similarity percentages from low (blue) to high (red) between recovered chitosan samples and commercial chitosan as a reference.
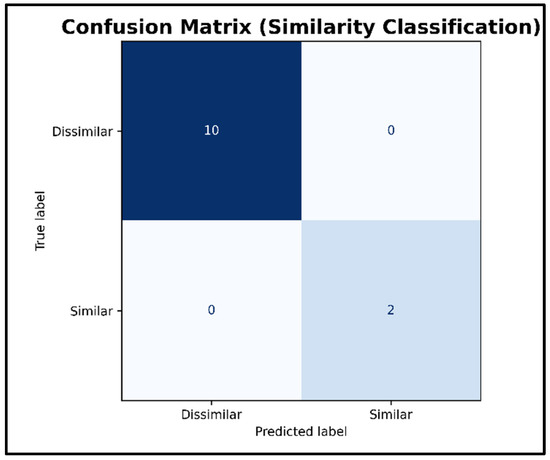
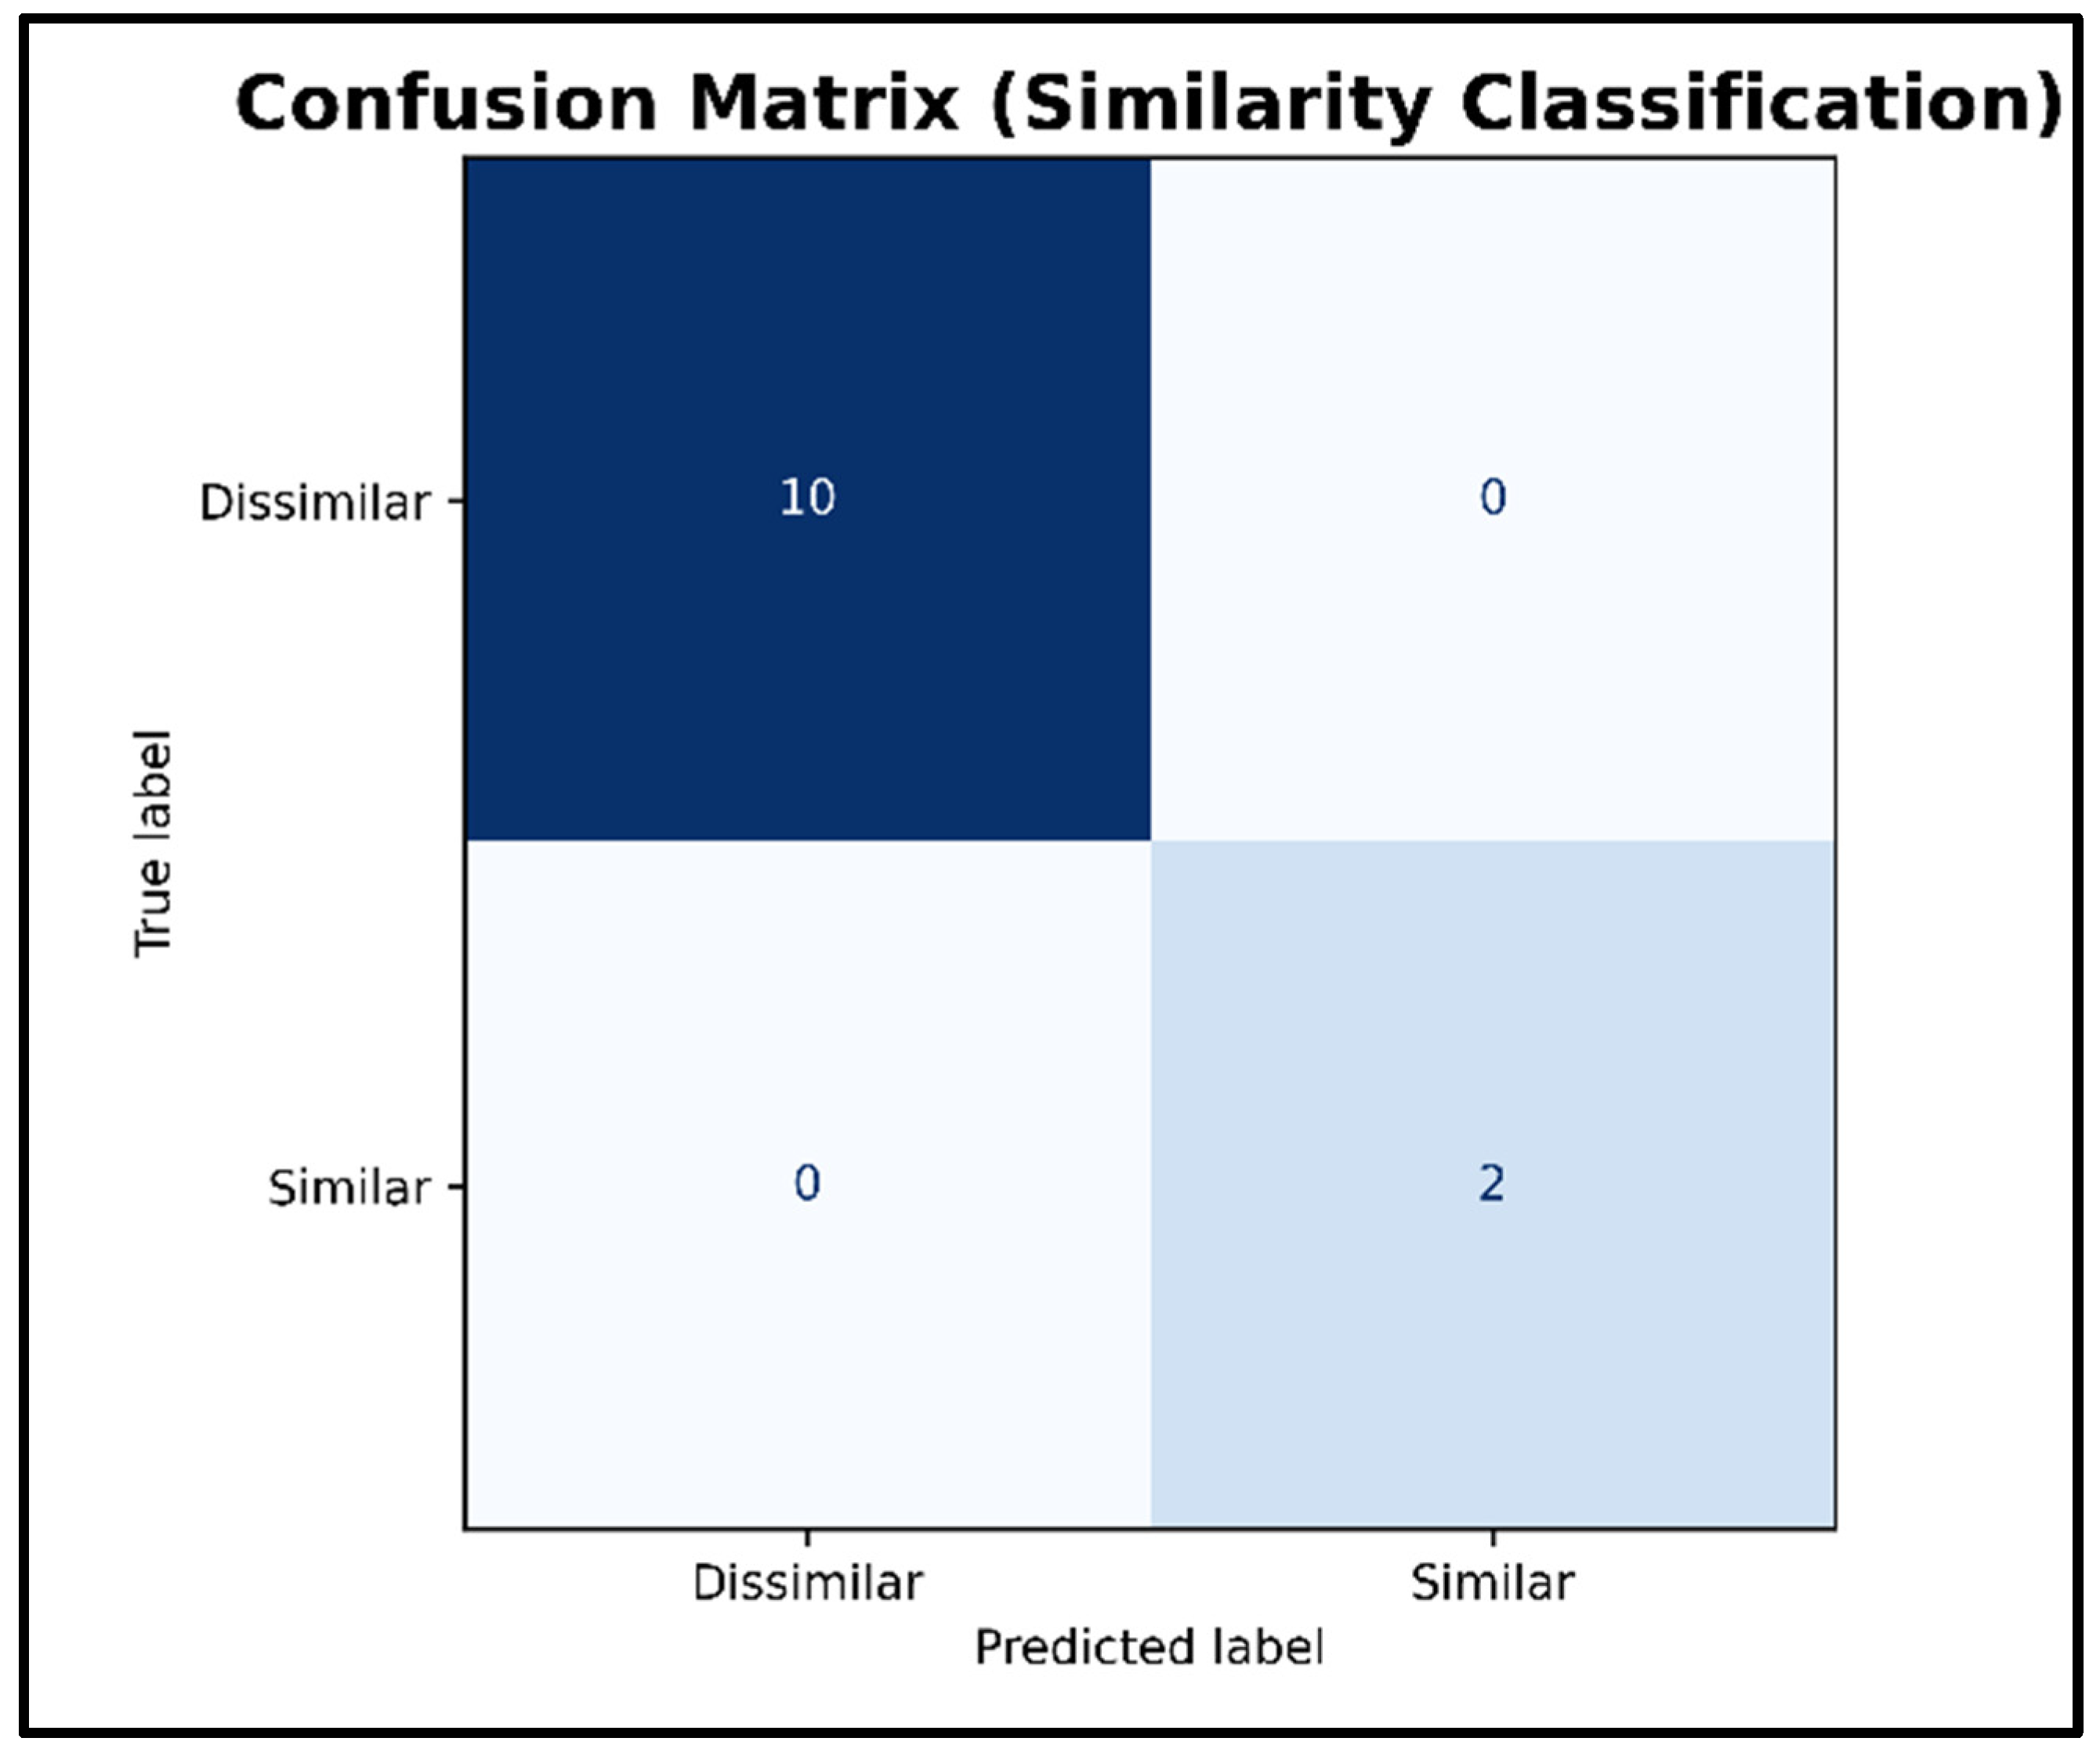
Furthermore, the confusion matrix (Figure 13) was used to validate the exploratory binary classification based on the similarity threshold (85%). The results showed that two samples (Ch3 and Ch4) were correctly classified as similar, while ten samples were correctly classified as dissimilar. This categorization meets the similarity threshold (85%) and highlights the ability of the model to accurately classify the samples.
Figure 13.
Confusion matrix of the similarity model between recovered chitosan samples and commercial chitosan as a reference.
4. Conclusions
Our previous works investigated the influence of extraction stages on chitosan yield through combining literature analysis and neural network modeling, in addition to experimental optimization of the demineralization stage, whereas the current study evaluated the influence of the deproteinization stage on chitosan’s structural properties while using machine learning to compare the resemblance of extracted chitosan samples with commercial chitosan. Chitosan utilization from shrimp shells (Litopenaeus vannamei) was optimized using a deproteinization approach, which relies on manipulation of NaOH alkali concentrations (1, 2, 3, 4, 5, and 10%) at RT and 50 ± 2 °C, while demineralization and deacetylation processes were maintained at stabilized conditions. The obtained chitosan products were characterized among ash content (%), moisture content (%), yield (%), deproteinization rate (%), FTIR, DD (%), XRD (CI%), and SEM. Furthermore, an innovative approach of using a machine learning-based similarity model of a random forest regressor combined with the advanced visualization techniques of the residual plot, ROC, heatmap, and confusion matrix was employed to evaluate the similarities of the physicochemical and structural characteristics between chitosan samples recovered by a deproteinization approach and commercial chitosan as a reference material.
The results obtained in the current study confirmed chitosan formation with partial to semi-complete deacetylation, with DD ranging from 98.84 ± 0.1% to 99.27 ± 0.004%. The ash content of extracted chitosan samples ranged from 2.43 ± 0.042 to 0.74 ± 0.05%, indicating the effectiveness of the demineralization step, while the moisture content ranged from 0.1 ± 0.02% to 0.44 ± 0.01%. On the other hand, chitosan yield and deproteinization rate were in the range of (7.8 ± 0.85% to 24.1 ± 0.03%) and (93.39 ± 0.083% to 97.0 ± 0.31%), respectively. While increasing the concentration of NaOH and temperature during the deproteinization stage enhances the deproteinization efficiency, it reduces the chitosan yield percentage. Moreover, the polymorphic and morphological analysis (XRD and SEM) in the present study demonstrated that commercial chitosan had a predominantly complete amorphous structure, while the amorphization of recovered chitosan samples at RT (S1–S10) showed a higher crystallinity index (4.48–10.5%) than the samples extracted at 50 ± 2 °C (0.37–5.27%) which had more amorphous structure and less crystalline arrangement, respectively. Furthermore, the deterministic similarity framework and exploratory machine learning-based similarity model were employed to determine the resemblance of isolated chitosan samples to commercial chitosan based on multiple characteristics, including ash content, moisture content, vibrations of functional groups, and crystallinity index. The results revealed clear distinctions between the chitosan samples’ features and their similarity to the reference commercial chitosan. Ch3 and Ch4 had higher similarity scores than other extracted chitosan samples, reflecting their resemblance in physicochemical and structural properties comparable to CC or even superior.
This study showed that the deproteinization approach was effective in isolating chitosan products with favorable chemical properties, particularly for applications in which a high degree of deacetylation is desirable. In this respect, the extracted chitosan samples may be relevant for uses such as antimicrobial applications, agricultural biostimulants and adsorbent-based systems since their high DD% can improve solubility and reactivity with biological and ionic substances. Since most samples exhibited limited similarity to commercial chitosan, additional assessments of molecular weight, molecular weight distribution, solubility, and functional performance through application-specific testing are still needed before their industrial applicability can be established.
Author Contributions
Conceptualization, A.H.; methodology, A.H.; investigation, A.H., D.D., I.I., J.B.-Z., M.U. and Š.V.; data analysis, S.U.; writing—original draft preparation, A.H.; writing—review and editing, D.D., M.U., Š.V., I.I. and K.B.; visualization, A.H.; supervision; All authors have read and agreed to the published version of the manuscript.
Funding
This research received no external funding.
Data Availability Statement
Data available upon request. Please let me know if this differs from the previous version.
Conflicts of Interest
The authors declare no conflicts of interest.
References
- Puvvada, Y.S.; Vankayalapati, S.; Sukhavasi, S. Extraction of chitin from chitosan from exoskeleton of shrimp for application in the pharmaceutical industry. Int. Curr. Pharm. J. 2012, 1, 258–263. [Google Scholar] [CrossRef] [Scilit]
- Wang, W.; Meng, Q.; Li, Q.; Liu, J.; Zhou, M.; Jin, Z.; Zhao, K. Chitosan derivatives and their application in biomedicine. Int. J. Mol. Sci. 2020, 21, 487. [Google Scholar] [CrossRef] [Scilit]
- Pokhrel, S.; Lach, R.; Grellmann, W.; Wutzler, A.; Lebek, W.; Godehardt, R.; Yadav, P.N.; Adhikari, R. Synthesis of chitosan from prawn shells and characterization of its structural and antimicrobial properties. Nepal J. Sci. Technol. 2016, 17, 5–9. [Google Scholar] [CrossRef] [Scilit]
- Bharathi, D.; Wadaan, M.A.; Mythili, R.; Lee, J. Synthesis of chitosan and gum Arabic functionalized silver nanocomposite for efficient removal of methylene blue and antibacterial activity. Polym. Adv. Technol. 2024, 35, e6356. [Google Scholar] [CrossRef] [Scilit]
- Doan, L.; Le, Q.N.; Tran, K.; Huynh, A.H. Surface Modifications of Silver Nanoparticles with Chitosan, Polyethylene Glycol, Polyvinyl Alcohol, and Polyvinylpyrrolidone as Antibacterial Agents against Staphylococcus aureus, Pseudomonas aeruginosa, and Salmonella enterica. Polymers 2024, 16, 1820. [Google Scholar] [CrossRef] [Scilit]
- Yusof, N. Production of Chitosan Oligosaccharides using β-glycosidic degrading enzyme: Optimization using Response Surface Methodology. Malays. J. Appl. Sci. 2020, 5, 30–44. [Google Scholar] [CrossRef] [Scilit]
- Nerdy, N.; Lestari, P.; Simorangkir, D.; Aulianshah, V.; Yusuf, F.; Bakri, T.K. Comparison of chitosan from crab shell waste and shrimp shell waste as natural adsorbent against heavy metals and dyes. Int. J. Appl. Pharm. 2022, 14, 181–185. [Google Scholar] [CrossRef] [Scilit]
- Chouhan, D.; Dutta, P.; Dutta, D.; Dutta, A.; Kumar, A.; Mandal, P.; Choudhuri, C.; Mathur, P. Effect of silver nanochitosan on control of seed-borne pathogens and maintaining seed quality of wheat. Phytopathol. Res. 2024, 6, 41. [Google Scholar] [CrossRef] [Scilit]
- Yuniastuti, E.; Insyira, A.R.; Pujiasmanto, B.; Sukaya. Effect of chitosan application time on seedlings of various rambutan varieties (Nephelium lappaceum L.). In Proceedings of the IOP Conference Series: Earth and Environmental Science, Medan, Indonesia, 26–27 September 2023. [Google Scholar] [CrossRef] [Scilit]
- Yulianto, T.; Putri, D.S.; Miranti, S.; Putra, W.K.A. Utilization of Shrimp Shell Waste as Alternative Raw for Mariculture. E3S Web Conf. 2021, 324, 4. [Google Scholar] [CrossRef] [Scilit]
- Adeyemi, A.O.; Ojoawo, S.O. Production and characterization of chitosan of crustacean shells. Mater. Today Proc. 2023, 88, 128–134. [Google Scholar] [CrossRef] [Scilit]
- Fatnah, N.; Azizah, D.; Cahyani, M.D. Synthesis of Chitosan from Crab’s Shell Waste (Portunus pelagicus) in Mertasinga-Cirebon. In Proceedings of the International Conference on Progressive Education (ICOPE 2019); Atlantis Press: Dordrecht, The Netherlands, 2020. [Google Scholar] [CrossRef] [Scilit]
- Ovonramwen, O.B.; Amoren, E.I. Extraction of Chitosan from L. squarrosulus (Mushroom) and C. africana (Shrimp) Based and Production of Film Polymer. Dutse J. Pure Appl. Sci. 2023, 9, 283–296. [Google Scholar] [CrossRef] [Scilit]
- Ibitoye, E.B.; Lokman, I.H.; Hezmee, M.N.M.; Goh, Y.M.; Zuki, A.B.Z.; Jimoh, A.A. Extraction and physicochemical characterization of chitin and chitosan isolated from house cricket. Biomed. Mater. 2018, 13, 025009. [Google Scholar] [CrossRef] [Scilit]
- Kucukgulmez, A.; Celik, M.; Yanar, Y.; Sen, D.; Polat, H.; Kadak, A.E. Physicochemical characterization of chitosan extracted from Metapenaeus stebbingi shells. Food Chem. 2011, 126, 1144–1148. [Google Scholar] [CrossRef] [Scilit]
- Pădurețu, C.C.; Isopescu, R.D.; Gîjiu, C.L.; Rău, I.; Apetroaei, M.R.; Schröder, V. Optimization of chitin extraction procedure from shrimp waste using Taguchi method and chitosan characterization. Mol. Cryst. Liq. Cryst. 2019, 695, 19–28. [Google Scholar] [CrossRef] [Scilit]
- Tokatlı, K.; Demirdöven, A. Optimization of chitin and chitosan production from shrimp wastes and characterization. J. Food Process. Preserv. 2018, 42, e13494. [Google Scholar] [CrossRef] [Scilit]
- Al Hoqani, H.A.S.; AL-Shaqsi, N.; Hossain, M.A.; Al Sibani, M.A. Isolation and optimization of the method for industrial production of chitin and chitosan from Omani shrimp shell. Carbohydr. Res. 2020, 492, 108001. [Google Scholar] [CrossRef] [Scilit] [PubMed]
- Sugiyanti, D.; Anggrahini, S.; Pranoto, Y.; Anwar, C.; Santoso, U. Low Molecular Weight Chitosan from Shrimp Shell Waste using Steam-Explosion Process Under Catalyst of Phosphotungstic Acid. Orient. J. Chem. 2019, 35, 193–199. [Google Scholar] [CrossRef] [Scilit]
- Nguyen, H.T.-T.; Tran, T.N.; Ha, A.C.; Huynh, P.D. Impact of Deacetylation Degree on Properties of Chitosan for Formation of Electrosprayed Nanoparticles. J. Nanotechnol. 2022, 2022, 2288892. [Google Scholar] [CrossRef] [Scilit]
- Sitohy, M.; Ewais, A.; Ghany, A.G.A.; Saber, R. Fully deacetylated chitosan from shrimp and crab using minimum heat input. Egypt. J. Chem. 2022, 66, 321–337. [Google Scholar] [CrossRef] [Scilit]
- Ojeda-Hernández, D.D.; Canales-Aguirre, A.A.; Matias-Guiu, J.; Gomez-Pinedo, U.; Mateos-Díaz, J.C. Potential of Chitosan and Its Derivatives for Biomedical Applications in the Central Nervous System. Front. Bioeng. Biotechnol. 2020, 8, 389. [Google Scholar] [CrossRef] [Scilit]
- Rizeq, B.R.; Younes, N.N.; Rasool, K.; Nasrallah, G.K. Synthesis, bioapplications, and toxicity evaluation of chitosan-based nanoparticles. Int. J. Mol. Sci. 2019, 20, 5776. [Google Scholar] [CrossRef] [Scilit]
- Yadav, M.; Kaushik, B.; Rao, G.K.; Srivastava, C.M.; Vaya, D. Advances and challenges in the use of chitosan and its derivatives in biomedical fields: A review. Carbohydr. Polym. Technol. Appl. 2023, 5, 100323. [Google Scholar] [CrossRef] [Scilit]
- Ul-Islam, M.; Alabbosh, K.F.; Manan, S.; Khan, S.; Ahmad, F.; Ullah, M.W. Chitosan-based nanostructured biomaterials: Synthesis, properties, and biomedical applications. Adv. Ind. Eng. Polym. Res. 2024, 7, 79–99. [Google Scholar] [CrossRef] [Scilit]
- He, X.; Li, K.; Xing, R.; Liu, S.; Hu, L.; Li, P. The production of fully deacetylated chitosan by compression method. Egypt. J. Aquat. Res. 2016, 42, 75–81. [Google Scholar] [CrossRef] [Scilit]
- Marei, N.H.; El-Samie, E.A.; Salah, T.; Saad, G.R.; Elwahy, A.H.M. Isolation and characterization of chitosan from different local insects in Egypt. Int. J. Biol. Macromol. 2016, 82, 871–877. [Google Scholar] [CrossRef] [Scilit]
- Ahing, F.A.; Wid, N. Extraction and Characterization of Chitosan from Shrimp Shell Waste in Sabah. Trans. Sci. Technol. 2016, 3, 227–237. [Google Scholar]
- Thirupathi, K.; Raorane, C.J.; Ramkumar, V.; Ulagesan, S.; Santhamoorthy, M.; Raj, V.; Krishnakumar, G.S.; Phan, T.T.V.; Kim, S.-C. Update on Chitosan-Based Hydrogels: Preparation, Characterization, and Its Antimicrobial and Antibiofilm Applications. Gels 2023, 9, 35. [Google Scholar] [CrossRef] [Scilit]
- Marques, C.; Som, C.; Schmutz, M.; Borges, O.; Borchard, G. How the Lack of Chitosan Characterization Precludes Implementation of the Safe-by-Design Concept. Front. Bioeng. Biotechnol. 2020, 8, 165. [Google Scholar] [CrossRef] [Scilit]
- Al-Manhel, A.J.; Al-Hilphy, A.R.S.; Niamah, A.K. Extraction of chitosan, characterisation and its use for water purification. J. Saudi Soc. Agric. Sci. 2018, 17, 186–190. [Google Scholar] [CrossRef] [Scilit]
- Aldila, H.; Asmar; Fabiani, V.A.; Dalimunthe, D.Y.; Irwanto, R. The effect of deproteinization temperature and NaOH concentration on deacetylation step in optimizing extraction of chitosan from shrimp shells waste. In IOP Conference Series: Earth and Environmental Science; IOP Publishing Ltd.: Bristol, UK, 2020. [Google Scholar] [CrossRef] [Scilit]
- Hosney, A.; Ullah, S.; Barčauskaitė, K. A Review of the Chemical Extraction of Chitosan from Shrimp Wastes and Prediction of Factors Affecting Chitosan Yield by Using an Artificial Neural Network. Mar. Drugs 2022, 20, 675. [Google Scholar] [CrossRef] [Scilit] [PubMed]
- Hosney, A.; Urbonavičius, M.; Varnagiris, Š.; Ignatjev, I.; Ullah, S.; Barčauskaitė, K. Feasibility study on optimizing chitosan extraction and characterization from shrimp biowaste via acidic demineralization. Biomass Convers. Biorefinery 2024, 15, 12673–12687. [Google Scholar] [CrossRef] [Scilit]
- AOAC. Association of Official Analytical Chemists (AOAC). In Van Nostrand’s Encyclopedia of Chemistry; Wiley: Hoboken, NJ, USA, 2005. [Google Scholar] [CrossRef] [Scilit]
- Ullah, S.; Naeem, A.; Calkaite, I.; Hosney, A.; Depar, N.; Barcauskaite, K. Zinc (Zn) mitigates copper (Cu) toxicity and retrieves yield and quality of lettuce irrigated with Cu and Zn-contaminated simulated wastewater. Environ. Sci. Pollut. Res. 2023, 30, 54800–54812. [Google Scholar] [CrossRef] [Scilit] [PubMed]
- Barčauskaitė, K.; Drapanauskaitė, D.; Silva, M.; Murzin, V.; Doyeni, M.; Urbonavicius, M.; Williams, C.F.; Supronienė, S.; Baltrusaitis, J. Low concentrations of Cu2+ in synthetic nutrient containing wastewater inhibit MgCO3-to-struvite transformation. Environ. Sci. 2021, 7, 521–534. [Google Scholar] [CrossRef] [Scilit]
- Duarte, M.L.; Ferreira, M.C.; Marvão, M.R.; Rocha, J. An optimised method to determine the degree of acetylation of chitin and chitosan by FTIR spectroscopy. Int. J. Biol. Macromol. 2002, 31, 1–8. [Google Scholar] [CrossRef] [Scilit]
- Younes, I.; Rinaudo, M. Chitin and chitosan preparation from marine sources. Structure, properties and applications. Mar. Drugs 2015, 13, 1133–1174. [Google Scholar] [CrossRef] [Scilit] [PubMed]
- Díaz-Rojas, E.I.; Argüelles-Monal, W.M.; Higuera-Ciapara, I.; Hernández, J.; Lizardi-Mendoza, J.; Goycoolea, F.M. Determination of Chitin and Protein Contents During the Isolation of Chitin from Shrimp Waste. Macromol. Biosci. 2006, 6, 340–347. [Google Scholar] [CrossRef] [Scilit]
- Pageeditor, A.L. Black, Method of Soil Analysis Part 2. Chemical and Microbiological Properties; American Society of Agronomy, Soil Science Society of America: Madison, WI, USA, 1965; Volume 9. [Google Scholar]
- Osorio-Madrazo, A.; David, L.; Trombotto, S.; Lucas, J.-M.; Peniche-Covas, C.; Domard, A. Kinetics Study of the Solid-State Acid Hydrolysis of Chitosan: Evolution of the Crystallinity and Macromolecular Structure. Biomacromolecules 2010, 11, 1376–1386. [Google Scholar] [CrossRef] [Scilit]
- Triandini, E.; Fauzan, R.; Siahaan, D.O.; Rochimah, S.; Suardika, I.G.; Karolita, D. Software similarity measurements using UML diagrams: A systematic literature review. Regist. J. Ilm. Teknol. Sist. Inf. 2022, 8, 10–23. [Google Scholar] [CrossRef] [Scilit]
- Mutanga, O.; Adam, E.; Cho, M.A. High density biomass estimation for wetland vegetation using worldview-2 imagery and random forest regression algorithm. Int. J. Appl. Earth Obs. Geoinf. 2012, 18, 399–406. [Google Scholar] [CrossRef] [Scilit]
- Munir, S.; Seminar, K.B.; Sudradjat; Sukoco, H.; Buono, A. The Use of Random Forest Regression for Estimating Leaf Nitrogen Content of Oil Palm Based on Sentinel 1-A Imagery. Information 2023, 14, 10. [Google Scholar] [CrossRef] [Scilit]
- Wang, G.; Lyu, Z.; Li, X. An Optimized Random Forest Regression Model for Li-Ion Battery Prognostics and Health Management. Batteries 2023, 9, 332. [Google Scholar] [CrossRef] [Scilit]
- Hanif, W.H.; Gunawan, F.E. Random Forest Regression to Predict Catalyst Deactivation in Industrial Catalytic Process. TEM J. 2022, 11, 104–110. [Google Scholar] [CrossRef] [Scilit]
- Jain, S.K.; Gupta, A.K. Application of Random Forest Regression with Hyper-parameters Tuning to Estimate Reference Evapotranspiration. Int. J. Adv. Comput. Sci. Appl. 2022, 13, 5. [Google Scholar] [CrossRef] [Scilit]
- Krupinski, E.A. Receiver operating characteristic (Roc) analysis. Frontline Learn. Res. 2017, 5, 31–42. [Google Scholar] [CrossRef] [Scilit]
- Sachs, M.C. Plotroc: A tool for plotting ROC curves. J. Stat. Softw. 2017, 79, 1–19. [Google Scholar] [CrossRef] [Scilit] [PubMed]
- Pérez, J.A.M.; Martin, P.S.P. ROC curve. Med. Fam. Semer. 2023, 49, 101821. [Google Scholar] [CrossRef] [Scilit]
- Ntinou, I.; Sanchez, E.; Bulat, A.; Valstar, M.; Tzimiropoulos, G. A Transfer Learning Approach to Heatmap Regression for Action Unit Intensity Estimation. IEEE Trans. Affect. Comput. 2023, 14, 436–450. [Google Scholar] [CrossRef] [Scilit]
- Schwabish, J. Heatmap. In Data Visualization in Excel; Taylor & Francis Group: Abingdon, UK, 2023. [Google Scholar] [CrossRef] [Scilit]
- Yu, B.; Tao, D. Heatmap Regression via Randomized Rounding. IEEE Trans. Pattern Anal. Mach. Intell. 2022, 44, 8276–8289. [Google Scholar] [CrossRef] [Scilit] [PubMed]
- Caelen, O. A Bayesian interpretation of the confusion matrix. Ann. Math. Artif. Intell. 2017, 81, 429–450. [Google Scholar] [CrossRef] [Scilit]
- Yun, H. Prediction model of algal blooms using logistic regression and confusion matrix. Int. J. Electr. Comput. Eng. 2021, 11, 2407–2413. [Google Scholar] [CrossRef] [Scilit]
- Sharma, A. Confusion Matrix in Machine Learning. 2018. Available online: www.geeksforgeeks.org (accessed on 17 June 2023).
- Riehl, K.; Neunteufel, M.; Hemberg, M. Hierarchical confusion matrix for classification performance evaluation. J. R. Stat. Soc. Ser. C Appl. Stat. 2023, 72, 1394–1412. [Google Scholar] [CrossRef]
- Eddya, M.; Tbib, B.; EL-Hami, K. A comparison of chitosan properties after extraction from shrimp shells by diluted and concentrated acids. Heliyon 2020, 6, e03486. [Google Scholar] [CrossRef] [Scilit] [PubMed]
- Sagheer, F.A.A.; Al-Sughayer, M.A.; Muslim, S.; Elsabee, M.Z. Extraction and characterization of chitin and chitosan from marine sources in Arabian Gulf. Carbohydr. Polym. 2009, 77, 410–419. [Google Scholar] [CrossRef] [Scilit]
- Younes, I.; Hajji, S.; Rinaudo, M.; Chaabouni, M.; Jellouli, K.; Nasri, M. Optimization of proteins and minerals removal from shrimp shells to produce highly acetylated chitin. Int. J. Biol. Macromol. 2016, 84, 246–253. [Google Scholar] [CrossRef] [Scilit]
- No, H.K.; Meyers, S.P. Preparation and Characterization of Chitin and Chitosan—A Review. J. Aquat. Food Prod. Technol. 1995, 4, 27–52. [Google Scholar] [CrossRef] [Scilit]
- Fadlaoui, S.; El Asri, O.; Mohammed, L.; Sihame, A.; Omari, A.; Melhaoui, M. Isolation and characterization of chitin from shells of the freshwater crab potamon algeriense. Prog. Chem. Appl. Chitin Deriv. 2019, 24, 23–35. [Google Scholar] [CrossRef] [Scilit]
- Olaosebikan, A.O.; Kehinde, O.A.; Tolulase, O.A.; Victor, E.B. Extraction and characterization of chitin and chitosan from Callinectes amnicola and Penaeus notialis shell wastes. J. Chem. Eng. Mater. Sci. 2021, 12, 1–30. [Google Scholar] [CrossRef] [Scilit]
- Rinaudo, M. Chitin and chitosan: Properties and applications. Prog. Polym. Sci. 2006, 31, 603–632. [Google Scholar] [CrossRef] [Scilit]
- El-araby, A.; El Ghadraoui, L.; Errachidi, F. Physicochemical Properties and Functional Characteristics of Ecologically Extracted Shrimp Chitosans with Different Organic Acids during Demineralization Step. Molecules 2022, 27, 8285. [Google Scholar] [CrossRef] [Scilit] [PubMed]
- Alishahi, A.; Mirvaghefi, A.; Tehrani, M.R.; Farahmand, H.; Shojaosadati, S.A.; Dorkoosh, F.A.; Elsabee, M.Z. Enhancement and Characterization of Chitosan Extraction from the Wastes of Shrimp Packaging Plants. J. Polym. Environ. 2011, 19, 776–783. [Google Scholar] [CrossRef] [Scilit]
- Rashmi, S.H.; Biradar, B.; Maladkar, K.; Kittur, A.A. Extraction of chitin from prawn shell and preparation of chitosan. Res. J. Chem. Environ. Sci. 2016, 4, 70–73. [Google Scholar]
- Rasweefali, M.K.; Sabu, S.; Sunooj, K.V.; Sasidharan, A.; Xavier, K.A.M. Consequences of chemical deacetylation on physicochemical, structural and functional characteristics of chitosan extracted from deep-sea mud shrimp. Carbohydr. Polym. Technol. Appl. 2021, 2, 100032. [Google Scholar] [CrossRef] [Scilit]
- Percot, A.; Viton, C.; Domard, A. Characterization of shrimp shell deproteinization. Biomacromolecules 2003, 4, 1380–1385. [Google Scholar] [CrossRef] [Scilit]
- Rasweefali, M.K.; Sabu, S.; Azad, K.M.; Rahman, M.R.; Sunooj, K.; Sasidharan, A.; Anoop, K. Influence of deproteinization and demineralization process sequences on the physicochemical and structural characteristics of chitin isolated from Deep-sea mud shrimp (Solenocera hextii). Adv. Biomark. Sci. Technol. 2022, 4, 12–27. [Google Scholar] [CrossRef] [Scilit]
- Boudouaia, N.; Bengharez, Z.; Jellali, S. Preparation and characterization of chitosan extracted from shrimp shells waste and chitosan film: Application for Eriochrome black T removal from aqueous solutions. Appl. Water Sci. 2019, 9, 91. [Google Scholar] [CrossRef] [Scilit]
- Boulahsen, M.A.; Chairi, H.; Laglaoui, A.; Arakrak, A.; Zantar, S.; Bakkali, M.; Hassani, M. Optimization and characterization of gelatin and chitosan extracted from fish and shrimp waste. E3S Web Conf. EDP Sci. 2018, 37, 02006. [Google Scholar] [CrossRef] [Scilit]
- Hossain, M.S.; Iqbal, A. Production and characterization of chitosan from shrimp waste. J. Bangladesh Agril. Univ. 2014, 12, 153–160. [Google Scholar] [CrossRef] [Scilit]
- Zhang, Y.; Xue, C.; Xue, Y.; Gao, R.; Zhang, X. Determination of the degree of deacetylation of chitin and chitosan by X-ray powder diffraction. Carbohydr. Res. 2005, 340, 1914–1917. [Google Scholar] [CrossRef] [Scilit]
- Nouri, M.; Khodaiyan, F.; Razavi, S.H.; Mousavi, M. Improvement of chitosan production from Persian Gulf shrimp waste by response surface methodology. Food Hydrocoll. 2016, 59, 50–58. [Google Scholar] [CrossRef] [Scilit]
- Kumar, M.Y.; Ravi, A. Extraction and Characterization of Chitosan from Shrimp Waste for Application in the Feed Industry. Int. J. Sci. Environ. Technol. 2017, 6, 2548–2557. [Google Scholar]
- Silvestre, J.; Delattre, C.; Michaud, P.; de Baynast, H. Optimization of chitosan properties with the aim of a water resistant adhesive development. Polymers 2021, 13, 4031. [Google Scholar] [CrossRef] [Scilit] [PubMed]
- Arbia, W.; Arbia, L.; Adour, L.; Amrane, A. Chitin Extraction from Crustacean Shells Using Biological Methods—A Review. Food Technol. Biotechnol. 2013, 51, 12–25. [Google Scholar]

Disclaimer/Publisher’s Note: The statements, opinions and data contained in all publications are solely those of the individual author(s) and contributor(s) and not of MDPI and/or the editor(s). MDPI and/or the editor(s) disclaim responsibility for any injury to people or property resulting from any ideas, methods, instructions or products referred to in the content. |
© 2026 by the authors. Licensee MDPI, Basel, Switzerland. This article is an open access article distributed under the terms and conditions of the Creative Commons Attribution (CC BY) license.