


Abstract
High-cost medical equipment procurement creates long-term clinical, technical, and service dependencies, making the pre-tender stage a critical decision point. A multicriteria decision analysis proof of concept for computed tomography procurement was developed using six macrocriteria and three hypothetical scenarios. Of 43 submissions, 42 were eligible, 40 had complete Analytic Hierarchy Process matrices, and 23 met the consistency ratio threshold of 0.10 for primary weighting. Scenario-specific weights were elicited for hypothetical hospital settings: S1, a proximity hospital; S2, a high-demand general hospital; and S3, a differentiated referral hospital. These weights were applied to five hypothetical profiles using SAW, TOPSIS, and MOORA, with agreement and sensitivity analyses. Reliability and service continuity ranked highest in S1; clinical fit and reliability were nearly tied in S2; and strategic value and interoperability led S3. The balanced profile led all methods in S1 and S2, whereas TOPSIS selected a strategic profile in S3. Under one-at-a-time ±20% weight changes, first place persisted in 36/36, 36/36, and 33/36 classifications for S1, S2, and S3. In S3, a 7.1% C6 increase triggered the nearest switch, supporting reporting stability alongside rank. Findings support methodological feasibility under controlled computed tomography scenarios; application to other equipment or clinical domains requires context-specific adaptation and prospective institutional validation with real data.
1. Introduction
Hospital logistics do not stop at medicines, inventory, transport, or internal distribution. Capital equipment creates supply and service dependencies that can last for years. When a hospital buys a computed tomography (CT) system, it commits to more than a scanner. The choice shapes diagnostic capacity, maintenance dependence, service continuity, interoperability, training, workflow, spare-part support, and costs that may persist throughout the equipment life cycle. Reviews of hospital material logistics already place supply and procurement among the core research streams of the field, while broader healthcare supply chain work stresses the interdependence of operational actors and flows [1,2]. For high-cost equipment, procurement is therefore an upstream logistics decision with downstream operational consequences.
That long horizon makes purchase price a poor summary of value. Total cost of ownership research in purchasing has long argued that acquisition decisions should account for costs that arise during use and disposal, not only the invoice price [3]. Medical equipment adds further complications. Device performance interacts with users and workflows, learning can affect outcomes, upgrades can change capability, and maintenance or downtime can alter both cost and service availability [4,5,6]. A CT system that is cheaper to buy may be more expensive to operate or harder to keep available. The reverse can also be true. The sourcing decision has to weigh these consequences before bids are scored.
Supply chain research has dealt with similar problems in supplier evaluation. Multicriteria approaches are common because cost, quality, service, risk, and technical capability rarely point in the same direction [7,8]. Hospitals face an added difficulty: some criteria concern the supplier, some concern the equipment, and others arise only when the technology meets a specific clinical and organizational setting. That makes generic supplier-selection models difficult to transfer without adaptation. In healthcare, value must be translated into attributes that can be specified, evidenced, and compared. It also has to be separated from mandatory requirements. A system that fails in a legal, safety, or minimum clinical requirement should not compensate for that failure by performing well elsewhere.
The decision is also distributed across people who see different parts of the problem. Clinicians understand clinical use; radiographers and technologists understand workflow; biomedical engineers understand performance, maintenance, and technical risk; information technology teams understand integration; procurement and finance understand contracting and cost. Fragmented purchasing can leave these perspectives poorly connected [9,10]. Experimental evidence also shows that incentives can change medical-device choices, including the weight placed on lower prices versus broader value [11]. Multidisciplinary participation helps, but it is not enough by itself. The decision still needs a common language for criteria, evidence, and trade-offs.
The evidence base for high-cost medical equipment procurement remains thin. A systematic review found only 24 eligible studies on hospital purchasing of high-cost devices and equipment across 12 countries, with just two studies formally testing a purchasing-process intervention [12]. Another global review screened 292 records on health technology assessment in medical-device procurement but included only 11 studies and found few explicit links between health technology assessment (HTA) outputs and final procurement decisions [13]. Reviews of healthcare tenders show that value is effectively encoded through the criteria, scoring rules, and contract conditions chosen by the buyer [14]. Recent studies have applied multicriteria models to Healthcare 4.0 technology choices and centralized purchasing performance [15,16]. Yet an upstream question remains less developed: how should a hospital structure value before the tender, while criteria and priorities can still be challenged rather than merely applied?
The institutional pathway to equipment procurement is not uniform across hospitals or health systems. Funding arrangements, budget constraints, purchasing autonomy, and the degree of centralized or local procurement can influence which technologies are considered, how affordability is assessed, and where formal purchasing authority sits [17,18]. Within hospitals, the information required for a capital-equipment decision is also distributed across several functions: clinical users define care and workflow needs; biomedical or clinical engineering assesses technical performance, maintenance, compatibility, and technology risk; information technology addresses integration; and procurement, finance, logistics, and management contribute contracting, budgetary, supply, and governance perspectives [9,10,12]. The final allocation of decision authority depends on the institutional and legal setting, so multidisciplinary technical appraisal should be distinguished from the formal authority to initiate, evaluate, or award a procurement [17].
The pre-tender stage is easy to overlook because it produces no visible winner, yet this is where much of the later decision is set. Hospitals decide which outcomes are negotiable, which are mandatory, what evidence suppliers must provide, how life-cycle costs will be estimated, and which operational risks deserve weight. Once those choices are embedded in tender documents, there is far less room to revisit them without compromising comparability or governance. In that sense, procurement quality depends not only on scoring bids correctly, but on asking the right questions before the bids exist [17,18].
Multiple criteria decision analysis (MCDA) is attractive at this stage because the underlying decision is already multicriteria. It can separate objectives, preference elicitation, performance measurement, aggregation, and uncertainty analysis [19,20]. Formal structure does not guarantee a sound decision, however. Healthcare MCDA reviews report persistent variation in criterion definition, weighting, aggregation, and sensitivity analysis [21,22,23]. The Analytic Hierarchy Process (AHP) offers a practical pairwise-comparison format and a consistency diagnostic [24,25], but a mathematically consistent matrix is not automatically a valid preference model. Weights can also depend on how performance ranges are understood [26], and different ranking rules may produce different orderings from the same data [27,28]. If a recommendation changes easily when a weight or method changes, that is useful information for procurement, not a nuisance to hide.
This study focuses on that pre-tender moment. Using CT procurement as a controlled proof of concept, we structured six bounded macrocriteria, refined their wording and conceptual boundaries through a specialist pilot, elicited AHP priorities under three hypothetical hospital scenarios, and applied each scenario-specific weight vector to the same five hypothetical CT profiles using Simple Additive Weighting (SAW), Technique for Order Preference by Similarity to Ideal Solution (TOPSIS), and Multi-Objective Optimization on the Basis of Ratio Analysis (MOORA). The contribution is therefore applicative and process-oriented rather than the development of a new MCDA algorithm. It lies in combining domain-specific pre-tender problem structuring with an explicit separation between mandatory admissibility, contextual priorities, controlled alternative performance, ranking method, and decision stability.
Decision stability is defined here as the persistence or switching of the first-ranked profile under the prespecified weight and analytical configurations tested in the study. It is therefore a conditional property of this proof-of-concept model, not a probabilistic measure of robustness or validation of a real CT procurement. The purpose was not to identify a universally best CT system, but to examine what matters in a given hospital context, whether the ranking depends on the analytical method, and how close the preferred profile is to changing.
2. Materials and Methods
2.1. Study Design and Procurement Context
This was an applied methodological development study designed as a proof of concept for the pre-tender planning stage of public hospital CT procurement that precedes the formal tender. It models preparatory decision support rather than the legal procurement procedure itself. The study was not tied to a named institution or specific funding mechanism, and no real hospital, contracting authority, procurement team, supplier, commercial CT system, budget, funding source, or bid was evaluated. In a real application, this preparatory stage would take place within the institution’s governance structure, with multidisciplinary clinical, technical, operational, information-technology, procurement, financial, and management input. Formal authority to approve procurement documentation, conduct the tender, evaluate bids, and award the contract would remain with the bodies designated under the applicable institutional and legal framework [9,10,12,17]. The study deliberately kept three elements apart: hospital context, represented by scenario-specific criterion weights; alternative performance, represented by one fixed hypothetical matrix; and ranking method, represented by SAW, TOPSIS, and MOORA. This separation allowed changes in ranking to be traced to the weights or the analytical method rather than to simultaneous changes in the alternatives.
Roles were deliberately separated within the proof of concept. The criterion structure was developed from the literature and refined through the specialist pilot; main-survey participants contributed only their individual pairwise judgments on the relative importance of the six criteria within the assigned hospital scenario; the hypothetical alternative profiles were defined independently of those judgments; and ranking, agreement, and sensitivity analyses were performed after data collection. Neither pilot nor main-survey participants evaluated suppliers, commercial CT systems, or bids, and no participant acted on behalf of an institutional procurement or award body.
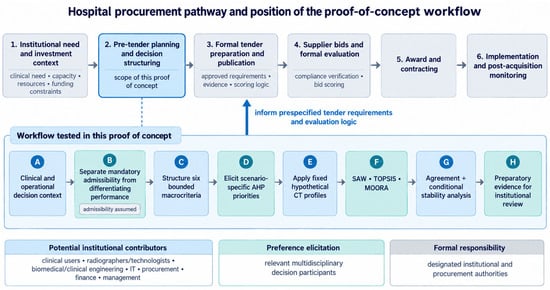
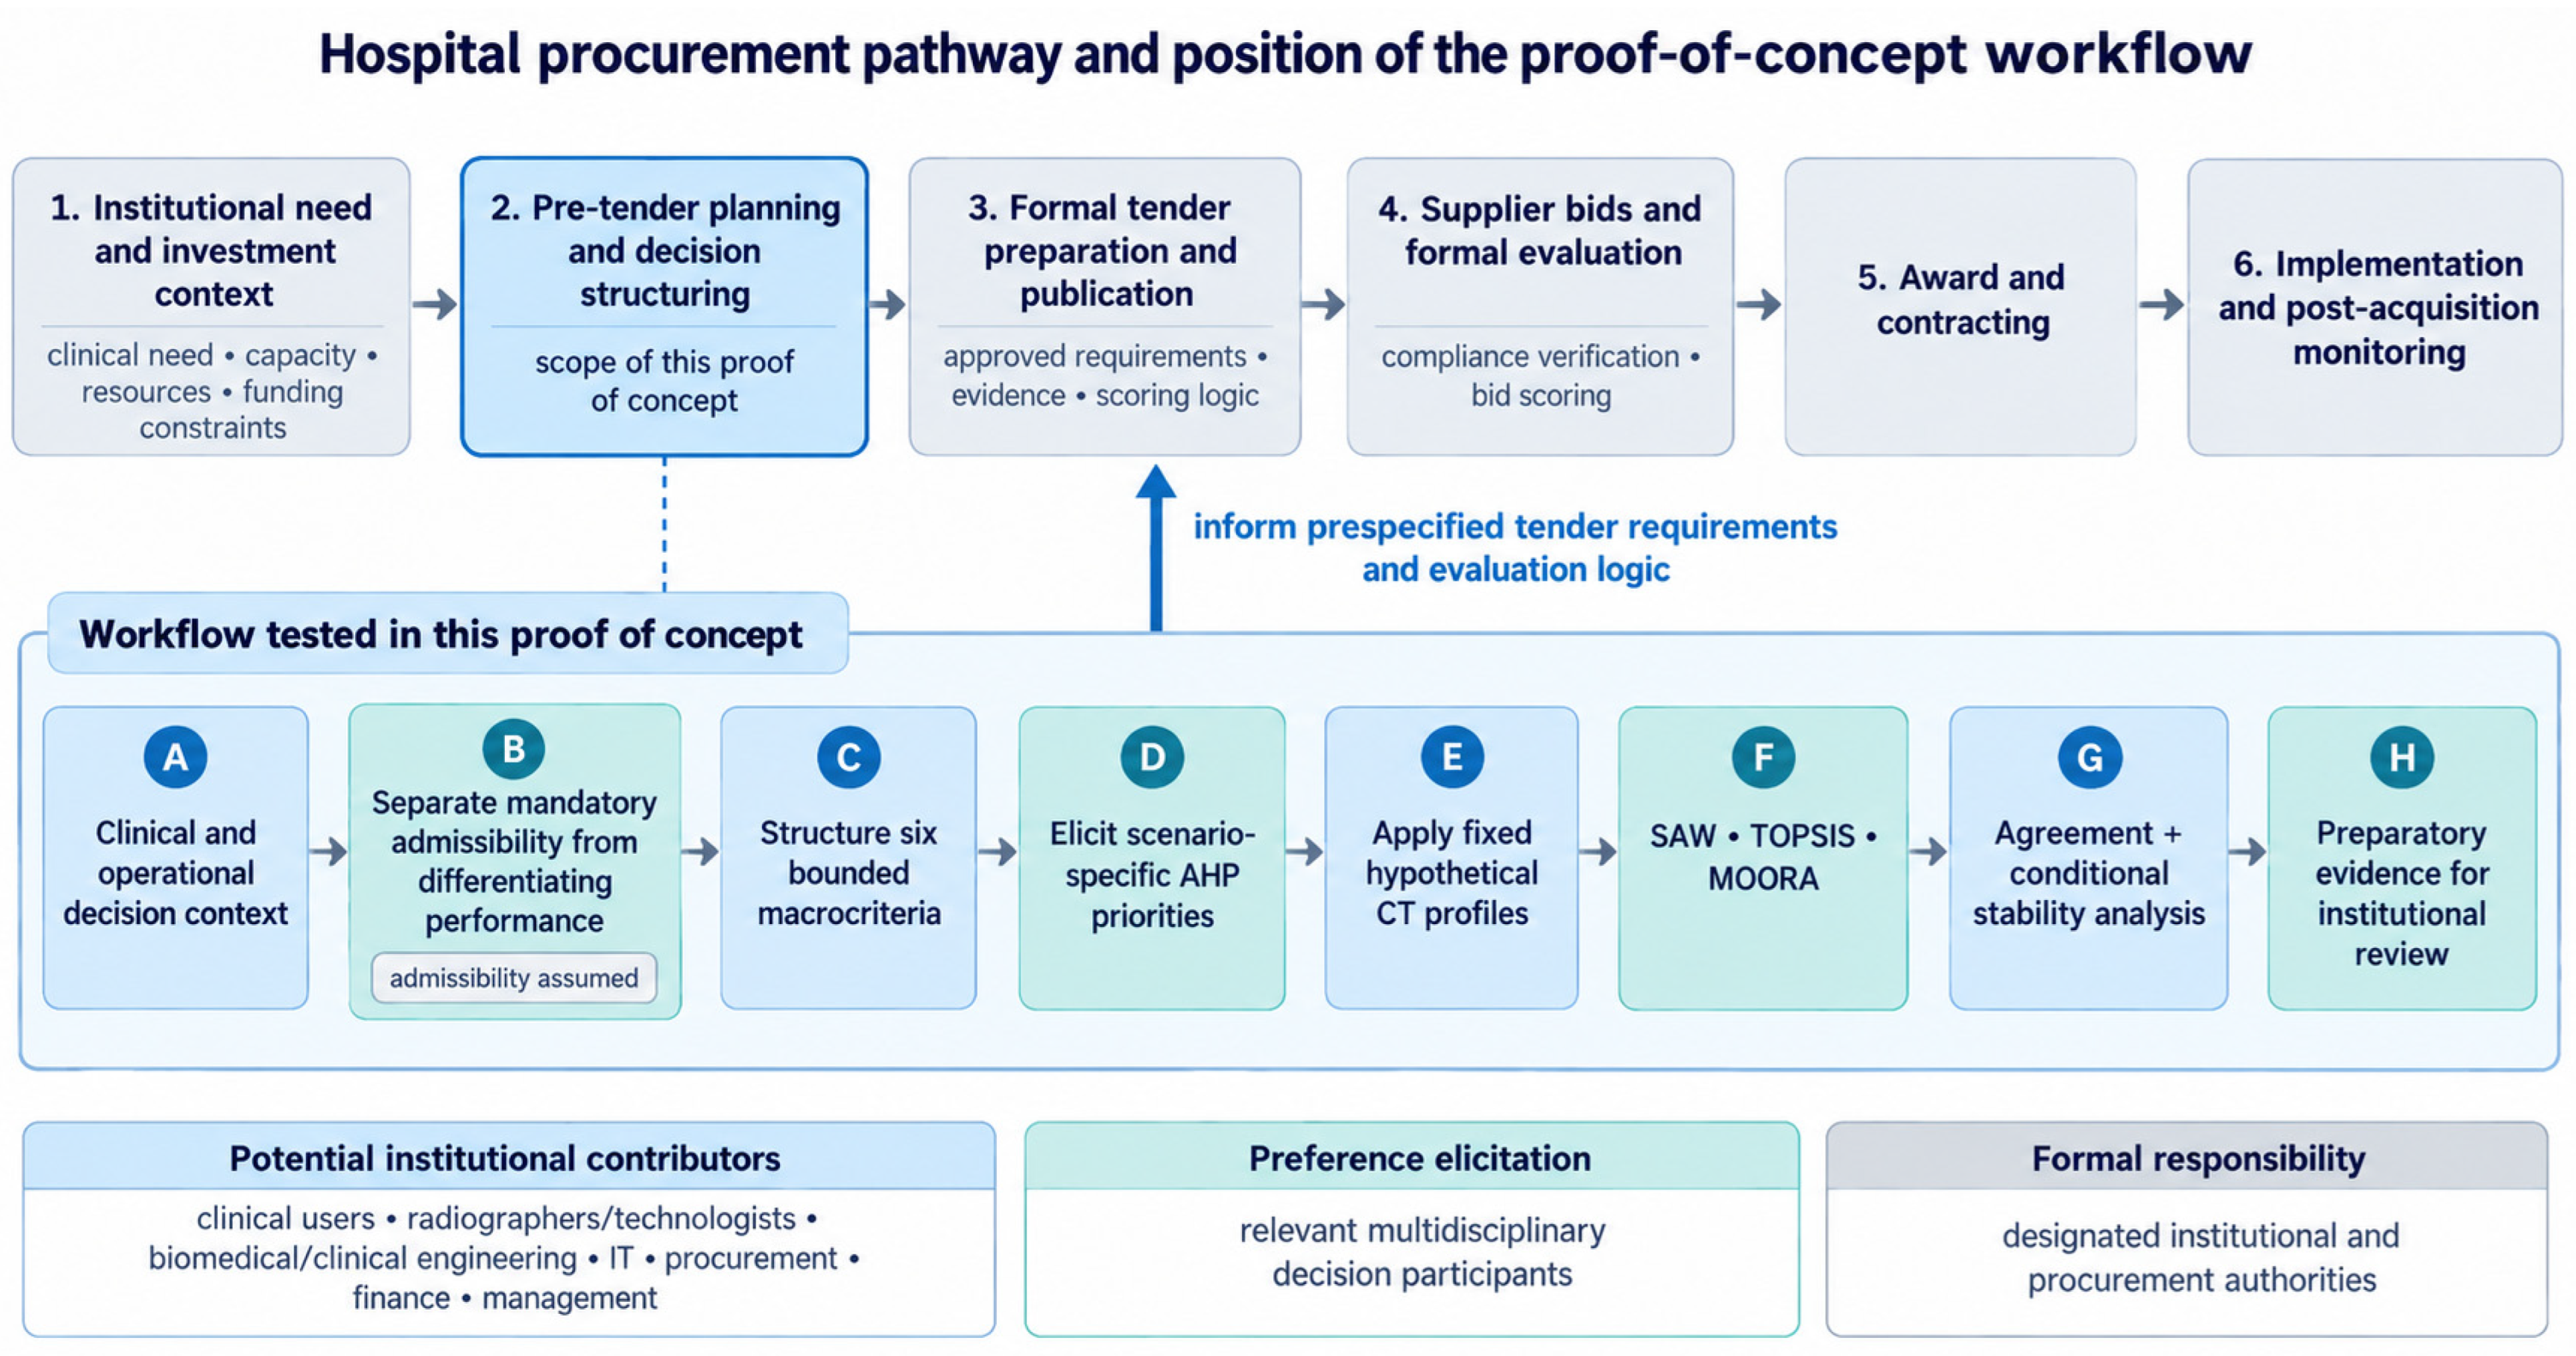
Mandatory legal, regulatory, clinical, technical, and safety requirements were treated as admissibility conditions. They were not included in compensatory weighting. Only performance above those assumed minimum requirements entered the multicriteria comparison. This distinction follows the basic MCDA principle that noncompensatory conditions should be handled before compensatory aggregation [20] and reflects the practical need to separate supplier or product eligibility from the later comparison of acceptable options. In a real procurement, the outputs of this preparatory stage would inform, but not replace, institutionally approved specifications, tender documentation, formal bid evaluation, and the final award decision. Those responsibilities remain with the relevant institutional and procurement authorities under the applicable governance and legal framework. The output of this proof of concept is therefore not an award recommendation for a real supplier, but a traceable representation of criterion priorities, conditional rankings, and their sensitivity under controlled assumptions. In a real procurement, these outputs could inform the institutional definition of requirements, evidence expectations, criteria, and scoring logic before the tender is published, but formal tendering, bid evaluation, and contract award remain outside the model. Figure 1 positions the tested workflow within this broader procurement pathway.
Figure 1.
Position of the proof-of-concept multicriteria workflow within the broader hospital procurement pathway. The proof of concept addresses the preparatory stage before formal tendering. Mandatory admissibility was assumed, hospital scenarios and CT profiles were hypothetical, and no real supplier, bid, contracting authority, or award decision was evaluated. In a real application, the workflow would support the institutional definition of requirements, evidence, criteria, priorities, and evaluation logic before tender publication; formal tendering, bid evaluation, award, and post-acquisition monitoring remain outside the tested model.
2.2. Criterion Development and Pilot Testing
Criterion development combined evidence from medical-device assessment, high-cost equipment procurement, life-cycle management, healthcare logistics, and MCDA. Rather than transferring an existing checklist, we used the literature to identify recurrent decision consequences and consolidated them into a parsimonious set of objectives with explicit boundaries. Acquisition, operating, maintenance, upgrade, and end-of-life costs were grouped in C1; clinical fit and additional clinical or safety benefit above mandatory minimums in C2; current, verifiable technical capability in C3; reliability, downtime, maintenance responsiveness, parts, support, and service recovery in C4; infrastructure, staffing, training, ergonomics, workflow, and current operational integration in C5; and interoperability, upgradeability, scalability, adaptability, and obsolescence risk in C6 [4,5,6,9,12,13,14,18,19,20,29,30].
Legal, regulatory, minimum clinical, minimum technical, and minimum safety requirements were not omitted from the decision process. They were treated as noncompensatory admissibility conditions before MCDA, because failure of a mandatory requirement should not be offset by stronger performance elsewhere [20]. Other procurement attributes were assigned according to the consequences they represented rather than added as separate criteria, limiting overlap and double counting [20,29]. Because this proof of concept operates at the pre-tender macrocriterion level, CT-specific technical specifications were not fixed as additional macrocriteria; in a real procurement, they would instead be operationalized as admissibility requirements or criterion-specific performance measures before alternatives are scored [19,20].
An initial five-criterion instrument was subsequently tested before the main survey in a single-round, word-based (Microsoft Corporation, Redmond, WA, USA) pilot with six specialists, each with at least 10 years of experience in the relevant professional area. The pilot assessed the five criterion definitions, the ten corresponding AHP pairwise comparisons, the proposed sensitivity component, clarity, organization, response burden, and the conceptual boundaries between criteria. Each response was first reviewed individually to identify comprehension difficulties, conceptual ambiguities, incompatible comparison entries, and signs of excessive burden; the observations were then synthesized by instrument domain. Pilot responses were kept separate from the main survey, were not treated as a vote, and were not used to calculate the final scenario weights or to seek consensus [29,31]. Feedback indicated that technical performance and reliability/service continuity represented distinct consequences and also helped clarify the boundaries between clinical benefit, current operational feasibility, and longer-term strategic value. We therefore split the initial technical performance/reliability criterion into C3 and C4 and refined the remaining labels and boundaries, yielding the final six macrocriteria. This was specialist-informed instrument refinement rather than formal validation of the final criterion set. The final six-criterion wording was not subjected to a second cognitive pilot before the main survey; subsequent Microsoft Forms (Microsoft Corporation, Redmond, WA, USA) testing verified the technical functioning of the questionnaire, including section logic, routing, and data export, but did not constitute a second assessment of content comprehension. The pilot was not a Delphi exercise. Table 1 summarizes the resulting operational boundaries and direction of preference.
Table 1.
Final macrocriteria used in the proof-of-concept model.
The pilot also exposed a practical survey problem. When pairwise-comparison direction and intensity were entered separately, some responses produced combinations that could not be interpreted on the AHP scale. The final instrument therefore used one bilateral response scale that combined direction and intensity in a single choice. This change was intended to reduce avoidable response error rather than make the judgments artificially more consistent [31].
2.3. Hospital Scenarios, Recruitment, and Survey Instrument
The three hospital scenarios were constructed specifically for this proof of concept as controlled analytical contexts rather than as a formal classification of hospitals or representations of named institutions. Their purpose was to operationalize the contextual contrasts defined in the research question, particularly differences in hospital differentiation, demand intensity, and clinical and organizational complexity, while keeping the decision task itself comparable across participants. S1 represented a proximity hospital with generalist activity and the option to refer highly specialized examinations; S2 represented a high-demand general hospital with continuous emergency activity and intensive, variable CT use; and S3 represented a differentiated referral hospital managing more complex cases, multidisciplinary care, and advanced protocols.
The scenarios were deliberately constructed to vary the functional context and decision challenge without simultaneously changing the criterion definitions, the AHP pairwise-comparison structure, the response rules, or the hypothetical CT performance matrix subsequently used in the ranking stage. Participants therefore judged the relative importance of the same six criteria under different contextual assumptions rather than evaluating different technologies or different criterion sets. The scenarios were not derived from empirical data from specific hospitals and were not intended to reproduce all possible public-hospital configurations. They served as controlled decision vignettes for examining whether the relative priorities assigned to the criteria could differ when the operating context changed. Table 2 summarizes the functional profile and decision challenge defined for each scenario.
Table 2.
Controlled hypothetical hospital scenarios used to vary the decision context.
The main survey ran in Microsoft Forms from 8 to 24 August 2026. A separate routing form displayed three pathways in randomized order and instructed each participant to choose only the first option shown. The selected pathway directed the participant to S1, S2, or S3. This reduced deliberate self-selection of a preferred scenario but did not constitute probability sampling or a randomized trial. The routing form and the three scenario questionnaires were technically independent.
Eligibility required age 18 years or older, electronic informed consent, and completion of the professional-characterization item. No minimum number of years of professional experience and no specific CT or public-procurement background were required for the main survey; these characteristics were collected to describe the sample rather than to determine eligibility. Participants were told to respond once and to one scenario only. Public access without authenticated sign-in meant that one response per person could not be technically guaranteed. Recruitment used institutional sharing, direct invitation, LinkedIn, and circulation by third parties. The sample was therefore voluntary and nonprobability-based. The study was not designed to estimate population-level hospital or professional preferences, and the observed weights are interpreted as exploratory, sample-specific priorities rather than robust estimates of institutional or population preferences.
2.4. AHP Weighting and Consistency
Each participant compared the six macrocriteria in all 15 possible pairs using a bilateral 1 to 9 AHP scale. A value of 1 represented equal importance; larger values represented progressively stronger preference in either direction. The response option “I cannot answer responsibly” was coded as missing, never as 0 or as equal importance. A matrix was complete only when all 15 comparisons were numeric.
For participant p in scenario s, the 15 numerical judgments were converted into a positive reciprocal pairwise-comparison matrix [24,25]:
The principal eigenvector was obtained from:
Its components were then normalized to obtain the individual criterion priorities:
Internal consistency was assessed for each complete matrix using the consistency index and consistency ratio [24,25]:
The prespecified primary analysis included complete matrices with a consistency ratio of 0.10 or less. This threshold was applied to each individual matrix and was used as an analytical inclusion rule, not as evidence that the underlying preferences were substantively valid [32]. Scenario-level medians and interquartile ranges were descriptive summaries of the individual consistency ratio values and did not determine inclusion.
Participants answered independently and did not deliberate toward a common judgment. We therefore aggregated individual priority vectors rather than constructing a collective pairwise-comparison matrix. For each criterion j and scenario s, the unweighted geometric mean of the individual priorities was calculated as [33,34]:
The six geometric means were then normalized to obtain the scenario-specific weight vector:
where Ps is the number of individual matrices included in scenario s. Every included participant had equal influence. Because no collective comparison matrix was constructed, no group-level consistency ratio was calculated. As a complementary sensitivity check, the same individual priority vectors were also aggregated using the unweighted arithmetic mean [33,34].
2.5. Hypothetical CT Profiles and Ranking Methods
Five hypothetical alternatives, A1 to A5, were constructed by the investigator responsible for the study before the final AHP weights were obtained and were kept unchanged across all three scenarios. Neither the pilot participants nor the main-survey participants determined or scored these values. Their purpose was not to reproduce the empirical CT market, but to create a controlled decision space containing distinct trade-off patterns without strict dominance. A1 emphasized lower life-cycle cost and operational feasibility; A2 emphasized clinical fit and technical performance; A3 emphasized reliability and service continuity; A4 emphasized strategic value and adaptability; and A5 represented a more balanced performance profile.
The numerical values were analytical design choices rather than measurements or estimates derived from commercial CT systems. They were selected to express the intended profile-specific trade-offs while ensuring that no alternative dominated the others across all six criteria. The matrix was defined independently of the AHP responses and before the final scenario weights were calculated, preventing the profile values from being adjusted retrospectively to favor a particular weighting pattern, ranking method, or scenario. Table 3 presents the resulting matrix, which was held constant so that changes in ranking could be attributed to the scenario-specific weights or to the ranking method rather than to changes in alternative performance. The resulting rankings and stability measures should consequently be interpreted as conditional on this controlled matrix, rather than as estimates of stability in the current CT market [26].
Table 3.
Controlled hypothetical performance matrix used across scenarios.
C1 used a relative life-cycle cost index with 100 as the reference: for example, values of 80 and 125 represent 80% and 125% of the reference cost, respectively, with lower values preferred. C2–C6 used controlled cardinal benefit indices from 0 to 100. Within these constructed scales, 0 denotes no differentiating performance above the assumed mandatory minimum, 50 an intermediate level, and 100 the upper endpoint defined for the proof of concept. The indices do not represent percentages, clinical measurements, or empirically estimated value functions.
Preference elicitation and performance measurement were intentionally kept as separate stages. The AHP was used only to elicit the relative importance of the six macrocriteria within each hospital scenario through pairwise comparisons [24,25]. Participants did not compare A1–A5 through the AHP and did not see the exact ranges of the controlled performance matrix when weighting the criteria. Alternative performance was instead represented independently in the fixed matrix and subsequently evaluated using the same scenario-specific weight vector. This separation allowed contextual priorities, alternative performance, and the effect of the ranking rule to remain analytically distinguishable. A full AHP hierarchy for the alternatives was therefore not used in this proof of concept. Consequently, the elicited weights should be interpreted as contextual priorities rather than as trade-off coefficients calibrated to the specific performance ranges in Table 3 [26]. Extending the AHP to pairwise comparisons of the alternatives would have addressed a different analytical design, because alternative performance would then have been elicited through additional judgments rather than held fixed in a common performance matrix [24,25].
The common performance matrix was represented as:
where xij denotes the performance of alternative i on criterion j.
For SAW, the five benefit criteria were normalized by the highest observed value within each criterion [35]:
For the cost criterion, the direction of preference was reversed through:
For each scenario, the overall SAW score was calculated as:
Alternatives were ranked in descending order of the resulting SAW score.
TOPSIS used vector normalization [36]:
For each scenario, the normalized matrix was weighted using the corresponding scenario-specific criterion weights:
The positive ideal contained the most favorable weighted value observed for each criterion and the negative ideal the least favorable value, taking the direction of preference into account. Euclidean distances to the two ideal solutions were calculated as:
Relative closeness to the positive ideal solution was then calculated as:
Alternatives were ranked in descending order of the relative-closeness coefficient.
MOORA used the same vector-normalized and scenario-weighted performance values but aggregated the five benefit criteria separately from the cost criterion [37]:
Alternatives were ranked in descending order of the resulting MOORA overall value.
SAW, TOPSIS, and MOORA were selected because all three could be applied to the same criterion set, performance matrix, and scenario-specific weights while representing different ranking logics. SAW provided a transparent weighted additive baseline after ratio normalization; TOPSIS introduced a distance-based comparison with ideal and anti-ideal solutions; and MOORA combined vector normalization with an explicit separation between benefit and cost contributions [35,36,37]. This controlled comparison was consistent with the study objective of examining whether rankings remained stable when the input information was held constant, but the normalization and aggregation rule changed [27,28]. The three methods were therefore used as contrasting analytical lenses, not as independent validation and not on the assumption that any one method is inherently superior.
Although C2–C6 were initially expressed on the same controlled 0–100 scale, these raw values were not aggregated directly. Each ranking method applied its own computational transformation. In SAW, benefit performance was expressed relative to the highest observed value within each criterion, while C1 was transformed so that lower cost produced a higher normalized value. In TOPSIS and MOORA, each criterion column was normalized by its Euclidean norm [35,36,37]. The resulting normalized quantities are therefore method-specific and relative to the five-profile matrix; they no longer retain the direct 0, 50, and 100 anchor interpretation of the original controlled scales. For example, under SAW, an observed maximum of 95 becomes 1.0 even though 100 remains the upper endpoint originally defined for that criterion. The second transformation was therefore a method-specific computational step rather than a redefinition of the underlying performance scale. The performance matrix and normalization rules were held constant across scenarios so that changes attributable to scenario-specific weights could be distinguished from changes attributable to the ranking method.
2.6. Agreement and Sensitivity Analysis
Within each scenario, the three rankings were compared pairwise using Spearman rank correlation. To accommodate any ties through average ranks, the coefficient was calculated as the Pearson correlation between the two rank vectors [38]:
Here, the terms in Equation (18) represent the positions assigned to each alternative by the two methods being compared within the corresponding scenario. The largest absolute change in position was also recorded:
The same comparison was made across scenarios within each method. Because the five alternatives formed a fixed analytical set rather than a random sample, the correlations were interpreted descriptively and were not subjected to significance testing [38].
Sensitivity analysis examined both weights and analytical choices. For each scenario, criterion k was perturbed one at a time by δ = −0.20 and δ = +0.20 [39,40]:
The remaining criterion weights were rescaled proportionally so that the complete weight vector continued to sum to 1:
This produced 36 first-rank checks per scenario: six criteria, two directions, and three ranking methods. We also searched for the nearest local weight change that switched the first-ranked alternative [39,40]. The 20% range was a study choice, not a universal robustness standard.
Additional checks used uniform weights, defined as:
as well as all complete matrices regardless of consistency ratio, arithmetic rather than geometric aggregation, and leave-one-participant-out recalculation. These analyses test local or structural dependence. They do not propagate simultaneous uncertainty in weights, performance values, scoring scales, and model structure; the resulting first-rank preservation rates and switching thresholds are therefore deterministic measures of conditional stability, not probabilistic robustness measures or validation [41,42,43].
2.7. Data Handling, Computation, and Ethics
Raw Microsoft Forms exports were kept separate from the processed analytical data. Coding rules, exclusions, scenario identifiers, and transformations were documented so that the path from response to ranking could be checked [44,45]. Microsoft Excel (Microsoft Corporation, Redmond, WA, USA) was used for coding, construction of the AHP and MCDA matrices, implementation of the analytical model, calculation of scenario weights, SAW/TOPSIS/MOORA rankings, agreement and sensitivity analyses, and calculation checks. Python 3.12.13 (Python Software Foundation, Beaverton, OR, USA) with NumPy 2.3.5 was used specifically to independently reproduce the individual AHP principal-eigenvector calculations and associated AHP numerical checks. Python was not used as a general computational routine for SAW, TOPSIS, MOORA, or sensitivity analyses. No custom Python script, notebook, Excel macro, or VBA routine developed for the study was retained. All calculations used the full available numerical precision and were rounded only for reporting.
The study was noninterventional and asked adult professionals to make pairwise judgments on the relative importance of six criteria within hypothetical hospital scenarios. It involved no patients, clinical or health data, institutional case records, or real procurement information. The dissertation proposal was approved by the Technical-Scientific Council of the Instituto Superior de Engenharia de Lisboa as the academic framework for the project. This approval did not constitute an ethics committee opinion or a formal waiver, and no separate opinion was requested from the Instituto Superior de Engenharia de Lisboa (ISEL) Ethics Committee. Before accessing the substantive questions, participants received study information and provided electronic informed consent. The survey did not request names or email addresses; however, professional characteristics, response metadata, withdrawal codes, and optional free-text responses could create a risk of indirect identification. Results are therefore reported in aggregate, and individual-level responses are not publicly disclosed.
3. Results
3.1. Participants and Analytical Sample
The survey received 43 submissions. Forty-two were eligible, and 40 contained complete AHP matrices. S1 contributed 15 eligible responses, all complete. S2 contributed 13 eligible responses, of which 12 were complete. S3 contributed 14 eligible responses, of which 13 were complete. One S3 submission was ineligible, and one eligible response in each of S2 and S3 had an incomplete AHP matrix. Missing pairwise judgments were not imputed.
The 42 eligible participants represented varied professional backgrounds and levels of relevant experience. Twelve (28.6%) were radiology technologists or other diagnostic and therapeutic professionals, five (11.9%) were physicians or radiologists, and 25 (59.5%) reported other professional areas. Four participants (9.5%) had less than 5 years of professional experience, 21 (50.0%) had 5–19 years, and 17 (40.5%) had 20 years or more. Regarding CT, 22 participants (52.4%) reported direct involvement in image acquisition, regular CT use, or advanced CT experience; eight (19.0%) reported occasional or indirect contact; and 12 (28.6%) reported no direct CT experience. Regarding the Portuguese National Health Service and public procurement, 16 participants (38.1%) reported direct or regular involvement, nine (21.4%) occasional or indirect involvement, and 17 (40.5%) none. The sample therefore included participants with different levels and types of professional and subject-matter exposure. Formal organizational position and seniority level were not collected and therefore cannot be characterized retrospectively. This heterogeneity supports the exploratory, multidisciplinary purpose of the proof of concept, but it does not establish a representative expert panel or justify interpreting the aggregated weights as expert consensus.
Participants did not rank A1–A5 or evaluate suppliers, bids, or commercial CT systems. Their role in the main survey was limited to eliciting the relative importance of the six criteria within the assigned hospital scenario; the alternative rankings were subsequently generated by applying the aggregated scenario weights to the fixed hypothetical performance matrix through SAW, TOPSIS, and MOORA.
3.2. Consistency and Scenario Priorities
Individual AHP priorities and consistency ratios were calculated using Equations (1)–(5). Of the 40 complete matrices, 23 (57.5%) had consistency ratios of 0.10 or less and entered the primary analysis: 7 of 15 (46.7%) in S1, 8 of 12 (66.7%) in S2, and 8 of 13 (61.5%) in S3. Median consistency ratios were 0.1037 in S1, 0.0530 in S2, and 0.0529 in S3. The other 17 complete matrices were retained for complementary analyses rather than altered or discarded from the study record. The 23 included priority vectors were then aggregated within each scenario using Equations (6) and (7), producing the primary scenario weights reported in Table 4.
Table 4.
Analytical sample, consistency, and primary scenario weights.
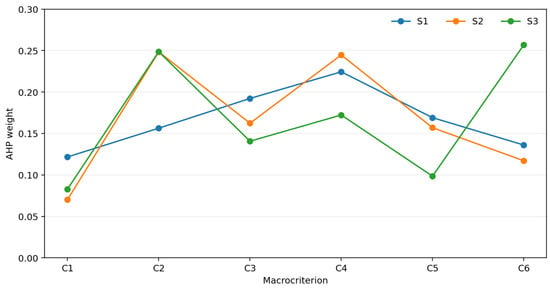
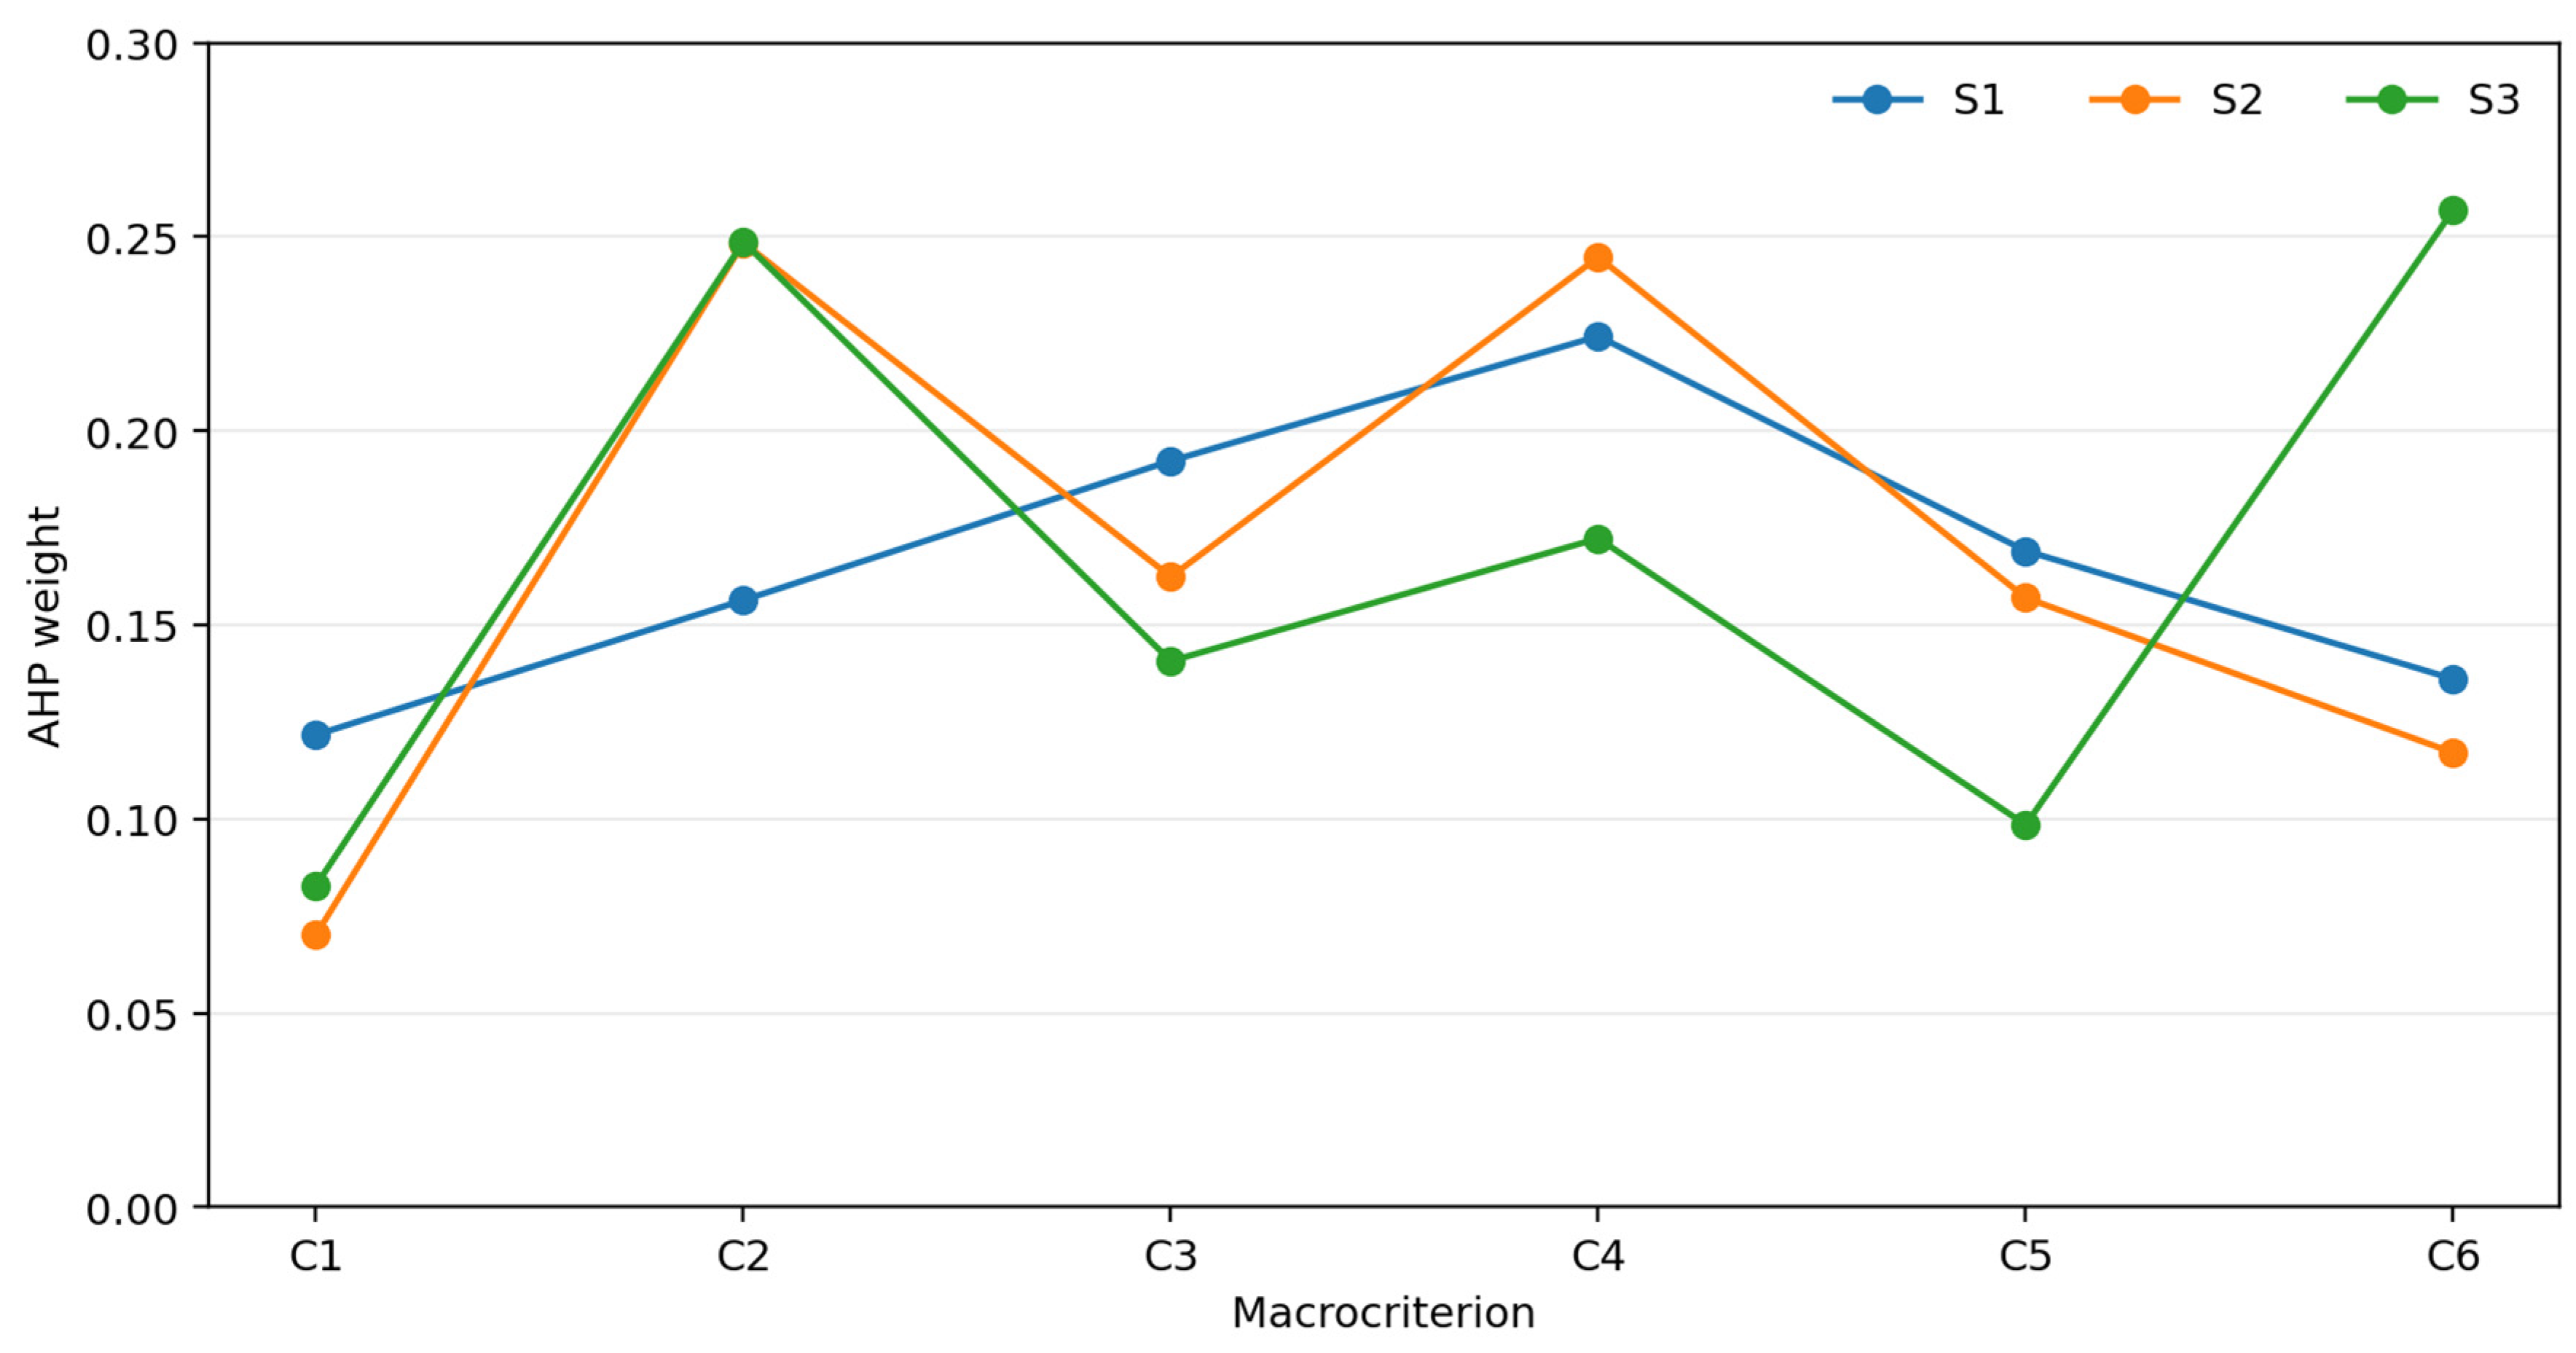
The three primary weight vectors differed most clearly in the criteria that carried the greatest weight. In S1, reliability, availability, and service continuity (C4; 0.2244) had the highest weight, followed by technical performance (C3; 0.1923) and operational feasibility (C5; 0.1691). In S2, clinical fit and benefit (C2; 0.2485) and C4 (0.2448) were almost tied. In S3, strategic value, interoperability, and adaptability (C6; 0.2569) ranked first, followed closely by C2 (0.2487). C1 had the lowest weight in all three scenarios: 0.1217 in S1, 0.0702 in S2, and 0.0829 in S3. These are exploratory, sample-specific priorities from the included participants and should not be interpreted as robust estimates of hospital, professional, or population preferences. Figure 2 shows the weight profiles across C1–C6.
Figure 2.
Scenario-specific AHP weights for the six macrocriteria. S1 = proximity hospital; S2 = high-demand general hospital; S3 = differentiated referral hospital. C1 = updated life-cycle cost; C2 = clinical fit and benefit; C3 = technical performance; C4 = reliability, availability, and service continuity; C5 = operational and organizational feasibility; C6 = strategic value, interoperability, and adaptability.
3.3. Rankings and Agreement Across Methods
Applying the common five-profile performance matrix in Equation (8) and the corresponding scenario-specific weight vectors through SAW [Equations (9)–(11)], TOPSIS [Equations (12)–(16)], and MOORA [Equations (12), (13) and (17)] produced the reference rankings shown in Table 5. A5 ranked first under SAW, TOPSIS, and MOORA in both S1 and S2. In S1, SAW and MOORA produced the same complete ordering, while TOPSIS reversed A3 and A4 in second and third place. In S2, the first and last positions were stable across methods, but the middle three positions changed.
Table 5.
Reference rankings and agreement among methods.
Pairwise ordinal agreement was evaluated using the Spearman coefficient and maximum absolute rank displacement defined in Equations (18) and (19), respectively. S3 was different. SAW and MOORA ranked A5 first, whereas TOPSIS ranked A4 first. Importantly, the disagreement was confined to the first two positions: A4 and A5 occupied first and second place under all three methods, with only their order changing under TOPSIS. In the reference calculations, SAW scored A5 at 0.869363 and A4 at 0.862961; TOPSIS produced relative-closeness coefficients of 0.714116 for A4 and 0.685947 for A5; and MOORA produced overall values of 0.402336 for A5 and 0.400117 for A4. These method-specific scores should not be compared numerically across methods because they arise from different normalization and aggregation rules. Within each method, however, they show that A4 and A5 were the leading competitors in S3. Thus, method choice affected the identity of the first-ranked profile even though pairwise Spearman correlations across the full rankings remained high, from 0.9000 to 1.0000. Across methods, correlations ranged from 0.9000 to 1.0000 in S1, from 0.6000 to 0.9000 in S2, and from 0.9000 to 1.0000 in S3. The S3 result matters because it shows that strong ordinal agreement can coexist with disagreement over the option placed first.
3.4. Sensitivity of the First-Ranked Alternative
The clearest contrast among scenarios emerged when the weights were perturbed using the one-at-a-time transformation defined in Equations (20) and (21). Under the ±20% tests, the reference first-ranked alternative was preserved in all 36 classifications in S1 and all 36 in S2, but in 33 of 36 in S3. Every S3 switch involved C6. Reducing C6 by 20% changed TOPSIS first place from A4 to A5. Increasing C6 by 20% changed first place from A5 to A4 under both SAW and MOORA.
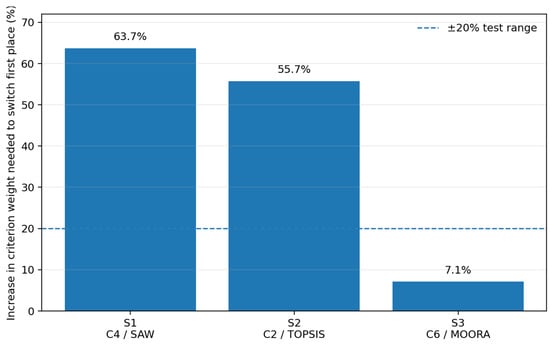
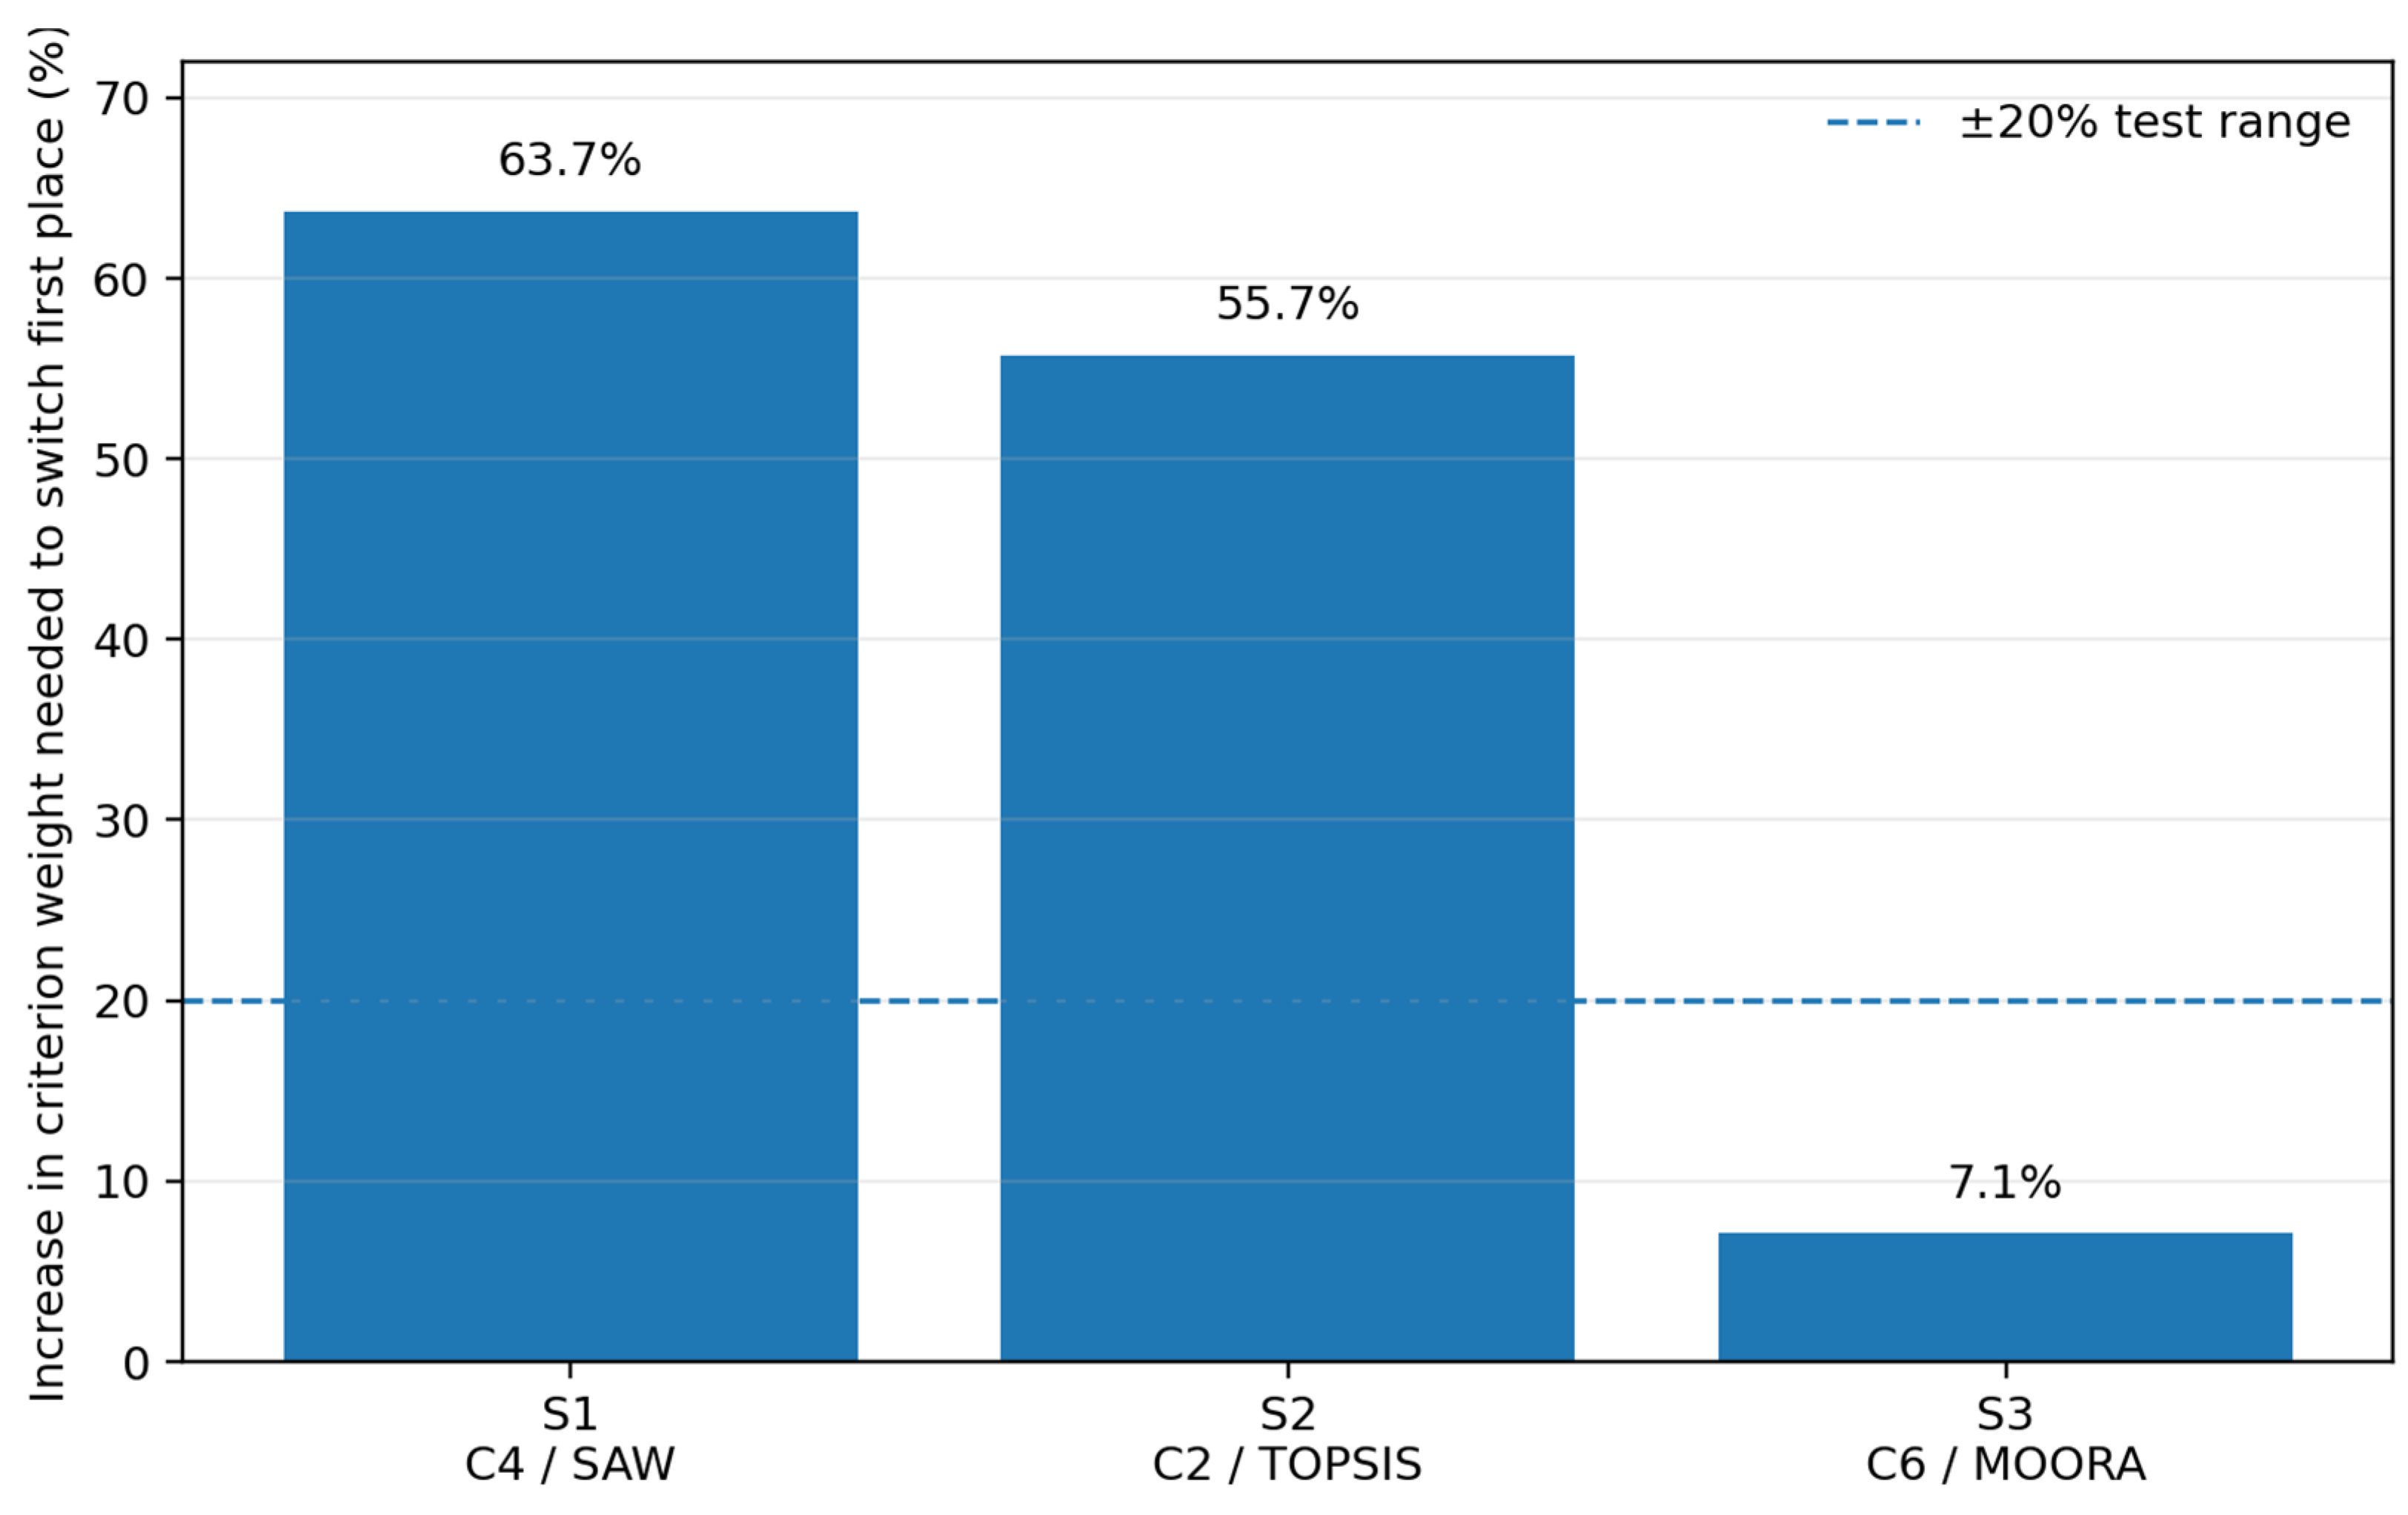
The nearest local switching threshold was much farther away in S1 and S2 than in S3. It required a 63.7% increase in C4 under SAW in S1 and a 55.7% increase in C2 under TOPSIS in S2. In S3, a 7.1% increase in C6 was enough to switch the first-ranked option under MOORA. These are deterministic one-at-a-time thresholds. They are not confidence intervals and should not be read as probabilities of rank change. Figure 3 highlights the contrast between the nearest local switching thresholds.
Figure 3.
Nearest local increase in a single criterion weight that changed the first-ranked alternative. The dashed line marks the +20% perturbation used in the standardized one-at-a-time sensitivity test. Thresholds are deterministic and should not be interpreted as confidence intervals or probabilities of rank change.
Uniform weights, defined by Equation (22), and inclusion of all complete matrices with geometric aggregation preserved A5 as the first-ranked alternative under all three methods in S1 and S2. In S3, both settings moved the TOPSIS first place from A4 to A5. Arithmetic aggregation of the primary matrices reproduced the reference first places in all three scenarios. Leave-one-participant-out analysis preserved the first-ranked option in 21 of 21 classifications in S1, 24 of 24 in S2, and 23 of 24 in S3. The single S3 change occurred under MOORA after exclusion of one participant. Table 6 brings these first-rank stability checks together across the three scenarios.
Table 6.
Sensitivity of the first-ranked alternative.
4. Discussion
4.1. A Logistics Decision Made Before the Tender
The most useful result was not which profile came first. It was how far that first place was from changing. In S1 and S2, the preferred profile survived every ±20% one-at-a-time weight change and all three ranking methods. In S3, the result was less settled. TOPSIS preferred A4, SAW and MOORA preferred A5, and a 7.1% increase in C6 was enough to change the MOORA first place. A ranking alone would hide that difference. For procurement, the distance to a different decision can matter almost as much as the decision itself.
That point is especially relevant in healthcare logistics. Procurement choices shape the availability of equipment, maintenance dependence, spare-part support, integration, and the ability of a service to recover from failure. Hospital material logistics research has long treated supply and procurement as part of the same operating system that later includes inventory, distribution, and service delivery [1,2]. Capital equipment extends that logic over a much longer time horizon. Once a CT system is installed, the hospital inherits a set of technical and supplier dependencies that are expensive to reverse. Therefore, pre-tender analysis is not paperwork around the real decision. It is part of the logistics decision itself.
4.2. Service Continuity, Strategic Fit, and the Role of Cost
The weight patterns make this visible. S1 placed the greatest emphasis on C4, reliability, availability, and service continuity. S2 placed clinical fit and C4 almost level. S3 gave the highest weight to C6, strategic value, interoperability, and adaptability. These patterns are plausible for the scenarios, but the design does not prove that hospital type caused them. Different participants evaluated each scenario, and the sample was small and nonprobability-based. The safer interpretation is descriptive: the model can represent different priority structures when the operating context changes.
In this study, value was not defined as a single monetary outcome or value-for-money ratio. It was operationalized as the multidimensional differentiating performance of admissible options across C1–C6, covering life-cycle cost, clinical benefit, technical performance, service continuity, operational feasibility, and longer-term strategic fit. Service continuity had a narrower and explicitly bounded meaning within C4: the ability to maintain availability and recover from failures throughout the use cycle, including reliability, downtime, maintenance responsiveness, parts and support availability, and service recovery. Monetary maintenance consequences remained within C1, current implementation and workflow demands within C5, and future adaptability and obsolescence risk within C6, reducing conceptual overlap between criteria.
C1, life-cycle cost, received the lowest weight in all three scenarios. That does not mean cost was unimportant, and it certainly does not show willingness to pay more. The participants weighted criterion definitions without seeing the exact performance ranges in the hypothetical matrix. In multicriteria models, weights are meaningful only in relation to the way attributes and ranges are defined [26]. Cost also enters hospital procurement in more than one way. Some cost consequences are direct and monetized, while others appear as downtime, workflow disruption, maintenance effort, or replacement risk. Purchasing research on total cost of ownership makes the same point from a supply perspective: purchase price is only one part of the cost created by a sourcing decision [3]. A real CT procurement should therefore estimate life-cycle cost explicitly rather than infer economic value from a low or high AHP weight.
4.3. Ranking Agreement Is Not the Same as Decision Stability
SAW, TOPSIS, and MOORA agreed often, but not completely. This is expected because the three methods used the same performance matrix and scenario-specific weights but transformed and aggregated those inputs differently [7,8,35,36,37]. SAW used ratio normalization followed by weighted additive aggregation, MOORA used vector normalization with the weighted benefit contributions offset by the cost contribution, and TOPSIS evaluated each profile through its relative distance from positive and negative ideal solutions. Identical weights and performance data therefore do not require identical rankings.
S3 illustrates this methodological dependence particularly clearly. A4 and A5 occupied the first two positions under all three methods, but TOPSIS ranked A4 first while SAW and MOORA ranked A5 first. This result is also consistent with the structure of the S3 decision problem: C6 had the highest scenario weight, A4 had the highest controlled C6 performance, and reducing the C6 weight was sufficient to move the TOPSIS first place from A4 to A5 in the sensitivity analysis. The result should not be attributed to C6 alone, because all six weighted criteria contribute to each ranking, but it confirms that the S3 first place lies closer to a methodological and preference boundary than in S1 or S2.
Accordingly, the high S3 Spearman correlations of 0.9000 to 1.0000 indicate strong agreement in the overall ordering, not equivalence of the preferred alternative. Agreement among the three methods should therefore be interpreted as methodological concordance under shared inputs rather than as independent validation. Conversely, the localized disagreement at the top should not be treated as a computational inconsistency; it is evidence that the preferred profile in S3 is more dependent on the ranking rule and on the surrounding preference structure.
This is why sensitivity analysis should be treated as a result, not as an appendix. The 63.7%, 55.7%, and 7.1% thresholds tell very different stories. In S1 and S2, the first place sat relatively far from the nearest local boundary. In S3, it sat close to one. That does not make S3 wrong. It tells the procurement team where the decision deserves another look. They can revisit the evidence behind C6, check whether the scoring scale separates A4 and A5 in a meaningful way, and ask whether a joint change in several assumptions would alter the conclusion. Local sensitivity has limits, and one-at-a-time tests do not capture interactions [41,42,46]. Still, even a local threshold is more informative than presenting one ranking as if it were immutable.
4.4. Consistency as Feedback on the Decision Process
The AHP consistency results also deserve practical reading. Seventeen of 40 complete matrices, or 42.5%, had a consistency ratio above 0.10. That does not mean 42.5% of respondents were poor decision makers. The consistency ratio measures mathematical tension among pairwise judgments; it does not assess expertise, clinical validity, or whether the criteria themselves are well designed [25,32]. In an open survey with participants who were not selected for prior AHP expertise, some inconsistency is not unexpected.
For a real procurement, however, the result is a warning about the elicitation process. Pairwise weighting should not be treated as a form to complete once and never revisit. Participants need clear criterion boundaries, a short explanation of the task, and a chance to review judgments that produce high inconsistency. The goal is not to force the consistency ratio below a threshold. It is to find out whether the apparent inconsistency comes from a misunderstanding, a genuinely difficult trade-off, or a criterion structure that needs revision. The pilot in this study already showed how survey design can create avoidable problems when direction and intensity are collected separately. That kind of feedback is valuable before a live procurement begins [31].
4.5. Potential Implications for Pre-Tender Procurement Practice
The practical implication of this proof of concept is a proposed preparatory sequence, not a validated scoring formula or a demonstrated improvement in procurement outcomes. In a prospective institutional application, the process would begin with a defined clinical and operational need, the applicable governance context, and a multidisciplinary decision team. Mandatory admissibility requirements would then be separated from criteria intended to differentiate otherwise acceptable options. Before preference elicitation, the institution would define the criterion boundaries, relevant performance ranges, evidence requirements, life-cycle cost assumptions, measurement rules, and direction of preference. Context-specific priorities could then be elicited and the resulting model stress-tested using hypothetical or reference profiles to identify sensitivity to weights, scales, or analytical choices before those assumptions become embedded in the formal procurement model. Because actual bids are not yet available at this stage, such profiles would support model testing rather than supplier selection. Following institutional and legal validation, the tender documentation would contain the prespecified requirements and compliant evaluation rules. Actual bids would subsequently be assessed within the formal procurement procedure by the designated authorities.
In a real institutional application, preference elicitation should be conducted by a purposively constituted multidisciplinary decision team rather than by an open convenience sample. Members should be selected for their relevance to the specific procurement, documented institutional role, and relevant experience with the clinical, technical, operational, economic, or governance dimensions they are expected to judge [9,12,20]. Collectively, the team should cover the perspectives required by the decision, which may include clinical users, radiographers or technologists, biomedical or clinical engineering, information technology and interoperability, maintenance and service support, procurement and finance, and management. This proof of concept does not establish a universal minimum or optimal number of participants, and the 23 consistent matrices used in the primary analysis should not be interpreted as a required sample size for future applications. Team size should instead reflect the institution’s governance structure and the expertise needed to cover the decision, with participant roles, relevant experience, potential conflicts of interest, and the aggregation rule documented prospectively [20,33,34].
This sequence fits the move from price-led purchasing toward value-based medical-device procurement [11,18,47]. It also addresses a gap identified in healthcare tenders, where value is ultimately expressed through the criteria and scoring rules chosen by the buyer [14]. The model should not be copied directly into an award formula. Relative normalization in SAW, TOPSIS, and MOORA depends on the alternatives being compared, while formal tenders may require scoring rules that are fixed in advance and independent of the competing set. The study is therefore better used to prepare the tender than to automate the award.
The potential practical benefit is therefore procedural rather than predictive. Making the decision context, admissibility rules, criterion boundaries, evidence expectations, preference weights, and sensitivity of the resulting recommendation explicit before the tender can improve the transparency, comparability, and traceability of the preparatory decision process. The present study did not test whether this translates into better procurement outcomes, lower costs, improved availability, or superior post-acquisition performance; those effects require prospective institutional evaluation.
Recent studies have shown that multicriteria methods can support healthcare technology choices and purchasing-process evaluation [15,16], while hospital studies combining HTA and MCDA show that structured appraisal can be brought into real procurement settings [48,49]. The present study takes a narrower position. It focuses on capital equipment before the tender and treats ranking sensitivity as part of the procurement result, not merely as a technical check after the ranking has been produced.
A more internally unified value-model architecture could instead use approaches such as the Simple Multi-attribute Rating Technique using Swings (SMARTS) or Simple Multi-attribute Rating Technique Exploiting Ranks (SMARTER), in which attribute value measurement and preference weighting are integrated within an additive value framework [50]. Such an approach may be preferable when the objective is to construct a single value model with weights explicitly linked to attribute ranges. The present proof of concept pursued a different analytical purpose: it deliberately separated scenario-dependent criterion priorities elicited through the AHP, a fixed hypothetical performance matrix, and alternative ranking rules so that dependence on context and aggregation method could be examined separately. This architecture is not claimed to be inherently superior, and future validation with real procurement data could usefully compare it with a unified value-based model.
The procedural logic may be adaptable to other categories of capital medical equipment, but this study did not test transferability beyond CT. A different device, service line, hospital, maintenance market, interoperability environment, or procurement objective may require different criteria, descriptors, evidence sources, scales, and priorities. Any broader application should therefore be treated as a new context-specific implementation requiring local validation rather than as direct transfer of the present model or weights. This caution is consistent with medical-device HTA and procurement research, which repeatedly shows that context, users, organizational effects, and technology characteristics matter [5,13,30].
4.6. Limitations and Next Step
Several limitations set clear boundaries around the findings. Recruitment was voluntary and nonprobability-based, and the response denominator was unknown. Public access without authenticated sign-in could not technically guarantee one submission per person, although participants were instructed to respond only once. The primary analysis was based on 23 complete matrices with consistency ratios of 0.10 or less, distributed across three small scenario groups (S1, n = 7; S2, n = 8; S3, n = 8). These group sizes, together with the nonprobability sampling design, preclude treating the aggregated weights as robust institutional or population preference estimates. The final six-criterion wording was not subjected to a second cognitive pilot before the main survey, which adds uncertainty regarding how consistently participants interpreted the refined criterion boundaries. Participants weighted the criterion definitions within the assigned scenario without seeing the exact performance ranges in the controlled matrix; the resulting AHP weights should therefore be interpreted as contextual priorities rather than as trade-off or swing weights calibrated to those ranges [26]. The three ranking methods shared the same input data, so their agreement is not independent validation. Sensitivity analysis was local and deterministic. Most importantly, no real CT system, supplier, price, contract, downtime history, or post-acquisition outcome was observed. Because the A1–A5 performance matrix was constructed analytically rather than estimated from market data, the observed rankings, agreement between methods, and switching thresholds are conditional on both the selected weights and the structure and ranges of that matrix [26]. They therefore demonstrate how the proposed analytical sequence behaves under controlled conditions, not how stable a decision would necessarily be among real CT systems. Accordingly, the present findings should be interpreted as hypothesis-generating evidence of methodological feasibility rather than as validation of an institutional decision architecture.
The AHP weights and the performance matrix also contain different types of information. The AHP weights reflect participants’ scenario-dependent judgments about the relative importance of the criteria, whereas the dispersion and relationships among the performance columns describe how strongly the alternatives are differentiated by the matrix itself. These two sources of information should not be conflated. The six macrocriteria were conceptually bounded to reduce overlap and double counting, but with only five analytically constructed profiles, the observed variability and cross-criterion relationships are properties of the analytical design rather than empirical estimates of the CT market. Normalization choices can further influence the contribution of these differences to the final ranking [51,52].
Data-derived weighting approaches provide a different perspective. Methods such as Criteria Importance Through Intercriteria Correlation (CRITIC) derive criterion weights from contrast intensity and inter-criterion relationships, while entropy-based approaches use the degree of differentiation contained in the observed data; hybrid approaches can combine such information with preference-based weights [53,54]. We did not apply these approaches to the present proof-of-concept matrix because doing so would convert variability deliberately introduced in the analytical design into apparently data-derived criterion importance and would not make the resulting weights independently objective. With real supplier and equipment data, however, comparing preference-based AHP weights with data-derived or hybrid weighting schemes would provide a useful additional sensitivity analysis and help distinguish stakeholder priorities from the discriminatory information contained in the observed performance matrix.
The next study should therefore be prospective and institutional. It should start with a defined CT need and a purposively constituted multidisciplinary procurement team whose formal organizational roles, decision responsibilities, relevant clinical, technical, operational, and procurement experience, and potential conflicts of interest are documented prospectively. The final criterion wording should be cognitively tested before preference elicitation, and the performance descriptors, relevant ranges, evidence requirements, and life-cycle cost logic should be specified before weights are elicited. Real supplier and equipment performance data should then replace the controlled hypothetical matrix. Sensitivity analysis should then include simultaneous uncertainty where the evidence supports it. The procurement should also be followed after the purchase. That is the point at which the model can be judged against outcomes that matter to logistics and management: implementation effort, availability, maintenance performance, service disruption, cost, and whether the decision process was useful to the people who had to make it. Hospital procurement research still has relatively little prospective evidence of this kind [12,13].
5. Conclusions
Hospital CT procurement is a healthcare logistics decision before it becomes a tender evaluation exercise. The main contribution of this study is not a new MCDA algorithm, but a domain-specific proof of concept for structuring and stress-testing a pre-tender decision before formal scoring rules are fixed. The model separates mandatory admissibility from differentiating value criteria, elicits context-dependent priorities, keeps alternative performance distinct from those priorities, compares rankings across different aggregation rules, and reports how readily the first-ranked profile changes under prespecified analytical perturbations.
Within the controlled A1–A5 matrix, S1 and S2 showed higher conditional first-rank stability, whereas S3 was more sensitive to both method choice and changes in C6. The 7.1% local switching threshold in S3 illustrates why a ranking should be accompanied by information about how close it is to changing. This stability is conditional on the constructed matrix, the included participants, the elicited weights, the tested ranking methods, and the deterministic sensitivity procedures; it should not be interpreted as a probability of rank preservation or as validation of a real CT procurement.
The proposed process is therefore best understood as a transparent and auditable preparatory framework rather than an automated award model. It may inform other high-cost medical-equipment decisions only after the criteria, performance measures, evidence sources, scales, and weights have been redefined and institutionally validated for the specific context. Its next test should be a prospective application in a real hospital procurement using observed supplier evidence, life-cycle costs, and post-acquisition outcomes.
Author Contributions
Conceptualization, R.Q., L.R., M.M.R. and V.O.; methodology, R.Q. and M.M.R.; validation, R.Q., M.M.R. and V.O.; formal analysis, R.Q.; investigation, R.Q.; resources, R.Q. and L.R.; data curation, R.Q., A.R., N.C., L.R., M.M.R. and V.O.; writing—original draft preparation, R.Q. and L.R.; writing—review and editing, R.Q., A.R., N.C., L.R., M.M.R. and V.O.; supervision, R.Q., M.M.R. and V.O.; project administration, R.Q. All authors have read and agreed to the published version of the manuscript.
Funding
This research received no external funding.
Data Availability Statement
Aggregated data supporting the reported results are presented in the article. Individual-level survey responses are not publicly available because combinations of professional characteristics, response metadata, withdrawal codes, and free-text responses may create a risk of indirect identification and are subject to the confidentiality and data-protection conditions communicated to participants. Further information may be requested from the corresponding author, subject to those confidentiality, consent, and data-protection constraints.
Conflicts of Interest
The authors declare no conflicts of interest.
Abbreviations
The following abbreviations are used in this manuscript:
| AHP | Analytic Hierarchy Process |
| CRITIC | Criteria Importance Through Intercriteria Correlation |
| CT | Computed Tomography |
| MCDA | Multiple Criteria Decision Analysis |
| MOORA | Multi-Objective Optimization on the Basis of Ratio Analysis |
| SAW | Simple Additive Weighting |
| SMARTER | Simple Multi-attribute Rating Technique Exploiting Ranks |
| SMARTS | Simple Multi-attribute Rating Technique using Swings |
| TOPSIS | Technique for Order Preference by Similarity to Ideal Solution |
References
- Volland, J.; Fügener, A.; Schoenfelder, J.; Brunner, J.O. Material logistics in hospitals: A literature review. Omega 2017, 69, 82–101. [Google Scholar] [CrossRef] [Scilit]
- de Vries, J.; Huijsman, R. Supply chain management in health services: An overview. Supply Chain Manag. Int. J. 2011, 16, 159–165. [Google Scholar] [CrossRef] [Scilit]
- Ellram, L.M. Total cost of ownership: An analysis approach for purchasing. Int. J. Phys. Distrib. Logist. Manag. 1995, 25, 4–23. [Google Scholar] [CrossRef] [Scilit]
- Drummond, M.; Griffin, A.; Tarricone, R. Economic evaluation for devices and drugs: Same or different? Value Health 2009, 12, 402–404. [Google Scholar] [CrossRef] [Scilit] [PubMed]
- Tarricone, R.; Callea, G.; Ogorevc, M.; Prevolnik Rupel, V. Improving the methods for the economic evaluation of medical devices. Health Econ. 2017, 26, 70–92. [Google Scholar] [CrossRef] [Scilit] [PubMed]
- Iadanza, E.; Gonnelli, V.; Satta, F.; Gherardelli, M. Evidence-based medical equipment management: A convenient implementation. Med. Biol. Eng. Comput. 2019, 57, 2215–2230. [Google Scholar] [CrossRef] [Scilit] [PubMed]
- Ho, W.; Xu, X.; Dey, P.K. Multi-criteria decision making approaches for supplier evaluation and selection: A literature review. Eur. J. Oper. Res. 2010, 202, 16–24. [Google Scholar] [CrossRef] [Scilit]
- Chai, J.; Liu, J.N.K.; Ngai, E.W.T. Application of decision-making techniques in supplier selection: A systematic review of literature. Expert Syst. Appl. 2013, 40, 3872–3885. [Google Scholar] [CrossRef] [Scilit]
- Hinrichs, S.; Dickerson, T.; Clarkson, J. Stakeholder challenges in purchasing medical devices for patient safety. J. Patient Saf. 2013, 9, 36–43. [Google Scholar] [CrossRef] [Scilit] [PubMed]
- Montgomery, K.; Schneller, E.S. Hospitals’ strategies for orchestrating selection of physician preference items. Milbank Q. 2007, 85, 307–335. [Google Scholar] [CrossRef] [Scilit] [PubMed]
- Matinheikki, J.; Kenny, K.; Kauppi, K.; van Raaij, E.; Brandon-Jones, A. Realising the promise of value-based purchasing: Experimental evidence of medical device selection. Int. J. Oper. Prod. Manag. 2024, 44, 100–126. [Google Scholar] [CrossRef] [Scilit]
- Hinrichs-Krapels, S.; Ditewig, B.; Boulding, H.; Chalkidou, A.; Erskine, J.; Shokraneh, F. Purchasing high-cost medical devices and equipment in hospitals: A systematic review. BMJ Open 2022, 12, e057516. [Google Scholar] [CrossRef] [Scilit] [PubMed]
- Cangelosi, M.; Chahar, A.; Eggington, S. Evolving use of health technology assessment in medical device procurement: Global systematic review: An ISPOR Special Interest Group report. Value Health 2023, 26, 1581–1589. [Google Scholar] [CrossRef] [Scilit] [PubMed]
- Miller, F.A.; Lehoux, P.; Peacock, S.; Rac, V.E.; Neukomm, J.; Barg, C.; Bytautas, J.P.; Krahn, M. How procurement judges the value of medical technologies: A review of healthcare tenders. Int. J. Technol. Assess. Health Care 2019, 35, 50–55. [Google Scholar] [CrossRef] [Scilit] [PubMed]
- Oluwadare, A.; Akintayo, B.D.; Babatunde, O.M.; Olanrewaju, O.A. Assessing the impact of Healthcare 4.0 technologies on healthcare supply chain management: A multi-criteria evaluation framework. Logistics 2024, 8, 44. [Google Scholar] [CrossRef] [Scilit]
- Mansouri, N.; Soulhi, A. A fuzzy decision model for evaluating centralized purchasing process performance. Logistics 2026, 10, 141. [Google Scholar] [CrossRef] [Scilit]
- Sorenson, C.; Kanavos, P. Medical technology procurement in Europe: A cross-country comparison of current practice and policy. Health Policy 2011, 100, 43–50. [Google Scholar] [CrossRef] [Scilit] [PubMed]
- Rahmani, K.; Karimi, S.; Rezayatmand, R.; Raeisi, A.R. Value-based procurement for medical devices: A scoping review. Med. J. Islam. Repub. Iran 2021, 35, 134. [Google Scholar] [CrossRef] [Scilit] [PubMed]
- Thokala, P.; Devlin, N.; Marsh, K.; Baltussen, R.; Boysen, M.; Kalo, Z.; Longrenn, T.; Mussen, F.; Peacock, S.; Watkins, J.; et al. Multiple criteria decision analysis for health care decision making: An introduction: Report 1 of the ISPOR MCDA Emerging Good Practices Task Force. Value Health 2016, 19, 1–13. [Google Scholar] [CrossRef] [Scilit] [PubMed]
- Marsh, K.; IJzerman, M.; Thokala, P.; Baltussen, R.; Boysen, M.; Kaló, Z.; Lönngren, T.; Mussen, F.; Peacock, S.; Watkins, J.; et al. Multiple criteria decision analysis for health care decision making: Emerging good practices: Report 2 of the ISPOR MCDA Emerging Good Practices Task Force. Value Health 2016, 19, 125–137. [Google Scholar] [CrossRef] [Scilit] [PubMed]
- Frazão, T.D.C.; Camilo, D.G.G.; Cabral, E.L.S.; Souza, R.P. Multicriteria decision analysis (MCDA) in health care: A systematic review of the main characteristics and methodological steps. BMC Med. Inform. Decis. Mak. 2018, 18, 90. [Google Scholar] [CrossRef] [Scilit] [PubMed]
- Gongora-Salazar, P.; Rocks, S.; Fahr, P.; Rivero-Arias, O.; Tsiachristas, A. The use of multicriteria decision analysis to support decision making in healthcare: An updated systematic literature review. Value Health 2023, 26, 780–790. [Google Scholar] [CrossRef] [Scilit] [PubMed]
- Oliveira, M.D.; Mataloto, I.; Kanavos, P. Multi-criteria decision analysis for health technology assessment: Addressing methodological challenges to improve the state of the art. Eur. J. Health Econ. 2019, 20, 891–918. [Google Scholar] [CrossRef] [Scilit] [PubMed]
- Saaty, T.L. A scaling method for priorities in hierarchical structures. J. Math. Psychol. 1977, 15, 234–281. [Google Scholar] [CrossRef] [Scilit]
- Ishizaka, A.; Labib, A. Review of the main developments in the analytic hierarchy process. Expert Syst. Appl. 2011, 38, 14336–14345. [Google Scholar] [CrossRef] [Scilit]
- von Nitzsch, R.; Weber, M. The effect of attribute ranges on weights in multiattribute utility measurements. Manag. Sci. 1993, 39, 937–943. [Google Scholar] [CrossRef] [Scilit]
- Guitouni, A.; Martel, J.-M. Tentative guidelines to help choosing an appropriate MCDA method. Eur. J. Oper. Res. 1998, 109, 501–521. [Google Scholar] [CrossRef] [Scilit]
- Zanakis, S.H.; Solomon, A.; Wishart, N.; Dublish, S. Multi-attribute decision making: A simulation comparison of select methods. Eur. J. Oper. Res. 1998, 107, 507–529. [Google Scholar] [CrossRef] [Scilit]
- Keeney, R.L.; Gregory, R.S. Selecting attributes to measure the achievement of objectives. Oper. Res. 2005, 53, 1–11. [Google Scholar] [CrossRef] [Scilit]
- Freitas, L.; Vieira, A.C.L.; Oliveira, M.D.; Monteiro, H.; Bana e Costa, C.A. Which value aspects are relevant for the evaluation of medical devices? Exploring stakeholders’ views through a Web-Delphi process. BMC Health Serv. Res. 2023, 23, 593. [Google Scholar] [CrossRef] [Scilit] [PubMed]
- Presser, S.; Couper, M.P.; Lessler, J.T.; Martin, E.; Martin, J.; Rothgeb, J.M.; Singer, E. Methods for testing and evaluating survey questions. Public Opin. Q. 2004, 68, 109–130. [Google Scholar] [CrossRef] [Scilit]
- Brunelli, M.; Canal, L.; Fedrizzi, M. Inconsistency indices for pairwise comparison matrices: A numerical study. Ann. Oper. Res. 2013, 211, 493–509. [Google Scholar] [CrossRef] [Scilit]
- Forman, E.; Peniwati, K. Aggregating individual judgments and priorities with the analytic hierarchy process. Eur. J. Oper. Res. 1998, 108, 165–169. [Google Scholar] [CrossRef] [Scilit]
- Ossadnik, W.; Schinke, S.; Kaspar, R.H. Group aggregation techniques for Analytic Hierarchy Process and Analytic Network Process: A comparative analysis. Group Decis. Negot. 2016, 25, 421–457. [Google Scholar] [CrossRef] [Scilit]
- Churchman, C.W.; Ackoff, R.L. An approximate measure of value. J. Oper. Res. Soc. Am. 1954, 2, 172–187. [Google Scholar] [CrossRef] [Scilit]
- Behzadian, M.; Khanmohammadi Otaghsara, S.; Yazdani, M.; Ignatius, J. A state-of-the-art survey of TOPSIS applications. Expert Syst. Appl. 2012, 39, 13051–13069. [Google Scholar] [CrossRef] [Scilit]
- Brauers, W.K.M.; Zavadskas, E.K. The MOORA method and its application to privatization in a transition economy. Control Cybern. 2006, 35, 445–469. [Google Scholar]
- Puth, M.-T.; Neuhäuser, M.; Ruxton, G.D. Effective use of Spearman’s and Kendall’s correlation coefficients for association between two measured traits. Anim. Behav. 2015, 102, 77–84. [Google Scholar] [CrossRef] [Scilit]
- Aguarón, J.; Moreno-Jiménez, J.M. Local stability intervals in the analytic hierarchy process. Eur. J. Oper. Res. 2000, 125, 113–132. [Google Scholar] [CrossRef] [Scilit]
- Triantaphyllou, E.; Sánchez, A. A sensitivity analysis approach for some deterministic multi-criteria decision-making methods. Decis. Sci. 1997, 28, 151–194. [Google Scholar] [CrossRef] [Scilit]
- Broekhuizen, H.; Groothuis-Oudshoorn, C.G.M.; van Til, J.A.; Hummel, J.M.; IJzerman, M.J. A review and classification of approaches for dealing with uncertainty in multi-criteria decision analysis for healthcare decisions. Pharmacoeconomics 2015, 33, 445–455. [Google Scholar] [CrossRef] [Scilit] [PubMed]
- Saltelli, A.; Aleksankina, K.; Becker, W.; Fennell, P.; Ferretti, F.; Holst, N.; Li, S.; Wu, Q. Why so many published sensitivity analyses are false: A systematic review of sensitivity analysis practices. Environ. Model. Softw. 2019, 114, 29–39. [Google Scholar] [CrossRef] [Scilit]
- Więckowski, J.; Sałabun, W. Sensitivity analysis approaches in multi-criteria decision analysis: A systematic review. Appl. Soft Comput. 2023, 148, 110915. [Google Scholar] [CrossRef] [Scilit]
- Broman, K.W.; Woo, K.H. Data organization in spreadsheets. Am. Stat. 2018, 72, 2–10. [Google Scholar] [CrossRef] [Scilit]
- Sandve, G.K.; Nekrutenko, A.; Taylor, J.; Hovig, E. Ten simple rules for reproducible computational research. PLoS Comput. Biol. 2013, 9, e1003285. [Google Scholar] [CrossRef] [Scilit] [PubMed]
- Borgonovo, E.; Plischke, E. Sensitivity analysis: A review of recent advances. Eur. J. Oper. Res. 2016, 248, 869–887. [Google Scholar] [CrossRef] [Scilit]
- Robinson, J.C. Value-based purchasing for medical devices. Health Aff. 2008, 27, 1523–1531. [Google Scholar] [CrossRef] [Scilit] [PubMed]
- Martelli, N.; Hansen, P.; van den Brink, H.; Boudard, A.; Cordonnier, A.-L.; Devaux, C.; Pineau, J.; Prognon, P.; Borget, I. Combining multi-criteria decision analysis and mini-health technology assessment: A funding decision-support tool for medical devices in a university hospital setting. J. Biomed. Inform. 2016, 59, 201–208. [Google Scholar] [CrossRef] [Scilit] [PubMed]
- Yang, C.; Wang, Y.; Hu, X.; Chen, Y.; Qian, L.; Li, F.; Gu, W.; Liu, Q.; Wang, D.; Chai, X. Improving hospital based medical procurement decisions with health technology assessment and multi-criteria decision analysis. Inquiry 2021, 58, 00469580211022911. [Google Scholar] [CrossRef] [Scilit] [PubMed]
- Edwards, W.; Barron, F.H. SMARTS and SMARTER: Improved simple methods for multiattribute utility measurement. Organ. Behav. Hum. Decis. Process. 1994, 60, 306–325. [Google Scholar] [CrossRef] [Scilit]
- Tofallis, C. Add or Multiply? A Tutorial on Ranking and Choosing with Multiple Criteria. Inf. Trans. Educ. 2014, 14, 109–119. [Google Scholar] [CrossRef] [Scilit]
- Vafaei, N.; Ribeiro, R.A.; Camarinha-Matos, L.M. Data normalisation techniques in decision making: Case study with TOPSIS method. Int. J. Inf. Decis. Sci. 2018, 10, 19–38. [Google Scholar] [CrossRef] [Scilit]
- Diakoulaki, D.; Mavrotas, G.; Papayannakis, L. Determining objective weights in multiple criteria problems: The CRITIC method. Comput. Oper. Res. 1995, 22, 763–770. [Google Scholar] [CrossRef] [Scilit]
- Ayan, B.; Abacıoğlu, S.; Basilio, M.P. A Comprehensive Review of the Novel Weighting Methods for Multi-Criteria Decision-Making. Information 2023, 14, 285. [Google Scholar] [CrossRef] [Scilit]

Disclaimer/Publisher’s Note: The statements, opinions and data contained in all publications are solely those of the individual author(s) and contributor(s) and not of MDPI and/or the editor(s). MDPI and/or the editor(s) disclaim responsibility for any injury to people or property resulting from any ideas, methods, instructions or products referred to in the content. |
© 2026 by the authors. Licensee MDPI, Basel, Switzerland. This article is an open access article distributed under the terms and conditions of the Creative Commons Attribution (CC BY) license.