


Abstract
Industrial activities contribute to the release of potentially toxic elements (PTEs) into the atmosphere, yet the spatial disparities in source-specific risks associated with atmospheric deposition remain insufficiently quantified. This study developed a Gini index-based framework to assess the inequality in source-specific ecological and health risks of PTEs in atmospheric deposition within a typical industrial city. A total of 128 deposition samples were collected in a typical industrial city in central China, and concentrations of nine PTEs (As, Cd, Co, Cr, Cu, Hg, Ni, Pb, and Zn) were analyzed. Source apportionment was performed using positive matrix factorization (PMF) and self-organizing maps (SOM). The Gini index for source-specific risk (GISR) was applied to quantify spatial inequality of ecological and health risks contributed by each source. The results showed that Cd, Pb, As and Zn were the most enriched metals, with Cd exhibiting extreme pollution level at 96% of sites. Four sources were identified, including industrial (28.41%), traffic (19.68%), natural (31.67%), and combustion (20.24%) sources. Cd dominated the integrated ecological risk (95.12%), while As and Pb contributed 88% of non-carcinogenic health risks, with children facing 2.3-fold higher chronic risk than adults. The GISR analysis revealed that industrial and combustion sources drove extreme ecological risk and chronic toxicity, and their contributions to the integrated ecological risk showed a highly homogeneous structural dominance (mean GISR = 0.43), whereas health risks exhibited moderate inequality with hotspots in eastern urban and industrial zones. This framework identifies priority control sources and areas, offering a transferable tool for spatially targeted pollution management in industrial regions.
1. Introduction
Rapid urbanization and industrial expansion have significantly accelerated the release of potentially toxic elements (PTEs) into the atmospheric environment [1,2]. These pollutants are persistent and bio-accumulative, capable of undergoing long-range transport and subsequently depositing onto soil and water bodies via both dry and wet processes [3]. Atmospheric deposition is widely recognized as a major pathway for exogenous metals to enter terrestrial ecosystems, thereby posing severe threats to environmental quality [4,5,6]. In typical industrial cities where non-ferrous metal smelting and coal combustion are concentrated, atmospheric PTEs such as lead, cadmium, and arsenic are frequently detected at high concentrations, presenting considerable ecological and human health hazards [7,8,9,10]. Such contamination can disrupt ecosystem functions, reduce biodiversity, and increase the risk of non-carcinogenic and carcinogenic diseases in local populations [11,12,13]. Therefore, a comprehensive evaluation of pollution levels and source-specific risks is essential for informing the development of pollution control strategies that prioritize interventions for reducing both ecological damage and public health burden in industrialized urban areas.
Recent advances in source apportionment have demonstrated the effectiveness of receptor models such as positive matrix factorization (PMF) and self-organizing maps (SOM) in identifying the source of PTEs across various environmental media [14,15,16]. These methods have been widely coupled with ecological risk indices and human health risk assessment frameworks to evaluate the overall hazard posed by metal contamination [14,16]. Consequently, many studies have shifted their focus to ecological or health risks and have conducted source-specific risk assessments at regional scales, successfully identifying priority control elements and priority control sources, thereby providing a scientific basis for risk management and pollution mitigation. However, a critical limitation of current source-specific risk assessments is that they typically aggregate source contributions across the entire study area, treating risk contribution of each source as spatially uniform [17]. This aggregation overlooks the spatial heterogeneity of source-specific risk contributions, which is essential for targeted pollution control. Spatial heterogeneity can significantly undermine the accuracy and reliability of source apportionment and subsequent risk assessment results [18,19]. Although the importance of spatial variability has been increasingly acknowledged in other environmental disciplines, a quantitative metric to assess inequality in the distribution of source-specific risks across different sites remains largely lacking. However, the application of the Gini index to evaluate the spatial inequality of source-specific ecological and health risks from PTEs in atmospheric deposition remains very limited. Such a metric would make it possible to identify hotspots where a particular source disproportionately drives local risk, thereby guiding more efficient and equitable intervention strategies. Consequently, there is a pressing need to develop a spatially explicit approach that links source apportionment results with risk inequality assessment.
The Lorenz curve and the Gini index, originally developed in economics to measure income inequality, have proven to be robust tools for quantifying distributional disparities across various fields [20]. In recent years, the Gini index, originally developed in economics to measure income inequality, has recently been extended to environmental applications such as assessing inequality in air pollution exposure, temperature exposure, and greenspace accessibility [21,22,23]. For instance, the Gini index has been widely employed to measure the spatial inequality of population exposure to PM2.5 and ozone, revealing significant disparities across different regions and populations [21,23]. These studies demonstrate that environmental burdens are seldom distributed uniformly and that certain populations or areas consistently bear disproportionately high exposure levels. The Gini index thus provides a standardized and intuitive metric for characterizing the equity dimension of environmental quality, complementing traditional assessments that focus solely on average concentrations or exceedance frequencies. Despite these advances, the application of the Lorenz curve and Gini index to evaluate the spatial inequality of source specific ecological and health risks arising from different environmental media remains notably limited. The majority of existing investigations rely on spatially averaged risk values or elementary hotspot identification techniques. Such approaches provide limited insight into the spatial unevenness of risk contributions from a given pollution source, and the associated spatial inequities in source receptor relationships are consequently not explicitly addressed [24,25]. Consequently, this gap hinders the development of spatially targeted risk management strategies. Currently, there is a lack of quantitative information to identify which pollution sources generate the most inequitable risk distributions and where interventions would achieve the greatest effect. Therefore, a dedicated metric combining source apportionment results with the Gini framework is required to explicitly quantify source specific risk inequality across different environmental compartments.
In response to this need, a novel Gini index for source-specific risk (GISR) was introduced to evaluate the spatial inequality of source-specific risks posed by PTEs in atmospheric deposition within a typical industrial city. By integrating source apportionment results with the Lorenz curve and Gini framework, the GISR quantifies the spatial inequality of risk contributions from each identified source, thereby identifying sources characterized by highly unequal distributions and guiding spatially targeted priority control measures. The specific objectives are: (a) to comprehensively characterize the pollution status of PTEs in atmospheric deposition and apportion their contributions to different sources; (b) to quantify the source specific ecological and human health risks, distinguishing between non carcinogenic and carcinogenic effects for both children and adults; (c) to assess the spatial inequality of source specific risks using the proposed GISR, thereby identifying priority control sources and high inequality hotspots. The findings will introduce a novel quantitative metric for risk inequality, facilitating a transition from region-averaged risk assessments to spatially explicit management strategies. Moreover, this approach provides a transferable framework for other industrial regions, supporting evidence-based decision making in environmental regulation and equitable allocation of pollution control resources.
2. Materials and Methods
2.1. Study Area
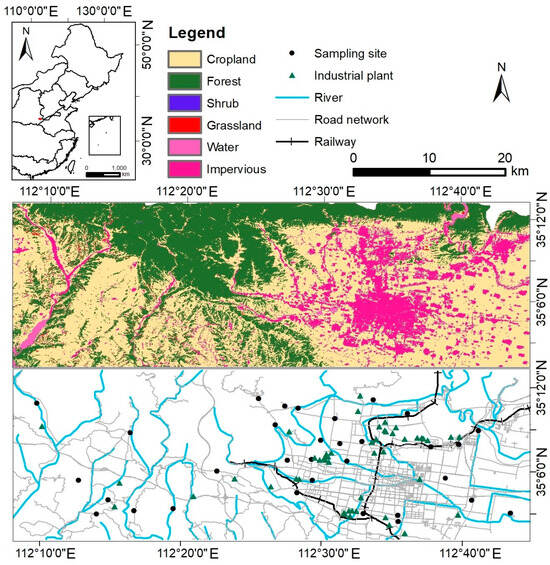
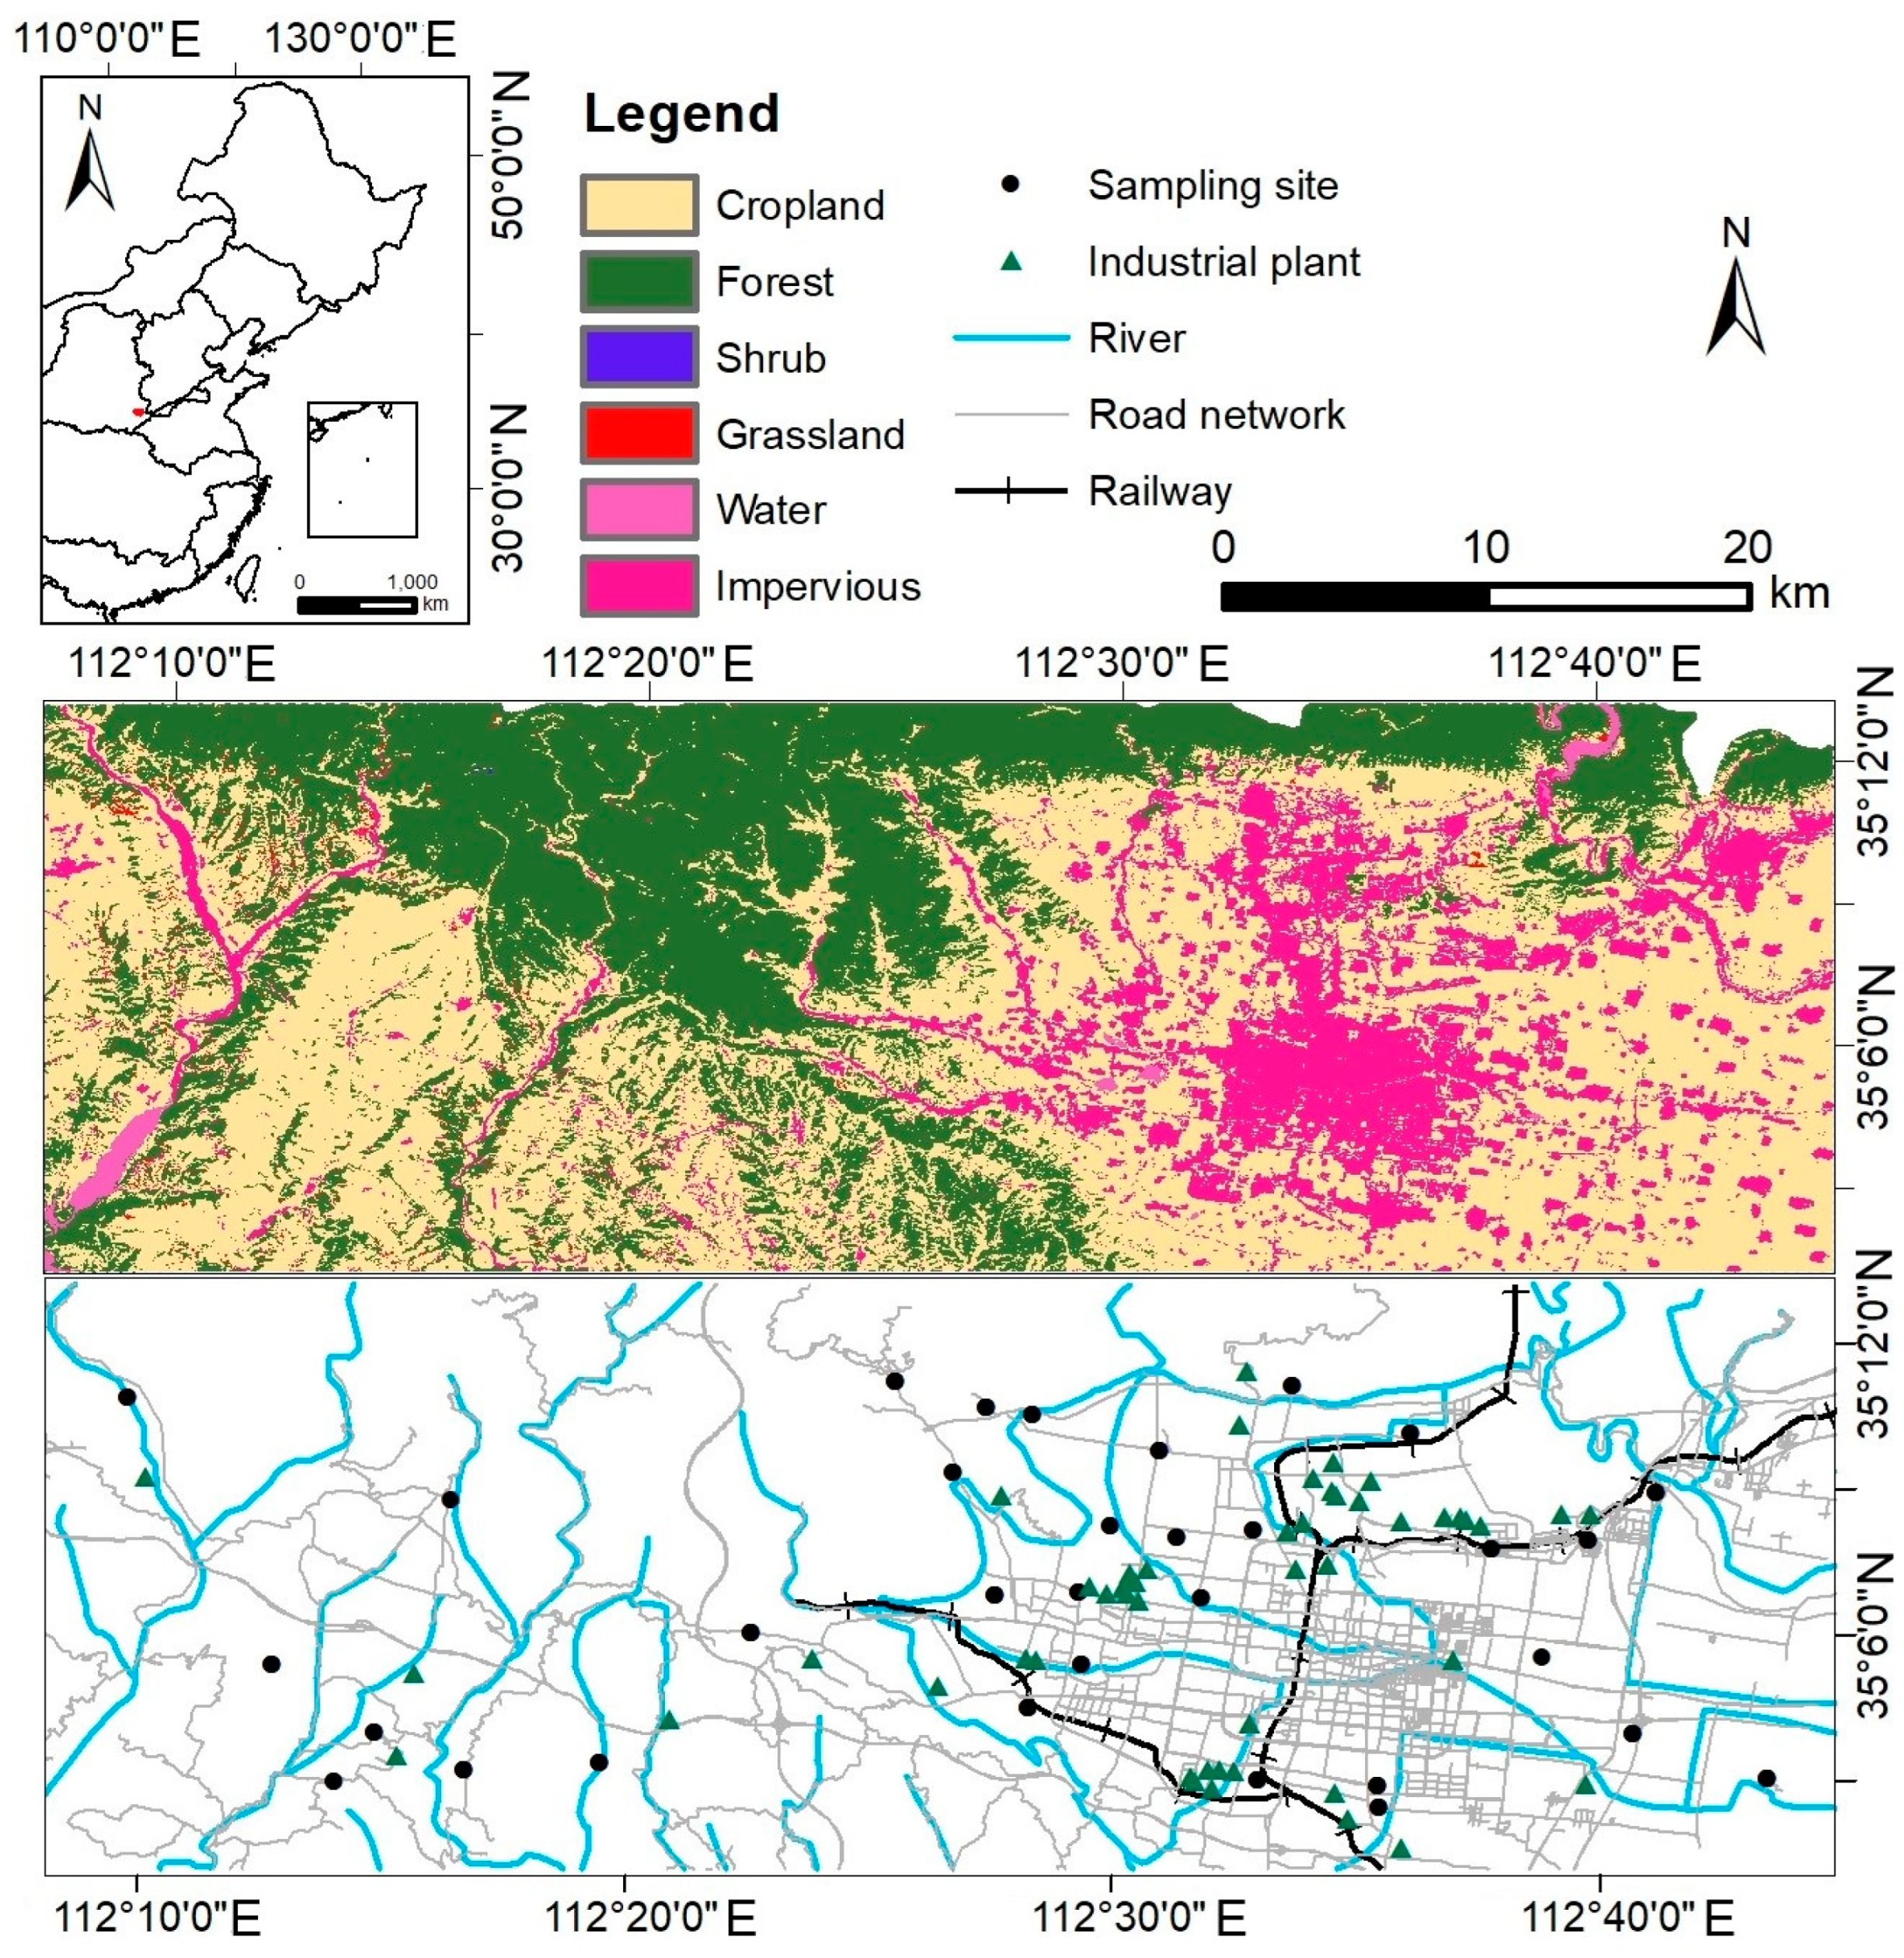
The study area is located at the southern foot of the Taihang Mountains within the Yellow River basin (Figure 1). It has a warm temperate continental monsoon climate with an average annual temperature of 14.6 °C and a mean annual precipitation of 567.9 mm [26]. The terrain is predominantly mountainous and hilly, accounting for 88% of the total area [27]. The region is distinguished by a well-developed industrial base, with non-ferrous metal smelting, serving as the primary sector [28]. Additional industrial activities include steel production, energy generation, chemical manufacturing, and equipment fabrication. It encompasses 49 key monitored enterprises distributed across the area. A robust transportation network, including railway and highway systems, supports industrial activities. Notably, atmospheric PTE pollution resulting from smelting activities has been documented, with elevated deposition fluxes of lead, cadmium, and arsenic near industrial sites posing potential risks to soil quality and human health [29].
Figure 1.
Location of the study area, distribution of sampling sites and industrial plant, and land use types.
2.2. Sample Collection and Analysis
Atmospheric deposition samples were collected following the standardized determination of dustfall gravimetric method [30]. Considering the topographic characteristics and industrial layout of the study area, a total of 32 sampling sites were established using a uniform distribution approach, incorporating prevailing wind direction and differences in functional zones (Figure 1). Four quarterly sampling campaigns were conducted in January, April, July and October of 2024 with each sampler exposed continuously for 3 months. Samples were collected using polyethylene cylinders with a 15 cm inner diameter and a 30 cm height containing 60 mL of ethylene glycol solution. The sampler height was set at 10 ± 3 m in accordance with the standard. After collection, the sample solution was rinsed with deionized water and transferred into sealed plastic bottles. In the laboratory, extraneous materials such as leaves and insects were removed using tweezers, and the bags and debris were rinsed with distilled water to recover any remaining particulate matter.
To quantify total PTEs in deposition samples, a triple acid digestion was performed based on a previous procedure [31]. A 0.1000 g sample was weighed into a polytetrafluoroethylene tube, pre-reacted with 1 mL concentrated HF overnight at room temperature, and then digested with 3 mL HCl and 1 mL HNO3 followed by analysis for Cd, Co, Cr, Cu, Ni, Pb, and Zn using inductively coupled plasma mass spectrometry (ICP-MS, iCAP RQ, Thermo Fisher Scientific, Waltham, MA, USA). A separate 10 mL aliquot of the mixed solution was subjected to freeze-drying based on the reported method [32]. The lyophilized solid residue was digested in a closed polytetrafluoroethylene vessel following the identical digestion protocol and the resultant digest solution was analyzed for As and Hg using an atomic fluorescence spectrometer (AFS, BAF-2000, Baode Instrument Co., Ltd., Beijing, China).
For quality assurance, each batch of samples included a procedural blank and a duplicate sample. The blank was processed following identical procedures and all reported concentrations were corrected using blank values. The relative standard deviation between duplicate measurements was below 5% for all elements. The calibration curves for all target elements achieved correlation coefficients (R2) greater than 0.995. The national standard reference material GBW07427 (GSS-13, National Standard Material Resource Sharing Platform, Beijing, China) was analyzed concurrently as a quality control, with recovery rates ranging from 85% to 107%.
2.3. Geoaccumulation Index Method
The geo-accumulation index (Igeo) was employed to assess the enrichment level of PTEs in atmospheric deposition samples. The calculation was performed using the following equation:
where Ci is the measured concentration of element i (mg kg−1). The reference value Bi was selected from the regional soil background values (Table S4). A factor of 1.5 was introduced to account for natural lithogenic variations [33,34]. The classification criteria for Igeo are provided in the Supplementary Materials (Table S1).
2.4. Source Apportionment
2.4.1. Self-Organizing Map (SOM)
The SOM is an unsupervised neural network algorithm proposed by Kohonen for pattern analysis and clustering [35]. In recent years, it has been increasingly applied in source apportionment studies [14,16]. The network consists of a one-dimensional input layer and a two-dimensional competitive layer, with neurons connected between layers to identify clustering patterns. In this study, the SOM was applied to identify patterns of PTEs in deposition samples. Component planes allow visual interpretation of relationships among variables, where similar gradient directions indicate positive correlations and opposing gradients suggest negative correlations. To enhance visualization, neurons are mapped onto a two-dimensional computational grid, which serves as the representational basis during model training. The size of the SOM, defined as the number of neurons in the output layer, was calculated using the following equation:
where m represents the number of neurons in the SOM and n denotes the total number of samples. Thus, the calculated map size was approximately 56, leading to an initial configuration of 8 × 7 neuron structure. Modeling, training, and application of the samples were implemented using the SOM Toolbox 2.0 in MATLAB R2019b.
2.4.2. Positive Matrix Factorization (PMF)
In this study, source apportionment of PTEs in atmospheric deposition was performed using PMF 5.0 software. PMF is a receptor-based factor analysis algorithm with non-negativity constraints, which decomposes a matrix of PTE concentration data in deposition samples into two matrices: the factor contribution matrix (G) and the factor profile matrix (F), without requiring prior knowledge of source emission inventories [36,37]. Mathematically, the PMF model can be expressed as:
where Xij (mg kg−1) is the measured concentration of the PTE j in the sample i. Gik (dimensionless, between 0 and 1) is the contribution of the factor k to the sample i. Fkj (mg kg−1) is the factor profile concentration of the PTE j in the factor k. Eij represents the residual matrix for each sample and PTE. To optimize the values of the factor contribution and factor profile matrices, PMF minimizes the objective function Q, which accounts for the uncertainty in chemical measurements [36]. The objective function Q is given by:
where μij is the uncertainty matrix for the sample i and PTE j, calculated based on the method detection limit (DL). The method detection limits for As, Cd, Co, Cr, Cu, Hg, Ni, Pb, and Zn were 0.2, 0.03, 0.06, 2, 0.7, 0.0005, 2, 1, and 5 mg kg−1 respectively. The uncertainty is determined by the DL and the relative standard deviation (RSD), as follows:
For concentrations below the DL:
2.5. Source-Specific Ecological Risk Apportionment Method
Based on the source apportionment results obtained from the PMF model, a source-specific integrated ecological risk assessment model was developed by incorporating the Nemerow integrated risk index approach to quantitatively evaluate the ecological risk contributed by each pollution source [38,39]. The integrated ecological risk index (IERI) of pollution source k was calculated using the following equation:
where ERi max and ERi ave denote the maximum and average ecological risk values of all PTEs, respectively. The ecological risk for an individual PTE i was calculated as:
where ERi is the ecological risk, and the toxicity response coefficient was set to 10, 30, 2, 2, 5, 40, 5, 5, and 1 for As, Cd, Co, Cr, Cu, Hg, Ni, Pb, and Zn, respectively [40,41]. The ecological risk levels for both ERi and IERI were classified according to the previous studies [41,42]. Specifically, IERI ≤ 40 and ERi ≤ 40 denote low risk; 40 < IERI ≤ 80 and 40 < ERi ≤ 80 indicate moderate risk; 80 < IERI ≤ 160 and 80 < ERi ≤ 160 represent considerable risk; 160 < IERI ≤ 320 and 160 < ERi ≤ 320 correspond to high risk; and IERI > 320 and ERi > 320 signify extreme risk [39,41].
2.6. Source-Specific Health Risk Apportionment Method
Human health risks posed by PTEs were evaluated following the U.S. Environmental Protection Agency (USEPA) human health risk assessment framework, which has been applied in health risk assessments of PTEs in atmospheric deposition, dust, airborne particulate matter, and soil [13,43,44,45]. Based on the source apportionment results derived from the PMF model, both carcinogenic and non-carcinogenic risks were quantified for adults and children under exposure to source-specific PTE concentrations [46].
Three primary exposure pathways namely hand-to-mouth ingestion, inhalation, and dermal contact were considered to estimate the average daily exposure doses of PTEs for children and adults. The corresponding equations were as follows:
For carcinogenic metals (As, Cd, Cr, Co, Ni, Pb), the lifetime average daily dose (LADD) through inhalation was calculated using the following equation:
where C represents the concentration of PTEs in atmospheric deposition (mg kg−1). The definitions and values of other parameters are provided in the Supplementary Materials. The non-carcinogenic risk was evaluated using the hazard index (HI), defined as the sum of hazard quotients (HQ) for each exposure pathway and each metal:
where RfD is the reference dose (mg kg−1 d−1) for non-carcinogenic effects. When HI ≤ 1, there is no health risk or the risk is considered negligible. When 1 < HI ≤ 10, a certain level of non-carcinogenic risk exists. When HI > 10, it indicates chronic toxicity [47]. The carcinogenic risk was assessed using the total carcinogenic risk (TCR), calculated as the sum of individual cancer risks (CR) for each carcinogenic metal:
where SF is the cancer slope factor (kg d mg−1). Since slope factors are currently available only for the inhalation pathway, carcinogenic risk was estimated exclusively via inhalation for As, Cd, Co, Cr, Ni and Pb. Considering Cr(VI) as the sole carcinogenic valence state via inhalation a conservative one-sixth conversion factor was applied to calculate the carcinogenic risk following previous studies [48]. This one sixth ratio is positioned within the documented literature range of 1% to 40% for atmospheric particulates (Figure S3). TCR ≤ 10−6 indicates negligible carcinogenic risk, 10−6 < TCR ≤ 10−4 indicates an acceptable level, and TCR > 10−4 suggests a high carcinogenic risk [49]. The input parameter values of the health risk assessment model are listed in Tables S2 and S3. To account for the uncertainty in risk indicators a Monte Carlo simulation was performed using Oracle Crystal Ball (version 11.1.2.4.400) with exposure parameter distributions defined by USEPA guidelines.
2.7. Source-Specific Risk Gini Index
The Lorenz curve and the Gini index, both rooted in economics, are widely employed as measures of inequity [50,51]. In this study, the GISR was introduced to evaluate the spatial inequality of source-specific ecological and health risks associated with PTEs in atmospheric deposition. The Lorenz curve was used as a graphical representation to illustrate the cumulative distribution of risk contributions across sampling sites. The GISR is defined as the ratio of the area between the line of equity and the Lorenz curve to the total area under the line of equity, quantifies the overall degree of inequality, ranging from 0 (absolute equity) to 1 (absolute inequity) [52].
Two complementary approaches were adopted to evaluate inequality from different perspectives. The first approach assessed spatial inequality at the source level. For each pollution source, the contribution rates to a specified risk index were ordered across sampling sites. Lorenz curves for both metrics were constructed by plotting the cumulative proportion of sites against the cumulative proportion of risk contribution using the percentage contribution rates of each source. The GISR for each source was derived as twice the area between the line of equity and the curve, enabling an independent evaluation of source-specific inequality. The second approach enabled spatial visualization of overall inequality by calculating a GISR for each sampling site based on the distribution of contribution rates from all sources to a given risk index. This site-specific GISR revealed areas where risk was dominated by a few sources versus areas where contributions were more evenly distributed.
The Lorenz curve was constructed by sorting the sampling sites in ascending order based on the selected variable (e.g., the contribution of a specific source to a risk index). The cumulative proportion of sites (x-axis) was plotted against the cumulative proportion of the variable (y-axis). The GISR was calculated as:
where SB represents the area under the Lorenz curve, calculated using the trapezoidal rule:
n is the total number of sites, Xi is the cumulative proportion of sites up to the i-th site, and Yi is the cumulative proportion of the variable at the i-th site. A higher GISR indicates greater inequality in the distribution of the risk contribution. The spatial representation of the GISR for source-specific risk assessment was generated using inverse distance weighting (IDW) interpolation in ArcGIS (version 10.8.1) [53].
3. Results and Discussion
3.1. Pollution Assessment of PTEs in Atmospheric Deposition
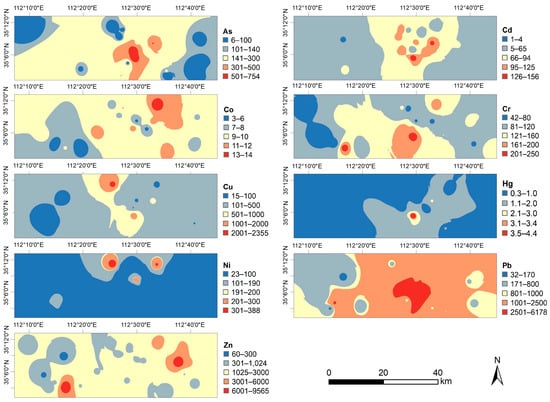
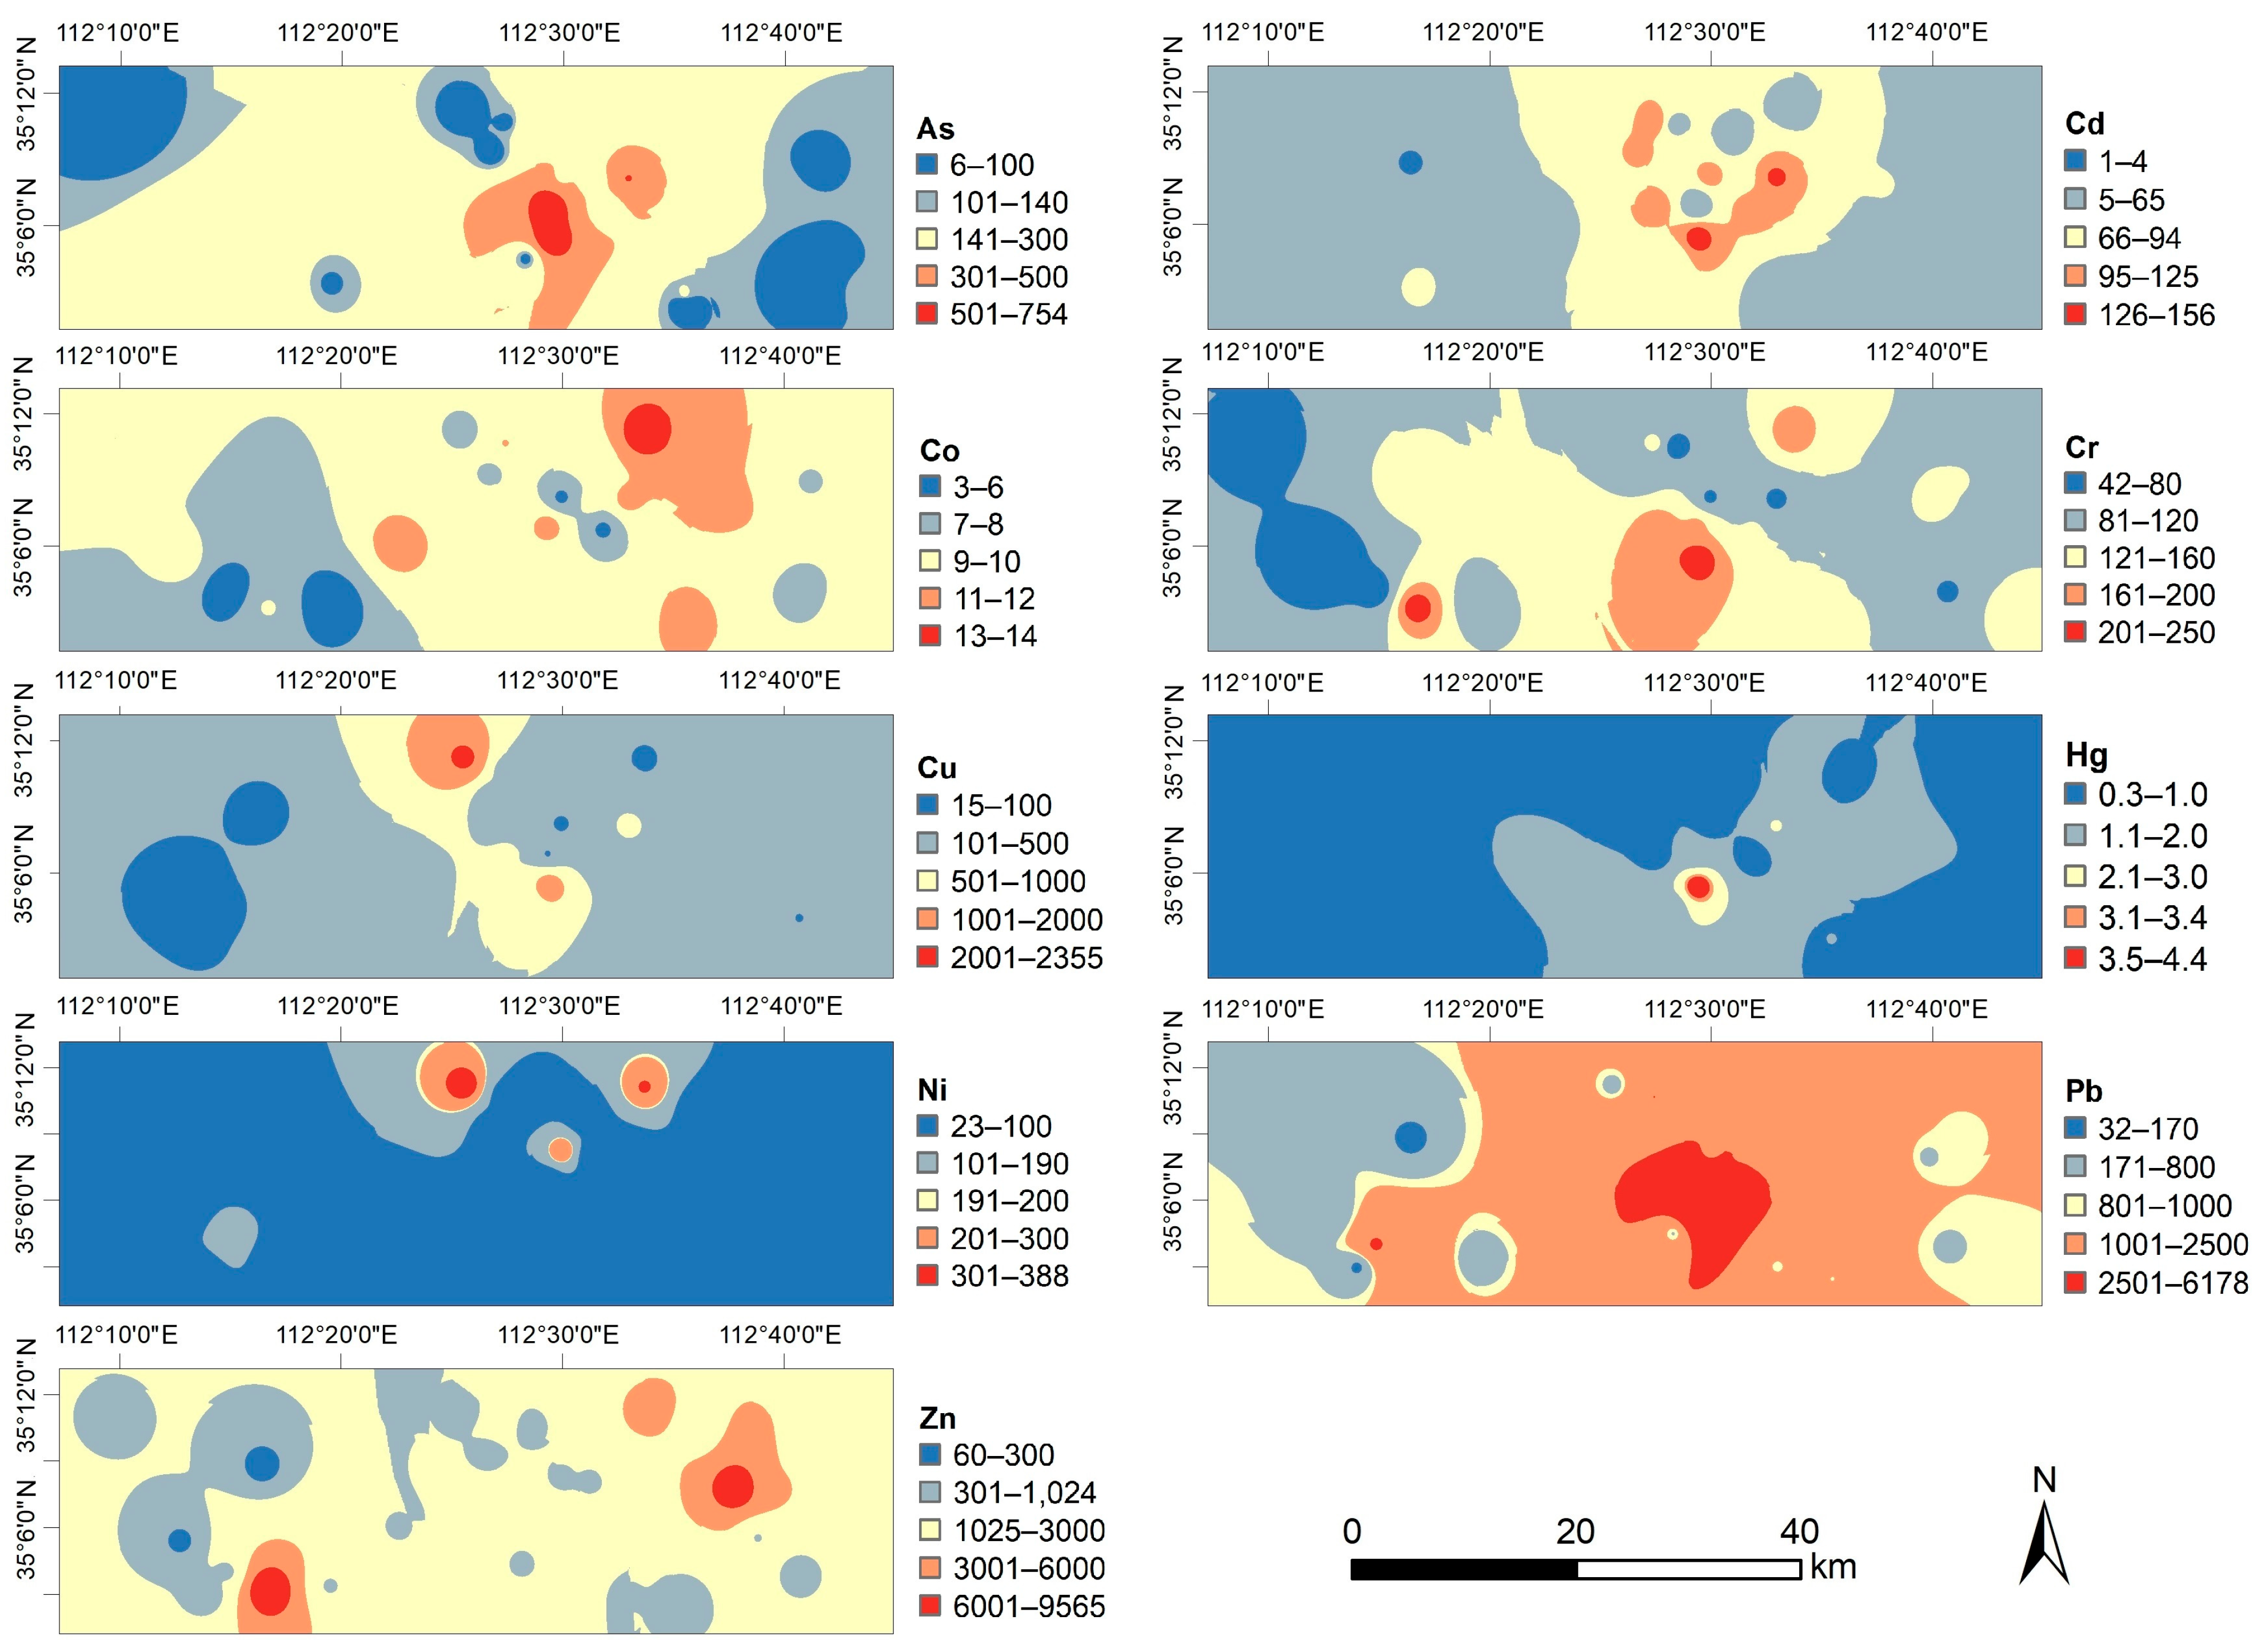
The descriptive statistics and the spatial distribution patterns of PTE concentrations in atmospheric deposition were summarized in Figure 2 and Table S4. The mean concentrations followed the descending order: Pb (1711.36 mg kg−1) > Zn (1445.03 mg kg−1) > Cu (249.84 mg kg−1) > As (179.86 mg kg−1) > Cr (111.81 mg kg−1) > Ni (94.44 mg kg−1) > Cd (61.00 mg kg−1) > Co (8.00 mg kg−1) > Hg (1.12 mg kg−1). Compared with the corresponding screening values derived from the Chinese soil environmental quality standard [54], the mean concentrations of Cd, Pb, As, and Zn exhibited substantial exceedances, with Cd being the most pronounced (approximately 102 times the reference value), followed by Pb (10.1 times), As (7.2 times), and Zn (4.8 times). In contrast, the mean concentrations of Co, Cr, Ni, and Hg were generally below their respective reference values. The coefficients of variation (CV) for all elements exceeded 36%, indicating high variability across sampling sites. Notably, As, Cd, Cu, Hg, Ni, Pb and Zn exhibited extremely high variability (CV > 80%), suggesting strong spatial heterogeneity and potential influence from localized anthropogenic sources. The elevated mean concentrations and high coefficients of variation for As, Pb, Zn, Cu, and Cd point to a shared origin likely affected by industrial activities. In contrast, Co and Cr showed lower variability, indicating a more uniform distribution and possible natural origins. Spatially, high concentrations of several metals were concentrated in industrial zones, with some elements showing broader dispersion and others more localized patterns. Zinc was notably elevated in an eastern residential-mixed area, which may be related to nearby industrial or traffic emissions. Co, Cr, and Ni showed limited spatial variation, implying minimal industrial influence. The unusually elevated concentrations of Cd, Pb and As are consistent with previous findings that deposition fluxes in smelting areas substantially exceed background levels [29].
Figure 2.
Spatial distribution of PTE concentrations in atmospheric deposition.
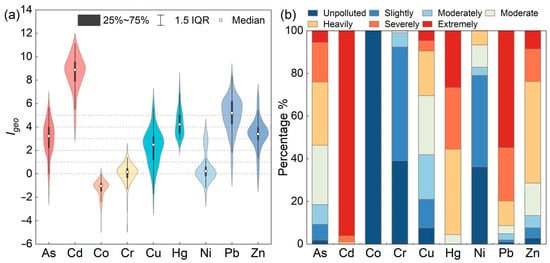
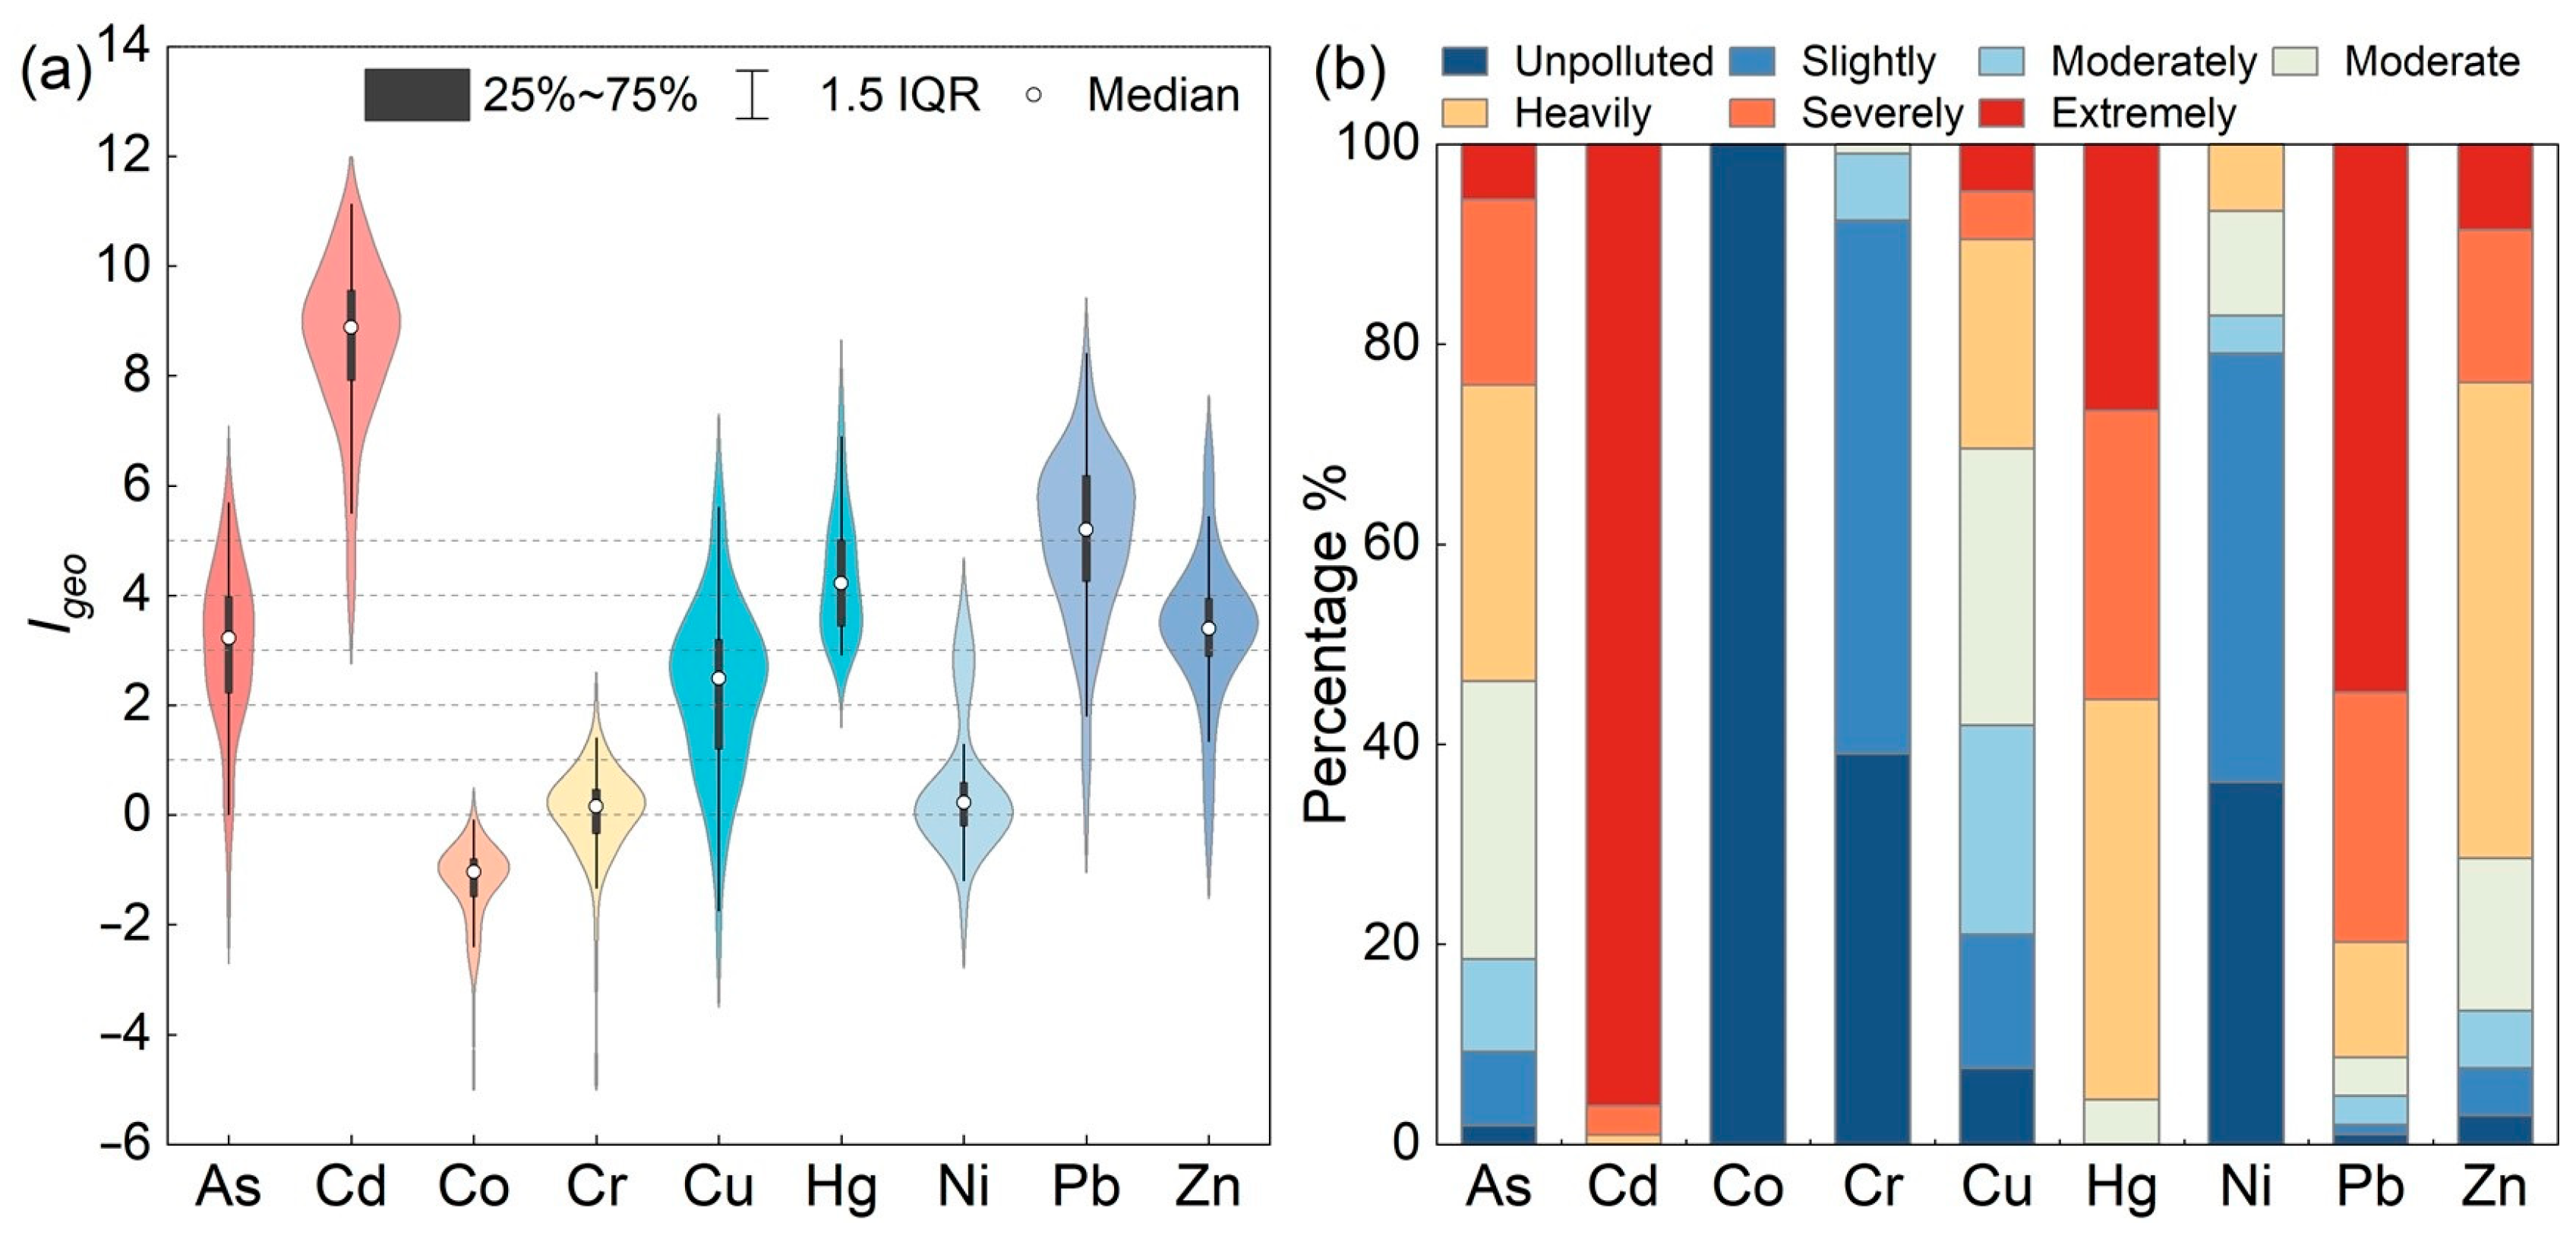
The Igeo values and the corresponding proportions of pollution levels were presented in Figure 3a,b. The mean Igeo values of PTEs in atmospheric deposition across the study area followed the order: Cd (8.60) > Pb (5.03) > Hg (4.36) > Zn (3.35) > As (3.02) > Cu (2.26) > Ni (0.52) > Cr (0.04) > Co (−1.26). According to the Igeo classification, Cd and Pb exhibited mean values exceeding 5, indicating extreme pollution. As, Hg, and Zn were categorized as the moderately to heavily and heavily polluted categories, while Cu was classified as moderately polluted. Cr and Ni were classified as slightly polluted, and Co was unpolluted. The proportions of sampling sites classified as moderately polluted or higher for each element were summarized as follows. For Cd, 96% of sites fell into the extremely polluted category, indicating the most severe contamination among all elements. Both Pb and Hg exhibited severe contamination, with over 90% of sampling sites reaching at least heavily polluted levels. As, Cu, and Zn displayed broader distributions across moderate to extreme pollution levels, accounting for 81.49%, 58.09%, and 86.67% of sampling sites, respectively, reflecting strong spatial heterogeneity. In contrast, Co remained unpolluted across all sampling sites, while Cr and Ni were primarily concentrated in the unpolluted to slightly polluted categories. The similar pollution patterns of Co, Cr, and Ni suggested a common origin, likely influenced by natural background sources. In contrast, the elevated Igeo values and broad spatial distribution of Cd, Pb, Hg, As, Zn, and Cu indicate substantial anthropogenic interference, primarily from industrial activities. Overall, Cd exhibited the most severe pollution in atmospheric deposition, while Co, Cr, and Ni showed minimal enrichment.
Figure 3.
(a) Geo-accumulation index (Igeo) of PTEs in atmospheric deposition; (b) Proportions of PTEs across different pollution levels.
3.2. Source Apportionment of PTEs in Atmospheric Deposition
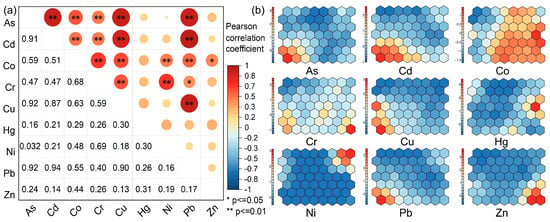
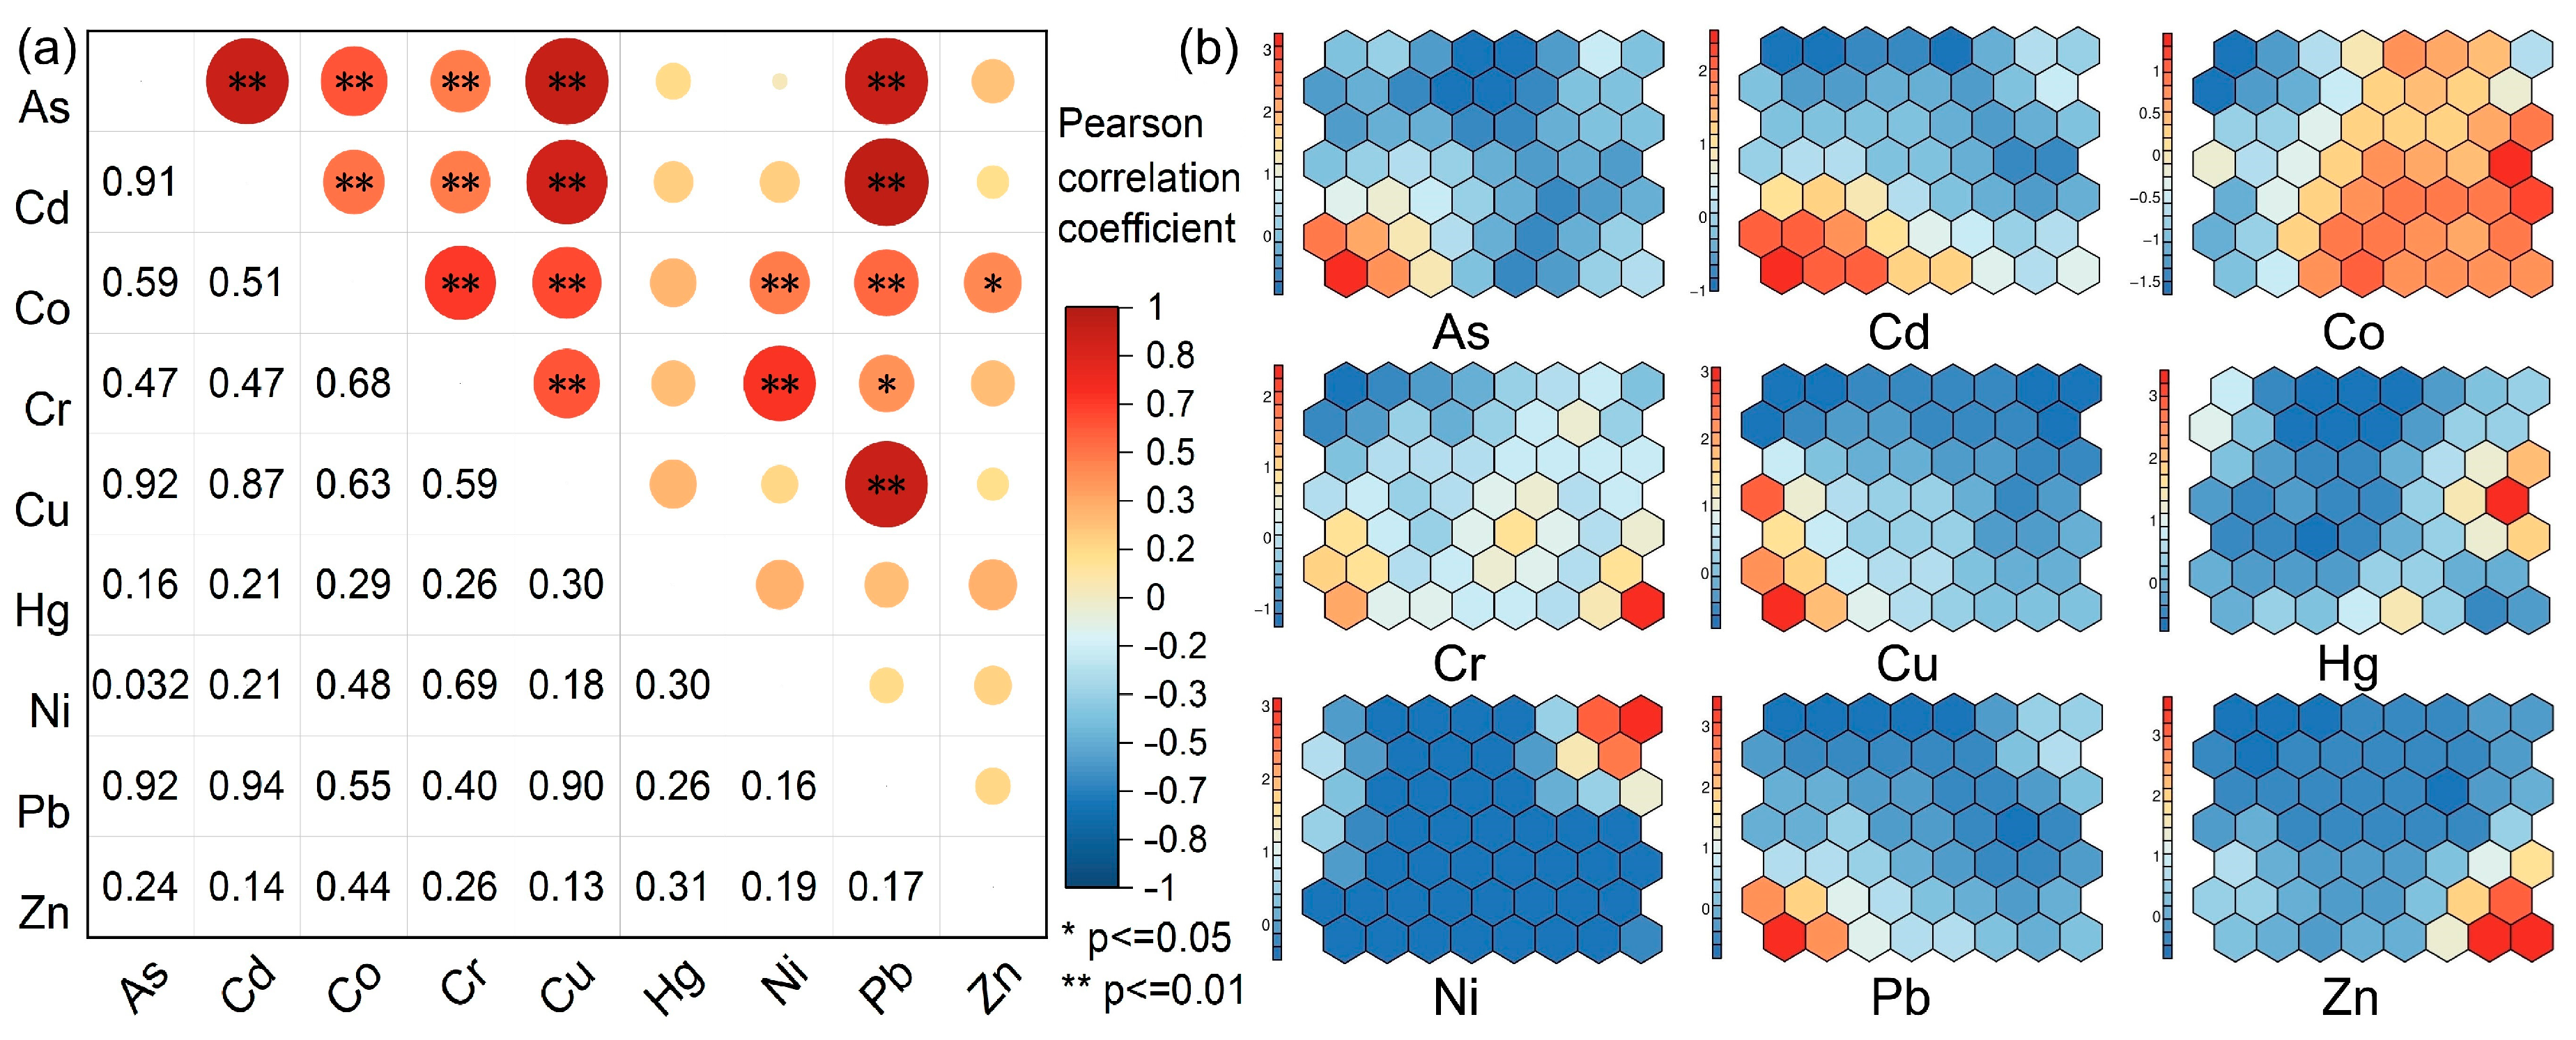
Correlation analysis was used to preliminarily identify the relationships among PTEs and their potential common origins. As shown in Figure 4a, the correlation coefficients and significance levels indicated that As, Cd, Cu, and Pb exhibited significant positive correlations with one another, with correlation coefficients ranging from 0.87 to 0.94 at a significance level of p < 0.01. This result demonstrated a high degree of commonality among these four elements, suggesting that they were likely influenced together by anthropogenic activities. Similarly, Co, Cr, and Ni were also significantly positively correlated with each other, with correlation coefficients between 0.48 and 0.68 (p < 0.01). Considering the previously observed low geoaccumulation index values, most of which were below the slight pollution level, it was inferred that these three elements originated primarily from natural parent materials. Notably, 20% of the sampling sites showed Ni concentrations above the moderate pollution level, hinting at a certain degree of anthropogenic influence on Ni. In contrast, Hg and Zn exhibited weak correlations with most other elements. Together with their geoaccumulation index pollution levels, this suggested that the sources of Hg and Zn were likely a mixture of both anthropogenic and natural inputs. In summary, the correlation analysis grouped the elements into three categories. The As–Cd–Cu–Pb group was attributed to anthropogenic sources, the Co–Cr–Ni group to natural sources, and the Zn–Hg group to mixed sources, whose specific origins required further investigation.
Figure 4.
Correlation analysis (a) and SOM result (b) of PTEs in atmospheric deposition.
The SOM feature plane for the nine metal elements in atmospheric deposition from the study area was presented in Figure 4b. In the resulting maps, similar colors indicated positive correlations between elements, whereas color differences denoted negative correlations. The SOM arranged the elements into 56 hexagonal neural network units in an 8-column by 7-row configuration. Based on hierarchical clustering, these units were classified into four groups: Group I (As, Cd, Cu, Pb) showed a gradual increase in content from the lower right to the upper left; Group II (Cr, Pb, Zn) exhibited an overall increase from the upper left to the lower right, with high values concentrated in the lower right; Group III (Co, Cr, Ni) displayed high concentrations in the central and upper right regions; and Group IV (Co, Hg) had maximum values on the right side of the plane, decreasing toward the left. This classification was consistent with the correlation analysis, confirming the effectiveness of SOM in elucidating spatial variations in element concentrations.
Further analysis divided the 56 neural network units into four clusters (Figure S1). Cluster I, located in the lower left of the SOM plane, corresponded to industrial areas (e.g., metal smelting and processing) and was interpreted as an industrial source. Cluster II, situated in the central and lower left portions, covered areas with dense national roads, highways, and railways, and was thus identified as a traffic-influenced source. Cluster III exhibited high loadings for Co, Cr, and Ni on the respective feature planes. However, the low coefficients of variation and low accumulation indices suggested a dominant geological background with limited anthropogenic disturbance. Therefore, Cluster III was attributed to a natural parent material source. Cluster IV, located on the right side of the feature plane, showed high Hg concentrations and encompassed areas with industrial, mining, and traffic activities. Given its association with coal combustion, traffic emissions, and non-ferrous metal smelting, Cluster IV was interpreted as a mixed source from fuel combustion. In summary, integrating correlation analysis and SOM results, the nine metal elements were grouped into four sources, with Cluster I (As, Cd, Cu, Pb) representing an industrial source, Cluster II (Zn) representing a traffic-influenced source, Cluster III (Co, Cr) representing a natural parent material source, and Cluster IV (Hg) representing a mixed source from fuel combustion.
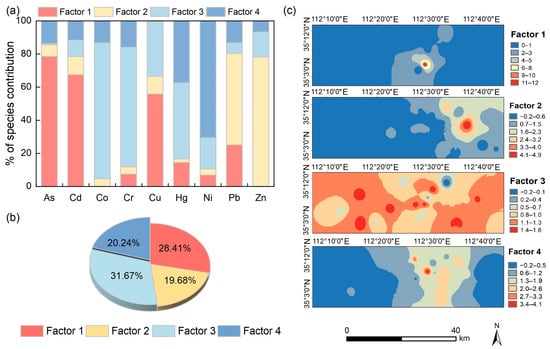
Correlation analysis and SOM provided preliminary elemental relationships. To accurately quantify source contributions, PMF 5.0 was then applied after excluding outliers. To determine the optimal number of factors we tested factor numbers from 3 to 5 and performed 20 iteration runs with random seeds. The results indicated that when the factor number was set to 4 the values of Qrobust and Qtrue stabilized and converged to their minimum (Table S5). The R2 correlation coefficient values for As, Cd, Co, Cr, Cu, Hg, Ni, Pb, and Zn were 0.64, 0.67, 0.77, 0.28, 0.67, 0.07, 0.79, 0.95, and 0.98, respectively. The relatively low R2 values for Hg and Cr are attributed to their high spatial variability. Furthermore, the four-factor model exhibited the highest proportions of scaled residuals within the −3 to 3 range among the three tested solutions with As reaching 100% and most elements exceeding 80% (Table S6). This demonstrates that the selected four factors provide a robust and reasonable interpretation for the source apportionment of PTEs in atmospheric deposition.
The source profiles of the resolved factors, their percentage contributions to total PTE concentrations, and their spatial distributions were shown in Figure 5a and Figure 5b and Figure 5c, respectively. Factor 1 exhibited the highest contributions for As (78.50%), Cd (67.50%), and Cu (55.80%), and a moderate contribution for Pb (25.10%), indicating typical industrial emission characteristics. High values of Factor 1 were located in the northwestern and southwestern parts of the main urban area, a pattern that generally coincided with the distribution of key monitored enterprises in the study area and showed a tendency to form contiguous patches. In general, industrial emissions contribute to PTEs in atmospheric deposition primarily in densely populated areas such as towns and industrial parks. Previous studies have identified steel smelting emissions and industrial activities as major sources of As, Cd, and Cu in atmospheric deposition [55,56]. The classification of this factor was highly consistent with the results of the correlation analysis and the geoaccumulation index (Igeo) assessment, collectively confirming that As, Cd, Cu, and Pb are mainly derived from industrial activities.
Figure 5.
Source apportionment results: (a) source profiles of identified factors, (b) contribution percentages of each factor to total PTE concentrations, and (c) spatial distribution of factor contributions.
Factor 2 was dominated by Zn (78.30%) and Pb (55.20%), with all other elements contributing less than 11%. Zn and Pb are typical tracers of traffic-influenced sources, including tire wear, brake pad wear, and vehicle exhaust. Spatially, high concentrations of Factor 2 were mainly concentrated in the urban area and its northeastern part, which precisely coincided with the dense distribution of urban roads, railways, highways, and national roads. The sub-high areas also exhibited considerable spatial continuity. Previous studies also confirmed that Cu, Fe, Mn, and Pb are typically found in brake wear dust, with Pb also arising from motor and fuel oil combustion, and that Fe, Zn, and K are associated with tailpipe emissions [57,58,59]. This factor was also consistent with the Igeo assessment of Zn, further confirming that Zn and Pb originate primarily from traffic-related pollution.
Factor 3 showed very high contributions of Co (82.00%) and Cr (72.30%), as well as moderate contributions of Cu (33.50%), Hg (46.00%), and Ni (18.90%). Spatially, high values of Factor 3 were continuously distributed, remaining at relatively high levels throughout the study area, and were mainly concentrated in the western region with less human impact and the southeastern part of the main urban area. The Igeo assessment indicated that Co and Cr were mostly unpolluted to slightly polluted, with low coefficients of variation, suggesting limited anthropogenic disturbance and a predominantly natural parent material origin. Although Co and Cr align with the regional background, the moderate contributions of Hg and Cu indicate a partial anthropogenic overlay. Therefore, Factor 3 is qualified as a predominantly geogenic source with minor anthropogenic disturbance, where Hg and Cu primarily reflect baseline concentrations in resuspended regional surface soil from historical deposition. Previous studies have shown that elements such as Cr, Ni, and Co generally originate from natural parent materials, whereas Cu, Zn, and Pb are mainly derived from anthropogenic emissions [36,57].
Factor 4 was characterized by prominent contributions of Ni (70.60%) and Hg (37.30%), with lower contributions from Co, Cr, and As. Ni is closely associated with industrial sectors like electroplating and alloy production, whereas Hg primarily originates from industrial coal combustion and non-ferrous metal smelting [60]. The spatial distribution of Factor 4 peaked in traffic corridors industrial parks and urban centers and this multi-region pattern strongly corroborates its mixed source characteristics. This factor corresponded to the Igeo assessment, which showed moderate Ni pollution at some sites. The previous literature has confirmed that elements such as Cu, Hg, Cr, and Co are mainly derived from coal combustion [12,61]. Another PMF modeling study identified fossil fuel combustion as a source contributing 25.75%, with Ni and Hg as key indicator elements [12]. Combined with its spatial distribution pattern, Factor 4 was interpreted as a mixed source from fuel combustion and industrial activities.
In summary, the PMF source apportionment results were highly consistent with the correlation analysis and Igeo assessment. The contribution hotspots of the four factors were mainly concentrated in the eastern urban area and industrial zones of the study region. Specifically, as shown in Figure 5b, Factor 1 was identified as an industrial source, accounting for 28.41% of the total PTE concentrations with As, Cd, Cu, and Pb as its main loading elements. Factor 2 was inferred as a traffic-influenced source, contributing 19.68% and dominated by Zn and Pb. Factor 3 represented a natural parent material source, which contributed the largest proportion of 31.67% with Co and Cr as its primary elements. Factor 4 was considered a mixed source from fuel combustion, contributing 20.24% with Ni and Hg as the main loading elements.
3.3. Risk Assessment
The average contribution rates of PTEs to the IERI followed the order Cd (95.12%) > As (2.25%) > Pb (1.54%) > Hg (0.44%) > Cu (0.35%) > Zn (0.16%) > Ni (0.07%) > Co (0.04%) > Cr (0.03%), with Cd dominating the ecological risk. Among the extreme risk samples Cd accounted for 94.74%, while As and Pb were present in 64.47% and 44.74% of the samples from moderate to extreme risk levels, respectively and other metals occurred in over 96% of the low-risk samples (Table S7). For the HI, the contribution order was As > Pb > Cd > Cr > Cu > Zn > Ni > Hg > Co for both children and adults, with As and Pb together contributing over 88% (Tables S8 and S9). Children exhibited a much higher chronic toxicity risk (59.80%) than adults (25.80%), and the child chronic risk for As was 2.3 times that of adults, indicating that children face a higher chronic risk requiring priority attention. For the TCR, the order was As (66.35%) > Cr (19.02%) > Cd (9.37%) > Co (1.80%) > Ni (1.74%) > Pb (1.72%), with As being the dominant contributor. The overall TCR assessment showed that 97.37% of sites had negligible risk and 2.63% had acceptable risk, with no unacceptable risk observed (Table S10). In conclusion, Cd is the primary driver of ecological risk, As and Pb are the key control elements for non-carcinogenic health risks especially for children, and As dominates the carcinogenic risk but remains within acceptable limits. Priority should be given to controlling Cd, As and Pb emissions to reduce both ecological and health risks, while the current carcinogenic risk is considered acceptable. Sensitivity analysis across Cr(VI) proportions from 1% to 40% (Figure S3) confirmed that the industrial source consistently dominated the TCR and all risks remained within acceptable limits. This demonstrates the high robustness of our conclusions.
The results from ecological and health risk assessment demonstrate that Cd is the dominant contributor to IERI from atmospheric deposition, while As and Pb dominate HI, and As dominates TCR. The extreme ecological risk posed by Cd, with 94.74% of sites falling into the extreme risk category, aligns with previous findings that Cd is a highly toxic element with strong bioaccumulation potential, often enriched in atmospheric deposition near non-ferrous metal smelting areas and urban area [11,28]. The high contribution of As and Pb to HI, particularly the 2.3-fold higher chronic toxicity risk in children compared to adults, underscores the heightened vulnerability of children to PTE exposure via ingestion and dermal contact pathways, as also reported in studies from other industrial cities [13]. Interestingly, while As is the primary driver of TCR, the overall carcinogenic risk remains low, which is consistent with observations that carcinogenic risks from atmospheric deposition are generally within acceptable limits in many urban and industrial regions [49]. The fact that Co, Cr, Cu, Hg, Ni, and Zn are predominantly associated with low-risk sites suggests that their environmental and health impacts are limited, a pattern has been noted in previous source apportionment studies [39]. Overall, these findings highlight that targeted control of Cd, As, and Pb emissions, particularly from industrial and combustion sources, is essential to mitigate both ecological and health risks, while current carcinogenic risk levels are manageable under existing regulatory frameworks [12].
3.4. Source-Specific Risk Assessment
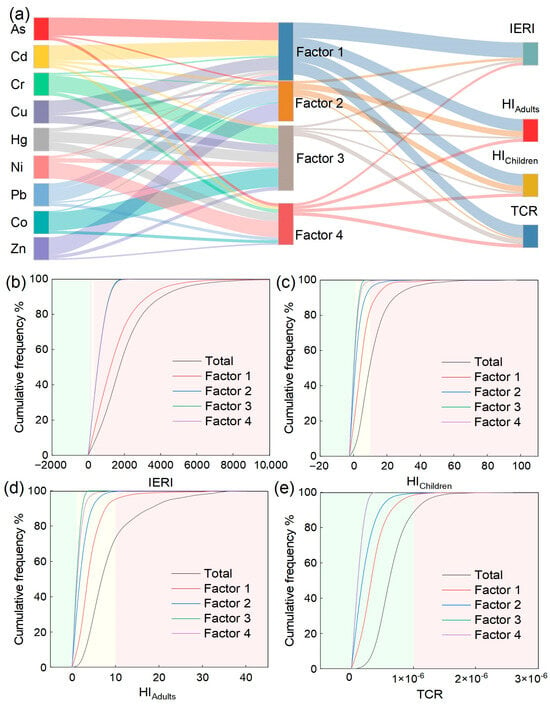
Descriptive statistics of site-specific contribution rates of four sources to risk indexes are shown in Figure 6a (Tables S11–S14 and Figure S2). The results indicated that the contribution of four sources to the IERI ranked as industrial source 67.57% followed by combustion source 11.63%, traffic source 11.01%, and natural source 9.92%. All IERI fell into the extreme risk level, where industrial, combustion, and traffic sources dominated 99.80%, 88.40%, and 46.80% of sites, respectively, while the natural source mainly influenced low to moderate risk levels. For the HI, the total contribution ranked consistently for children and adults as about 53% from industrial source, 26% from traffic source, 14% from combustion source, and 8% from natural source, and the industrial source was the primary contributor to chronic toxicity risk. For the TCR, the contributions ranked as industrial source (56.35%), natural source (20.08%), combustion source (15.33%), and traffic source (7.51%). These findings are consistent with previous studies that identified industrial emissions as the dominant driver of ecological and non-carcinogenic health risks in PTE contaminated regions [39], while industrial sources also contribute significantly to carcinogenic risk due to the high carcinogenic potency and contribution rates of As [62]. Therefore, priority should be given to reducing industrial and combustion source emissions to mitigate the extreme ecological risk and chronic toxicity risk observed in this study.
Figure 6.
Source-oriented ecological and health risk assessment: contributions of PTEs to sources and risk indicators (a), probability distributions of the integrated ecological risk index (IERI) (b), non-carcinogenic hazard index for children (HIChildren) (c) and adults (HIAdults) (d), and carcinogenic risk (TCR) (e).
The simulated cumulative probability distributions of source contributions to different risk levels based on Monte Carlo simulation are illustrated in Figure 6b–e and summarized in Figure S2. For ecological risk, the extreme risk class covered 99.20% of all sites and the industrial source provided 96.20% of the class-internal contribution while traffic, natural, and combustion sources primarily contributed to high and considerable risk levels. For non-carcinogenic health risk in children, the industrial source dominated potential risk at 94.60%, whereas the natural source mainly fell into negligible risk at 90.20%. For children, chronic toxicity risk (HI > 10) accounted for 59.80% of the total, with the industrial source contributing 21.20% and the traffic source 6.40% to this level, while the natural source remained largely negligible. Carcinogenic risk was predominantly negligible at 89.20% with the industrial source showing 98.80% negligible risk and the remaining 1.20% falling into the acceptable category. In conclusion, the industrial source was the primary driver of extreme ecological risk and potential non carcinogenic risk, while natural and traffic sources play secondary roles. Priority control measures should target industrial emissions to effectively reduce both ecological and health risks.
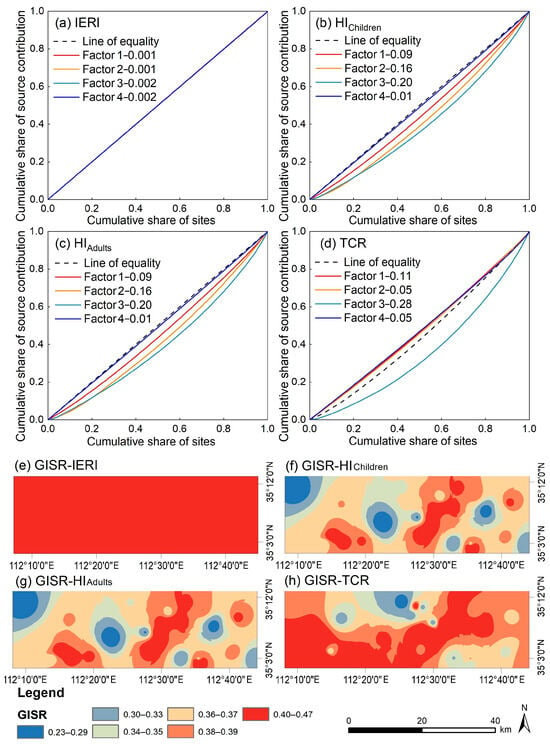
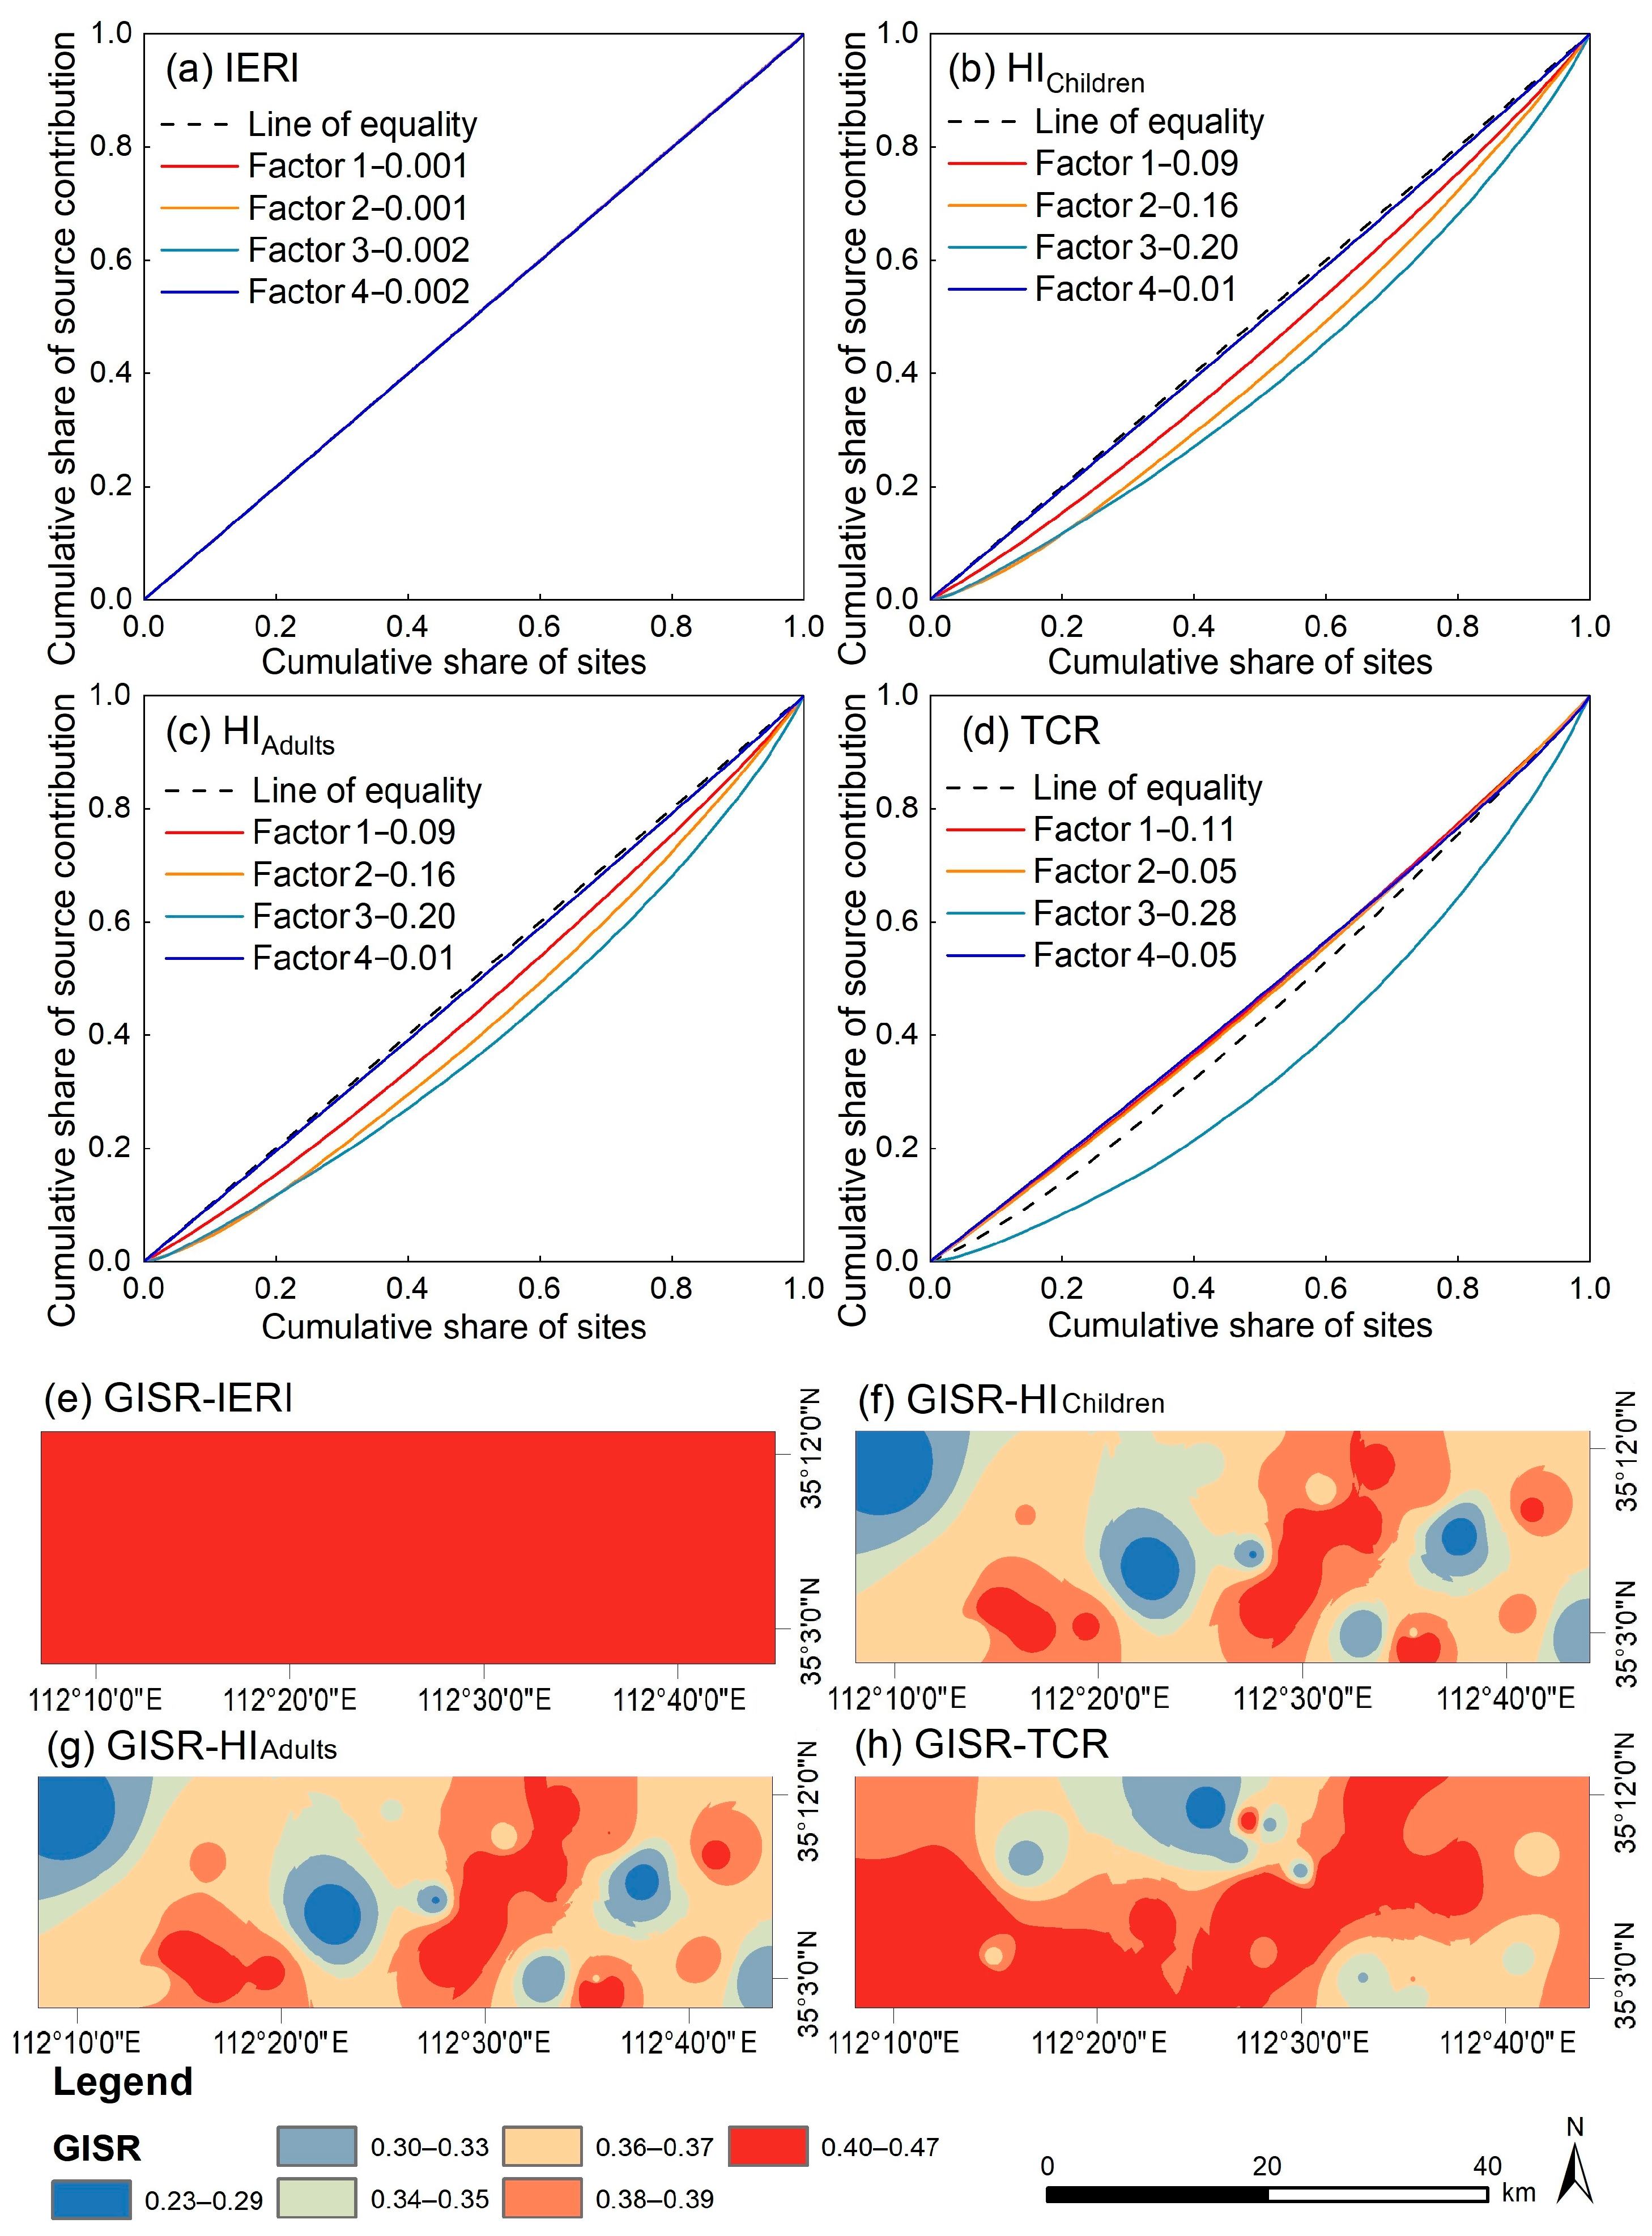
3.5. Spatial Inequality of Source-Specific Risks
As shown in Figure 7a–d, the spatial GISR values of the contribution rates of each source to the four risk indices were examined. For the IERI, the GISR values were extremely low (≤0.002), indicating a highly uniform spatial distribution of ecological risk contributions with negligible inequality. For HIChildren and HIAdults, the GISR values of the natural source (0.20) and traffic source (0.16) were markedly higher than those of the industrial source (0.09) and combustion source (0.01), suggesting moderate spatial heterogeneity of these two sources for non-carcinogenic health risks. For the TCR, the industrial source (0.11) and natural source (0.28) exhibited significantly higher GISR values than the traffic source (0.05) and combustion source (0.05). This pattern differs somewhat from that observed for non-carcinogenic risks, mainly because the carcinogenic risk assessment focuses only on a subset of elements (As, Cd, Co, Cr, and Ni), leading to source-specific differences in risk contribution. Overall, the GISR values of source-level contributions were generally low spatial inequality. Nevertheless, the natural and traffic sources showed relatively higher GISR values, reflecting a certain degree of spatial unevenness in their contributions to non-carcinogenic health risks.
Figure 7.
Lorenz curves (a−d) and spatial distribution of site-specific Gini indices (GISR) (e−h) for source-specific ecological and health risks.
Figure 7e–h illustrate the spatial GISR values of the four risk indices computed from the relative contribution rates of the four sources at each site. The results showed that the mean site-level GISR for IERI was 0.43 which indicates a highly homogeneous risk structure rather than true spatial inequality as a single source dominated all sites. This finding corresponds with the previously reported ranking of source contributions to total IERI. The mean GISR for HI for both children and adults were 0.37 with a range of 0.23 to 0.58, demonstrating strong spatial heterogeneity in source contributions to non-carcinogenic health risks. The hot spots of these GISR for HI were consistent with the overlay results of anthropogenic sources including industrial, traffic, and combustion sources identified in the previous source apportionment, and were mainly distributed in the eastern urban area and industrial zones (Figure 5c). The mean GISR for TCR was 0.37 with a range of 0.29 to 0.49, indicating notable spatial unevenness in source contributions to total carcinogenic risk. It should be emphasized that GISR measures relative inequality rather than absolute risk magnitude. For instance, the natural source exhibits a high GISR (0.28) but a relatively low absolute TCR contribution (20.08%) indicating localized hotspots rather than widespread high risk.
In summary, the spatial disparity in source contributions was largest and uniformly high across the region for integrated ecological risk, whereas non-carcinogenic and carcinogenic risks exhibited moderate overall inequality but with localized hot spots of high inequality. This pattern highlights the utility of the GISR as a spatial inequality metric, which has been increasingly applied in assessing the inequality in urban greenspace exposure [51,52]. Therefore, the GISR can quantify the degree of spatial imbalance in risk distribution and help managers identify high-risk hot spots. For risk types with a high GISR such as IERI, precise control measures should be prioritized in areas with concentrated contributions. For health risks with a moderate GISR but locally high values, differentiated spatial intervention strategies should be developed based on hot spot distributions to improve resource utilization efficiency and governance effectiveness in pollution control.
3.6. Limitations and Perspectives
This study integrated PMF source apportionment, ecological and health risk assessments, and the Gini index to systematically characterize PTE pollution in atmospheric deposition, identify source contributions, and evaluate spatial inequality in a typical industrial city, thereby providing a scientific basis for developing differentiated risk control strategies. Nevertheless, several limitations should be addressed in future research. First, the potential influence of seasonal meteorological conditions such as precipitation, wind direction, and wind speed on PTE deposition was not fully considered. Future work should conduct continuous sampling with higher temporal resolution and incorporate backward trajectory modeling to resolve regional transport contributions. Second, uncertainties remain in the PMF source apportionment due to overlapping loadings and the empirical factor number. Although the limited sample size restricts full uncertainty propagation the highly stable profiles from multiple random seed runs ensure robust source rankings and GISR values. Therefore, isotopic fingerprinting should be introduced in future studies to disentangle these competing sources and differentiate baseline geogenic hazards from active anthropogenic risks. Future studies should include key crustal tracers such as Al, Fe, and Si to improve the discrimination between natural soil dust and anthropogenic sources. Third, the IDW interpolation only illustrates general spatial trends rather than precise local concentrations meaning GISR maps are not exact risk boundaries. Although highly stable factor profiles ensure robust rankings limited sample sizes restrict full PMF uncertainty propagation into GISR. Moreover, due to limitations in the model framework and available carcinogenic potency factors, the carcinogenic risk assessment only considered the inhalation pathway, which should be expanded in the future.
The proposed assessment framework based on source contribution, risk level, and spatial inequality is flexible and can be applied to spatial diagnosis and priority control area identification for PTE pollution in various media such as soil, water, and atmospheric deposition. Given that industrial and combustion sources were identified as the dominant contributors to extreme ecological risk and chronic toxicity risk, management authorities should implement precise control strategies following the approach of source reduction, process interruption, and exposure isolation, particularly in the eastern urban area and industrial zones, while strengthening health protection for sensitive populations such as children. Furthermore, the Gini index revealed a high degree of spatial inequality in ecological risk contributions, indicating an extremely uneven distribution of source contributions. Future studies should integrate geographical detectors or spatial regression models to quantitatively disentangle how driving factors such as industrial layout, road network density, and population distribution contribute to risk inequality, thereby supporting the development of pollution control policies based on environmental justice. The methodological framework of this study can also serve as a reference for risk management of environmental pollution in other contexts.
4. Conclusions
In this study, a comprehensive framework integrating PMF source apportionment, ecological and health risk assessments, and the GISR was developed to characterize PTE pollution in atmospheric deposition, quantify source contributions, and evaluate spatial inequality of source-specific risks in a typical industrial city. The results revealed that Cd, Pb, As, and Zn were the most enriched elements, with Cd demonstrating extreme pollution levels at 96% of the sampling sites. Four principal sources of pollution were identified: industrial (accounting for 28.41% of total metal concentrations), traffic (19.68%), natural (31.67%), and combustion (20.24%). Cd dominated the IERI with a contribution of 95.12%, and 94.74% of sites fell into the extreme risk level. For non-carcinogenic health risks, As and Pb together contributed over 88% of the HI, with children experiencing a 2.3-fold higher chronic toxicity risk compared to adults. Although the TCR was primarily influenced by As, it remained within acceptable limits across all sites. Source-specific apportionment indicated that industrial and combustion sources were the main drivers of extreme ecological risk affecting 99.80% and 88.40% of sites, respectively and chronic toxicity risk with industrial sources also dominating the overall carcinogenic risk. The GISR analysis revealed that source contributions to the IERI exhibited a uniform structural dominance, with a mean GISR value of 0.43. Meanwhile, non-carcinogenic and carcinogenic risks exhibited moderate overall inequality, characterized by localized hot spots in the eastern urban area and industrial zones. These findings highlight that emission control should prioritize industrial and combustion sources through source reduction, process interruption, and exposure isolation while paying special attention to protecting children. The proposed GISR metric effectively quantifies spatial risk inequality and identifies high-priority areas, offering a transferable tool for evidence-based environmental management in other industrial regions.
Supplementary Materials
The following supporting information can be downloaded at: https://www.mdpi.com/article/10.3390/toxics14110968/s1. Figure S1: Graph neural unit sample size allocation and clustering diagram; Figure S2: Contribution proportions of each source to different levels of ecological and health risks; Figure S3: The relative contributions of identified sources to the total carcinogenic risk under varying Cr(VI) proportion assumptions (from 1% to 40%). Table S1: Classification of contamination levels based on the geoaccumulation index (Igeo); Table S2: Input parameters to characterize the daily exposure dose of PTEs via various exposure pathways; Table S3. Values of the reference dose (RfD, mg kg−1 d−1) and the slope factor (SF, kg d mg−1) for PTEs; Table S4: Descriptive statistics of PTE concentrations (mg kg−1) in atmospheric deposition; Table S5: Comparison of PMF model diagnostic metrics (R2 and Q values) across different factor numbers; Table S6: Percentage of scaled residuals within the ±3 range for target elements under different PMF factor solutions. Table S7: The contribution rates (%) of PTEs concentrations to ER and IERI; Table S8: Contribution rates (%) of PTEs in atmospheric deposition to non-carcinogenic risk levels for children; Table S9: Contribution rates (%) of PTEs in atmospheric deposition to non-carcinogenic risk levels for adults; Table S10: Contribution rates (%) of carcinogenic PTEs in atmospheric deposition to the carcinogenic risk index; Table S11: Descriptive statistics of site-specific contribution rates (%) of the four sources to IERI; Table S12: Descriptive statistics of site-specific contribution rates (%) of the four sources to HIChildren; Table S13: Descriptive statistics of site-specific contribution rates (%) of the four sources to HIAdults; Table S14: Descriptive statistics of site-specific contribution rates (%) of the four sources to TCR.
Author Contributions
Conceptualization, Y.Z. and L.H.; methodology, Y.Z.; software, S.S.; validation, W.F.; formal analysis, Y.Z.; investigation, Y.Z. and W.F.; resources, S.S.; data curation, L.H. and W.F.; writing—original draft, Y.Z.; writing—review and editing, L.H. and W.F.; visualization, S.S.; supervision, L.H. All authors have read and agreed to the published version of the manuscript.
Funding
This research was funded by the National Natural Science Foundation of China (grant number U20A2087), the Science and Technology Research Plan Program of Henan Province (grant number 232102320137), and the Key Science Research Program Foundation of High Education Schools of Henan Province (grant number 23B610010).
Institutional Review Board Statement
Not applicable.
Informed Consent Statement
Not applicable.
Data Availability Statement
The data presented in this study are available on request from the corresponding author. (please specify the reason for restriction, e.g., the data are not publicly available due to privacy or ethical restrictions.)
Conflicts of Interest
The authors declare no conflicts of interest.
References
- Ali-Taleshi, M.S.; Feiznia, S.; Masiol, M. Seasonal and spatial variations of atmospheric depositions-bound elements over Tehran megacity, Iran: Pollution levels, PMF-based source apportionment and risks assessment. Urban Clim. 2022, 42, 101113. [Google Scholar] [CrossRef] [Scilit]
- Kim, G.; Lee, J.; Lee, M.; Kim, D. Impacts of urbanization on atmospheric circulation and aerosol transport in a coastal environment simulated by the WRF-Chem coupled with urban canopy model. Atmos. Environ. 2021, 249, 118253. [Google Scholar] [CrossRef] [Scilit]
- Feng, W.; Guo, Z.; Xiao, X.; Peng, C.; Shi, L.; Ran, H.; Xu, W. Atmospheric deposition as a source of cadmium and lead to soil-rice system and associated risk assessment. Ecotoxicol. Environ. Saf. 2019, 180, 160–167. [Google Scholar] [CrossRef] [Scilit] [PubMed]
- Li, C.; Zhang, C.; Yu, T.; Liu, X.; Xia, X.; Hou, Q.; Yang, Y.; Yang, Z.; Wang, L. Annual net input fluxes of cadmium in paddy soils in karst and non-karst areas of Guangxi, China. J. Geochem. Explor. 2022, 241, 107072. [Google Scholar] [CrossRef] [Scilit]
- Shi, T.; Ma, J.; Wu, X.; Ju, T.; Lin, X.; Zhang, Y.; Li, X.; Gong, Y.; Hou, H.; Zhao, L.; et al. Inventories of heavy metal inputs and outputs to and from agricultural soils: A review. Ecotoxicol. Environ. Saf. 2018, 164, 118–124. [Google Scholar] [CrossRef] [Scilit] [PubMed]
- Song, Y.; Wang, M.; Xie, T.; Wang, Y.; Chen, X.; Chen, W. Atmospheric Deposition and Flood Inputs Dominate Paddy Soil Cadmium Accumulation in Southern China: A Multi-Process Model Coupling Input and Output Pathways. J. Hazard. Mater. 2025, 502, 140953. [Google Scholar] [CrossRef] [Scilit] [PubMed]
- Feng, W.; Guo, Z.; Peng, C.; Xiao, X.; Shi, L.; Zeng, P.; Ran, H.; Xue, Q. Atmospheric bulk deposition of heavy metal(loid)s in central south China: Fluxes, influencing factors and implication for paddy soils. J. Hazard. Mater. 2019, 371, 634–642. [Google Scholar] [CrossRef] [Scilit] [PubMed]
- Zhong, J.; Kong, L.; Anaman, R.; Peng, C. A regional mass balance model for spatially predicting cadmium critical loads in paddy soil under management scenarios. J. Hazard. Mater. 2025, 495, 138968. [Google Scholar] [CrossRef] [Scilit] [PubMed]
- Zhu, C.; Li, J.; Chai, Y.; Zhang, Y.; Li, Y.; Zhang, X.; Liu, J.; Li, Y. Synergistic Cr(VI) Reduction and Chloramphenicol Degradation by the Visible-Light-Induced Photocatalysis of CuInS2: Performance and Reaction Mechanism. Front. Chem. 2022, 10, 964008. [Google Scholar] [CrossRef] [Scilit] [PubMed]
- Liu, S.; Cui, J.; Huang, J.; Tian, B.; Jia, F.; Wang, Z. Facile one-pot synthesis of highly fluorescent nitrogen-doped carbon dots by mild hydrothermal method and their applications in detection of Cr(VI) ions. Spectroc. Acta Pt. A.-Molec. Biomolec. Spectr. 2019, 206, 65–71. [Google Scholar] [CrossRef] [Scilit] [PubMed]
- Feng, D.; Gong, P.; Li, Y.; Li, N.; Dong, Z.; Zhu, Z.; Jiang, R.; Deng, S. Risk assessment and source apportionment of heavy metals pollution from atmospheric deposition in Nanjing, China. Heliyon 2023, 9, e18858. [Google Scholar] [CrossRef] [Scilit] [PubMed]
- Liu, S.; Wu, T.; Wang, Q.; Zhang, Y.; Tian, J.; Ran, W.; Cao, J. High time-resolution source apportionment and health risk assessment for PM2.5-bound elements at an industrial city in northwest China. Sci. Total Environ. 2023, 870, 161907. [Google Scholar] [CrossRef] [Scilit] [PubMed]
- Weerasundara, L.; Magana-Arachchi, D.N.; Ziyath, A.M.; Goonetilleke, A.; Vithanage, M. Health risk assessment of heavy metals in atmospheric deposition in a congested city environment in a developing country: Kandy City, Sri Lanka. J. Environ. Manag. 2018, 220, 198–206. [Google Scholar] [CrossRef] [Scilit] [PubMed]
- Hossain Bhuiyan, M.A.; Chandra Karmaker, S.; Bodrud-Doza, M.; Rakib, M.A.; Saha, B.B. Enrichment, sources and ecological risk mapping of heavy metals in agricultural soils of dhaka district employing SOM, PMF and GIS methods. Chemosphere 2021, 263, 128339. [Google Scholar] [CrossRef] [Scilit] [PubMed]
- Jiang, W.; Meng, L.; Liu, F.; Sheng, Y.; Chen, S.; Yang, J.; Mao, H.; Zhang, J.; Zhang, Z.; Ning, H. Distribution, source investigation, and risk assessment of topsoil heavy metals in areas with intensive anthropogenic activities using the positive matrix factorization (PMF) model coupled with self-organizing map (SOM). Environ. Geochem. Health 2023, 45, 6353–6370. [Google Scholar] [CrossRef] [Scilit] [PubMed]
- Li, X.; Liu, H.; Meng, W.; Liu, N.; Wu, P. Accumulation and source apportionment of heavy metal(loid)s in agricultural soils based on GIS, SOM and PMF: A case study in superposition areas of geochemical anomalies and zinc smelting, Southwest China. Process Saf. Environ. Prot. 2022, 159, 964–977. [Google Scholar] [CrossRef] [Scilit]
- Shi, B.; Yang, X.; Liang, T.; Liu, S.; Yan, X.; Li, J.; Liu, Z. Source apportionment of soil PTE in a northern industrial county using PMF model: Partitioning strategies and uncertainty analysis. Environ. Res. 2024, 252, 118855. [Google Scholar] [CrossRef] [Scilit] [PubMed]
- Wu, J.; Wang, H.; Han, Z.; Shu, Y.; Huang, X.; Zhong, Q.; Li, R.; Fan, Z. Application of a PMF+BMR hybrid model for source apportionment and ecological risk assessment of soil heavy metal(loid)s. J. Hazard. Mater. 2025, 494, 138734. [Google Scholar] [CrossRef] [Scilit] [PubMed]
- Wu, J.; Yang, M.; Li, J.; Wang, G.; Zhu, G.; Yinglan, A.; Xue, B.; Gong, M.; Chen, R. Quantitative characterization of uncertainty in the source apportionment induced by the dual spatial heterogeneity of soil heavy metals. J. Hazard. Mater. 2025, 498, 139893. [Google Scholar] [CrossRef] [Scilit] [PubMed]
- Tillé, Y.; Langel, M. Histogram-Based Interpolation of the Lorenz Curve and Gini Index for Grouped Data. Am. Stat. 2012, 66, 225–231. [Google Scholar] [CrossRef] [Scilit]
- Deng, H.; Sun, W.; Yip, W.; Zheng, S. Household income inequality aggravates high-temperature exposure inequality in urban China. J. Environ. Manag. 2020, 275, 111224. [Google Scholar] [CrossRef] [Scilit] [PubMed]
- Liao, L.; Yuan, F.; He, Y.; Xu, S.; Tang, X.; Xie, M.; Tang, X.; Tang, Z.; Zeng, G.; Zhang, Y.; et al. Spatiotemporal disparities in maternal mortality and the role of multiscale administrative levels: A 20-year study across Chinese counties. Front. Public Health 2025, 13, 1572382. [Google Scholar] [CrossRef] [Scilit] [PubMed]
- Xu, C.; Xia, K.; Huang, Z.; Qu, J.J.; Singh, A.; Ye, Z.; Li, Q.; Xia, J. Global PM2.5 exposures and inequalities. npj Clim. Atmos. Sci. 2025, 8, 54. [Google Scholar] [CrossRef] [Scilit]
- Han, Y.; He, J.; Liu, D.; Zhao, H.; Huang, J. Inequality in urban green provision: A comparative study of large cities throughout the world. Sust. Cities Soc. 2023, 89, 104229. [Google Scholar] [CrossRef] [Scilit]
- Pisoni, E.; Dominguez-Torreiro, M.; Thunis, P. Inequality in exposure to air pollutants: A new perspective. Environ. Res. 2022, 212, 113358. [Google Scholar] [CrossRef] [Scilit] [PubMed]
- Zhao, L.; Meng, P.; Zhang, J.; Zhang, J.; Li, J.; Wang, X. The contribution of human activities to runoff and sediment changes in the Mang River basin of the Loess Plateau, China. Land Degrad. Dev. 2023, 34, 28–41. [Google Scholar] [CrossRef] [Scilit]
- Liu, J.; Qiao, S.; Chen, H.; Zhao, S.; Li, C.; Wu, Y.; Li, D.; Li, L. Multiple pathway exposure risks and driving factors of heavy metals in soil-crop system in a Pb/Zn smelting city, China. J. Clean. Prod. 2024, 459, 142523. [Google Scholar] [CrossRef] [Scilit]
- Li, L.; Zhang, Y.; Ippolito, J.A.; Xing, W.; Qiu, K.; Yang, H. Lead smelting effects heavy metal concentrations in soils, wheat, and potentially humans. Environ. Pollut. 2020, 257, 113641. [Google Scholar] [CrossRef] [Scilit] [PubMed]
- Qiu, K.; Xing, W.; Scheckel, K.G.; Cheng, Y.; Zhao, Z.; Ruan, X.; Li, L. Temporal and seasonal variations of As, Cd and Pb atmospheric deposition flux in the vicinity of lead smelters in Jiyuan, China. Atmos. Pollut. Res. 2016, 7, 170–179. [Google Scholar] [CrossRef] [Scilit]
- HJ 1221-2021; Ambient Air–Determination of Dustfall–Gravimetric Method. China Environmental Science Press: Beijing, China, 2021.
- Chen, M.; Ma, L.Q. Comparison of Three Aqua Regia Digestion Methods for Twenty Florida Soils. Soil Sci. Soc. Am. J. 2001, 65, 491–499. [Google Scholar] [CrossRef] [Scilit]
- Liu, Q.; Song, J.; Ma, T.; Jiang, M.; Ma, G.; Sheng, Y. Effects of drying pretreatments on the analysis of the mercury fraction in sediments. Environ. Monit. Assess. 2019, 191, 607. [Google Scholar] [CrossRef] [Scilit] [PubMed]
- Hossain, M.K.; Riya, K.K.; Jubaer, A.A.; Arai, T.; Ngah, N.; Yu, J.; Hossain, M.B. Multi-index and multivariate assessment of heavy metal contamination and ecological risks in the largest deltaic Estuary of South Asia. Mar. Pollut. Bull. 2026, 225, 119202. [Google Scholar] [CrossRef] [Scilit] [PubMed]
- Li, C.; Song, C.; Yin, Y.; Sun, M.; Tao, P.; Shao, M. Spatial distribution and risk assessment of heavy metals in sediments of Shuangtaizi estuary, China. Mar. Pollut. Bull. 2015, 98, 358–364. [Google Scholar] [CrossRef] [Scilit] [PubMed]
- Kohonen, T. Essentials of the self-organizing map. Neural Netw. 2013, 37, 52–65. [Google Scholar] [CrossRef] [Scilit] [PubMed]
- Feng, W.; Zhang, Y.; Huang, L.; Li, Y.; Wang, S.; Zheng, Y.; Shi, L.; Xu, K. Source apportionment of environmentally persistent free radicals (EPFRs) and heavy metals in size fractions of urban arterial road dust. Process Saf. Environ. Prot. 2022, 157, 352–361. [Google Scholar] [CrossRef] [Scilit]
- Zhong, Y.; Sun, S.; Niu, L.; Tian, Y.; Yang, Q. Source tracing of heavy metals in estuaries: How hydro-morphological evolution governs contaminant flux and fate under human pressure. J. Hazard. Mater. 2026, 509, 142006. [Google Scholar] [CrossRef] [Scilit] [PubMed]
- Li, J.; Wang, C.; Tuo, X.; Proshad, R.; Liu, J.; Gao, Z.; Zhou, F.; Zang, F. Machine learning-driven multi-technique source tracing and source-specific probabilistic ecological risk assessment of heavy metal(loid)s in urban river sediments. Ecol. Indic. 2025, 171, 113189. [Google Scholar] [CrossRef] [Scilit]
- Men, C.; Liu, R.; Xu, L.; Wang, Q.; Guo, L.; Miao, Y.; Shen, Z. Source-specific ecological risk analysis and critical source identification of heavy metals in road dust in Beijing, China. J. Hazard. Mater. 2020, 388, 121763. [Google Scholar] [CrossRef] [Scilit] [PubMed]
- Hakanson, L. An ecological risk index for aquatic pollution control.a sedimentological approach. Water Res. 1980, 14, 975–1001. [Google Scholar] [CrossRef] [Scilit]
- Yang, X.; Su, Q.; Huang, L.; Wen, C.; Shahab, A.; Wang, C.; Li, N.; Kang, B. Potential toxic elements (PTEs) in the surface sediments of the Beibu Gulf, South China Sea: Spatiotemporal variation, geochemical fractionation and ecological risk assessment. Mar. Environ. Res. 2025, 211, 107368. [Google Scholar] [CrossRef] [Scilit] [PubMed]
- Aithani, D.; Jyethi, D.S.; Siddiqui, Z.; Yadav, A.K.; Khillare, P.S. Source apportionment, pollution assessment, and ecological and human health risk assessment due to trace metals contaminated groundwater along urban river floodplain. Groundw. Sustain. Dev. 2020, 11, 100445. [Google Scholar] [CrossRef] [Scilit]
- Cui, Y.; Fan, C.; Zhou, X.; Yu, P. Impact of urbanization on heavy metals in outdoor air and risk assessment: A case study in severe cold regions. Sust. Cities Soc. 2024, 114, 105713. [Google Scholar] [CrossRef] [Scilit]
- Qadeer, A.; Saqib, Z.A.; Ajmal, Z.; Xing, C.; Khalil, S.K.; Usman, M.; Huang, Y.; Bashir, S.; Ahmad, Z.; Ahmed, S.; et al. Concentrations, pollution indices and health risk assessment of heavy metals in road dust from two urbanized cities of Pakistan: Comparing two sampling methods for heavy metals concentration. Sust. Cities Soc. 2020, 53, 101959. [Google Scholar] [CrossRef] [Scilit]
- Zhao, T.; Li, G.; Zhang, S.; Yang, H.; Ni, W.; Shao, A. Enhancement effect of biochar on the immobilization of heavy metals and anions in MSWI fly ash/bottom ash–coal fly ash-based cementitious materials: Risk assessment model and mechanisms. J. Hazard. Mater. 2025, 497, 139615. [Google Scholar] [CrossRef] [Scilit] [PubMed]
- Shi, X.; Liu, S.; Song, L.; Wu, C.; Yang, B.; Lu, H.; Wang, X.; Zakari, S. Contamination and source-specific risk analysis of soil heavy metals in a typical coal industrial city, central China. Sci. Total Environ. 2022, 836, 155694. [Google Scholar] [CrossRef] [Scilit] [PubMed]
- Emmanuel, U.C.; Chukwudi, M.I.; Monday, S.S.; Anthony, A.I. Human health risk assessment of heavy metals in drinking water sources in three senatorial districts of Anambra State, Nigeria. Toxicol. Rep. 2022, 9, 869–875. [Google Scholar] [CrossRef] [Scilit] [PubMed]
- Xu, S.A.; Yu, C.; Wang, Q.; Liao, J.; Liu, C.; Huang, L.; Liu, Q.; Wen, Z.; Feng, Y. Chromium contamination and health risk assessment of soil and agricultural products in a rural area in southern China. Toxics 2022, 11, 27. [Google Scholar] [CrossRef] [Scilit] [PubMed]
- Sobhanardakani, S.; Hosseini, N.S. Modeling health risks from urban roadside soil toxic elements using two-dimensional Monte Carlo simulation paired with multiple linear regression. J. Environ. Chem. Eng. 2026, 14, 121843. [Google Scholar] [CrossRef] [Scilit]
- Gastwirth, J.L. The Estimation of the Lorenz Curve and Gini Index. Rev. Econ. Stat. 1972, 54, 306. [Google Scholar] [CrossRef] [Scilit]
- Song, Y.; Chen, B.; Ho, H.C.; Kwan, M.; Liu, D.; Wang, F.; Wang, J.; Cai, J.; Li, X.; Xu, Y.; et al. Observed inequality in urban greenspace exposure in China. Environ. Int. 2021, 156, 106778. [Google Scholar] [CrossRef] [Scilit] [PubMed]
- Chen, B.; Wu, S.; Song, Y.; Webster, C.; Xu, B.; Gong, P. Contrasting inequality in human exposure to greenspace between cities of Global North and Global South. Nat. Commun. 2022, 13, 4636. [Google Scholar] [CrossRef] [Scilit] [PubMed]
- Feng, W.; Zhang, Y.; Huang, L.; Li, Y.; Guo, Q.; Peng, H.; Shi, L. Spatial distribution, pollution characterization, and risk assessment of environmentally persistent free radicals in urban road dust from central China. Environ. Pollut. 2022, 298, 118861. [Google Scholar] [CrossRef] [Scilit] [PubMed]
- GB 15618-2018; Soil Environmental Quality–Risk Control Standard for Soil Contamination of Agricultural Land. China Environmental Science Press: Beijing, China, 2018.
- Cai, A.; Zhang, H.; Zhao, Y.; Wang, X.; Wang, L.; Zhao, H. Quantitative source apportionment of heavy metals in atmospheric deposition of a typical heavily polluted city in Northern China: Comparison of PMF and UNMIX. Front. Environ. Sci. 2022, 10, 950288. [Google Scholar] [CrossRef] [Scilit]
- Jianfei, C.; Chunfang, L.; Lixia, Z.; Quanyuan, W.; Jianshu, L. Source apportionment of potentially toxic elements in soils using APCS/MLR, PMF and geostatistics in a typical industrial and mining city in Eastern China. PLoS ONE 2020, 15, e0238513. [Google Scholar] [CrossRef] [Scilit] [PubMed]
- Fang, J.; Xu, M.; Tan, Z.; Guo, J.; Tao, H.; Ruan, J. Bioaccessibility and health risk assessment of heavy metals in dust from electronic waste recycling in China. Process Saf. Environ. Prot. 2025, 201, 107550. [Google Scholar] [CrossRef] [Scilit]
- Jeong, H. Toxic metal concentrations and Cu–Zn–Pb isotopic compositions in tires. J. Anal. Sci. Technol. 2022, 13, 2. [Google Scholar] [CrossRef] [Scilit]
- Yuan, W.; Balajiang, G.; Dang, Y.; Xie, J.; Zhao, W.; Cong, Y.; Ai, S. Spatial distribution, pollution assessment and source identification of heavy metals in Yarlung Zangbo River, Tibet. Process Saf. Environ. Prot. 2025, 202, 107768. [Google Scholar] [CrossRef] [Scilit]
- Wang, S.; Hu, G.; Yan, Y.; Wang, S.; Yu, R.; Cui, J. Source apportionment of metal elements in PM2.5 in a coastal city in Southeast China: Combined Pb-Sr-Nd isotopes with PMF method. Atmos. Environ. 2019, 198, 302–312. [Google Scholar] [CrossRef] [Scilit]
- Ghanavati, N.; Nazarpour, A.; Watts, M.J. Status, source, ecological and health risk assessment of toxic metals and polycyclic aromatic hydrocarbons (PAHs) in street dust of Abadan, Iran. Catena 2019, 177, 246–259. [Google Scholar] [CrossRef] [Scilit]
- Li, H.; Yao, J.; Sunahara, G.; Min, N.; Li, C.; Duran, R. Quantifying ecological and human health risks of metal(loid)s pollution from non-ferrous metal mining and smelting activities in Southwest China. Sci. Total Environ. 2023, 873, 162364. [Google Scholar] [CrossRef] [Scilit] [PubMed]
Disclaimer/Publisher’s Note: The statements, opinions and data contained in all publications are solely those of the individual author(s) and contributor(s) and not of MDPI and/or the editor(s). MDPI and/or the editor(s) disclaim responsibility for any injury to people or property resulting from any ideas, methods, instructions or products referred to in the content. |
© 2026 by the authors. Licensee MDPI, Basel, Switzerland. This article is an open access article distributed under the terms and conditions of the Creative Commons Attribution (CC BY) license.