


Abstract
Enrofloxacin (ENR) is an antibiotic that is widely used in aquaculture, but residual ENR persistence in popular farmed fish such as largemouth bass (Micropterus salmoides) poses significant risks to food safety and the environment. We investigated the accumulation–excretion characteristics and environmental fate of ENR in largemouth bass fed diets containing 20 or 100 mg/kg body weight for 5 consecutive days. Our results reveal differences in ENR accumulation between the two dosage groups, with tissue-specific distribution patterns. Pharmacokinetic analysis revealed a disproportionately high increase in tissue AUC (area under the concentration–time curve) values (9.4- to 13.7-fold) relative to the fivefold dose increase from the lower to the higher dosage. Skin tissue exhibited the highest and most persistent residues, with peak concentrations 12.5-fold higher in the high-dose group, exceeding the maximum residue limit for up to 28 days. The withdrawal time calculated for skin in the high-dose group was 930 degree-days. The dose of 20 mg/kg suppressed overall growth and triggered oxidative stress and time-dependent histopathological damage. Our results underscore the necessity of mandating stricter residue surveillance in intensive aquaculture systems and highlight a need for further investigations into the mechanisms underlying dose-dependent nonlinear ENR excretion and their long-term ecological consequences.
1. Introduction
Largemouth bass (Micropterus salmoides) is one of the most important commercial farmed fish species in China; the species exhibits rapid growth, strong environmental adaptability, and high nutritional value [1,2,3]. According to the China Fisheries Statistical Yearbook, production exceeded 930,000 tons in 2024, with an average annual growth rate of more than 5% [4]. Enrofloxacin (ENR) is widely used to treat common bacterial infections in largemouth bass, such as Aeromonas salmonicida, Aeromonas hydrophila, and Edwardsiella ictaluri [5]. To mitigate the risk of residual, China has set a maximum residue limit (MRL) of 0.10 mg/kg for the sum of ENR and its active metabolite ciprofloxacin (CIP) residues in muscle with attached skin [6] and a uniform withdrawal time of 500 degree-days [7]. However, recent surveys have revealed increasingly prevalent problems with ENR residues in largemouth bass. In a survey of 260 cultured fish samples, ENR was the most prevalent compound among the 11 quinolones tested, reaching concentrations up to 246.0 μg/kg [8]. A nationwide survey covering 19 Chinese provinces revealed a high detection frequency for antibiotics in cultured largemouth bass (41.2%) [9]. ENR is listed among the high-frequency noncompliant drugs for largemouth bass [7]. These findings highlight an urgent need for pharmacokinetic investigations across fish species to optimize therapeutic protocols and safeguard the long-term viability of aquaculture [10].
ENR pharmacokinetics has been extensively studied [2,11,12], but its depuration varies markedly among fish species. For example, ENR excretion following oral administration is more rapid in red tilapia than in GIFT tilapia [2]. In largemouth bass, several studies have characterized ENR tissue distribution and depletion, yet the reported pharmacokinetic parameters remain highly variable. Xu et al. [13] used a nonlinear mixed-effects model to characterize the population pharmacokinetics of ENR in largemouth bass and suggested that a dose of 20 mg/kg is highly effective against aquatic pathogens. However, a withdrawal time (WT) of 24 days (672 degree-days) was reported following a single oral dose of 20 mg/kg [13], whereas repeated oral administration (20 mg/kg for 5 days) resulted in a longer withdrawal time of 46 days at approximately 30 °C [14]. Water temperature has also been identified as a critical modulating factor for ENR depuration. Fan et al. [15] demonstrated that an increase in water temperature from 17 °C to 27 °C shortened the WT calculated for ENR from 29.57 days to 23.90 days, both of which still exceeded the recommended 500 degree-days. Field evidence further indicates that ENR residues can persist for extended periods; for instance, 45 days after treatment, the combined ENR + CIP level in fish muscle was 30.8 ± 4.1 μg/kg [16]. Moreover, prolonged ENR retention leads to continuous ENR exposure, which can induce oxidative stress, intestinal damage, and growth suppression [17,18,19], ultimately reducing the economic output of largemouth bass aquaculture.
The risk of antibiotic contamination of aquatic environments due to freshwater aquaculture has become increasingly severe in recent years [20]. Antibiotics are typically administered via feed, with 30–90% of the dose excreted largely unchanged in feces and urine [21]; such excretion represents an important route for residue entry into sediments and aquatic biota [22]. Fluoroquinolones are among the most frequently detected antibiotics in freshwater systems [23], with ENR showing the highest detected concentrations, up to 1315 ng/L [20]. After release, ENR tends to bind to sediments, which then become a secondary source of ENR pollution [24]. Recirculating aquaculture systems have been widely adopted as an environmentally friendly option for largemouth bass farming because of the benefits of a controllable rearing environment [1,25]. Therefore, dose-dependent studies on ENR pharmacokinetics, residue distribution, and environmental fate in recirculating aquaculture systems are urgently needed to support reduced ENR usage.
We conducted a study in which two clinically relevant ENR doses were administered to largemouth bass in a recirculating aquaculture system. We investigated the pharmacokinetics and tissue and environmental distribution of ENR at two dosage levels. Growth performance, oxidative stress parameters, and histopathological changes were additionally evaluated in the control and low-dose groups. The findings could help in providing scientifically based guidance for ENR administration strategies and residue management in aquaculture.
2. Materials and Methods
2.1. Experimental Materials
Analytical-grade ENR (CAS 93106-60-6; purity ≥ 99.0%), CIP hydrochloride (CAS 85721-33-1; purity ≥ 98.0%), and corresponding internal standards (enrofloxacin-d5 and ciprofloxacin-d8) were purchased from Dr. Ehrenstorfer GmbH (Augsburg, Germany). Reference standard solutions were prepared by precisely weighing (the mass of the CIP hydrochloride salt was corrected to the equivalent free base) and dissolving them in methanol (MeOH) to yield a concentration of 100 μg/mL. All stock solutions were stored at −20 °C until use for preparation of quality control samples and calibration standards. The veterinary drug (active ingredient 10%) was purchased from Chongqing Xinbao Animal Pharmaceuticals (Chongqing, China). The experimental diet consisted of an extruded compound feed formulated for largemouth bass (model 5.0; Special Feed Branch, Tongwei Biotechnology, Wuxi, China). Additional information on the reagents and materials used in this study is provided in Supplementary Text S1.
2.2. Experimental Methods
2.2.1. ENR Exposure and Sampling Protocol
A total of 180 healthy, 12-month-old hybrid-sex largemouth bass (body weight 300.2 ± 53.1 g) were obtained from a commercial recirculating aquaculture facility in Rizhao, Shandong Province, China. Before the experiment, random subsamples were collected and analyzed to confirm that ENR and CIP residues were below the limit of detection (LOD). The animal study protocol was approved by the Institutional Animal Care and Use Committee of the Yellow Sea Fisheries Research Institute (protocol code YSFRI-2026089), and all experiments were conducted following the principles of randomization and blinding (Text S2).
The experimental fish were randomly divided into nine groups of 20 individuals each and placed in circular tanks with a volume of approximately 300 L (height 1.5 m; outer diameter 1.3 m; conical bottom). The tanks were supplied with freshwater that had been continuously aerated for 24 h before use. The fish were maintained in a static-renewal water system without recirculating filtration. Approximately one-third of the water in each tank was replaced daily throughout the experimental period. Throughout the acclimation and experimental periods, the water temperature was maintained at 15.0 ± 1.0 °C, pH at 8.0–8.3, dissolved oxygen concentration at ≥5.0 mg/L, ammonia nitrogen concentration at <0.5 mg/L, and under a natural photoperiod. All water quality parameters were monitored and recorded daily (Table S1). After a 7-day acclimation period in the tanks, the fish were fasted for 24 h before drug administration.
The experiment comprised two ENR dosage groups and an ENR-free control group. In the low-dose (LD) group, ENR was administered at a dose of 20 mg/kg, based on previously reported therapeutic regimens for aquaculture species [7]. In the high-dose (HD) group, ENR was administered at a dose of 100 mg/kg, in accordance with veterinary guidelines on pharmaceutical use in fish. The control group was fed the same basal diet without any drug supplementation throughout the experimental period. Each group consisted of three replicate tanks. Fish mortality was monitored daily throughout the experimental period, and the number of deaths in each treatment group is provided in the Supplementary Materials (Table S2).
The veterinary drug was accurately weighed and incorporated into the basal diet by serial geometric dilution. The mixture was then homogenized using the coning and quartering method, followed by a final thorough mixing. The resulting diet was equally divided into 30 portions, each sealed in an aluminum foil bag and stored in the dark at 4 °C. Before feeding, each portion was removed from the freezer and allowed to stand at room temperature for 30 min to equilibrate before being offered to the fish, with a daily feeding ration of 1% of the fish’s body weight (feed/fish weight, w/w) fully consumed within 30 min. Feed containing ENR was administered twice daily (08:00 a.m. and 20:00 p.m. at a morning-to-evening feeding ratio of 1:2) for 5 days.
The sampling procedure was as follows: fish were first stunned physically, and complete loss of consciousness was verified. Body weight and length were recorded, then tail severing was then performed to collect approximately 4 mL of blood, after which the fish were killed by decapitation. Blood samples were collected at 0.5, 2, 6, 8, 12, and 24 h, and 3, 5, 6, 7, 10,14, 21, 28, 40, and 80 days after the first feeding (n = 3) of each group. The collected blood was immediately transferred to anticoagulant tubes, and centrifuged at 3000× g for 10 min to obtain plasma, which was stored at −20 °C until analysis. Following blood collection, the fish were dissected to obtain three categories of tissue samples according to their physiological functions: (1) edible tissues, including dorsal epaxial muscle (hereafter referred to as dorsal muscle), caudal peduncle muscle (hereafter referred to as caudal muscle), and skin; (2) absorption-related organs (gill, stomach, and intestine); and (3) excretion-related organs (liver, kidney, and spleen) (n = 3). All samples were immediately rinsed in physiological saline, finely minced and homogenized, placed into separate sample tubes and stored at −20 °C. The liver, kidney, and spleen tissues used for antioxidant assays were collected on days 6 and 28 and stored at −80 °C. For histopathological assessments, two fish of each tank (n = 3 tanks per group per time point) from the control group and the LD group were sampled on days 6, 28 and 40. Liver, kidney, and spleen tissues were collected from each fish and fixed in general-purpose tissue fixative (pH 7.0–7.5, Wuhan Servicebio Technology Co., Ltd., Wuhan, China). The experimental aquaculture water and fecal samples were collected on days 1, 2, 3, 4, 5, 6, 7, 8, 9, 10, 13, 16, 19, and 22 after ENR administration (n = 3). At each sampling time point, 500 mL of aquaculture water was collected in a sampling bottle and filtered under vacuum through a nylon sieve (aperture 0.15 mm, Tianjin Jinteng Experimental Equipment Co., Ltd., Tianjin, China). The filtrate was then collected in a centrifuge tube and stored frozen until analysis. For fecal samples, the samples were centrifuged at 3000× g for 10 min, and the solid fraction was collected and stored frozen until analysis. Three technical replicates were performed for each sample.
2.2.2. Determination of ENR and CIP
- (1)
- Extraction from plasma and tissue samples
A 0.5-mL aliquot of plasma was transferred to a centrifuge tube and 1 mL of ACN containing 1% FA was added. The mixture was vortex-mixed for 5 min to ensure thorough homogenization and then centrifuged at 8000× g for 12 min at 4 °C. This extraction step was repeated, and the combined organic phases were evaporated to dryness under a nitrogen stream at 55 °C (N-EVAP 112, Organomation Associates, Inc., Berlin, MA, USA). The dried residue was reconstituted in 1 mL of 20% MeOH in water by vortex-mixing, and the resulting solution was centrifuged at 6000× g for 10 min. The supernatant was filtered through a 0.22-μm nylon membrane filter (Bonna-Agela Technologies Inc., Tianjin, China) for liquid chromatography-tandem mass spectrometry (LC-MS/MS) analysis.
Tissue samples were processed following Zhu et al. [2]. A sample of 2.00 g (±0.01 g) of tissue was accurately weighed into a 50-mL centrifuge tube, and 50 μL of mixed internal standard working solution was added and thoroughly mixed. After addition of 2 g of anhydrous sodium sulfate, extraction was performed with 5 mL of ACN containing 1% FA. The mixture was vortexed and ultrasonicated for 5 min each, then centrifuged at 3000× g for 10 min. The supernatant was collected, and the extraction procedure was repeated once. The combined ACN extracts were evaporated to near dryness under a nitrogen stream at 40 °C. The residue was reconstituted in 1 mL of 20% MeOH–water via vortex mixing, and the resulting solution was centrifuged at 6000× g for 10 min. The supernatant was then filtered through a 0.22-μm nylon membrane filter for LC-MS/MS analysis.
- (2)
- Extraction process for water and fecal samples
A 40 mL aliquot of the water sample was transferred to a 50 mL centrifuge tube, and 20 μL of the mixed internal standard working solution (1 μg/mL) was added, followed by thorough homogenization. Cleanup was performed using an HLB Pro SPE (6 mL, 500 mg, ANPEL Laboratory Technologies Inc., Shanghai, China). The cartridge was sequentially conditioned with 5 mL of MeOH and 5 mL of water. The spiked water sample was then processed on the cartridge. After the entire sample had passed through, the cartridge was rinsed with 1 mL of ultrapure water. Elution was carried out twice with 1 mL of 0.1% FA in MeOH each time, and the combined eluates were thoroughly mixed. An aliquot of 200 μL of the eluate was accurately transferred and diluted with 800 μL of a diluent (95:5, v/v) composed of acetic acid water (1:81, v/v) and 0.1% FA in MeOH. The resulting solution was then filtered through a 0.22-μm nylon membrane filter for LC-MS/MS analysis.
A sample of 2 g (± 0.20 g) was accurately weighed and transferred to a 15 mL centrifuge tube, and 20 μL of mixed internal standard working solution (10 μg/mL) was added, followed by vortex-mixing for 30 s. Subsequently, 8 mL of 0.1% FA in MeOH solution was added, and the mixture was vortexed for 15 min. The extract was centrifuged at 6000× g for 5 min, and the supernatant was collected. The residual pellet was re-extracted with another 4 mL of 0.1% FA in MeOH solution, following the same procedure. The two supernatants were combined and evaporated to approximately 1 mL under a nitrogen stream at 40 °C. The concentrated extract was purified using an HLB Pro SPE (6 mL, 500 mg, ANPEL Laboratory Technologies Inc., Shanghai, China). The cartridge was sequentially conditioned with 5 mL of MeOH and 5 mL of water. The concentrated sample was then processed on the cartridge, which was subsequently rinsed with 1 mL of ultrapure water. Elution was performed sequentially with 3 mL and 1 mL of 0.1% FA in MeOH (v/v), and the combined eluates were collected and thoroughly mixed. An aliquot of 200 μL of the eluate was then mixed with 800 μL of a diluent (95:5, v/v) composed of acetic acid-water (1:81, v/v) and 0.1% FA in MeOH. The resulting solution was then filtered through a 0.22-μm nylon membrane filter for LC-MS/MS analysis. All fecal concentrations in this study are expressed on a wet weight (ww) basis.
- (3)
- LC-MS/MS analysis
Separation was performed on a Shimadzu XD20 ultra-high-performance LC system (Shimadzu Corp., Kyoto, Japan) with a Kinetex XB-C18 column (100 mm × 2.1 mm, 2.6 µm; Phenomenex, Torrance, CA, USA) maintained at 35 °C. The mobile phases were (A) 0.1% FA in water containing 5 mM ammonium acetate and (B) MeOH. MS analysis was conducted using a SCIEX 5500 QTRAP mass spectrometer (SCIEX, Marlborough, MA, USA) in positive electrospray ionization mode with multiple reaction monitoring. The optimized MS parameters were as follows: ion spray voltage, 4500 V; ion source temperature, 350 °C. The following transitions were used: ENR, m/z 360 > 245 and 360 > 316*; CIP, m/z 332 > 245 and 332 > 288*; ENR-D5, m/z 365 > 321; and CIP-D5, m/z 340 > 322; asterisks (*) denote the quantifier ion. Data below the LOD were treated as not detected; values between the LOD and LOQ were used only for trend comparison of two groups and were not included in statistical analyses. Details of gradient program, method validation, including blank sample, reagent sample and recovery test are provided in the Supplementary Material (Texts S3 and S4, and Table S3).
2.2.3. Calculation of Growth Performance Parameters
The body weight and length of the fish in each aquarium were measured after ENR treatment on days 0, 6, 28, and 80, and the average value for each treatment group was used for the growth index statistics (n = 3). The weight gain (WG %) and specific growth rate (SGR) and Fulton’s condition factor (K) for largemouth bass were calculated using the following formulas [26].
where Wt is final body weight (g), W0 is initial body weight (g), and t is the duration of the experiment (days), W is body weight (g), and L is body length (cm).
WG (%) = [(Wt − W0)/W0] × 100%,
SGR (%/day) = [(ln Wt − ln W0)/t] × 100%,
K = W/L3 × 100,
2.2.4. Histopathological Analysis
Liver, kidney, and spleen tissues were collected from the ENR-free control group and the LD group on days 6, 28, and 40 after administration and fixed in 30 mL general-purpose tissue fixative (contain 4% paraformaldehyde dissolved in PBS, pH 7.0–7.5, Wuhan Servicebio Technology Co., Ltd., Wuhan, China) for 48 h at room temperature. After fixation, tissue samples were dehydrated using a tissue dehydrator (JJ-12J, Wuhan Junjie Electronic Co., Ltd., Wuhan, China). Dehydration was performed through a graded ethanol series, followed by clearing in xylene, paraffin infiltration, and embedding. The samples were then sectioned at 4 μm. After deparaffinization and rehydration, sections were sequentially stained with hematoxylin and eosin. Following staining, the sections were dehydrated, cleared, and mounted. Finally, the sections were examined under a light microscope (Nikon Eclipse CI, Nikon Corp., Tokyo, Japan), and images were captured using a Nikon DS-U3 imaging system (Nikon Corp., Tokyo, Japan). Detailed histopathological procedures are provided in the Supplementary Materials (Text S5). All histopathological procedures were performed by Jiangsu Meimian Industrial Co., Ltd. (Yancheng, China).
Representative histological images were selected to illustrate the characteristic histo-logical features observed in the corresponding experimental groups and sampling time points, rather than to represent the most severe lesions. A semi-quantitative scoring method was used to assess histopathological lesions in the liver, kidney, and spleen [27,28]. The severity of histological alterations was evaluated in six fish per group per time point. For statistical analysis, the two fish from each tank were averaged to obtain a single tank-level value, and the three tank-level values (n = 3 tanks per group per time point) were used as experimental units. The histopathological index (Ih) for each organ was calculated as the sum of weighted scores for individual lesions, with weights assigned according to the reaction pattern (regressive changes, inflammation, circulatory disturbance) [29,30]. The specific scoring criteria (0–4) were established based on the percentage of the microscopic field affected by each histopathological lesion (0 = no alterations; 1 = 1–25%; 2 = 26–50%; 3 = 51–75%; and 4 = 76–100%) [31]. And the detailed weights, scoring criteria, and calculation formula are provided in the Supplementary Material (Tables S4 and S5, and Text S6). For each organ, differences among the 6 d, 28 d, and 40 d groups were assessed using one-way ANOVA followed by Tukey’s multiple comparisons test. Statistical significance was set at p < 0.05.
2.2.5. Antioxidant-Related Parameters
Frozen liver, kidney, and spleen tissues were homogenized in ice-cold physiological saline at a ratio of 1:9 (w/v) using a tissue homogenizer to prepare 10% (w/v) tissue homogenates. The homogenates were centrifuged at 3000× g at 4 °C for 15 min, with the supernatants collected for subsequent biochemical analyses. All oxidative stress parameters were analyzed based on three biological replicates (n = 3). The activities of catalase (CAT), superoxide dismutase (SOD), and total antioxidant capacity (T-AOC), as well as the malondialdehyde (MDA) content, were determined using commercial assay kits (Jiangsu Meimian Industrial Co., Ltd., Yancheng, China) according to the manufacturer’s instructions. The kit information was as follows: CAT assay kit (cat. no. ADS-W-KY002), SOD assay kit (WST-8 method; cat. no. ADS-W-KY011), T-AOC assay kit (FRAP method; cat. no. ADS-W-KY005), and MDA assay kit (cat. no. ADS-W-YH002). The detailed detection ranges of these kits are provided in the Supplementary Materials (Text S7).
2.3. Data Processing and Statistical Analysis
All experimental data were expressed as the mean ± standard deviation. The pharmacokinetic parameters of ENR and CIP, including the excretion half-life (T1/2β), time to peak concentration (Tmax), peak concentration (Cmax), area under the concentration–time curve from time zero to infinity (AUC0-∞), mean residence time (MRT), apparent clearance (CL/F), apparent distribution volume (Vd/F), and terminal excretion rate constant (λz), were analyzed using a noncompartmental model in WinNonlin 8.3 (Certara, Princeton, NJ, USA). Graphs illustrating the effects of ENR on oxidative stress parameters in tissues sampled from largemouth bass and the semi-quantitative analysis of histopathological indices in the liver, kidney, and spleen were plotted using GraphPad Prism 11.0 (GraphPad Software, LLC, Boston, MA, USA); other graphs were generated using Origin 2026 (OriginLab Corp., Northampton, MA, USA). Software developed by the European Medicines Agency (WT 1.4) was used to calculate WT values for edible tissues, which were converted to degree-days using a baseline temperature of 15 °C according to the following formula: degree-days = WT (in days) × temperature (in °C). Statistical analyses were performed using SPSS Statistics version 22.0 (IBM Corp., Armonk, NY, USA) and differences were considered statistically significant at p < 0.05.
3. Results and Analysis
3.1. Absorption and Distribution of ENR and CIP in Largemouth Bass
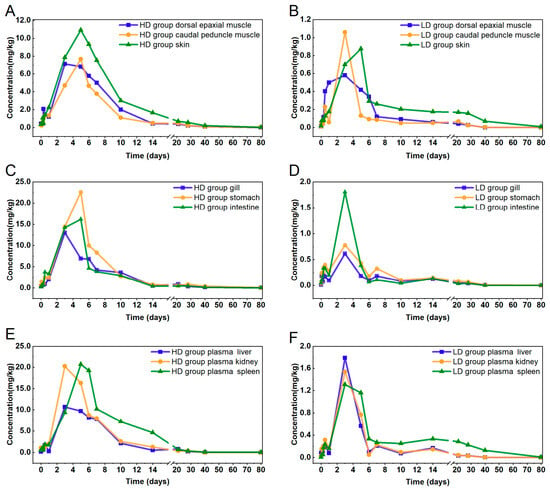
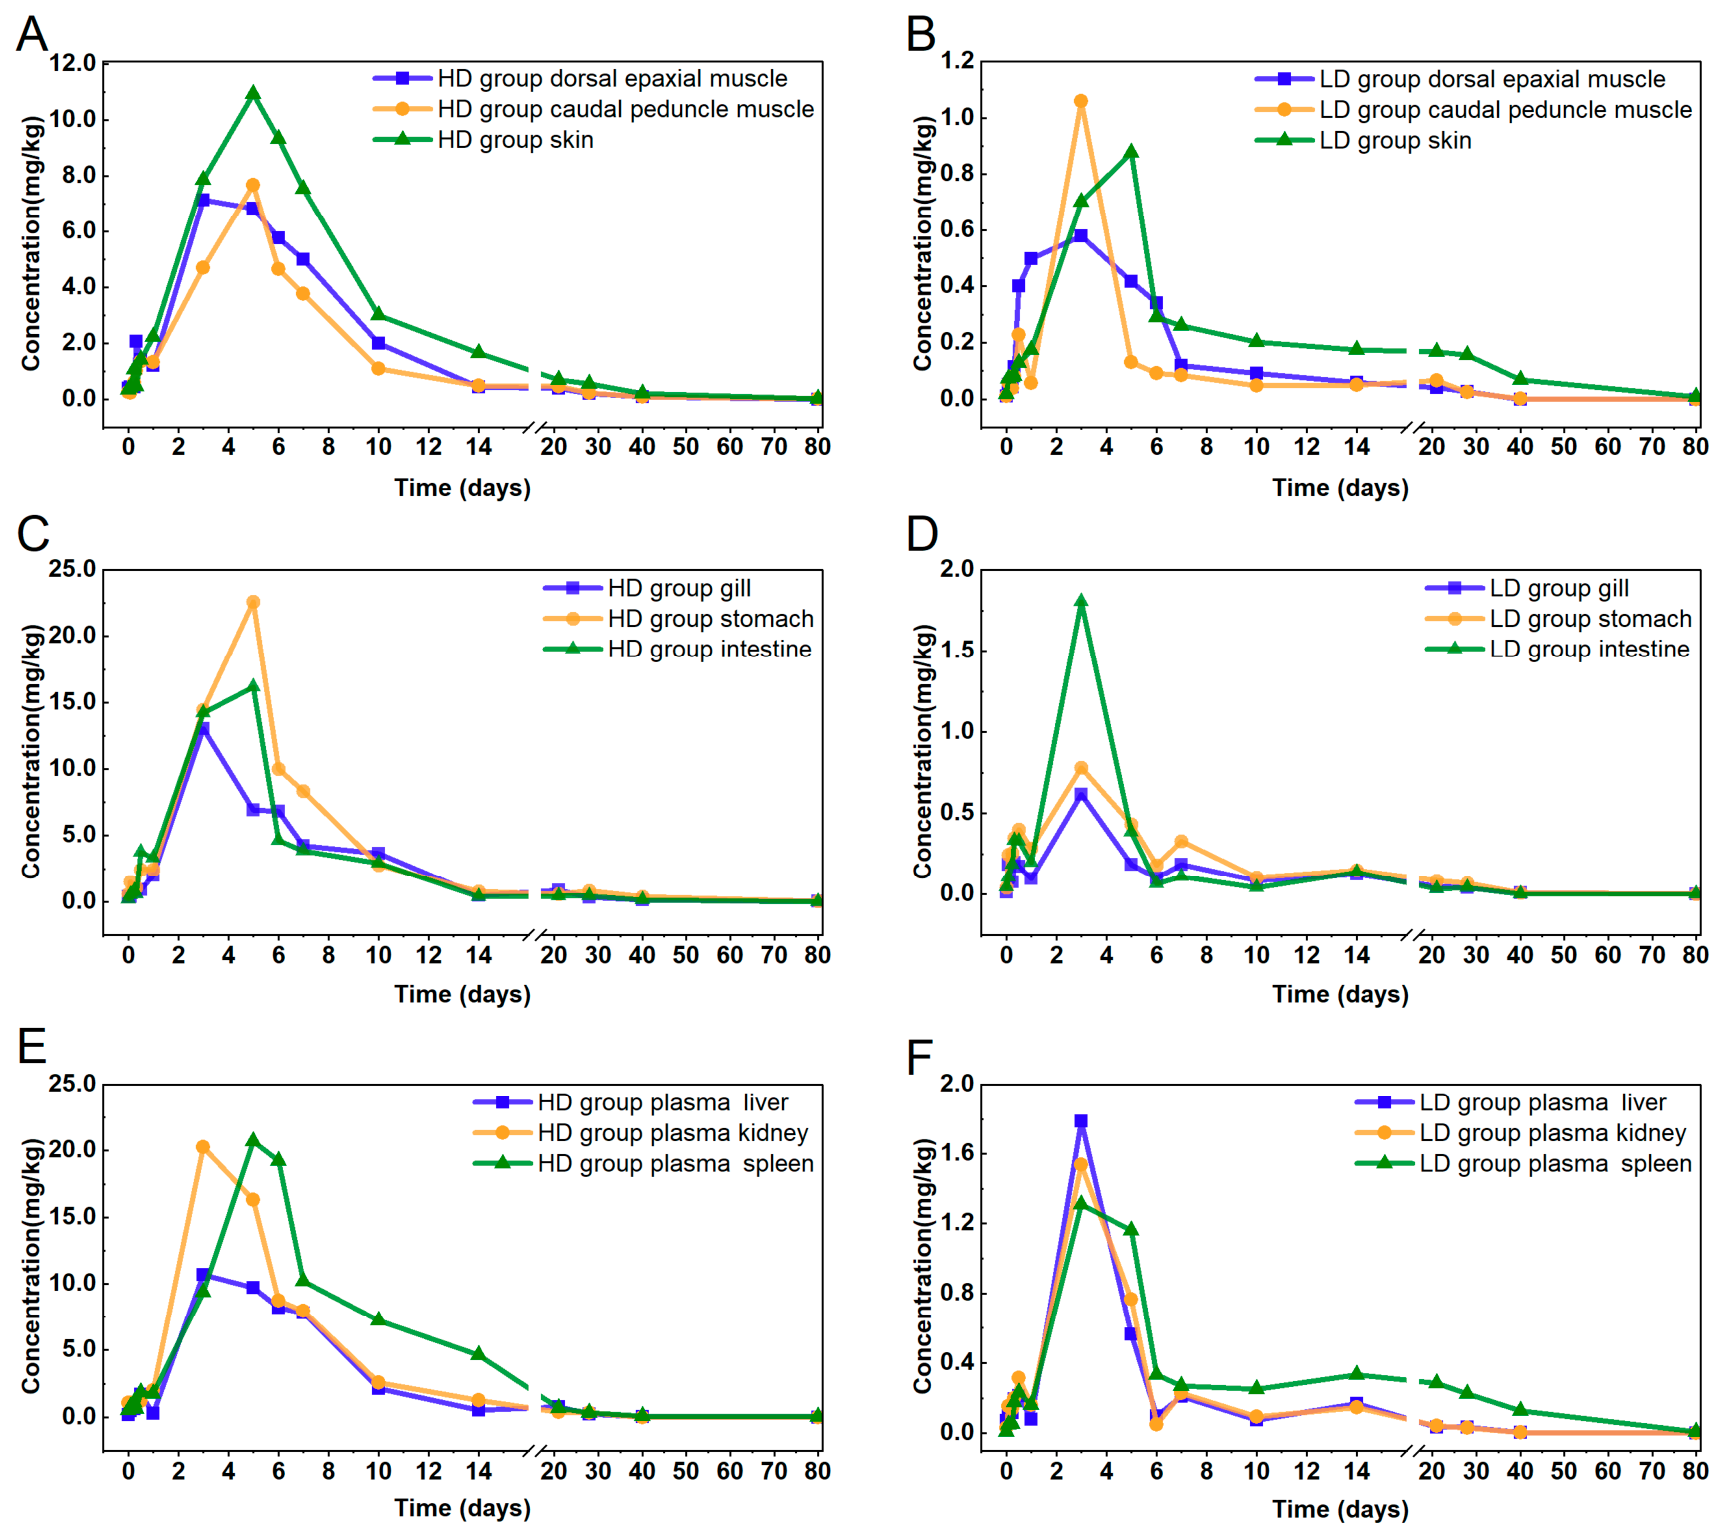
Figure 1 shows concentration–time curves for ENR and CIP in tissues; results for plasma are shown in Figure S1. No enrofloxacin or ciprofloxacin was detected in any sample from the ENR-free control group. In the treatment groups, ENR levels in all tissues reached a maximum concentration during the 3–5-day accumulation period. In the LD group, peak levels were ranked as follows: plasma > intestine > liver > kidney > spleen, with all of the edible tissues showing relatively low levels. In the HD group, the ranking was stomach > spleen > kidney > intestine > gill > plasma, with a significant difference in ranking between the two groups. In comparison to the LD group, the HD group exhibited a relatively longer time to peak levels in plasma and certain tissues, and the accumulation patterns differed markedly between the two doses. Notably, levels in all edible tissues in the HD group exceeded 0.10 mg/kg at 0.5 h after ENR administration, while this level was not reached in any edible tissues in the LD group until 12 h. The maximum skin concentration was 10.9 mg/kg in the HD group and 0.875 mg/kg in the LD group.
Figure 1.
Tissue distribution and time–concentration profiles for enrofloxacin (ENR) and ciprofloxacin (CIP) in various tissues from largemouth bass (Micropterus salmoides) (n = 3). (A,B) Edible tissues: dorsal epaxial muscle, caudal peduncle muscle, and skin. (C,D) Absorption-related organs: gill, stomach, and intestine. (E,F) Excretion-related organs: liver, kidney, and spleen.
The peak ENR level in plasma was approximately fivefold higher in the HD group than in the LD group (Figure S1) and approximately sevenfold to 12-fold higher in edible tissues (Figure 1A,B). In the gill and stomach, which are the primary uptake organs, differences between the LD and HD groups exceeded a factor of 20 (Figure 1C,D), which indicates that the gill and stomach are the main sites of ENR absorption. Residue levels in the two muscle tissues exceeded the MRL and remained above the limit up to day 28 in the HD group versus only day 7 in the LD group. The highest residue levels were observed in skin, which exceeded those in muscle by factors of 1.6 to 1.8 in the HD group, and by factors of 1.3 to 2.3 in the LD group. The peak ENR concentration in skin was 12.5-fold greater in the HD group than in the LD group. These results highlight the markedly higher food-safety risk for fillet tissues after HD ENR administration.
During the excretion phase, distribution patterns and residual ENR levels were generally consistent in the LD group. However, in the HD group, residual ENR levels were significantly lower in liver than in the kidney and spleen, with an approximately twofold difference (Figure 1E,F). In the LD group, the time required for ENR residues to decline below the MRL was 10 days for dorsal muscle, 6 days for caudal muscle, and 40 days for skin. In the HD group, a period of at least 40 days was needed for ENR levels in skin to reach the MRL, and even at the end of the 80-day experimental period, ENR residues were still detectable in all of the tissues examined. For completeness, the relative proportions of CIP in the combined ENR and CIP residues in the three edible tissues, as well as in subsequent feces and water samples, are presented in Table S6.
3.2. Pharmacokinetic and Excretion Profiles of ENR and CIP in Largemouth Bass
Table 1 shows the pharmacokinetic profile of ENR and CIP in largemouth bass following oral ENR administration at two dosages. For caudal muscle, Tmax was 72 h in the LD group versus 120 h in the HD group, which indicates delayed absorption at the higher dosage. AUC values ranged from 1215.68 to 2300.38 h·mg/kg in the HD group (p < 0.05), which were 9.4- to 13.7-fold higher than in the LD group (94.07–245.60 h·mg/kg), even though the dose administered was only fivefold higher. According to the AUC0–∞ method, the tissue distribution sequence was kidney > plasma > skin > liver in the LD group, and shifted to kidney > stomach > spleen > skin in the HD group. The highest residual levels were consistently observed in the kidney in both groups. Notably, the most pronounced inter-tissue differences were between the stomach and plasma in the two dosage groups.
Table 1.
Pharmacokinetic parameters of enrofloxacin (ENR) and ciprofloxacin (CIP) in edible tissues from largemouth bass (Micropterus salmoides) following oral ENR administration at two dosage levels.
T1/2β values varied considerably among the three edible tissues, but no consistent dose-dependent trend was observed: for dorsal muscle and caudal muscle, T1/2β was longer in the HD group than in the LD group, whereas T1/2β for skin was slightly higher in the LD group (248.02 vs. 299.79 h). The disproportionate increase in AUC from the low to the high dose, together with the dose-dependent changes in CL/F described below, suggests nonlinear pharmacokinetic behavior. In terms of WT risk, all three edible tissues exceeded the recommended minimum threshold of 500 degree-days in the HD group, with skin posing the greatest food-safety concern (930 degree-days). By contrast, only skin in the LD group exceeded the limit of 810 degree-days. WTs for the two muscle tissues were more than twice as long in the HD group in comparison to the LD group. The withdrawal period models for ENR and CIP in the three edible tissues are presented in Figure S2.
Results for plasma and the remaining tissues are summarized in Table S7. For plasma, Tmax was 144 h in the HD group and 72 h in the LD group, which confirms delayed systemic absorption at the higher dosage. Among the absorption-related organs, the highest Cmax values were observed for the stomach (22.58 mg/kg, HD group) and intestine (1.8 mg/kg, LD group), which reflect rapid and extensive ENR uptake following oral administration. Among the excretion-related organs, the spleen had the highest AUC values (3717.77 and 382.61 h·mg/kg in the HD and LD groups, respectively) and the longest MRT (228.05 and 471.86 h, respectively). The kidney showed moderate AUC values (2765.01·h·mg/kg in the HD group and 164.10 h·mg/kg in the LD group) (p < 0.05). CL/F was consistently lower in the HD group (0.03–0.08 kg/h/kg) than in the LD group (0.05–0.21 kg/h/kg), in accordance with dose-dependent or saturable excretion.
3.3. Environmental Distribution of ENR and CIP in the Aquaculture System
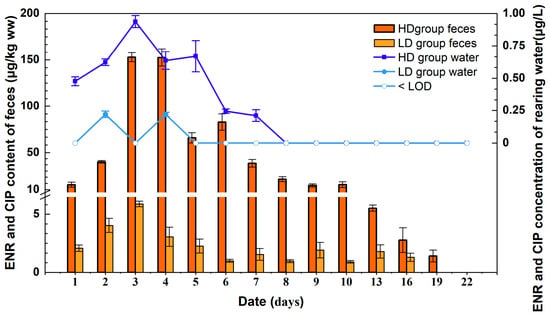
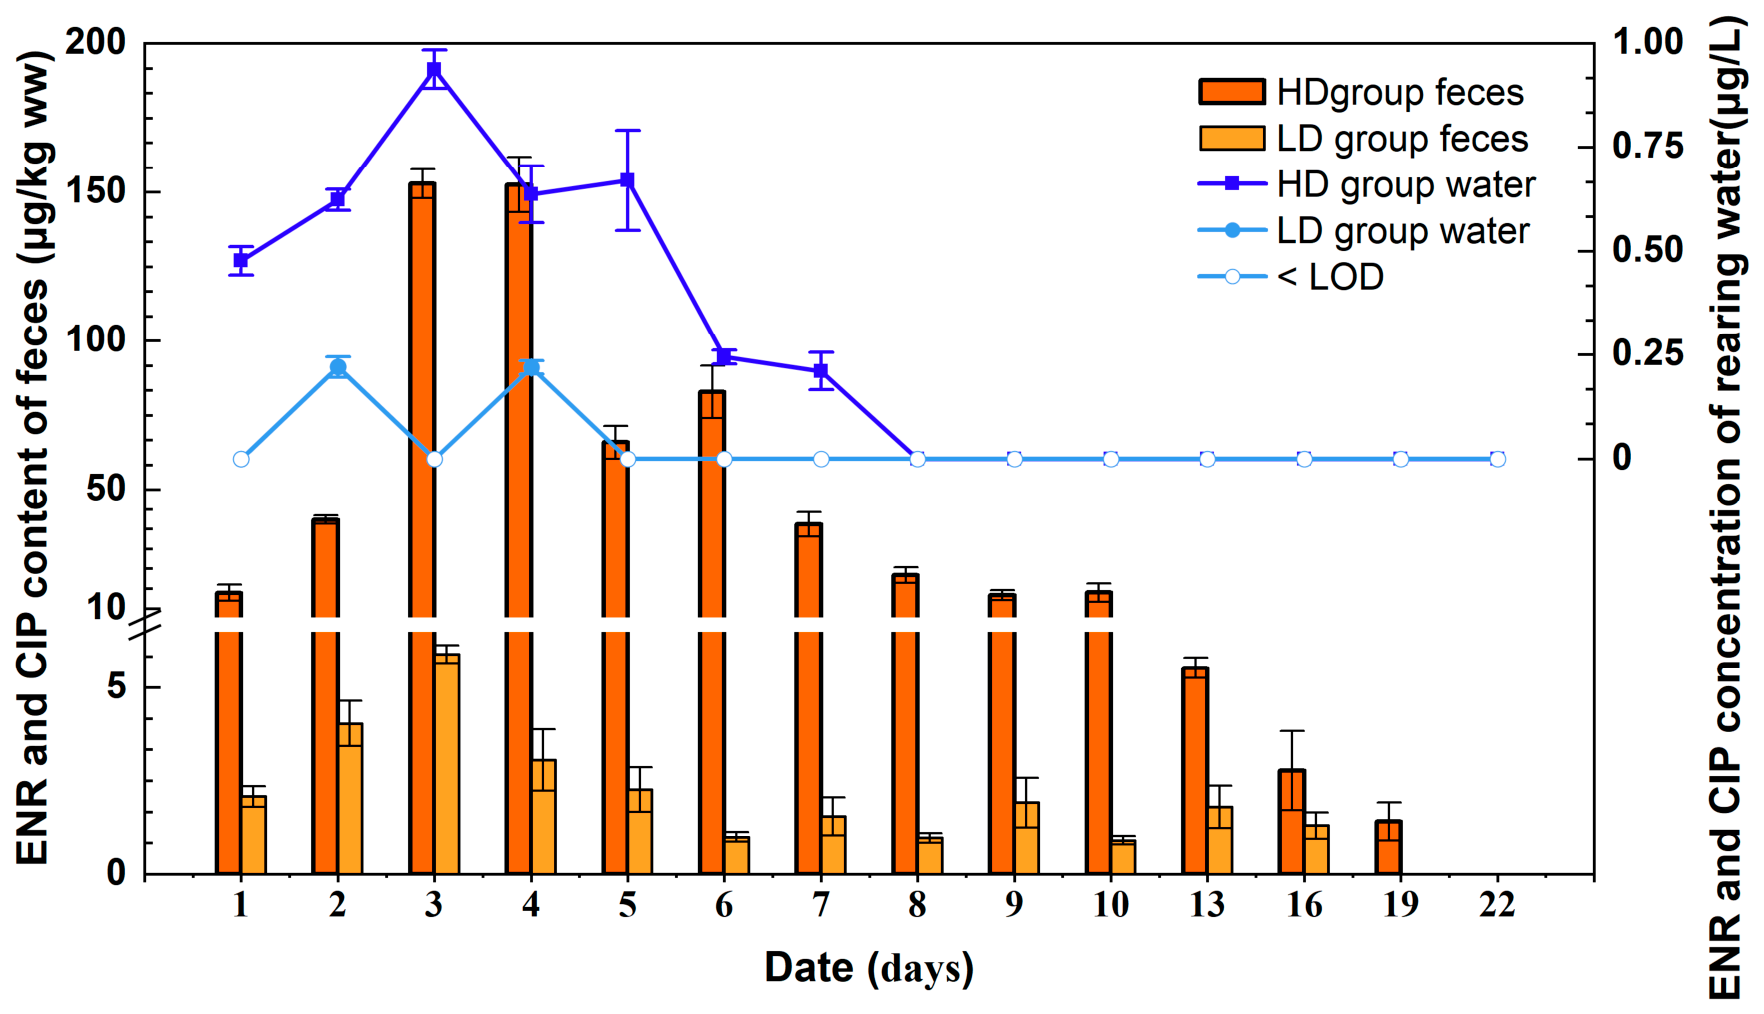
To evaluate the excretion and distribution of ENR and its metabolite CIP in the aquaculture system, dynamic distributions in feces and tank water were analyzed over the experimental period. No ENR or CIP was detected in any sample from the ENR-free control group. As shown in Figure 2, in the HD group, ENR and CIP concentrations in tank water peaked on day 3 (0.94 μg/L) and then gradually declined from days 5 to 8, becoming undetectable thereafter. In contrast, in the LD group, ENR and CIP were detected only on days 2 and 4, with concentrations between the LOD and LOQ and a peak of 0.22 μg/L on day 2. Feces result for the HD group revealed peak concentrations on day 3 (152.79 μg/kg ww) and day 4 (152.52 μg/kg ww); the levels in both groups decreased to <10 μg/kg ww by day 13. By contrast, ENR and CIP concentrations in feces remained consistently low in the LD group throughout the experiment, with a maximum value of only 5.89 μg/kg ww on day 3. The marked difference in residue levels between the two dosage groups suggests that the environmental distribution of ENR and CIP is dose-dependent.
Figure 2.
Dynamic distribution of enrofloxacin (ENR) and ciprofloxacin (CIP) in the aquaculture system after oral ENR administration at two dosage levels. Data are presented as mean ± SD (water samples: n = 3, three technical replicates per sample were averaged; fecal samples: n = 3 biological replicates).
3.4. Growth Performance and Pathological Changes in Largemouth Bass After Low-Dose (20 mg/kg) ENR Exposure
3.4.1. Growth Performance
The effects of ENR exposure on the growth of largemouth bass are presented in Table 2. During the 80-day experimental period, body weight in the control group increased from an initial value of 300.2 ± 53.1 g to a final weight of 396.2 ± 43.4 g (p < 0.05), with an WG of 32.0%. By contrast, fish exposed to LD ENR treatment showed markedly suppressed growth and reached a final body weight of only 370.3 ± 31.8 g, with an SGR of 0.26%/day, which was notably lower than for the control group (0.35%/day). Using Equation (3), Fulton’s condition factor (K) was calculated from the measurements of largemouth bass. The initial K value of largemouth bass was 1.34 ± 0.11. Over the 80-day experimental period, K showed a trend of first increasing and then decreasing, reaching a peak on day 28 and declining somewhat by day 80. The control group exhibited a similar temporal trend. Although the K values in the low-dose enrofloxacin (LD) group were slightly lower than those in the control group at all measured time points, the difference between the two groups was not significant (p > 0.05), and both groups showed similar temporal patterns. These results suggest that ENR administration at dose of 20 mg/kg reduced weight gain in the LD group, together with unchanged K values, suggests that LD treatment suppressed overall growth rather than altering body shape or condition.
Table 2.
Growth parameters for largemouth bass (Micropterus salmoides) exposed to low-dose ENR over 80 days. Data are presented as mean ± SD (n = 3).
3.4.2. Oxidative Stress Parameters in Excretion-Related Organs
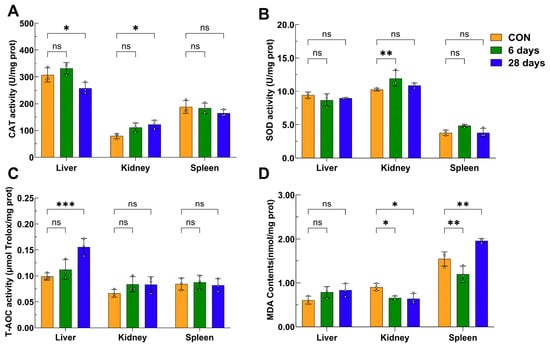
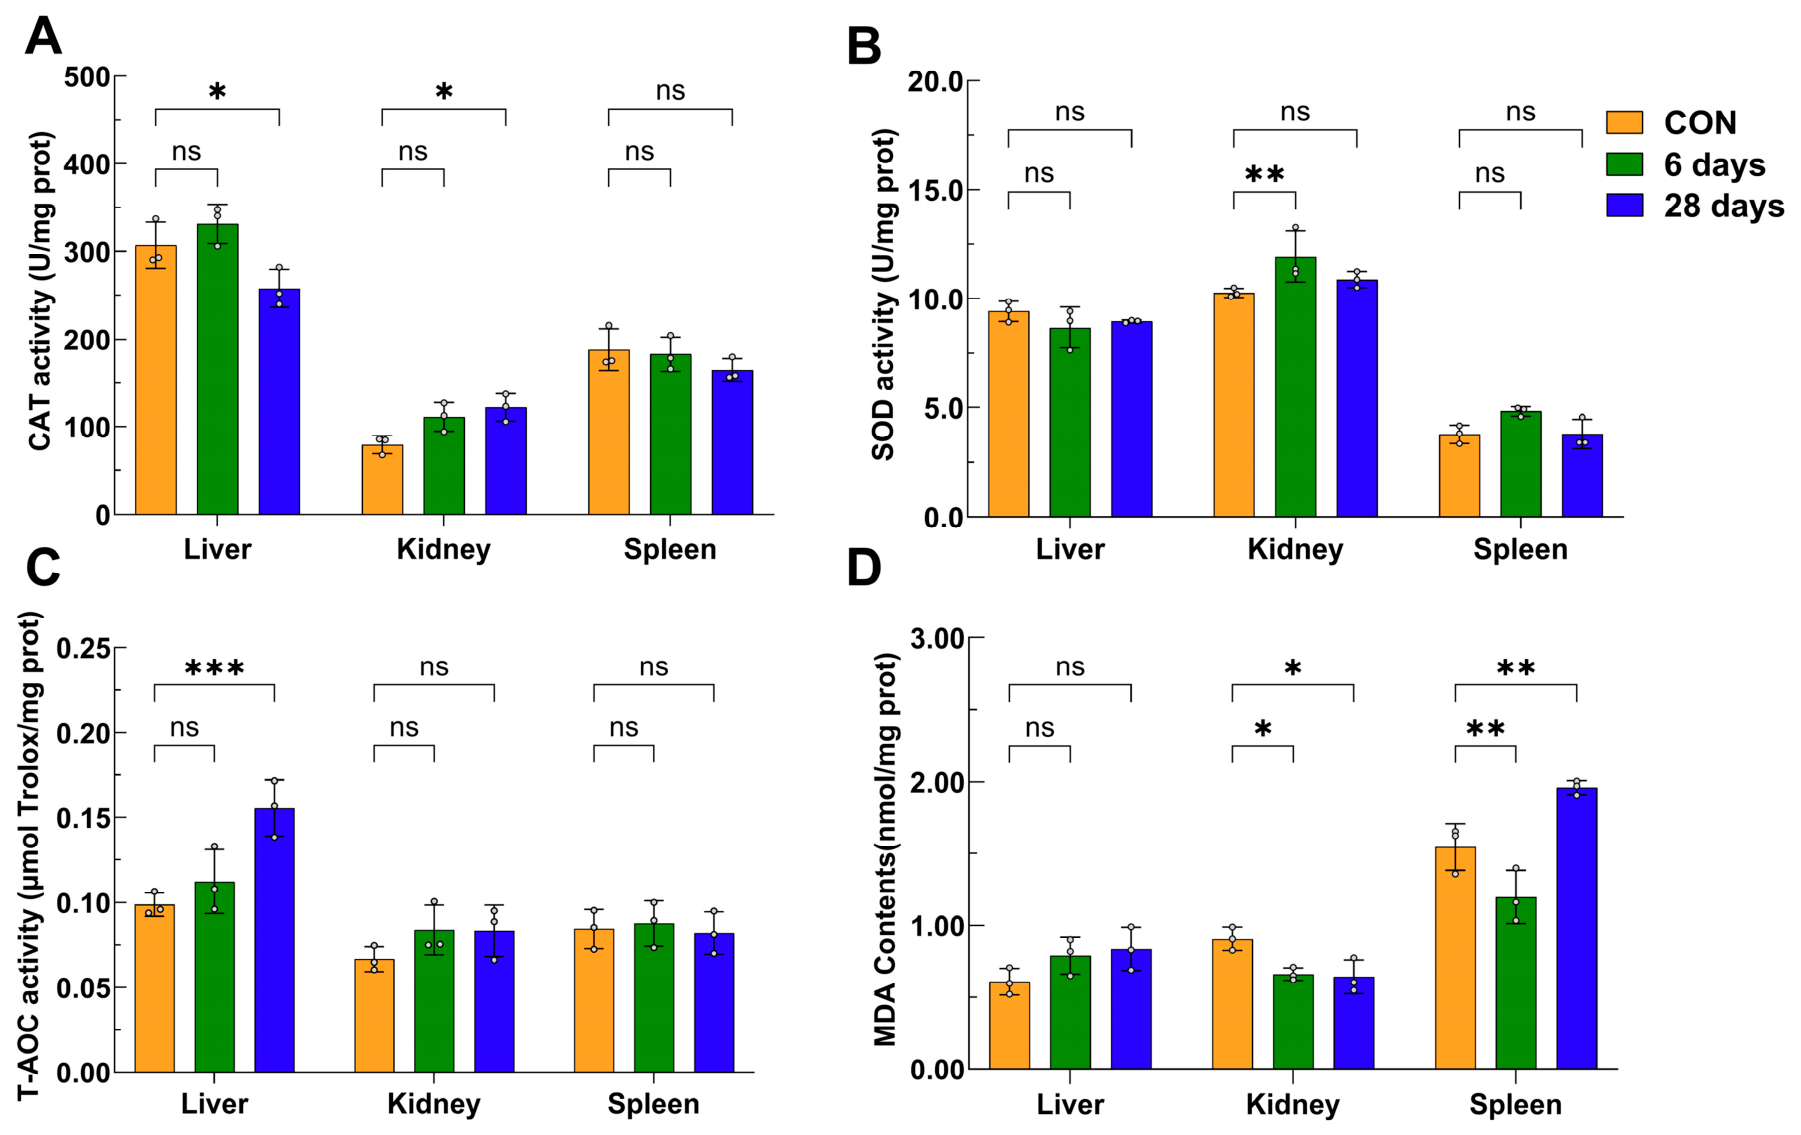
We measured CAT and SOD enzyme activity and T-AOC and MDA levels to evaluate the effects of ENR metabolism on oxidative stress (Figure 3). ENR treatment resulted in marked tissue-specific patterns for these oxidative stress parameters in excretion-related organs. The liver, as the primary metabolic organ, showed compensatory elevation of T-AOC (Figure 3C) in comparison to the control group (p < 0.05) by day 28; however, CAT activity had decreased significantly by this time point. In the kidney, CAT activity levels at 28 days and SOD activity levels at 6 days were significantly higher than those in the control group, whereas MDA levels were significantly lower (p < 0.05) than in the control group at both time points (Figure 3A,B,D); these results indicate that the kidney effectively maintained redox homeostasis under ENR stress. Notably, we observed a biphasic pattern for MDA levels in the spleen, with a significant initial decrease followed by a sharp increase (p < 0.05); the highest value of 1.9610 nmol/mg was observed at 28 days (Figure 3D). This pattern indicates that the spleen is highly susceptible to delayed oxidative damage under prolonged ENR exposure.
Figure 3.
Effects of enrofloxacin (ENR) on oxidative stress parameters in the liver, kidney, and spleen of largemouth bass (Micropterus salmoides) in the LD group and the control (CON) group. (A) CAT activity; (B) SOD activity; (C) T-AOC activity; and (D) MDA content. Data are presented as mean ± SD (n = 3 fish per group). The experimental unit was the individual fish, with liver, kidney, and spleen sampled from the same fish. Statistical significance was determined using two-way ANOVA with treatment group (CON, LD-6d, and LD-28d) and organ (liver, kidney, spleen) as factors, followed by Dunnett’s multiple comparisons test to compare the LD-6d and LD-28d groups with the CON group within each organ. * p < 0.05, ** p < 0.01, *** p < 0.001, versus CON; ns, not significant (p ≥ 0.05).
3.4.3. Pathological Changes in Excretion-Related Organs
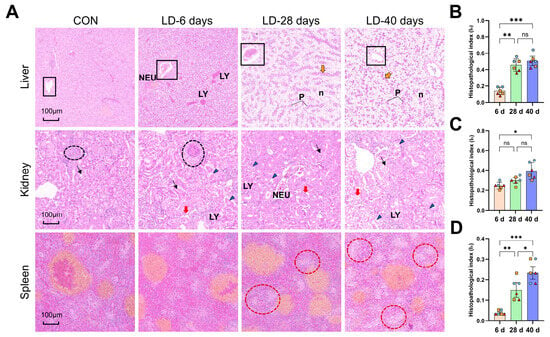
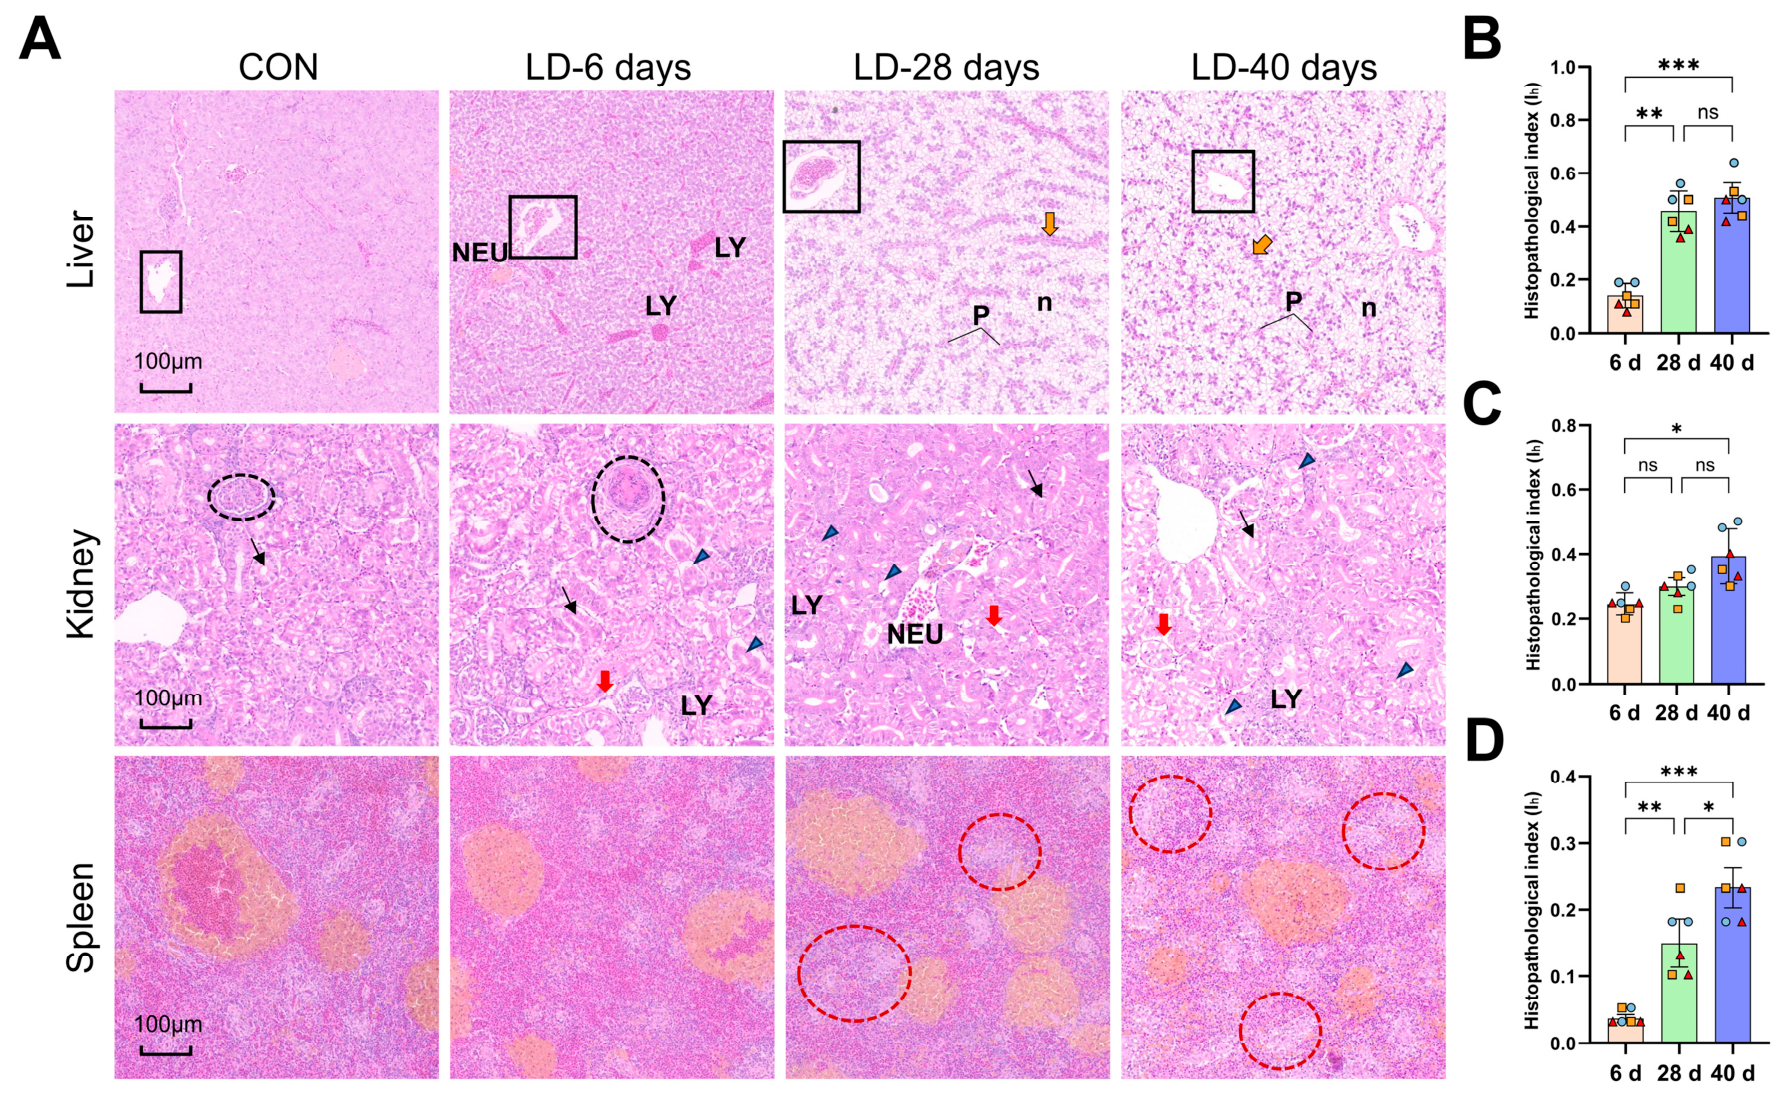
Histopathological changes in the liver, kidney, and spleen are shown in Figure 4A, and the corresponding semi-quantitative histopathological indices are presented in Figure 4B–D. The control group had normal hepatic architecture. In the LD group, progressive hepatocellular damage was observed after ENR exposure, including cellular swelling, vacuolar degeneration, neutrophil and lymphocyte infiltration (at 6 days, score 2), hemocyte infiltration into the central vein (at 6 and 28 days, score 2), and extensive necrosis with pyknosis and hepatic cord disruption (at 28 and 40 days, score 3), which together indicate time-dependent aggravation of hepatic injury. Consistent with these histopathological changes, the hepatic histopathological index was significantly lower on day 6 than on days 28 and 40 (p < 0.05) (Figure 4B).
Figure 4.
(A) Histopathological changes in the liver, kidney, and spleen of largemouth bass (Micropterus salmoides) following low-dose enrofloxacin (ENR) exposure at different time intervals (6, 28, and 40 days). Hematoxylin and eosin staining. Scale bars = 100 μm. Abbreviations: NEU, neutrophils; LY, lymphocytes; P, pyknosis; n, necrosis. Black boxes indicate hemocyte infiltration into the central vein; yellow arrows indicate hepatic cord disruption; black circles indicate neutrophil infiltration into the glomeruli; red arrows indicate interstitial fibrosis and tubular atrophy; black arrows indicate necrosis and sloughing of renal tubular epithelial cells; blue arrows indicate the presence of cellular debris within the tubular lumen; red circles indicate splenic necrosis. (B–D) Semi-quantitative analysis of histopathological indices in the liver (B), kidney (C), and spleen (D). Data are presented as mean ± SD of tank-level values (n = 3 tanks per group per time point). Individual fish values (two fish per tank) are shown as separate points with different colors and symbols denoting. Individual fish values are shown as separate points, with the same color and symbol indicating fish from the same replicate tank. For each organ, differences among the 6 d, 28 d, and 40 d groups were assessed using one-way ANOVA followed by Tukey’s multiple comparisons test. * p < 0.05, ** p < 0.01, *** p < 0.001 between indicated groups; ns, not significant (p ≥ 0.05).
In the kidney, ENR exposure induced glomerular neutrophil infiltration, interstitial fibrosis, tubular atrophy, and acute tubular necrosis with cellular debris in the lumina. At 28 days, glomerular cell proliferation and basement membrane thickening were observed, and by 40 days, extensive cytoplasmic rarefaction was evident. The renal histopathological index was significantly higher (p < 0.05) on day 40 than on day 6 (Figure 4C). In the spleen, no obvious lesions were observed at 6 days. However, at 28 and 40 days, splenic parenchymal cell disintegration and necrosis were evident, indicating a pattern of delayed-onset injury. The splenic histopathological index showed a significant upward trend (p < 0.05) with prolonged exposure time in the LD group (Figure 4D).
4. Discussion
ENR is a lipophilic antibiotic with significant species-specific accumulation in fish [24]. We found that at both experimental dosages, ENR showed rapid distribution and slow excretion in largemouth bass, with greater peak accumulation and distribution levels, along with a much slower excretion rate in the HD group.
The ENR tissue distribution in largemouth bass exhibited a clear dose-dependent pattern. According to AUC0–∞ values, plasma was the major distribution site in the LD group, whereas in the H group, its role in ENR distribution ranked below kidney, stomach, spleen, and muscle with skin. This dose-dependent shift in plasma distribution is consistent with the negative correlation between ENR concentrations and the protein binding rate in plasma, as reported by Xu et al. [32] observed a decline from 39.1% to 7.77% as the ENR concentration was increased from 1 to 10 µg/mL. The lower plasma level at the higher ENR dosage was accompanied by markedly higher accumulation in visceral organs, which can be mechanistically attributed to the well-recognized affinity of ENR for lipid-rich tissues [33]. By contrast, edible tissues had relatively lower ENR levels, presumably because of distribution via systemic circulation after the drug enters the bloodstream [34]. Nevertheless, muscle with skin consistently showed a higher accumulation risk across different administration routes. This finding is corroborated by previous studies: bath exposure resulted in highest ENR levels in plasma, followed by the kidney, liver, and muscle with skin [5], whereas oral administration yielded a ranking of liver > muscle with skin > plasma [35]. These observations collectively support the tissue distribution pattern observed in our study.
A finding of particular concern for food safety is that although there was only a fivefold difference in ENR dose between the HD and LD regimens, the resulting tissue residues increased disproportionately: the difference was approximately fivefold in plasma and, more strikingly, sevenfold to 12-fold in edible tissues. Notably, residues in muscle tissues exceeded the MRL of 0.10 mg/kg in both groups, but with marked differences in persistence: ENR was detectable up to day 28 in the HD group versus only day 7 in the LD group. According to the WT values calculated, the dose escalation resulted in approximately twofold prolongation, which supports the occurrence of nonlinear excretion kinetics and is consistent with a previous report. Runlin et al. [36] found that ENR doses of 20 and 50 mg/kg in rainbow trout (Oncorhynchus mykiss) resulted in WTs of 32 days and 42 days (15 ± 2 °C), respectively; their results also indicate that WT did not increase in proportion to the ENR dose. A critical finding from our study is the exceptionally slow ENR excretion from skin tissue. This is similar to a report by Shan et al. [35] on largemouth bass in which muscle with skin had the second longest T1/2β value of 115.14 h, with 24 days required to reach the ENR MRL [35]. In the present study, WT for the HD group was 930 degree-days, which closely approximates the 925 degree-days recommended for bath-exposed largemouth bass by Shan et al. [5]. However, yellow catfish (Pelteobagrus fulvidraco) exposed to ENR for 3 days at 20 mg/kg exhibited an even longer WT of 1080 degree-days under similar conditions [32]. These findings underscore the need to strictly determine WT values on the basis of the edible tissue with the slowest depuration (i.e., skin) rather than on muscle alone for management of potential human health risks.
And previous studies have demonstrated that antibiotics exhibit tissue-specific distribution and accumulation patterns in fish. In crucian carp, repeated oral administration of enrofloxacin (ENR) by gavage at 20 mg/kg for 5 days resulted in maximum concentrations of 74.5 μg/g in the kidney and 26.8 μg/g in muscle–skin tissue [37]. Similarly, in northern snakehead, repeated oral administration of ENR by gavage at 10 mg/kg for 5 days resulted in a longer elimination half-life in the kidney (126.07 h) than in muscle with adhering skin (83.24 h) [38]. In the present study, ENR concentrations in the kidney and skin peaked on day 3 (1.54 mg/kg) and day 5 (0.876 mg/kg) in the 20 mg/kg dosage group, respectively, also indicating stronger accumulation in the kidney. Compared with accumulation characteristics of other antibiotics, for instance, following a single oral dose of oxolinic acid (30 mg/kg) via medicated feed, the highest tissue concentration was observed in the kidney (Cmax 17.99 mg/L), whereas the muscle reached 4.54 mg/L [39]. These findings indicate that ENR displays a relatively moderate but tissue-specific bioaccumulation profile.
Previous studies have revealed dose-related growth inhibition in fish and an increase in metabolic burden following long-term ENR exposure [40]. We observed consistent reduction in weight gain in the LD group, whereas K remained stable, indicating that the reduced growth was not accompanied by obvious changes in body shape or condition. Nevertheless, oxidative stress [41] and histopathological changes in excretion-related organs may contribute to the reduction in weight gain. In our study, the excretion-related organs showed primary injury as early as day 6, and severe toxicity by day 28 at lower doses. The liver, as the primary metabolic organ, can develop hepatosteatosis even at environmentally relevant ENR concentrations [42]. The spleen and kidney represent important target organs for assessing immune responses and environmental stress in fish [43]. These findings are consistent with a previous study in large yellow croaker (Larimichthys crocea) in which exposure to ENR and atrazine at environmental levels induced oxidative stress and elevated liver injury, both indicating hepatotoxicity [44].
The tissue damage observed, particularly in the kidney and liver, is consistent with the hypothesis that ENR excretion is prolonged. This aligns with the lipid-rich nature of these organs and their tendency for accumulation of higher residue levels with longer excretion half-lives [45,46]. Moreover, given that ENR is primarily eliminated renally and that its metabolite CIP is eliminated via both renal and hepatic routes [18,38], the renal impairment observed would logically impede excretion. Notably, while an ENR dose of 20 mg/kg is widely regarded as highly effective against aquatic pathogens [13]. Our results indicate that the nominal dose of 20 mg/kg was associated with changes in growth performance, oxidative stress responses, and histopathological features in the LD group. Further studies are needed to clarify the potential relationships between these physiological responses and ENR residue accumulation and elimination.
A limitation of our study should be acknowledged: the sampling design did not include frequent time points immediately following final ENR administration. Since enrofloxacin is water-soluble, the amount of feed offered cannot be equated with the actual dose ingested by the fish. According to a previous report, a secondary ENR concentration peak may occur at 1–6 h on day 5 after administration of the last dose [37]. Studies with more intensive sampling schedules would help in better characterization of the full ENR depletion profile and refinement of WT estimates. Although medicated-feed administration reflects a commonly used drug delivery route in aquaculture, the nominal dose does not necessarily correspond to the amount of ENR ingested or absorbed by individual fish. The experimental conditions differed from industrial-scale recirculating aquaculture system (RAS) conditions in terms of water exchange, exercise intensity, and feed wastage. These factors may alter the actual ingested dose. Therefore, semi-commercial validation is needed before the results can be applied to practical aquaculture.
5. Conclusions
Our study provides a systematic assessment of the impact of ENR on largemouth bass aquaculture, from individual physiology to environmental safety. A fivefold increase in the ENR dose administered led to disproportionately higher ENR accumulation (7- to 12-fold) in edible tissues and a significantly prolonged excretion phase, which confirms the nonlinear pharmacokinetics of the antibiotic. Among edible tissues, skin was identified as the primary ENR accumulation site with the slowest excretion rate and thus poses the greatest risk to food safety. The WT for skin (930 degree-days in the HD group) exceeded the recommended threshold. At the recommended low dose (20 mg/kg), ENR exposure impaired growth performance (e.g., reduced weight gain and specific growth rate) and induced oxidative stress, while time-dependent histopathological damage to the excretory organs led to delayed excretion. Overall, these findings demonstrate that the high-dose regimen is untenable for food safety because of the excessively long WT. This study provides a scientific rationale for ENR dose optimization and highlights the need for strict regulation of drug use to ensure food safety and mitigate the environmental risks associated with ENR treatment.
Supplementary Materials
The following supporting information can be downloaded at https://www.mdpi.com/article/10.3390/toxics14110963/s1: Text S1: Reagents and materials; Text S2: Randomization and blinding; Text S3: Chromatographic conditions; Text S4: Quality control and method validation; Text S5: Detailed histopathological procedures; Text S6: Semi-quantitative analysis; Text S7: Detection ranges and validation information of the antioxidant assay kits; Figure S1: Time-concentration profiles of enrofloxacin and ciprofloxacin in the plasma of largemouth bass (Micropterus salmoides); Figure S2: Withdrawal period models of enrofloxacin and its metabolite ciprofloxacin in three edible tissues of largemouth bass (Micropterus salmoides); Table S1: Water quality parameters during the acclimation and exposure periods in each treatment group (Mean ± SD); Table S2: Mortality of largemouth bass in each treatment group during the experimental period; Table S3: Results of enrofloxacin and ciprofloxacin in reagent and sample blanks; Table S4: The assigned histopathological weights (w); Table S5 Semiquantitative scoring criteria for histopathological lesions; Table S6: Relative proportions of ciprofloxacin of the combined enrofloxacin and ciprofloxacin residues in dorsal epaxial muscle, caudal peduncle muscle, skin, feces, and water samples (Mean ± SD, n = 3); Table S7: Pharmacokinetic parameters of enrofloxacin and its metabolite ciprofloxacin in the plasma and six tissues of largemouth bass (Micropterus salmoides) following oral administration of enrofloxacin at two dosage levels. References [27,28,29,30,31] are cited in Supplementary Materials.
Author Contributions
Conceptualization, H.W.; data curation, Y.Z. and H.W.; validation, T.D. and Y.D.; resources, T.D., Y.D., G.Z., Z.T. and Z.Z.; writing—original draft preparation, Y.Z.; writing—review and editing, H.W., T.D. and Y.D.; visualization, Y.Z.; supervision, G.Z., Z.T. and Z.Z.; project administration, G.Z., Z.T. and Z.Z. All authors have read and agreed to the published version of the manuscript.
Funding
This work was supported by the Central Public-interest Scientific Institution Basal Research Fund, CAFS (Grant No. 2026XT150302) and the Hebei Province Modern Agriculture Industry Technology System Freshwater Aquaculture Innovation Team (Grant No. HBCT2023230203).
Institutional Review Board Statement
The animal study protocol was approved by the Institutional Animal Care and Use Committee of the Yellow Sea Fisheries Research Institute (protocol code YSFRI-2026089 and date of approval: 3 July 2026).
Informed Consent Statement
Not applicable.
Data Availability Statement
All data supporting the findings of this work are contained within this article. Requests for additional information should be addressed to the corresponding author.
Acknowledgments
During the preparation of this manuscript, the authors used DeepSeek (DeepSeek-V4.1-Flash) for the purposes of language editing, grammatical revision, and improving readability. The authors have reviewed and edited the output and take full responsibility for the content of this publication.
Conflicts of Interest
The authors declare no conflict of interest.
References
- Hou, H.C.; Ren, A.Q.; Yu, L.; Ma, Z.; Zhang, Y.; Liu, Y. An environmental impact assessment of largemouth bass (Micropterus salmoides) aquaculture in Hangzhou, China. Sustainability 2023, 15, 12368. [Google Scholar] [CrossRef] [Scilit]
- Zhu, L.; Meng, S.; Fang, L.; Li, Z.; Yang, R.; Qiu, L.; Zhong, L.; Song, C. Intra-species differences shape differences of enrofloxacin residues and its degradation products in tilapia: A precise risk assessment. J. Hazard. Mater. 2024, 476, 135151. [Google Scholar] [CrossRef] [Scilit] [PubMed]
- She, S.; Ye, Y.; Guo, F.; Yang, S.; Huang, M.; Fei, H. MsCL-p1: A multifunctional c-type lectin from largemouth bass (Micropterus salmoides) with broad microbe binding and agglutination activities. Comp. Immunol. Rep. 2025, 8, 200201. [Google Scholar] [CrossRef] [Scilit]
- Ministry of Agriculture and Rural Affairs of the People’s Republic of China. China Fisheries Statistical Yearbook 2025; China Agriculture Press: Beijing, China, 2025.
- Shan, Q.; Zhang, M.; Xu, F.; Zhou, H.; Ma, L.; Li, L.; Lin, J.; Liu, S.; Yin, Y. Pharmacokinetics, withdrawal time, and dietary risk assessment of enrofloxacin in the largemouth bass (Micropterus salmoides) after bath immersion. Aquac. Rep. 2026, 47, 103472. [Google Scholar] [CrossRef] [Scilit]
- GB 31650-2019; National Food Safety Standard: Maximum Residue Limits of Veterinary Drugs in Foods. China Agriculture Press: Beijing, China, 2019.
- Ministry of Agriculture and Rural Affairs of the People’s Republic of China; National Fisheries Technology Extension Center; Chinese Academy of Fishery Sciences. Aquaculture Drug Use Information Sheet (2026 No. 1, 2, and 3); China Agriculture Press: Beijing, China, 2026.
- Bao, R.; Yang, Y.; Chen, H.J.; Li, Y.X. Occurrence, distribution and health risk assessment of quinolone residues in cultured fish in southeast China. J. Environ. Sci. Health B 2024, 59, 714–724. [Google Scholar] [CrossRef] [Scilit] [PubMed]
- Tang, Y.; Lou, X.; Yang, G.; Tian, L.; Wang, Y.; Huang, X. Occurrence and human health risk assessment of antibiotics in cultured fish from 19 provinces in China. Front. Cell. Infect. Microbiol. 2022, 12, 964283. [Google Scholar] [CrossRef] [Scilit] [PubMed]
- Mallick, C.; Sreedevi, A.; Mukherjee, T.K.; Pal, D.; Das, R.; Mondal, S.; Gautam, M. Accessibility, detection, bioaccumulation, concentration and toxicity studies of antibiotics in fish. Aquat. Toxicol. 2025, 287, 107525. [Google Scholar] [CrossRef] [Scilit] [PubMed]
- López-Cadenas, C.; Sierra-Vega, M.; García-Vieitez, J.J.; Diez-Liébana, M.J.; Sahagún-Prieto, A.; Fernández-Martínez, N. Enrofloxacin: Pharmacokinetics and metabolism in domestic animal species. Curr. Drug Metab. 2013, 14, 1042–1058. [Google Scholar] [CrossRef] [Scilit] [PubMed]
- Rairat, T.; Kumphaphat, S.; Chuchird, N.; Srisapoome, P.; Phansawat, P.; Keetanon, A.; Liu, Y.K.; Chou, C.C. Pharmacokinetics, optimal dosages and withdrawal time of florfenicol in Asian seabass (Lates calcarifer) after oral administration via medicated feed. J. Fish Dis. 2023, 46, 75–84. [Google Scholar] [CrossRef] [Scilit] [PubMed]
- Xu, N.; Zhou, S.; Dong, J.; Li, J.T.; Ding, Y.Z.; Ai, X.H. Population pharmacokinetics of enrofloxacin in Micropterus salmoides based on a nonlinear mixed effect model after intravenous and oral administration. Animals 2025, 15, 1362. [Google Scholar] [CrossRef] [Scilit] [PubMed]
- Zhang, H. Study on the Elimination Rule of Enrofloxacin and Its Metabolites Residue in Largemouth Bass and Grass Carp. Master’s Thesis, Wuhan Polytechnic University, Wuhan, China, 2023. [Google Scholar]
- Fan, R.Q.; Wang, X.Y.; Ren, Y.Y.; Li, S.; Guo, W.F.; Liu, J.Q.; Mu, Y.C.; Wang, X.Y.; Xia, S.D.; Cheng, B. Effect of water temperature on the depletion of enrofloxacin and its metabolite ciprofloxacin in largemouth bass (Micropterus salmoides) tissue following repeated oral administrations. Aquaculture 2026, 612, 743154. [Google Scholar] [CrossRef] [Scilit]
- Phu, T.M.; Douny, C.; Scippo, M.L.; De Pauw, E.; Thinh, N.Q.; Huong, D.; Vinh, H.P.; Phuong, N.T.; Dalsgaard, A. Elimination of enrofloxacin in striped catfish (Pangasianodon hypophthalmus) following on-farm treatment. Aquaculture 2015, 438, 1–5. [Google Scholar] [CrossRef] [Scilit]
- Grabowski, L.; Gaffke, L.; Pierzynowska, K.; Cyske, Z.; Choszcz, M.; Wegrzyn, G.; Wegrzyn, A. Enrofloxacin-the ruthless killer of eukaryotic cells or the last hope in the fight against bacterial infections? Int. J. Mol. Sci. 2022, 23, 3648. [Google Scholar] [CrossRef] [Scilit] [PubMed]
- Poapolathep, S.; Giorgi, M.; Chaiyabutr, N.; Chokejaroenrat, C.; Klangkaew, N.; Phaochoosak, N.; Wongwaipairote, T.; Poapolathep, A. Pharmacokinetics of enrofloxacin and its metabolite ciprofloxacin in freshwater crocodiles (Crocodylus siamensis) after intravenous and intramuscular administration. J. Vet. Pharmacol. Ther. 2020, 43, 19–25. [Google Scholar] [CrossRef] [Scilit] [PubMed]
- Liu, C.; Pan, K.; Xu, H.; Song, Y.; Qi, X.; Lu, Y.; Jiang, X.; Liu, H. The effects of enrofloxacin exposure on responses to oxidative stress, intestinal structure and intestinal microbiome community of largemouth bass (Micropterus salmoides). Chemosphere 2024, 348, 140751. [Google Scholar] [CrossRef] [Scilit] [PubMed]
- Medne, R.; Kokorite, I.; Bartkevics, V.; Kublina, A.; Niemi, A.; Plostins, H.; Vehi, M.; Mingarelli, S. Linking aquaculture practices to antibiotic occurrence, accumulation, and environmental risk in freshwater systems. Aquat. Toxicol. 2026, 292, 107744. [Google Scholar] [CrossRef] [Scilit] [PubMed]
- Burridge, L.; Weis, J.S.; Cabello, F.; Pizarro, J.; Bostick, K. Chemical use in salmon aquaculture: A review of current practices and possible environmental effects. Aquaculture 2010, 306, 7–23. [Google Scholar] [CrossRef] [Scilit]
- Rico, A.; Phu, T.M.; Satapornvanit, K.; Min, J.; Shahabuddin, A.M.; Henriksson, P.; Murray, F.J.; Little, D.C.; Dalsgaard, A.; van den Brink, P.J. Use of veterinary medicines, feed additives and probiotics in four major internationally traded aquaculture species farmed in Asia. Aquaculture 2013, 412, 231–243. [Google Scholar] [CrossRef] [Scilit]
- Guo, Z.F.; Boeing, W.J.; Xu, Y.Y.; Borgomeo, E.; Liu, D.; Zhu, Y.G. A systematic workflow of data mining confirms widespread occurrence of antibiotic contamination in freshwater reservoirs. Expo. Health 2023, 15, 889–901. [Google Scholar] [CrossRef] [Scilit]
- Xi, F. The enrofloxacin pollution control from fish to environment. Mar. Pollut. Bull. 2024, 199, 115923. [Google Scholar] [CrossRef] [Scilit] [PubMed]
- Lourenço, T.; Rocha, M.J.O.; Rocha, E.; Madureira, T.V. A double challenge for fish: The combined stress of warming and pharmaceuticals in aquatic systems. J. Xenobiot. 2025, 15, 190. [Google Scholar] [CrossRef] [Scilit] [PubMed]
- Jia, R.; Wang, L.; Hou, Y.R.; Feng, W.R.; Li, B.; Zhu, J. Effects of stocking density on the growth performance, physiological parameters, redox status and lipid metabolism of Micropterus salmoides in integrated rice-fish farming systems. Antioxidants 2022, 11, 1215. [Google Scholar] [CrossRef] [Scilit] [PubMed]
- Bernet, D.; Schmidt, H.; Meier, W.; Holm, P.B.; Wahli, T. Histopathology in fish: Proposal for a protocol to assess aquatic pollution. J. Fish Dis. 1999, 22, 25–34. [Google Scholar] [CrossRef] [Scilit]
- Costa, P.M.; Carreira, S.; Costa, M.H.; Caeiro, S. Development of histopathological indices in a commercial marine bivalve (Ruditapes decussatus) to determine environmental quality. Aquat. Toxicol. 2013, 126, 442–454. [Google Scholar] [CrossRef] [Scilit] [PubMed]
- Almeida, D.S.M. Histopathological Evaluation of Two Blennius Fishes Exposed to Microplastics via Feeding. Master′s Thesis, Universidade Nova de Lisboa, Lisbon, Portugal, 2017. [Google Scholar]
- Geng, Q.; Zou, L.; Guo, M.; Peng, J.; Li, F.; Bi, Y.; Jiang, S.; Qin, H.; Tan, Z. Insights into the combined toxicity and mechanisms of BDE-47 and PFOA in marine blue mussel: An integrated study at the physiochemical and molecular levels. Aquat. Toxicol. 2024, 273, 106999. [Google Scholar] [CrossRef] [Scilit] [PubMed]
- Ugrin, M.; Fernandez Godoy, M.; Restović, I.; Hrabar, J.; Kević, N.; Bočina, I. Cage-farming causes histopathological alterations in the renal tissues of the rainbow trout Oncorhynchus mykiss (Walbaum, 1792). Int. J. Mol. Sci. 2025, 26, 10876. [Google Scholar] [CrossRef] [Scilit] [PubMed]
- Xu, N.; Sun, W.Y.; Zhang, H.; Li, Z.; Cheng, B.; Ding, Y.Z.; Ai, X.H. The assessment of withdrawal interval for enrofloxacin in yellow catfish (Pelteobagrus fulvidraco) after multiple oral administrations at disparate temperatures. Animals 2023, 13, 2568. [Google Scholar] [CrossRef] [Scilit] [PubMed]
- Zhang, X.R.; Zhang, J.C.; Han, Q.F.; Wang, X.L.; Wang, S.G.; Yuan, X.Z.; Zhang, B.Y.; Zhao, S. Antibiotics in mariculture organisms of different growth stages: Tissue-specific bioaccumulation and influencing factors. Environ. Pollut. 2021, 288, 117715. [Google Scholar] [CrossRef] [Scilit] [PubMed]
- Zhang, M.L.; Zheng, G.M.; Yin, Y.; Zhou, H.; Ma, L.S.; Li, L.C.; Lin, J.W.; Liu, S.G.; Zhao, C.; Dai, X.X.; et al. Pharmacokinetics, withdrawal period and risk assessment of enrofloxacin in the northern snakehead (Channa argus) following bath administration. J. Vet. Pharmacol. Ther. 2024, 47, 134–142. [Google Scholar] [CrossRef] [Scilit] [PubMed]
- Shan, Q.; Wang, J.X.; Zheng, G.M.; Zhu, X.P.; Yang, Y.H.; Ma, L.S.; Zhao, C.; Li, L.C.; Yin, Y. Pharmacokinetics and tissue residues of enrofloxacin in the largemouth bass (Micropterus salmoides) after oral administration. J. Vet. Pharmacol. Ther. 2020, 43, 147–152. [Google Scholar] [CrossRef] [Scilit] [PubMed]
- Runlin, Y.S.C.B. Pharmacokinetics of enrofloxacin and its metabolite ciprofloxacin in rainbow trout Oncorhynchus mykiss orally administrated at two doses. J. Dalian Fish. Univ. 2021, 36, 985–994. [Google Scholar] [CrossRef]
- Shan, Q.; Huang, H.Q.; Zheng, G.M.; Yin, Y.; Zhu, X.P.; Ma, L.S.; Zhou, H.; Xie, W.P.; Li, L.C.; Liu, S.G.; et al. Pharmacokinetics and tissue residue profiles of enrofloxacin in crucian carp (Carassius auratus gibelio) following single and multiple oral administration. Front. Vet. Sci. 2022, 9, 872828. [Google Scholar] [CrossRef] [Scilit] [PubMed]
- Zhang, W.J.; Wang, J.X.; Zheng, G.M.; Yin, Y.; Zhu, X.P.; Shan, Q.; Yang, Y.H.; Ma, L.S.; Li, L.C.; Liu, S.G. Pharmacokinetics, tissue distribution, and depletion of enrofloxacin and its metabolite ciprofloxacin in the northern snakehead (Channa argus) following multiple oral administration. Aquaculture 2021, 533, 736183. [Google Scholar] [CrossRef] [Scilit]
- Yang, J.; Li, M.; Chen, X.; Song, C.; Fan, L.; Qiu, L.; Li, D.; Xu, H.; Li, T.; Huang, Y.; et al. Integrative pharmacokinetic and metabolomic analyses reveal the underlying mechanisms of metabolic regulation and support the safe use of oxolinic acid in Micropterus salmoides. Antioxidants 2026, 15, 283. [Google Scholar] [CrossRef] [Scilit] [PubMed]
- Cao, X.Q.; Wang, X.; Liu, B.; He, S.W.; Cao, Z.H.; Xing, S.Y.; Li, P.; Li, Z.H. Evaluation of physiological stress of grass carp chronically exposed to enrofloxacin based on IBR index. Water Air Soil Pollut. 2023, 234, 548. [Google Scholar] [CrossRef] [Scilit]
- Badawy, S.; Yang, Y.; Liu, Y.; Marawan, M.A.; Ares, I.; Martinez, M.A.; Martínez-Larrañaga, M.R.; Wang, X.; Anadón, A.; Martínez, M. Toxicity induced by ciprofloxacin and enrofloxacin: Oxidative stress and metabolism. Crit. Rev. Toxicol. 2021, 51, 754–787. [Google Scholar] [CrossRef] [Scilit] [PubMed]
- Wei, X.L.; Xu, Y.C.; Tan, X.Y.; Lv, W.H.; Zhang, D.G.; He, Y.; Luo, Z. Enrofloxacin (ENR) exposure induces lipotoxicity by promoting mitochondrial fragmentation via dephosphorylation of DRP1 at s627 site. Chemosphere 2023, 340, 139892. [Google Scholar] [CrossRef] [Scilit] [PubMed]
- Qiang, J.; Tao, Y.F.; He, J.; Li, H.X.; Xu, P.; Sao, J.W.; Sun, Y.L. Inhibition of mir-92d-3p enhances inflammation responses in genetically improved farmed tilapia (GIFT, Oreochromis niloticus) with Streptococcus iniae infection by modulating complement c3. Fish Shellfish Immunol. 2017, 63, 367–375. [Google Scholar] [CrossRef] [Scilit] [PubMed]
- Wang, Y.N.; Yang, C.X.; Shi, Q.Q.; Zhang, L.Q.; Liu, H.; You, J.J.; Zhang, R.R.; Sun, A.L.; Song, S.Q.; Zhang, Z.M.; et al. Co-exposure to enrofloxacin and atrazine enhances the hepatotoxicity in Larimichthys crocea by targeting the hypothalamic-pituitary-thyroid and gut-liver axes. J. Hazard. Mater. 2025, 489, 137548. [Google Scholar] [CrossRef] [Scilit] [PubMed]
- Steffenak, I.; Hormazabal, V.; Yndestad, M. Reservoir of quinolone residues in fish. Food Addit. Contam. 1991, 8, 777–780. [Google Scholar] [CrossRef] [Scilit] [PubMed]
- Chen, M.; Zhao, H.X.; Wang, Y.; Bekele, T.G.; Liu, W.Y.; Chen, J.W. Uptake and depuration of eight fluoroquinolones (FQs) in common carp (Cyprinus carpio). Ecotoxicol. Environ. Saf. 2019, 180, 202–207. [Google Scholar] [CrossRef] [Scilit] [PubMed]

Disclaimer/Publisher’s Note: The statements, opinions and data contained in all publications are solely those of the individual author(s) and contributor(s) and not of MDPI and/or the editor(s). MDPI and/or the editor(s) disclaim responsibility for any injury to people or property resulting from any ideas, methods, instructions or products referred to in the content. |
© 2026 by the authors. Licensee MDPI, Basel, Switzerland. This article is an open access article distributed under the terms and conditions of the Creative Commons Attribution (CC BY) license.