


Abstract
Extracellular antibiotic resistance genes (eARGs) can move with pore water through soils and sediments. In this study, Mg-Al layered double hydroxide (LDH)-modified biochar (MPC) and sodium-dodecyl-sulfonate-treated LDH biochar (SPC) were evaluated in water-saturated quartz-sand columns. Microscopy, elemental mapping, and diffraction were consistent with an Mg-Al-containing layered component on the modified biochars, while spectroscopy and zeta-potential measurements showed changes in surface composition and electrokinetic charge. Extracellular DNA (eDNA) effluent recovery decreased from approximately 70% in the unamended control to 52% with MPC and 43% with SPC, and the eARG breakthrough curves followed the same treatment order. Electrostatic attraction and metal-related interactions are possible contributors to these responses. Increasing NaCl or CaCl2 concentration reduced eDNA plateau concentrations in the tested series. Humic-acid and fulvic-acid preconditioning increased subsequent eDNA and eARG effluent recovery, with a larger response to humic acid. The results identify material-dependent transport responses and their sensitivity to solution chemistry in a controlled porous-medium model. The input–output deficit represents DNA unrecovered from the effluent during the collection interval.
1. Introduction
Antibiotic resistance genes (ARGs) enter agricultural soils, sediments, and surface waters through manure application, sewage sludge, reclaimed-water irrigation, and leachate [1]. Genetic material can then move with infiltrating water or pore-water flow toward groundwater, receiving waters, and crop root zones. Extracellular ARGs (eARGs) occur outside microbial cells and have been detected in the extracellular DNA fraction of livestock-waste sludge [2]. Association with soil or sediment particles may protect extracellular DNA (eDNA), allowing its genetic information to remain available for natural transformation [3]. The partitioning and movement of extracellular genetic material are therefore relevant to environmental persistence and resistance-gene dissemination [4].
DNA adsorption and transport depend on the mineral surface, molecular properties, pH, and solution chemistry [5,6]. Phosphate and organic ligands can modify DNA adsorption by soil colloids and minerals [7]. In sand and iron-oxide-coated sand columns, DNA retention responded to surface coatings, ionic strength, and dissolved Mg2+ [8]. Biochar-amended saturated sand columns also showed pyrolysis-dependent changes in eARG mobility [9]. Batch and up-flow column experiments with sewage-sludge biochar and iron-oxide-coated sand have further examined extracellular DNA and resistance-associated genetic material in treated effluents [10]. These studies provide a basis for evaluating DNA surface interactions under flowing conditions.
Biochar DNA interactions vary with feedstock, pyrolysis conditions, and the resulting surface properties, as shown in a recent comparison of biochars in a synthetic treated-wastewater matrix [11]. Surface modification provides another means of changing DNA interactions; magnetic biochar modified with quaternary phosphonium groups has been investigated for extracellular resistance-gene removal from water [12]. Mg-Al LDH phases can be prepared on biochar supports [13]. Direct DNA-LDH experiments have also shown that adsorption depends on both LDH particle dimensions and DNA length [14]. These findings motivate comparison of pristine and LDH-modified biochars under saturated flow.
Organic matter adds another layer of complexity to DNA surface interactions. In batch experiments, humic acid reduced DNA adsorption onto sewage-sludge biochar and iron-oxide-coated sand [10]. DNA associated with natural organic matter or adsorbed to natural-organic-matter-coated silica can remain available for natural transformation [15]. Evaluating transport during electrolyte variation and after dissolved-organic-matter conditioning therefore helps characterize the response of an amended porous medium to changing solution chemistry.
In this study, pristine biochar (PC), Mg-Al LDH-modified biochar (MPC), and sodium-dodecyl-sulfonate-treated Mg-Al LDH biochar (SPC) were compared with an unamended quartz-sand control (CK) in water-saturated columns. Material characterization was combined with eDNA and eARG transport experiments under NaCl and CaCl2 treatments and after humic acid (HA) and fulvic acid (FA) preconditioning. Breakthrough profiles and integrated effluent recoveries were examined, with zeta-potential measurements and backwashing providing context for possible surface interactions. The comparisons evaluate the whole composites and their responses to solution chemistry.
2. Materials and Methods
2.1. Chemicals
Magnesium nitrate hexahydrate (Mg(NO3)2·6H2O), aluminum nitrate nonahydrate (Al(NO3)3·9H2O), and sodium dodecyl sulfonate (C12H25SO3Na), each with a purity of >97%, were purchased from Sinopharm Chemical Reagent Co., Ltd. (Shanghai, China). Sodium hydroxide (NaOH), sodium chloride (NaCl), calcium chloride (CaCl2), Tris-HCl, and ethylenediaminetetraacetic acid (EDTA), each with a purity of >97%, were obtained from the same supplier. Concentrated hydrochloric acid (HCl), hydrogen peroxide (H2O2, 30%), commercial humic acid (HA), and fulvic acid (FA) were also obtained from Sinopharm Chemical Reagent Co., Ltd. (Shanghai, China).
Calf-thymus genomic DNA (molecular-biology grade; D4764) was purchased from Sigma-Aldrich (St. Louis, MO, USA), and purified pBR322 plasmid DNA (N3033) was obtained from New England Biolabs (Ipswich, MA, USA). DNA preparation, purity ratios, initial concentrations, and storage conditions are described in Text S1 and Table S1. Deionized water was used for composite preparation, and molecular-biology-grade water was used for DNA working solutions.
2.2. Preparation of LDH-Modified Biochar
Pristine tobacco-stalk biochar (PC) was prepared by pyrolysis at 500 °C for 3 h under N2 at a flow rate of 200 mL min−1 in a tube furnace (O-KTF1200, Chunlei, China), with a heating rate of 10 °C min−1. MPC was prepared by dispersing 10 g of PC in 2.5 L of deionized water by ultrasonication for 4 h. Mg(NO3)2·6H2O (12.8 g) and Al(NO3)3·9H2O (9.375 g) were dissolved in the suspension under continuous stirring. A 0.5 mol L−1 NaOH solution was added dropwise to pH 10. The precipitated composite was aged at room temperature for 24 h, separated by centrifugation at 4000 rpm for 10 min, and dried at 80 °C [11]. To prepare SPC, 0.5 g of MPC was mixed with 0.5 g of sodium dodecyl sulfonate in deionized water and stirred at 500 rpm and 60 °C for 24 h. The solid was collected by centrifugation, repeatedly washed with deionized water, and dried. SPC is described as sodium-dodecyl-sulfonate-treated Mg-Al LDH biochar. Feedstock pretreatment and further preparation details are provided in Text S2.
2.3. Material Characterization
Surface morphology was examined by SEM (S-480, Hitachi, Tokyo, Japan) with EDS and by TEM (FEI Talos F200x, FEI Company, Hillsboro, OR, USA) [16]. XRD patterns were obtained using a D8 Advance diffractometer (Bruker AXS, Karlsruhe, Germany) at 10° min−1. FTIR spectra were recorded from 4000 to 500 cm−1 (Tensor 27, Bruker Optics, Ettlingen, Germany). XPS was used to examine surface elemental composition and chemical states (AXIS Ultra, Kratos Analytical, Manchester, UK); high resolution spectra were fitted with mixed Gaussian Lorentzian functions in XPSPEAK 4.1. Zeta potential was measured with a Zetasizer Nano ZS90 (Malvern Instruments, Malvern, UK). The preparation used a 5 g L−1 suspension in 0.01 M NaCl with ultrasonication for 1 h (300 W, 40 kHz); the additional background solutions corresponding to Figure S1b are specified in the Supporting Information.
2.4. Transport Experiments in Saturated Porous Media
Transport experiments used vertically oriented, water saturated plexiglass columns with a packed-bed height of 10 cm and an internal diameter of 2.6 cm, operated in upward flow at 1.0 mL min−1. Quartz sand (595–841 μm) was the granular matrix. A 200-mesh nylon screen was installed at each end, and effluent was collected with an EBS-20 fraction collector. Sand cleaning and column preparation are detailed in Text S3.
Each amended column contained 0.70 g of PC, MPC, or SPC uniformly mixed with 69.30 g of quartz sand, giving a dry biochar:sand mass ratio of 1:99 (1 wt% biochar) and a total dry packing mass of 70.00 g. The unamended quartz-sand control (CK) contained 70.00 g of sand without biochar. The biochars were ground and passed through a 120-mesh sieve (nominal aperture 0.125 mm), and the bed was wet-packed in 2 cm increments with gentle tapping. The measured pore volumes of CK, PC, MPC, and SPC were 26.7, 26.4, 26.6, and 26.3 mL, respectively, giving nominal hydraulic residence times of 26.7, 26.4, 26.6, and 26.3 min at the operating flow rate. Packing masses, calculated porosities and dry bulk densities, and hydraulic parameters are summarized in Table S2.
The bulk-eDNA and eARG experiments used separate DNA preparations: calf-thymus genomic double-stranded DNA at 25 mg L−1 and pBR322 plasmid DNA at 1.06 × 10¹⁰ plasmid copies L-1, respectively. Column working solutions contained 10 mM Tris-HCl, adjusted to pH 7.5 at 25 °C using dilute HCl or NaOH; solution pH was measured with an AB15 pH meter (Fisher Scientific, Pittsburgh, PA, USA). Each baseline or electrolyte run comprised 10 pore volumes (PV) of equilibration, 3 PV of DNA injection, and 3 PV of DNA-free forward elution (Figure S2). NaCl and CaCl2 were tested separately at 0, 5, 25, and 50 mM, with the selected electrolyte background maintained throughout these stages. HA or FA was added only during preconditioning at 25 mg L−1 in the 25 mM CaCl2 background, followed by a background rinse before DNA injection. Complete stage compositions are provided in Text S3 and Table S3. DNA preparation is described in Text S1 and Table S1.
The baseline breakthrough experiments and the NaCl and CaCl2 series were conducted separately using newly packed columns, with independently measured zero-added-salt controls. The 0 mM condition contained 10 mM Tris-HCl at pH 7.5 without added NaCl or CaCl2.
Effluent fractions were collected every 5 min. Bulk eDNA was quantified by UV spectrophotometry at 260 nm (UV-9000S, Shanghai Metash Instruments Co., Ltd., Shanghai, China), with background subtraction using matched DNA-free column effluent. The plasmid-borne bla gene was the sole qPCR target, quantified using a LightCycler 2.0 system (Roche Diagnostics, Mannheim, Germany) [17,18]. Assay validation over seven tenfold calibration levels (101–107 copies per reaction) gave R2 = 0.99949 and an amplification efficiency of 98.73%; the detection and quantification limits were both 5 copies per reaction. Detailed primer information is provided in Table S4; reaction composition, thermal program, copy-number conversion, and inhibition assessment are described in Text S4. Calibration and validation data are summarized in Table S5. UV measurement and matrix-interference correction are described in Text S5. Influent concentration was checked at the beginning and end of each run. Breakthrough curves are expressed as normalized effluent concentration (C/C0) against PV, where C0 is the influent concentration. Each plotted data point represents the mean normalized effluent concentration from three independently packed columns (n = 3), and the error bars indicate the sample standard deviation.
Forward-effluent recovery (%) was calculated for each column as the recovered eDNA mass or bla target-copy amount divided by the corresponding introduced amount, multiplied by 100. Recovered amounts were integrated from measured fraction concentrations and actual collected volumes over DNA injection and forward elution (0–6 PV); the constant-concentration input pulse was 3 PV. The input–output difference is described as DNA unrecovered from the forward effluent. The equations and amount calculations are provided in Text S6. Calculated DNA input amounts are summarized in Table S6. Backwashing was performed sequentially with Tris-HCl followed by EDTA in the same SPC columns after the preceding loading and forward-elution stages; the design and stage-specific release calculation are described in Text S7 and Table S7.
2.5. Statistical Analysis
Three independently prepared and packed columns were used for each tested condition (n = 3). Details of independent replication and statistical reporting are provided in Text S8. Results are expressed as mean ± sample standard deviation (SD). Successive effluent fractions and repeated UV readings or qPCR wells were treated as measurements within a column. Integrated forward-effluent recovery (%) was calculated for each column. For the DOM experiments, Control, HA, and FA were compared within each packing, separately for eDNA and eARG recovery, using one-way ANOVA followed by Duncan’s multiple-range test (p < 0.05). Residual normality and variance homogeneity were assessed with the Shapiro–Wilk and median-centered Levene tests. Table S8 provides individual-column recoveries, and Table S9 reports the statistical outputs.
3. Results and Discussion
3.1. Effect of LDH Modification on Biochar Properties
3.1.1. Morphology and Elemental Distribution
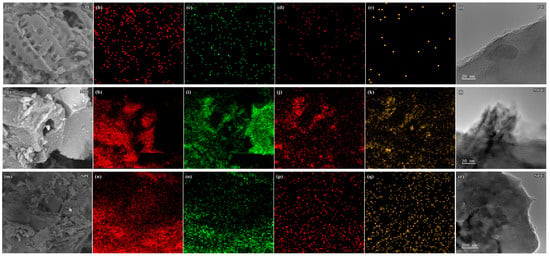
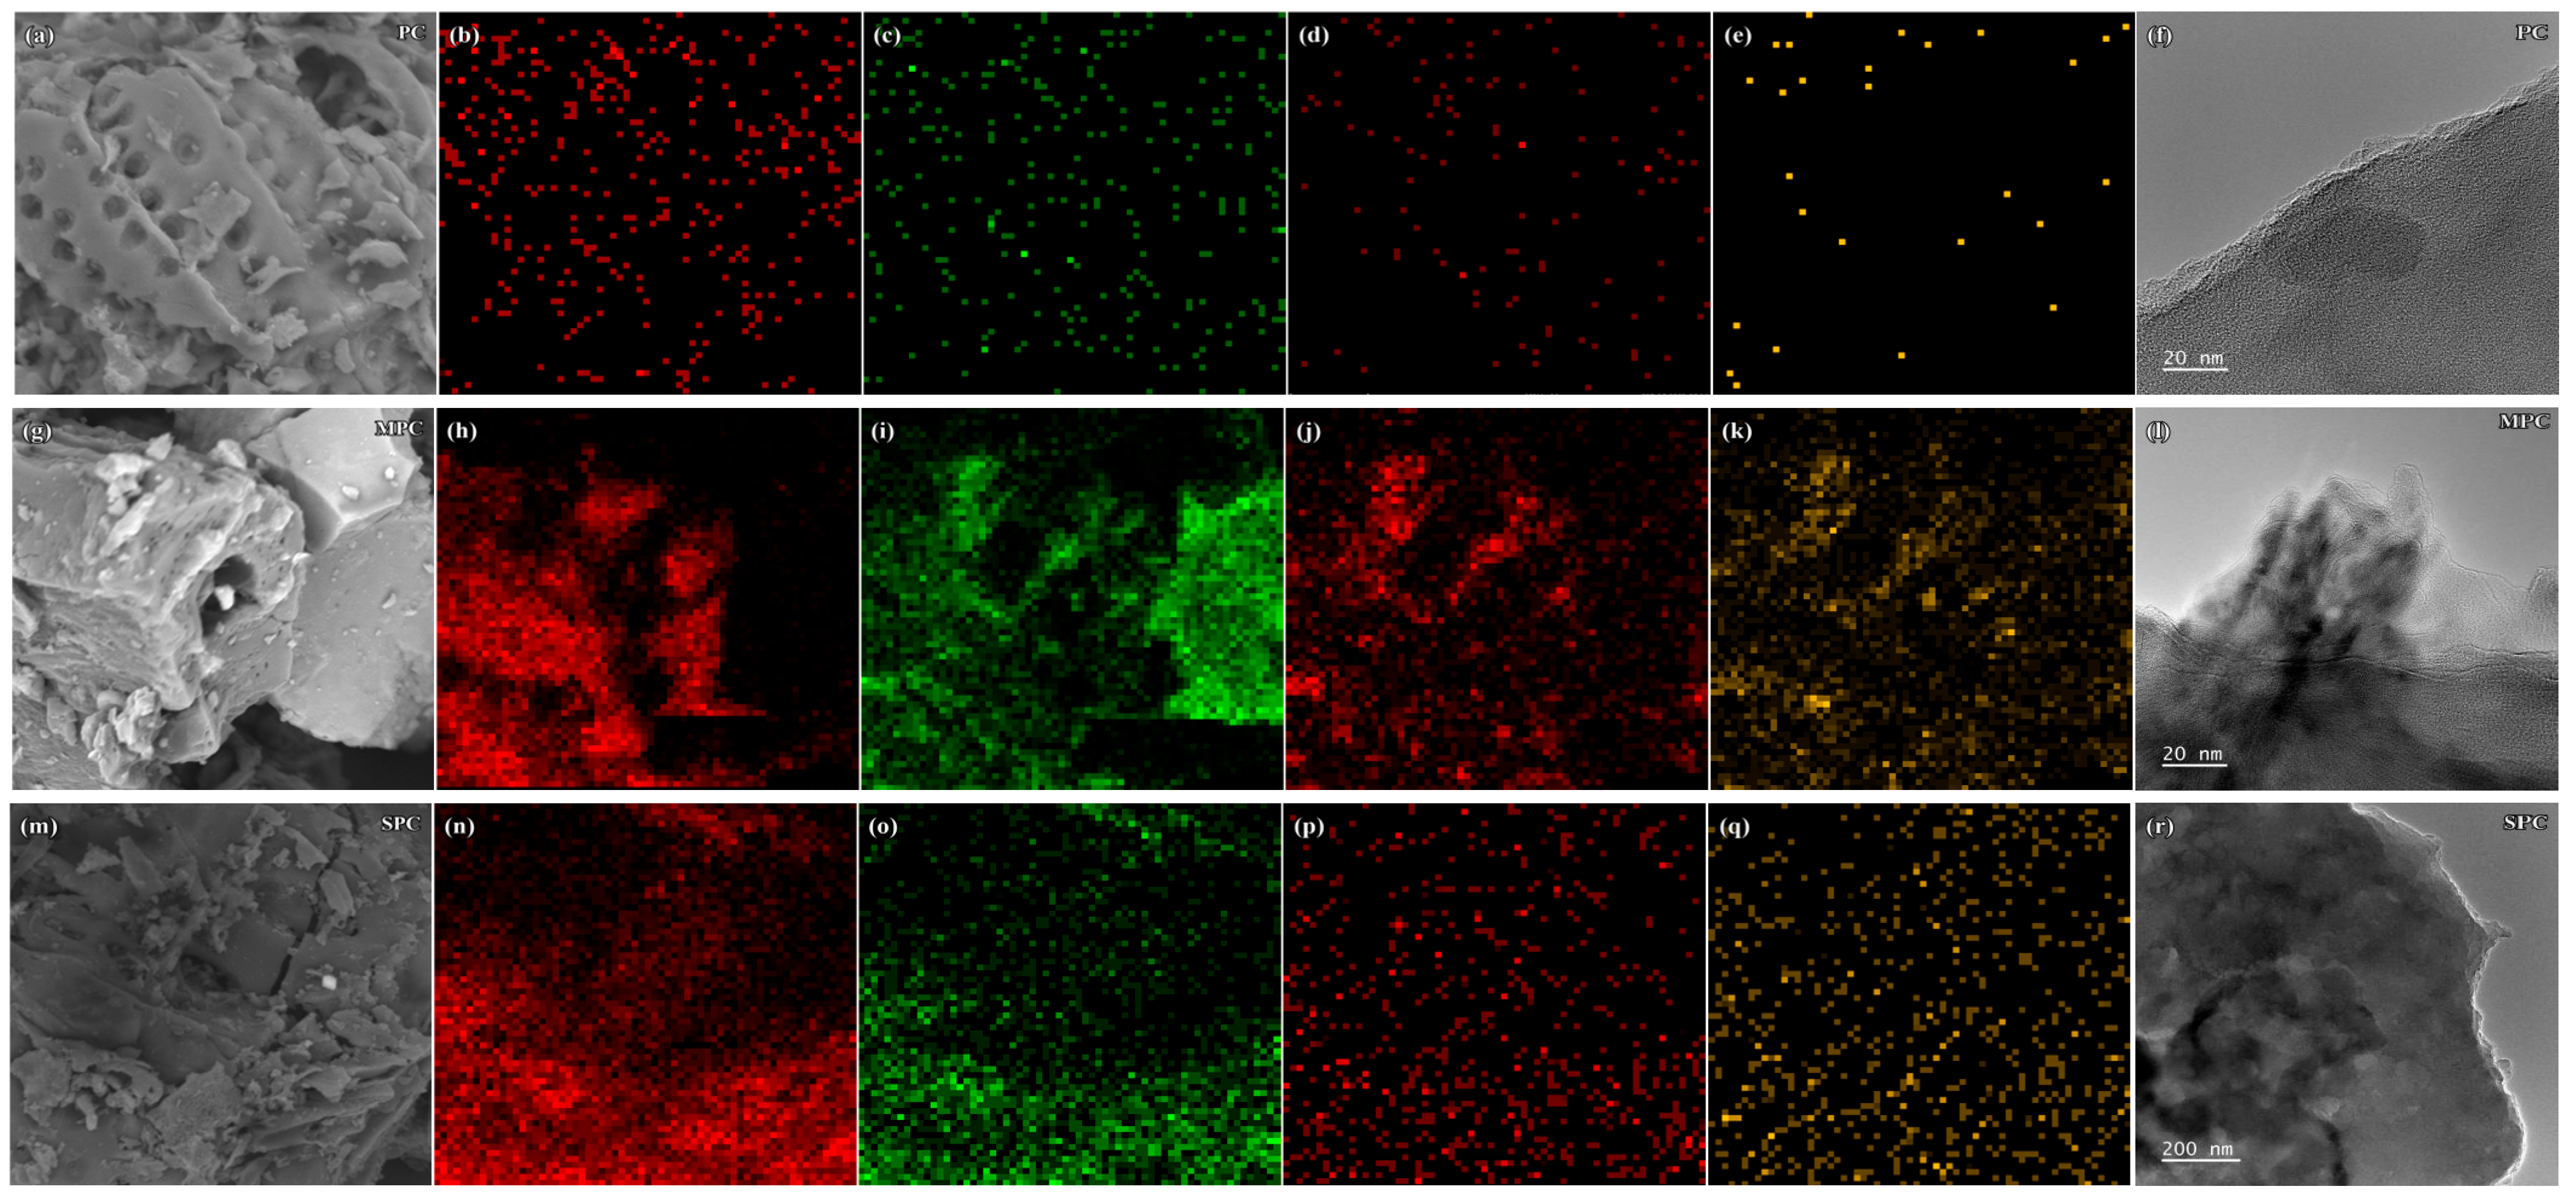
SEM revealed a porous morphology in PC and irregular surface features in the modified biochars (Figure 1a,g,m). TEM showed thin sheet-like features in MPC (Figure 1l) and particle aggregates in SPC (Figure 1r). The TEM images were acquired at different scales, so the comparison describes local morphology rather than differences in nanosheet thickness or spacing.
Figure 1.
SEM images of PC (a), MPC (g), and SPC (m), with corresponding C, O, Mg, and Al EDS maps (b–e, h–k, and n–q, respectively), and TEM images of PC (f), MPC (l), and SPC (r).
EDS maps qualitatively indicated Mg and Al within selected regions of MPC (Figure 1j,k) and SPC (Figure 1p,q). Together with the XRD and XPS observations, these results are consistent with an Mg-Al-containing layered component associated with the biochar support. The maps describe elemental distribution in the imaged regions; quantitative coating loading and retained sulfonate content require separate compositional measurements.
Our previous studies on related wood-derived biochars showed that LDH deposition and organic surface treatment altered nitrogen-accessible pore structure and generally lowered BET surface area [19,20]. Such changes may also affect DNA access to interaction sites in the present composites. The lower effluent recovery of MPC and SPC is therefore interpreted in terms of their combined surface and structural properties, with electrostatic attraction and metal-associated interactions as possible contributors.
3.1.2. Surface Functional Groups and Elemental Composition
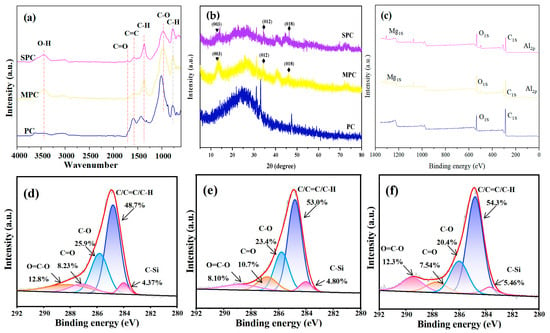
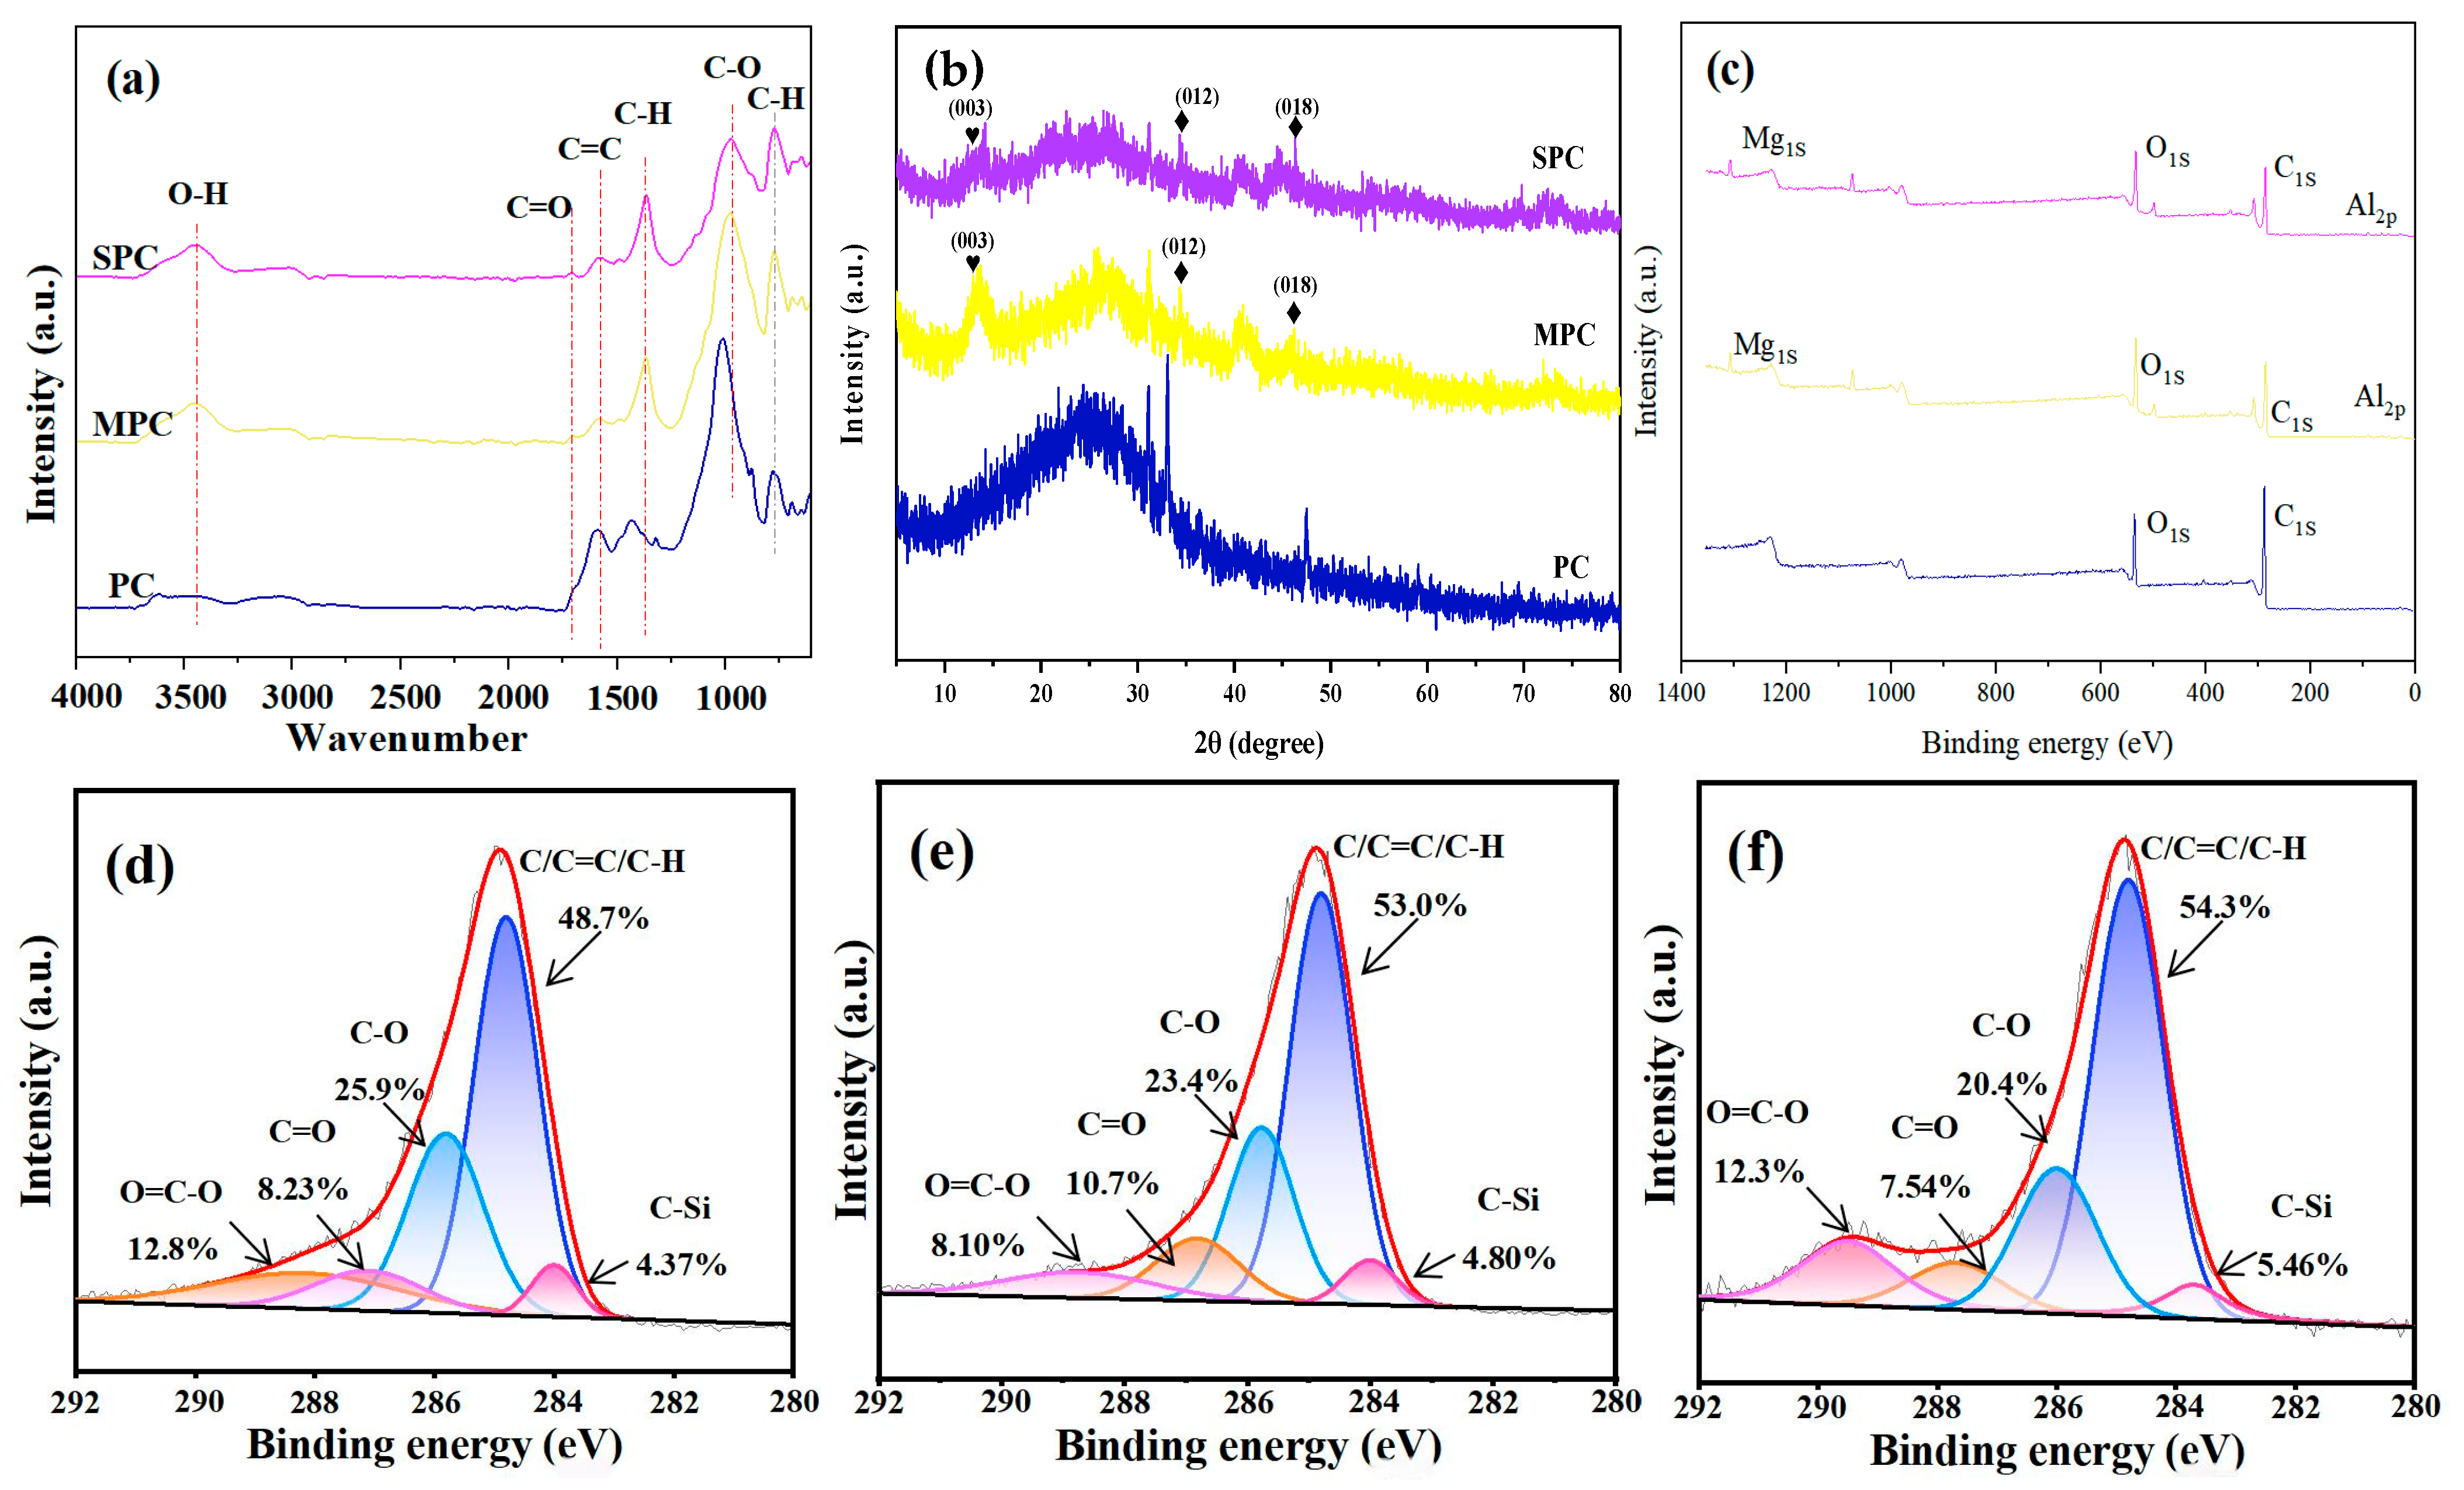
The FTIR spectra of PC, MPC, and SPC are compared in Figure 2a. The broad 3600–3000 cm−1 band was associated with O-H stretching. Bands at 2926, 1700, and 1598 cm−1 were assigned to C-H stretching, C=O stretching, and overlapping bending or aromatic contributions, respectively. Features at 1450 and 1378 cm−1 were associated with C-H vibrations, while the 1200–1000 cm−1 region can contain overlapping C-O, silicate, and inorganic contributions. The assignments are considered tentative where bands overlap, as is common for biochar–LDH composites [21].
Figure 2.
FTIR spectra (a), XRD patterns (b), survey XPS spectra (c), and high-resolution C 1s XPS spectra of PC (d), MPC (e), and SPC (f). In panels (a–c), blue, yellow, and purple/magenta curves correspond to PC, MPC, and SPC, respectively. In panels (d–f), thin black curves show the measured spectra, red curves show the overall fits, and the colored component peaks correspond to the labeled chemical assignments.
After LDH loading, changes in the C=O/C-O region and the broader O-H envelope were consistent with a different oxygen-containing surface environment and hydroxyl-rich material. For SPC, sulfonate-related S-O vibrations may contribute to the fingerprint region, where they overlap with C-O and mineral contributions. Sodium dodecyl sulfonate contains a sulfonate headgroup and an alkyl C-S bond. A distinct C-S band and retained-modifier loading cannot be determined from these overlapping spectra. The alkyl C-H signal is also shared with the biochar matrix.
XPS survey spectra showed mainly C and O signals for PC and additional Mg and Al signals for MPC and SPC (Figure 2c–f), consistent with EDS. The C 1s spectra were fitted into C-C/C=C/C-H, C-O, C=O, O=C-O, and C-Si components. The C-C/C=C/C-H fraction increased from 48.7% in PC to 53.0% in MPC and 54.3% in SPC, while fitted oxygen-containing fractions declined. These are relative surface fractions and can be influenced by coating coverage or spectral fitting; they do not establish formation of new aromatic domains. Mg and Al detection in SPC supports the persistence of an Mg-Al-containing phase after treatment, without quantifying its loading relative to MPC.
Together, FTIR and XPS indicate changes in the surface environment after modification. The modifier content and its location within the composite remain to be quantified; SPC is therefore described by its preparation as sodium-dodecyl-sulfonate-treated LDH biochar.
3.1.3. Crystal Structure
XRD was used to examine the mineral composition and crystallinity of the different LDH–BC materials (Figure 2b). Tobacco stalks consist mainly of organic compounds, including cellulose, lignin, and hemicellulose, and contain relatively few inorganic minerals. Accordingly, PC exhibited few mineral reflections, with a prominent diffraction feature at approximately 2θ = 24°, assigned to amorphous carbon (PDF No. 50–0926) [22]. In contrast, the LDH-modified biochars displayed reflections characteristic of the layered LDH structure. In the XRD pattern of MPC, reflections at 2θ = 13.1°, 34.4°, and 46.1° were assigned to the (003), (012), and (018) planes of a typical hydrotalcite structure, respectively (JCPDS No. 36-0383), indicating that LDH had been deposited on the biochar surface [23]. Furthermore, SPC exhibited an XRD pattern similar to that of MPC but with lower diffraction peak intensities, suggesting that the introduction of SDS may reduce the crystallinity of Mg–Al LDH [24].
The combined microscopy, EDS, XPS, and XRD observations are consistent with an Mg-Al-containing layered component on the modified biochars. Visible pores, sheet-like features, and particle aggregates identify structural differences that may affect contact with DNA during flow; DNA localization and pore-scale confinement remain mechanistic hypotheses.
3.2. Transport and Retention of eDNA and eARGs in Biochar-Amended Saturated Porous Media
3.2.1. Breakthrough Behavior
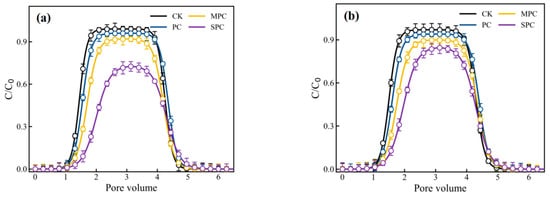
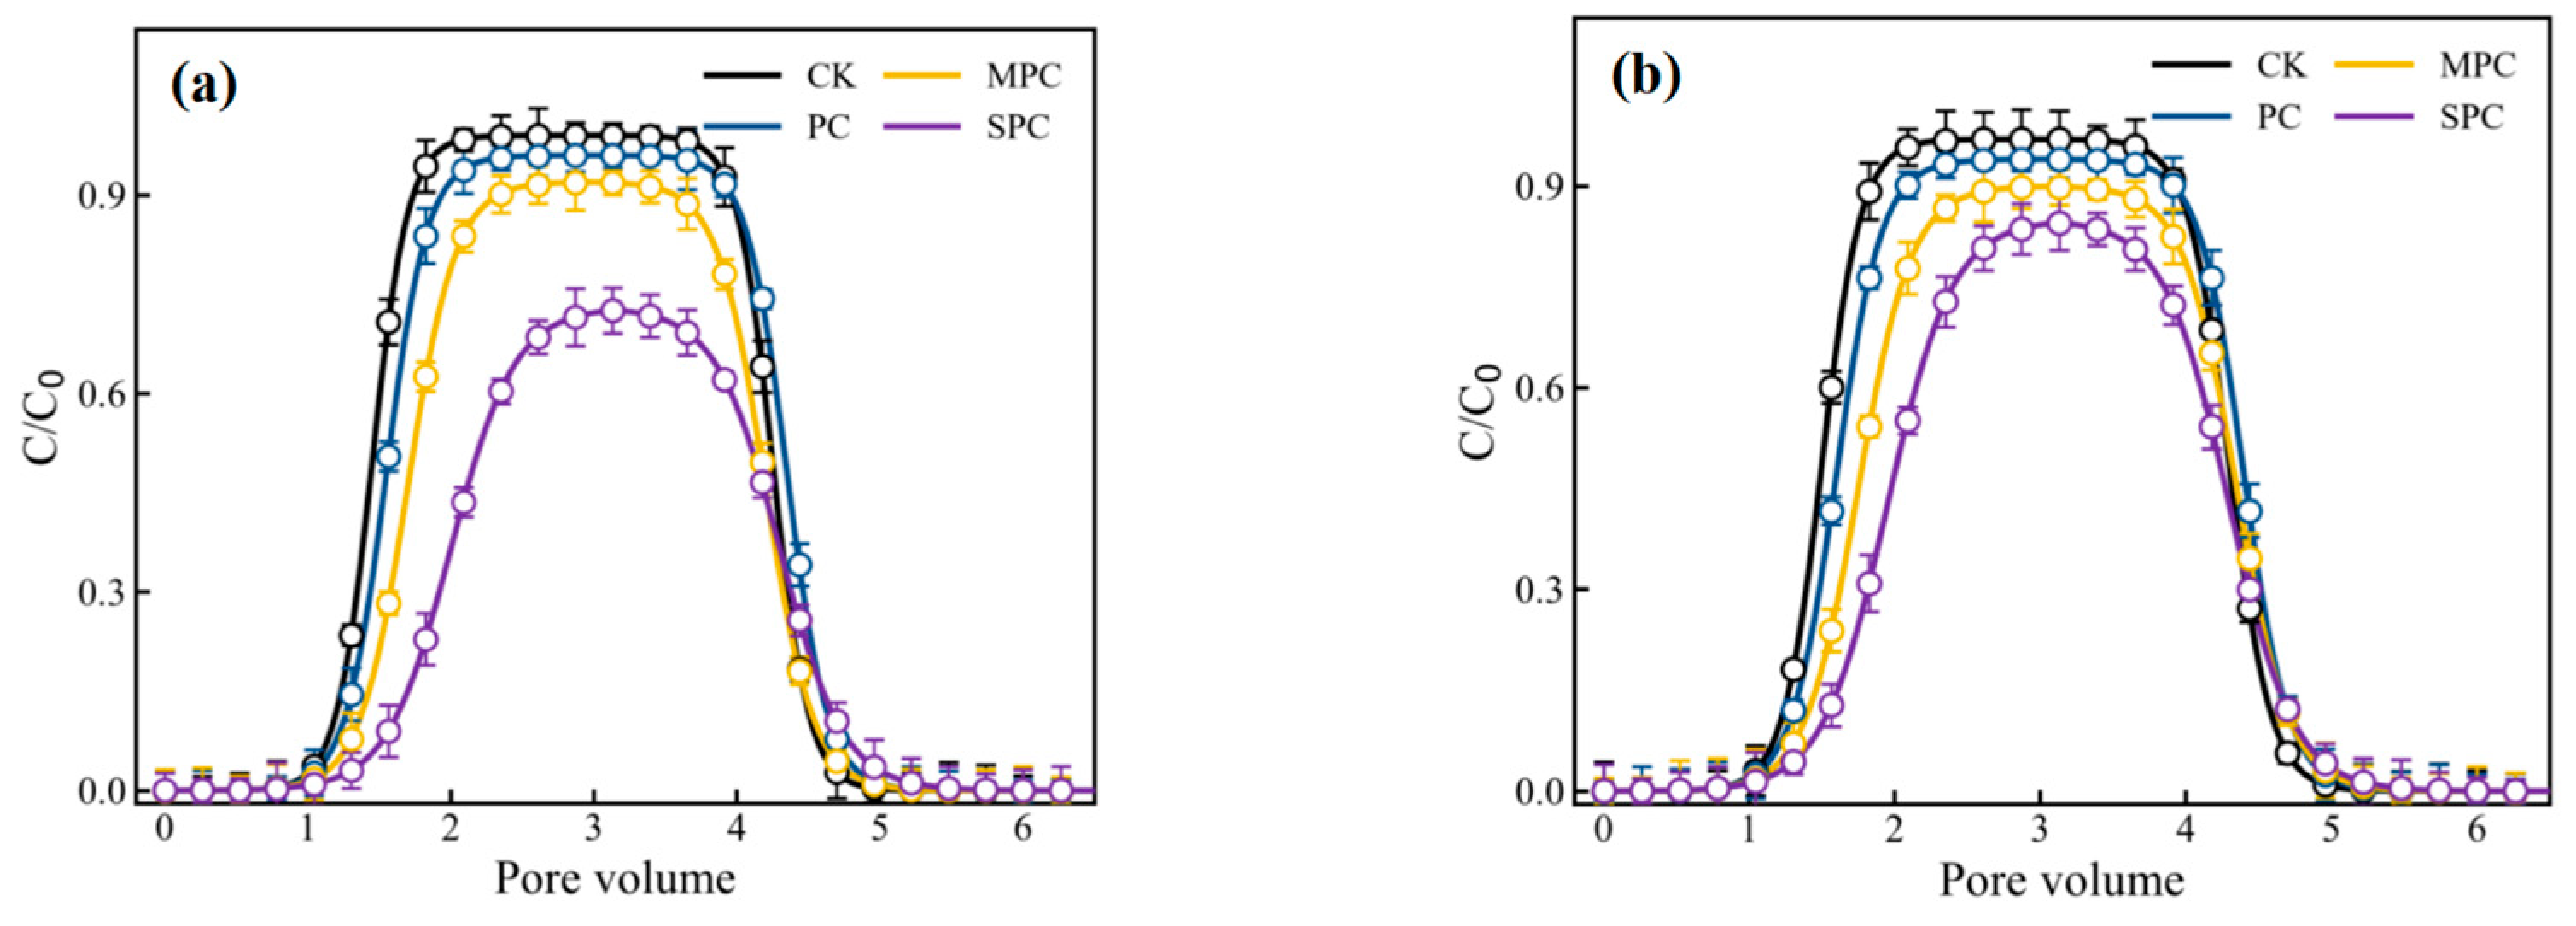
The eDNA and eARG BTCs showed a lag, rising limb, near-steady region, and elution tail (Figure 3a,b). In CK, the eDNA plateau C/C0 was approximately 0.98, and PC produced a similar response. MPC delayed breakthrough and lowered the plateau to approximately 0.90. SPC showed a more delayed rising limb and a plateau near 0.75. No conservative tracer experiment was conducted. Consequently, differences in BTC timing or tailing cannot be separated into hydraulic dispersion, pore accessibility, and DNA interactions, and the curve shapes alone do not establish binding strength.
Figure 3.
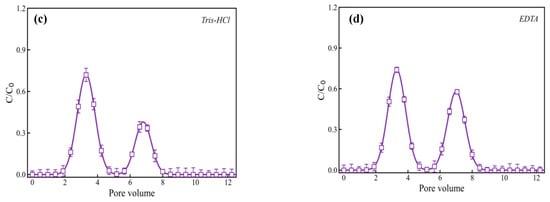
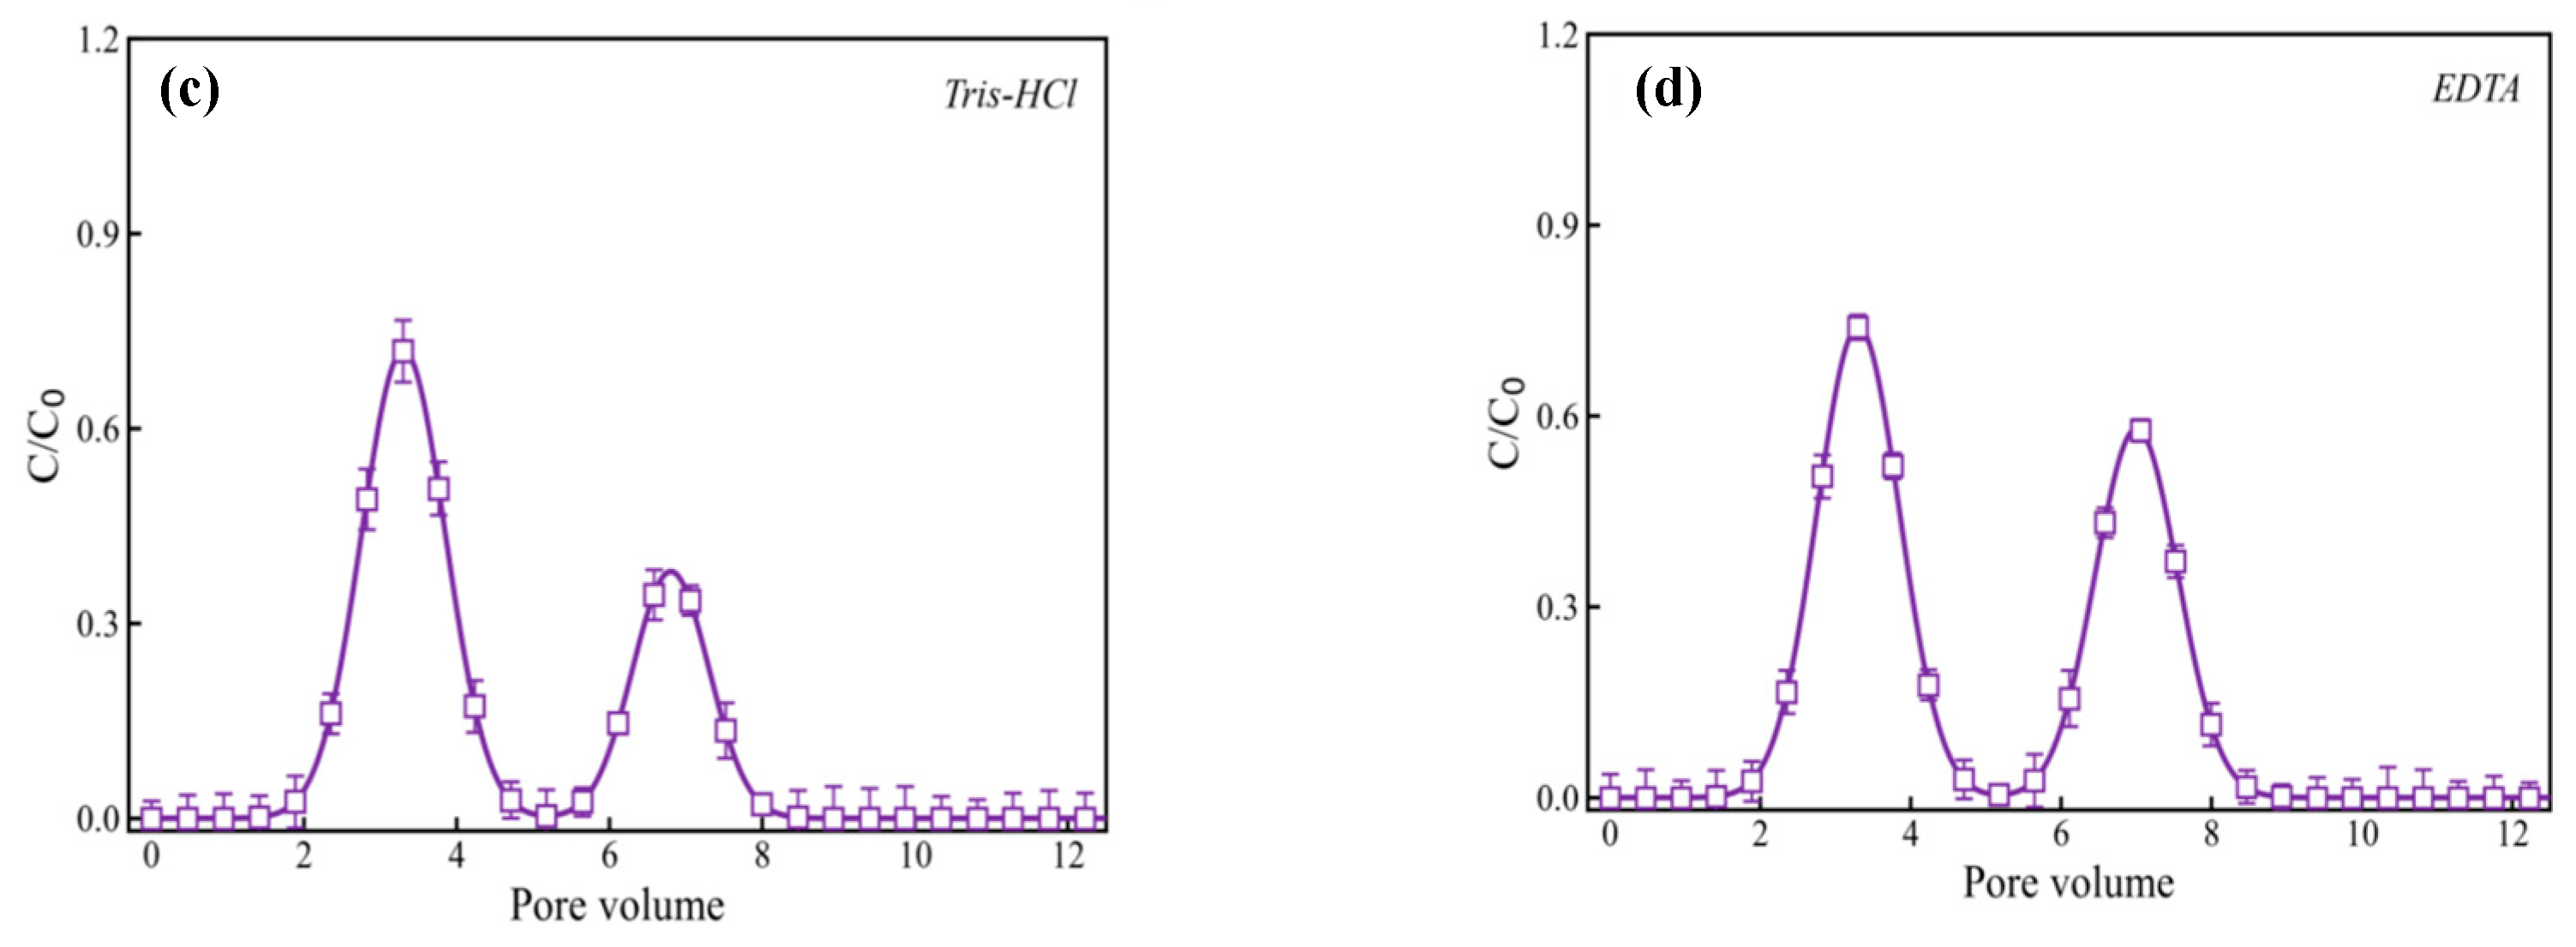
BTCs of eDNA (a) and eARGs (b) for the unamended quartz-sand control (CK), PC, MPC, and SPC; and eDNA release during sequential Tris-HCl (c) and subsequent EDTA (d) backwashing of the same SPC columns under the 25 mM CaCl2 condition. C/C0 is normalized effluent concentration. The backwashing profiles describe successive stages of the same column history; release integration is defined in Text S7.
The eARG BTCs followed the same apparent treatment order, with plateau C/C0 values of approximately 0.97, 0.93, 0.88, and 0.82 for CK, PC, MPC, and SPC. These plateaus describe the mobile target signal and are not integrated recovery percentages. The experiments used distinct genomic and plasmid DNA models at different initial concentrations; those properties were not varied independently, so differences between the two experiments cannot be assigned to one molecular property.
3.2.2. Effluent Recovery and Retention Mechanisms
eDNA effluent mass recovery was approximately 70% in CK and 72% in PC, compared with approximately 52% in MPC and 43% in SPC (Figure S1a). These values describe lower measured effluent recovery in the LDH-amended columns. The contrasts between PC, MPC, and SPC do not isolate charge from coating distribution, accessible area, pore structure, or hydraulic effects. The individual-column eDNA and eARG recoveries provided in Table S8 concern the separate DOM-preconditioning experiments.
Positive zeta potentials are consistent with attraction to the negatively charged DNA backbone, and DNA affinity for LDH materials has been reported [14]. Metal-associated interactions and differences in accessible contact regions are also possible contributors. The present experiments did not isolate these processes. Physical confinement, hydrophobic contacts, and π–π interactions remain hypotheses and are not assigned quantitative contributions.
SPC showed lower measured eDNA effluent recovery than MPC. Its higher zeta potential provides one possible explanation, but coating loading, coverage, accessible surface area, pore geometry, and retained sulfonate may also differ. The preparation alone does not establish which property caused the transport difference.
Several processes can contribute to non-recovery. DNA interactions with certain polypropylene surfaces have been reported [25]; association with apparatus surfaces and residual DNA in unflushed liquid volumes are possible contributors. The finite forward-elution interval may not exhaust slowly released DNA. Matrix effects may bias qPCR measurements through amplification inhibition or fluorescence interference [26], while UV measurements and sample handling may introduce additional uncertainty. Changes in DNA integrity could also affect recovery. Studies under disinfectant exposure show that qPCR-target detection and ARG biological activity are distinct endpoints [27]. These possible contributions were not quantified separately in the present columns, so the deficit cannot be assigned entirely to DNA associated with the packed bed.
3.2.3. Zeta Potential
MPC and SPC had positive zeta potentials in the backgrounds shown in Figure S1b. This observation is consistent with an electrostatic contribution to DNA association, but zeta potential describes the electrokinetic potential near the slipping plane. It does not quantify internal binding sites or separate charge effects from surface area, coating distribution, and column hydraulics.
SPC had a higher zeta potential than MPC in each tested background. In Tris-HCl, the reported values were approximately +17 mV for SPC and +8 mV for MPC. Their association with lower effluent recovery is consistent with a charge-related interaction, but does not establish causation or quantify its contribution.
NaCl lowered the reported zeta potential of MPC from approximately +8 to +5 mV and of SPC from +17 to +9 mV. Values in the CaCl2 background were approximately +4 and +5 mV, respectively. These measurements show a change in electrokinetic potential with the tested solution chemistry. Electrolytes can screen attractive and repulsive interactions at different surface domains, and calcium-associated interactions may also occur. Zeta potential alone is therefore insufficient to predict the net BTC response.
3.2.4. DNA Release During Backwashing
Backwashing was performed on SPC columns after the preceding DNA-loading and forward-elution sequence described in Section 2.4. The same SPC columns received Tris-HCl followed by EDTA; these were sequential elution stages rather than separate eluent-treatment groups. The profiles in Figure 3c,d therefore describe DNA mobilization at successive stages of the same column history.
The EDTA stage followed the Tris-HCl stage and produced an additional eDNA release signal (Figure 3c,d). This later mobilization may involve metal-associated DNA interactions, changes in solution chemistry, or changes in the LDH-containing phase. Because the eluents were applied sequentially to the same columns, the profiles are interpreted in relation to their preceding elution history. Peak concentrations describe the release profiles; cumulative DNA release requires integration of concentration over collected volume for each stage.
The backwashing curves demonstrate later recovery of a remobilizable DNA signal. They do not identify the location or binding state of the entire unrecovered fraction. Electrostatic attraction, metal-related interactions, and physical confinement can be discussed as possible contributors, but an input–output deficit is not a measurement of irreversible binding or DNA associated with the solids.
3.3. Effects of Ionic Strength and Dissolved Organic Matter
The zero-added-salt controls in Figure 3a and the NaCl and CaCl2 series in Figure 4 were measured independently using newly packed columns. Differences in their plateau concentrations, particularly for MPC and SPC, may reflect variability in column preparation and operation; the specific causes were not resolved by the present measurements. Accordingly, salt-concentration effects are assessed within each experimental series relative to its own zero-added-salt control, and differences between these controls are not interpreted as an effect of electrolyte identity.
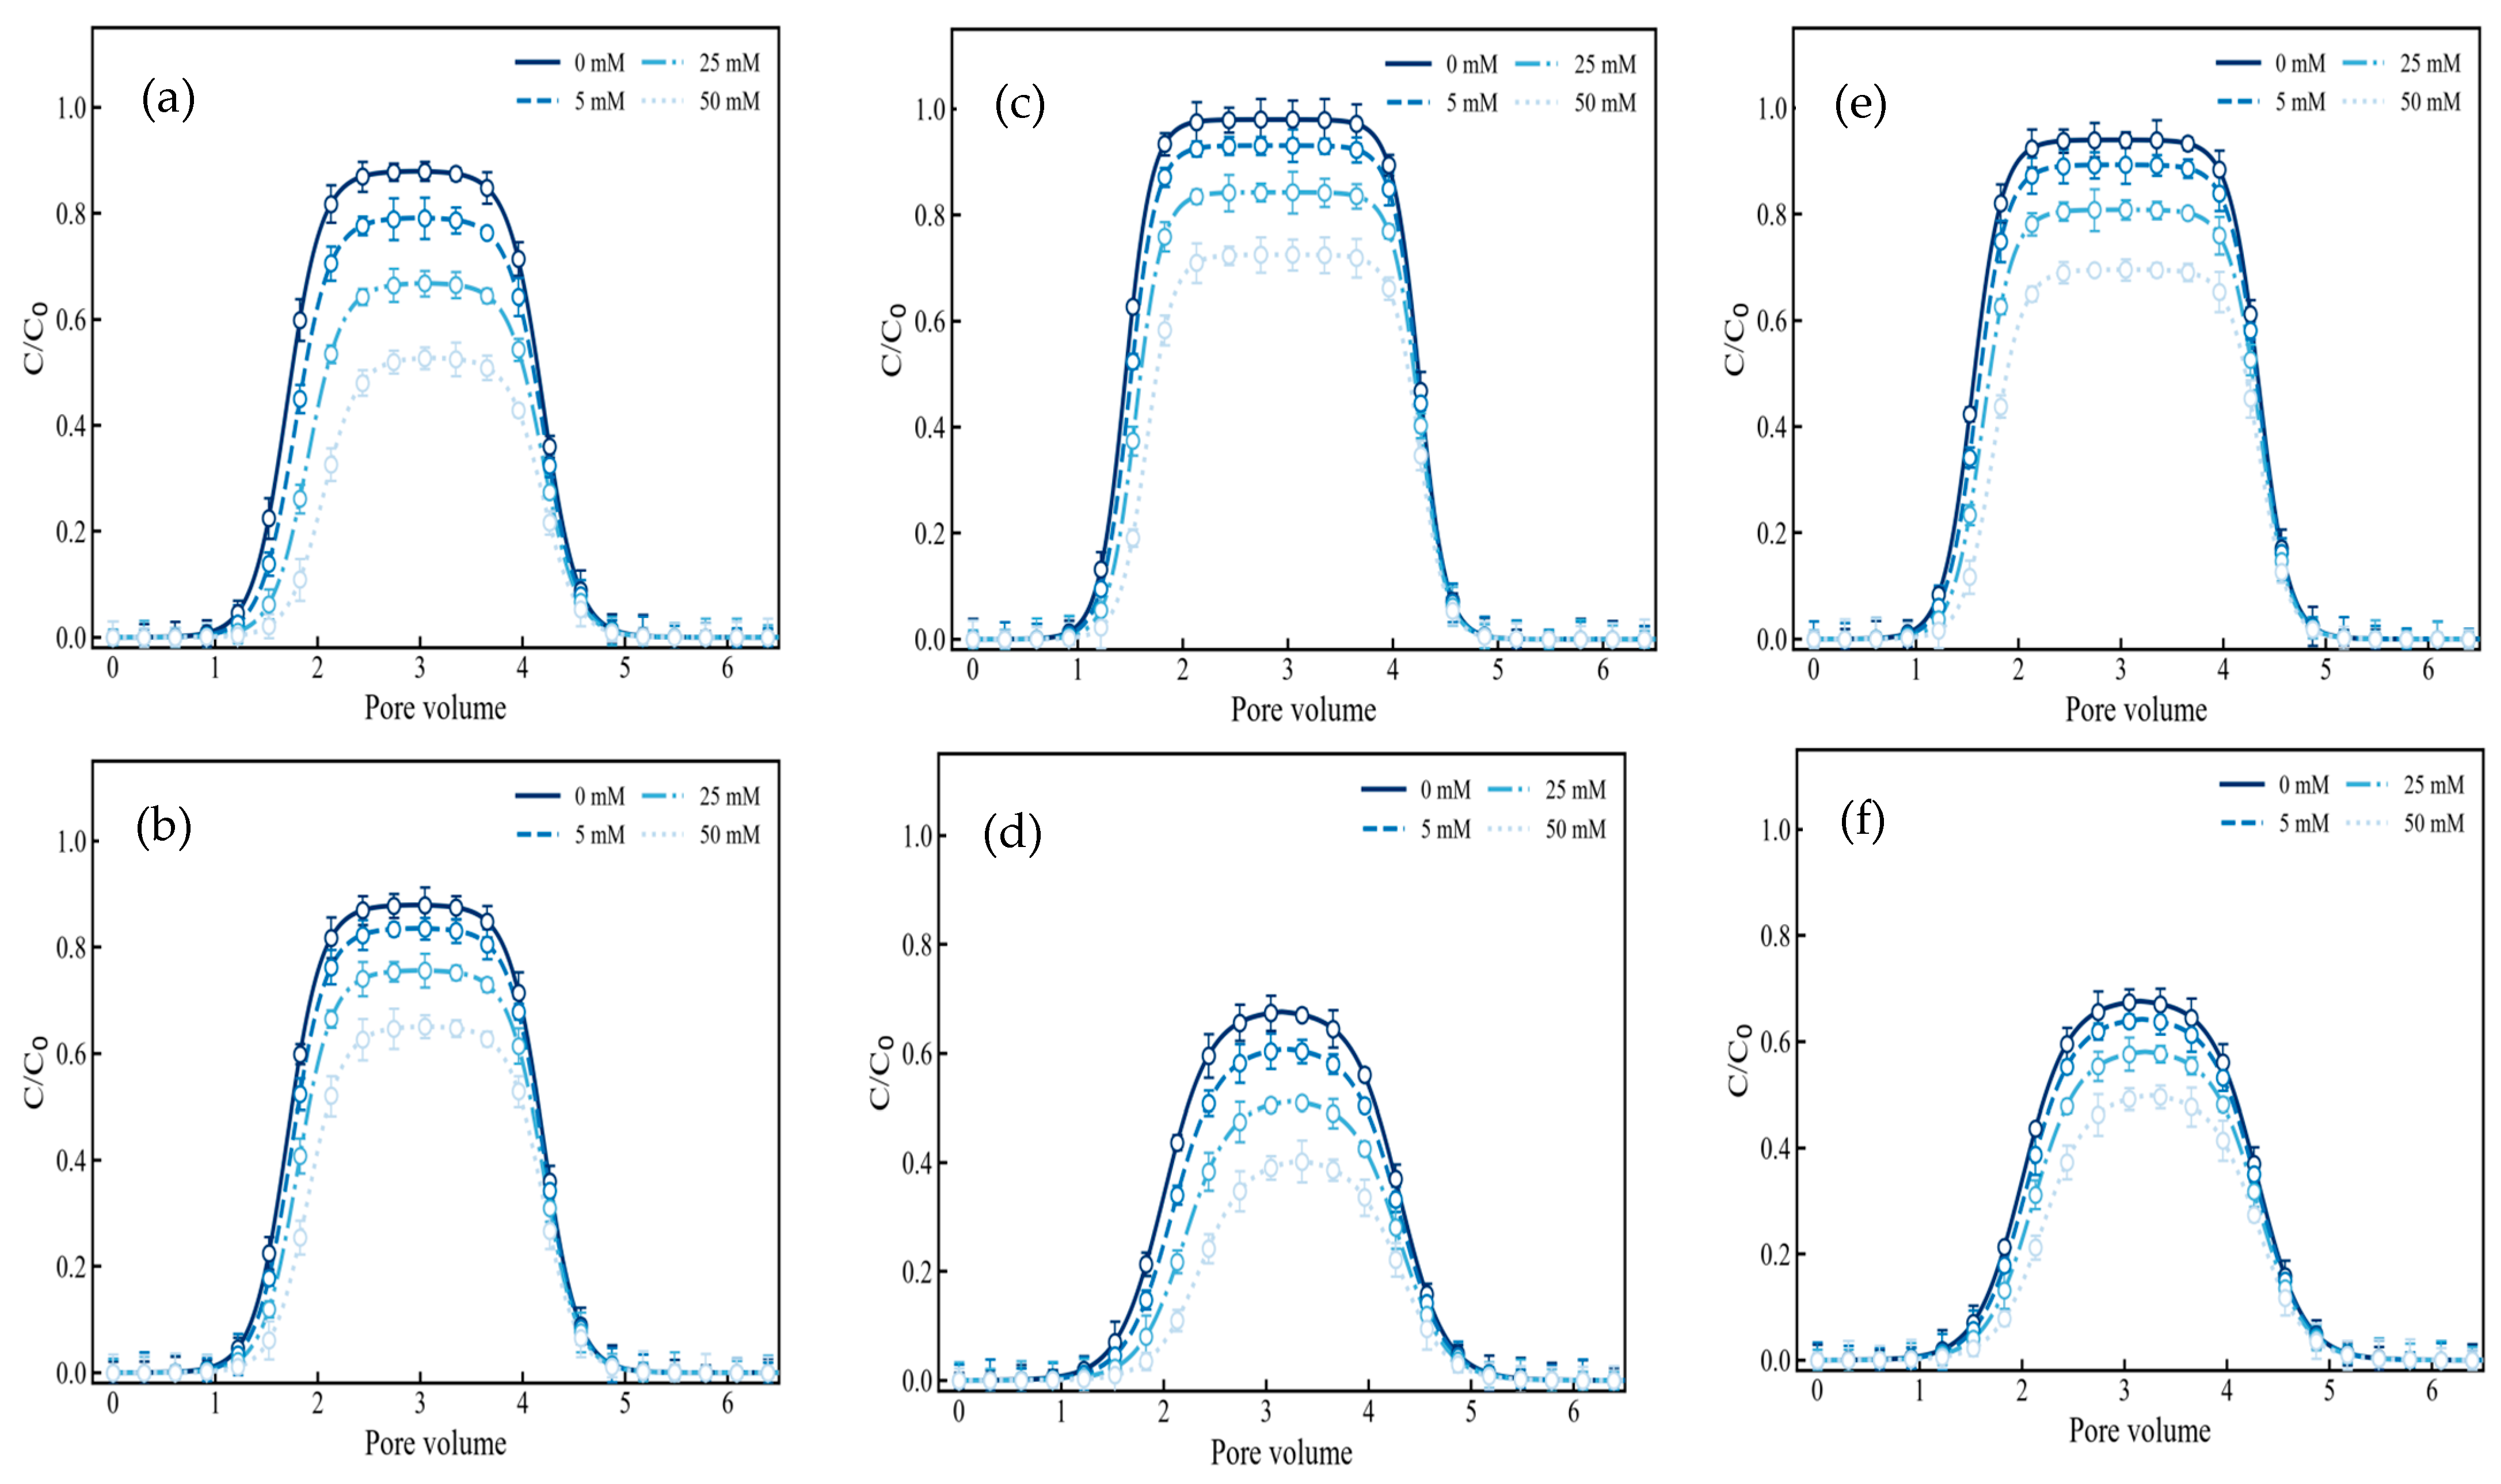
Figure 4.
Effects of NaCl (a,c,e) and CaCl2 (b,d,f) concentration (0, 5, 25, and 50 mM) on eDNA breakthrough curves in PC (a,b), MPC (c,d), and SPC (e,f) columns. C/C0 denotes normalized effluent concentration. The same electrolyte identity and concentration were maintained during equilibration, DNA injection, and forward elution.
Increasing NaCl concentration from 0 to 50 mM lowered the approximate eDNA plateau C/C0 from 0.88 to 0.53 for PC, 0.99 to 0.73 for MPC, and 0.94 to 0.70 for SPC (Figure 4a,c,e; Figure S3a,c,e). The corresponding changes for CaCl2 were 0.89 to 0.64, 0.68 to 0.39, and 0.68 to 0.50, respectively (Figure 4b,d,f; Figure S3b,d,f). These values represent normalized plateau concentrations; integrated effluent recoveries are reported separately. Timing and tailing changes may involve DNA interactions and treatment-dependent flow paths. Figure S4 summarizes the approximate 0 and 50 mM plateau values.
The plotted curves do not support one ranking between NaCl and CaCl2 across all amendments. Interpretation is restricted to the concentration trend within each verified electrolyte series. Equal NaCl and CaCl2 molarities also have different ionic-strength contributions, so a valence comparison at equal concentration does not isolate calcium-specific interactions. Ionic strength was determined from the solution composition as described in Text S3; the Tris-HCl contribution is considered separately. Screening and calcium-associated interactions remain possible explanations for the net response. Figure S5 shows the contribution of each added salt to ionic strength.
HA and FA preconditioning increased subsequent eDNA and eARG effluent recovery relative to the matched Control, with HA producing the higher recovery for all four packings (p < 0.05; Figure S6). In SPC columns, eDNA recovery was 24.83 ± 2.79%, 42.87 ± 3.52%, and 34.35 ± 3.69% for Control, HA, and FA, respectively; the corresponding eARG recoveries were 19.90 ± 1.54%, 36.74 ± 1.00%, and 29.70 ± 2.31%. Values are means ± SD for three independently prepared and packed columns per condition. Individual-column values, complete treatment summaries, and statistical results are provided in Tables S8 and S9.
MPC and SPC showed lower effluent recovery than CK and PC under the DOM treatments (Figure S6). The protocol involved HA or FA preconditioning followed by a buffer rinse before DNA injection (Text S3 and Table S3), so the response concerns a conditioned porous medium. Retained DOM may alter surface charge or access to interaction sites [10,28]. The larger HA response cannot be assigned specifically to molecular size, aromaticity, or carbon content without characterization of the DOM preparations. UV and qPCR provide distinct analytical endpoints, with their blank correction and quality-control procedures described in Texts S4 and S5.
The quartz-sand columns provide a controlled comparison under saturated flow, but natural soils and sediments contain heterogeneous minerals, preferential flow paths, organic matter, and changing water chemistry. Biochar-derived DOM can influence transport in soil–water systems [29]. Coating stability and the biological availability of associated DNA must also be considered before extrapolating the observed transport response to environmental application.
The stability of the Mg-Al-containing coating is relevant to longer-term application. Published hydrotalcite studies show that stability varies with interlayer composition and groundwater flow conditions [30], while Mg-Al LDH dissolution in acidic media is pH dependent [31]. Changes in the LDH-containing phase could alter DNA surface interactions and subsequent remobilization. Mg/Al release and coating changes in MPC and SPC should therefore be evaluated during extended flow and shifts in solution chemistry. DNA associated with environmental solids can remain available for natural transformation [15], and mineral humic-acid composites can exert contrasting effects on ARG transformation in competent bacteria [28]. Attenuation of the aqueous eARG signal and biological inactivation are distinct outcomes. The availability of DNA associated with MPC or SPC will depend on its integrity, accessibility to recipient cells, and possible release as solution chemistry changes.
4. Conclusions and Environmental Implications
Mg-Al LDH modification was associated with lower measured effluent recovery of extracellular genetic material in water-saturated quartz-sand columns. The reported eDNA recoveries with MPC and SPC were approximately 52% and 43%, respectively, and eARG BTCs showed the same apparent treatment order. Characterization was consistent with an Mg-Al-containing layered component and changes in surface composition and electrokinetic charge. Electrostatic attraction and metal-associated interactions may contribute to these responses, while physical confinement remains a mechanistic hypothesis. Increasing electrolyte concentration reduced eDNA plateau concentrations in the tested series. HA and FA preconditioning increased subsequent eDNA and eARG effluent recovery, with a larger response to HA.
The input–output deficit represents DNA unrecovered from the effluent during the defined collection interval and does not locate the DNA or identify its binding state. Apparatus losses, incomplete elution, analytical recovery, and degradation remain possible contributors. Further work combining nitrogen adsorption desorption measurements, conservative-tracer experiments, and DNA-specific localization would help distinguish surface interactions from structural and hydraulic contributions. Longer-term assessment should examine coating stability and Mg/Al release, remobilization under changing chemistry, and the natural-transformation potential of material-associated eARGs.
Supplementary Materials
The following supporting information can be downloaded at: https://www.mdpi.com/article/10.3390/toxics14110958/s1, Text S1: DNA preparations and molecular identity; Text S2: Supplementary material characterization; Text S3: Column packing and stage compositions; Text S4: qPCR assay and copy-number calculations; Text S5: UV measurement and matrix interference; Text S6: Breakthrough integration and recovery; Text S7: Backwashing and release integration; Text S8: Independent replication and statistical reporting; Table S1: DNA sources, preparation, molecular identity, purity, and storage; Table S2: Packing masses, pore volumes, calculated porosities, nominal residence times, and dry bulk densities; Table S3: Stage-specific solution composition; Table S4: Primers and amplicon length for the bla qPCR assay; Table S5: qPCR calibration, sensitivity, and validation-control results; Table S6: Calculated DNA inputs for the pore volumes; Table S7: Sequential backwashing design; Table S8: Individual-column effluent recoveries in the DOM experiments; Table S9: One-way ANOVA and assumption diagnostics for the DOM recovery data; Figure S1: Baseline eDNA effluent mass recovery for CK, PC, MPC, and SPC (a), and zeta potentials of MPC and SPC in different solution backgrounds (b); Figure S2: Influent sequence for baseline and electrolyte experiments: 10 PV equilibration, 3 PV DNA injection, and 3 PV DNA-free forward elution; Figure S3: Effects of added NaCl (a,c,e) and CaCl2 (b,d,f) concentrations (0, 5, 25, and 50 mM) on eDNA breakthrough curves in PC (a,b), MPC (c,d), and SPC (e,f) columns; Figure S4: Approximate eDNA plateau C/C0 at 0 and 50 mM added salt for PC (a,b), MPC (c,d), and SPC (e,f), summarized from Figure 4; Figure S5: Calculated nominal contributions of added NaCl and CaCl2 to ionic strength; Figure S6: Effluent recovery of (a) eDNA and (b) eARGs in CK, PC, MPC, and SPC under Control, HA, and FA treatments.
Author Contributions
Conceptualization, S.K. and X.P.; methodology, Z.L., X.P. and S.K.; validation, X.P., S.K., J.X. and S.G.; formal analysis, Z.L. and Z.Y.; investigation, Z.L., X.P., X.W. and Z.S.; resources, S.K.; software, Z.L.; visualization, X.P. and S.G.; writing—original draft preparation, Z.L.; writing—review and editing, X.P., S.K., X.W., Z.S., J.X., Z.Y. and S.G.; supervision, S.K.; funding acquisition, S.K. All authors have read and agreed to the published version of the manuscript.
Funding
This research was funded by the Major Scientific and Technological Innovation Project of Shandong Province, grant number 2021CXGC011206.
Institutional Review Board Statement
Not applicable.
Informed Consent Statement
Not applicable.
Data Availability Statement
The individual-column eDNA and eARG recovery values for the DOM experiments are provided in Supporting Information Table S8, with the associated statistical results in Table S9 and the updated Figure S6. Other data presented in this study are available from the corresponding author upon reasonable request.
Conflicts of Interest
The authors declare no conflicts of interest.
References
- Larsson, D.G.J.; Flach, C.-F. Antibiotic resistance in the environment. Nat. Rev. Microbiol. 2022, 20, 257–269. [Google Scholar] [CrossRef] [Scilit]
- Zhang, Y.; Snow, D.D.; Parker, D.; Zhou, Z.; Li, X. Intracellular and extracellular antimicrobial resistance genes in the sludge of livestock waste management structures. Environ. Sci. Technol. 2013, 47, 10206–10213. [Google Scholar] [CrossRef] [Scilit]
- Mao, D.; Luo, Y.; Mathieu, J.; Wang, Q.; Feng, L.; Mu, Q.; Feng, C.; Alvarez, P.J.J. Persistence of extracellular DNA in river sediment facilitates antibiotic resistance gene propagation. Environ. Sci. Technol. 2014, 48, 71–78. [Google Scholar] [CrossRef] [Scilit]
- Zhu, Y.; Liu, Z.; Hu, B.; Zhu, L. Partitioning and migration of antibiotic resistance genes at soil-water-air interface mediated by plasmids. Environ. Pollut. 2023, 327, 121557. [Google Scholar] [CrossRef] [Scilit]
- May, T.; Ito, A.; Okabe, S. Induction of multidrug resistance mechanism in Escherichia coli biofilms by interplay between tetracycline and ampicillin resistance genes. Antimicrob. Agents Chemother. 2009, 53, 4628–4639. [Google Scholar] [CrossRef] [Scilit]
- Small, K.L.; Henthorn, N.T.; Angal-Kalinin, D.; Chadwick, A.L.; Santina, E.; Aitkenhead, A.; Kirkby, K.J.; Smith, R.J.; Surman, M.; Jones, J. Evaluating very high energy electron RBE from nanodosimetric pBR322 plasmid DNA damage. Sci. Rep. 2021, 11, 3341. [Google Scholar] [CrossRef] [Scilit]
- Cai, P.; Huang, Q.; Zhu, J.; Jiang, D.; Zhou, X.; Rong, X.; Liang, W. Effects of low-molecular-weight organic ligands and phosphate on DNA adsorption by soil colloids and minerals. Colloids Surf. B Biointerfaces 2007, 54, 53–59. [Google Scholar] [CrossRef] [Scilit]
- Sodnikar, K.; Kaegi, R.; Christl, I.; Schroth, M.H.; Sander, M. Transport of double-stranded ribonucleic acids (dsRNA) and deoxyribonucleic acids (DNA) in sand and iron oxide-coated sand columns under varying solution chemistries. Environ. Sci. Process. Impacts 2023, 25, 2067–2080. [Google Scholar] [CrossRef] [Scilit]
- Fang, J.; Li, W.; Tian, Y.; Chen, Z.; Yu, Y.; Shan, S.; Rajput, V.D.; Srivastava, S.; Lin, D. Pyrolysis temperature affects the inhibitory mechanism of biochars on the mobility of extracellular antibiotic resistance genes in saturated porous media. J. Hazard. Mater. 2022, 439, 129668. [Google Scholar] [CrossRef] [Scilit]
- Calderón-Franco, D.; Apoorva, S.; Medema, G.; van Loosdrecht, M.C.M.; Weissbrodt, D.G. Upgrading residues from wastewater and drinking water treatment plants as low-cost adsorbents to remove extracellular DNA and microorganisms carrying antibiotic resistance genes from treated effluents. Sci. Total Environ. 2021, 778, 146364. [Google Scholar] [CrossRef] [Scilit]
- Schmidt, M.P.; Ashworth, D.J.; Phan, D.; Bhattacharjee, A.S.; Ferreira, J.F.S.; Ibekwe, A.M. Biochar–eDNA interactions in wastewater treatment: Interplay between feedstock diversity and pyrolysis temperature. Bioresour. Technol. Rep. 2026, 35, 102903. [Google Scholar] [CrossRef] [Scilit]
- Fu, Y.; Wang, F.; Sheng, H.; Hu, F.; Wang, Z.; Xu, M.; Bian, Y.; Jiang, X.; Tiedje, J.M. Removal of extracellular antibiotic resistance genes using magnetic biochar/quaternary phosphonium salt in aquatic environments: A mechanistic study. J. Hazard. Mater. 2021, 411, 125048. [Google Scholar] [CrossRef] [Scilit]
- Peng, Y.; Sun, Y.; Hanif, A.; Shang, J.; Shen, Z.; Hou, D.; Zhou, Y.; Chen, Q.; Ok, Y.S.; Tsang, D.C.W. Design and fabrication of exfoliated Mg/Al layered double hydroxides on biochar support. J. Clean. Prod. 2021, 289, 125142. [Google Scholar] [CrossRef] [Scilit]
- Xie, J.; Kim, K.-M.; Park, J.; Kim, Y.S.; Park, W.; Jung, B.C.; Chandrabose, V.; Khalid, Z.; Kim, T.-I.; Oh, J.-M. Dimensional precision in DNA affinity by layered double hydroxides with length and size selectivity. Appl. Clay Sci. 2025, 273, 107852. [Google Scholar] [CrossRef] [Scilit]
- Lu, N.; Mylon, S.E.; Kong, R.; Bhargava, R.; Zilles, J.L.; Nguyen, T.H. Interactions between dissolved natural organic matter and adsorbed DNA and their effect on natural transformation of Azotobacter vinelandii. Sci. Total Environ. 2012, 426, 430–435. [Google Scholar] [CrossRef] [Scilit]
- Thommes, M.; Kaneko, K.; Neimark, A.V.; Olivier, J.P.; Rodriguez-Reinoso, F.; Rouquerol, J.; Sing, K.S.W. Physisorption of gases, with special reference to the evaluation of surface area and pore size distribution (IUPAC Technical Report). Pure Appl. Chem. 2015, 87, 1051–1069. [Google Scholar] [CrossRef] [Scilit]
- Lee, C.; Kim, J.; Shin, S.G.; Hwang, S. Absolute and relative QPCR quantification of plasmid copy number in Escherichia coli. J. Biotechnol. 2006, 123, 273–280. [Google Scholar] [CrossRef] [Scilit]
- Dong, L.; Yoo, H.-B.; Wang, J.; Park, S.-R. Accurate quantification of supercoiled DNA by digital PCR. Sci. Rep. 2016, 6, 24230. [Google Scholar] [CrossRef] [Scilit]
- Pan, X.; Kuang, S.; Wang, X.; Ullah, H.; Rao, Z.; Ali, E.F.; Abbas, Q.; Lee, S.S.; Shaheen, S.M. Functionalization of sawdust biochar using Mg-Fe-LDH and sodium dodecyl sulfonate enhanced its stability and immobilization capacity for Cd and Pb in contaminated water and soil. Biochar 2025, 7, 16. [Google Scholar] [CrossRef] [Scilit]
- Pan, X.; Kuang, S.; Wang, X. Effective strategy for alleviation of oil contamination in marine via the superhydrophobic biochar: Performances, mechanisms and environmental recalcitrance. J. Clean. Prod. 2024, 462, 142695. [Google Scholar] [CrossRef] [Scilit]
- Yang, X.; Tong, J.; Yang, X.; Shao, X.; Luo, T.; Zhao, S.; Zhang, E.; Jiang, B.; Wang, L.; Han, Y. Efficient removal of anionic Congo red by hickory-chip/peanut-shell biochar and Mg-Al hydrotalcite composites fabricated via modified co-precipitation-hydrothermal and buried carbon pyrolysis approach. Mater. Res. Bull. 2026, 198, 113963. [Google Scholar] [CrossRef] [Scilit]
- Liu, W.-J.; Jiang, H.; Yu, H.-Q. Development of biochar-based functional materials: Toward a sustainable platform carbon material. Chem. Rev. 2015, 115, 12251–12285. [Google Scholar] [CrossRef] [Scilit]
- Huang, Z.; Wang, T.; Shen, M.; Huang, Z.; Chong, Y.; Cui, L. Coagulation treatment of swine wastewater by the method of in-situ forming layered double hydroxides and sludge recycling for preparation of biochar composite catalyst. Chem. Eng. J. 2019, 369, 784–792. [Google Scholar] [CrossRef] [Scilit]
- Das, A.; Jana, A.; Das, D.; Biswas, S.; Sheshadri, H.; Rao, M.S.; De, S. Surfactant assisted APTES functionalization of graphene oxide intercalated layered double hydroxide (LDH) for uranium adsorption from alkaline leach liquor. J. Clean. Prod. 2023, 390, 136058. [Google Scholar] [CrossRef] [Scilit]
- Zandieh, M.; Hogan, Ú.E.; Smith, R.D.L.; Liu, J. Spherical DNA for probing wettability of microplastics. Langmuir 2023, 39, 4959–4966. [Google Scholar] [CrossRef] [Scilit]
- Sidstedt, M.; Jansson, L.; Nilsson, E.; Noppa, L.; Forsman, M.; Rådström, P.; Hedman, J. Humic substances cause fluorescence inhibition in real-time polymerase chain reaction. Anal. Biochem. 2015, 487, 30–37. [Google Scholar] [CrossRef] [Scilit]
- He, H.; Zhou, P.; Shimabuku, K.K.; Fang, X.; Li, S.; Lee, Y.; Dodd, M.C. Degradation and deactivation of bacterial antibiotic resistance genes during exposure to free chlorine, monochloramine, chlorine dioxide, ozone, ultraviolet light, and hydroxyl radical. Environ. Sci. Technol. 2019, 53, 2013–2026, Correction in Environ. Sci. Technol. 2020, 54, 10975. https://doi.org/10.1021/acs.est.0c04935. [Google Scholar] [CrossRef] [Scilit]
- Huang, Q.; Zhu, J.; Qu, C.; Wang, Y.; Hao, X.; Chen, W.; Cai, P.; Huang, Q. Dichotomous role of humic substances in modulating transformation of antibiotic resistance genes in mineral systems. Environ. Sci. Technol. 2023, 57, 790–800. [Google Scholar] [CrossRef] [Scilit]
- Qiu, L.; Wu, J.; Qian, Y.; Nafees, M.; Zhang, J.; Du, W.; Yin, Y.; Guo, H. Impact of biochar-induced vertical mobilization of dissolved organic matter, sulfamethazine and antibiotic resistance genes variation in a soil-plant system. J. Hazard. Mater. 2021, 417, 126022. [Google Scholar] [CrossRef] [Scilit]
- Alonso-de-Linaje, V.; Tobler, D.J.; Espinosa, R.; Rives, V.; Bovet, N.; Dalby, K.N. Hydrotalcite stability during long-term exposure to natural environmental conditions. Environ. Sci. Pollut. Res. 2020, 27, 23801–23811. [Google Scholar] [CrossRef] [Scilit]
- Parello, M.L.; Rojas, R.; Giacomelli, C.E. Dissolution kinetics and mechanism of Mg–Al layered double hydroxides: A simple approach to describe drug release in acid media. J. Colloid Interface Sci. 2010, 351, 134–139. [Google Scholar] [CrossRef] [Scilit]
Disclaimer/Publisher’s Note: The statements, opinions and data contained in all publications are solely those of the individual author(s) and contributor(s) and not of MDPI and/or the editor(s). MDPI and/or the editor(s) disclaim responsibility for any injury to people or property resulting from any ideas, methods, instructions or products referred to in the content. |
© 2026 by the authors. Licensee MDPI, Basel, Switzerland. This article is an open access article distributed under the terms and conditions of the Creative Commons Attribution (CC BY) license.