


Abstract
Ozone (O3) pollution has become an important constraint on air quality improvement in the Guanzhong region, a typical semi-enclosed terrain in inland China. Based on hourly air quality and meteorological observations during 2019–2023 across five key cities in the Guanzhong region, this study investigated spatiotemporal patterns of O3 and its response to meteorological drivers using correlation analysis, a Meteorology Synthetic Index (MSI), and a vector wind decomposition method for identifying mountain-valley-breeze days. Results showed that regional annual O3 concentrations exhibited an overall upward trend, with monthly peaks in June–July and hourly peaks between 14:00 and 17:00 China Standard Time (UTC + 08:00). Notably, the night-time O3 increase was approximately four times that in daytime, indicating a prominent nocturnal accumulation effect. Spatially, O3 levels were lower in the west and higher in the southeast, with Xi’an and Xianyang as persistent hotspots. Ozone-exceedance days are frequently observed under meteorological conditions of T > 30 °C, RH < 50%, and wind speed < 4 m·s−1 in Guanzhong region. Meteorological factors explained 35% of the MDA8 O3 variance on normal days, which decreased to 4% during moderate-severe pollution episodes. Mountain-valley-breeze days accounted for 43% of the total, with MDA8 O3 levels 12.6 ± 5.7 μg·m−3 higher than that on non-breeze days. This discrepancy was most pronounced during the daytime valley breeze phase and was further intensified during moderate–severe pollution events. The differentiated diurnal ozone amplification effect of valley breeze further supplements global knowledge of terrain-induced ozone stagnation, delivering hierarchical, cross-regional collaborative control guidance for ozone abatement in comparable basin regions across Asia, North America and Europe.
1. Introduction
At present, PM2.5 (fine particulate matter with aerodynamic diameter ≤ 2.5 μm) concentrations across 337 prefecture-level and above cities in China have declined significantly, accompanied by a marked increase in the proportion of days with good air quality. However, against this backdrop, ozone (O3) pollution has become increasingly prominent. O3 has emerged as a major pollutant affecting air quality in China, second only to PM2.5 [1,2]. Numerous studies indicate that O3 pollution levels are rising across China [3,4,5]. Increasing O3 concentrations pose significant risks to ecosystems and human health [6,7], with high levels shown to impair the respiratory, immune, nervous, and integumentary systems [8,9,10]. Therefore, O3 pollution has become a key constraint on further improvements in air quality in China.
O3 is a secondary pollutant formed through photochemical reactions involving nitrogen oxides (NOx consists of nitric oxide (NO) and nitrogen dioxide (NO2)) and volatile organic compounds (VOCs) in the presence of solar ultraviolet radiation [11,12,13,14,15]. The key reactions include the photolysis of NO2 (NO2 + hv → NO + O(3P)), the rapid recombination of atomic oxygen with molecular oxygen (O(3P) + O2 + M → O3 + M) (M being used to represent any third co-reactant), and the VOC-mediated cycling of NO to NO2 via peroxy radicals (RO2 + NO → RO + NO2), which enables O3 accumulation by inhibiting the NO + O3 → NO2 + O2 titration reaction. The nonlinear dependence of O3 production on precursor concentrations means that O3 formation can be either NOx-limited or VOC-limited depending on the local photochemical regime [16,17]. O3 pollution results from the combined effects of complex chemical reactions and specific meteorological conditions, which exhibit a strongly nonlinear relationship with O3 formation [18,19]. Solar ultraviolet radiation acts as an essential driver for photolysis-based reactions, while temperature further modulates reaction rates and biogenic-VOC emissions, jointly regulating net O3 build-up. These factors influence O3 production and accumulation by regulating precursor emissions, photochemical reaction rates, pollutant transport and dispersion, and deposition processes [20,21]. Meteorological conditions such as high temperature, low humidity, and strong solar radiation can accelerate O3 formation [22,23,24]. For example, when temperatures exceed 30 °C, the rate at which O3 concentrations increase with temperature rises significantly in cities such as Shanghai [25] and Beijing [18]. Specifically, elevated temperatures increase the rate constants of key photochemical reactions and enhance the emission of biogenic VOCs such as isoprene; low relative humidity reduces cloud cover and atmospheric attenuation, allowing greater solar actinic flux to reach the surface and drive NO2 photolysis; and intense ultraviolet radiation directly determines the rate of OH radical production via O3 photolysis (O3 + hν → O(1D) + O2; O(1D) + H2O → 2OH), thereby initiating VOC oxidation chains that sustain net O3 production [16,26]. Among these factors, temperature has the greatest influence on O3 concentrations, followed by atmospheric pressure and humidity. In addition, topography affects pollutant distribution by altering local atmospheric circulation [27]. In regions with complex terrain, such as plateaus and basins, mountain-valley-breeze circulation is a dominant local atmospheric pattern. When it occurs, pollutants tend to accumulate near the surface, leading to regional episodes of elevated O3 concentrations [28,29]. Notably, even under less pronounced meteorological conditions, pollutant transport and dispersion during severe O3 pollution events are often governed by mountain-valley-breeze circulation [30]. This has been supported by previous studies. For example, Guo et al. [31] reported that mountain-valley breeze increased O3 concentrations in the Taiyuan Basin by 20 μg·m−3. Similarly, Guo et al. [32] found that mountain breeze transported O3-rich air masses into Lanzhou, raising night-time O3 levels by 16.1 μg·m−3. Comparable findings have been reported by Lee et al. [33] in the Phoenix Valley, USA, and Beaver et al. [34] in California’s San Joaquin Valley. Further evidence from Kaser et al. [35] in the Colorado Mountains and Baumbach et al. [36] in Freiburg suggests that early-morning increases in O3 may be linked to residual O3 from the previous day, retained within valleys under the influence of mountain-valley-breeze circulation [37]. In the Colorado Mountains, O3 concentrations increased by 5 ppb·h−1 on mountain-valley-breeze days, while in Freiburg, peak O3 levels rose from 70 ppb to 100 ppb. In summary, specific meteorological conditions, particularly high temperature and low humidity together with mountain-valley-breeze circulation are closely linked to O3 formation and accumulation and are key drivers of regional O3 pollution. A clear understanding of the meteorological drivers of O3 pollution and their effects is essential for early warning and the implementation of targeted emission control strategies.
The Guanzhong region is located in central inland China, bordered by the Qinling Mountains to the south and the Loess Plateau to the north. Its distinctive topography—the Weihe Basin—combined with rapid industrialization and urbanization has led to frequent O3 pollution episodes, making it one of the regions in China most affected by O3 pollution [38,39,40]. The region hosts a dense concentration of industrial emission sources, including petrochemical refining, coal-fired power generation, cement production, and chemical manufacturing, which constitute major anthropogenic sources of NOx and VOCs. Vehicular emissions from the growing urban fleet and biogenic VOC emissions from the extensive forest cover of the Qinling Mountains further contribute to the regional precursor burden [41,42,43,44]. Ozone pollution episodes are driven by the combined effect of precursor emission loads, meteorological conditions, and topographic trapping effects within the basin. From 2014 to 2020, ozone levels in the Guanzhong region continued to rise, with concentrations increasing by 3.9–6.4 μg·m−3 [45]. The dispersion, transport, and transformation of O3 in the Guanzhong region are closely linked to meteorological conditions [46]. Research indicates that days with excessive O3 concentration levels are often accompanied by meteorological conditions characterized by high daily temperatures, low humidity, and low wind speeds [47]. More importantly, the terrain formed by the Qinling Mountains and the Loess Plateau gives rise to pronounced mountain-valley-breeze circulation in the region. This local circulation system facilitates the accumulation and stagnation of pollutants within the basin, thereby intensifying regional pollution. Although observational evidence from other basin-valley regions, including Taiyuan [31], Lanzhou [32], and multiple North American valleys [33,35,37], has confirmed that mountain-valley-breeze circulations elevate O3 concentrations [48,49], the available literature concerning mountain-valley-breeze impacts on O3 concentrations remains relatively limited, and most basin-oriented studies are based on single-city analyses or short-term pollution-event simulations. For the Guanzhong region, a typical semi-enclosed inland basin, two notable limitations persist in current understanding: multi-year observational analyses that systematically quantify mountain-valley-breeze modulation of diurnal O3 evolution, especially night-time O3 accumulation, are still scarce; furthermore, the explanatory power of integrated meteorological signals under different scenarios (ordinary days versus moderate-to-severe ozone-pollution episodes) has yet to be thoroughly assessed for this region.
Under this background, this study focuses on the Guanzhong region (Xi’an, Xianyang, Weinan, Baoji, and Tongchuan) and conducts a systematic analysis using hourly air pollutant concentrations and meteorological data from national monitoring stations from 2019 to 2023. Pearson correlation analysis and a Meteorology Synthetic Index (MSI) were applied to quantify the strength of the relationships between O3 concentrations and key meteorological factors, as well as the contribution of meteorological conditions to O3 variability. A vector breeze decomposition method was used to distinguish mountain-valley-breeze days from non-breeze days, enabling a comparison of O3 concentrations under these conditions. This approach aims to advance understanding of the mechanisms driving O3 pollution in the Guanzhong region and other similar basin environments, and to provide a scientific basis for more targeted and effective pollution control strategies. The findings can further provide a reference for ozone pollution warning and control for analogous basin areas across Asia, North America, and Europe.
2. Materials and Methods
2.1. Study Area
The Guanzhong region is located in central Shaanxi Province, China, spanning 106° 13′–110° 40′ E and 33° 30′–35° 50′ N. It includes five cities—Xi’an, Xianyang, Weinan, Baoji, and Tongchuan (Figure 1)—and is also referred to as the “Guanzhong Basin” or “Guanzhong Plain”. The region is characterized by the Weihe Basin, a semi-enclosed terrain surrounded by mountains on three sides and open to the east. It is bordered by the Qinling Mountains to the south and the Loess Plateau to the north. The basin has elevations ranging from 320 to 800 m, with relatively flat terrain and the Weihe River flowing across it. This enclosed topography significantly restricts pollutant dispersion. The region experiences a temperate continental monsoon climate, characterized by hot, dry summers and intense solar radiation. These conditions—high temperature, low humidity, and strong radiation—favor photochemical O3 formation. As a major population and economic center, the Guanzhong region also has substantial industrial emissions, providing abundant precursors (NOx and VOCs) for O3 formation. Consequently, it is one of the regions in China most prone to O3 pollution.
Figure 1.
Schematic map of the geographical location of the Guanzhong region in Shaanxi Province, China. The red area in the inset map indicates the location of the study region, while the red connecting lines link the study region to the enlarged topographic map.
2.2. Data Sources and Processing
2.2.1. Data Sources
The air pollutant concentration data used in this study—including ozone (O3), fine particulate matter (PM2.5), inhalable particulate matter (PM10), sulfur dioxide (SO2), nitrogen dioxide (NO2), and carbon monoxide (CO)—were obtained from national air quality monitoring stations across five cities in the Guanzhong region. The data were sourced from the Shaanxi Provincial Air Quality Monitoring Platform. Measurements were performed using Thermo Fisher Scientific continuous gas analyzers (Model 42i, 43i, 48i, and 49i; Thermo Fisher Scientific, Waltham, MA, USA). Chemiluminescence detection for NO-NO2-NOx (42i), pulsed fluorescence for SO2 (43i), gas-filter correlation for CO (48i), and UV photometry for O3 (49i) were conducted. The study covers the period from 1 January 2019 to 31 December 2023.
Hourly meteorological data—including wind speed, wind direction, air temperature, relative humidity, and solar radiation—used to analyze the effects of mountain-valley-breeze circulation and meteorological conditions were collected from the meteorological monitoring systems co-located at these national air quality stations. Information on stations is provided in Table S1. To supplement the station-based observations, partial wind speed and wind direction data were obtained from the ERA5 reanalysis dataset provided by the European Centre for Medium-Range Weather Forecasts (ECMWF).
2.2.2. Data Processing
In accordance with the Ambient Air Quality Standards (GB 3095-2012) [50] and the Technical Regulation on Ambient Air Quality Index (Trial) (HJ 633-2012) [51], the daily evaluation metric for O3 is defined as the maximum 8 h moving average concentration within a 24-h period (MDA8 O3) [50]. The annual O3 assessment value for each city was defined as the 90th percentile of valid daily maximum 8 h average (MDA8) O3 concentrations within each calendar year. According to China’s National Ambient Air Quality Standard (Grade II), the daily limit for MDA8 O3 is approximately 80 ppb (160 μg·m−3), and the 1 h average concentration limit for O3 is 100 ppb (200 μg·m−3). An “ozone exceedance day” is defined as a city-day on which MDA8 O3 exceeds the Grade-II limit of 160 μg·m−3 specified for the daily maximum 8 h average. An “ozone primary-pollutant day” is a city-day on which AQI > 50 and O3 has the largest IAQI among the six criteria pollutants. This is not synonymous with an ozone exceedance day: when O3 exceeds its own 8 h limit while another pollutant—mainly PM2.5 or PM10—yields a higher IAQI, O3 exceeds but is not the primary pollutant. All day counts in this paper are reported as city-days (five cities × 1826 days = 9130 city-days over 2019–2023).
The air quality monitoring data used in this study were obtained from the Shaanxi Provincial Air Quality Monitoring Platform. Data quality control was conducted in accordance with the relevant requirements of Ambient Air Quality Standards (GB 3095-2012) [50], the Technical Regulation on Ambient Air Quality Index (AQI) (on trial) (HJ 633-2012) [51], which were applicable during the study period. Specifically, the calculation of an 8 h moving average O3 concentration required at least six valid hourly measurements. For the MDA8 O3 concentration to be considered valid, at least 14 valid 8 h moving averages were required between 08:00 and 24:00. If fewer than 14 valid 8 h averages were available but the maximum 8 h average exceeded the applicable air quality standard, the daily exceedance determination was still considered valid.
2.3. Methods
2.3.1. Air Quality Index Calculation
The Air Quality Index (AQI) was calculated according to the Technical Regulation on Ambient Air Quality Index (HJ 633-2012) [51]. The individual air quality index (IAQI) of each pollutant was first computed by piecewise linear interpolation:
where CP denotes the mass concentration of pollutant P (P encompasses six pollutants: SO2, NO2, CO, PM2.5, PM10, and O3); BPHi represents the upper limit of the pollutant concentration limit corresponding to CP in the Individual Air Quality Index (IAQI) and Corresponding Pollutant Concentration Limits Table (Table S2), and BPLo represents the lower limit of the pollutant concentration limit corresponding to CP in the Individual Air Quality Index (IAQI) and Corresponding Pollutant Concentration Limits Table (Table S2); IAQIP is the individual air quality index for pollutant P, and IAQIHi and IAQILo are the IAQI values corresponding to BPHi and BPLo, respectively. The 24 h average concentrations were used for SO2, NO2, PM10 and PM2.5, the 24 h average concentration (mg/m3) for CO, and the daily maximum 8 h moving average for O3.
The AQI was then defined as the maximum of the individual IAQI values:
When AQI > 50, the pollutant with the highest IAQI was designated as the primary pollutant, and that day was designated as the corresponding “primary pollutant day”; otherwise, no primary pollutant was assigned. Based on the AQI, air quality was classified into six levels: excellent (0–50), good (51–100), light pollution (101–150), moderate pollution (151–200), heavy pollution (201–300), and severe pollution (>300).
2.3.2. Analysis of Meteorological Influences
In this study, a Meteorology Synthetic Index (MSI) was used to comprehensively describe the effect of meteorological roles on ground-level O3 concentration variability. The MSI was calculated following the method proposed by Chen et al. [52], as shown in Equation (3), incorporating variables such as temperature, ultraviolet radiation, and wind speed. Higher MSI values indicate meteorological conditions that are more favorable for O3 formation.
The Meteorology Synthetic Index (MSI) combines two simplified meteorological components: the Photochemical Reaction Condition (PRC) and the Physical Dispersion Capacity (PDC). The meteorological parameters used in Equation (3) were first nondimensionalized to make them comparable (Equations (4)–(6)). The normalization in Equations (4)–(6) follows min–max scaling of the meteorological variables. For the normalized mean values, the temperature uses a 24 h average; however, since SW values are zero during the night, we calculate the average over non-zero periods. PRC is defined as the product of 2 m air temperature and solar radiation () (here, we use ultraviolet radiation data to replace solar radiation.), representing meteorological conditions favorable for photochemical O3 production. Higher temperatures can enhance temperature-dependent atmospheric chemistry and biogenic VOC emissions, while stronger solar radiation generally increases photolysis frequencies, including that of NO2, an essential step in tropospheric O3 formation. Wind speed can be a surrogate for planetary boundary layer height (PBLH); in this context, it is denoted as PDC (PDC = WS’), which serves as a simplified proxy for atmospheric ventilation and pollutant dispersion, particularly horizontal dilution and advection. The WS used is the daily average value. When WS equals 0, the PRC/PDC ratio is undefined; therefore, such data points are excluded from the dataset. Consequently, a high MSI indicates meteorological conditions characterized by strong photochemical potential and relatively weak physical dispersion. Nevertheless, the index is an empirical diagnostic metric and does not explicitly represent precursor emissions, chemical sensitivity, vertical mixing, cloud effects, or regional O3 transport [47]. We used linear associations between MDA8 O3 and PRC, PDC, and MSI. We performed linear regressions of MDA8 O3 against MSI for the Guanzhong region. The coefficient of determination (R2) quantifies the fraction of ozone variance captured by these integrated meteorological roles for regression analyses. Importantly, R2 reflects the variance explained by meteorological roles rather than absolute meteorological contributions fully decoupled from precursor-emission backgrounds.
2.3.3. Identification of Mountain-Valley Breeze
Owing to the unique topography formed by the Qinling Mountains and the Loess Plateau, the Guanzhong region exhibits pronounced mountain-valley-breeze circulation [53,54]. During the daytime, solar radiation heats mountain slopes more rapidly than valley floors, causing warm air over the slopes to rise while cooler air from the valley descends to compensate, generating a valley breeze that flows from the valley toward the slopes. At night, slopes cool more quickly than valleys, leading to the downslope movement of cooler air and the compensatory upward motion of warmer valley air, forming a mountain breeze that flows from the slopes toward the valley. Together, these processes create a diurnal circulation cycle [55,56]. In this study, the method proposed by Yuqing Zhang [57] was adopted to identify mountain-valley-breeze days. Let WSij and WDij denote the wind speed and wind direction at time j on day i at a monitoring station. The observed wind speed and direction from 00:00 to 23:00 were decomposed into vector breeze components u and v, where u represents the zonal (east–west) component and v represents the meridional (north–south) component. All hourly time presented in this study refers to China Standard Time (UTC + 08:00). The daily mean values (, ) were calculated to represent the background breeze components. The local breeze components (u′, v′) were then obtained by subtracting the background breeze from the observed breeze. Finally, the local wind speed (WSij′) and wind direction (WDij′) associated with mountain-valley-breeze circulation were derived from the local breeze components.
For the local breeze components, positive u′ denotes westerly breeze and negative u′ denotes easterly breeze, while positive v′ denotes southerly breeze and negative v′ denotes northerly breeze. Mountain breeze was defined as occurring from 20:00 on the previous day to 07:00 local time on the current day, whereas valley breeze was defined as occurring from 08:00 to 19:00 local time. Based on the geographical characteristics of cities in the Guanzhong region, city-specific directional criteria were applied. For Xi’an and Xianyang, mountain breeze was identified when WDij′ ranged from 78.75° to 258.75°, with all other directions classified as valley breeze. For Weinan, mountain breeze was defined as WDij′ between 90° and 270°, with all other directions considered valley breeze. For Baoji, mountain breeze was defined as WDij′ between 112.5° and 281.25°, while valley breeze was defined as WDij′ between 292.5° and 101.25°. For Tongchuan, mountain breeze was defined as WDij′ within 22.5–90° and 101.25–225°, with all other directions classified as valley breeze. A day was classified as a mountain-valley-breeze day only when both mountain breeze during 20:00–07:00 LST and valley breeze during 08:00–19:00 LST persisted continuously for at least 4 h within their respective periods.
3. Results and Discussion
3.1. Characteristics of O3 Variation and Its Impact on Air Quality
3.1.1. Temporal Variation in O3 Concentrations
The annual O3 assessment values across the region exhibit a trend of first declining and then rising. In high-concentration areas such as Xi’an and Xianyang, annual O3 assessment values (90th percentile of daily MDA8 O3) increased from 166 and 162 μg·m−3 in 2019 to 172 and 171 μg·m−3 in 2023, respectively. These results indicate that the regional baseline level of O3 pollution has risen markedly, while O3 assessment values in already highly polluted areas have continued to increase. At the city level, the trends in annual O3 assessment values differed substantially among the five cities in the Guanzhong region during 2019–2023. Xi’an and Xianyang showed similar patterns, with fluctuating but overall increasing annual O3 assessment values that peaked in 2022 at 176 and 178 μg·m−3, respectively. In contrast, Weinan and Tongchuan exhibited slight fluctuating downward trends in annual O3 assessment values. Baoji showed a slight fluctuating upward trend in annual O3 assessment values (Table 1). The temporary decline in 2020 is attributable to reduced anthropogenic emissions during the COVID-19 pandemic lockdown period, which suppressed NOx emissions and altered O3 photochemistry. The subsequent increase from 2021 to 2022 reflects the recovery of industrial and transportation activities combined with meteorological conditions favorable to O3 formation, including above-average temperatures and increased solar radiation during the summer of 2022 [41,58,59,60].
Table 1.
Annual O3 assessment values (90th percentile of daily MDA8 O3 concentrations) change in the five cities in Guanzhong region from 2019 to 2023.
In terms of monthly variation, peak MDA8 O3 concentrations in the five cities of the Guanzhong region during 2019–2023 were concentrated in June and July, followed by May and August–September. Observations show that a sharp increase in MDA8 O3 concentrations occurred in March–April during 2019–2020, whereas in 2021 this increase was delayed to April–May. By 2022–2023, this rapid rise was no longer evident. In contrast, MDA8 O3 concentrations declined rapidly during September–October throughout 2019–2023. A comparison of monthly city-level assessment values shows that Baoji had lower MDA8 O3 concentrations than the other four cities during high-concentration months, and its monthly variation was also more moderate (Figure S1).
In summary, the five cities exhibited notably divergent multi-year O3 evolutionary patterns during 2019–2023. Xi’an and Xianyang, the two most populous metropolitan hubs with intensive industrial and vehicular precursor emissions [61,62,63], displayed fluctuating yet overall upward O3 trends and maintained persistently high concentration levels. By contrast, Weinan and Tongchuan, characterized by different industrial and economic structures dominated by agriculture and resource-based industries [61,62,63], presented slightly fluctuating downward or relatively stable O3 trajectories over the study period. Situated at the western basin entrance with comparatively favorable ventilation conditions, Baoji experienced a moderate upward trend but kept the lowest O3 magnitude among the five cities. Such inter-city divergence in ozone temporal evolution highlights that regional O3 pollution is jointly shaped by local precursor-emission backgrounds and topographic–meteorological conditions, which calls for differentiated, city-tailored pollution-control strategies within the Guanzhong basin.
To further examine the diurnal variation in O3 concentrations, hourly data for the high-O3 months (May-September) during 2019–2023 were selected for detailed analysis. The results show that the diurnal variation in hourly O3 concentrations across the five cities in the Guanzhong region followed a typical unimodal pattern (Figure 2) [64]. The lowest hourly O3 concentrations generally occurred from the early morning to shortly after sunrise (04:00–08:00), with minima typically observed around 06:00. For example, the minimum value in Xi’an was 30 μg·m−3. Peak concentrations were reached in the afternoon (14:00–17:00), with a maximum of 153 μg·m−3 recorded in Xi’an. Based on the division between night-time (20:00 on the previous day to 06:00 on the current day) and daytime (07:00–19:00), O3 concentrations showed a clear pattern of night-time decline followed by daytime increase. Compared with 2019, the mean night-time O3 concentration in the Guanzhong region increased from 52 μg·m−3 to 59 μg·m−3 in 2023, representing a rise of 13.4%. Over the same period, the mean daytime concentration increased from 98 μg·m−3 to 101 μg·m−3, an increase of 3.0%. These results indicate that the increase in night-time O3 concentrations over the five-year period was substantially greater than that during the daytime—approximately four times higher—suggesting that the upward trend in night-time O3 was more pronounced in this region. This finding is consistent with the results reported by Guo et al. [32] and Zhu et al. [65].
Figure 2.
Hourly variation in O3 concentration in high-O3 months in five cities of Guanzhong region from 2019 to 2023. (a) Xi’an, (b) Xianyang, (c) Weinan, (d) Baoji, and (e) Tongchuan.
3.1.2. Spatial Variation in O3 Concentrations
The spatial distribution of annual O3 concentrations in the Guanzhong region was characterized by lower levels in the west and higher levels in the southeast. Regional O3 pollution was mainly concentrated in Xi’an, Xianyang, and southern Weinan (Figure 3), which is consistent with the spatial pollution characteristics reported in previous basin-scale studies [66]. The spatial distribution maps were generated using inverse distance weighting (IDW) interpolation applied to annual mean O3 concentrations at each monitoring station. IDW was selected for its ability to preserve local concentration gradients in the complex terrain of the Guanzhong Basin. A unified color scale (130–200 μg·m−3) was applied across all years to facilitate direct visual comparison of interannual changes. Among the five cities, Xi’an and Xianyang consistently exhibited the highest O3 concentrations, followed by Weinan, whereas Tongchuan and Baoji had relatively lower levels. Between 2019 and 2023, the spatial distribution of regional pollution exhibited a trend of first decreasing and then increasing. The O3 hotspot region observed in eastern Guanzhong during 2019 gradually weakened between 2020 and 2021, leading to a reduction in the overall area within the Guanzhong region affected by pollution. From 2022 to 2023, the O3 polluted areas expanded rapidly, while O3 concentrations also rose progressively. As the two major O3 hotspot cities in this region, Xi’an and Xianyang maintained relatively high O3 concentrations throughout the period from 2019 to 2023; however, due to the impact of the pandemic during 2020–2021 [41], their O3 concentrations declined, before experiencing a sharp increase again during 2022–2023. In Weinan, O3 concentrations showed significant fluctuations between decreases and increases, but in 2023, the O3 levels were essentially consistent with those recorded in 2019. No pronounced local hotspots were observed in Baoji or Tongchuan. In particular, Baoji not only had the lowest O3 concentrations, but also showed substantially smaller overall fluctuations than the other four cities.
Figure 3.
Spatial distribution of O3 concentration in five cities of Guanzhong region from 2019 to 2023.
3.1.3. Impact of O3 on Air Quality
The contribution of each pollutant to the comprehensive air quality index was calculated as the ratio of the individual pollutant sub-index to the total air quality index, following the methodology specified in the Technical Regulation on Ambient Air Quality Index (HJ 633-2012) [51]. The comprehensive index is determined by the maximum sub-index among the six criteria pollutants, and the contribution share identifies which pollutant most frequently drives air quality exceedances in each city. From 2019 to 2023, PM2.5 contributed the largest share to the comprehensive air quality index in the five cities of the Guanzhong region (25–31%), followed by PM10 (23–25%), O3 (17–24%), and NO2 (16–21%). The contributions of CO and SO2 were comparatively low, accounting for less than 10% and 5%, respectively (Figure S2). Notably, the contribution of O3 to the comprehensive index showed a clear year-by-year increase during the study period. The increase reached 4–5 percentage points in Xi’an, Xianyang, Baoji, and Tongchuan, and approximately 2 percentage points in Weinan. During the study period, O3 was identified as the primary pollutant on a total of 922 days across five cities. Of these, 92.4% were classified as lightly polluted days, while moderately and -severely polluted days together accounted for less than 8%. In terms of interannual variation, the number of O3 pollution days showed a continuous upward trend in Xianyang, Baoji, and Tongchuan, whereas Xi’an and Weinan exhibited a fluctuating pattern, with an initial decline followed by an increase (Figure S3).
3.2. Effects of Meteorological Factors on O3 Concentrations
3.2.1. Correlation Analysis Between O3 Concentrations and Meteorological Variables
A correlation analysis was conducted between MDA8 O3 concentrations and four meteorological variables—daily maximum temperature, relative humidity, wind speed, and air pressure—in the five cities of the Guanzhong region during 2019–2023. The results are presented in Table 2. Overall, MDA8 O3 concentrations were positively correlated with daily maximum temperature and wind speed (p < 0.01), whereas they were generally negatively correlated with relative humidity and air pressure. However, these relationships varied somewhat among cities. These results are consistent with those reported in the 2021 study by Zhao et al. [41]. In Xianyang, Baoji, and Weinan, MDA8 O3 concentrations were significantly negatively correlated with both relative humidity and air pressure. In Xi’an, no significant correlation was found between MDA8 O3 concentrations and air pressure. In Tongchuan, MDA8 O3 concentrations showed no significant correlation with relative humidity, but remained significantly negatively correlated with air pressure.
Table 2.
Correlation analysis of meteorological elements and MDA8 O3 concentration in five cities of Guanzhong region from 2019 to 2023.
3.2.2. Meteorological Characteristics During O3 Exceedance Periods
Ozone pollution episodes are not driven by a single meteorological factor but arise from the combined coupling of multiple variables including temperature, relative humidity and wind speed. Figure 4 illustrates the relationships between O3 concentrations and temperature, relative humidity, as well as wind speed across the five cities in the Guanzhong region. To characterize the meteorological characteristics under which ozone exceedances have already occurred, non-exceedance days were excluded and frequency-distribution statistics were performed exclusively for ozone-exceedance days.
Figure 4.
Relationship between O3 concentration and temperature, humidity and wind speed in five cities of Guanzhong region. (a) Xi’an, (b) Xianyang, (c) Weinan, (d) Baoji, and (e) Tongchuan.
Between 2019 and 2023, a total of 973 days of ozone exceedance were recorded across five cities under the secondary ozone limit value (160 μg·m−3); analysis revealed that the majority of these ozone exceedance events occurred under meteorological conditions characterized by high temperatures, dryness, and low wind speeds. Specifically, 84.6% (95% CI: 82.2–86.7%) of exceedance days featured maximum daily temperatures above 30 °C; 72.3% (95% CI: 69.4–75.0%) had relative humidity below 50%; as many as 98.8% (95% CI: 97.9–99.3%) exhibited wind speeds lower than 4 m·s−1. High temperatures accelerate photochemical reaction rates and enhance biogenic volatile organic compound (VOC) emissions. Low relative humidity corresponds to reduced cloud cover and stronger ultraviolet radiation, which facilitates NO2 photolysis. Low wind speed indicates poor atmospheric ventilation and dispersion capacity. Collectively, these factors create favorable conditions for ozone formation and local accumulation. Comparable patterns have been reported in observational studies of the North China Plain and Fenwei Plain [67,68,69], suggesting that the combination of high temperature, low humidity and weak wind represents a common meteorological Characteristic for ozone exceedance events across basins and plains in China.
Importantly, these percentages represent the distribution of meteorological variables “within the subset of exceedance events”. They must not be misinterpreted as the probability that ozone exceedances will occur given these meteorological conditions. Even when hot-dry-weak-wind conditions are met, ozone exceedances may still be absent if precursor-emission levels are low. Meteorology therefore provides favorable prerequisites for pollution outbreaks rather than acting as a decisive driver.
3.2.3. Quantitative Assessment of Meteorologically Explained O3 Variability Using the MSI
The daily variations in photochemical reaction conditions (PRC), physical dispersion capacity (PDC), and the Meteorology Synthetic Index (MSI) for the five cities in the Guanzhong region from 2019 to 2023 are shown in Figure 5. The five cities showed different MSI ranges, and the years in which peak MSI values occurred also differed. Higher MSI values indicate meteorological conditions that are generally more favorable for elevated surface O3. After excluding invalid MSI values, peak MSI values occurred in 2019 for Xi’an, Xianyang, Weinan and Tongchuan, reaching 8.82, 15.54, 13.82 and 7.71, respectively. In contrast, the peak MSI values for Baoji occurred in 2020 (12.54). Based on MSI values, meteorological conditions were relatively favorable for O3 formation in Xi’an, Xianyang, Weinan and Tongchuan in 2019 and in Baoji in 2020. However, because O3 formation and pollution episodes are controlled by multiple factors, a high MSI in a given city does not necessarily correspond to a high O3 concentration. After normalization of the meteorological data, both PRC and PDC ranged from 0 to 1 in all five cities. As shown in Figure 6, high MSI values were generally associated with higher PRC and lower PDC values, indicating that PRC had a stronger influence on MSI.
Figure 5.
Daily variation in photochemical reaction conditions (PRC), Physical Dispersion Capacity (PDC) and Meteorology Synthetic Index (MSI) in five cities of Guanzhong region from 2019 to 2023. (a) Xi’an, (b) Xianyang, (c) Weinan, (d) Baoji, and (e) Tongchuan.
From 2019 to 2023, the MSI showed good agreement with MDA8 O3 across the five cities in the Guanzhong region. Linear regression was performed between daily MSI and MDA8 O3 for 2019–2023 (Figure S4), and further regression analysis was conducted between daily MSI and corresponding MDA8 O3 on moderate to severe polluted days (Figure S5). The fitted equations are presented in Table 3. The variation in R2 values across cities (Table 3) reveals important spatial heterogeneity in meteorological influences on O3. It should be noted that these city-specific R2 values quantify the variance in MDA8 O3 explained by the integrated meteorological index, MSI, and should not be interpreted as absolute meteorological contributions completely decoupled from precursor-emission backgrounds. The higher explanatory power in Xi’an (R2 = 0.47 daily) and Xianyang (R2 = 0.41) compared with Baoji (R2 = 0.27) may reflect differences in the relative importance of meteorological versus emission drivers. In cities with higher precursor emissions (Xi’an, Xianyang) [64,69], meteorological conditions act as the limiting factor that triggers exceedances when chemical precursors are already abundant, resulting in stronger meteorology-O3 correlations. Conversely, in cities with lower emissions (Baoji and Tongchuan, China) [65,70], precursor availability may be the primary limiting factor, weakening the apparent meteorological signal.
Table 3.
Fitting results of MSI and MDA8 O3 in five cities of Guanzhong region from 2019 to 2023.
For comparison with the diagnostic MSI, a single-predictor model based on daily maximum temperature (Tmax) and a multivariable meteorological regression were also evaluated; their reported fitting and cross-validation statistics are summarized in Table S3. These comparisons assess statistical performance and do not establish a causal attribution of O3 variability to individual meteorological factors.
We further calculated annual pooled regression outputs for the five-city dataset to characterize temporal variations in MSI–O3 relationships. For individual years, the all-day/moderate-to-severe-episode R2 pairs were as follows: 0.28/0.09 (2019), 0.33/0.29 (2020), 0.56/0.02 (2021), 0.32/0.01 (2022), and 0.39/0.02 (2023). The inter-annual variations in these pooled R2 values broadly follow the documented decreasing-then-increasing trend of regional O3 concentrations. The explanatory capacity of MSI for ozone variability shows pronounced year-to-year differences, which are modulated by the combined effects of meteorological conditions and real-world precursor-emission backgrounds.
After clarifying the spatial variations across cities and inter-annual temporal variability in MSI–O3 relationships, we further compiled a fully pooled dataset covering all five cities and the complete 2019–2023 time series to quantify the overall regional statistical characteristics during the study period. For the pooled five-city dataset, the overall R2 of the five cities in five years reaches only 0.35 for all-day samples and decreased to 0.04 for pollution-episode samples. Compared with the regression results based on all valid days, the explanatory power of MSI was substantially reduced under moderate-to-severe O3 pollution conditions in Xi’an, Xianyang, Weinan, and Tongchuan, with R2 decreasing from 0.26 to 0.49 to 0.02–0.11. This reduction may partly reflect the restricted range of O3 concentrations after selecting only heavily polluted days, together with the smaller sample size. Furthermore, severe O3 pollution episodes are influenced not only by meteorological conditions but also by variations in precursor emissions, nonlinear photochemical reactions, and regional transport, which are not explicitly represented by MSI. Therefore, MSI, as a simplified diagnostic indicator of meteorological conditions, may not adequately capture the variability in O3 concentrations within the selected high-pollution subset.
Baoji exhibited a different pattern, with a relatively high R2 of 0.81 and a negative Pearson correlation coefficient (r = −0.90) under moderate-to-severe pollution conditions. However, only three days with O3 concentrations exceeding 200 μg m−3 were recorded during the study period. Given this extremely limited sample size, the regression result is highly sensitive to individual observations and should not be interpreted as evidence of a robust negative relationship between MSI and O3.
3.3. Influence of Mountain-Valley Breeze on O3 Concentrations
In basin environments, mountain-valley-breeze circulation is one of the most prominent regional airflow patterns. The Guanzhong region is bordered by the Qinling Mountains to the south and the Loess Plateau to the north. This semi-enclosed terrain, confined by elevated landforms on both sides, provides ideal topographic conditions for the formation and development of mountain-valley breeze. Mountain-valley-breeze circulation not only affects the horizontal and vertical dispersion of pollutants, but can also promote the recirculation and accumulation of O3 and its precursors within the basin, thereby aggravating regional O3 pollution. O3 concentrations in the Guanzhong region are jointly influenced by meteorological conditions and mountain-valley breeze. Having examined the effects of meteorological factors in the previous section, we next assess the specific influence of mountain-valley-breeze circulation on O3 concentrations in the region.
3.3.1. Distribution Characteristics of Mountain-Valley Breeze
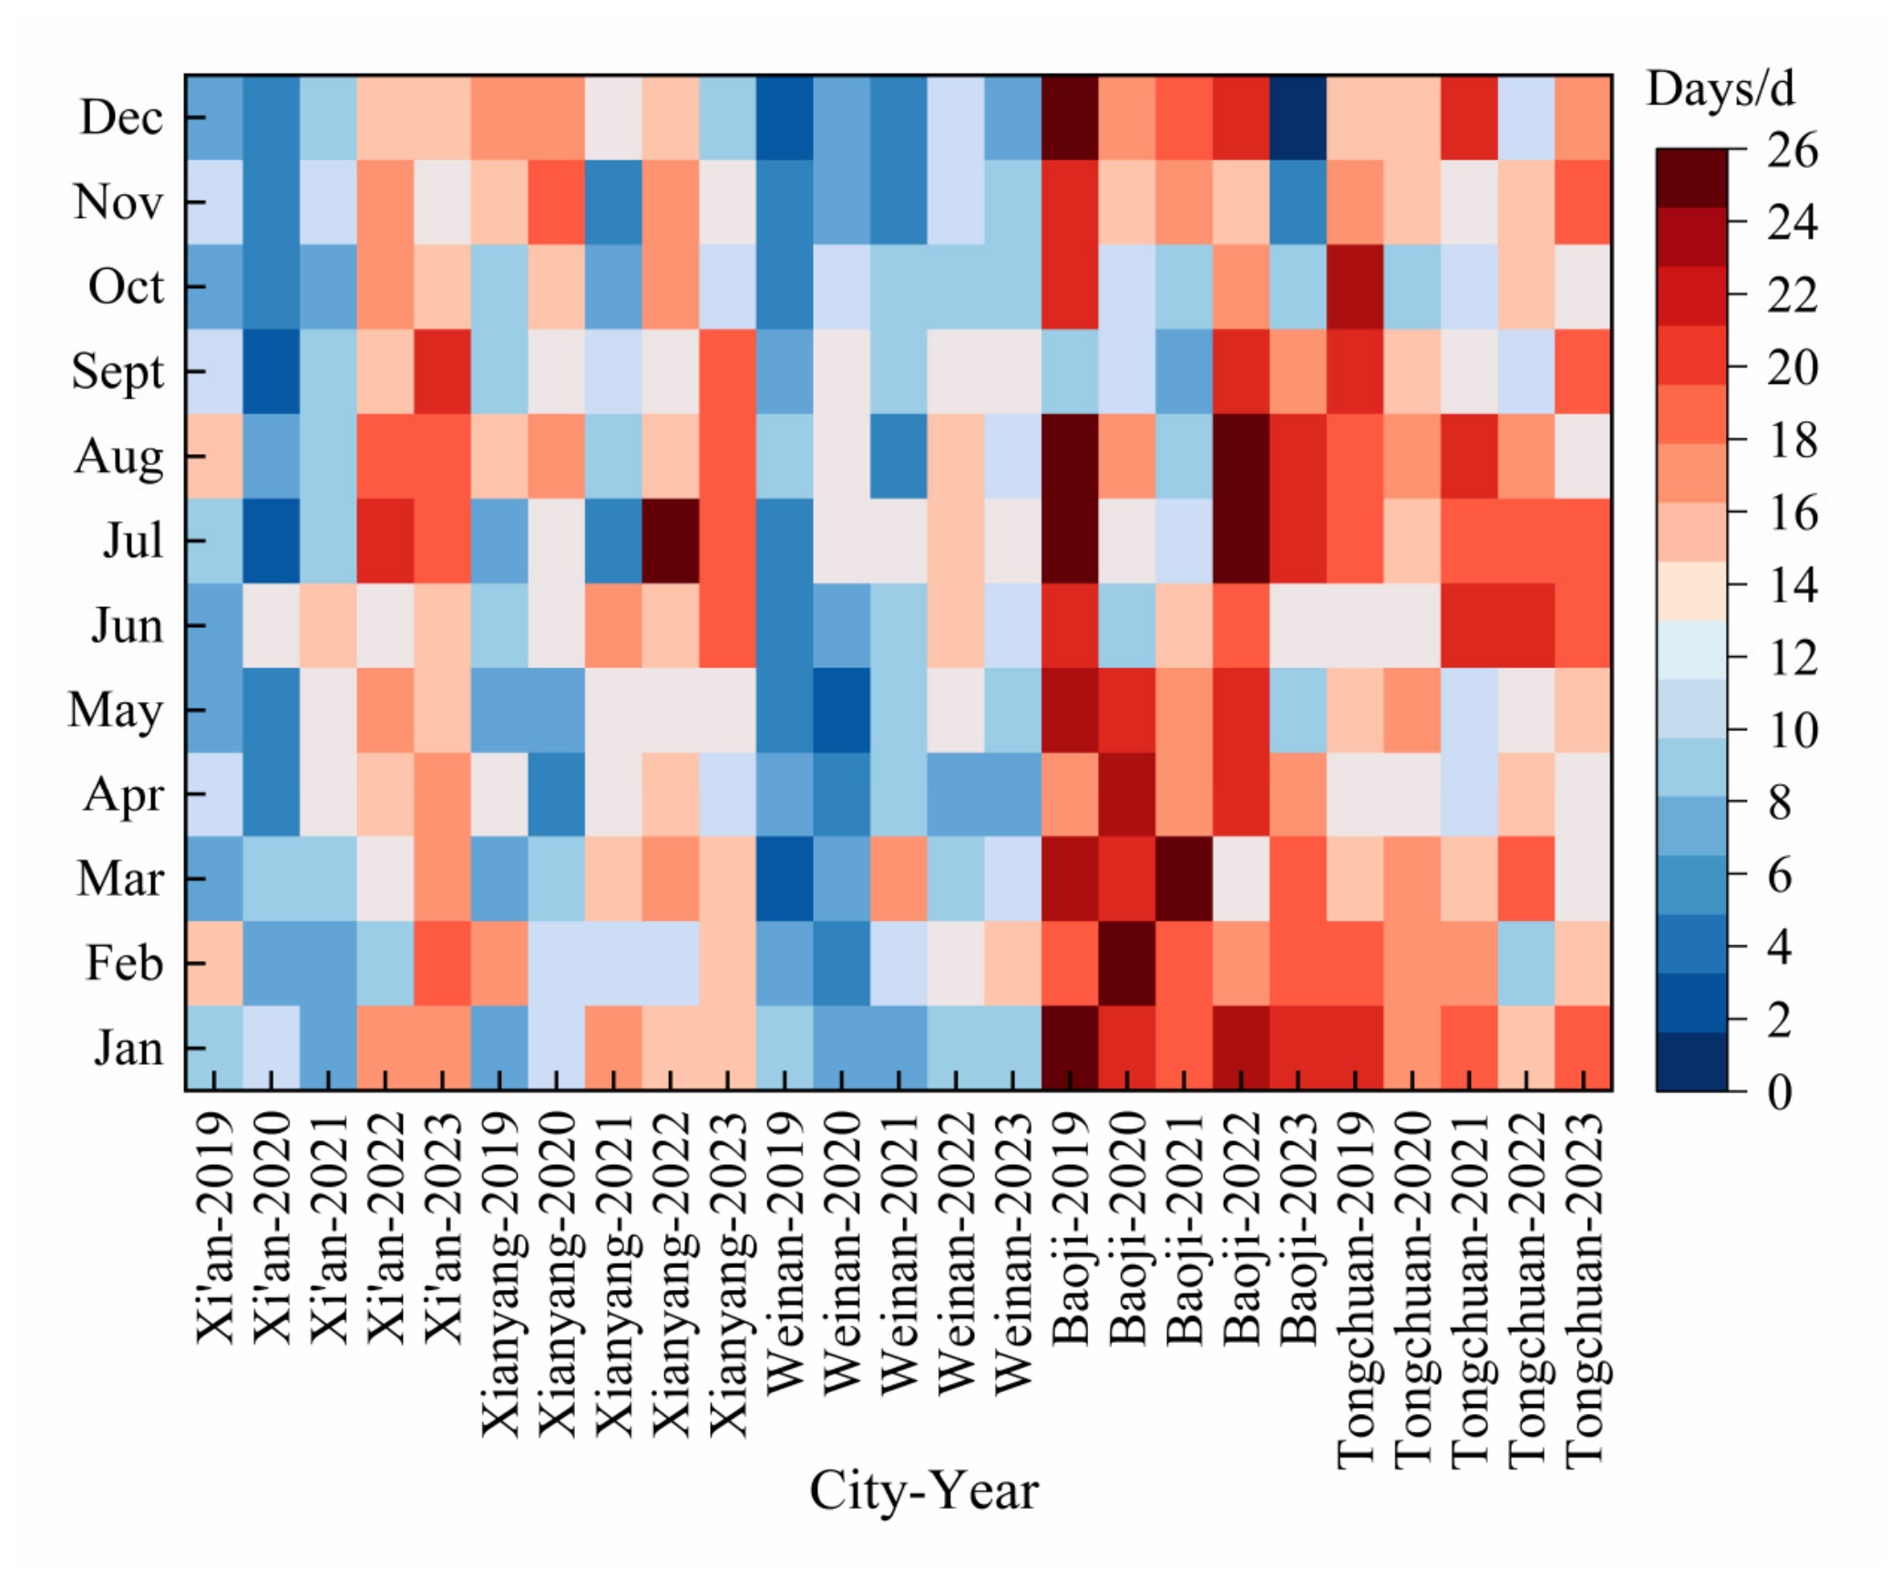
From 2019 to 2023, the number of mountain-valley-breeze days increased year by year in Xi’an, Xianyang, and Weinan, showed a fluctuating pattern in Baoji, and remained generally stable in Tongchuan (Figure 6) (the number of non-valley breeze days is shown in Figure S6). On average, each city experienced 155 ± 41 mountain-valley-breeze days per year. At the city level, Baoji recorded the highest number of mountain-valley-breeze days, whereas Weinan recorded the lowest. Mountain-valley-breeze days occurred throughout the year across the five cities, exhibiting substantial spatial and interannual variability in their monthly frequencies. Relatively high frequencies were observed during summer in several cities and years, with the monthly number of mountain-valley-breeze days exceeding 15 days and occasionally reaching more than 20 days. However, elevated frequencies were also observed in other seasons, particularly in Baoji and Tongchuan. These findings indicate that the seasonal variation in mountain-valley-breeze occurrence does not follow a uniform summer maximum across all five cities. On a monthly basis, the five cities generally showed fluctuating or relatively stable trends. A combined analysis of interannual changes in mountain-valley-breeze days and O3 concentrations showed that the number of mountain-valley-breeze days in the study region was highest in 2022, followed by 2023, and lower in the other years. A similar pattern was observed for O3 concentrations in the Guanzhong region, which also peaked in 2022, were the second highest in 2023, and remained lower in the other years. The temporal consistency between these interannual variations suggests a potential link between the frequency of the mountain-valley breeze and regional O3 pollution in the Guanzhong region.
A persistence-threshold sensitivity analysis was conducted using 3, 4, 5, and 6 h requirements for both the night-time mountain breeze and daytime valley breeze (Table S4). As expected from the nested duration criteria, the number of identified mountain-valley-breeze days decreases as the required duration increases. The mountain-valley-breeze–non-breeze mean O3 differences remain positive across the thresholds reported in Table S4, although their magnitudes vary by city. We retain the 4 h criterion as the baseline classification; the sensitivity results support the direction of the association, not a unique physical optimum at 4 h.
In terms of O3 exceedances (Figure S7), O3 exceedance days during mountain-valley-breeze conditions in the Guanzhong region from 2019 to 2023 occurred mainly between April and September. The proportion was highest in June and July, reaching up to 65%. At the city level, Xi’an, Xianyang, and Weinan showed similar proportions of O3 exceedance days under mountain-valley-breeze conditions, all peaking in June at over 60%. In contrast, Baoji and Tongchuan had relatively lower proportions, with peak values of 29% and 48%, respectively. This difference is closely related to the level of precursor emissions in each city. As major industrial and transportation centers, Xi’an and Xianyang have substantially higher NOx and VOC emissions than Baoji and Tongchuan [60,61,62]. The accumulation and stagnation effects of mountain-valley breeze can substantially enhance O3 exceedances only when precursor concentrations are sufficiently high. This further indicates that mountain-valley breeze acts in concert with chemical factors, rather than independently driving O3 pollution [42].
Figure 6.
Number of mountain-valley-breeze days in five cities of Guanzhong region from 2019 to 2023.
3.3.2. Influence of Mountain-Valley Breeze on Daily O3 Assessment Values
From 2019 to 2023, MDA8 O3 concentrations on mountain-valley-breeze days were generally higher than those on non-mountain-valley-breeze days across the five cities in the Guanzhong region. The difference was most pronounced from May to September each year (Figure 7). At the city level, the MDA8 O3 assessment value in Xi’an was 97 μg·m−3 on mountain-valley-breeze days, compared with 87 μg·m−3 on non-mountain-valley-breeze days, a difference of 10 μg·m−3. In Xianyang, the corresponding values were 101 and 89 μg·m−3, respectively, a difference of 12 μg·m−3. In Weinan, the values were 108 and 92 μg·m−3, respectively, a difference of 16 μg·m−3. In Baoji, the values were 98 and 77 μg·m−3, respectively, a difference of 21 μg·m−3, the largest among the five cities. In Tongchuan, the values were 101 and 97 μg·m−3, respectively, a difference of 4 μg·m−3, the smallest among the five cities. In terms of absolute concentration levels, MDA8 O3 concentrations on mountain-valley-breeze days were relatively high in Xi’an and Xianyang, but comparatively low in Baoji. Statistical comparisons reveal that the differences between mountain-valley-breeze days and non-valley breeze days exhibit pronounced seasonal variability. Significant differences occur primarily during the warm season, especially from June to October (Figure 7). Similar patterns have also been reported in Linfen, China [71], and in valley regions of the United States. For example, in Linfen, China, the mean O3 concentration on mountain-valley-breeze days reached 118 μg·m−3, representing a 64% increase over the 72 μg·m−3 observed on non-breeze days [71]. Overall, mountain-valley-breeze circulation appears to enhance MDA8 O3 concentrations in the cities of the Guanzhong region and may contribute to elevated regional O3 pollution levels.
Figure 7.
Comparison of O3 assessment value of five cities in Guanzhong region from 2019 to 2023. (a) Xi’an (b) Xianyang (c) Weinan (d) Baoji (e) Tongchuan. The lower and upper edges of the boxes indicate the 25th and 75th percentiles (Q1 and Q3), respectively, and the horizontal lines inside the boxes indicate the medians. The small squares represent the mean values. The whiskers extend to the most extreme observations within 1.5 times the interquartile range (IQR), while the individual symbols outside the whiskers indicate outliers and extreme outliers. The dashed line in the figure represents the daily concentration limit for MDA8 O3. (Statistical significance was assessed using the Mann–Whitney U test. p < 0.05, *, p < 0.01, **, p < 0.001 ***.).
To reduce confounding by differences in the seasonal distribution of mountain-valley-breeze and non-breeze days, we additionally compared their daily O3 concentrations within the same city and calendar month (Table S5). Across 299 city-year-month comparisons, 224 (74.9%) showed higher mean O3 on mountain-valley-breeze days. The average paired monthly difference was +10.37 μg·m−3, and the mean difference was positive for each calendar month when pooled across the available city-year comparisons. These descriptive comparisons support the direction of the observed association, but do not independently establish causality or statistical significance for every month.
3.3.3. Influence of Mountain-Valley Breeze on Hourly O3 Concentrations
A comparative analysis of hourly O3 concentrations on mountain-valley-breeze days and non-mountain-valley-breeze days in the Guanzhong region (Figure 8) showed that hourly O3 concentrations were generally higher on mountain-valley-breeze days. In terms of diurnal variation, the difference in hourly O3 concentrations between mountain-valley-breeze days and non-mountain-valley-breeze days was small during the hours of 01:00–08:00. From 09:00 onward, hourly O3 concentrations on mountain-valley-breeze days became clearly higher than those on non-breeze days. The difference gradually widened and reached its maximum during 15:00–19:00. This pattern may be explained by the fact that this period coincides with the strongest phase of daytime valley-breeze circulation. Near-surface horizontal airflow associated with the valley breeze can transport air masses rich in O3 and its precursors from surrounding areas into the basin. Because of topographic confinement and the closed circulation structure, pollutants tend to accumulate within the Guanzhong region. Combined with enhanced daytime photochemical reactions, these conditions lead to a marked increase in hourly O3 concentrations. After 20:00, as mountain breeze gradually becomes the dominant circulation pattern, and relatively clean air from the surrounding mountainous areas descends along the slopes into the basin, while the relatively warmer air over the valley center is forced upward. This process promotes the dilution and dispersion of residual O3 and its precursors within the basin, causing hourly O3 concentrations to decrease gradually and narrowing the difference between mountain-valley-breeze days and non-breeze days. A similar influence of mountain-valley breeze on O3 concentrations has also been reported in Shaoguan, China, where O3-rich air masses from surrounding cities were transported into Shaoguan at night, resulting in higher O3 concentrations than in neighboring urban areas [72].
Figure 8.
Daily variation in O3 concentration in five cities of Guanzhong region from 2019 to 2023. (a) Xi’an, (b) Xianyang, (c) Weinan, (d) Baoji and (e) Tongchuan. The green and purple boxes represent non-breeze days and mountain-valley breeze days, respectively. The lower and upper edges of the boxes indicate the 25th and 75th percentiles (Q1 and Q3), respectively, and the horizontal lines inside the boxes indicate the medians. The small squares represent the mean values. The whiskers extend to the most extreme observations within 1.5 times the interquartile range (IQR), while the individual symbols outside the whiskers indicate outliers and extreme outliers. The dashed line in the figure represents the O3 hourly concentration limit.
A comparison among cities shows that hourly O3 concentrations on mountain-valley-breeze days were markedly higher than those on non-mountain-valley-breeze days in Xi’an, Xianyang, Weinan, and Baoji, with differences ranging from 10 to 25 μg·m−3. This indicates that mountain-valley-breeze circulation has a clear amplifying effect on O3 pollution in these cities. In contrast, the maximum difference in hourly O3 concentrations between mountain-valley-breeze days and non-mountain-valley-breeze days in Tongchuan was only 6 μg·m−3, substantially lower than in the other cities. Given Tongchuan’s location at the upwind funnel-shaped entrance of the Guanzhong region, the alternating mountain-valley-breeze system is more likely to transport O3 and its precursors downstream rather than promote their local accumulation. As a result, Tongchuan may be less affected by the pollution stagnation associated with mountain-valley-breeze circulation [73].
The night-time O3 accumulation effect observed in the Guanzhong cities is consistent with findings from other basin environments. Li et al. observed that the O3 concentration at Mount Emei City, located in the western Sichuan Basin, exhibited a secondary peak during the night under the influence of mountain-valley winds, resulting in an abnormal diurnal variation pattern that is opposite to the typical “higher during the day, lower at night” cycle [74]. Raga et al. observed in the Mexico City Basin that night-time downhill winds can transport high concentrations of O3 from the residual layer to near-surface levels within the basin, leading to elevated ozone concentrations at monitoring stations located near mountainous areas [75]; Lee et al. found in Phoenix, USA, that ozone and its precursors, which were transported to mountainous areas by valley winds during the day, could subsequently return to urban areas by mountain winds at night, triggering night-time high-O3 events [33]; Xu et al. observed at Waliguan that night-time downhill airflow can transport ozone-enriched air from the free troposphere to the surface, resulting in local night-time ozone concentrations being higher than during the day [76].
During moderate-to-severe O3 pollution episodes, the difference in hourly O3 concentrations between mountain-valley-breeze days and non-breeze days became even larger in some cities of the Guanzhong region (Figure 9). During the hours of 01:00–08:00, hourly O3 concentrations on mountain-valley-breeze days were generally similar to those on non-breeze days in Xianyang and Tongchuan, while in Weinan and Baoji they were slightly lower on mountain-valley-breeze days. From 09:00 onward, hourly O3 concentrations on mountain-valley-breeze days increased gradually in all five cities and were generally higher than those on non-breeze days. The difference reached its maximum during the hours of 17:00–23:00, with a peak difference of 27 μg·m−3. At the city level, the contrast between mountain-valley-breeze days and non-breeze days was especially pronounced in Xi’an and Baoji during moderate-to-severe O3 pollution episodes, particularly during the hours of 17:00–23:00. This pattern may be explained by the fact that Xi’an is located near the center of the Guanzhong region, where mountain and valley breeze are more likely to converge, promoting pollutant accumulation and limiting dispersion. Baoji, located at the western end of the basin, may also be strongly affected because the eastward funnel-shaped topography of the Guanzhong region facilitates pollutant transport under mountain-valley breeze circulation, while the western terrain hinders further dispersion, making the O3 contrast more evident [73]. Differences in local emission sources may also contribute to the enhanced O3 concentration differences. Overall, under heavy-pollution conditions, the response of O3 to mountain-valley-breeze circulation became markedly more heterogeneous among the five cities.
Figure 9.
Daily variation in O3 concentration on moderate and severe pollution days in five cities of Guanzhong region from 2019 to 2023. (a) Xi’an, (b) Xianyang, (c) Weinan, (d) Baoji and (e) Tongchuan. The green and purple boxes represent non-breeze days and mountain-valley breeze days, respectively. The lower and upper edges of the boxes indicate the 25th and 75th percentiles (Q1 and Q3), respectively, and the horizontal lines inside the boxes indicate the medians. The small squares represent the mean values. The whiskers extend to the most extreme observations within 1.5 times the interquartile range (IQR), while the individual symbols outside the whiskers indicate outliers and extreme outliers. The dashed line in the figure represents the O3 hourly concentration limit.
This study quantified nocturnal (20:00–06:00 LST) O3 differences between mountain-valley-breeze and non-breeze days across the five cities of the Guanzhong region (Table 4). Under normal conditions, night-time O3 concentrations were higher on mountain-valley-breeze days in Xi’an (+5.71 μg·m−3, p < 0.001), Xianyang (+3.68 μg·m−3, p = 0.0024), Weinan (+4.33 μg·m−3, p = 0.0004), and Baoji (+2.66 μg·m−3, p = 0.0052). However, the corresponding effect sizes were generally small (Cohen’s d = 0.126–0.236), indicating that the magnitude of the mountain-valley-breeze-associated O3 enhancement was relatively modest despite its statistical significance. These increases may be associated with night-time downslope transport and reduced boundary-layer mixing, although other meteorological and chemical processes may also contribute to nocturnal O3 variability. In contrast, Tongchuan showed a slight decrease in night-time O3 on mountain-valley-breeze days (−0.72 μg·m−3), but the difference was not statistically significant (p = 0.4928; Cohen’s d = −0.032).
Table 4.
Night-time (20:00–06:00 LST) and full-day mean O3 concentrations on mountain-valley-breeze and non-breeze days under normal and heavy pollution conditions. The 95% confidence intervals and p values were estimated using the bootstrap procedure, while Cohen’s d represents the standardized effect size.
Under heavy pollution conditions, the mountain-valley-breeze-associated O3 response showed considerable spatial heterogeneity. Xi’an exhibited an increase in night-time O3 on mountain-valley-breeze days (+7.26 μg·m−3, p = 0.0046; Cohen’s d = 0.330). Baoji showed the largest increase (+8.84 μg·m−3), with a statistically significant difference (p = 0.0050) and a moderate effect size (Cohen’s d =0.594). In Xianyang, night-time O3 was 4.68 μg·m−3 higher on mountain-valley-breeze days, but the difference was not statistically significant (p = 0.1382). No significant differences were observed in Weinan (−0.64 μg·m−3, p = 0.8016) or Tongchuan (−3.02 μg·m−3, p = 0.2738). Overall, the block-bootstrap results indicate that the association between mountain-valley-breeze conditions and nocturnal O3 varies among cities and pollution conditions. The positive differences remained statistically significant in Xi’an and Baoji under heavy pollution, whereas those in Xianyang, Weinan, and Tongchuan were not statistically distinguishable from zero.
Overall, mountain-valley-breeze impacts on nocturnal O3 are highly terrain- and pollution-dependent, showing accumulation effects in plain basins and dispersion effects in mountainous areas. This finding is consistent with the conclusions reported by Schlink et al. for Mendoza, Argentina [77], and by Guo et al. for the Sichuan Basin, China [78].
4. Implications and Recommendations
These results suggest that the Guanzhong region should strengthen routine pollution control and implement targeted management measures differentiated by pollution stage and intensity. Meteorological conditions cannot be artificially adjusted. Nevertheless, these historically observed meteorological ranges (temperature > 30 °C, relative humidity < 50%, wind speed < 4 m·s−1), which correspond to a high fraction of O3-exceedance events in our dataset, can serve as a high-risk reference for adaptive ozone prevention. We emphasize that these values are observational statistical ranges rather than rigid deterministic thresholds for O3 exceedance. Combined with real-time precursor-emission backgrounds, forecast meteorology falling within this reference range can prompt authorities to issue early warnings and intensify NOx and VOC emission reductions in advance to counteract elevated ozone-formation potential. Given the year-by-year increase in O3 pollution, rising baseline concentrations, aggravated pollution levels over hotspot areas, peak ozone levels occurring in June–July daytime hours, and the pronounced night-time accumulation effect, spring and summer, especially the period from afternoon to evening, should be treated as key control periods. Under meteorological conditions associated with frequent pollution episodes-high temperature (>30 °C), low humidity (<50%), and light breeze (<4 m·s−1)-targeted control measures should be implemented to reduce both daytime and night-time O3 concentrations and effectively curb the upward trend in pollution.
Precise ozone-pollution response should draw on these meteorological-statistical references. We stress again that these statistical features do not constitute standalone deterministic warning criteria. The likelihood of ozone pollution rises when forecast meteorology falls within these reference ranges, yet pollution occurrence still heavily depends on local precursor-emission burdens. Moreover, the statistical association between MSI and MDA8 O3 varied with pollution severity, with substantially lower explanatory power observed within the moderate-to-severe pollution subset. These findings suggest that the Guanzhong region should establish an early-warning and emergency response framework built upon multi-factor comprehensive assessment (combining meteorological-statistical references and real-time precursor-emission status), to anticipate pollution risk in advance. Such an approach would support a shift from passive response to proactive prevention and improve the overall efficiency of pollution control.
These results suggest that basin regions strengthen coordinated regional prevention and control measures and improve integrated meteorological air quality forecasting systems. In the Guanzhong region, mountain-valley-breeze days are generally associated with higher O3 concentrations, with the effect being particularly pronounced during the valley-breeze phase. Under the combined influence of topography and local circulation, O3 and its precursors tend to converge and recirculate within the region, making it difficult for single-city control measures to interrupt pollution transport and feedback processes. Therefore, in basin regions, O3 management must extend beyond administrative boundaries. Coordinated control across the five cities, unified planning of precursor emission reductions, and a more integrated regional governance approach are all essential. In addition, coupled modeling of meteorological fields and O3 formation and transport processes should be strengthened to improve forecasting accuracy and provide technical support for targeted pollution control.
5. Conclusions
From 2019 to 2023, the regional baseline O3 concentration increased markedly, while O3 levels in high-concentration areas also showed an upward trend. Over the five-year period, the annual O3 assessment value (90th percentile of daily MDA8 O3) in Xi’an and Xianyang showed a fluctuating upward trend, whereas those in Weinan and Tongchuan exhibited slight fluctuating declines. Baoji showed a slight fluctuating upward trend in annual O3 assessment value. Peak O3 concentrations in the five cities mainly occurred in June and July, while hourly O3 peaks were observed between 14:00 and 17:00. Over the five-year period, the increase in night-time O3 concentrations (13.4%) was four times greater than that observed during the daytime (3.0%). Spatially, O3 concentrations were generally lower in the west and higher in the southeast. The contribution of O3 to the comprehensive air quality index increased year by year in all five cities. Meteorological factors had a substantial influence on O3 variability in the Guanzhong region. In all five cities, MDA8 O3 concentrations were significantly positively correlated with daily maximum temperature and wind speed. The occurrence of O3 concentration exceedances in five cities was predominantly observed under conditions where the air temperature exceeded 30 °C, the relative humidity was less than 50%, and the wind speed was less than 4 m·s−1. For the pooled five-city dataset, MSI explained approximately 35% of the observed variance in MDA8 O3 concentrations across all valid days, whereas its explanatory power decreased to approximately 4% under moderate-to-severe pollution conditions.
Mountain-valley-breeze circulation generally favored higher O3 concentrations in most basin and plain cities of the Guanzhong region under normal pollution conditions, whereas its influence became more spatially heterogeneous under heavy-pollution conditions. MDA8 O3 concentrations on mountain-valley-breeze days were higher than those on non-mountain-valley-breeze days by 12.6 ± 5.7 μg·m−3. Block-bootstrap comparisons showed significantly higher nocturnal O3 concentrations on mountain-valley-breeze days in Xi’an, Xianyang, Weinan, and Baoji under normal conditions, but not in Tongchuan. Under heavy pollution conditions, significant positive differences were observed only in Xi’an and Baoji; differences in Xianyang, Weinan, and Tongchuan were not statistically significant. These findings indicate spatially heterogeneous associations between local breeze circulation and nocturnal O3, without establishing that mountain-valley breezes are the sole or dominant cause of the observed differences.
For basin areas strongly influenced by mountain-valley-breeze circulation, future efforts should focus on improving integrated meteorological air quality forecasting, strengthening cross-regional joint prevention and control, implementing targeted precursor emission reductions, and advancing more integrated regional governance. These efforts would provide a stronger scientific basis for precise O3 pollution control in similar basin environments.
Supplementary Materials
The following supporting information can be downloaded at: https://www.mdpi.com/article/10.3390/toxics14110953/s1, Table S1: Names and locations of state-controlled monitoring stations in the five cities of the Guanzhong region; Table S2: Individual Air Quality Index (IAQI) and Corresponding Pollutant Concentration Limits; Table S3: For the five cities in the Guanzhong region: (i) only Tmax; (ii) a standard multiple linear regression model incorporating Tmax, RH, WS, and atmospheric pressure; (iii) cross-validation R2 and sample R2 under the MSI model; Table S4: Number of mountain-valley breeze days and ozone concentrations on mountain-valley breeze and non-breeze days in five cities of the Guanzhong region over a five-year period under different persistence thresholds; Table S5: Monthly comparison of average O3 concentrations on mountain-valley breeze and non-breeze days in five cities from 2019 to 2023. Figure S1: Monthly changes in MDA8 O3 concentrations across five cities in the Guanzhong region from 2019 to 2023; Figure S2: Contribution rates of six pollutants to the composite index in the five cities of the Guanzhong region from 2019 to 2023; Figure S3: Distribution of days with primary pollutant exceedances in the five cities of the Guanzhong region from 2019 to 2023; Figure S4: Daily MSI and MDA8 O3 fitting results for the five cities in the Guanzhong region from 2019 to 2023; Figure S5: Daily average MSI and MDA8 O3 fitting results for days with moderate and severe pollution in the five cities of the Guanzhong region from 2019 to 2023; Figure S6: Number of non-breeze days in five cities of Guanzhong region from 2019 to 2023; Figure S7: Proportion of days with O3 exceedances during mountain-valley breeze days in the five cities of the Guanzhong region from 2019 to 2023.
Author Contributions
X.Z.: Writing—original draft, Methodology, Investigation, Data curation. H.L.: Supervision, Methodology, Resources. L.W.: Methodology. R.G.: Supervision, Conceptualization. Y.Z.: Methodology. W.G.: Resources, Data curation. C.J.: Resources, Data curation. X.G.: Methodology. S.G.: Resources. X.L.: Resources. H.W.: Resources. H.Z.: Supervision, Validation. J.L.: Supervision, Resources. Y.Y.: Writing—review & editing, Supervision, Methodology, Resources, Funding acquisition. All authors have read and agreed to the published version of the manuscript.
Funding
This research was funded by the Fundamental Research Funds for Central Public Welfare Research Institutes, Chinese Research Academy of Environmental Sciences (No. 2025YSKY-01) and the Research Project on Causes and Countermeasures of Air Pollution in the Guanzhong Region (No. 2024—Local Scientific Research—0428).
Institutional Review Board Statement
Not applicable.
Informed Consent Statement
Not applicable.
Data Availability Statement
The original contributions presented in this study are included in the article/Supplementary Materials. Further inquiries can be directed to the corresponding author.
Conflicts of Interest
The authors declare no conflict of interest.
References
- Huang, L.; Wang, L.; Du, M.; Liu, H.; Jin, L. Characteristics of near-ground ozone pollution and relationships with meteorological conditions in Guanzhong region from 2014 to 2020. J. Arid. Meteorol. 2023, 41, 413–422. [Google Scholar] [CrossRef]
- Wang, P.; Chen, T.; Zhang, S.; Wang, F. High-resolution ground-level O3 estimation in China (2019-2024) via self-attention networks: Unveiling spatiotemporal dynamics and key drivers. Atmos. Res. 2026, 330, 108633. [Google Scholar] [CrossRef] [Scilit]
- Lin, C.; Lau, A.K.H.; Fung, J.C.H.; Song, Y.; Li, Y.; Tao, M.; Lu, X.; Ma, J.; Lao, X.Q. Removing the effects of meteorological factors on changes in nitrogen dioxide and ozone concentrations in China from 2013 to 2020. Sci. Total Environ. 2021, 793, 148575. [Google Scholar] [CrossRef] [Scilit]
- Zhang, Y.; Zhang, F.; Wan, M.; Bo, Y.; He, K.; Liu, R. Evolution of surface ozone pollution in Yangtze River Delta between 2019 and 2022: Influences of meteorology and emissions. Atmos. Environ. 2025, 358, 121339. [Google Scholar] [CrossRef] [Scilit]
- Fleming, Z.L.; Doherty, R.M.; von Schneidemesser, E.; Malley, C.S.; Cooper, O.R.; Pinto, J.P.; Colette, A.; Xu, X.; Simpson, D.; Schultz, M.G.; et al. Tropospheric Ozone Assessment Report: Present-day ozone distribution and trends relevant to human health. Elem. Sci. Anthr. 2018, 6, 12. [Google Scholar] [CrossRef] [Scilit]
- Zhang, Y.; Cooper, O.R.; Gaudel, A.; Thompson, A.M.; Nédélec, P.; Ogino, S.-Y.; West, J.J. Tropospheric ozone change from 1980 to 2010 dominated by equatorward redistribution of emissions. Nat. Geosci. 2016, 9, 875–879. [Google Scholar] [CrossRef] [Scilit]
- Zhang, L.; Wilson, J.P.; MacDonald, B.; Zhang, W.; Yu, T. The changing PM2.5 dynamics of global megacities based on long-term remotely sensed observations. Environ. Int. 2020, 142, 105862. [Google Scholar] [CrossRef] [Scilit]
- Liu, C.; Chen, R.; Sera, F.; Vicedo-Cabrera, A.M.; Guo, Y.; Tong, S.; Lavigne, E.; Correa, P.M.; Ortega, N.V.; Achilleos, S.; et al. Interactive effects of ambient fine particulate matter and ozone on daily mortality in 372 cities: Two stage time series analysis. Br. Med. J. 2023, 383, e075203. [Google Scholar] [CrossRef] [Scilit]
- Zhu, Y.; Kan, H. Current research status and advances in the impact of atmospheric environment on human health. J. Lanzhou Univ. (Med. Sci.) 2025, 51, 1–11+25. [Google Scholar] [CrossRef]
- Yu, X.; Qi, J.; Yin, P.; Liu, Y.; Zhou, M.; Wang, L. The impact of long-term exposures to ozone and nitrogen dioxide on all-cause, cardio/cerebrovascular disease mortalities in China, 2010−2021. Dis. Surveill. 2025, 40, 526–531. [Google Scholar] [CrossRef]
- Atkinson, R. Atmospheric chemistry of VOCs and NOx. Atmos. Environ. 2000, 34, 2063–2101. [Google Scholar] [CrossRef] [Scilit]
- Jacob, D.J. Heterogeneous chemistry and tropospheric ozone. Atmos. Environ. 2000, 34, 2131–2159. [Google Scholar] [CrossRef] [Scilit]
- Sillman, S. The relation between ozone, NOx and hydrocarbons in urban and polluted rural environments. Atmos. Environ. 1999, 33, 1821–1845. [Google Scholar] [CrossRef] [Scilit]
- Tan, Z.; Lu, K.; Dong, H.; Hu, M.; Li, X.; Liu, Y.; Lu, S.; Shao, M.; Su, R.; Wang, H.; et al. Explicit diagnosis of the local ozone production rate and the ozone-NOx-VOC sensitivities. Sci. Bull. 2018, 63, 1067–1076. [Google Scholar] [CrossRef] [Scilit]
- Tan, Z.; Lu, K.; Jiang, M.; Su, R.; Dong, H.; Zeng, L.; Xie, S.; Tan, Q.; Zhang, Y. Exploring ozone pollution in Chengdu, southwestern China: A case study from radical chemistry to O3-VOC-NOx sensitivity. Sci. Total Environ. 2018, 636, 775–786. [Google Scholar] [CrossRef] [Scilit]
- Monks, P.S.; Archibald, A.T.; Colette, A.; Cooper, O.; Coyle, M.; Derwent, R.; Fowler, D.; Granier, C.; Law, K.S.; Mills, G.E.; et al. Tropospheric ozone and its precursors from the urban to the global scale from air quality to short-lived climate forcer. Atmos. Chem. Phys. 2015, 15, 8889–8973. [Google Scholar] [CrossRef] [Scilit]
- Elminir, H.K. Dependence of urban air pollutants on meteorology. Sci. Total Environ. 2005, 350, 225–237. [Google Scholar] [CrossRef] [Scilit]
- Wang, Z.; Li, Y.; An, X.; Li, Q.; Sun, N.; Wang, B.; Pan, J. Variation of O3 Concentration in Different Regions of Beijing from 2006-2015. Environ. Sci. 2018, 39, 1–8. [Google Scholar] [CrossRef]
- Gong, D.; Du, N.; Wang, L.; Deng, X.; Zhang, X.; Yang, L. Impacts of meteorological and precursor emission factors on PM2.5 and O3 from 2019 to 2022: Insights from multiple perspectives. Atmos. Res. 2025, 315, 107933. [Google Scholar] [CrossRef] [Scilit]
- Gao, D.; Xie, M.; Liu, J.; Wang, T.; Ma, C.; Bai, H.; Chen, X.; Li, M.; Zhuang, B.; Li, S. Ozone variability induced by synoptic weather patterns in warm seasons of 2014-2018 over the Yangtze River Delta region, China. Atmos. Chem. Phys. 2021, 21, 5847–5864. [Google Scholar] [CrossRef] [Scilit]
- Zhao, W.; Gao, B.; Lu, Q.; Zhong, Z.; Liang, X.; Liu, M.; Ma, S.; Sun, J.; Chen, L.; Fan, S. Ozone Pollution Trend in the Pearl River Delta Region During 2006-2019. Environ. Sci. 2021, 42, 97–105. [Google Scholar] [CrossRef]
- Yan, Y.; Wang, H.; Zhang, X.; Yan, X.; Nie, Y.; Li, J.; Zhang, H.; Ren, Y.; Li, H. Research on weather classification of atmospheric complex pollution: Progress and prospect. Atmos. Environ. 2025, 358, 121346. [Google Scholar] [CrossRef] [Scilit]
- Liang, B.; Zhang, L.; Lai, X.; Wei, X. Analysis of the characteristics of ozone pollution and its relationship with meteorological conditions in Shenzhen. J. Meteorol. Environ. 2017, 33, 6. [Google Scholar] [CrossRef]
- Sun, X.; Zhao, M.; Shen, H.; Liu, Y.; Du, M.; Zhang, W.; Xu, H.; Fan, G.; Gong, H.; Li, Q.; et al. Ozone Formation and Key VOCs of a Continuous Summertime O3 Pollution Event in Ji’nan. Environ. Sci. 2022, 43, 686–695. [Google Scholar] [CrossRef] [Scilit]
- Gu, Y.; Li, K.; Xu, J.; Liao, H.; Zhou, G. Observed dependence of surface ozone on increasing temperature in Shanghai, China. Atmos. Environ. 2020, 221, 117108. [Google Scholar] [CrossRef] [Scilit]
- Péré, J.C.; Bessagnet, B.; Pont, V.; Mallet, M.; Minvielle, F. Influence of the aerosol solar extinction on photochemistry during the 2010 Russian wildfires episode. Atmos. Chem. Phys. 2015, 15, 10983–10998. [Google Scholar] [CrossRef] [Scilit]
- Hu, J.; Zhao, T.; Liu, J.; Cao, L.; Wang, C.; Li, Y.; Shi, C.; Tan, C.; Sun, X.; Shu, Z.; et al. Exploring the ozone pollution over the western Sichuan Basin, Southwest China: The impact of diurnal change in mountain-plains solenoid. Sci. Total Environ. 2022, 839, 156264. [Google Scholar] [CrossRef] [Scilit]
- Shu, Z.; Zhao, T.; Liu, Y.; Zhang, L.; Ma, X.; Kuang, X.; Li, Y.; Huo, Z.; Ding, Q.; Sun, X.; et al. Impact of deep basin terrain on PM2.5 distribution and its seasonality over the Sichuan Basin, Southwest China. Environ. Pollut. 2022, 300, 118944. [Google Scholar] [CrossRef] [Scilit]
- Liu, S.; Liu, Z.; Li, J.; Wang, Y.; Ma, Y.; Sheng, L.; Liu, H.; Liang, F.; Xin, G.; Wang, J. Numerical simulation for the coupling effect of local atmospheric circulations over the area of Beijing, Tianjin and Hebei Province. Sci. China Ser. D Earth Sci. 2009, 52, 382–392. [Google Scholar] [CrossRef] [Scilit]
- Shen, Z.; Cao, J.; Liu, S.; Zhu, C.; Wang, X.; Zhang, T.; Xu, H.; Hu, T. Chemical Composition of PM10 and PM2.5 Collected at Ground Level and 100 Meters during a Strong Winter-Time Pollution Episode in Xi’an, China. J. Air Waste Manag. Assoc. 2011, 61, 1150–1159. [Google Scholar] [CrossRef] [Scilit]
- Guo, W.; Yan, S.; Gao, Y.; Zhu, L.; Yue, J.; Wang, X. Analysis of Spatial-temporal Variation and Meteorological Driving Factors of Ozone in the Taiyuan Basin from 2020 to 2023. Environ. Sci. 2025, 46, 2125–2134. [Google Scholar] [CrossRef] [Scilit]
- Guo, W.; Yang, Y.; Zhang, J.; Han, K.; Yang, Y.; Chen, Q.; Li, S.; Zhu, Y. Effects of valley topography on ozone pollution in the Lanzhou valley: A numerical case study. Environ. Pollut. 2024, 363, 125225. [Google Scholar] [CrossRef] [Scilit]
- Lee, S.M.; Fernando, H.J.S.; Princevac, M.; Zajic, D.; Sinesi, M.; Mcculley, J.L.; Anderson, J. Transport and Diffusion of Ozone in the Nocturnal and Morning Planetary Boundary Layer of the Phoenix Valley. Environ. Fluid Mech. 2003, 3, 331–362. [Google Scholar] [CrossRef] [Scilit]
- Beaver, S.; Palazoglu, A. Influence of synoptic and mesoscale meteorology on ozone pollution potential for San Joaquin Valley of California. Atmos. Environ. 2009, 43, 1779–1788. [Google Scholar] [CrossRef] [Scilit]
- Kaser, L.; Patton, E.G.; Pfister, G.G.; Weinheimer, A.J.; Montzka, D.D.; Flocke, F.; Thompson, A.M.; Stauffer, R.M.; Halliday, H.S. The effect of entrainment through atmospheric boundary layer growth on observed and modeled surface ozone in the Colorado Front Range. J. Geophys. Res. Atmos. 2017, 122, 6075–6093. [Google Scholar] [CrossRef] [Scilit]
- Baumbach, G.; Vogt, U. Experimental determination of the effect of mountain-valley breeze circulation on air pollution in the vicinity of Freiburg. Atmos. Environ. 1999, 33, 4019–4027. [Google Scholar] [CrossRef] [Scilit]
- Pfister, G.; Wang, C.-T.; Barth, M.; Flocke, F.; Vizuete, W.; Walters, S. Chemical Characteristics and Ozone Production in the Northern Colorado Front Range. J. Geophys. Res. Atmos. 2019, 124, 13397–13419. [Google Scholar] [CrossRef] [Scilit]
- Bei, N.; Xiao, B.; Meng, N.; Feng, T. Critical role of meteorological conditions in a persistent haze episode in the Guanzhong basin, China. Sci. Total Environ. 2016, 550, 273–284. [Google Scholar] [CrossRef] [Scilit]
- Shen, Z.; Cao, J.; Arimoto, R.; Han, Z.; Zhang, R.; Han, Y.; Liu, S.; Okuda, T.; Nakao, S.; Tanaka, S. Ionic composition of TSP and PM2.5 during dust storms and air pollution episodes at Xi’an, China. Atmos. Environ. 2009, 43, 2911–2918. [Google Scholar] [CrossRef] [Scilit]
- Feng, T.; Bei, N.; Zhao, S.; Wu, J.; Li, X.; Zhang, T.; Cao, J.; Zhou, W.; Li, G. Wintertime nitrate formation during haze days in the Guanzhong basin, China: A case study. Environ. Pollut. 2018, 243, 1057–1067. [Google Scholar] [CrossRef] [Scilit]
- Zhao, H.; Niu, Z.; Feng, X. Factors influencing improvements in air quality in Guanzhong cities of China, and variations therein for 2014–2020. Urban Clim. 2021, 38, 100877. [Google Scholar] [CrossRef] [Scilit]
- Li, N.; He, Q.; Greenberg, J.; Guenther, A.; Li, J.; Cao, J.; Wang, J.; Liao, H.; Wang, Q.; Zhang, Q. Impacts of biogenic and anthropogenic emissions on summertime ozone formation in the Guanzhong Basin, China. Atmos. Chem. Phys. 2018, 18, 7489–7507. [Google Scholar] [CrossRef] [Scilit]
- Zhou, Q.; Yun, J.; Li, X.; Zhang, X.; Liu, B.; Zhang, S.; Zheng, X.; Yue, W.; Li, X.; Zhang, W. Vehicle emissions in a megacity of Xi’an in China: A comprehensive inventory, air quality impact, and policy recommendation. Urban Clim. 2023, 52, 101740. [Google Scholar] [CrossRef] [Scilit]
- Li, L.; Yang, W.; Xie, S.; Wu, Y. Estimations and uncertainty of biogenic volatile organic compound emission inventory in China for 2008-2018. Sci. Total Environ. 2020, 733, 139301. [Google Scholar] [CrossRef] [Scilit]
- Bei, N.; Liang, J.; Li, X.; Wang, R. Worsening summertime ozone pollution in the Guanzhong Basin, China from 2014 to 2018: Impacts of synoptic conditions and anthropogenic emissions. Atmos. Environ. 2022, 274, 118974. [Google Scholar] [CrossRef] [Scilit]
- Bei, N.; Zhao, L.; Xiao, B.; Meng, N.; Feng, T. Impacts of local circulations on the wintertime air pollution in the Guanzhong Basin, China. Sci. Total Environ. 2017, 592, 373–390. [Google Scholar] [CrossRef] [Scilit]
- Song, X.; Hao, Y. Analysis of Ozone Pollution Characteristics and Transport Paths in Xi’an City. Sustainability 2022, 14, 16146. [Google Scholar] [CrossRef] [Scilit]
- Li, Y.; Zhao, C.; Li, M.; Jing, X.; Li, Z. Influence of Valley Wind on the Mass Concentration of Pollutants in Taiyuan. Meteorol. Environ. Sci. 2022, 45, 22–28. [Google Scholar] [CrossRef]
- Xu, Y.; Yang, Y.; Liu, Y.; Meng, P.; Sun, N.; Wu, L.; Mao, H. Impact characteristics of typical atmospheric circulation on the combined pollution of PM2.5 and O3 in Tianjin. China Environ. Sci. 2023, 43, 5078–5087. [Google Scholar] [CrossRef]
- GB 3095-2012; Ambient Air Quality Standards. China Environmental Science Press: Beijing, China, 2012.
- HJ 633-2012; Technical Specifications on Ambient Air Quality Index. China Environmental Science Press: Beijing, China, 2012.
- Chen, W.; Wang, W.; Jia, S.; Mao, J.; Yan, F.; Zheng, L.; Wu, Y.; Zhang, X.; Dong, Y.; Kong, L.; et al. A New Index Developed for Fast Diagnosis of Meteorological Roles in Ground-Level Ozone Variations. Adv. Atmos. Sci. 2022, 39, 403–414. [Google Scholar] [CrossRef] [Scilit]
- Miao, Y.; Hu, X.; Liu, S.; Qian, T.; Xue, M.; Zheng, Y.; Wang, S. Seasonal variation of local atmospheric circulations and boundary layer structure in the Beijing-Tianjin-Hebei region and implications for air quality. J. Adv. Model. Earth Syst. 2015, 7, 1602–1626. [Google Scholar] [CrossRef] [Scilit]
- Miao, Y.; Liu, S.; Zheng, Y.; Wang, S.; Chen, B. Numerical Study of the Effects of Topography and Urbanization on the Local Atmospheric Circulations over the Beijing-Tianjin-Hebei, China. Adv. Meteorol. 2015, 2015, 397070. [Google Scholar] [CrossRef] [Scilit]
- Guo, H.; Mao, Z.; Gao, C.; Cao, J. Characteristics of Mountain-valley Wind in Qinglong County and Its Impact on Pollutants. J. Agric. Catastrophol. 2023, 13, 227–229. [Google Scholar]
- Lu, Z.; Zhang, Y.; Zhao, T.; Hu, J.; Li, Z.; Wang, D. The impact of mountain-valley breeze on O3 pollution in the western Ya’an region of the Sichuan basin. Acta Sci. Circumstantiae 2024, 44, 83–90. [Google Scholar] [CrossRef]
- Zhang, Y.; Zhao, T.; Sun, X.; Bai, Y.; Shu, Z.; Fu, W.; Lu, Z.; Wang, X. Ozone pollution aggravated by mountain-valley breeze over the western Sichuan Basin, Southwest China. Chemosphere 2024, 361, 142445. [Google Scholar] [CrossRef] [Scilit]
- Kang, M.; Zhang, J.; Zhang, H.; Ying, Q. On the Relevancy of Observed Ozone Increase during COVID-19 Lockdown to Summertime Ozone and PM2.5 Control Policies in China. Environ. Sci. Technol. Lett. 2021, 8, 289–294. [Google Scholar] [CrossRef] [Scilit]
- Ordóñez, C.; Garrido-Perez, J.M.; García-Herrera, R. Early spring near-surface ozone in Europe during the COVID-19 shutdown: Meteorological effects outweigh emission changes. Sci. Total Environ. 2020, 747, 141322. [Google Scholar] [CrossRef] [Scilit]
- Miyazaki, K.; Bowman, K.; Sekiya, T.; Takigawa, M.; Neu, J.L.; Sudo, K.; Osterman, G.; Eskes, H. Global tropospheric ozone responses to reduced NOx emissions linked to the COVID-19 worldwide lockdowns. Sci. Adv. 2021, 7, eabf7460. [Google Scholar] [CrossRef] [Scilit]
- Yan, Y.; Shi, W.; Wang, C.; Chen, Y. Source Attribution and Process Analysis of Summertime Ozone Pollution in Guanzhong Basin, Northwestern China. Atmosphere 2023, 14, 1742. [Google Scholar] [CrossRef] [Scilit]
- Guan, C.; Liu, M.; Shi, J.; Li, Y. Temporal and spatial heterogeneity of tropospheric O3 and NO2 and health impact analysis in Shaanxi, Gansu, and Ningxia regions of China. Environ. Monit. Assess. 2025, 197, 414. [Google Scholar] [CrossRef] [Scilit]
- Xujing, W.; Ying, C.; Wei, S.; Xiaowei, N.; Songbo, L.; Jingxu, Z.; Jing, S. Variation Trends of Air Quality and Pollution Characteristics in Baoji City from 2017 to 2025. Atmos. Environ. X 2026, 31, 100500. [Google Scholar] [CrossRef] [Scilit]
- Hui, L.; Ma, T.; Gao, Z.; Gao, J.; Wang, Z.; Xue, L.; Liu, H.; Liu, J. Characteristics and sources of volatile organic compounds during high ozone episodes: A case study at a site in the eastern Guanzhong Plain, China. Chemosphere 2021, 265, 129072. [Google Scholar] [CrossRef] [Scilit]
- Xiaowan, Z.; Yulu, Q.; Xuebo, F.; Zhiqiang, M.; Jin, W.; Xiangxue, L.; Yingruo, L. Statistical analysis of the relationships between boundary layer meteorological processes and nocturnal O3 increases in Beijing from 2018 to 2022. Atmos. Res. 2024, 306, 107451. [Google Scholar] [CrossRef] [Scilit]
- Wang, R.; Zhang, N.; Wu, J.; Jiang, Q.; Yu, J.; Lu, Y.; Tie, X. Sub-seasonal and spatial variations in ozone formation and co-control potential for secondary aerosols in the Guanzhong basin, central China. Atmos. Chem. Phys. 2026, 26, 3417–3438. [Google Scholar] [CrossRef] [Scilit]
- Tu, J.; Xia, Z.-G.; Wang, H.; Li, W. Temporal variations in surface ozone and its precursors and meteorological effects at an urban site in China. Atmos. Res. 2007, 85, 310–337. [Google Scholar] [CrossRef] [Scilit]
- Zhang, L.; Wang, L.; Tang, G.; Xin, J.; Li, M.; Li, X.; Xin, F.; Qin, Y.; Wang, Y.; Hu, B. Comprehensively exploring the characteristics and meteorological causes of ozone pollution events in Beijing during 2013-2020. Atmos. Res. 2023, 294, 106978. [Google Scholar] [CrossRef] [Scilit]
- Chen, L.; Xiao, H.; Zhu, L.; Guo, X.; Wang, W.; Ma, L.; Guo, W.; He, J.; Wang, Y.; Li, M.; et al. Characteristics of Ozone Pollution and the Impacts of Related Meteorological Factors in Shanxi Province, China. Atmosphere 2022, 13, 1729. [Google Scholar] [CrossRef] [Scilit]
- Wang, X.; Huo, A.; LÜ, J.; Zhao, Z.; Chen, J.; Zhong, F.; Yang, L.; Yang, L. Variation Characteristics and Source Analysis of Atmospheric Ozone Pollution in Guanzhong Region. Environ. Sci. 2024, 45, 3789–3798. [Google Scholar] [CrossRef] [Scilit]
- Xia, Y.; Chen, X.; He, Y.; Xue, Z.; Ning, Y.; Wei, P.; Yan, Q.; Wei, M.; Zhang, W. Investigating the factors contributing to the maintenance of high levels of warm season nocturnal ozone in a basin city. Environ. Pollut. 2025, 368, 125752. [Google Scholar] [CrossRef] [Scilit]
- He, Y.; Wang, H.; Wang, H.; Xu, X.; Li, Y.; Fan, S. Meteorology and topographic influences on nocturnal ozone increase during the summertime over Shaoguan, China. Atmos. Environ. 2021, 256, 118459. [Google Scholar] [CrossRef] [Scilit]
- Yan, Y.; Wang, X.; Qu, K.; Li, X.; Shi, W.; Peng, Z.; Zhang, Y. Impacts of synoptic circulations on summertime ozone pollution in Guanzhong Basin, northwestern China. Atmos. Environ. 2021, 262, 118660. [Google Scholar] [CrossRef] [Scilit]
- Li, D.; Fu, H.; Liu, Y.J.; Jiang, P.; Qi, G.W. Analysis of abnormal phenomenon of ozone at night in Emeishan City. China Resour. Compr. Util. 2023, 41, 10. [Google Scholar] [CrossRef]
- Raga, G.B.; Baumgardner, D.; Kok, G.; Rosas, I. Some aspects of boundary layer evolution in Mexico City. Atmos. Environ. 1999, 33, 5013–5021. [Google Scholar] [CrossRef] [Scilit]
- Xu, W.; Lin, W.; Xu, X.; Tang, J.; Huang, J.; Wu, H.; Zhang, X. Long-term trends of surface ozone and its influencing factors at the Mt Waliguan GAW station, China—Part 1: Overall trends and characteristics. Atmos. Chem. Phys. 2016, 16, 6191–6205. [Google Scholar] [CrossRef] [Scilit]
- Schlink, U.; Herbarth, O.; Richter, M.; Rehwagen, M.; Puliafito, J.L.; Puliafito, E.; Puliafito, C.; Guerreiro, P.; Quéro, J.L.; Behler, J.C. Ozone-Monitoring in Mendoza, Argentina: Initial Results. J. Air Waste Manag. Assoc. 1999, 49, 82–87. [Google Scholar] [CrossRef] [Scilit]
- Guo, R.; Shi, G.; Zhang, D.; Chen, Y.; Peng, C.; Zhai, C.; Yang, F. An observed nocturnal ozone transport event in the Sichuan Basin, Southwestern China. J. Environ. Sci. 2024, 138, 10–18. [Google Scholar] [CrossRef] [Scilit]
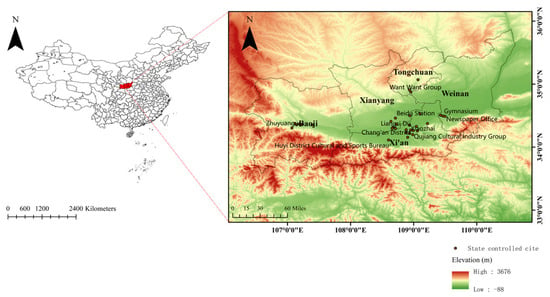
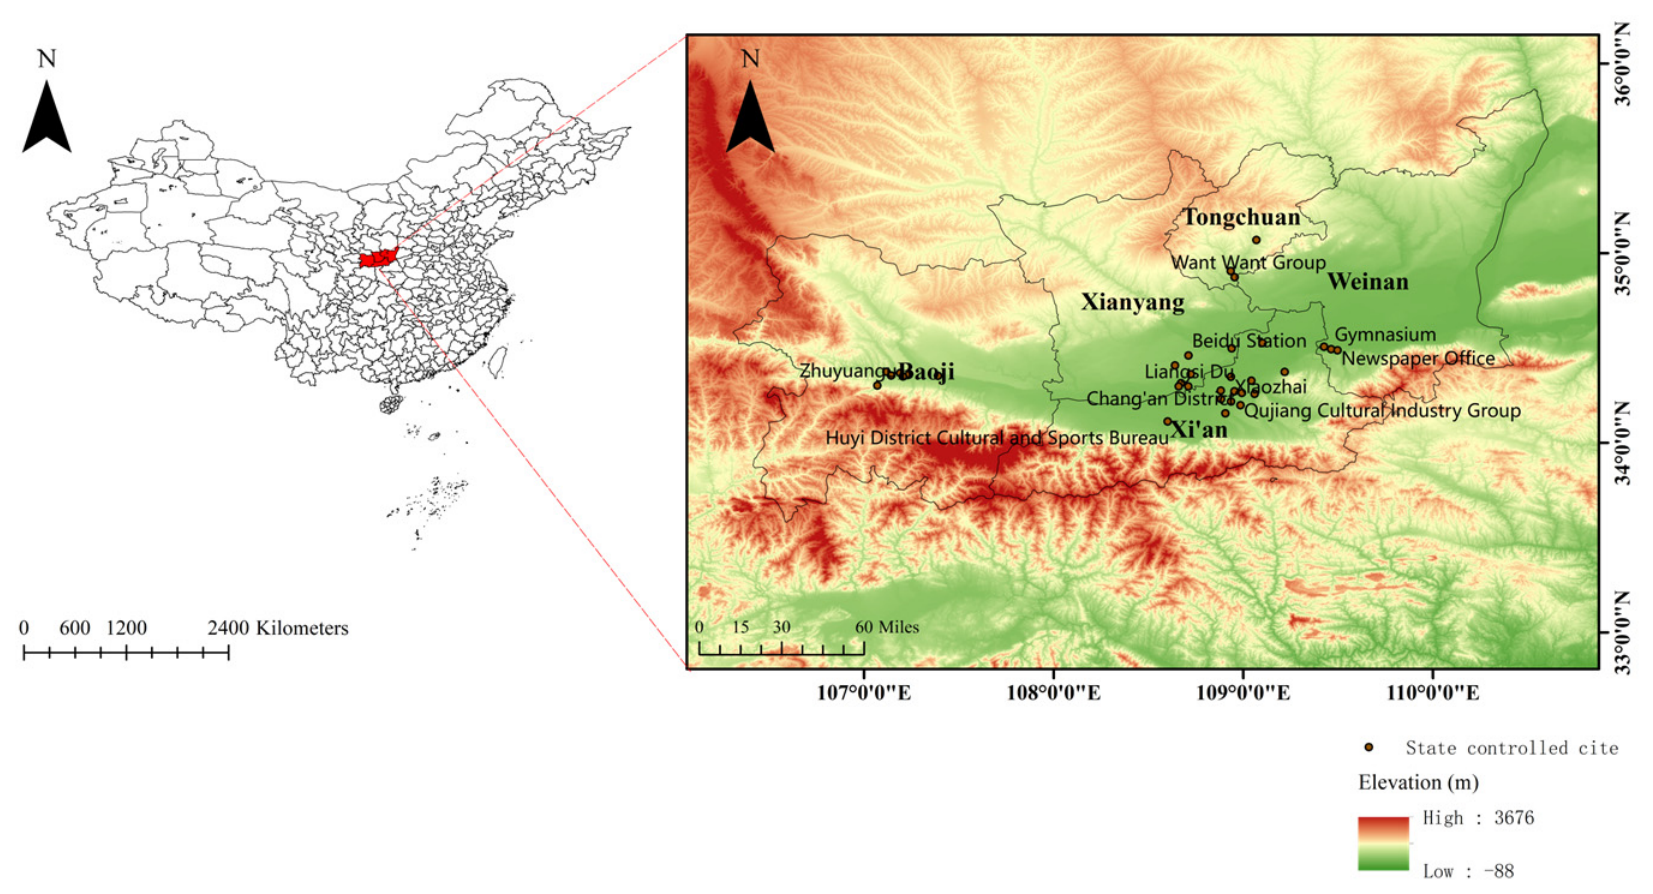
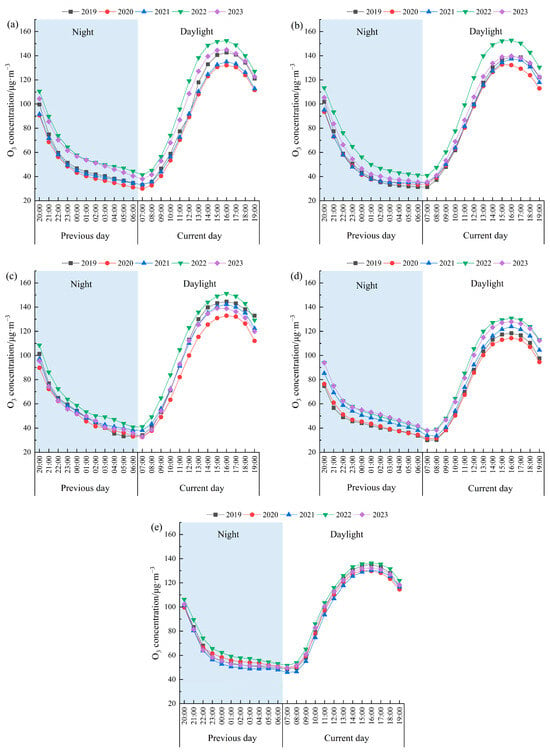
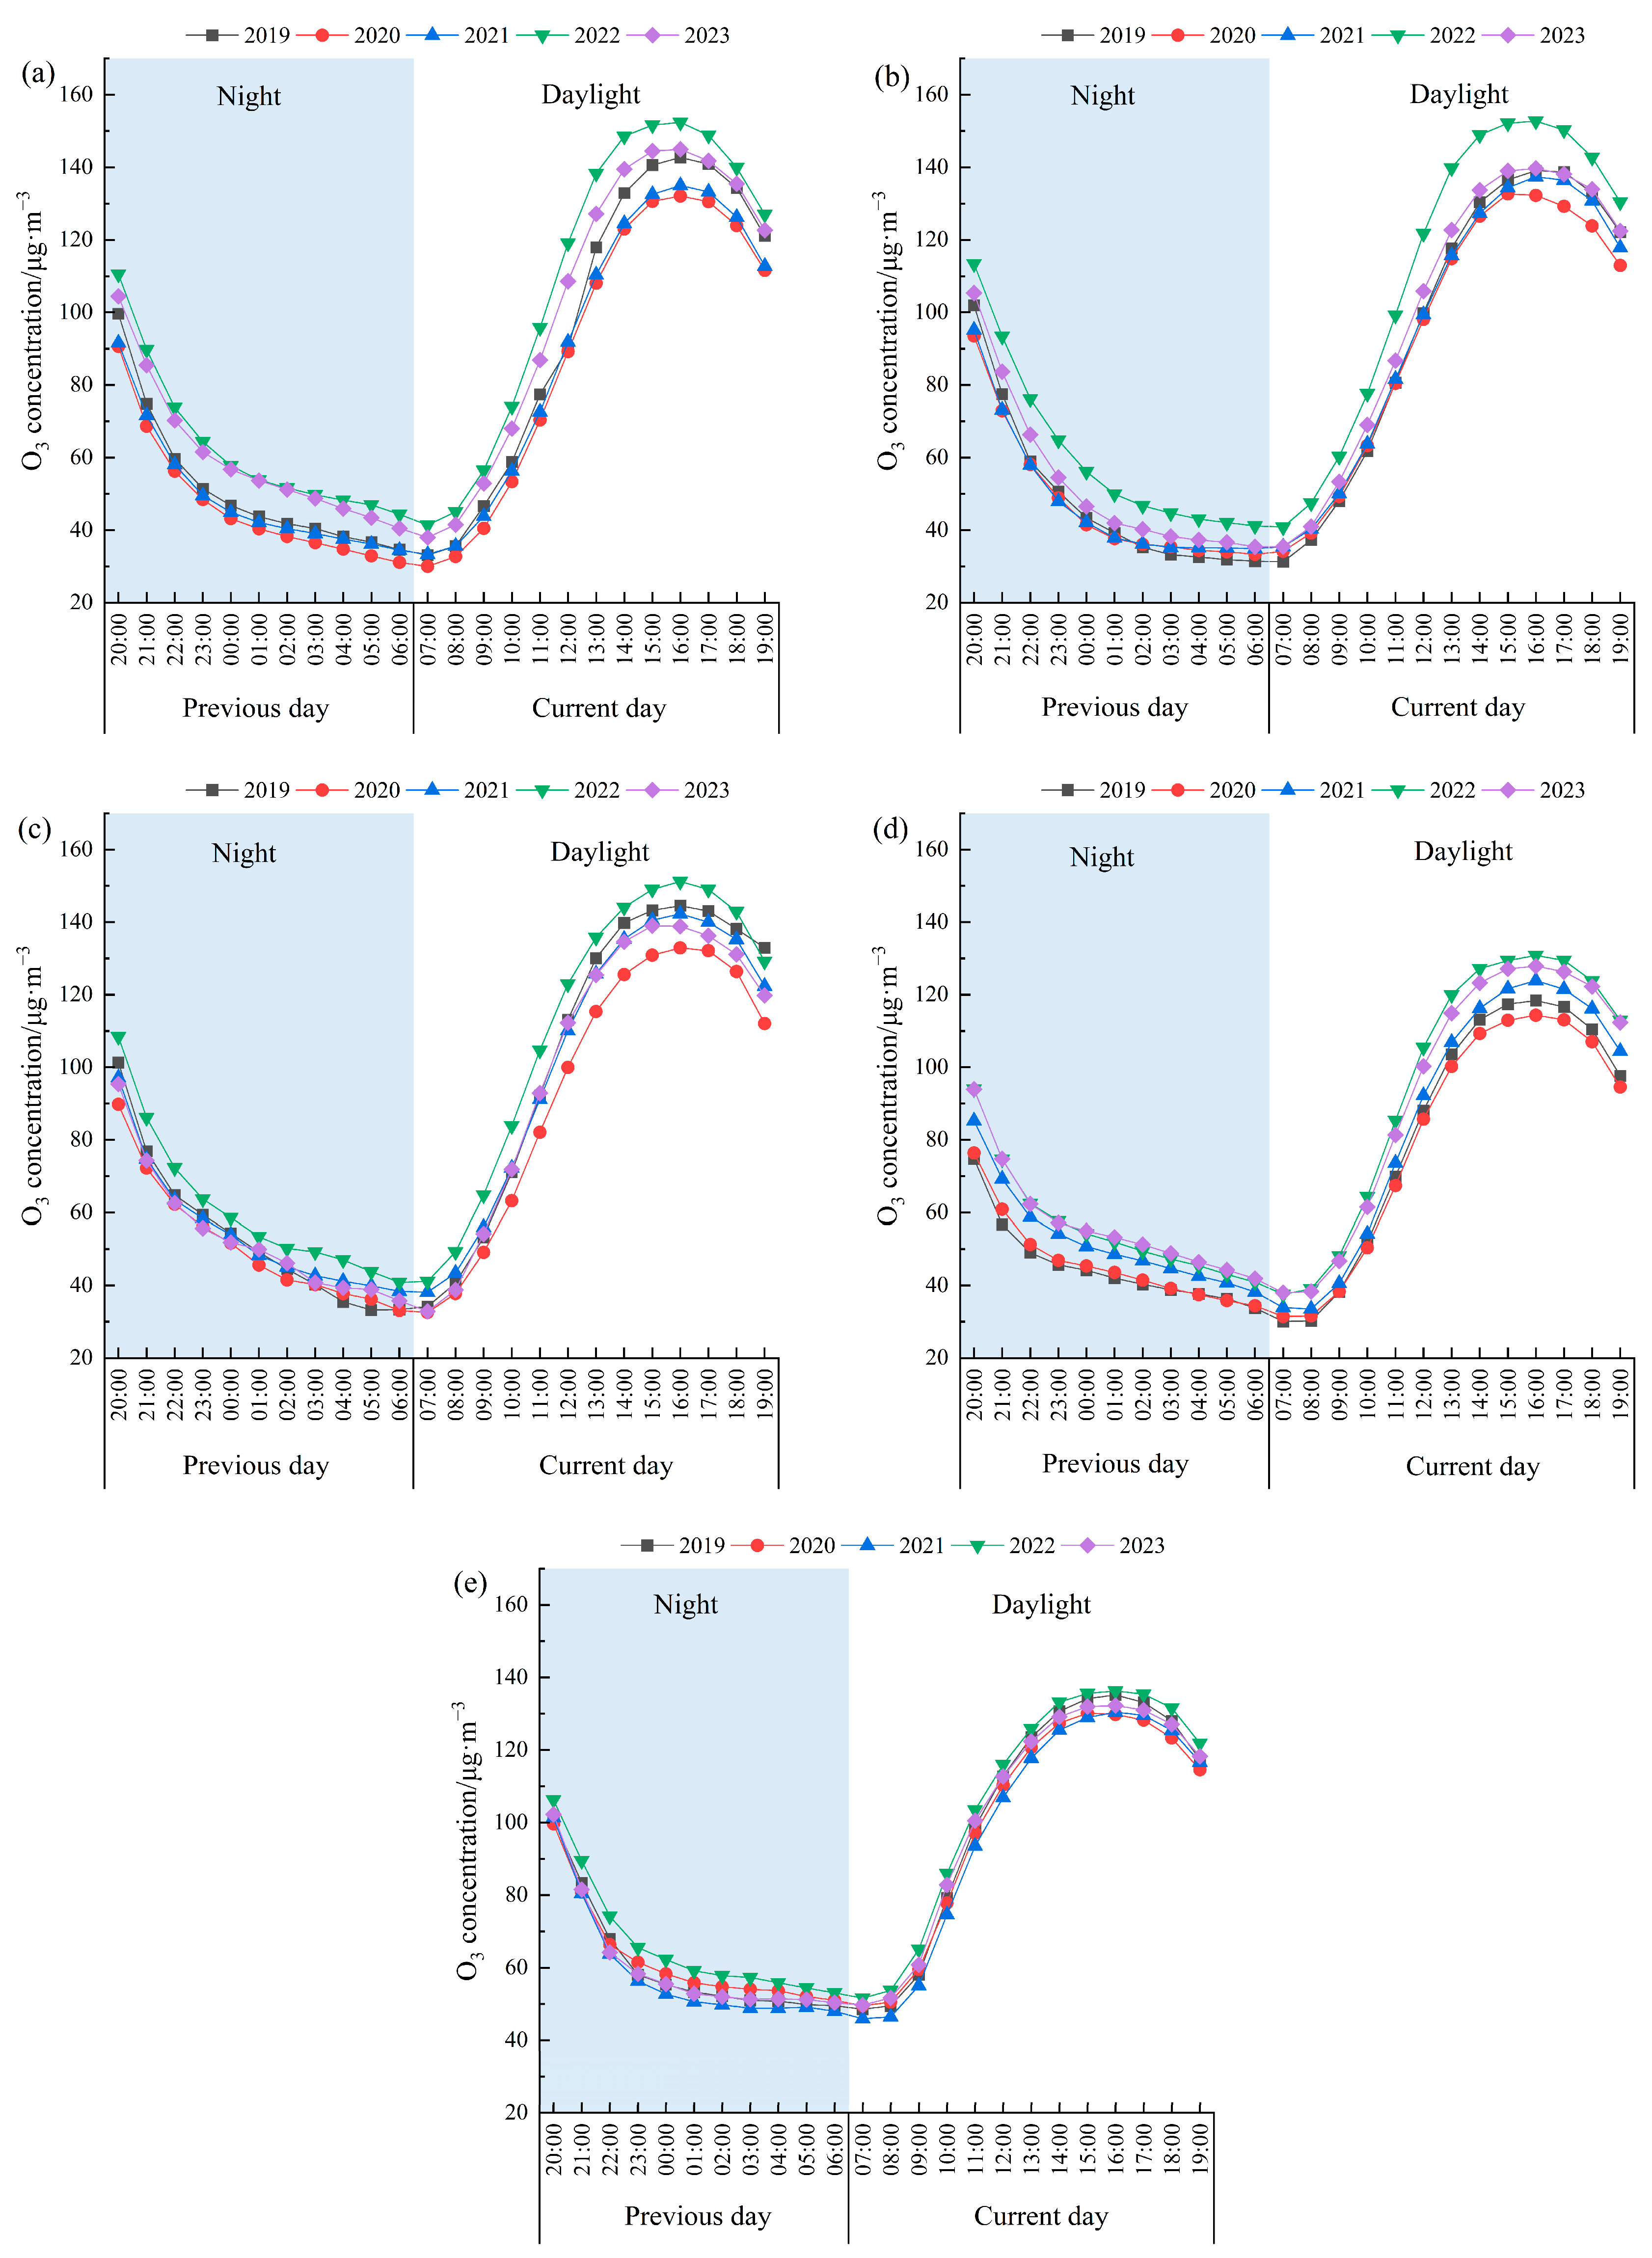
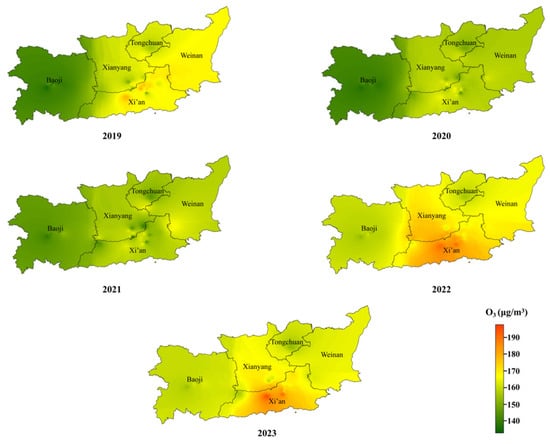
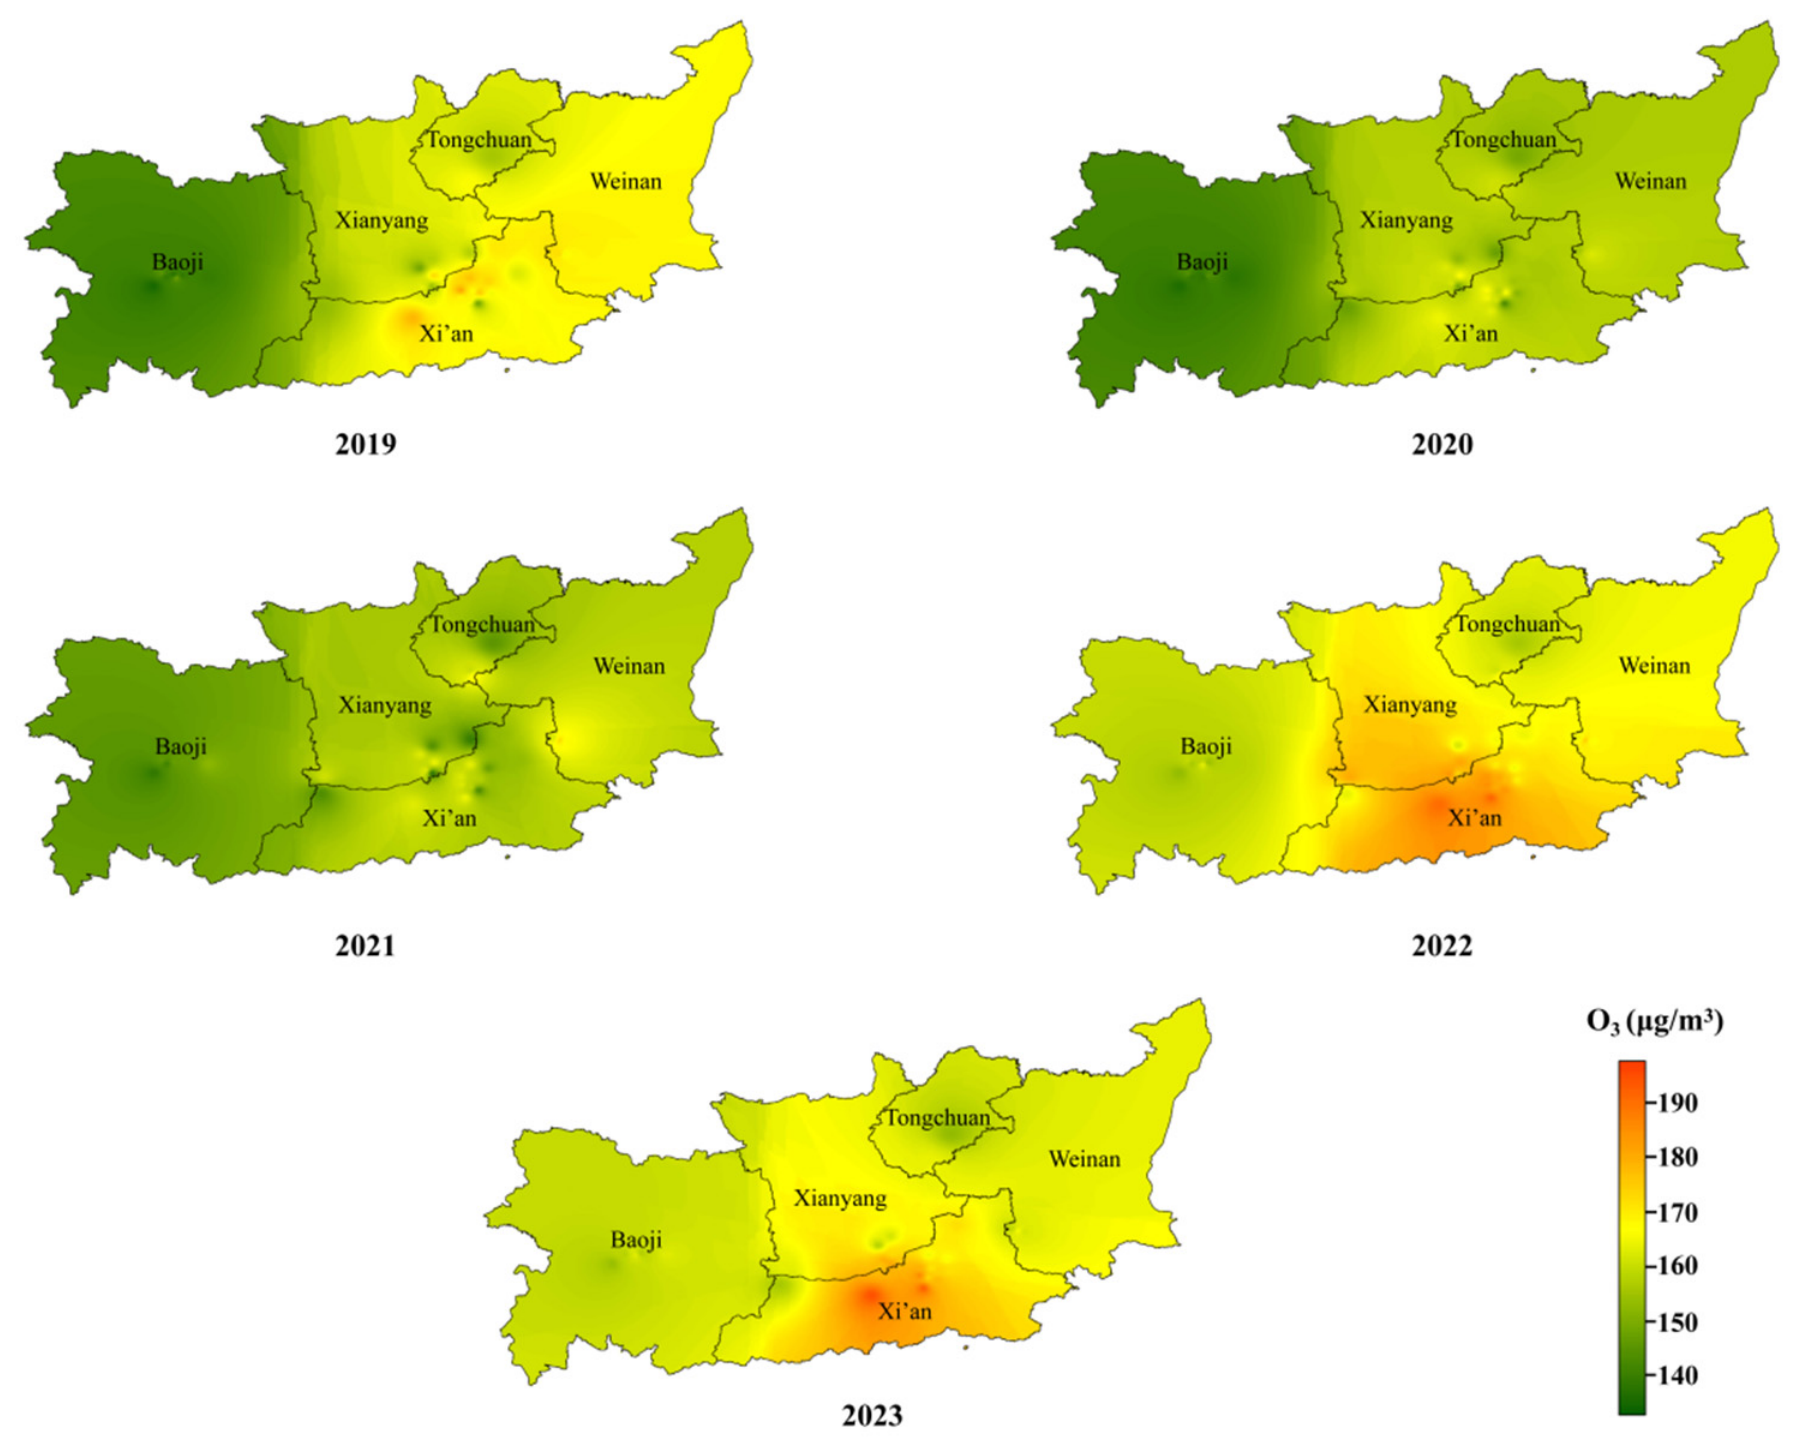
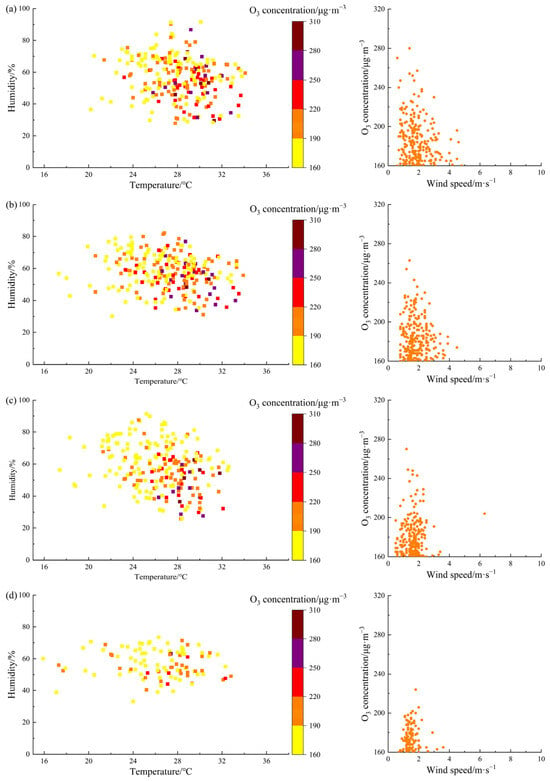
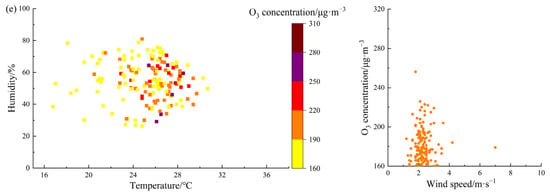
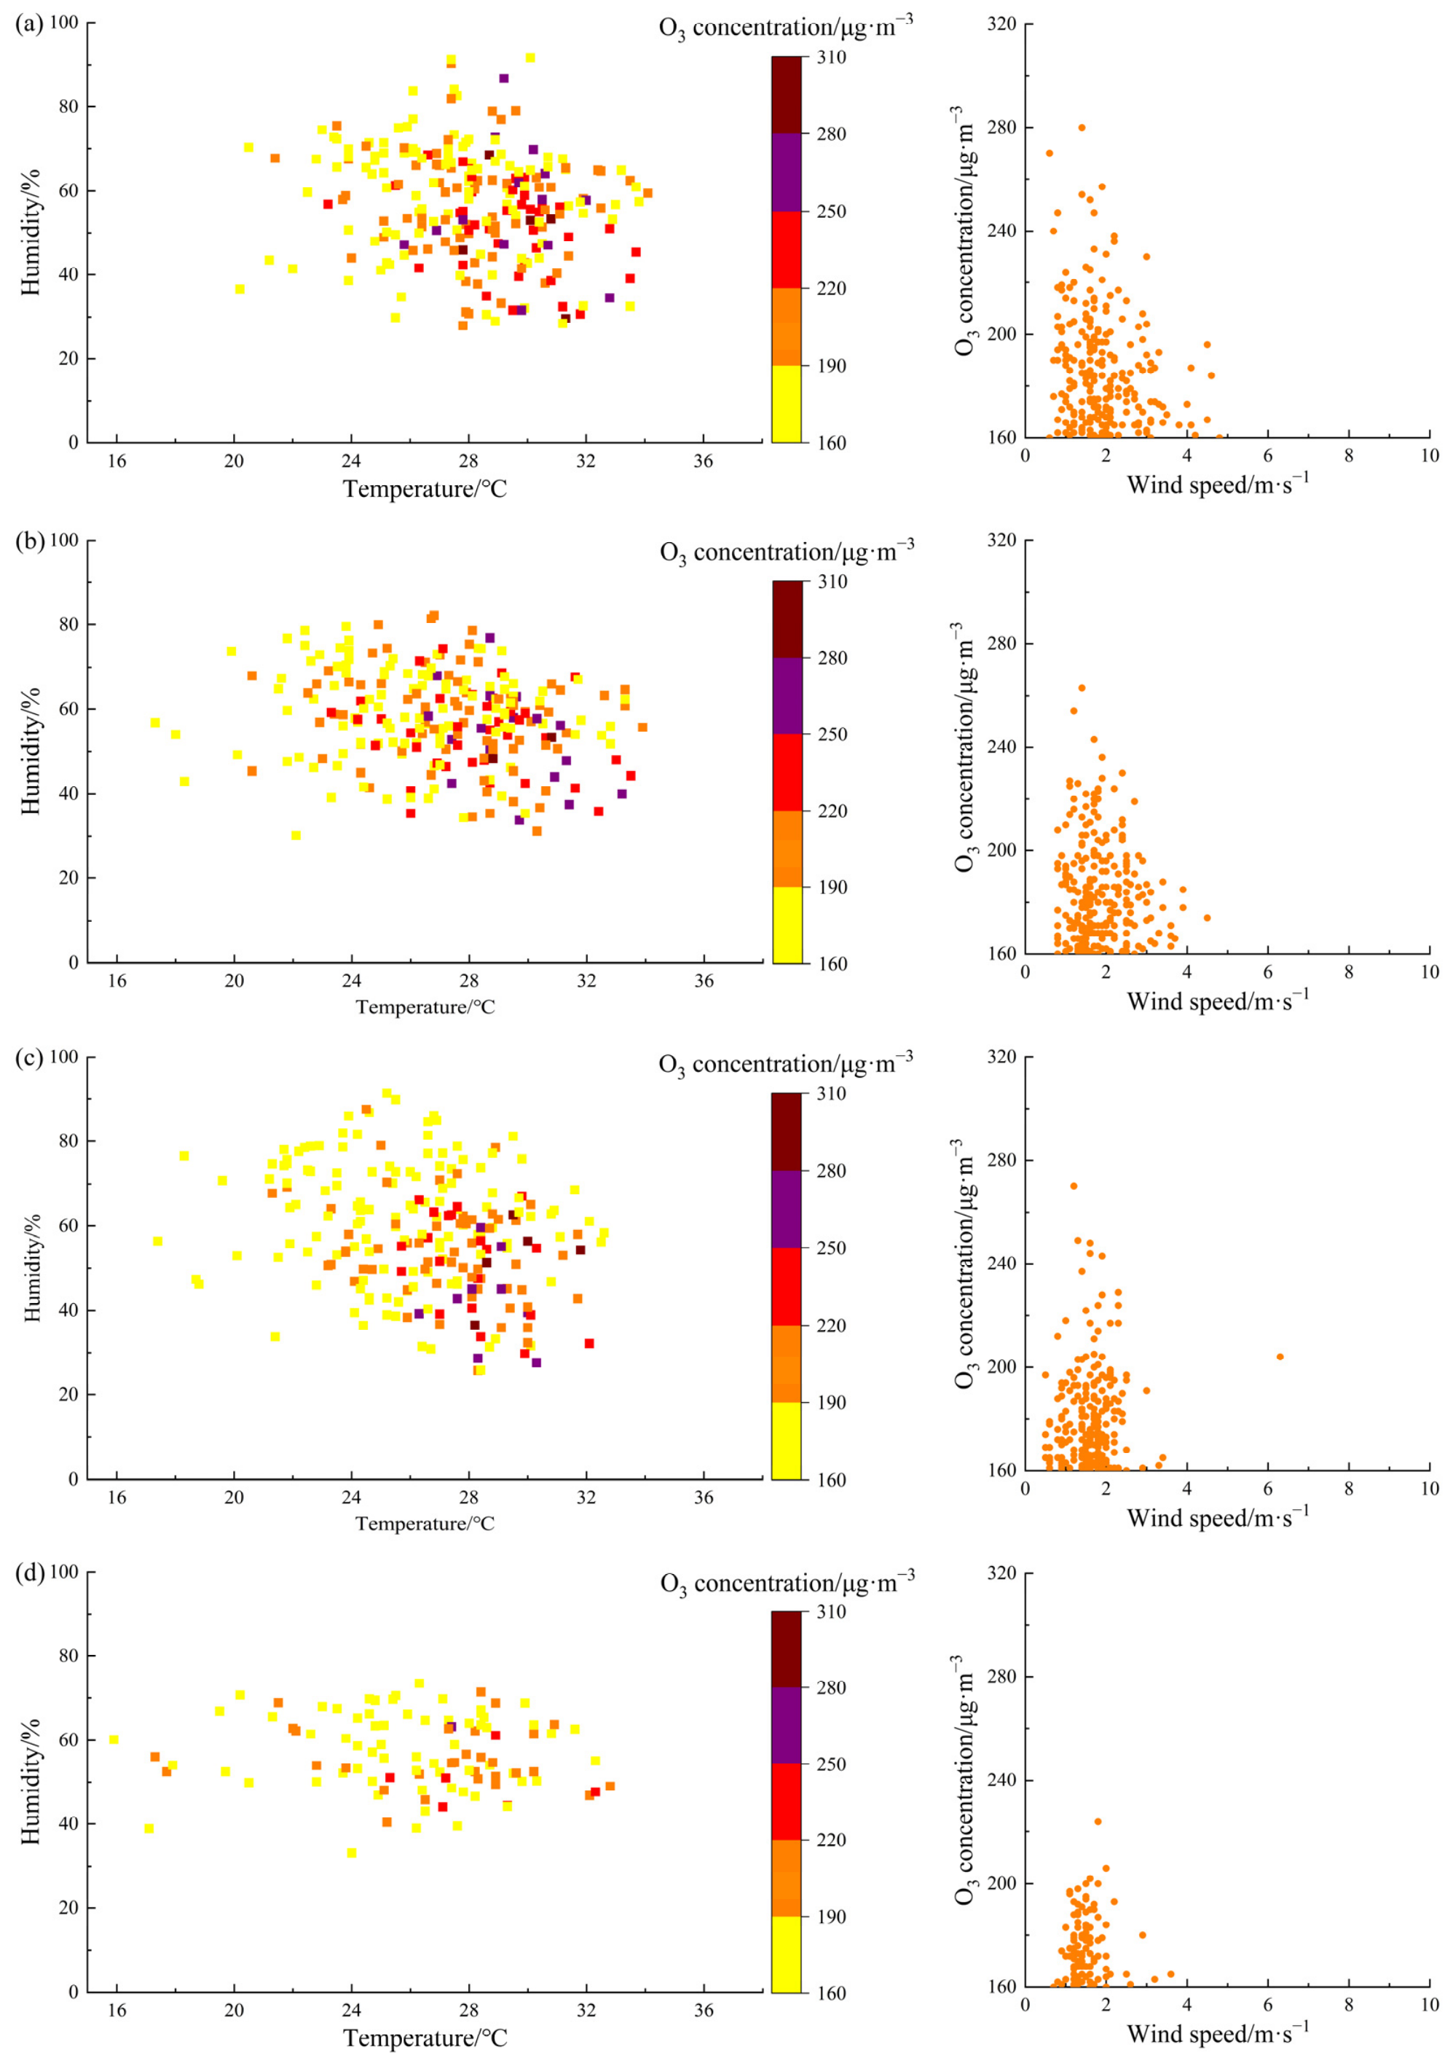
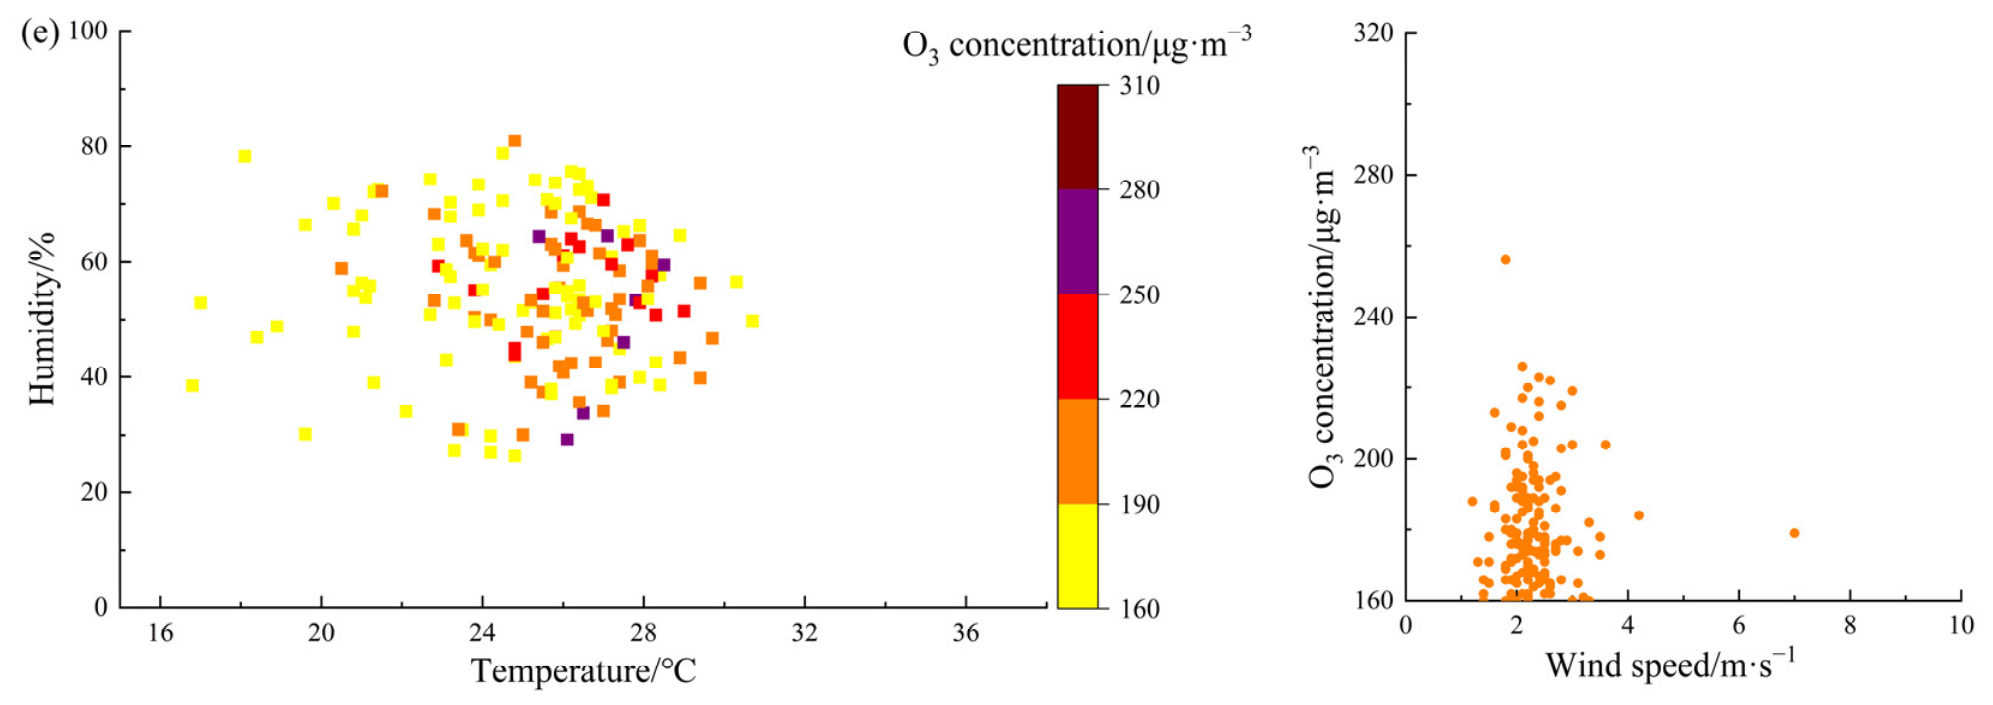
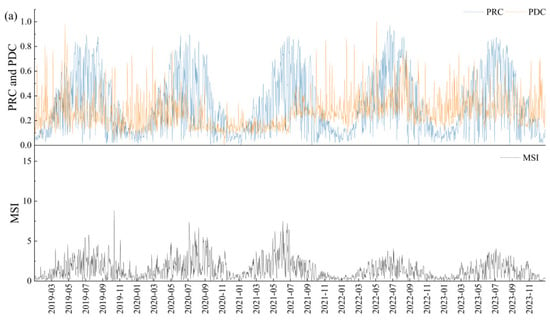
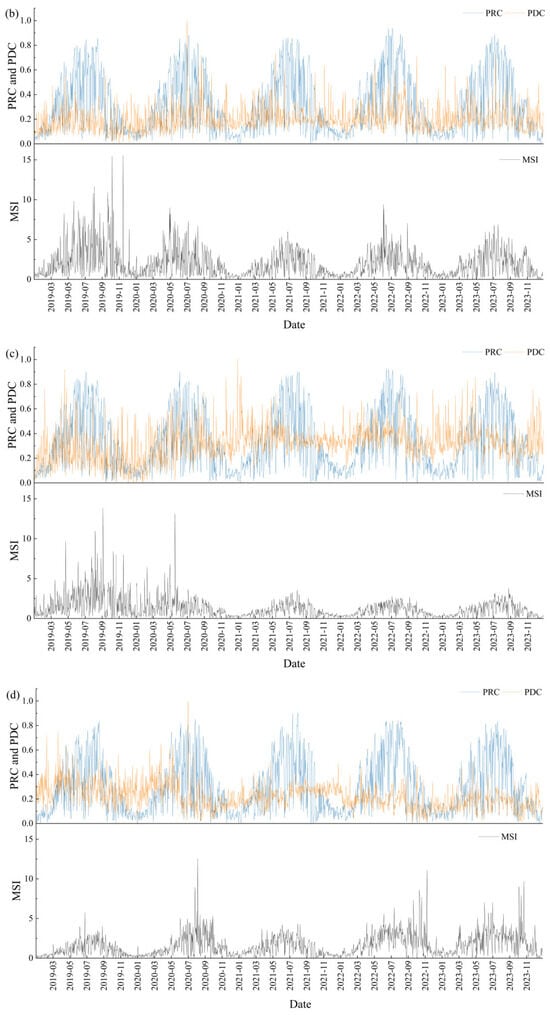
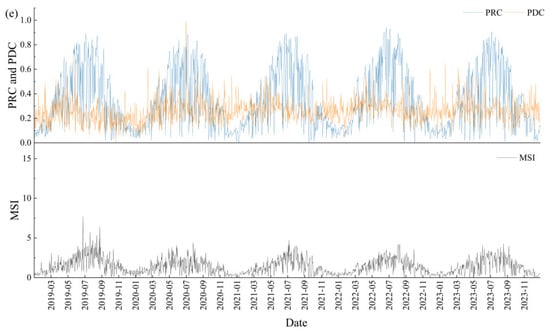
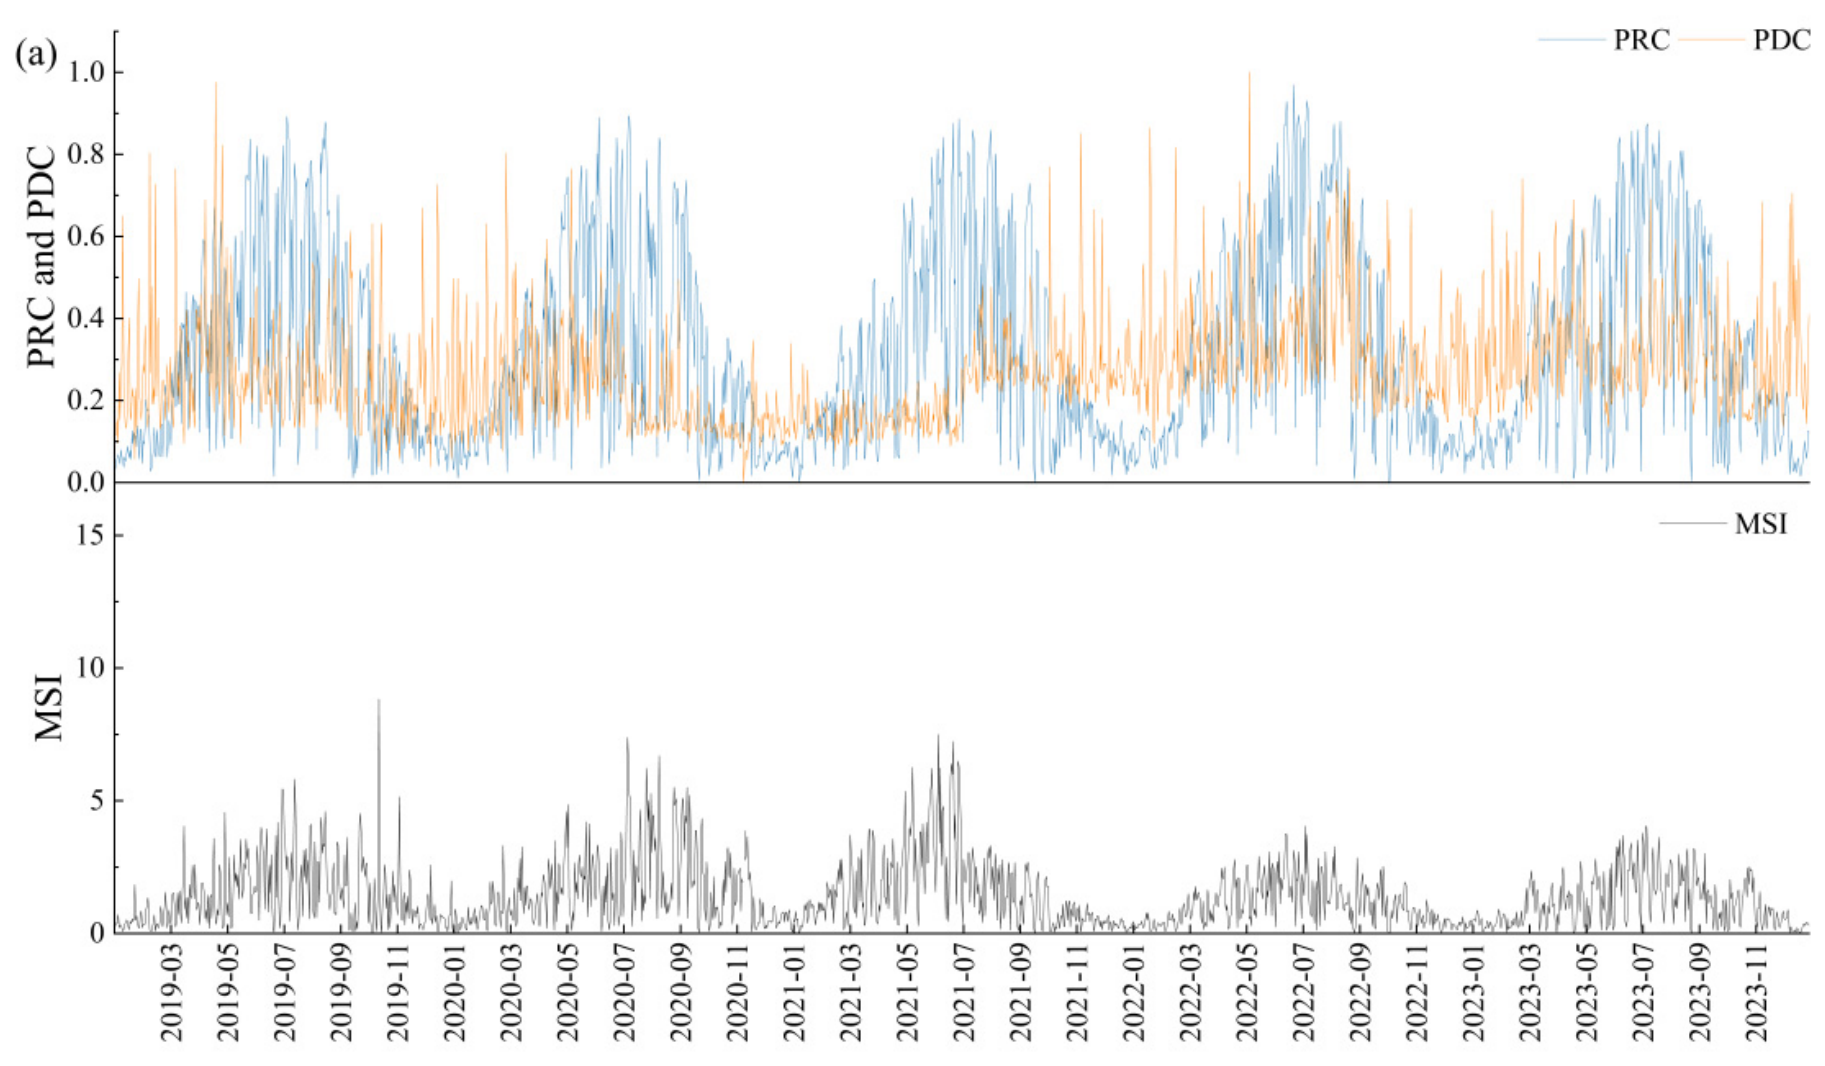
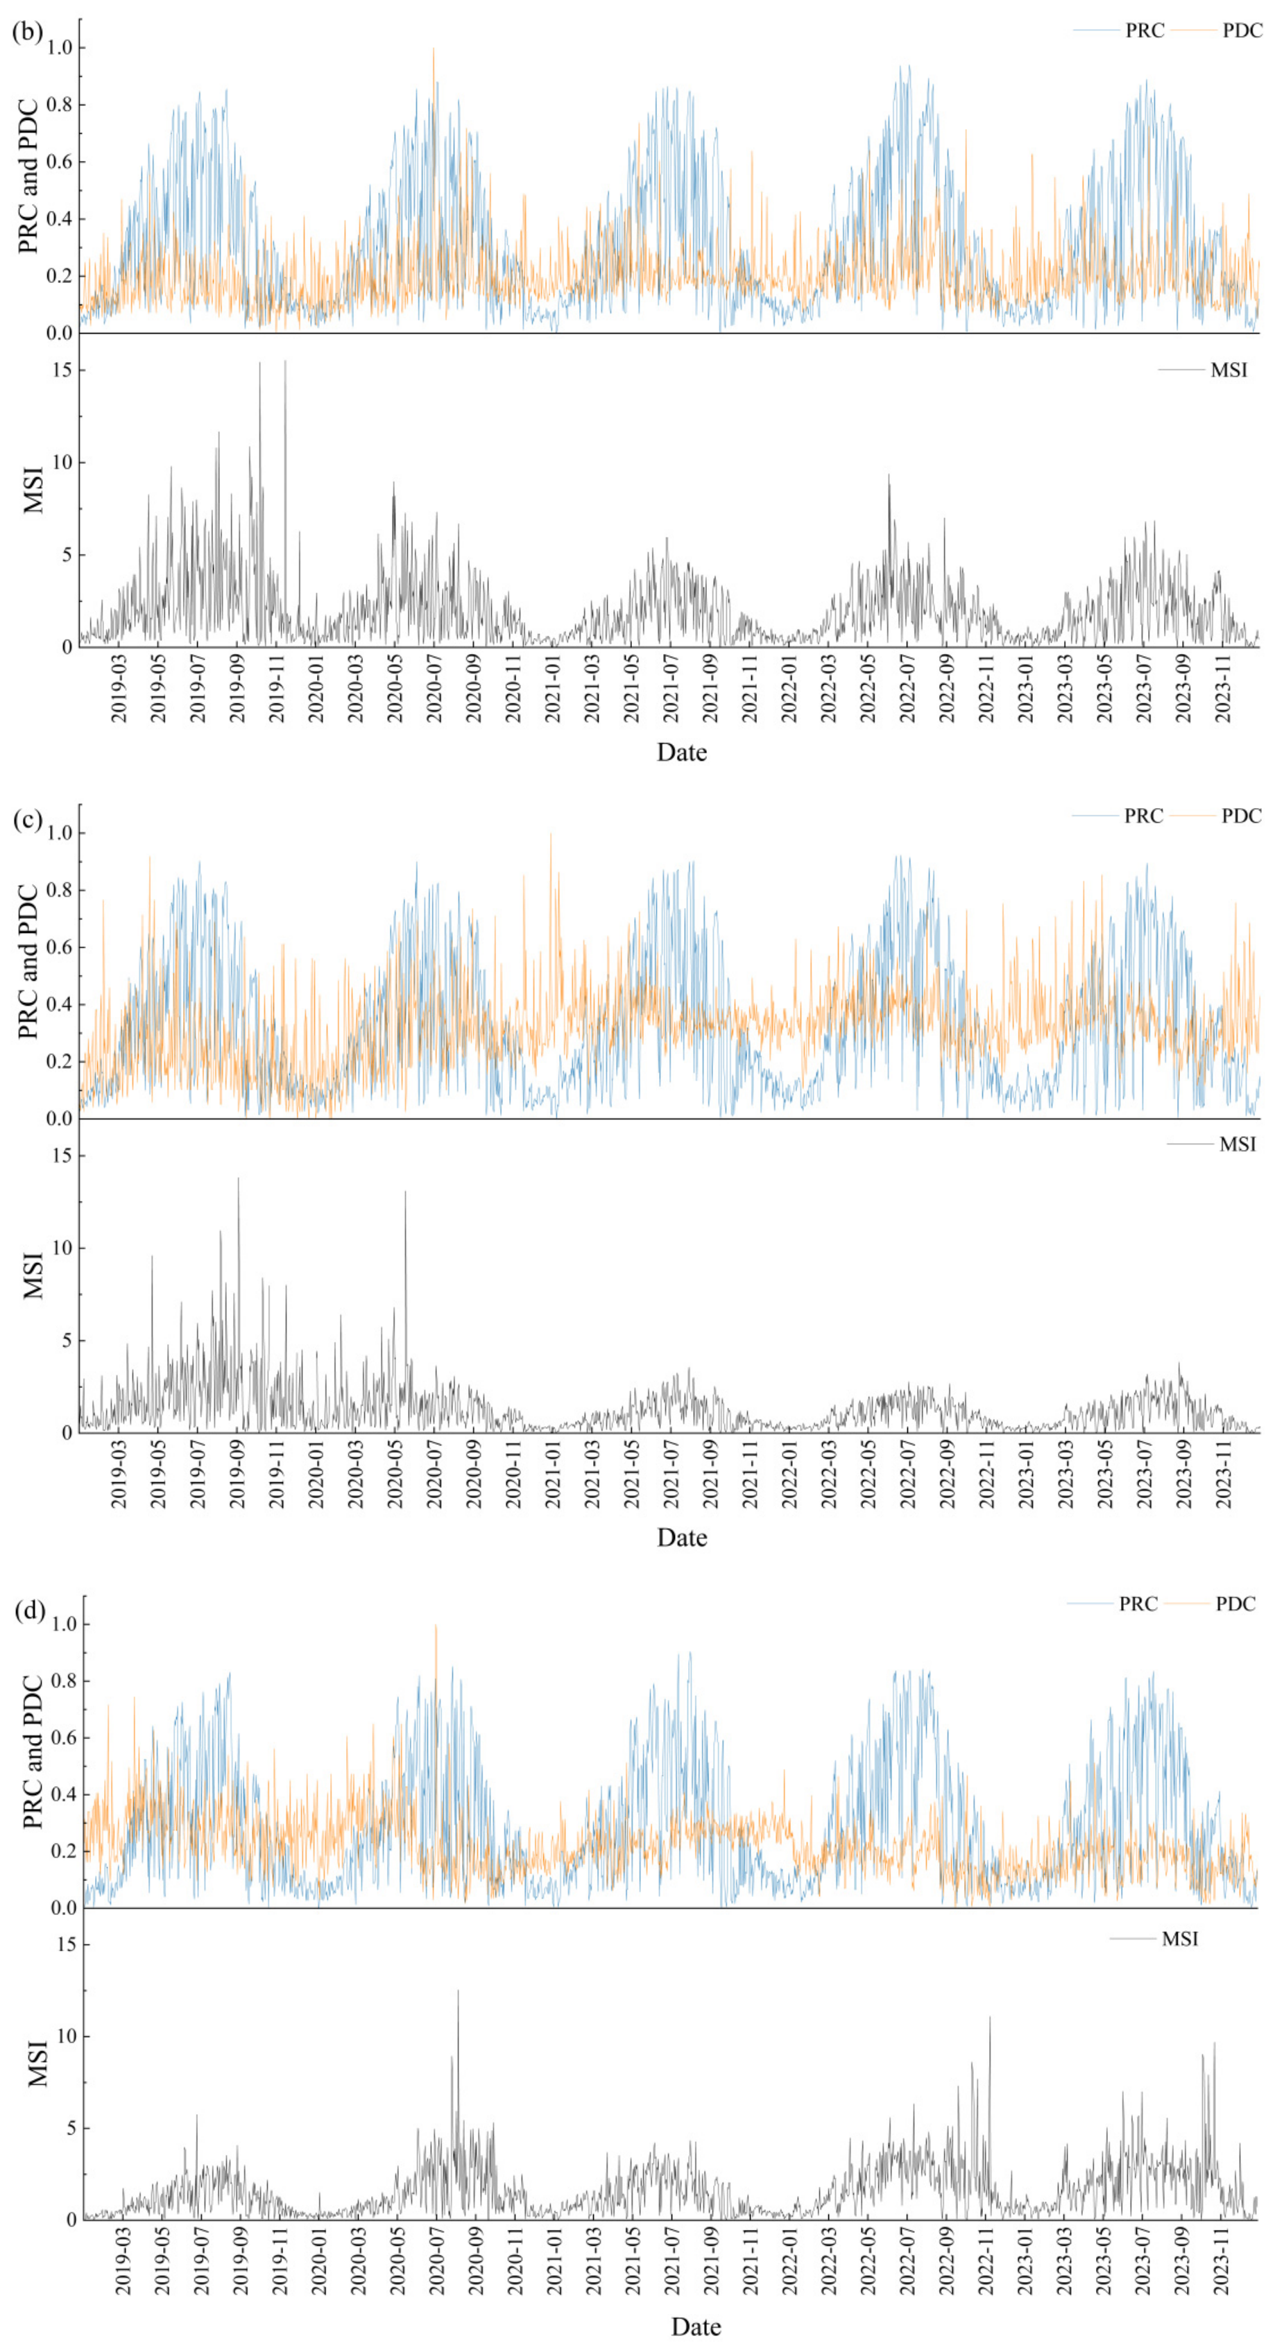
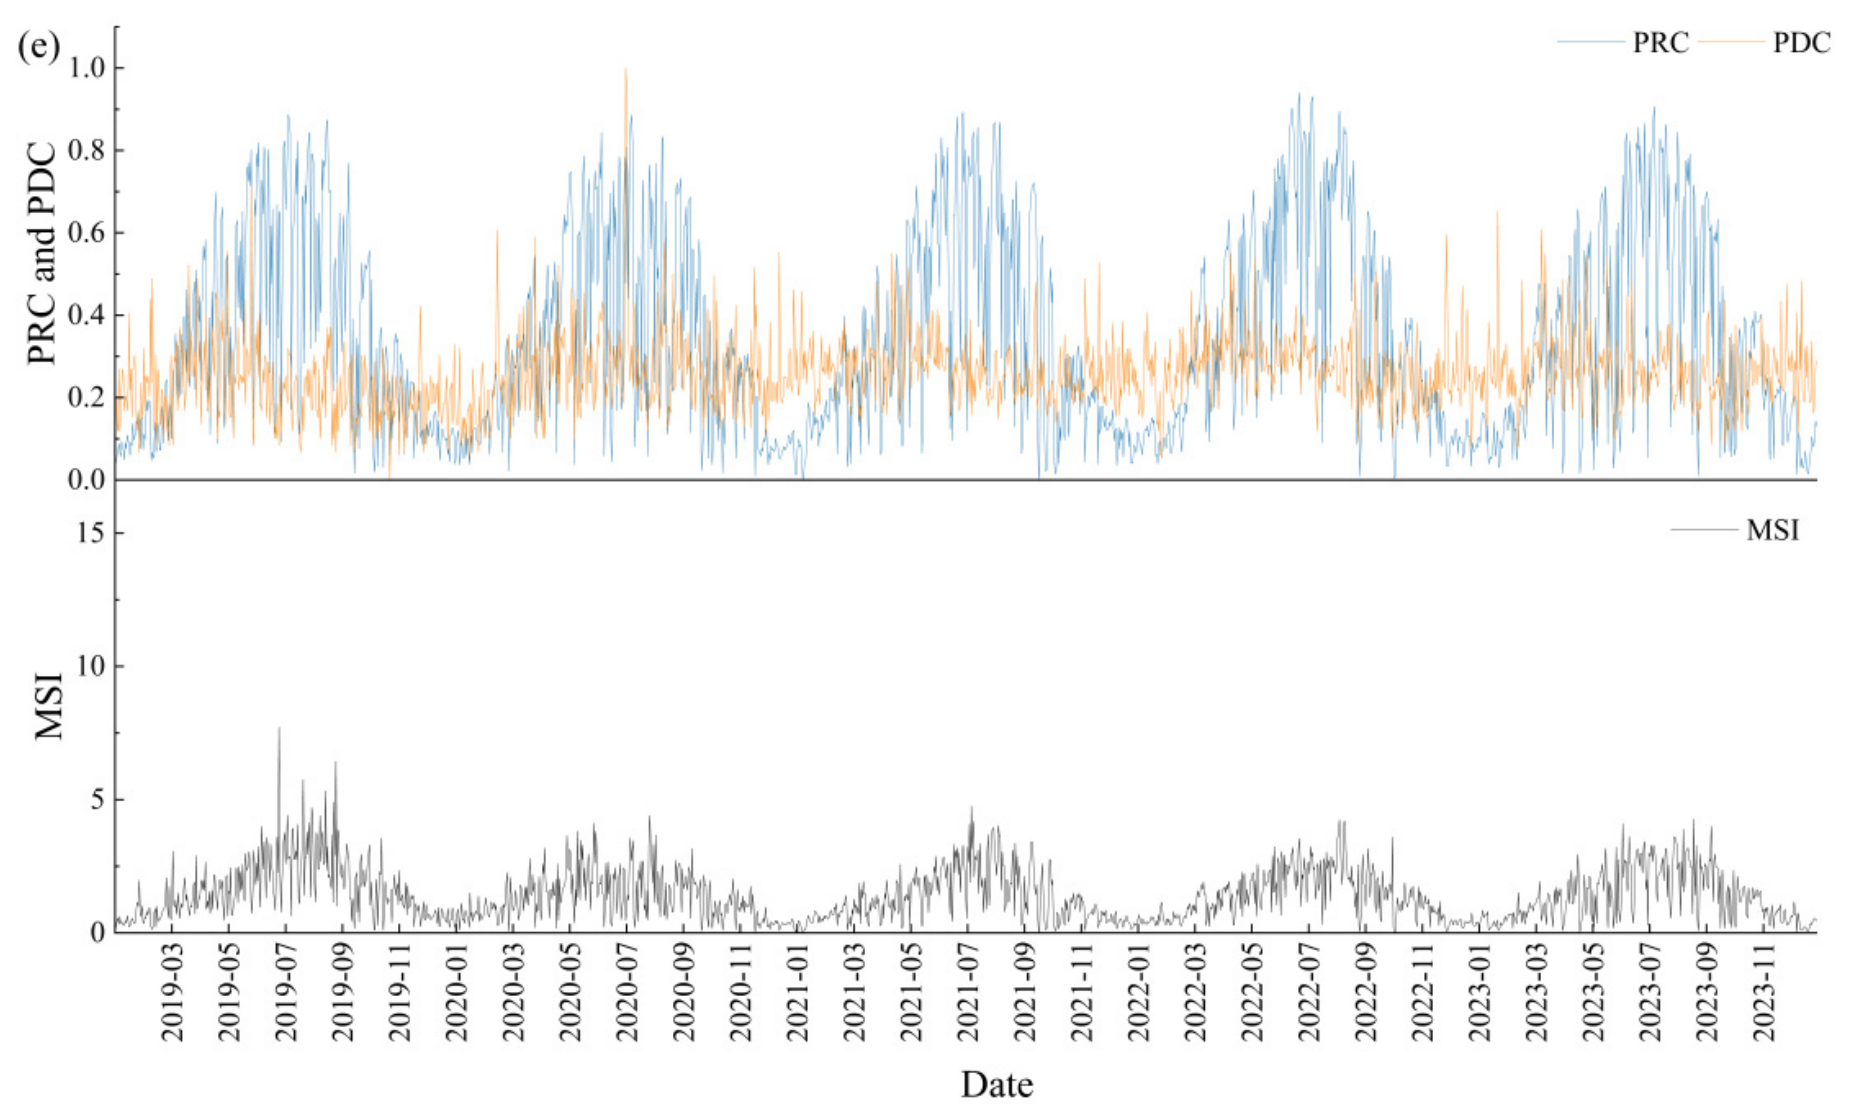
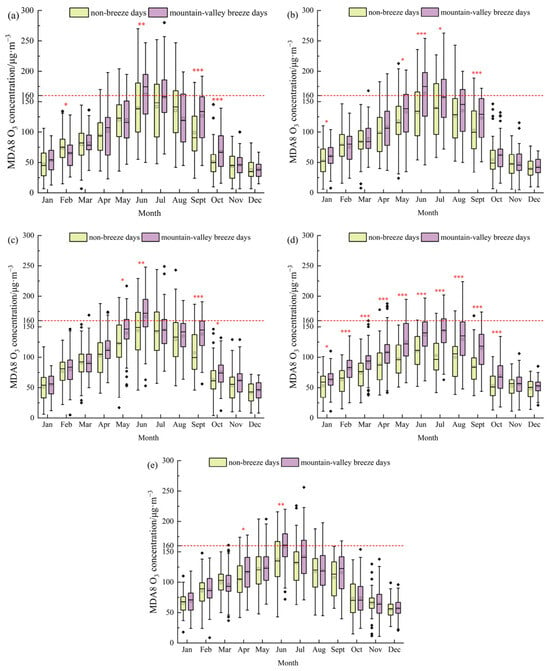
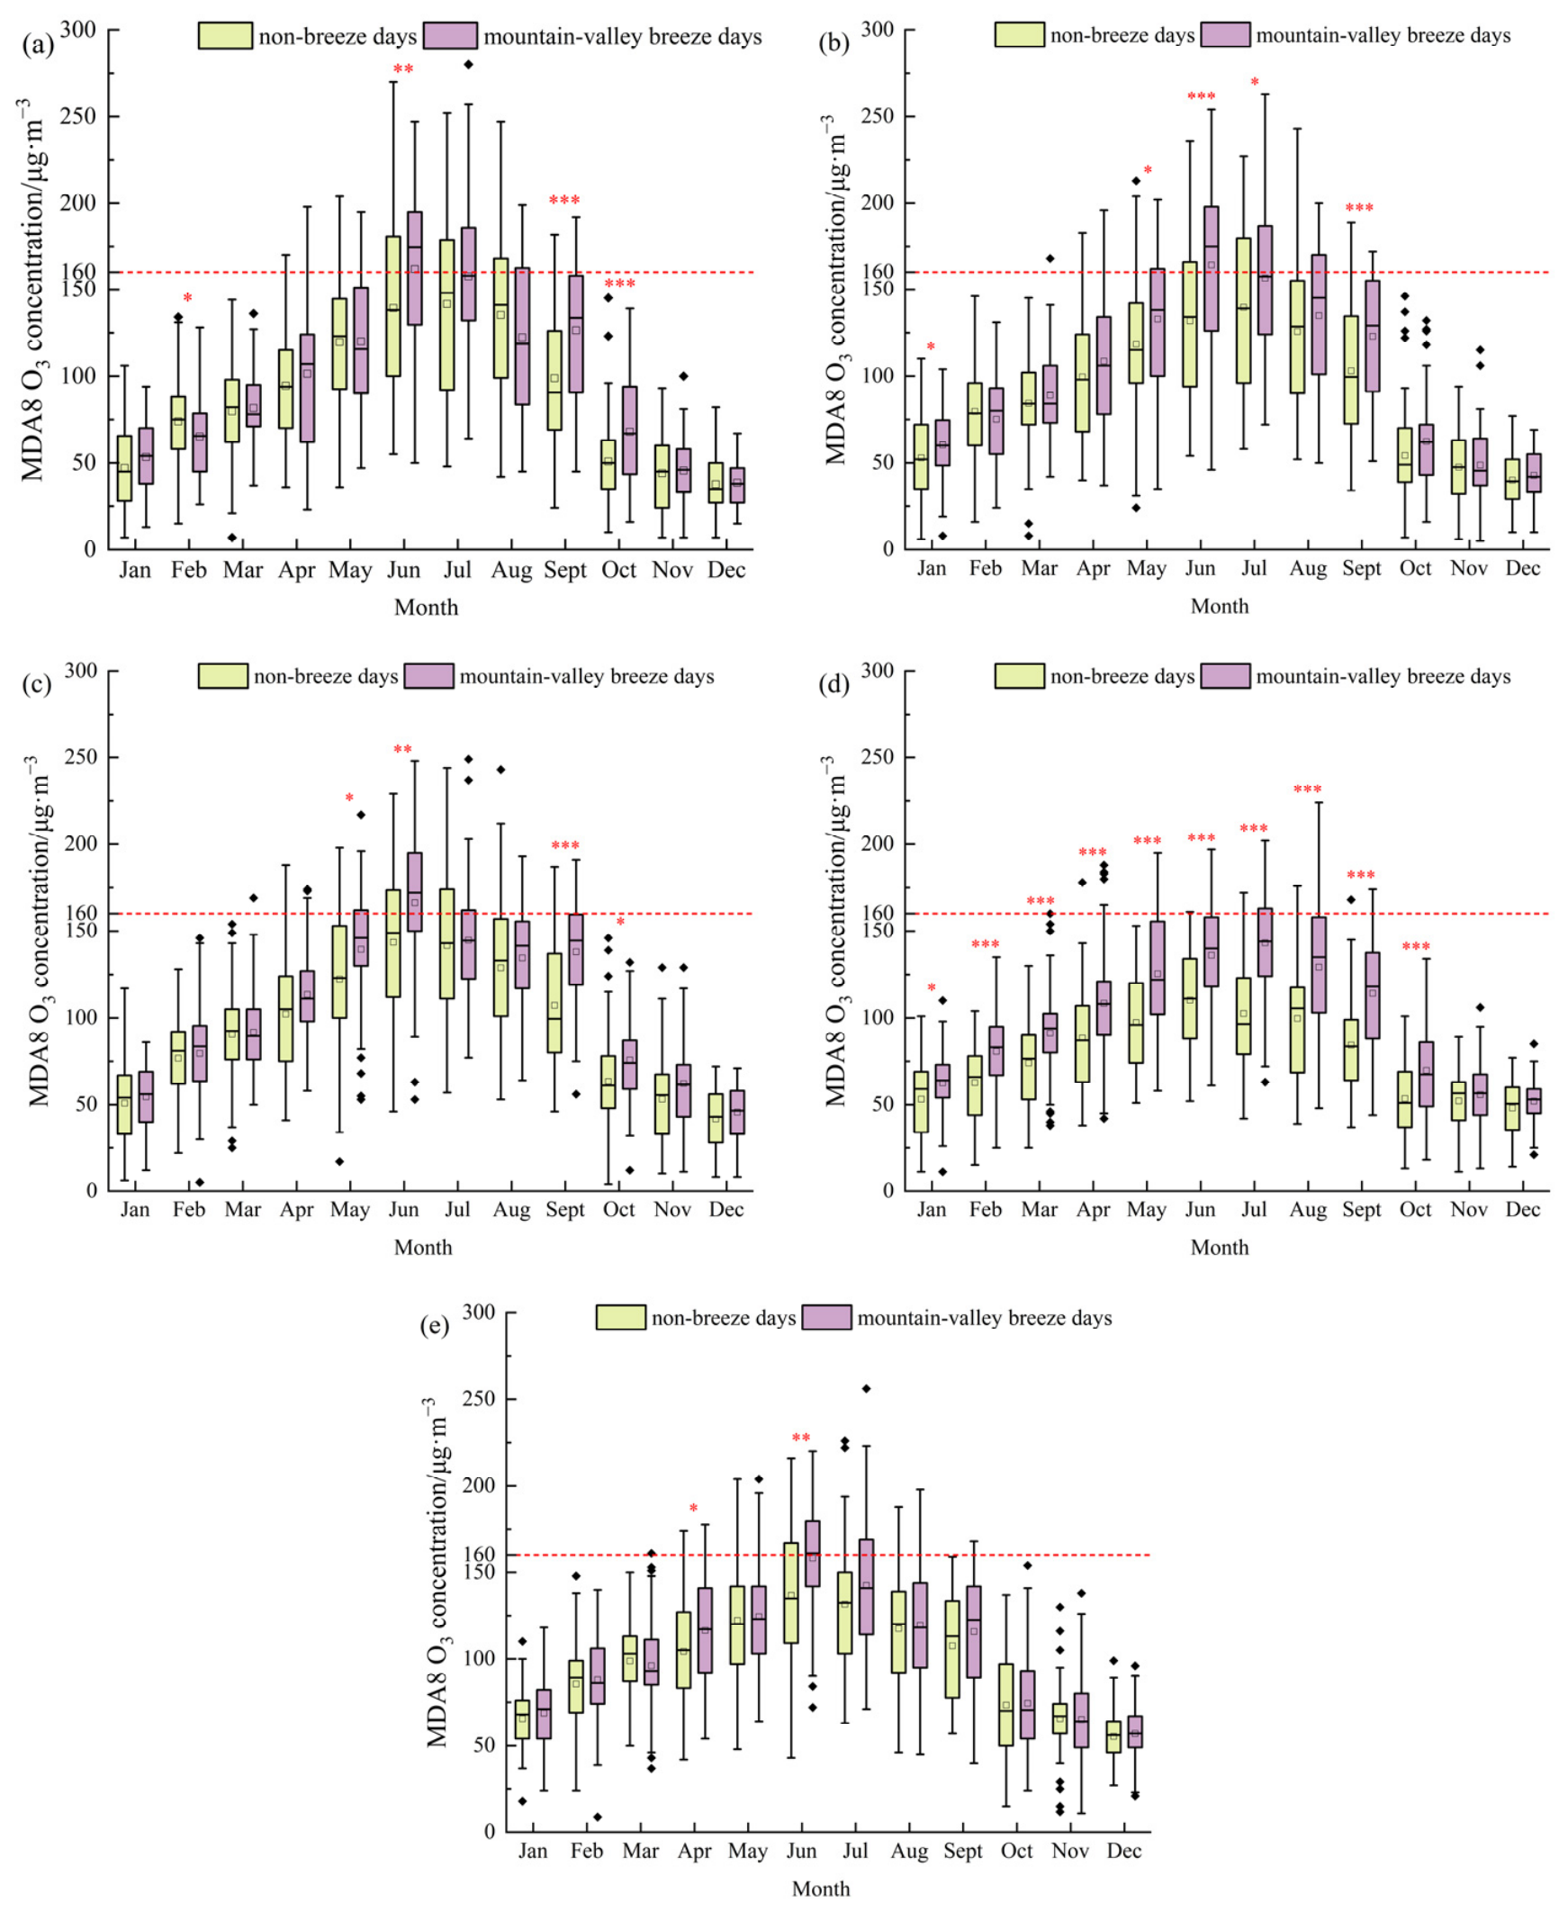
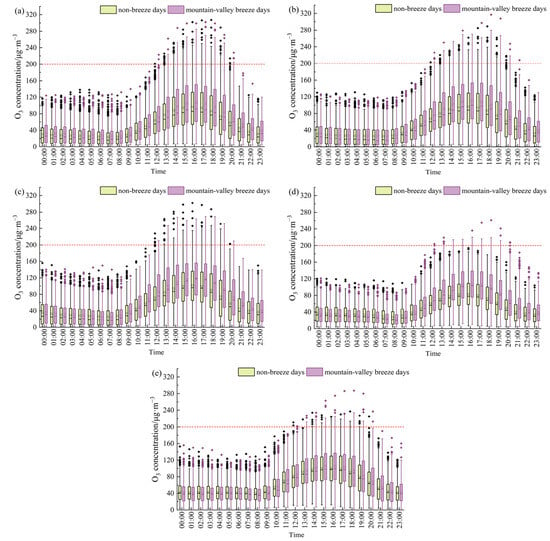
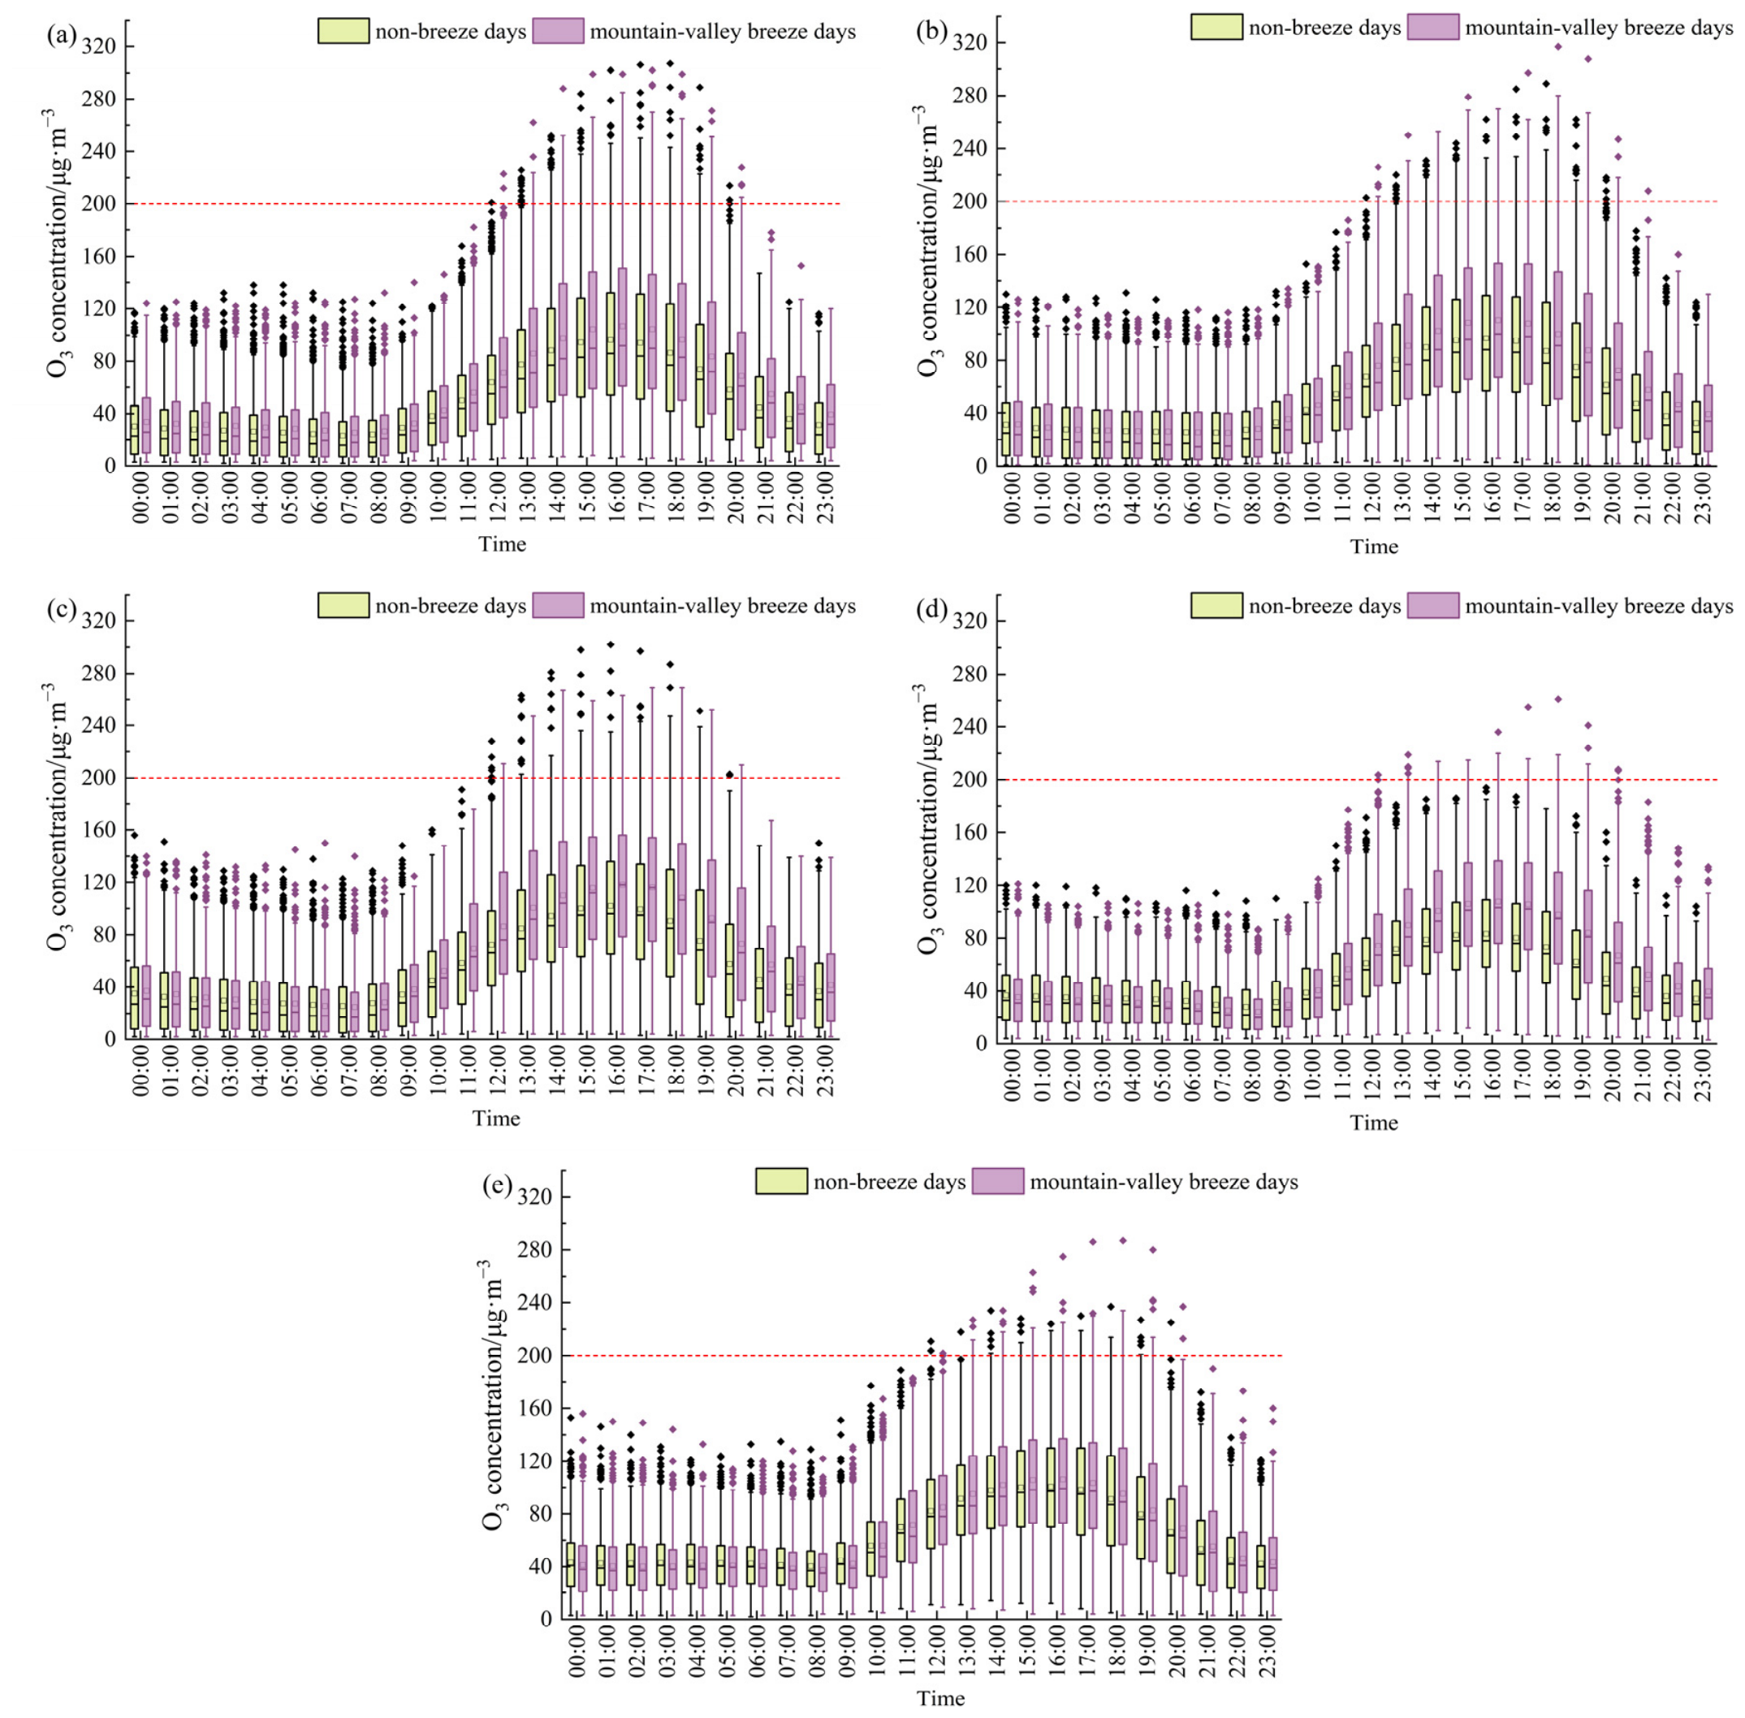
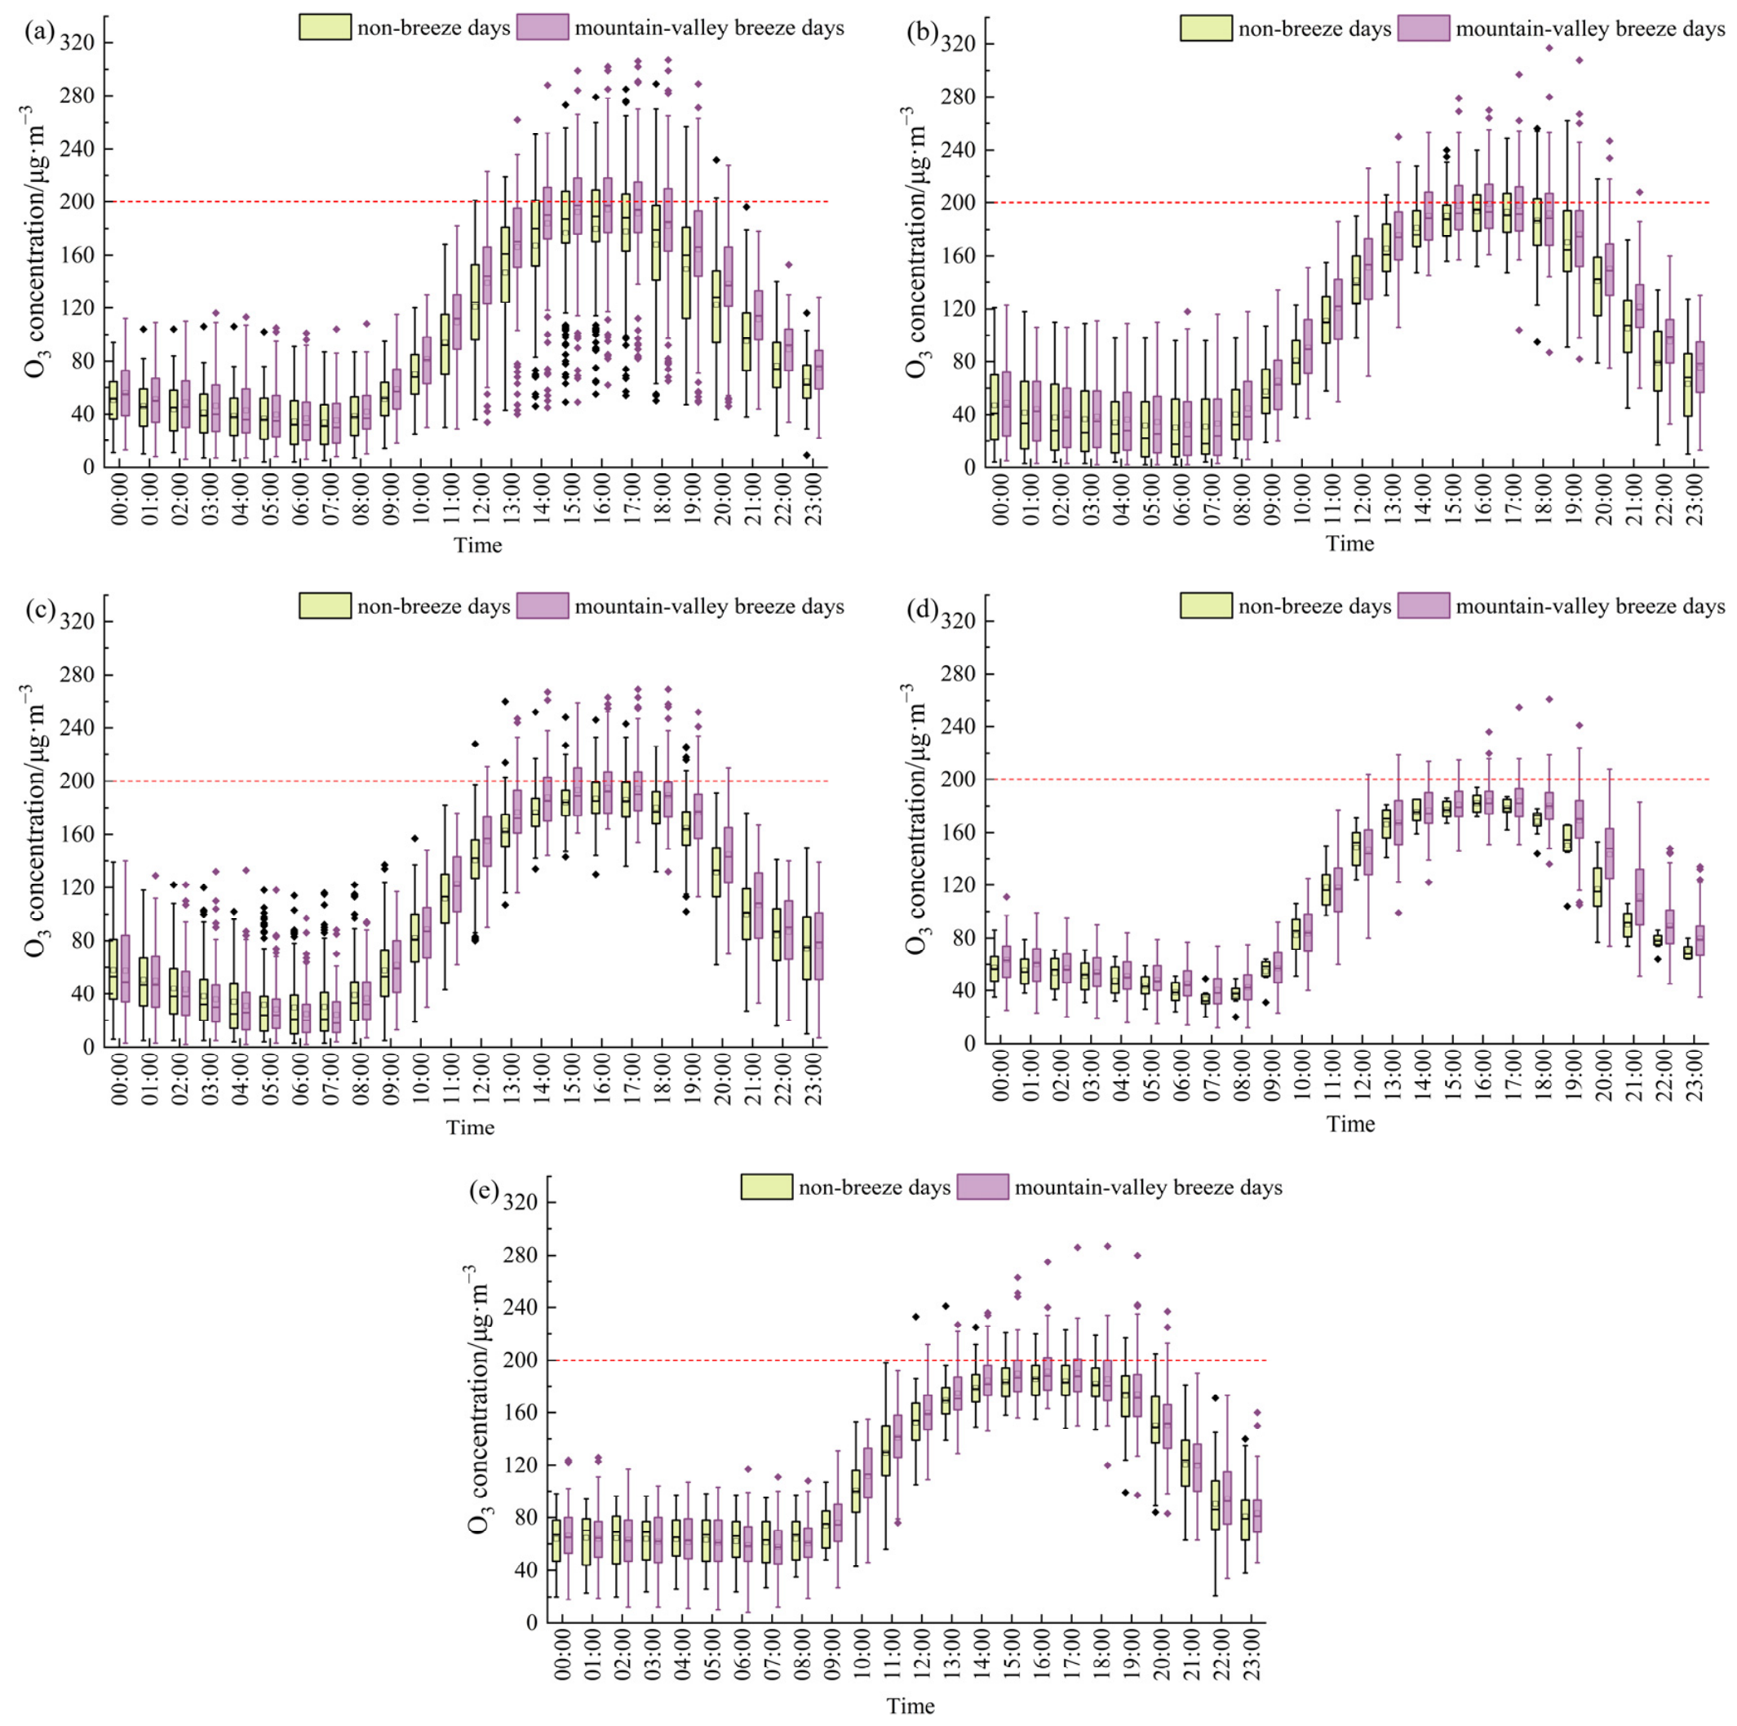

Disclaimer/Publisher’s Note: The statements, opinions and data contained in all publications are solely those of the individual author(s) and contributor(s) and not of MDPI and/or the editor(s). MDPI and/or the editor(s) disclaim responsibility for any injury to people or property resulting from any ideas, methods, instructions or products referred to in the content. |
© 2026 by the authors. Licensee MDPI, Basel, Switzerland. This article is an open access article distributed under the terms and conditions of the Creative Commons Attribution (CC BY) license.