


Abstract
Background: Lean management has been widely adopted, particularly in logistics operations. Achieving lean is not a discrete intervention but a continuous process of maturing in the integration of processes, work systems, and organizational capabilities within a coherent management philosophy. This maturation requires structured measurement instruments for tracking maturity progression. Although numerous lean maturity models (LMMs) have been proposed, none has achieved methodological standardization or acceptance as a measurement yardstick. Methods: This study addresses this gap by evaluating 27 qualified LMMs using a reproducibility-inspired assessment framework. The paper introduces the OVRGP framework (Opportunity, Validity, Reliability, Generalizability, and Process Integrity), comprising 17 rigor-based criteria. Independent raters with substantial lean expertise evaluated all 27 models using a six-point ordinal scale, achieving a pre-consensus inter-rater reliability of ICC(2,1) = 0.836. Results: Nine critical methodological weaknesses were identified, with average scores below 2.0 for criteria requiring empirical validation, structural integrity testing, and cross-context replication. Conclusions: The study offers targeted methodological guidelines for strengthening future LMM development in logistics and supply chain contexts, and introduces the OVRGP framework as a universal reference architecture for maturity model development across industries. It provides researchers, organizations, and consulting practitioners with a design reference standard for rigorous lean maturity instruments.
1. Introduction
Since its origins within Toyota in the 1950s, the Toyota Production System (TPS) has evolved into one of the most influential paradigms in operations management [1]. Its international diffusion accelerated following The Machine That Changed the World [2], which popularized the term “lean” [3]. Since then, lean has been embraced by almost every industry, and successful adaptation has given enterprises significant performance advantages [4,5]. However, sustained performance improvements depend not on isolated tool implementation but on systemic integration of processes, information flows, organizational routines, and leadership practices [6,7,8]. Structured instruments to assess the level of lean maturity are therefore essential. The literature is characterized by measures attempting to assess the impact of lean, yet most exhibit a dominant bias towards financial benefits [9,10], which are ill-equipped to measure constructs such as lean integration [11].
Recognizing this inherent research gap, many studies have attempted to measure the degree of lean integration, using terms such as leanness, lean adaptation level, and lean maturity level. These attempts are well documented by comprehensive systematic reviews [12,13,14]. Numerous lean maturity models (LMMs) have therefore been developed, yet despite their proliferation, no LMM has emerged as a methodological benchmark in academia or practice. While prior reviews have cataloged model content and structural configurations, little attention has been given to evaluating their methodological rigor, and no study has examined whether existing LMMs are fit-for-purpose as scientific measurement instruments. This gap is further compounded in logistics and supply chain contexts, where recent research increasingly frames performance as the result of integrated capability configurations spanning facilities and partners, suggesting that lean maturity assessment should evaluate systemic capability rather than isolated tools or short-term financial impacts [15,16,17,18]. Yet despite this strategic importance, no validated lean maturity model exists specifically designed for logistics and supply chain as an integrated organizational capability [19,20], and maturity models in this domain broadly suffer from limited validation and the absence of improvement guidelines [21].
This dual absence of a rigorous LMM evaluation framework generally, and of targeted methodological guidance for logistics and supply chain contexts specifically, represents the central research gap motivating this study. Without a rigorous evaluative framework, researchers will continue proposing new LMMs without a reference standard to design against, perpetuating the same methodological weaknesses across generations of models. No LMM will achieve benchmark status not for lack of effort, but because the structural reasons for failure remain undiagnosed. Logistics practitioners, meanwhile, will continue without a credible instrument to assess lean capability consistently across facilities, suppliers, and distribution partners. The study addresses this research gap through four research questions.
RQ1:
What criteria make a maturity model fit-for-purpose as a measurement instrument?
RQ2:
How do existing lean maturity models perform against these criteria?
RQ3:
What critical methodological weaknesses emerge from this evaluation?
RQ4:
How can future lean maturity models be improved when developing LMMs for logistics and supply chain industries?
To address these research questions, this study first systematically evaluates 27 LMMs against 17 rigor-based criteria derived from measurement theory and maturity model research. In doing so, it introduces the OVRGP framework as an integrated evaluative architecture, representing the first theoretical consolidation of these criteria into a single evaluation framework specifically designed for LMM development and assessment. Second, it derives targeted methodological recommendations to guide future LMM development for logistics and supply chain contexts, addressing the absence of rigorous, logistics-specific lean maturity frameworks identified in the literature. This study adopts a structured review and comparative evaluation design aligned with PRISMA guidelines. RQ1 is addressed through the synthesis of formative measurement theory and maturity model design literature, culminating in the derivation of 17 evaluation criteria grouped under the OVRGP framework. RQ2 and RQ3 are addressed through the systematic comparative evaluation of 27 eligible LMMs against these criteria, using a structured procedure documented in Section 3.1 through Section 3.6. RQ4 is addressed through the analytical synthesis of identified weaknesses and the formulation of targeted improvement recommendations. The first three research questions are addressed at the cross-industry level, as methodological rigor requirements for measurement instruments are independent of industry context. RQ4 narrows to logistics and supply chain contexts to ensure the derived recommendations deliver focused and actionable guidance for a domain where lean maturity assessment remains critically underdeveloped. The study adopts a pragmatic research philosophy, combining qualitative theoretical synthesis with structured empirical evaluation to address a practical and unresolved problem in the lean maturity literature. The resulting framework and recommendations are designed to be immediately useful for researchers, practitioners, and policymakers, while simultaneously establishing the methodological foundations that future studies will require to empirically validate lean maturity models through more positivist approaches.
2. Literature Review
Since the mid-1990s, research has proposed diverse approaches to measure lean [22,23]. Some studies operationalize lean through bundles of practices (e.g., pull systems, 5S), others infer leanness from performance outcomes (e.g., lead time, inventory, set-up time, cost), and a third stream combines enablers and outcomes within composite indices. Systematic reviews document a large and fragmented landscape of these approaches [12,13,14]. A widely used distinction classifies them into: (i) outcome-based assessments, which evaluate improvements achieved after lean implementation (e.g., reductions in lead time, inventories), and (ii) implementation/capability-based assessments, which gauge the degree to which lean principles and practices are embedded [13]. Outcome-based approaches, while useful for reporting purposes, cannot distinguish whether improvements resulted from lean integration or other operational factors. This limitation justifies the existence and continued development of capability-based lean maturity models. However, many such instruments under-specify lean as a multidimensional capability and therefore struggle to capture the systemic integration required for lean to translate into stable, repeatable performance [5,24,25]. Rather than critically evaluating individual models, which is addressed comprehensively through the research questions in Section 4 and Section 5, this literature review establishes the appropriate theoretical measurement model for lean maturity, derives the criteria an LMM should satisfy as a rigorous measurement instrument, critically discusses persistent methodological weaknesses in maturity model development, and identifies the specific gap in logistics and supply chain contexts.
2.1. Specification of the Measurement Model
We conceptualize lean maturity as an abstract latent construct assessed through observable indicators reflecting the extent of lean principle adoption and routinization. Following measurement theory, we argue lean maturity should be modeled formatively: indicators cause the maturity construct rather than reflect it [26,27]. This logic matches lean transformation practice: improvements in selected indicators (e.g., pull replenishment discipline, standardized problem solving, visual performance management, supplier coordination routines) can increase maturity even when other areas remain less developed. Conversely, removing essential indicators can dilute the meaning of “maturity.” Despite its implications for validity testing and interpretation, explicit specification of formative versus reflective logic remains uncommon in LMM studies (with few exceptions such as Leyer and [28]).
2.2. What Criteria Should Maturity Models Satisfy as Measurement Instruments?
This section explores different theoretical criteria MMs should meet to satisfy their purpose as measurement instruments. The fundamental assumption behind MMs is that performance can be improved when the included indicators are improved [29]. This implies the need to establish a clear cause-and-effect relationship between the indicators of an MM and defined outcomes, specifying the business benefits expected when indicators are improved [30,31,32]. Without clarity on desirability, developing an MM becomes meaningless. Among the LMMs, Karlsson and Åhlström [4] and Abdi [33] clearly explain how assessment leads to business improvements, whereas many studies merely state academic relevance and fail to specify business desirability (e.g., [34,35,36]).
2.2.1. Opportunity—Desirability, Scope, Target Group, and Outcome Measures
Lean maturity, as argued earlier, is an abstract latent construct that should be modeled formatively. Given the direction of causality from indicators to the construct, internal consistency is inappropriate for assessing suitability [37]. Instead, validity requires examining how well the construct relates to other variables [37] (p. 333). Diamantopoulos and Winklhofer [26] recommend using an external criterion variable to assess the external validity of formative models. Accordingly, LMMs should specify clear outcome measures derived from their stated business desirability. Some studies comply (e.g., [36,38]), whereas many fail to specify outcome measures (e.g., [33,39,40,41]). A clear definition of the capability domain is critical, as it establishes boundaries for components and indicators [30,42]. Lean has often been interpreted inconsistently, and many LMMs omit explicit scope definition (e.g., [24,43,44]), though some define it clearly (e.g., [4,45,46,47]). Given the complexity of capability domains, the target group must be clearly defined [42]. Defining the target group clarifies the source of information and rater qualifications [30,42]. Some LMMs clearly define target groups (e.g., [25,48]), whereas others do not (e.g., [47,49,50]). When opportunity criteria are absent, the model lacks a defined purpose and the foundation for all subsequent validity and reliability testing collapses.
2.2.2. Validity—Content Specification, Indicator Specification, Construct Validity, and Structural Integrity
Diamantopoulos and Winklhofer [26] outline four criteria for formative validity. First, content specification requires comprehensive coverage within defined domain boundaries. Exclusion of components results in incomplete representation [26,37,51]. Domain components should therefore be clearly specified and justified ([42,52]). Some studies comply (e.g., [22,45]), while others fail to justify inclusion (e.g., [44,48,49]). Second, indicator specification requires coverage of the full breadth of content and theoretically justified linkage to outcome measures [26,27,52,53]. Literature synthesis and expert input support this criterion. Some LMMs justify indicator inclusion (e.g., [35,45]), whereas many do not (e.g., [34,49,50,54]). Third, indicator collinearity may create instability. While variance inflation factor (VIF) is often used to eliminate highly collinear indicators [55], Bollen and Lennox [27] argue that purely statistical elimination may reduce construct meaning. Organizational constructs inevitably involve interdependencies [56]. Accordingly, we do not propose collinearity elimination as a criterion. Fourth, external validity requires meaningful theoretical linkage between indicators and the construct [26,37]. Use of external criterion variables within a MIMIC framework is recommended [57,58]. However, construct validity requires more than specification: upward movement in maturity levels must result in incremental improvements in defined outcomes. Theoretical justification may rely on literature and expert synthesis [42], but empirical construct validity requires longitudinal evidence [59,60]. Many LMMs lack such testing (e.g., [33,34,40,61]). Some claim validation without evidence (e.g., [4,48]). Others compare maturity levels cross-sectionally (e.g., [36,62]), but longitudinal statistical proof remains absent. Structural integrity further contributes to validity. Domain components and indicators should be mutually exclusive and collectively exhaustive (MECE) [42,63]. Overlaps are common (e.g., [34,41,49]). Testing for MECE through theoretical review or expert opinion is therefore essential. When validity criteria are unmet, the maturity scores produced by an LMM cannot be trusted to reflect actual lean capability, making cross-organizational comparison meaningless.
2.2.3. Reliability—Observability, Responsiveness, Language Adequacy, Administrative Procedure, and Repeatability and Reproducibility
Five criteria are critical for reliability: observability, responsiveness, language adequacy, clarity of administrative procedure, and repeatability and reproducibility (R&R). Indicators should be observable to minimize interpretation bias and improve inter-rater reliability [64,65,66]. Some studies use observable metrics (e.g., [4,67]), while others provide insufficient evidence (e.g., [34,36]). Responsiveness refers to the ability to detect change over time [52]. Clear stage definitions enhance responsiveness [31,63,68]. Most LMMs rely on Likert scales, limiting responsiveness, though exceptions exist (e.g., [22,44,47,48,62,69]). Language adequacy strengthens reliability and should be pretested [70,71]. Few studies report such testing (e.g., [24,67]). Administrative procedures should also be clearly specified [63]. Only a minority provide detailed guidance (e.g., [22,25,34,48]). Collectively, these criteria contribute to R&R. Formal R&R testing using Gage R&R [72] or Kappa statistics [73,74] is recommended, yet rarely implemented. Kumar et al. [50] conduct sensitivity analysis, but comprehensive R&R testing is largely absent. When reliability criteria are not met, different raters applying the same model to the same organization will produce different scores, making the instrument unusable for consistent capability tracking or inter-organizational benchmarking.
2.2.4. Generalizability—Proximal Similarity and Cross-Context Validation
Generalizability refers to applicability beyond the original context. Developers should specify proximal contexts [75] and provide thick descriptions [76,77]. True generalizability requires successful application in new contexts with demonstrated improvements [42]. While some studies specify context (e.g., [43,45,61,67,69]), none demonstrate validated cross-context improvements. Nightingale and Mize [48] claim broader results without evidence. Without demonstrated generalizability, an LMM remains a single-context instrument whose findings cannot be transferred, compared, or built upon—severely limiting its value as a reference standard for the field.
2.2.5. Process Integrity—Design Justification and Continuous Improvement
Process integrity requires transparent design justification and evidence of continuous improvement [42,78,79]. Some studies reference design principles (e.g., [22,31,47]), but many provide minimal methodological justification (e.g., [35,38,62]). Evidence of iterative refinement remains limited, with few examples of testing and revision (e.g., [4,48,54,80]). When process integrity is absent, the credibility of the model’s design cannot be independently verified—making its theoretical soundness difficult to assess or replicate.
2.3. Persistent Methodological Weaknesses in Maturity Model Development
Although the number of published maturity models has risen sharply since the CMM [81], they have been consistently criticized for lacking theoretical rigor and empirical evidence of achieving desired outcomes [31,32,78,82,83]. Santos-Neto and Costa [32] report that of journal-published maturity models between 1973 and 2018, only 3% were empirically validated, and only 10% demonstrated real-world application. Wendler [79] further notes that maturity models with proven usefulness remain scarce, and that many have not disclosed the methodological approach taken in their design. While a substantial body of systematic reviews exists [32,60,79,84,85] and standard design processes have been proposed [42,78], studies providing comprehensive design principles and evaluation criteria remain rare [31,86].
2.4. Lean Maturity in Logistics and Supply Chain: An Underdeveloped Research Frontier
Lean management has been widely recognized as a critical organizational capability in logistics and supply chain contexts, where sustained performance improvements depend on the systemic integration of processes, information flows, and operational routines across facilities and partners [6,7,8]. Recent logistics research increasingly frames performance as the result of capability configurations and integration mechanisms spanning facilities and partners, particularly under digital transformation, resilience, and sustainability pressures [15,16,17,18]. Despite this strategic importance, the development of rigorous lean maturity assessment instruments for logistics and supply chain contexts remains severely underdeveloped. Soares et al. [19] explicitly confirm that no validated lean maturity model existed in the supply chain management context using rigorous measurement approaches at the time of their study. Ferraro et al. [21] further demonstrate that maturity models in supply chain management and logistics broadly suffer from limited validation and the absence of comprehensive improvement guidelines. A comprehensive review of lean applications in supply chain management between 2012 and 2024 reveals that existing studies are overwhelmingly focused on isolated SCM activities such as warehouse processes, logistics cost reduction, and manufacturing operations, with no study proposing a lean maturity model designed for logistics and supply chain as an integrated organizational capability [20]. This absence of a rigorous, logistics-specific lean maturity framework directly justifies the recommendations in Section 5.5 of this study.
3. Research Methods
This study is theoretically grounded in formative measurement theory as established in Section 2.1 and in the evaluation criteria derived in Section 2.2, which together constitute the theoretical model informing the research design. To operationalize this foundation, the study first identifies and screens qualifying lean maturity models through a systematic PRISMA-guided search, derives a theoretically anchored evaluation framework through a structured two-stage synthesis process, and applies this framework through a rigorous multi-rater scoring procedure to generate the empirical basis for addressing the four research questions.
3.1. Data Sources and Search Criteria
A systematic search was conducted across four electronic databases: Web of Science, Scopus, SpringerLink, and ScienceDirect. While Web of Science and Scopus are broad indexing databases, SpringerLink and ScienceDirect are publisher platforms and may introduce some coverage bias toward their respective publishing ecosystems. This is acknowledged as a limitation. However, given that the lean maturity model literature is concentrated in operations management and production research journals predominantly indexed across these four databases, the risk of missing qualifying models is considered low. Furthermore, the analytical objective of this study, ‘identifying systematic methodological weaknesses across the LMM landscape,’ is robust to marginal variation in sample size, as the structural patterns identified are unlikely to be reversed by the addition of a small number of models from supplementary sources.
The search was performed using the following executable string, applied across title, abstract, and keyword fields:
(“lean maturity model” OR “degree of leanness” OR “measuring lean adaptation” OR “measuring lean integration” OR “measuring lean level”).
The keyword strategy was designed to directly target studies that explicitly conceptualize and measure the degree of lean implementation, which is the defining characteristic of a maturity-based measurement instrument. The five phrases used collectively cover the core terminology through which lean maturity measurement has been operationalized in the academic literature since 1988. The possibility that a small number of qualifying studies using different terminology were missed is acknowledged as a limitation. Given the consistency of findings across all 27 evaluated models, however, the structural patterns identified are considered robust to marginal variation in sample composition.
3.2. Eligibility Criteria
Studies were included if they:
- Were published in peer-reviewed academic journals, ensuring minimum standards of methodological transparency and scholarly scrutiny consistent with PRISMA-based systematic review practice [87].
- Proposed or substantially developed a structured lean measurement model, reflecting the requirement that maturity models possess defined architectural components, including domain decomposition and scaling logic [42,63].
- Assessed the degree of lean implementation or maturity, rather than only performance outcomes, consistent with the implementation/capability-based assessment category identified in the lean measurement literature [13].
- Contained sufficient methodological detail to evaluate model design and structure, as evaluation against the OVRGP criteria requires minimum reportable evidence of design decisions, indicator specification, and validation procedures [31,63].
Studies were excluded if they:
- Were conference papers, books, book chapters, or non-peer-reviewed publications, as these formats do not provide the level of methodological reporting required for rigorous comparative evaluation [87].
- Measured lean solely through outcome indicators (e.g., cost reduction, lead-time improvement) without assessing implementation maturity, as outcome-only measures do not capture the embedded capability configurations that distinguish maturity-based assessment from performance reporting [13,24].
- Reused existing lean measurement models without significant methodological modification, as inclusion of derivative instruments without independent design contribution would inflate model count without adding evaluative variance [42].
Because terminology varies (e.g., leanness, lean adaptation level, lean integration), models were not excluded solely based on naming conventions.
3.3. Screening and Selection Process
The study selection followed four sequential stages consistent with PRISMA logic [87].
- Identification: Records retrieved from the four databases were compiled, and duplicates were removed.
- Screening: Titles and abstracts were screened to remove clearly irrelevant studies.
- Eligibility: Full-text articles were assessed against inclusion and exclusion criteria.
- Final inclusion: Studies meeting all criteria were retained for detailed evaluation.
An additional structural screening step was conducted to ensure conceptual alignment with the maturity model architecture. To qualify as a lean maturity model (LMM), the study had to demonstrate:
- A first-level construct decomposition (domain components), as maturity models require explicit domain-level structuring to enable meaningful capability differentiation and evaluation [42,63].
- Clearly specified indicators under each domain component, as indicator specification is a minimum requirement for formative measurement instruments to ensure content coverage and construct interpretability [26,63].
- A scaling mechanism reflecting the degree of implementation or maturity progression, as the presence of an explicit scaling logic is the defining architectural feature that distinguishes maturity models from simple assessment checklists [31,63].
Following this process, 27 lean maturity models were retained for analysis.
3.4. Development of the Evaluation Framework (OVRGP) and Embedded Risk-of-Bias Logic
To address RQ1, criteria were derived through a two-stage process. First, a thematic synthesis was conducted across the measurement theory, formative index construction, organizational capability measurement, and maturity model design literature. Source texts were read iteratively and statements specifying what a rigorous measurement instrument or maturity model should demonstrate were extracted and coded into emerging themes. Second, each resulting criterion was traced back to specific source literature to verify theoretical grounding and eliminate criteria that could not be anchored in established measurement or maturity model design principles. This process yielded 17 criteria, which were then consolidated and grouped into five higher-order dimensions based on their conceptual relatedness, termed the OVRGP framework:
- ○
- Opportunity;
- ○
- Validity;
- ○
- Reliability;
- ○
- Generalizability;
- ○
- Process Integrity.
The framework comprises 17 criteria distributed across these five dimensions. Importantly, rather than treating risk of bias as a separate assessment layer, this study integrates risk-of-bias logic directly into the OVRGP structure. Each dimension captures specific forms of methodological bias that may systematically distort maturity assessment.
- OVRGP Dimensions as Bias Domains
Each dimension addresses a distinct category of potential bias:
- Opportunity (Purpose and Desirability Bias)Evaluates whether the model clearly specifies its intended logistics or supply chain value creation purpose.Bias risk: Absence of explicit business or operational desirability may result in normative or purely academic framing bias, limiting practical relevance.
- Validity (Conceptual and Construct Bias)Assesses content specification, indicator justification, formative measurement logic, and linkage to external outcome variables.Bias risk: Weak domain boundary definition, incomplete indicators, or lack of empirical construct validation introduces construct validity bias.
- Reliability (Measurement and Administration Bias)Examines observability, responsiveness, language adequacy, administrative clarity, and repeatability/reproducibility (R&R).Bias risk: Ambiguous indicators, inconsistent rating procedures, or absence of inter-rater testing increase measurement and rater bias.
- Generalizability (Context and Transferability Bias)Evaluates contextual boundary definition and evidence supporting applicability beyond the original setting.Bias risk: Overgeneralization without contextual specification introduces external validity bias.
- Process Integrity (Design and Reporting Bias)Assesses transparency of development methodology, justification of design choices, and evidence of iterative refinement.Bias risk: Limited methodological transparency or absence of refinement evidence introduces reporting and design bias.
3.5. Data Extraction, Evaluation, and Embedded Bias Assessment
For each of the 27 included lean maturity models, qualitative evidence was extracted and organized in a structured evaluation matrix (27 models × 17 criteria). Extracted elements included:
- ○
- Model purpose and scope;
- ○
- Domain component definition;
- ○
- Indicator selection and justification;
- ○
- Scaling logic and maturity progression;
- ○
- Validation procedures;
- ○
- Reliability testing;
- ○
- Evidence of contextual specification;
- ○
- Documentation of design and refinement processes.
Each model was rated using a six-point ordinal scale (0–5) for every criterion. Equal weighting was applied across all 17 criteria, reflecting the theoretical position that each criterion represents a necessary and non-substitutable requirement for fit-for-purpose maturity model design. Assigning differential weights would require empirical evidence that certain criteria contribute more to overall model quality than others, evidence that does not currently exist in the maturity model design literature. Equal weighting is therefore the most theoretically neutral and defensible approach given the current state of knowledge [42,63].
Simultaneously, risk-of-bias interpretation was embedded in the scoring logic:
- ○
- Scores of 0–1 typically reflected a high risk of bias within the relevant OVRGP dimension.
- ○
- Scores of 2–3 indicated a moderate risk of bias due to partial fulfillment.
- ○
- Scores of 4–5 indicated low risk of bias supported by clear methodological evidence.
Thus, bias levels were inferred directly from criterion-level compliance rather than assessed separately.
Three raters, each with substantial lean experience as a practitioner, published researcher, and senior academic, evaluated all 27 models independently against the 17 OVRGP criteria using the six-point ordinal scale. Pre-consensus ratings yielded an Intraclass Correlation Coefficient (ICC(2,1)) of 0.836, indicating good inter-rater reliability [88]. Disagreements were concentrated primarily in the Opportunity dimension, where the subjective nature of desirability and outcome specification judgments is most pronounced, with score differences in one rating point in most cases and two points in isolated instances. All disagreements were resolved through structured discussion and re-examination of the original publications until full consensus was achieved. Equal weighting was applied across all 17 criteria, as no empirical basis exists in the maturity model literature for differential criterion weighting [42,63].
3.6. Synthesis and Interpretation
The integrated OVRGP–bias framework enables:
- ○
- Comparative performance assessment across models (RQ2);
- ○
- Identification of systematically high-bias domains (RQ3);
- ○
- Development of targeted methodological recommendations for logistics and supply chain industries (RQ4).
Rather than excluding studies based on bias, the framework interprets bias patterns as structural characteristics of the current LMM landscape. This approach supports constructive advancement of maturity model design in logistics and supply chain research.
4. What Criteria Make a Lean Maturity Model Fit-for-Purpose? The OVRGP Framework
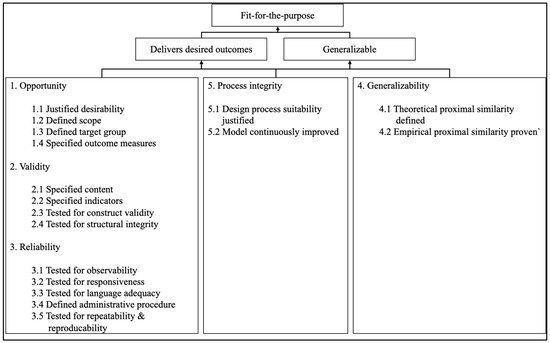
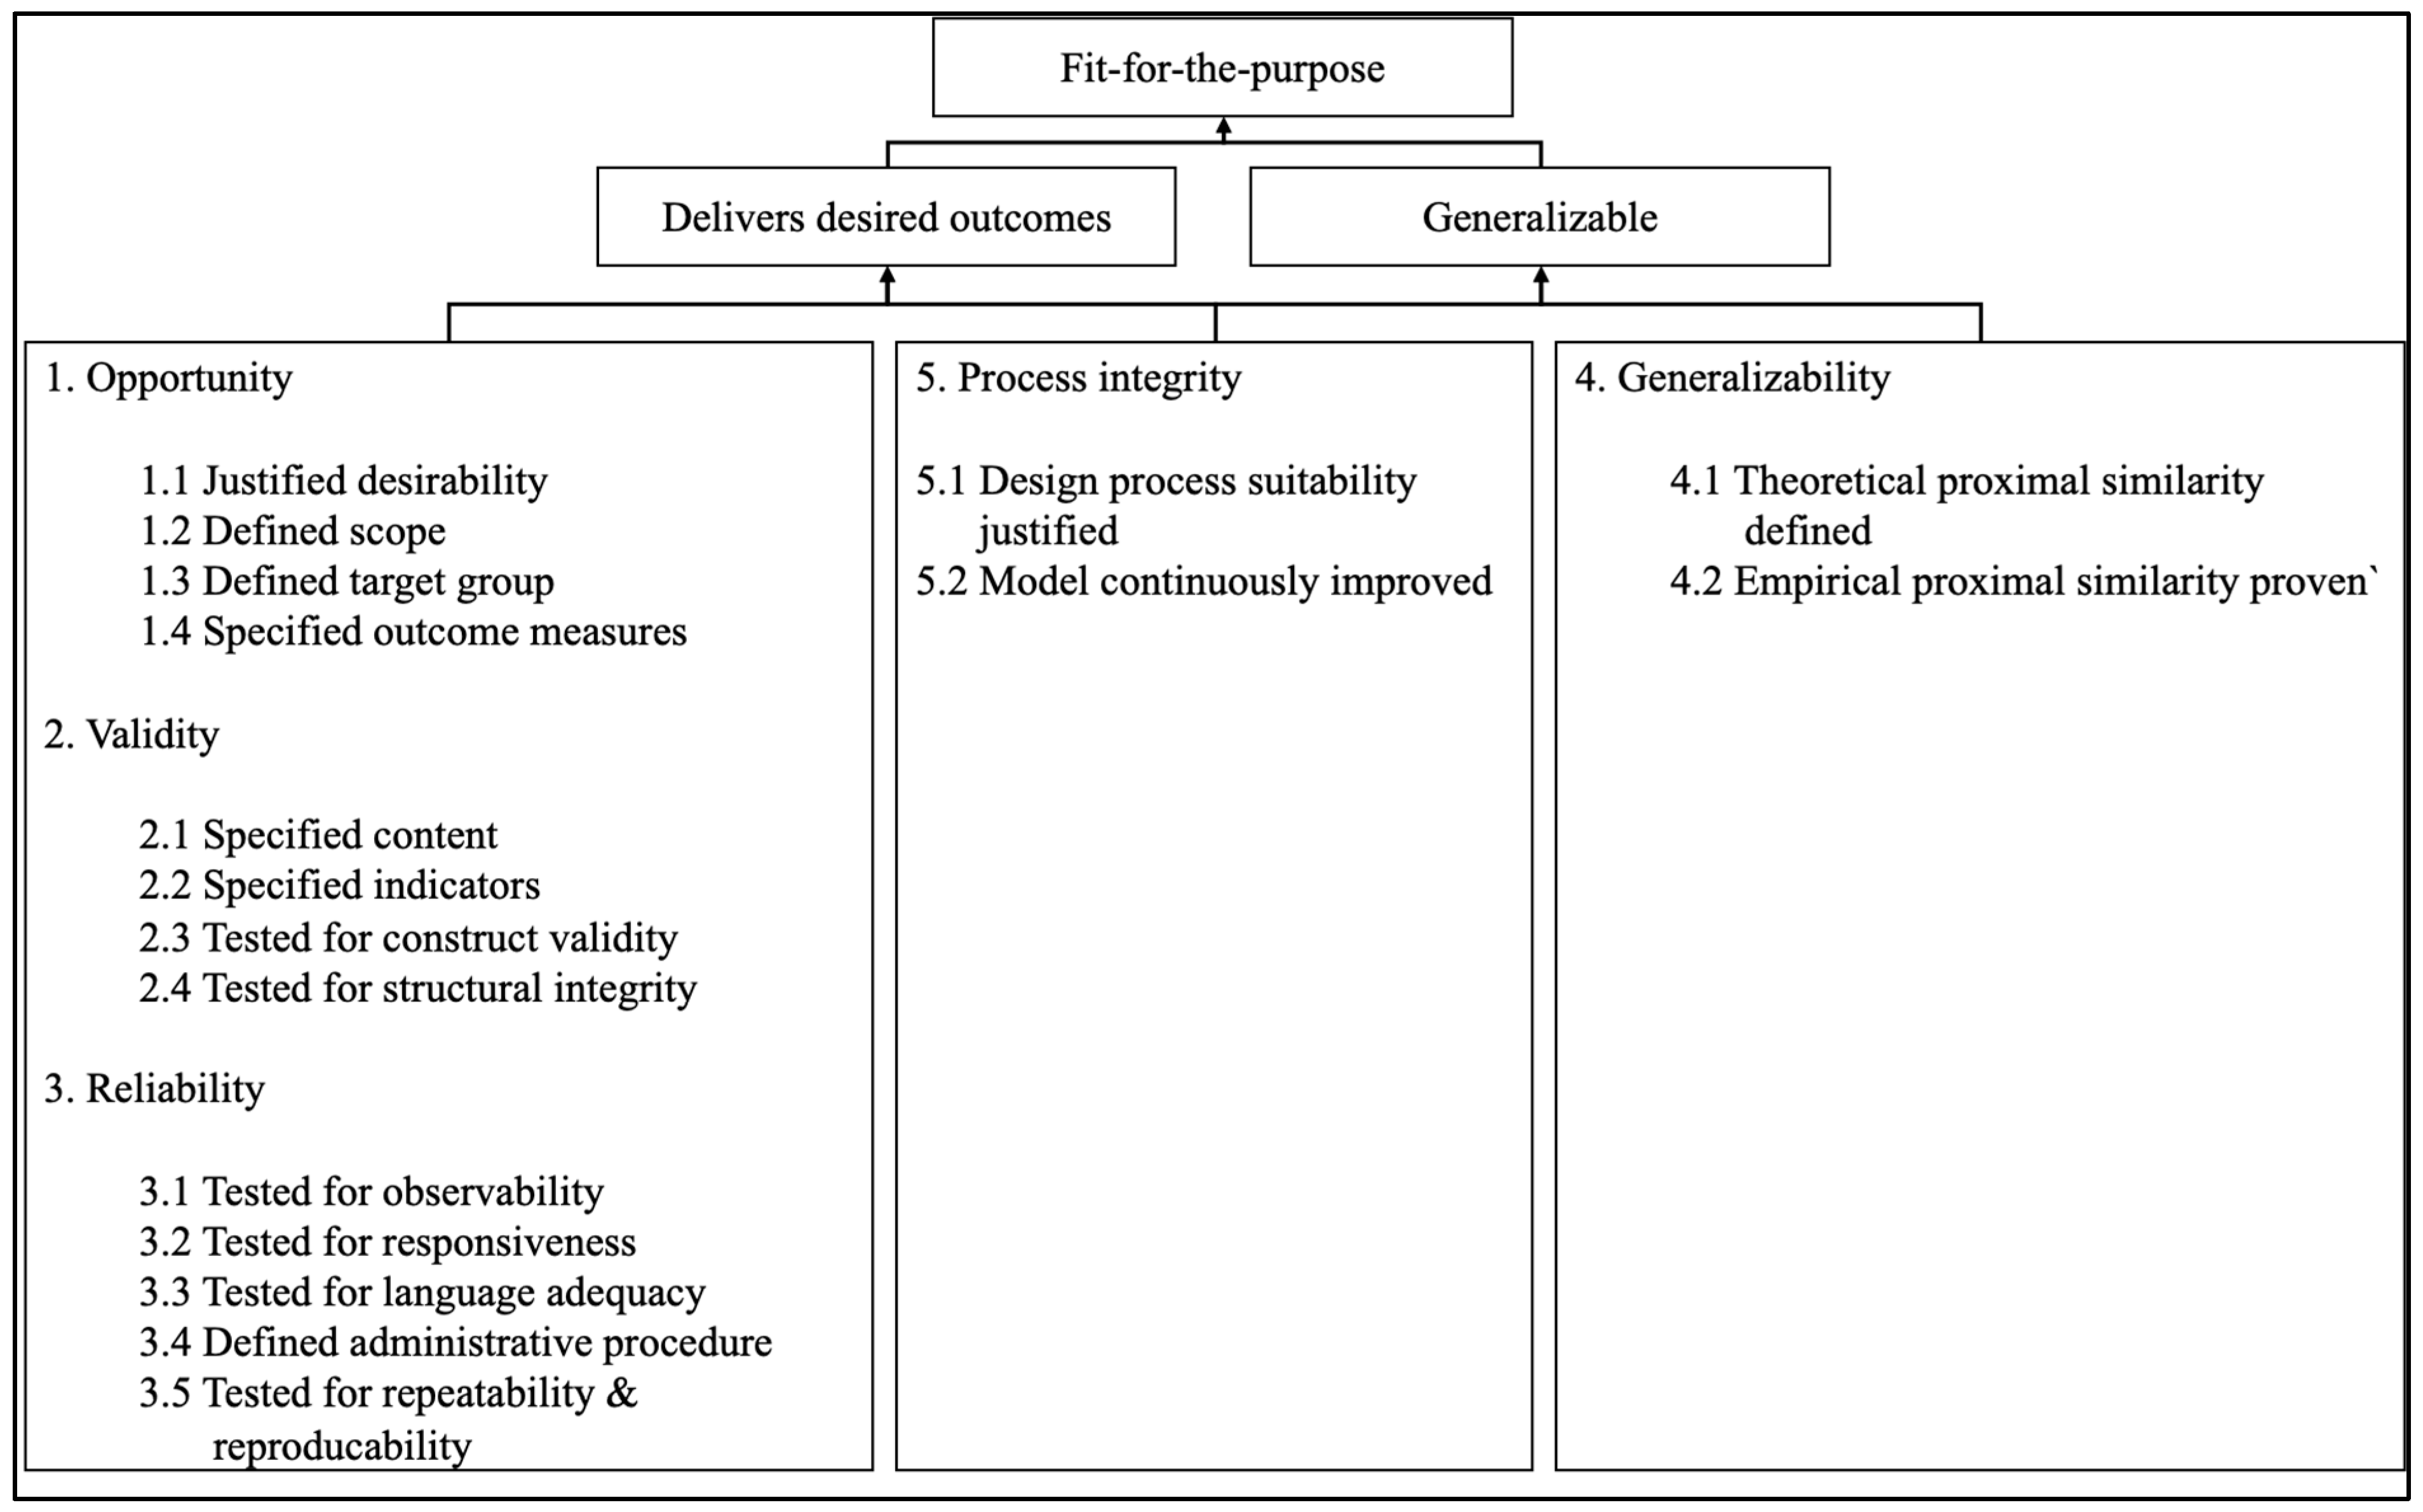
This section addresses RQ1 by introducing the OVRGP framework as the integrated evaluative architecture derived from the theoretical and measurement literature reviewed in Section 2.1 and Section 2.2. The criteria discussed in the literature review are summarized within a conceptual model (Figure 1) and listed in Table 1 with specific attributes to be fulfilled. We define the combined quality achieved by fulfilling these criteria as the fit-for-purpose of an MM. Broadly, for an MM to be fit-for-purpose, it should satisfy two fundamental attributes. First, it should be capable of delivering the desired outcomes within the selected context, meaning it must statistically demonstrate that improved maturity in the selected capability leads to improvements in defined outcomes. Second, it should be generalizable within defined proximal contexts. For an LMM, this implies that the instrument can statistically capture whether maturing in lean management results in improvements in defined outcomes such as customer satisfaction, lead time, or waste reduction, and that similar relationships can be demonstrated in comparable settings such as similar industries.
Figure 1.
OVRGP conceptual framework (maturity model evaluation criteria).
Table 1.
OVRGP list of criteria.
As illustrated in Figure 1, the ability of an MM to achieve desired outcomes emerges from the combined fulfillment of opportunity, validity, and reliability. These three dimensions are not independent and form a logical dependency chain. Opportunity ensures a clear need, defined scope, specified target group, and explicit outcome variables. These criteria form the foundation for all others. Without defined outcome variables, cause-and-effect relationships cannot be established when testing construct validity; without a defined scope, accurate content and indicator specification are not possible. Validity ensures that the instrument measures what it intends to measure and that its structure allows meaningful correlation between input and output variables, thereby enabling construct validity. Reliability, in turn, depends on validity. An instrument that is not validly specified cannot be meaningfully tested for repeatability and reproducibility, as consistent measurement of a poorly defined construct produces consistently misleading results. Reliability, therefore, requires a validly specified instrument as its prerequisite, and builds upon it through repeatability and reproducibility, supported by observable indicators, unambiguous language, clearly defined administrative procedures, and a responsive measurement scale with explicit maturity stage definitions. Generalizability requires the specification of proximally similar contexts in which the MM can be applied. True reusability is achieved only when empirical construct validity is demonstrated within these defined contexts. Finally, a scientifically credible MM should clearly justify the design process used and document how lessons learned have been incorporated into the published model.
5. Evaluation Results: LMM Performance, Critical Weaknesses, and Improvement Recommendations
This section addresses RQ2, RQ3, and RQ4 using the ratings derived from the systematic evaluation of the 27 selected lean maturity models as described in Section 3. The analysis proceeds in four stages. It first examines the overall performance of all 27 models against the 17 OVRGP criteria, before isolating the highest performing model to understand what enabled its relative strength and where its limitations remain. Cross-model patterns are then analyzed to establish whether the identified weaknesses are structural and field-wide rather than model-specific. The nine criteria recording the lowest average scores are subsequently identified as critical methodological weaknesses, and the section concludes with targeted recommendations to guide future lean maturity model development in logistics and supply chain contexts.
5.1. RQ2—How Do the LMMs Perform Against the OVRGP Criteria?
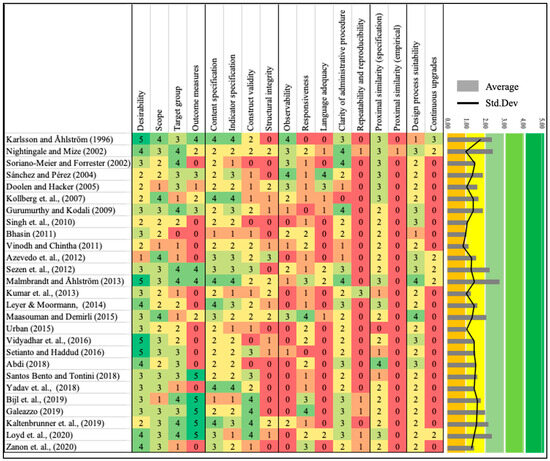
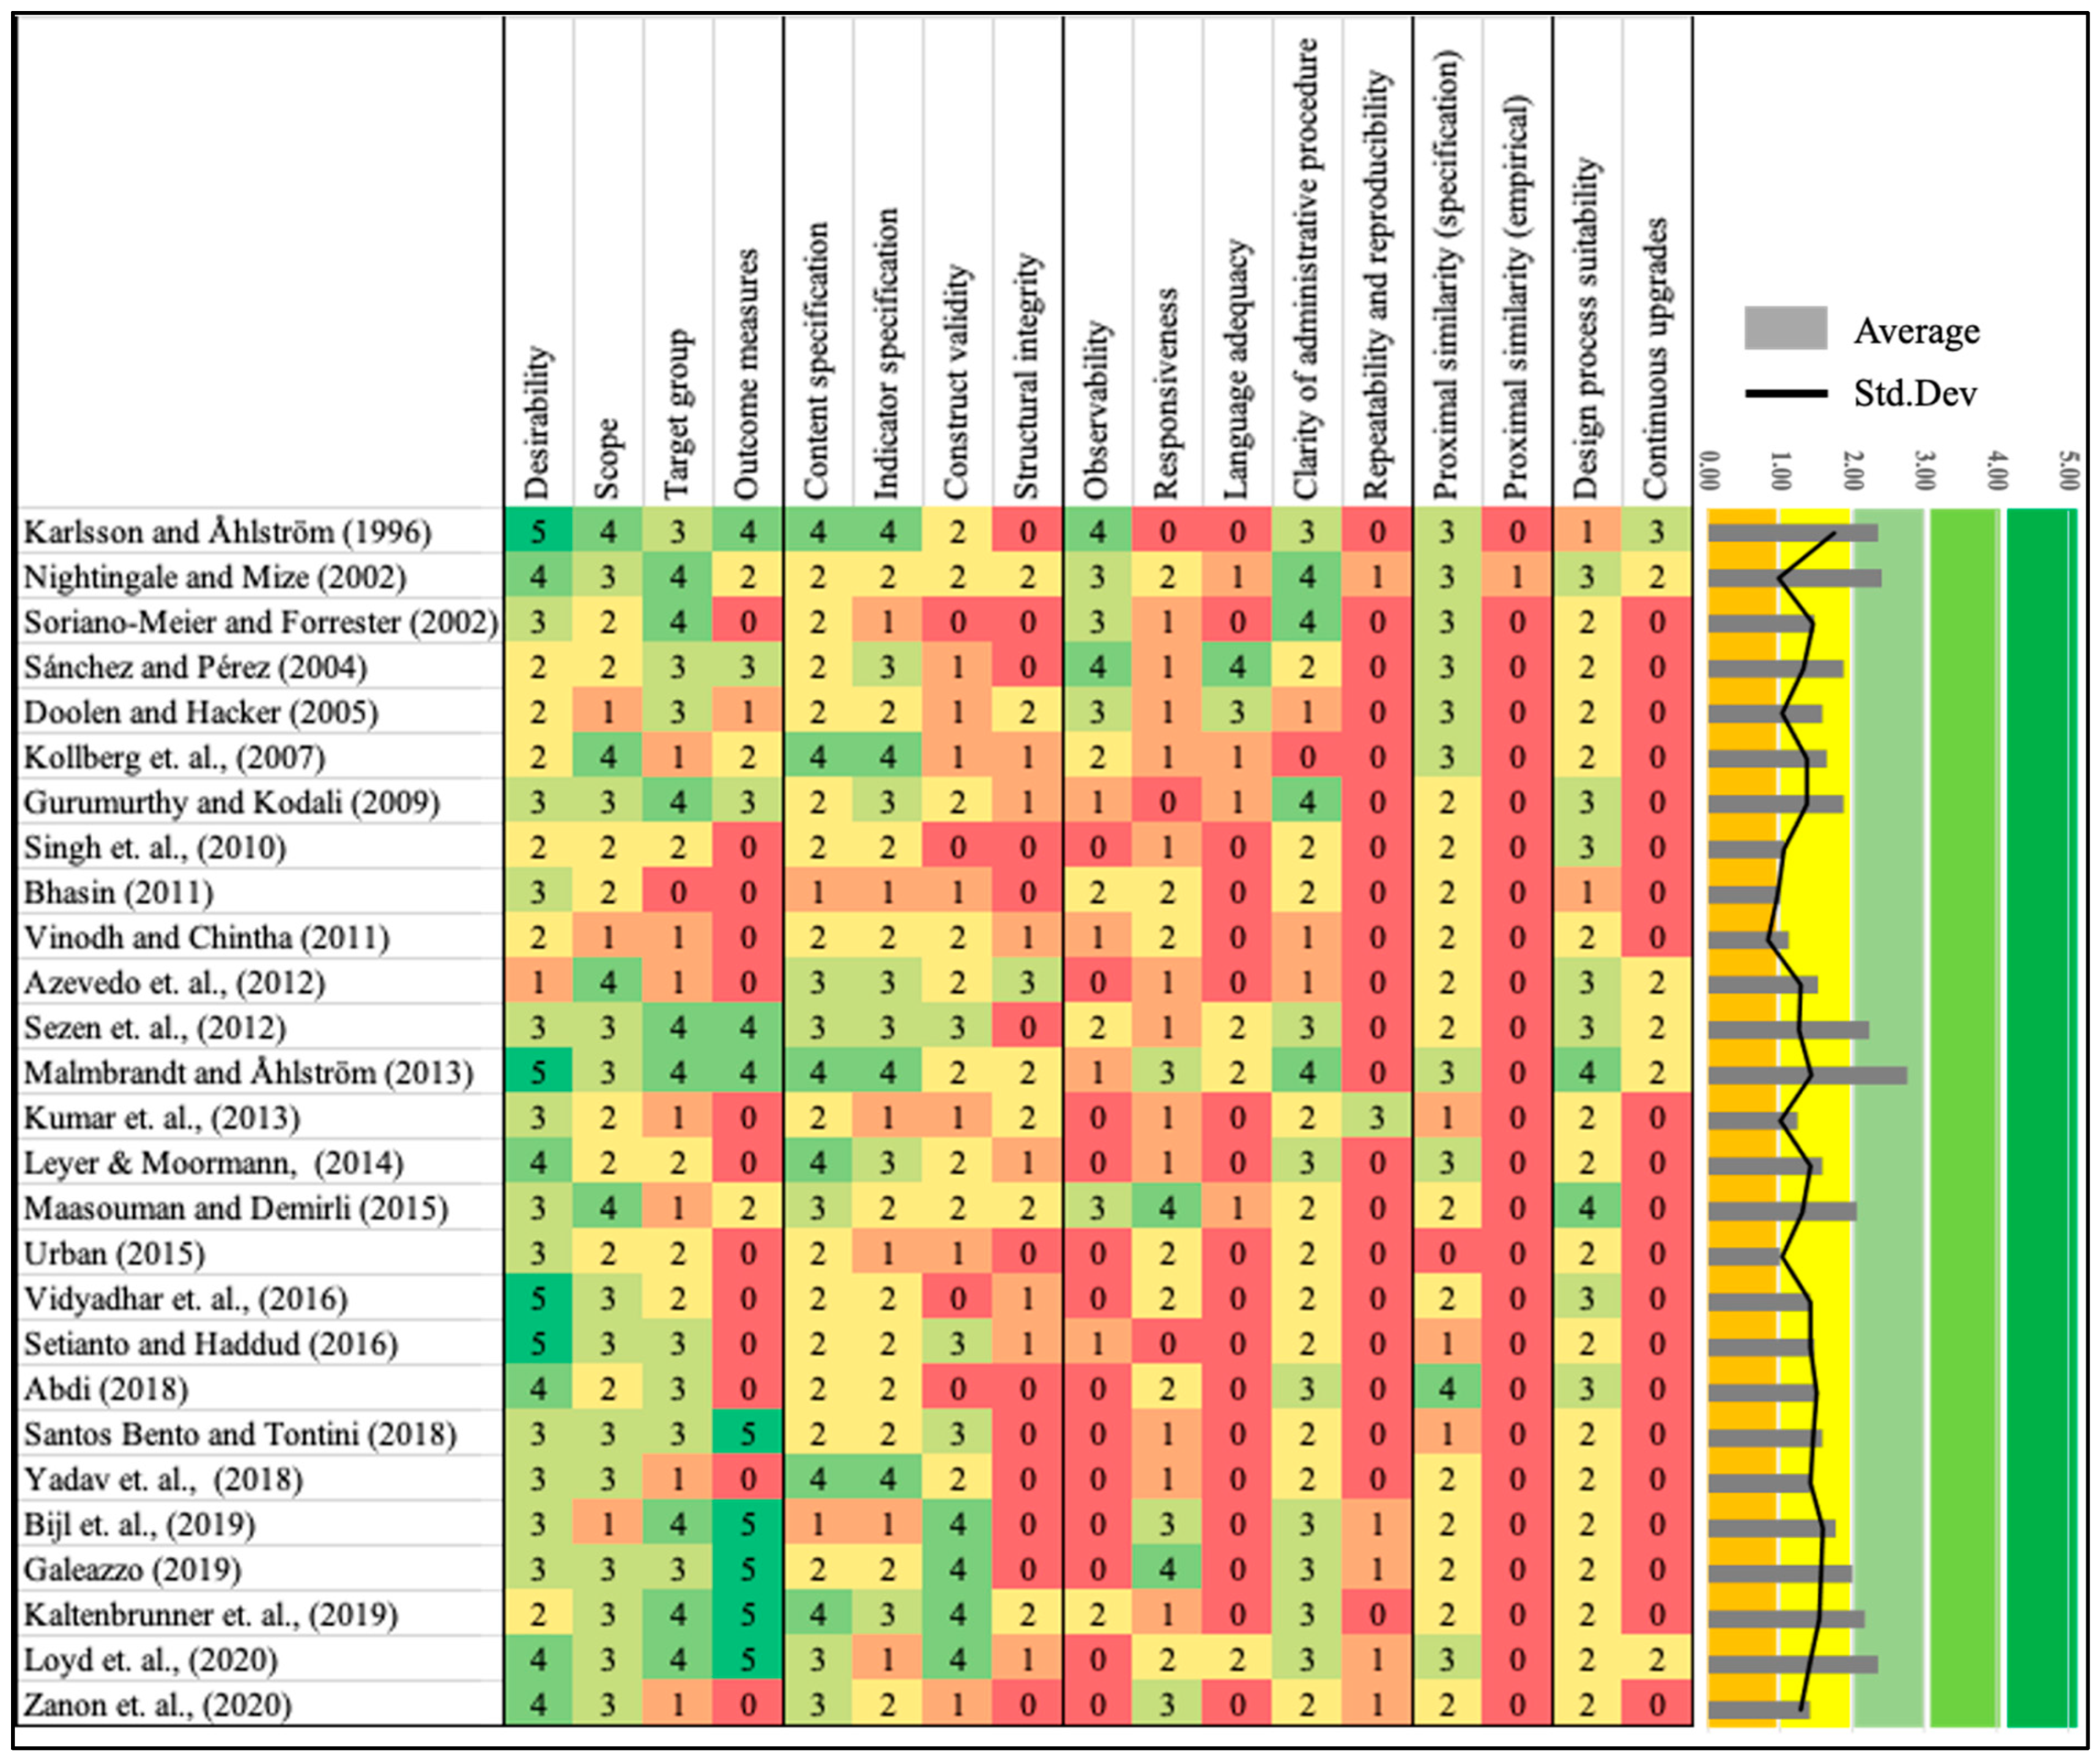
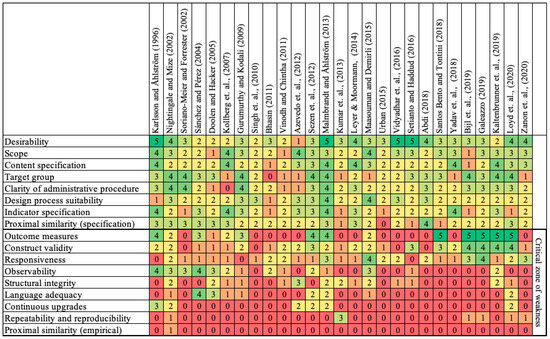
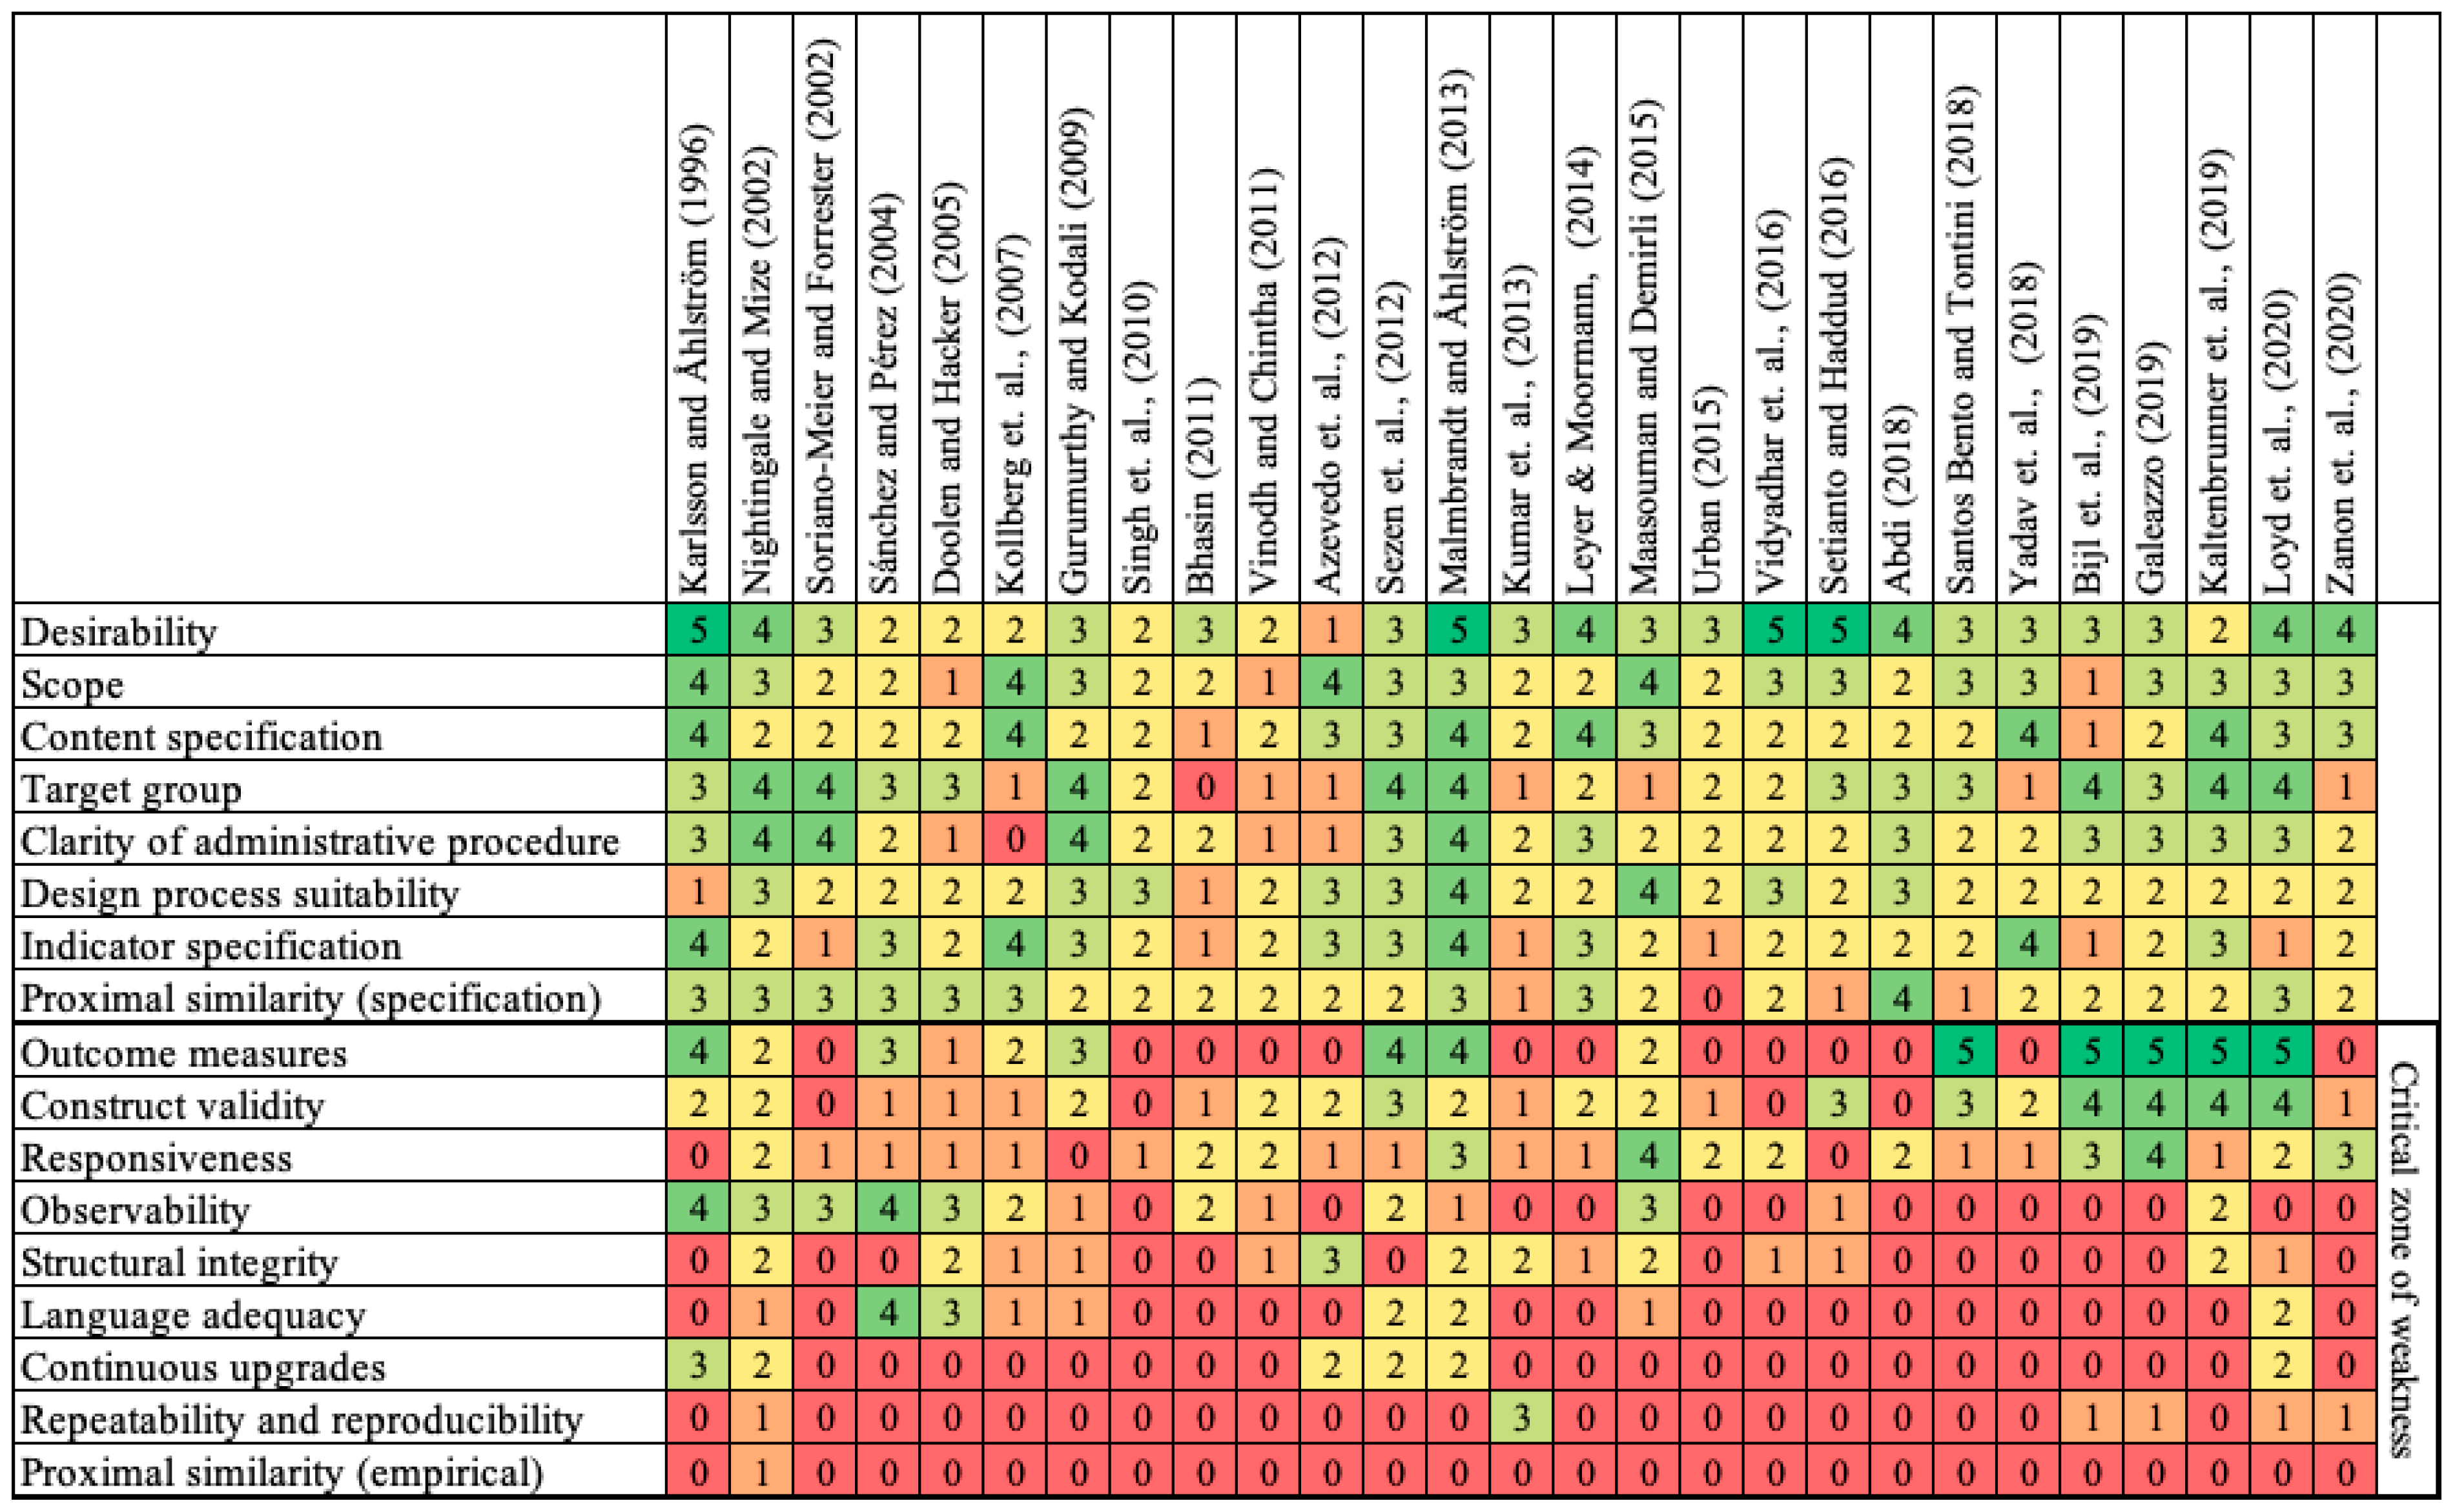
Figure 2 presents the 27 LMMs ordered chronologically by year of publication. Each cell reports the criterion-level rating (0–5), while the accompanying bar chart displays the overall average score per model across the 17 OVRGP criteria.
Figure 2.
OVRGP rating of LMMs (in the chronological order of publication year).
- Overall Trends
Despite more than 25 years of LMM development, the findings reveal that methodological rigor remains consistently low across the evaluated models. Even the most recent models do not demonstrate consistently strong methodological fulfillment.
Importantly:
- ○
- No LMM achieved an overall average rating of 3 or above.
- ○
- Performance variability across criteria remains moderate.
- ○
- Standard deviation patterns suggest that most models exhibit systematic weaknesses across multiple dimensions, rather than isolated deficiencies.
This pattern indicates structural limitations within the LMM landscape rather than generational improvement.
5.2. Highest-Performing Model and Its Limitations
Among the evaluated models, Malmbrandt and Åhlström [22] achieved the highest overall average score. Their lean service maturity model demonstrates relatively strong performance within the Opportunity dimension, particularly in:
- ○
- Justifying business desirability;
- ○
- Defining outcome measures;
- ○
- Articulating a coherent scope.
The model development process combined theoretical grounding with iterative practical validation, strengthening its Process Integrity dimension relative to other LMMs. The use of generic maturity stage definitions (adapted from Nightingale and Mize [48]) improved responsiveness compared to models relying solely on Likert-type scales.
Nevertheless, critical weaknesses remain:
- ○
- Construct validity relies primarily on expert opinion rather than empirical demonstration of maturity–outcome relationships.
- ○
- Structural integrity (MECE) is not formally tested.
- ○
- The inclusion of lean enablers, practices, and performance indicators within the same structural layer raises concerns of conceptual overlap and embedded cause-and-effect circularity.
Thus, even the strongest-performing LMM presents a moderate risk of bias under the integrated OVRGP–bias framework.
5.3. Cross-Model Patterns and Systematic Weaknesses
Across the 27 LMMs, several recurring patterns emerge:
- 1.
- Opportunity is partially satisfied in many models, yet outcome variables are frequently underspecified, limiting construct testing.
- 2.
- Validity weaknesses are widespread, particularly regarding:
- ○
- Empirical construct validation;
- ○
- Justification of indicator inclusion;
- ○
- Testing of structural integrity (MECE).
- 3.
- Reliability is inconsistently addressed, with limited evidence of:
- ○
- Observability testing;
- ○
- Inter-rater reliability assessment;
- ○
- Repeatability and reproducibility (R&R) testing.
- 4.
- Generalizability remains the weakest dimension, as very few models demonstrate empirical validation beyond their original application context.
- 5.
- Process Integrity is often underreported, with limited transparency in design logic or iterative refinement.
The relatively narrow standard deviation across criteria indicates that most LMMs perform at similar moderate-to-low levels of methodological rigor. In other words, the field demonstrates consistency in structural limitations, rather than isolated excellence.
In formative measurement, the structural stability of an index depends on the fulfillment of specific foundational requirements—valid construct specification, justified and non-overlapping indicators, empirically tested outcome relationships, and documented reliability across raters and contexts [26,27,37]. When these requirements are systematically absent, as the OVRGP scores demonstrate across the majority of the 27 evaluated models, the resulting index scores are mathematically computed but theoretically compromised. The maturity scores such models produce cannot be trusted to reliably reflect actual lean capability, nor can they support credible comparison across organizations or contexts. It is in this precise sense that the identified weaknesses are structural rather than incidental.
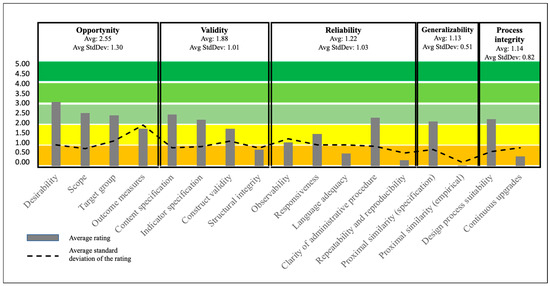
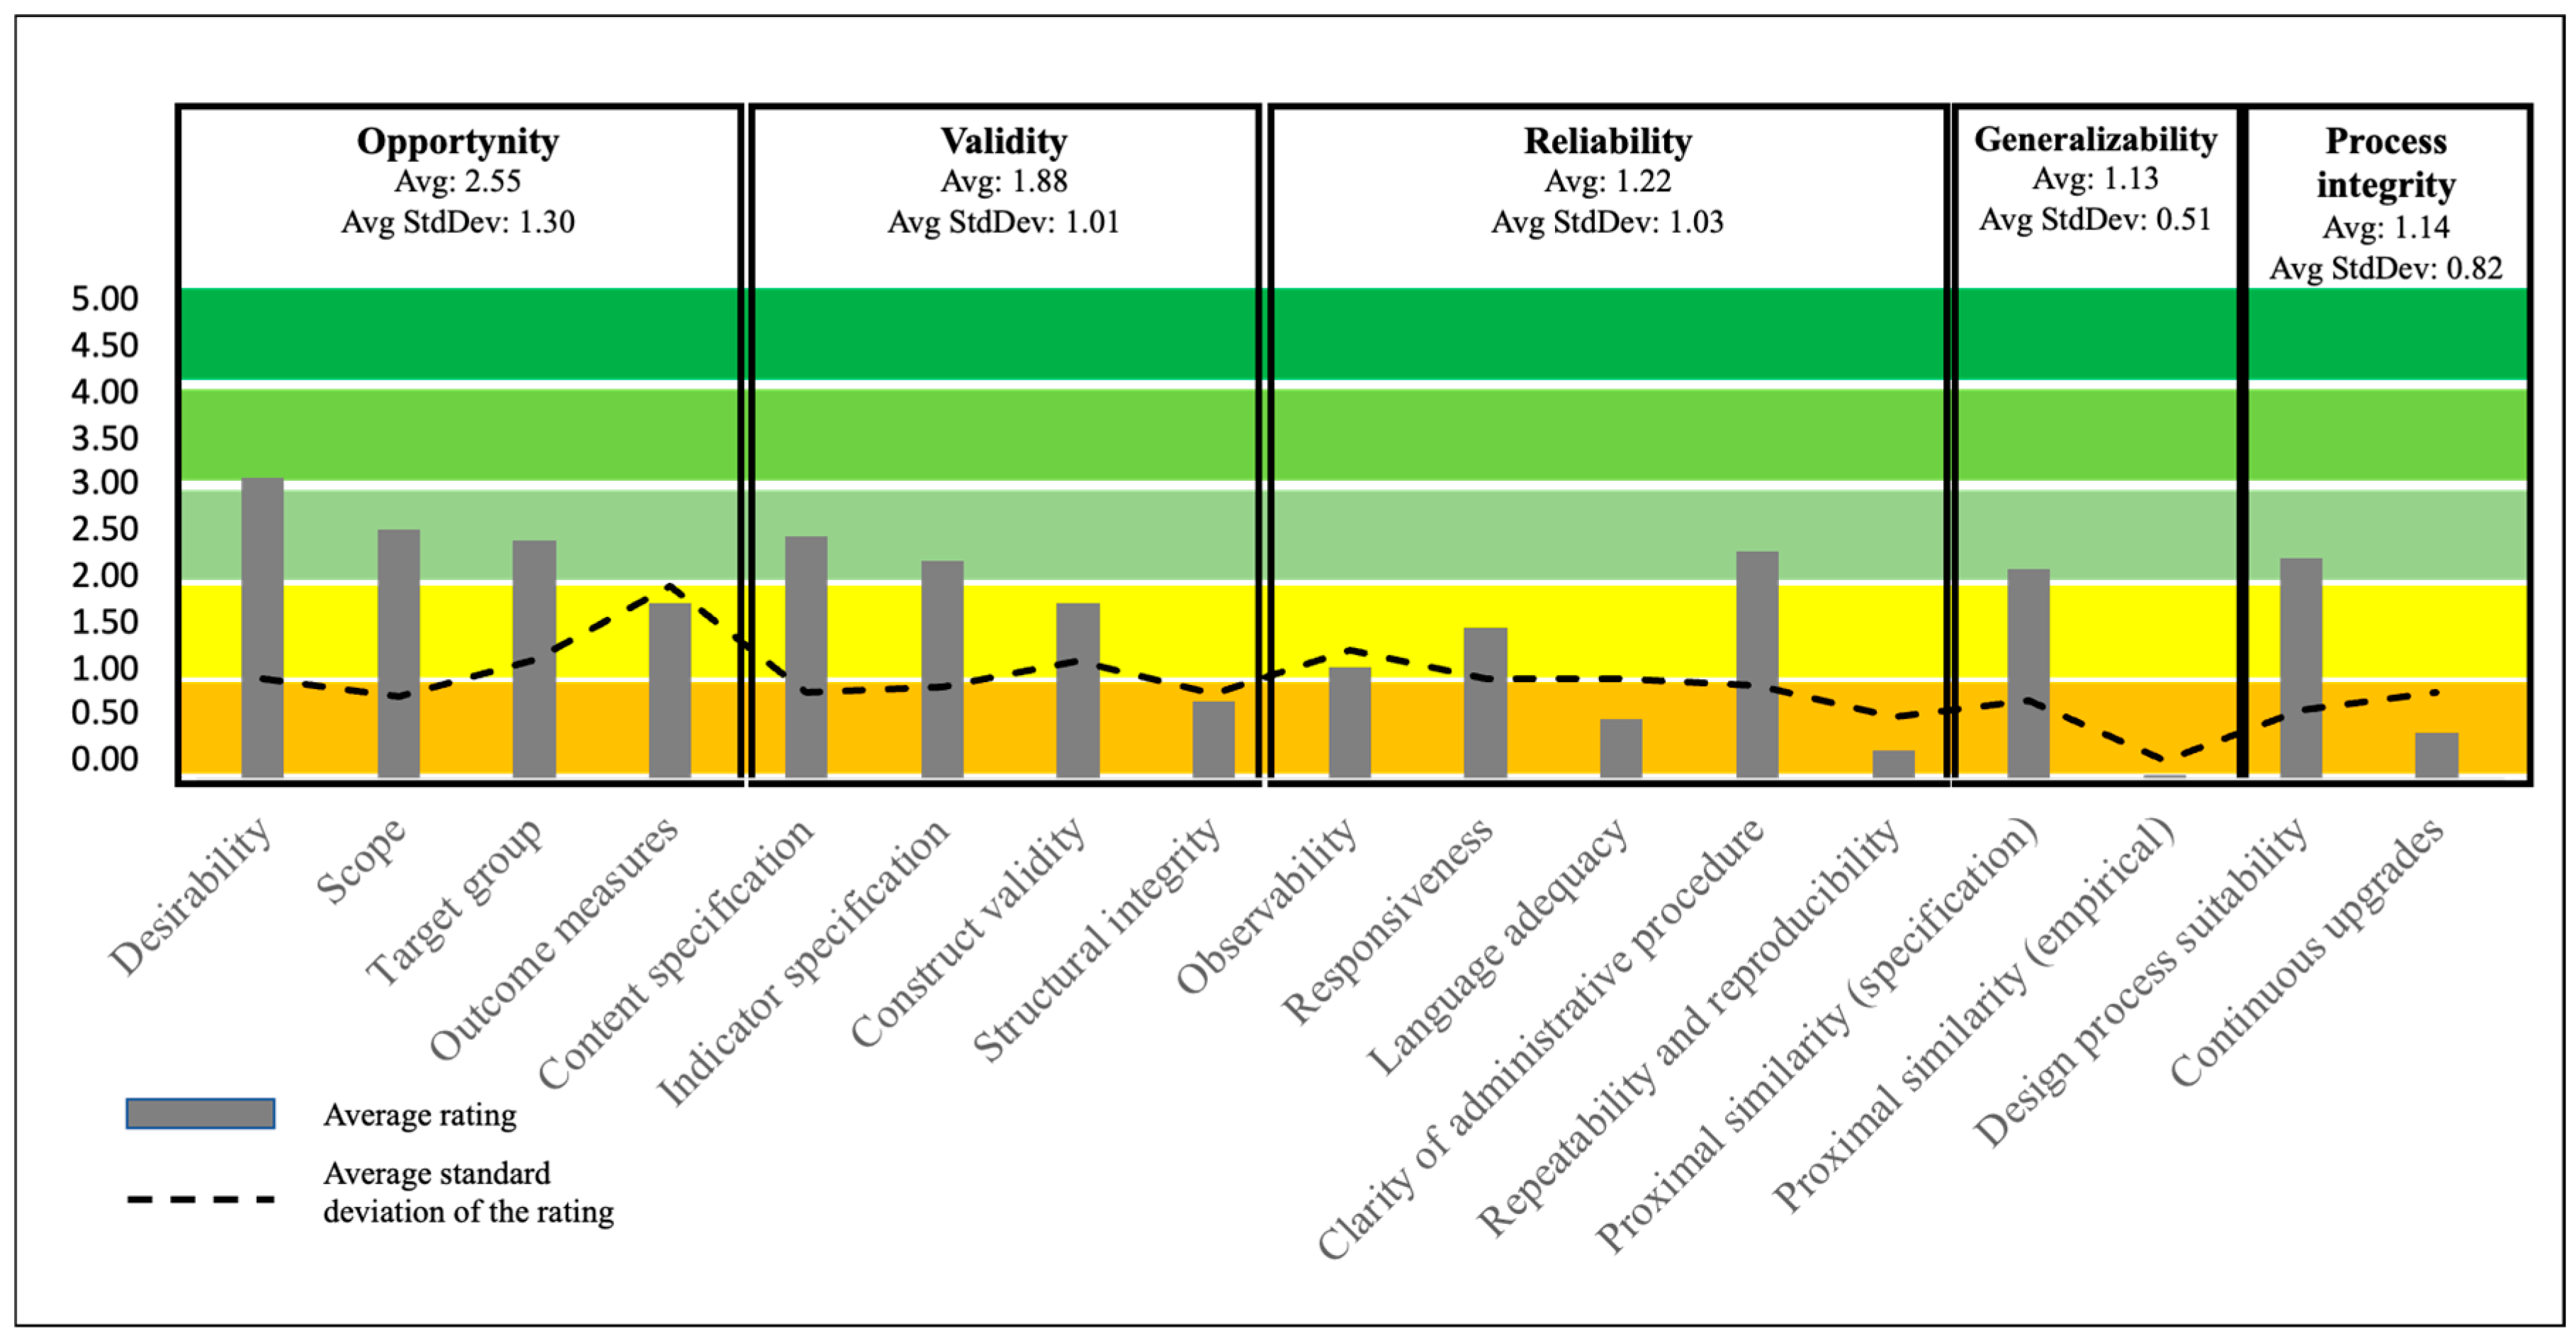
Figure 3 further disaggregates criterion-level performance to identify systematically weak dimensions, providing deeper insight into RQ2 and setting the stage for RQ3.
Figure 3.
Average OVRGP rating within sub-criteria.
Figure 3 presents the average rating and average standard deviation for each of the 17 criteria, aggregated by OVRGP category. This disaggregated analysis provides deeper insight into systematic strengths and weaknesses across the LMM landscape.
- Criterion-Level Performance Patterns
Among the five OVRGP dimensions, Opportunity records the highest average score. Most LMMs articulate business desirability, scope, and target audience at least partially. However, the specification of measurable outcome variables remains inconsistent, as only a subset clearly translates intended benefits into operationalized performance metrics. The comparatively stronger performance of Opportunity reflects the conceptual nature of its criteria. Defining scope, target group, and intended purpose does not require empirical testing or statistical validation. This pattern also applies to other criteria grounded primarily in conceptual articulation rather than empirical demonstration, including:
- ○
- Content specification;
- ○
- Indicator specification;
- ○
- Clarity of administrative procedures;
- ○
- Theoretical definition of proximal context;
- ○
- Justification of design logic.
These criteria show comparatively higher average ratings across models.
- Empirical Rigor as a Systematic Weakness
In contrast, criteria that require empirical validation, statistical testing, or structured expert involvement consistently exhibit low average ratings. These include:
- ○
- Empirical construct validity;
- ○
- Structural integrity testing (MECE);
- ○
- Language adequacy testing;
- ○
- Empirical proximal similarity (cross-context validation);
- ○
- Demonstrated continuous improvement of the model.
The consistently low performance in these areas suggests that most LMMs remain at the conceptual stage and do not advance to rigorous validation. This raises a broader methodological concern: the field appears largely driven by literature synthesis and author judgment, with limited empirical verification of maturity–outcome relationships. From the perspective of the integrated OVRGP–bias framework, this pattern indicates elevated construct, measurement, and transferability bias across the majority of models.
- Variability Across Criteria
Standard deviation values across criteria are moderate and stable, indicating that weaknesses are broadly distributed rather than confined to a few models. An exception is the “specification of outcome measures,” which shows higher variability, reflecting a polarized pattern in which some authors operationalize outcomes clearly while others omit them entirely. As expected, the lowest standard deviation appears in “empirical proximal similarity,” where nearly all models received minimal or zero ratings, revealing a near-universal absence of cross-context empirical validation. Overall, the findings from Figure 3 suggest that methodological limitations of LMMs are structural rather than incidental: conceptual articulation is common, whereas empirical substantiation is rare. Strengthening empirical validation and cross-context testing, therefore, represents a critical pathway for improving the fit-for-purpose of future lean maturity models in logistics and supply chain research.
5.4. RQ3—What Are the Critical Methodological Weaknesses?
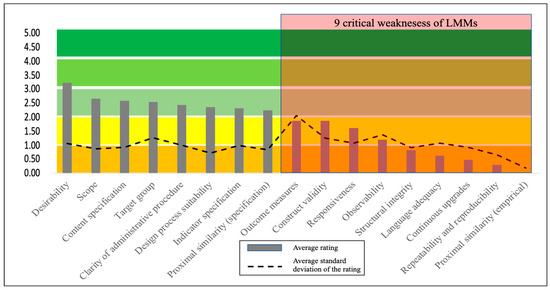
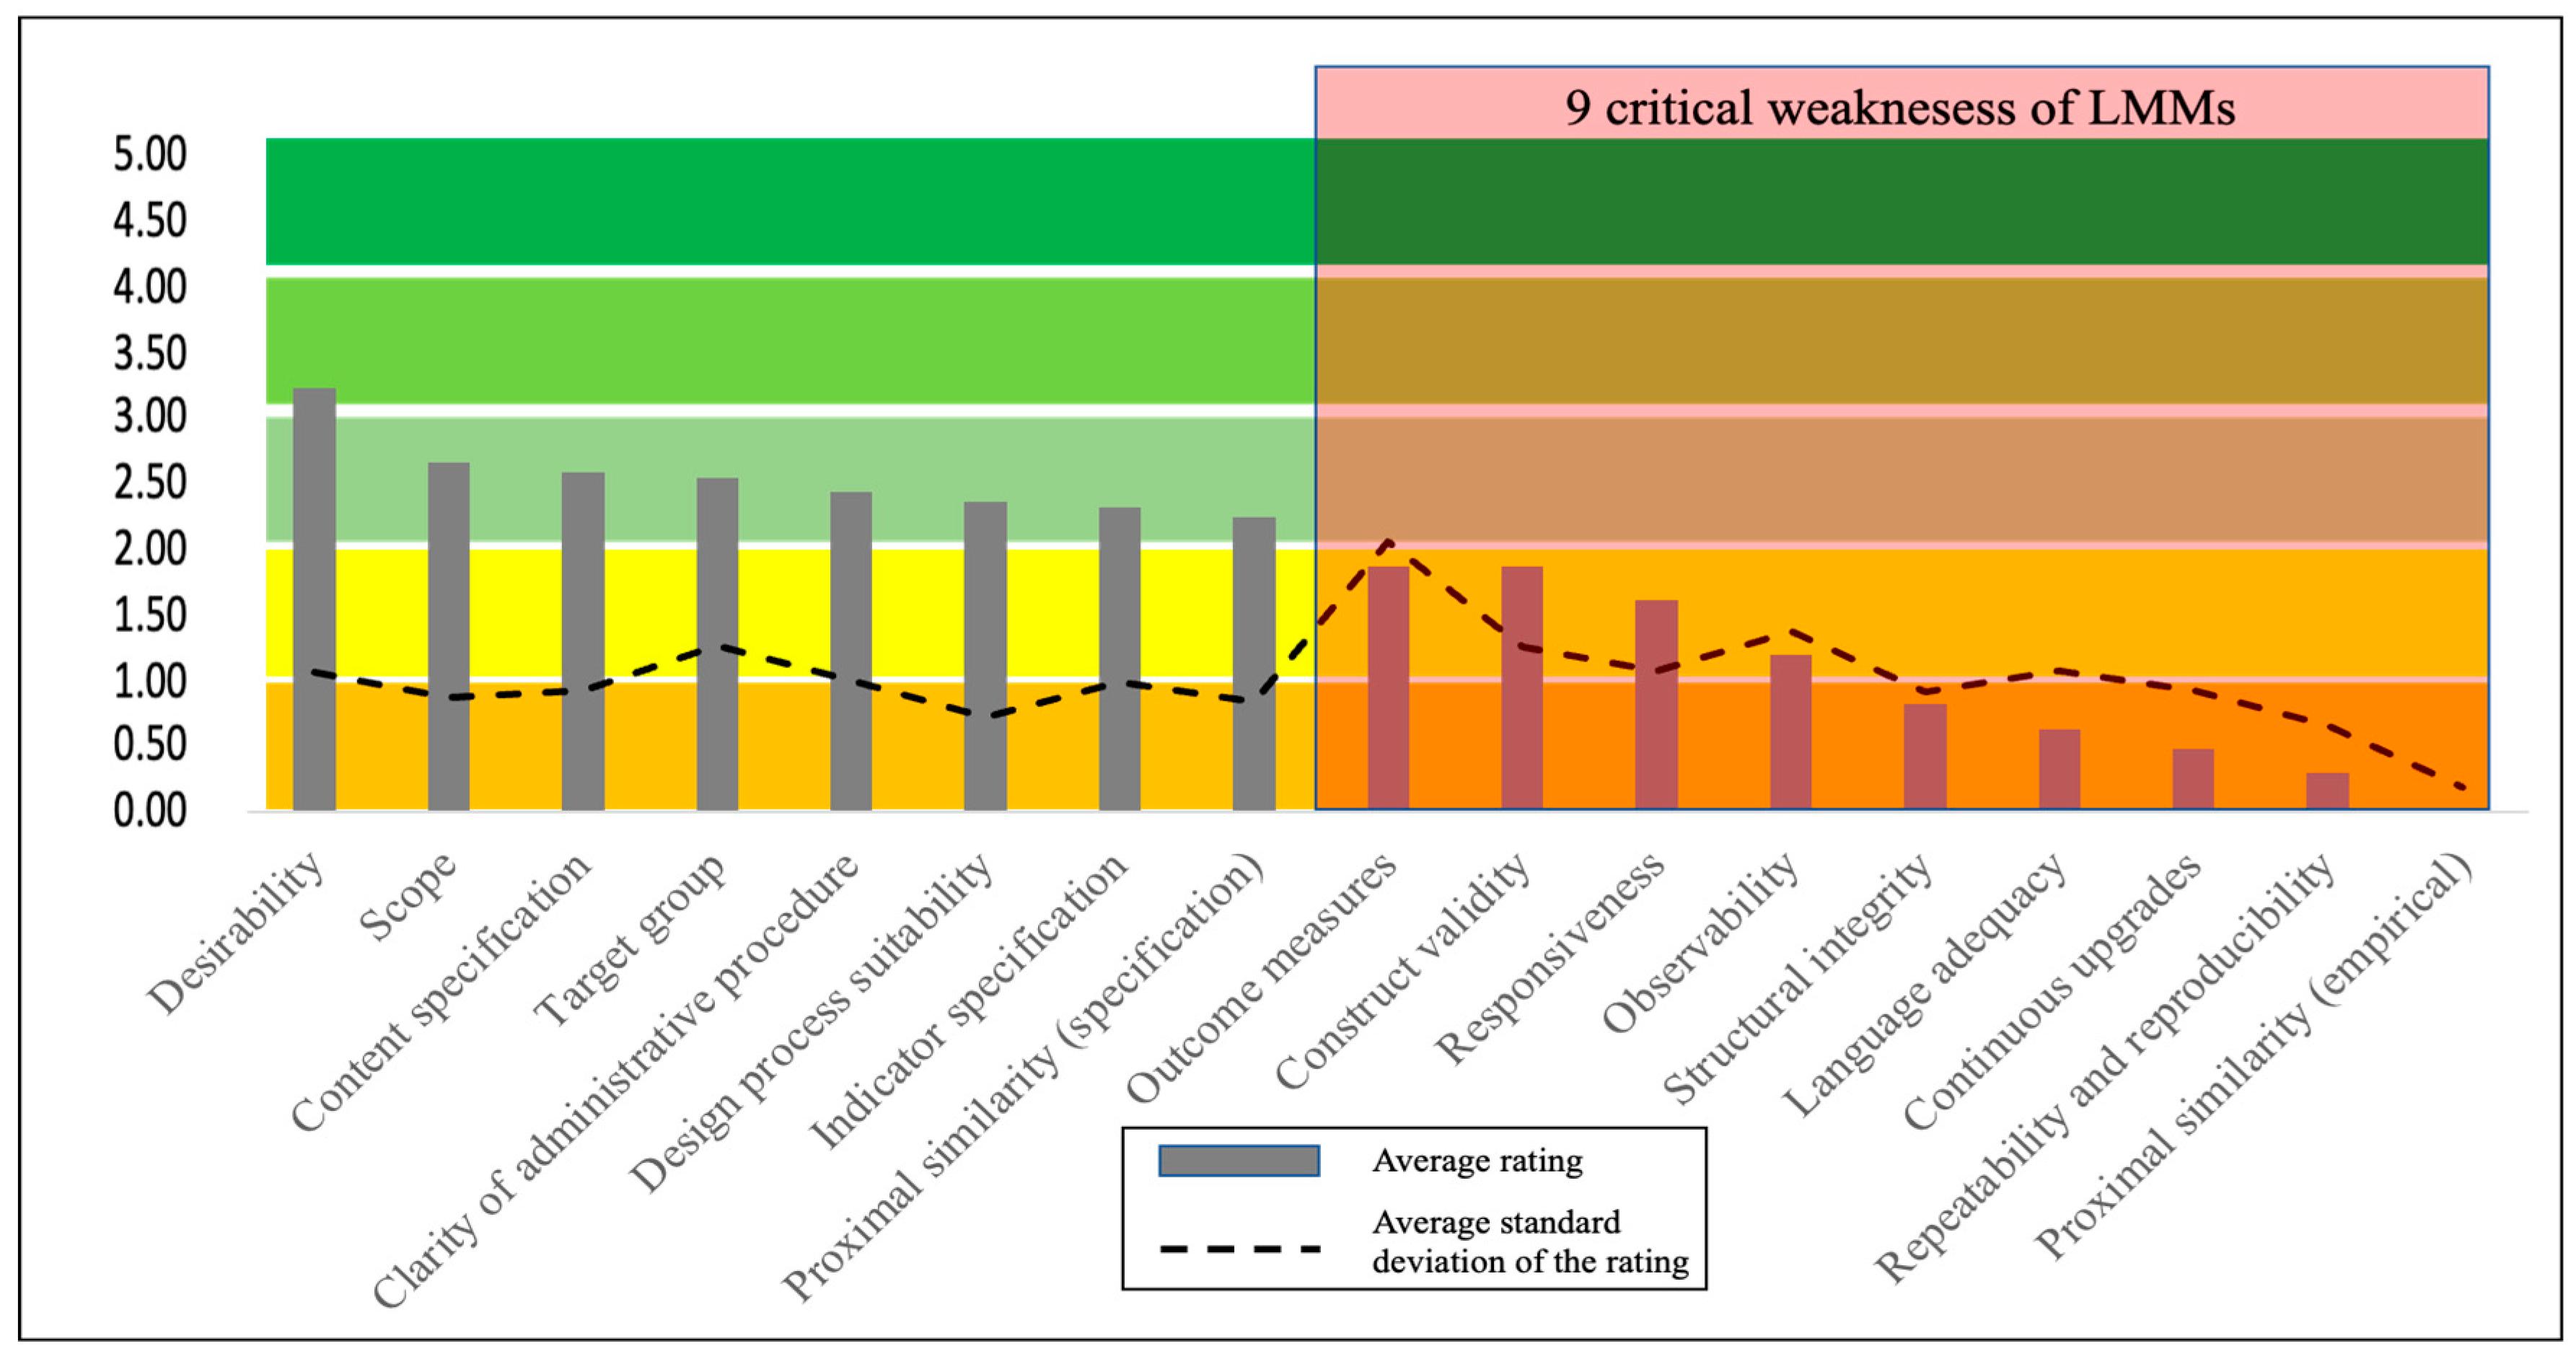
In addressing RQ3, we identify nine criteria within the OVRGP framework that constitute critical methodological weaknesses. Figure 4 presents all 17 criteria ranked in descending order according to their average rating across the 27 evaluated LMMs.
Figure 4.
Sub-criteria in descending order (9 critical weaknesses of LMMs).
The nine lowest-performing criteria score below an average of 2 on the six-point scale, dividing the 17 criteria into two nearly equal groups. Notably, all eight higher-ranked criteria share a common feature: they do not require empirical validation, statistical testing, or structured expert assessment. This reinforces the earlier observation that LMM literature has largely emphasized conceptual articulation over empirical substantiation. Although these comparatively stronger criteria are not classified as critical weaknesses, their performance remains modest, with most averages between 2 and 3, indicating only partial fulfillment. The only exception is “justified desirability,” which scores slightly above 3. Even in the strongest conceptual areas, methodological rigor remains moderate rather than robust.
The nine critical weaknesses predominantly correspond to criteria requiring:
- ○
- Empirical construct validation.
- ○
- Structural integrity testing (MECE).
- ○
- Reliability testing (e.g., R&R, language adequacy.
- ○
- Empirical cross-context validation.
- ○
- Demonstrated iterative refinement.
This clustering indicates that the most demanding aspects of measurement design, those requiring data collection, statistical analysis, or systematic validation, are consistently underdeveloped. At least one critical weakness appears within each of the five OVRGP dimensions, showing that limitations of existing LMMs are structurally distributed across purpose articulation, validity, reliability, generalizability, and process integrity. From a measurement theory perspective, this is concerning. A maturity model intended as a scientific instrument must demonstrate credible construct validity, reliability, and transferability. Weak performance across these domains reduces the overall fit-for-purpose of current LMMs and limits their usefulness for evidence-based logistics and supply chain decision-making. The following subsections examine these nine critical weaknesses in detail and propose targeted methodological improvements, addressing both RQ3 and RQ4.
5.5. RQ4—How Can Future Lean Maturity Models Be Improved When Developing LMMs for Logistics and Supply Chain Industries?
Figure 5 presents the 27 LMMs ranked in descending order according to their overall average scores. When performance is examined across the nine identified critical weaknesses, a consistent pattern emerges: most models score zero or near zero, with only isolated exceptions achieving ratings above 4 or 5. Among the weakest-performing criteria, two are particularly critical for logistics and supply chain applications: repeatability and reproducibility (R&R) and empirical proximal similarity.
Figure 5.
Sub-criteria in descending order based on the average rating (for all the LMMs).
- Repeatability and Reproducibility (R&R)
The absence of explicit R&R testing raises substantial concerns regarding the use of LMMs as measurement instruments in logistics and supply chain environments, where assessments often span multiple facilities, functional units, and inter-organizational interfaces. A model that cannot demonstrate consistent results across raters, locations, or time lacks the stability required for network-level capability evaluation. A rating of zero does not imply inherent unreliability, but rather the absence of documented evidence of systematic testing (e.g., inter-rater reliability, intra-rater consistency, Kappa statistics, or Gage R&R procedures). In distributed logistics systems, where maturity may be assessed across warehouses, distribution centers, transport nodes, or supplier interfaces, the omission of documented R&R testing increases measurement bias risk within the Reliability dimension of the OVRGP framework. Without formal evidence of rating stability, conclusions regarding maturity differentiation across supply chain entities remain methodologically vulnerable.
- Empirical Proximal Similarity
The second lowest-performing criterion, empirical proximal similarity, concerns whether construct validity holds beyond the original study context. In logistics and supply chain research, where operational configurations vary across industries, regions, and network structures, demonstrating cross-context validity is essential. While several models describe theoretically applicable settings, very few provide empirical evidence that maturity–outcome relationships are reproducible in comparable logistics or supply chain environments. Merely specifying potential application domains does not establish reusability. To function as transferable instruments, LMMs must show that progression in lean maturity correlates with improved operational or network-level outcomes in at least one additional proximal context (e.g., similar distribution networks, manufacturing supply chains, or service-based logistics systems). Unsurprisingly, empirical proximal similarity scores are uniformly low, particularly given the limited evidence of empirical construct validation even within original contexts.
Although cross-context validation may extend beyond the initial development phase of an LMM, from a scientific measurement perspective, it is indispensable for establishing broader acceptance in logistics and supply chain scholarship. Excluding this criterion would weaken the evaluative rigor of the OVRGP framework and lower the standards required for maturity models intended to assess inter-firm and multi-site lean capability development. Accordingly, empirical proximal similarity is retained as a forward-looking benchmark for methodological maturity in future LMM development within logistics and supply chain research.
In addressing RQ4, we have first examined the consequences for the fit-for-purpose of LMMs in logistics and supply chain applications when these weaknesses remain unaddressed. We then provide methodological recommendations intended to guide future researchers in strengthening the design and validation of lean maturity models.
This dual perspective moves the discussion beyond critique toward constructive advancement of lean maturity assessment in supply chain contexts. From the first perspective, each unresolved weakness undermines one or more OVRGP dimensions. For instance, the absence of empirical construct validation weakens the credible linkage between lean capability development and operational outcomes such as service reliability or flow efficiency (Validity dimension). Lack of R&R testing compromises measurement stability across sites and evaluators (Reliability dimension), while failure to demonstrate empirical proximal similarity limits transferability across comparable supply chain configurations (Generalizability dimension). Collectively, these deficiencies reduce the overall fit-for-purpose of LMMs as scientific instruments in logistics and supply chain systems.
From the second perspective, these weaknesses translate into targeted methodological recommendations (Table 2). We advocate systematic strengthening of model development practices, including clearer specification of supply chain-relevant outcome variables, formal MECE testing, longitudinal empirical validation, documented reliability assessment across raters and sites, cross-context replication, and transparent reporting of iterative refinement.
Table 2.
Synthesized recommendations for each critical weakness.
6. Discussion
6.1. Theoretical Implications
The OVRGP framework addresses this gap by consolidating 17 rigor-based criteria derived from formative measurement theory and maturity model design literature into a single integrated evaluative architecture. The consistent pattern of low empirical substantiation across 27 models spanning more than 25 years of development suggests that the identified weaknesses are structural and field-wide rather than generational or model-specific. This study, therefore, provides the theoretical foundation necessary for transforming LMMs from descriptive frameworks into validated measurement instruments.
6.2. Implications for Managers, Practitioners, and Policymakers
The OVRGP framework and its associated recommendations serve as a practical reference for organizations, consulting practitioners, and policymakers seeking to develop or select rigorous lean maturity instruments for logistics and supply chain transformation. Practitioners can use the framework diagnostically to assess the methodological credibility of existing LMMs before adopting them for capability assessment. Organizations commissioning LMM development can use the 17 criteria and nine recommendations in Table 2 as a design standard to ensure the resulting instrument meets minimum scientific requirements. Policymakers can use the OVRGP framework as a reference architecture for developing standards and certification programs for lean capability assessment across critical supply chain processes, supporting more consistent and credible benchmarking at the industry and network level.
6.3. Limitations and Future Research Directions
This study acknowledges several limitations. The keyword search strategy and database coverage, while systematically applied, may have missed a small number of qualifying studies using different terminology, though the consistency of findings across 27 models suggests the structural patterns identified are robust to marginal variation in sample composition. Disagreements among raters were concentrated in the Opportunity dimension, reflecting the inherently subjective nature of desirability and outcome specification judgments. The recommendations derived from this study are theoretically grounded but not yet empirically validated. Their practical effectiveness will only be demonstrated when a purpose-built logistics-specific LMM is developed and tested using this theoretical foundation, representing a distinct and necessary avenue for future research. The OVRGP framework itself also awaits empirical validation against a demonstrably rigorous LMM to confirm that fulfilling all 17 criteria produces a superior instrument in practice. Future research should focus on developing and empirically validating a logistics-specific lean maturity model grounded in the OVRGP criteria, testing cross-context generalizability across comparable supply chain configurations, and longitudinally validating the relationship between lean maturity progression and network-level performance outcomes.
7. Conclusions
This study systematically evaluated 27 lean maturity models against 17 rigor-based criteria grouped under the OVRGP framework, revealing nine critical methodological weaknesses distributed across construct validation, reliability testing, structural integrity, and empirical generalizability. The consistent pattern that emerges across more than 25 years of LMM development is unambiguous: the field has prioritized framework construction over measurement validation, producing instruments that are conceptually articulated but empirically underdeveloped. The OVRGP framework introduced in this study provides the first theoretically consolidated reference architecture for evaluating and developing rigorous lean maturity models, with targeted recommendations specifically designed for logistics and supply chain contexts. Strengthening methodological rigor is not an optional refinement. It is a prerequisite for lean maturity models to achieve scientific credibility and practical utility as instruments of organizational capability assessment.
Author Contributions
Conceptualization, P.M. and G.V.; Methodology, P.M. and G.V.; Investigation, P.M.; Data curation, P.M.; Writing—original draft, P.M.; Writing—review and editing, P.M. and G.V.; Visualization, P.M. and G.V.; Supervision, G.V.; Project administration, G.V. All authors have read and agreed to the published version of the manuscript.
Funding
This research received no external funding.
Institutional Review Board Statement
Not applicable.
Informed Consent Statement
Not applicable.
Data Availability Statement
The original contributions presented in this study are included in the article. Further inquiries can be directed to the corresponding author.
Acknowledgments
During the preparation of this manuscript/study, the authors used [large language models (LLMs) and Grammarly 1.165.1.0] to check grammatical accuracy, and, when appropriate, condense lengthy sentences to improve readability. All AI-suggested edits were reviewed by the authors for accuracy and manually edited before inclusion.
Conflicts of Interest
The authors declare no conflicts of interest.
References
- Ohno, T. Toyota Production System: Beyond Large-Scale Production; Productivity Press: Cambridge, MA, USA, 1988. [Google Scholar]
- Womack, J.; Jones, D.; Roos, D. The Machine That Changed the World; Rawson Associates: New York, NY, USA, 1990. [Google Scholar]
- Krafcik, J.F. Triumph of the lean production system. Sloan Manag. Rev. 1988, 30, 41–52. [Google Scholar]
- Karlsson, C.; Åhlström, P. Assessing changes towards lean production. Int. J. Oper. Prod. Manag. 1996, 16, 24–41. [Google Scholar] [CrossRef] [Scilit]
- Shah, R.; Ward, P.T. Defining and developing measures of lean production. J. Oper. Manag. 2007, 25, 785–805. [Google Scholar] [CrossRef] [Scilit]
- Liker, J.K.; Hoseus, M. Toyota Culture, the Heart and Soul of the Toyota Way; McGraw Hill Professional: New York, NY, USA, 2008. [Google Scholar]
- Rother, M. Toyota Kata: Managing People for Improvement, Adaptiveness, and Superior Results; McGraw-Hill: New York, NY, USA, 2010. [Google Scholar]
- Mann, D. Creating a Lean Culture, Tools to Sustain Lean Conversions, 3rd ed.; Taylor and Francis Group: Abingdon, UK, 2014. [Google Scholar]
- Baggaley, B. Using strategic performance measures to accelerate Lean performance. Cost Manag. 2006, 20, 36–45. [Google Scholar]
- Sharma, M.; Bhagwat, R. An integrated BSC-AHP approach for supply chain management evaluation. Meas. Bus. Excell. 2007, 11, 57–69. [Google Scholar] [CrossRef] [Scilit]
- Schonberger, R.J. Lean performance management (metrics don’t add up). Cost Manag. 2008, 22, 5–10. [Google Scholar]
- Pakdil, F.; Leonard, K.M. Criteria for a lean organisation: Development of a lean assessment tool. Int. J. Prod. Res. 2014, 52, 4587–4607. [Google Scholar] [CrossRef] [Scilit]
- Narayanamurthy, G.; Gurumurthy, A. Leanness assessment: A literature review. Int. J. Oper. Prod. Manag. 2016, 36, 1115–1160. [Google Scholar] [CrossRef] [Scilit]
- Cocca, P.; Marciano, F.; Alberti, M.; Schiavini, D. Leanness measurement methods in manufacturing organisations: A systematic review. Int. J. Prod. Res. 2018, 57, 5103–5118. [Google Scholar] [CrossRef] [Scilit]
- Klundt, E.; Towers, N.; Bechkoum, K. Lean and Agile Supply Strategies in Distribution Centres to Deliver Value-Added Services (VAS). Logistics 2024, 8, 67. [Google Scholar] [CrossRef] [Scilit]
- Atieh, A.A.; Abu Hussein, A.; Al-Jaghoub, S.; Alheet, A.F.; Attiany, M. The Impact of Digital Technology, Automation, and Data Integration on Supply Chain Performance: Exploring the Moderating Role of Digital Transformation. Logistics 2025, 9, 11. [Google Scholar] [CrossRef] [Scilit]
- Roman, E.-A.; Stere, A.-S.; Roșca, E.; Radu, A.-V.; Codroiu, D.; Anamaria, I. State of the Art of Digital Twins in Improving Supply Chain Resilience. Logistics 2025, 9, 22. [Google Scholar] [CrossRef] [Scilit]
- Nunes, L.J.R. Reverse Logistics as a Catalyst for Decarbonizing Forest Products Supply Chains. Logistics 2025, 9, 17. [Google Scholar] [CrossRef] [Scilit]
- Soares, G.P.; Tortorella, G.; Bouzon, M.; Tavana, M. A fuzzy maturity-based method for lean supply chain management assessment. Int. J. Lean Six Sigma 2021, 12, 1017–1045. [Google Scholar] [CrossRef] [Scilit]
- Gomaa, A.H. Boosting Supply Chain Effectiveness with Lean Six Sigma. Am. J. Manag. Sci. Eng. 2024, 9, 156–171. [Google Scholar] [CrossRef] [Scilit]
- Ferraro, S.; Leoni, L.; Cantini, A.; De Carlo, F. Trends and Recommendations for Enhancing Maturity Models in Supply Chain Management and Logistics. Appl. Sci. 2023, 13, 9724. [Google Scholar] [CrossRef] [Scilit]
- Malmbrandt, M.; Åhlström, P. An instrument for assessing lean service adoption. Int. J. Oper. Prod. Manag. 2013, 33, 1131–1165. [Google Scholar] [CrossRef] [Scilit]
- Almomani, M.A.; Abdelhadi, A.; Mumani, A.; Momani, A.; Aladeemy, M. A proposed integrated model of lean assessment and analytical hierarchy process for a dynamic road map of lean implementation. Int. J. Adv. Manuf. Technol. 2014, 72, 161–172. [Google Scholar] [CrossRef] [Scilit]
- Doolen, T.L.; Hacker, M.E. A review of lean assessment in organizations: An exploratory study of lean practices by electronics manufacturers. J. Manuf. Syst. 2005, 24, 55. [Google Scholar] [CrossRef] [Scilit]
- Gurumurthy, A.; Kodali, R. Application of benchmarking for assessing the lean manufacturing implementation. Benchmarking Int. J. 2009, 16, 274–308. [Google Scholar] [CrossRef] [Scilit]
- Diamantopoulos, A.; Winklhofer, H.M. Index construction with formative indicators: An alternative to scale development. J. Mark. Res. 2001, 38, 269–277. [Google Scholar] [CrossRef] [Scilit]
- Bollen, K.; Lennox, R. Conventional wisdom on measurement: A structural equation perspective. Psychol. Bull. 1991, 110, 305–314. [Google Scholar] [CrossRef]
- Leyer, M.; Moormann, J. How lean are financial service companies really? Empirical evidence from a large scale study in Germany. Int. J. Oper. Prod. Manag. 2014, 34, 1366–1388. [Google Scholar] [CrossRef] [Scilit]
- Pasian, B.; Sankaran, S.; Boydell, S. Project management maturity: A critical analysis of existing and emergent factors. Int. J. Manag. Proj. Bus. 2012, 5, 146–157. [Google Scholar] [CrossRef] [Scilit]
- Mettler, T. Thinking in Terms of Design Decisions When Developing Maturity Models. Int. J. Strateg. Decis. Sci. 2010, 1, 76–87. [Google Scholar] [CrossRef] [Scilit]
- Pöppelbuß, J.; Röglinger, M. What makes a useful maturity model? A framework of general design principles for maturity models and its demonstration in business process management. In Proceedings of the ECIS 2011, Helsinki, Finland, 9–11 June 2011. [Google Scholar]
- Santos-Neto, J.B.S.; Costa, A.P.C.S. Enterprise maturity models: A systematic literature review. Enterp. Inf. Syst. 2019, 13, 719–769. [Google Scholar] [CrossRef] [Scilit]
- Abdi, F. Hospital leanness assessment model: A Fuzzy MULTI-MOORA decision-making approach. J. Ind. Syst. Eng. 2018, 11, 37–59. [Google Scholar]
- Soriano-Meier, H.; Forrester, P.L. A model for evaluating the degree of leanness of manufacturing firms. Integr. Manuf. Syst. 2002, 13, 104–109. [Google Scholar] [CrossRef] [Scilit]
- Yadav, V.; Khandelwal, G.; Jain, R.; Mittal, M.L. Development of leanness index for SMEs. Int. J. Lean Six Sigma 2018, 10, 397–410. [Google Scholar] [CrossRef] [Scilit]
- Kaltenbrunner, M.; Mathiassen, S.E.; Bengtsson, L.; Engström, M. Lean maturity and quality in primary care. J. Health Organ. Manag. 2019, 33, 141–154. [Google Scholar] [CrossRef] [Scilit]
- Bagozzi, R.P. (Ed.) Structural equation models in marketing research: Basic principles. In Principles of Marketing Research; Blackwell: Oxford, UK, 1994; pp. 317–385. [Google Scholar]
- Santos Bento, G.; Tontini, G. Developing an instrument to measure lean manufacturing maturity and its relationship with operational performance. Total Qual. Manag. Bus. Excell. 2018, 29, 977–995. [Google Scholar] [CrossRef] [Scilit]
- Urban, W. The Lean Management Maturity Self-assessment Tool Based on Organizational Culture Diagnosis. Procedia Soc. Behav. Sci. 2015, 213, 728–733. [Google Scholar] [CrossRef] [Scilit]
- Vidyadhar, R.; Sudeep Kumar, R.; Vinodh, S.; Antony, J. Application of fuzzy logic for leanness assessment in SMEs: A case study. J. Eng. Des. Technol. 2016, 14, 78–103. [Google Scholar] [CrossRef] [Scilit]
- Setianto, P.; Haddud, A. A Maturity Assessment of Lean Development Practices in Manufacturing Industry. Int. J. Adv. Oper. Manag. 2016, 8, 294–322. [Google Scholar] [CrossRef] [Scilit]
- de Bruin, T.; Rosemann, M.; Freeze, R.; Kulkarni, U. Understanding the main phases of developing a maturity assessment model. In Proceedings of the Australasian Conference on Information Systems (ACIS), Sydney, Australia, 30 November–2 December 2005. [Google Scholar]
- Vinodh, S.; Chintha, S.K. Leanness assessment using multi-grade fuzzy approach. Int. J. Prod. Res. 2011, 49, 431–445. [Google Scholar] [CrossRef] [Scilit]
- Bijl, A.; Ahaus, K.; Ruël, G.; Gemmel, P.; Meijboom, B. Role of lean leadership in the lean maturity—Second-order problem-solving relationship: A mixed methods study. BMJ Open 2019, 9, e026737. [Google Scholar] [CrossRef] [Scilit] [PubMed]
- Kollberg, B.; Dahlgaard, J.J.; Brehmer, P. Measuring lean initiatives in health care services: Issues and findings. Int. J. Prod. Perform. Manag. 2007, 56, 7–24. [Google Scholar] [CrossRef] [Scilit]
- Azevedo, S.G.; Govindan, K.; Carvalho, H.; Cruz-Machado, V. An integrated model to assess the leanness and agility of the automotive industry. Resour. Conserv. Recycl. 2012, 66, 85–94. [Google Scholar] [CrossRef] [Scilit]
- Maasouman, M.A.; Demirli, K. Development of a lean maturity model for operational level planning. Int. J. Adv. Manuf. Technol. 2015, 83, 1171–1188. [Google Scholar] [CrossRef] [Scilit]
- Nightingale, D.J.; Mize, J.H. Development of a lean enterprise transformation maturity model. Inf. Knowl. Syst. Manag. 2002, 3, 15. [Google Scholar] [CrossRef] [Scilit]
- Bhasin, S. Measuring the Leanness of an organisation. Int. J. Lean Six Sigma 2011, 2, 55–74. [Google Scholar] [CrossRef] [Scilit]
- Kumar, S.; Singh, B.; Qadri, M.A.; Kumar, Y.V.S.; Haleem, A. A framework for comparative evaluation of lean performance of firms using fuzzy TOPSIS. Int. J. Prod. Qual. Manag. 2013, 11, 371. [Google Scholar] [CrossRef] [Scilit]
- Nunnally, J.C.; Bernstein, I.H. Psychometric Theory, 3rd ed.; McGraw-Hill: New York, NY, USA, 1994. [Google Scholar]
- Kimberlin, C.L.; Winterstein, A.G. Validity and reliability of measurement instruments used in research. Am. J. Health Syst. Pharm. 2008, 65, 2276–2284. [Google Scholar] [CrossRef] [Scilit]
- Pekkola, S.; Hildén, S.; Rämö, J. A maturity model for evaluating an organisation’s reflective practices. Meas. Bus. Excell. 2015, 19, 17–29. [Google Scholar] [CrossRef] [Scilit]
- Loyd, N.; Harris, G.; Gholston, S.; Berkowitz, D. Development of a lean assessment tool and measuring the effect of culture from employee perception. J. Manuf. Technol. Manag. 2020, 31, 1439–1456. [Google Scholar] [CrossRef] [Scilit]
- Diamantopoulos, A.; Siguaw, J.A. Formative versus reflective indicators in organizational measure development: A comparison and empirical illustration. Br. J. Manag. 2006, 17, 263–282. [Google Scholar] [CrossRef] [Scilit]
- Sunder, M.V.; Ganesh, L.S. Identification of the Dynamic Capabilities Ecosystem—A Systems Thinking Perspective. Group Organ. Manag. 2020, 46, 105960112096363. [Google Scholar] [CrossRef] [Scilit]
- Hauser, R.M.; Goldberger, A.S. The treatment of unobservable variables in path analysis. Sociol. Methodol. 1971, 3, 81. [Google Scholar] [CrossRef] [Scilit]
- Jöreskog, K.G.; Goldberger, A.S. Estimation of a model with multiple indicators and multiple causes of a single latent variable. J. Am. Stat. Assoc. 1975, 70, 631. [Google Scholar]
- Solli-Sæther, H.; Gottschalk, P. The Modeling Process for Stage Models. J. Organ. Comput. Electron. Commer. 2010, 20, 279–293. [Google Scholar] [CrossRef] [Scilit]
- Tarhan, A.; Turetken, O.; Reijers, H.A. Business process maturity models: A systematic literature review. Inf. Softw. Technol. 2016, 75, 122–134. [Google Scholar] [CrossRef] [Scilit]
- Singh, B.; Garg, S.K.; Sharma, S.K. Development of index for measuring leanness: Study of an Indian auto component industry. Meas. Bus. Excell. 2010, 14, 46–53. [Google Scholar] [CrossRef] [Scilit]
- Galeazzo, A. Degree of leanness and lean maturity: Exploring the effects on financial performance. Total Qual. Manag. Bus. Excell. 2019, 32, 758–776. [Google Scholar] [CrossRef] [Scilit]
- Maier, A.M.; Moultrie, J.; Clarkson, P.J. Assessing Organizational Capabilities: Reviewing and Guiding the Development of Maturity Grids. IEEE Trans. Eng. Manag. 2012, 59, 138–159. [Google Scholar] [CrossRef] [Scilit]
- Crocker, L.; Algina, J. Introduction to Classical and Modern Test Theory; Harcourt Brace Jovanovich: Orlando, FL, USA, 1986. [Google Scholar]
- Röglinger, M.; Pöppelbuß, J.; Becker, J. Maturity models in business process management. Bus. Process Manag. J. 2012, 18, 328–346. [Google Scholar] [CrossRef] [Scilit]
- Bertrand, M.; Mullainathan, S. Do people mean what they say? Implications for subjective survey data. Am. Econ. Rev. 2001, 91, 67–72. [Google Scholar] [CrossRef] [Scilit]
- Sánchez, A.M.; Pérez, M. The use of lean indicators for operations management in services. Int. J. Serv. Technol. Manag. 2004, 5, 465. [Google Scholar] [CrossRef] [Scilit]
- Maier, A.M.; Moultrie, J.; Clarkson, P.J. Developing maturity grids for assessing organisational capabilities: Practitioner guidance. In Proceedings of the 4th International Conference on Management Consulting, Academy of Management (MCD), Vienna, Austria, 11–13 June 2009. [Google Scholar]
- Zanon, L.G.; Ulhoa, T.F.; Esposto, K.F. Performance measurement and lean maturity: Congruence for improvement. Prod. Plan. Control 2020, 32, 760–774. [Google Scholar] [CrossRef] [Scilit]
- Moody, D.L.; Shanks, G.G. What makes a good data model? Evaluating the quality of entity relationship models. In Entity-Relationship Approach—ER ’94 Business Modelling and Re-Engineering; Lecture Notes in Computer Science; Springer: Berlin/Heidelberg, Germany, 1994; pp. 94–111. [Google Scholar]
- Becker, J.; Rosemann, M.; von Uthmann, C. Guidelines of Business Process Modeling. In Business Process Management; Springer: Berlin/Heidelberg, Germany, 2000; pp. 30–49. [Google Scholar]
- Woodall, W.H.; Borror, C.M. Some relationships between gage R&R criteria. Qual. Reliab. Eng. Int. 2008, 24, 99–106. [Google Scholar]
- Fleiss, J.L. Measuring nominal scale agreement among many raters. Psychol. Bull. 1971, 76, 378–382. [Google Scholar] [CrossRef] [Scilit]
- Hallgren, K.A. Computing inter-rater reliability for observational data: An overview and tutorial. Tutor. Quant. Methods Psychol. 2012, 8, 23–34. [Google Scholar] [CrossRef] [Scilit]
- Campbell, D.T. Relabeling internal and external validity for the applied social sciences. In Advances in Quasi-Experimental Design and Analysis; Trochim, W., Ed.; Jossey-Bass: San Francisco, CA, USA, 1986; pp. 67–77. [Google Scholar]
- Geertz, C. (Ed.) Thick description: Toward an interpretive theory of culture. In The Interpretation of Cultures; Basic Books: New York, NY, USA, 1973; Chapter 2. [Google Scholar]
- Lincoln, Y.; Guba, E. Naturalistic Inquiry; Sage: Beverly Hills, CA, USA, 1985. [Google Scholar]
- Becker, J.; Knackstedt, R.; Pöppelbuß, J. Developing Maturity Models for IT Management. Bus. Inf. Syst. Eng. 2009, 1, 213–222. [Google Scholar] [CrossRef] [Scilit]
- Wendler, R. The maturity of maturity model research: A systematic mapping study. Inf. Softw. Technol. 2012, 54, 1317–1339. [Google Scholar] [CrossRef] [Scilit]
- Sezen, B.; Karakadilar, I.S.; Buyukozkan, G. Proposition of a model for measuring adherence to lean practices: Applied to Turkish automotive part suppliers. Int. J. Prod. Res. 2012, 50, 3878–3894. [Google Scholar] [CrossRef] [Scilit]
- Paulk, M.C.; Curtis, B.; Chrissis, M.B.; Weber, C.V. The Capability Maturity Model for Software, version 1.1. No. CMU/SEI-93-TR-24. Software Engineering Institute: Pittsburgh, PA, USA, 1993.
- Van De Ven, A.H.; Poole, M.S. Explaining Development and Change in Organizations. Acad. Manag. Rev. 1995, 20, 510–540. [Google Scholar] [CrossRef] [Scilit]
- Monteiro, E.L.; Maciel, R.S.P. Maturity models architecture: A large systematic mapping. iSys Braz. J. Inf. Syst. 2020, 13, 110–140. [Google Scholar] [CrossRef] [Scilit]
- Reis, T.L.; Mathias, M.A.S.; de Oliveira, O.J. Maturity models: Identifying the state-of-the-art and the scientific gaps from a bibliometric study. Scientometrics 2016, 110, 643–672. [Google Scholar] [CrossRef] [Scilit]
- Vallerand, J.; Lapalme, J.; Moïse, A. Analysing enterprise architecture maturity models: A learning perspective. Enterp. Inf. Syst. 2015, 11, 859–883. [Google Scholar] [CrossRef] [Scilit]
- ISO/IEC 33004; Information Technology–Process Assessment–Requirements for Process Reference, Process Assessment, and Maturity Models. ISO: Geneva, Switzerland, 2015.
- Moher, D.; Liberati, A.; Tetzlaff, J.; Altman, D.G. Preferred reporting items for systematic reviews and meta-analyses: The PRISMA statement. PLoS Med. 2009, 6, e1000097. [Google Scholar] [CrossRef] [Scilit]
- Koo, T.K.; Li, M.Y. A guideline of selecting and reporting intraclass correlation coefficients for reliability research. J. Chiropr. Med. 2016, 15, 155–163. [Google Scholar] [CrossRef] [Scilit]
- Liker, J.K. The Toyota Way–14 Management Principles from the World’s Greatest Manufacturer; McGraw-Hill: New York, NY, USA, 2004. [Google Scholar]

Disclaimer/Publisher’s Note: The statements, opinions and data contained in all publications are solely those of the individual author(s) and contributor(s) and not of MDPI and/or the editor(s). MDPI and/or the editor(s) disclaim responsibility for any injury to people or property resulting from any ideas, methods, instructions or products referred to in the content. |
© 2026 by the authors. Licensee MDPI, Basel, Switzerland. This article is an open access article distributed under the terms and conditions of the Creative Commons Attribution (CC BY) license.