


Abstract
Background: This study evaluates heuristic and optimization-based methods for minimum-cost distribution flow allocation using discrete-event simulation. Methods: Four distribution networks in Ecuador were modeled in FlexSim 2027, comprising a hypothetical factory–warehouse system and three fuel distribution networks with 147 to 1872 potential connections. Seven allocation strategies were compared across three demand levels (25%, 50%, and 100%), using 31 paired replications. Performance was evaluated in terms of unit cost and algorithm execution time, using Gurobi as the optimization reference. Results: In the factory–warehouse network, Northwest Corner produced a mean unit cost of USD 11.14, compared with USD 9.03 for Gurobi, representing a 23.3% increase. In the Diesel Premium network, these costs were USD 3.1212 and USD 3.1094 per gallon, respectively. Northwest Corner consistently required the shortest execution times (314–826 ms), whereas Gurobi required 3330–44,570 ms. Among strategies achieving costs equal to, lower than, or not significantly different from Gurobi, OR-Tools ranked fastest in nine of twelve configurations, while Minimum Cost ranked first in the remaining three. Conclusions: These findings highlight the importance of obtaining minimum-cost allocations while considering computational efficiency when selecting methods for distribution networks of different sizes.
1. Introduction
Logistics is defined as the planning, implementation, and control of the flow of goods and services within an organization, covering activities such as transportation, inventory management, and warehousing [1]. It plays an important role in the supply chain by efficiently managing the acquisition of raw materials, the supply of goods, and inventory control [2]. Its purpose is to meet customer demands by delivering products under optimal conditions, balancing supply and demand at the lowest possible cost without compromising service quality [3,4].
Logistics systems face challenges that affect their sustainability and operational efficiency. The most common problems include poor product allocation, which leads to longer travel times [5]; the management of large volumes of data, which makes decision-making more difficult [6]; lack of accurate knowledge of real demand, causing shipment cancellations and imbalances in delivery routes [7]; and limited factory capacity, which results in inefficient vehicle utilization, stockouts at warehouses, and bottlenecks [8]. These inefficiencies not only increase operating costs but also compromise the overall performance of the logistics system. Addressing these issues requires an approach that enables the efficient optimization of logistics flows.
Optimization strategies aim to solve transportation problems by determining the optimal flow from origin to destination, minimizing total costs while considering supply and demand constraints [9,10]. Heuristic methods and optimization algorithms seek to satisfy expected demand while achieving the best possible results [11,12].
1.1. Literature Review
Among the commonly used heuristic methods is the Northwest Corner Method, which assigns flow starting from the upper-left cell, satisfying supply and demand until the entire table is completed. It is implemented in a distribution matrix to facilitate the calculation of transportation costs, optimizing processes and simplifying operational tasks [13]. The Minimum Cost Method selects the cell with the lowest cost and assigns the maximum possible amount of flow, repeating the process iteratively. Its objective is to solve the transportation cost problem at the lowest possible cost, improving distribution efficiency and reducing total shipping costs [14]. The Vogel’s Approximation Method seeks an initial solution that minimizes transportation costs by correcting deficiencies and generating a near-optimal initial solution [15,16].
Alternatively, specific Python libraries are used to solve optimization problems, such as CVXPY, which is a library used to model and solve optimization problems. It allows mathematical formulations to be expressed declaratively and solved using specialized solvers [17]. It has been applied to logistics problems such as the optimal placement of parcel lockers to maximize total benefits, where the implementation of the model helped validate the optimal quality of the proposed solutions [18]. It has also been used in studies focused on the combination of trucks and drones for goods delivery, efficiently solving the model and achieving improvements in demand fulfillment across all evaluated scenarios [19]. Additionally, CVXPY has been applied to energy-related logistics problems involving the optimal flow allocation in natural gas transportation networks, considering costs and demand centers; the modeling of constraints enabled the efficient evaluation of different operational scenarios within the system [20].
Another library used to solve optimization problems is OR-Tools, an open-source library developed by Google for addressing combinatorial optimization and operations research problems in logistics. It allows complex systems to be modeled through constraints and solved using specialized solvers [21]. It has been applied to resource allocation problems in logistics, such as container yard management, where determining the appropriate positions becomes challenging due to location conflicts; by modeling the problem with constraints, high-quality solutions were obtained in shorter computation times [22]. It has also been used in vehicle distribution problems with open capacity, where companies must decide which routes to use while considering constraints and minimizing distance and travel time, achieving real-time optimization of delivery routes and vehicle utilization [23]. Additionally, it has been applied to problems involving drones with limited autonomy that must coordinate with vehicles for energy recharging; by considering battery and time constraints, the model optimized route speeds and reduced travel times, resulting in improved efficiency [24].
Likewise, NetworkX is used to solve optimization problems; it is a library designed for the analysis and manipulation of complex network graphs used in logistics studies, enabling flexible modeling of systems to analyze transportation and allocation networks [25]. It has been used to propose an approach for optimizing urban public transportation networks modeled as graphs, where nodes represent stops and intersections and edges represent bus routes. This approach made it possible to identify bottlenecks and congestion areas, allowing alternative scenarios to be simulated for improved planning [26]. NetworkX has also been applied to urban travel networks with the objective of assigning routes to multiple origin–destination trips while maximizing route overlap; this enabled the calculation of compatibility metrics at different levels and the comparison of various route assignment strategies [27]. In addition, an innovative approach to supply chain risk management has been proposed using graph theory as the central analytical tool, allowing risks to be evaluated and prioritized in an objective and quantitative manner, thereby facilitating decision-making under conditions of uncertainty [28].
Optimization strategies have been widely used to solve flow allocation problems, making it important to evaluate their performance and effectiveness. For this purpose, discrete event simulation allows the evaluation of distribution performance under conditions of uncertainty and variable parameters such as demand, production capacity, costs, and distances, among others [29,30]. It facilitates the digital replication of processes in order to understand their behavior and performance [31]. Integrating an optimization algorithm supports more realistic logistics decision-making [32]. The simulation model enables the representation of the entire supply chain and the evaluation of process efficiency, helping to identify opportunities for performance improvement [33]. For the production of carbonated beverages, a simulation was carried out using MATLAB R2024a, and a comparison was proposed between two quality inspection methods to determine which one provided better productive performance. The results indicated that the automated option achieved higher production levels [34].
FlexSim is a simulation software used to represent the processes and operational resources of an organization [35]. It helps model logistics systems in a practical manner, improving decision-making to minimize travel times and distances, thereby reducing supply chain costs [36,37]. This tool has the capability to manage industrial scenarios through input parameters such as delivery windows, required demand, maximum capacity, and distribution, in order to address operational problems [38]. FlexSim has also been integrated into various studies on process simulation and optimization; for example, ref. [39] implemented it to model the logistics system of a manufacturing workshop and propose improvements. In addition, it has been used to evaluate warehouse performance and optimize material flows through algorithms [40], and other studies have highlighted its combination with network models and optimization techniques for logistics analysis [41].
In Ecuador, FlexSim has been implemented in different industrial sectors for process simulation. For example, ref. [42] modeled a manufacturing process in metal-mechanical companies to identify bottlenecks and reduce production times. In the textile sector, it has been used to analyze the supply chain and develop performance indicators [43]. Likewise, in the floriculture industry, it has been applied to optimize energy consumption and propose improvements aimed at cost reduction [44]. Additionally, it has been used in a company in the heating, ventilation, and air conditioning sector, where productivity was limited due to bottlenecks. With the support of FlexSim, the impact of replacing a manual bending machine with a hydraulic bending machine was evaluated, and the results showed an increase in daily production from 20 units to 31 units [45].
Table 1 compares previous studies on transportation heuristics and minimum-cost flow optimization, highlighting their objectives, methods, and main findings.
Table 1.
Comparison of related studies on transportation heuristics and minimum-cost flow optimization.
1.2. Research Gap and Contributions
Previous studies have evaluated transportation heuristics and minimum-cost flow algorithms in terms of solution quality, computational performance, and applications to specific transportation networks (Table 1). The present study extends these evaluations by comparing seven established flow allocation strategies, including three heuristic methods and four optimization-based approaches, within a common discrete-event simulation framework. The experimental design considers four distribution networks of different sizes, including three Ecuadorian fuel distribution models based on actual supply terminal and service station locations and historical dispatch records, from which supply capacities and station-level demands were estimated. All strategies are evaluated across three demand levels under identical stochastic demand realizations, using 31 paired replications per configuration. This approach enables a controlled comparison of the performance of different implementations and provides empirical evidence for identifying computationally efficient alternatives that achieve allocation costs comparable to those of the optimization reference under varying network and demand conditions.
This study presents a proof-of-concept logistics case study designed to evaluate the performance of different flow allocation strategies in Ecuador. The original model considers factories and warehouses located in strategic cities, from which generic, non-perishable products are shipped, allowing the analysis to focus on the efficiency of flow allocation. Although the model does not correspond to a specific company, it incorporates geographic information and assumes operational parameters to evaluate the methods under controlled conditions. Additionally, the study extends the original model to three larger fuel distribution networks in Ecuador, incorporating historical fuel dispatch data and geographic information on supply terminals and service stations.
The objective of this study is to evaluate heuristic and optimization-based strategies for minimum-cost flow allocation in logistics distribution systems using discrete-event simulation. To this end, four distribution networks were modeled in FlexSim 2027, integrating supply capacity constraints, transportation costs, and variable customer demand. The models incorporate heuristic methods (Northwest Corner, Minimum Cost, and Vogel’s Approximation) and optimization-based approaches implemented through Python 3.10 (CVXPY, OR-Tools, NetworkX, and Gurobi). This approach enables comparative performance analysis of different flow allocation strategies across distribution networks of varying sizes and demand conditions.
The main contributions of this study are:
- Integration of seven heuristic and optimization-based flow allocation methods within a common FlexSim–Python simulation framework.
- Comparative evaluation of a hypothetical factory–warehouse network and three larger Ecuadorian fuel distribution networks, incorporating geographic information and historical dispatch data.
- Evaluation of allocation costs and computational performance across networks with 147 to 1872 potential connections, using paired stochastic replications and a common optimization reference.
- Identification of computationally efficient alternatives that achieve allocation costs comparable to the reference solution under different demand conditions.
2. Materials and Methods
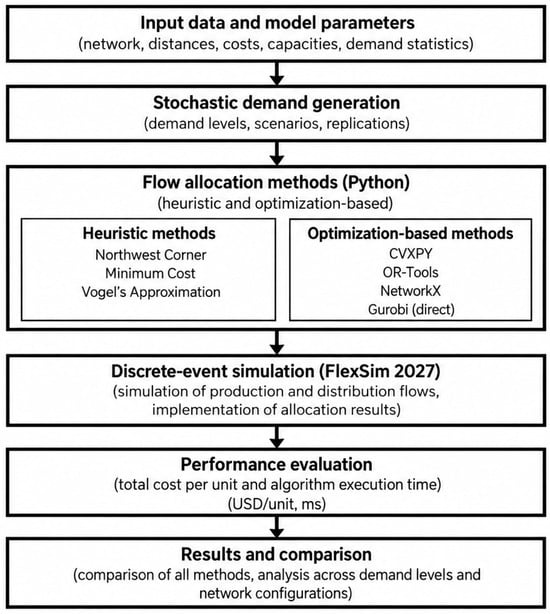
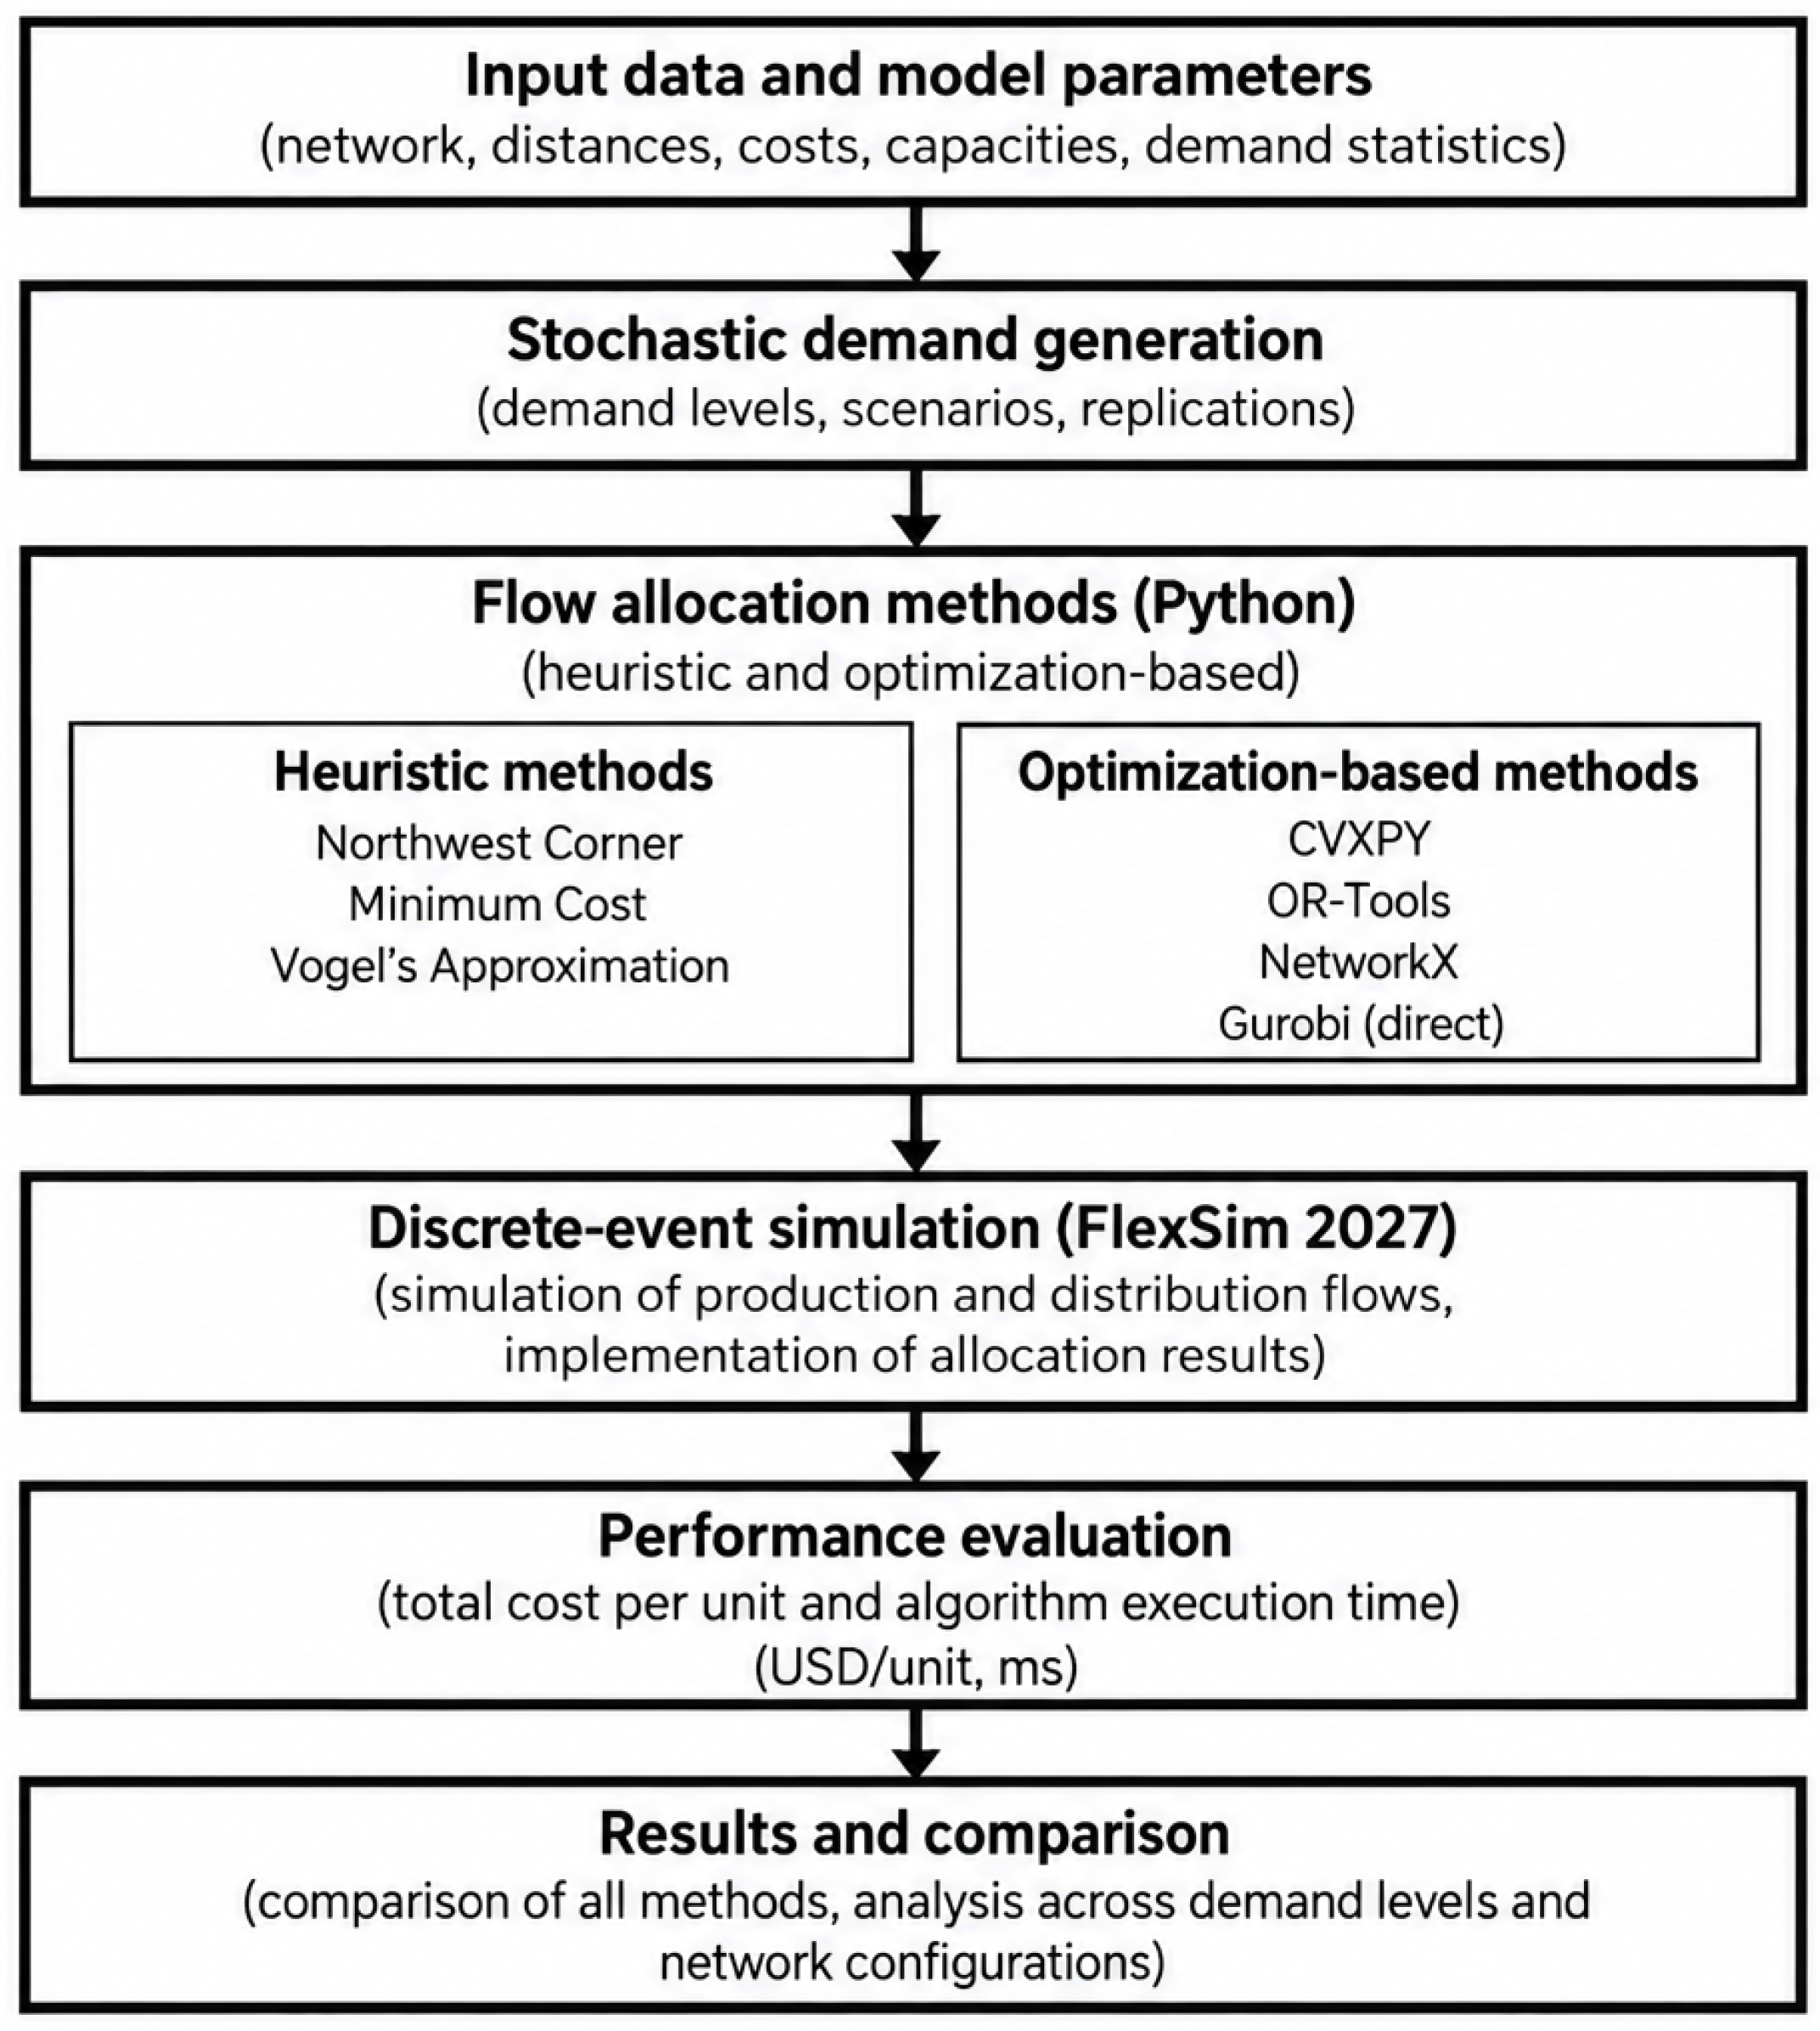
The overall methodological framework is illustrated in Figure 1. Input data and model parameters are integrated into FlexSim 2027, where stochastic demand is generated for each experimental scenario. The corresponding flow allocation problem is solved through Python using heuristic and optimization-based methods. The resulting allocations are implemented in the discrete-event simulation, and performance is evaluated in terms of total cost per unit and algorithm execution time. Finally, the methods are compared across demand levels and distribution network configurations (Figure 1).
Figure 1.
Flowchart of the methodology.
2.1. Description of the Case Studies
A supply chain model presented by Autodesk is taken as a conceptual reference, as it integrates daily stochastic demand generation and optimal flow allocation through optimization techniques [49]. Building on this approach, the present work develops a simulation model adapted to the Ecuadorian context, incorporating heuristic methods such as the Northwest Corner Method, the Minimum Cost Method, and Vogel’s Approximation Method, as well as Python libraries including CVXPY, OR-Tools, and NetworkX, and the Gurobi optimization solver. These methods are evaluated under different demand levels and distribution network configurations, allowing for a comparative performance analysis. Four distribution networks of varying sizes are considered. The initial case study consists of seven factories and twenty-one warehouses located in Ecuador, while three additional case studies represent Diesel Premium (diesel), Extra (85 RON gasoline), and Ecopaís (85 RON ethanol-blended gasoline) distribution networks, incorporating geographic information and historical fuel dispatch data. All four networks are evaluated using FlexSim 2027 and the same flow allocation methods.
2.1.1. Factory–Warehouse Distribution Network
This case study represents a hypothetical distribution network, with factory locations and operating parameters defined for simulation purposes. The factories are located in the cities of Guayaquil, Quito, Cuenca, Santo Domingo, Machala, Manta, and Portoviejo. They are situated in these locations due to their national industrial relevance and their well-established road and logistics infrastructure, which facilitates distribution throughout the country. Each factory has a maximum supply capacity and a unit production cost. The unit production cost reflects the characteristics of each factory, meaning that different factories may incur different unit costs for the same product depending on factors such as location, raw material costs, labor expenses, production volume, and the technology used. The unit production costs considered in this study are presented in Table 2 and were assumed based on an economy-of-scale criterion, whereby factories with higher production capacities exhibit lower unit costs, while those with lower capacities present higher unit costs.
Table 2.
Factory capacity and production cost per unit.
Additionally, the system incorporates warehouses distributed across the cities of Ambato, Azogues, Babahoyo, Bahía de Caráquez, Esmeraldas, Francisco de Orellana, Ibarra, Latacunga, Loja, Milagro, Montecristi, Nueva Loja, Pedernales, Puyo, Quevedo, Riobamba, Salinas, Sangolquí, Tena, Tulcán, and Zamora. These locations were selected to represent a diversified demand covering different regions of the country. The average demand assigned to each warehouse is presented in Table 3, and it is determined that the sum of the system’s average demands equals 2000 units. Likewise, the demand at each warehouse is characterized by a relative variability of 30% with respect to its average value, allowing demand fluctuations across warehouses to be represented. This percentage is adopted as a reference value, as it models a moderate level of demand variability without generating extreme scenarios, while maintaining system stability.
Table 3.
Demand for each warehouse.
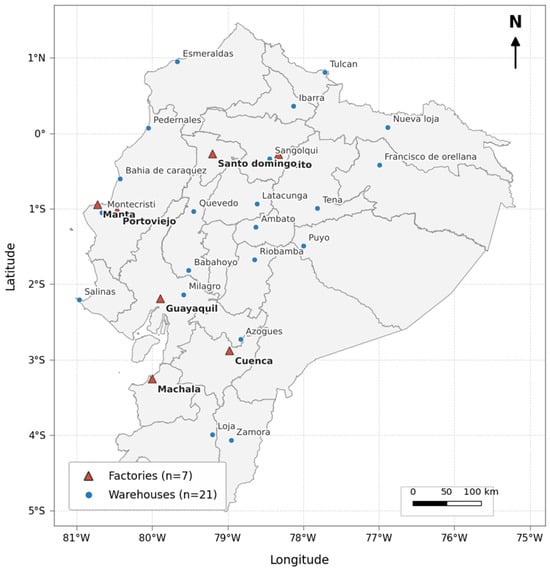
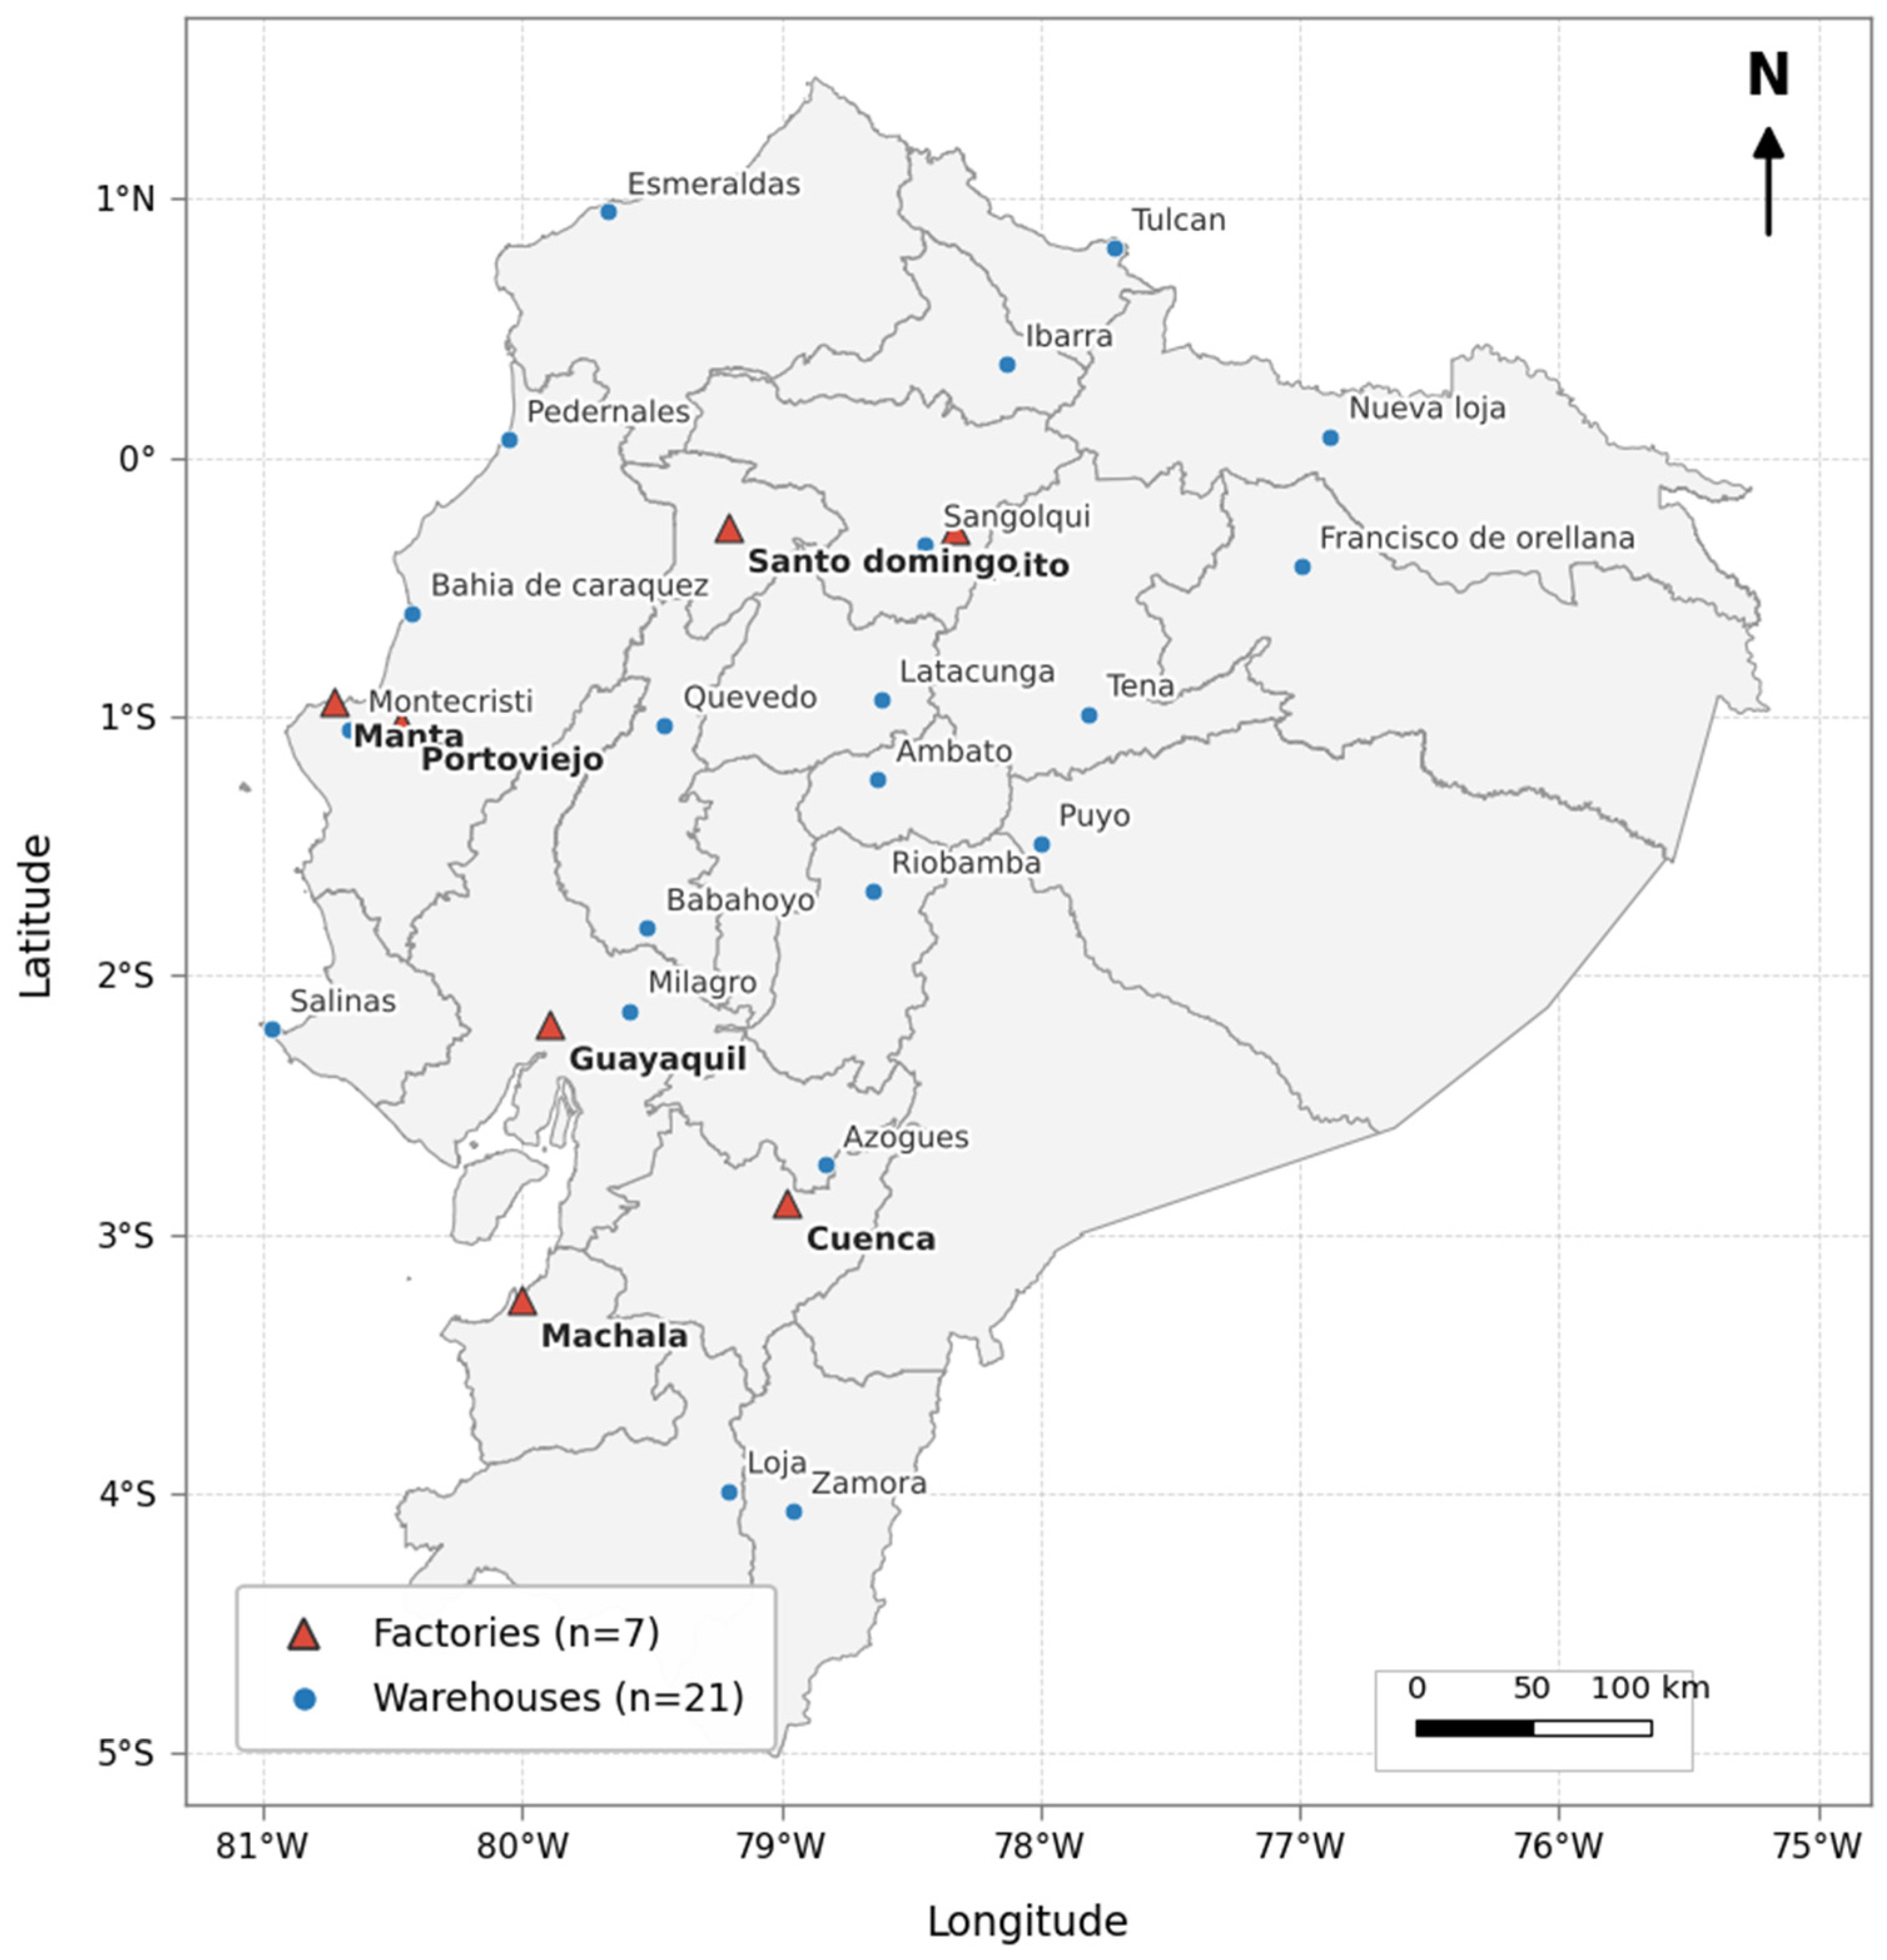
The geographic locations of the factories and warehouses modeled in this study are presented in Figure 2. This allows the coverage of the logistics network across Ecuador to be observed.
Figure 2.
Geographic location of the factories and warehouses within the modeled logistics network.
2.1.2. Fuel Distribution Networks
Three additional case studies were developed using publicly available information on fuel distribution in Ecuador. The distribution system of the public oil company EP Petroecuador was used as a reference because the company publishes monthly fuel dispatch volumes by terminal and product type, as well as official terminal selling prices [50]. The models also incorporated the geographic locations of supply terminals. This information allowed the development of three distribution networks for Diesel Premium, Extra gasoline, and Ecopaís gasoline.
The models consider nine supply terminals, whose geographic coordinates and assigned capacities are presented in Table 4. Capacities were estimated from monthly dispatch records for January–September 2026 [51], converting volumes into daily values by excluding Sundays. For each fuel type, the maximum network-wide daily dispatch was allocated among terminals in proportion to their mean daily dispatch over the study period. These values represent estimated model capacities based on official data rather than verified physical capacities.
Table 4.
Supply terminals and capacities considered in the fuel distribution case studies.
Service station locations were obtained from OpenStreetMap using Overpass Turbo (https://overpass-turbo.eu/) through an Overpass QL query that identified fuel stations associated with Petroecuador or Petrocomercial in the name, brand, operator, or network fields. Unclear records were manually verified, resulting in 208 stations. Diesel Premium is distributed nationwide, whereas Extra and Ecopaís gasoline are distributed in specific provinces, as reported in [52] and cross-checked against Petroecuador’s fuel dispatch records. Accordingly, the diesel network included all 208 stations, while the Extra and Ecopaís networks included 133 and 75 stations, respectively. The complete list of stations and their geographic coordinates is provided in the Supplementary Materials, while Table 5 summarizes the network characteristics.
Table 5.
Characteristics of the fuel distribution case studies.
Daily demand was estimated using historical dispatch volumes, with the average demand for each fuel type distributed among its service stations. Stochastic demand was generated using a normal distribution, applying the same coefficient of variation to all stations within each fuel case. Three demand levels (25%, 50%, and 100%) were evaluated, with 31 replications per treatment. The terminal prices used were USD 3.102332/gal for Diesel Premium and USD 3.092152/gal for Extra and Ecopaís, based on the official prices published for 12 June–11 July 2026 [50]. A transportation cost of USD 0.50/km was applied to all cases.
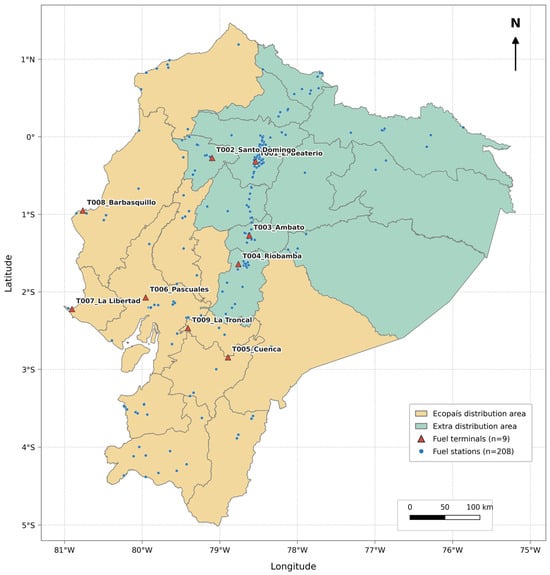
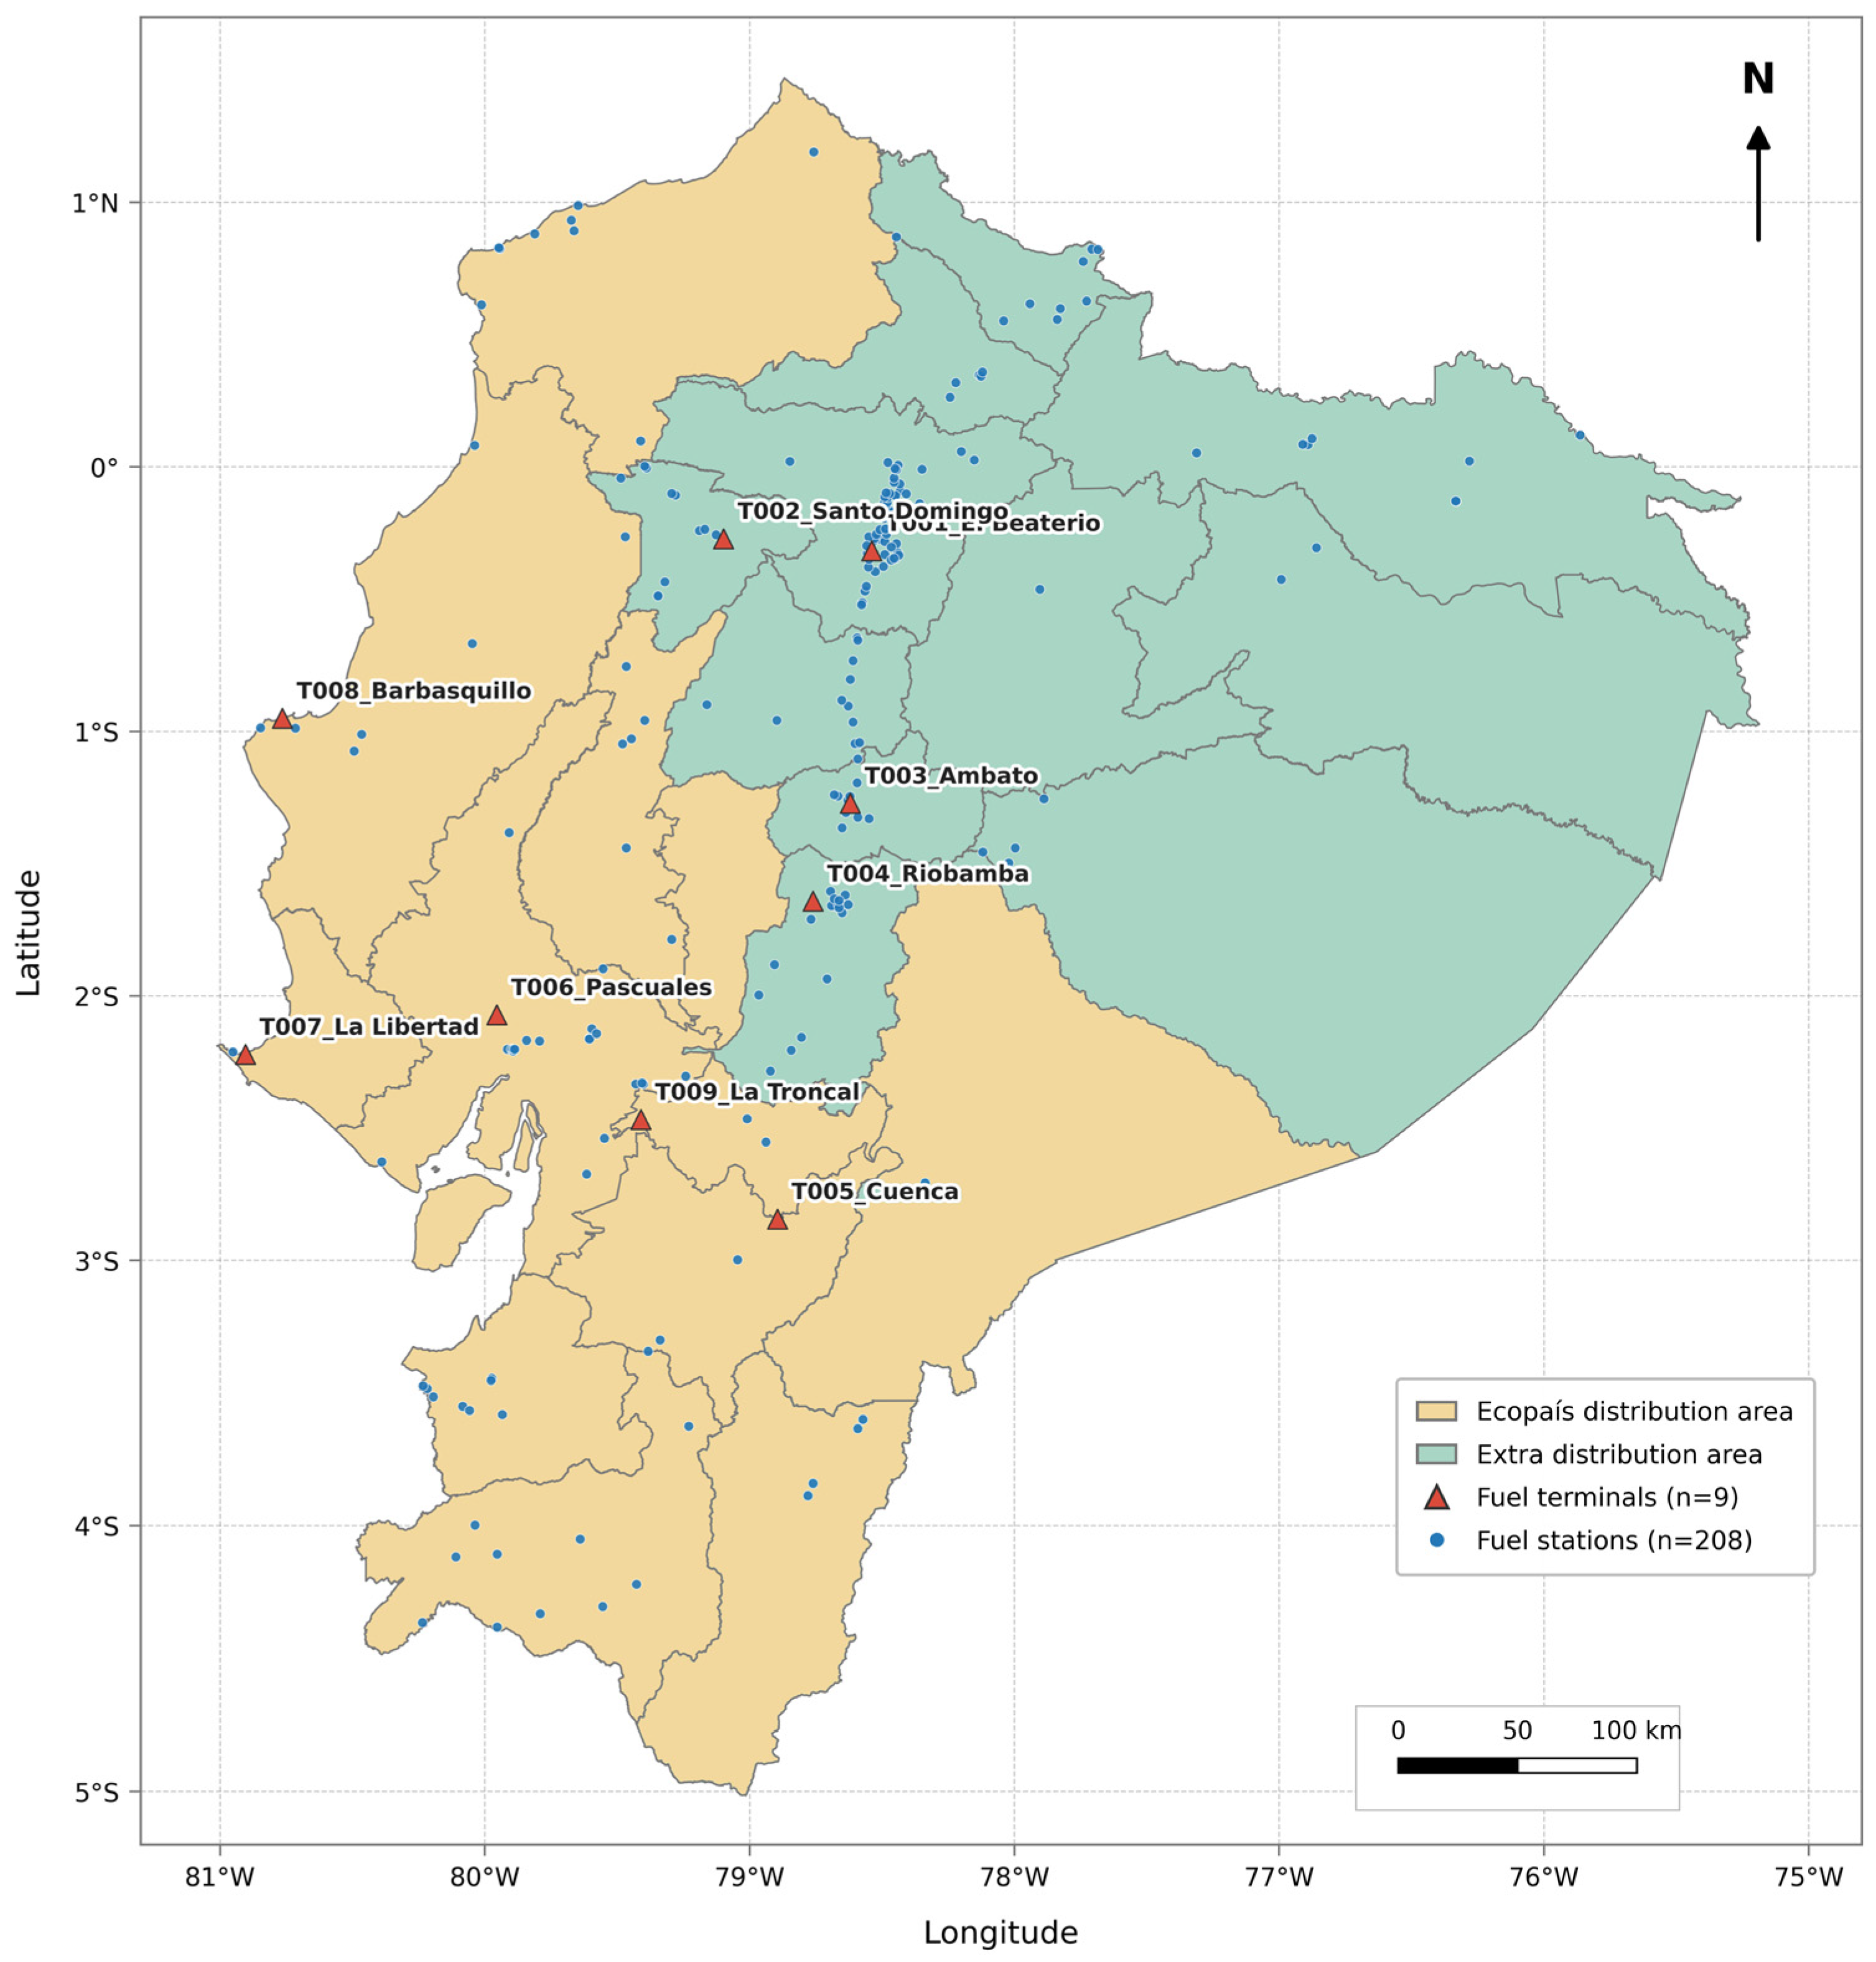
Although the models incorporate real geographic and historical information (Figure 3), they do not reproduce the actual operations of EP Petroecuador. Station-level demand, supply assignments, and some operational parameters were estimated or assumed based on the available information. These assumptions were not validated with the company. The purpose of the models is to compare the allocation methods under conditions closer to those of larger distribution networks, rather than to evaluate the actual performance of EP Petroecuador’s network.
Figure 3.
Geographic location of the terminals and fuel stations within the modeled fuel logistics networks.
2.1.3. Transport Characteristics
Transportation between supply and demand nodes was represented in FlexSim 2027 using generic vehicles, without distinguishing vehicle types or imposing fleet-size or vehicle-capacity constraints. Road distances and travel times were obtained through the GIS module using the available road network and an external routing server. The model allows multiple trips to satisfy the demand assigned to each destination. This approach focuses the analysis on flow allocation without introducing additional vehicle scheduling constraints.
The distances Dij, where i represents the i-th factory and j the j-th warehouse, are obtained automatically through the GIS module. Using FlexSim’s getDistance() and getDuration() functions, the available routes are determined based on the defined road network and an external routing server. Since the study focuses on optimal flow allocation, no limit is imposed on the number of trucks available per factory. This approach allows the analysis to concentrate on flow allocation between factories and warehouses without introducing additional variables related to vehicle type or additional operational constraints.
2.1.4. Costs
The model begins with an estimation of the total cost per unit, defined as the sum of the production cost per unit and transportation cost per unit. Based on this cost estimation, the model constructs an initial cost matrix that is used by the optimization algorithms during the simulation. The nomenclature used for mathematical formulation can be found in the Nomenclature section. The total cost per unit is calculated as follows:
The transportation cost per unit is calculated as follows:
A typical value of Ckm in Ecuador is between 0.25 and depending on vehicle type, distance traveled, and operating conditions [53,54]. This study assumed a value of .
2.1.5. Model Development
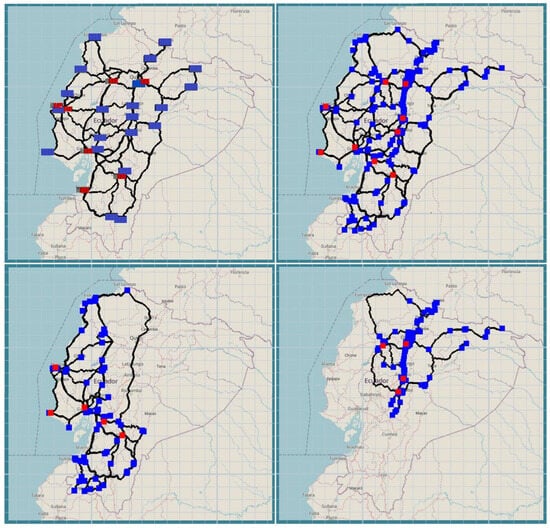
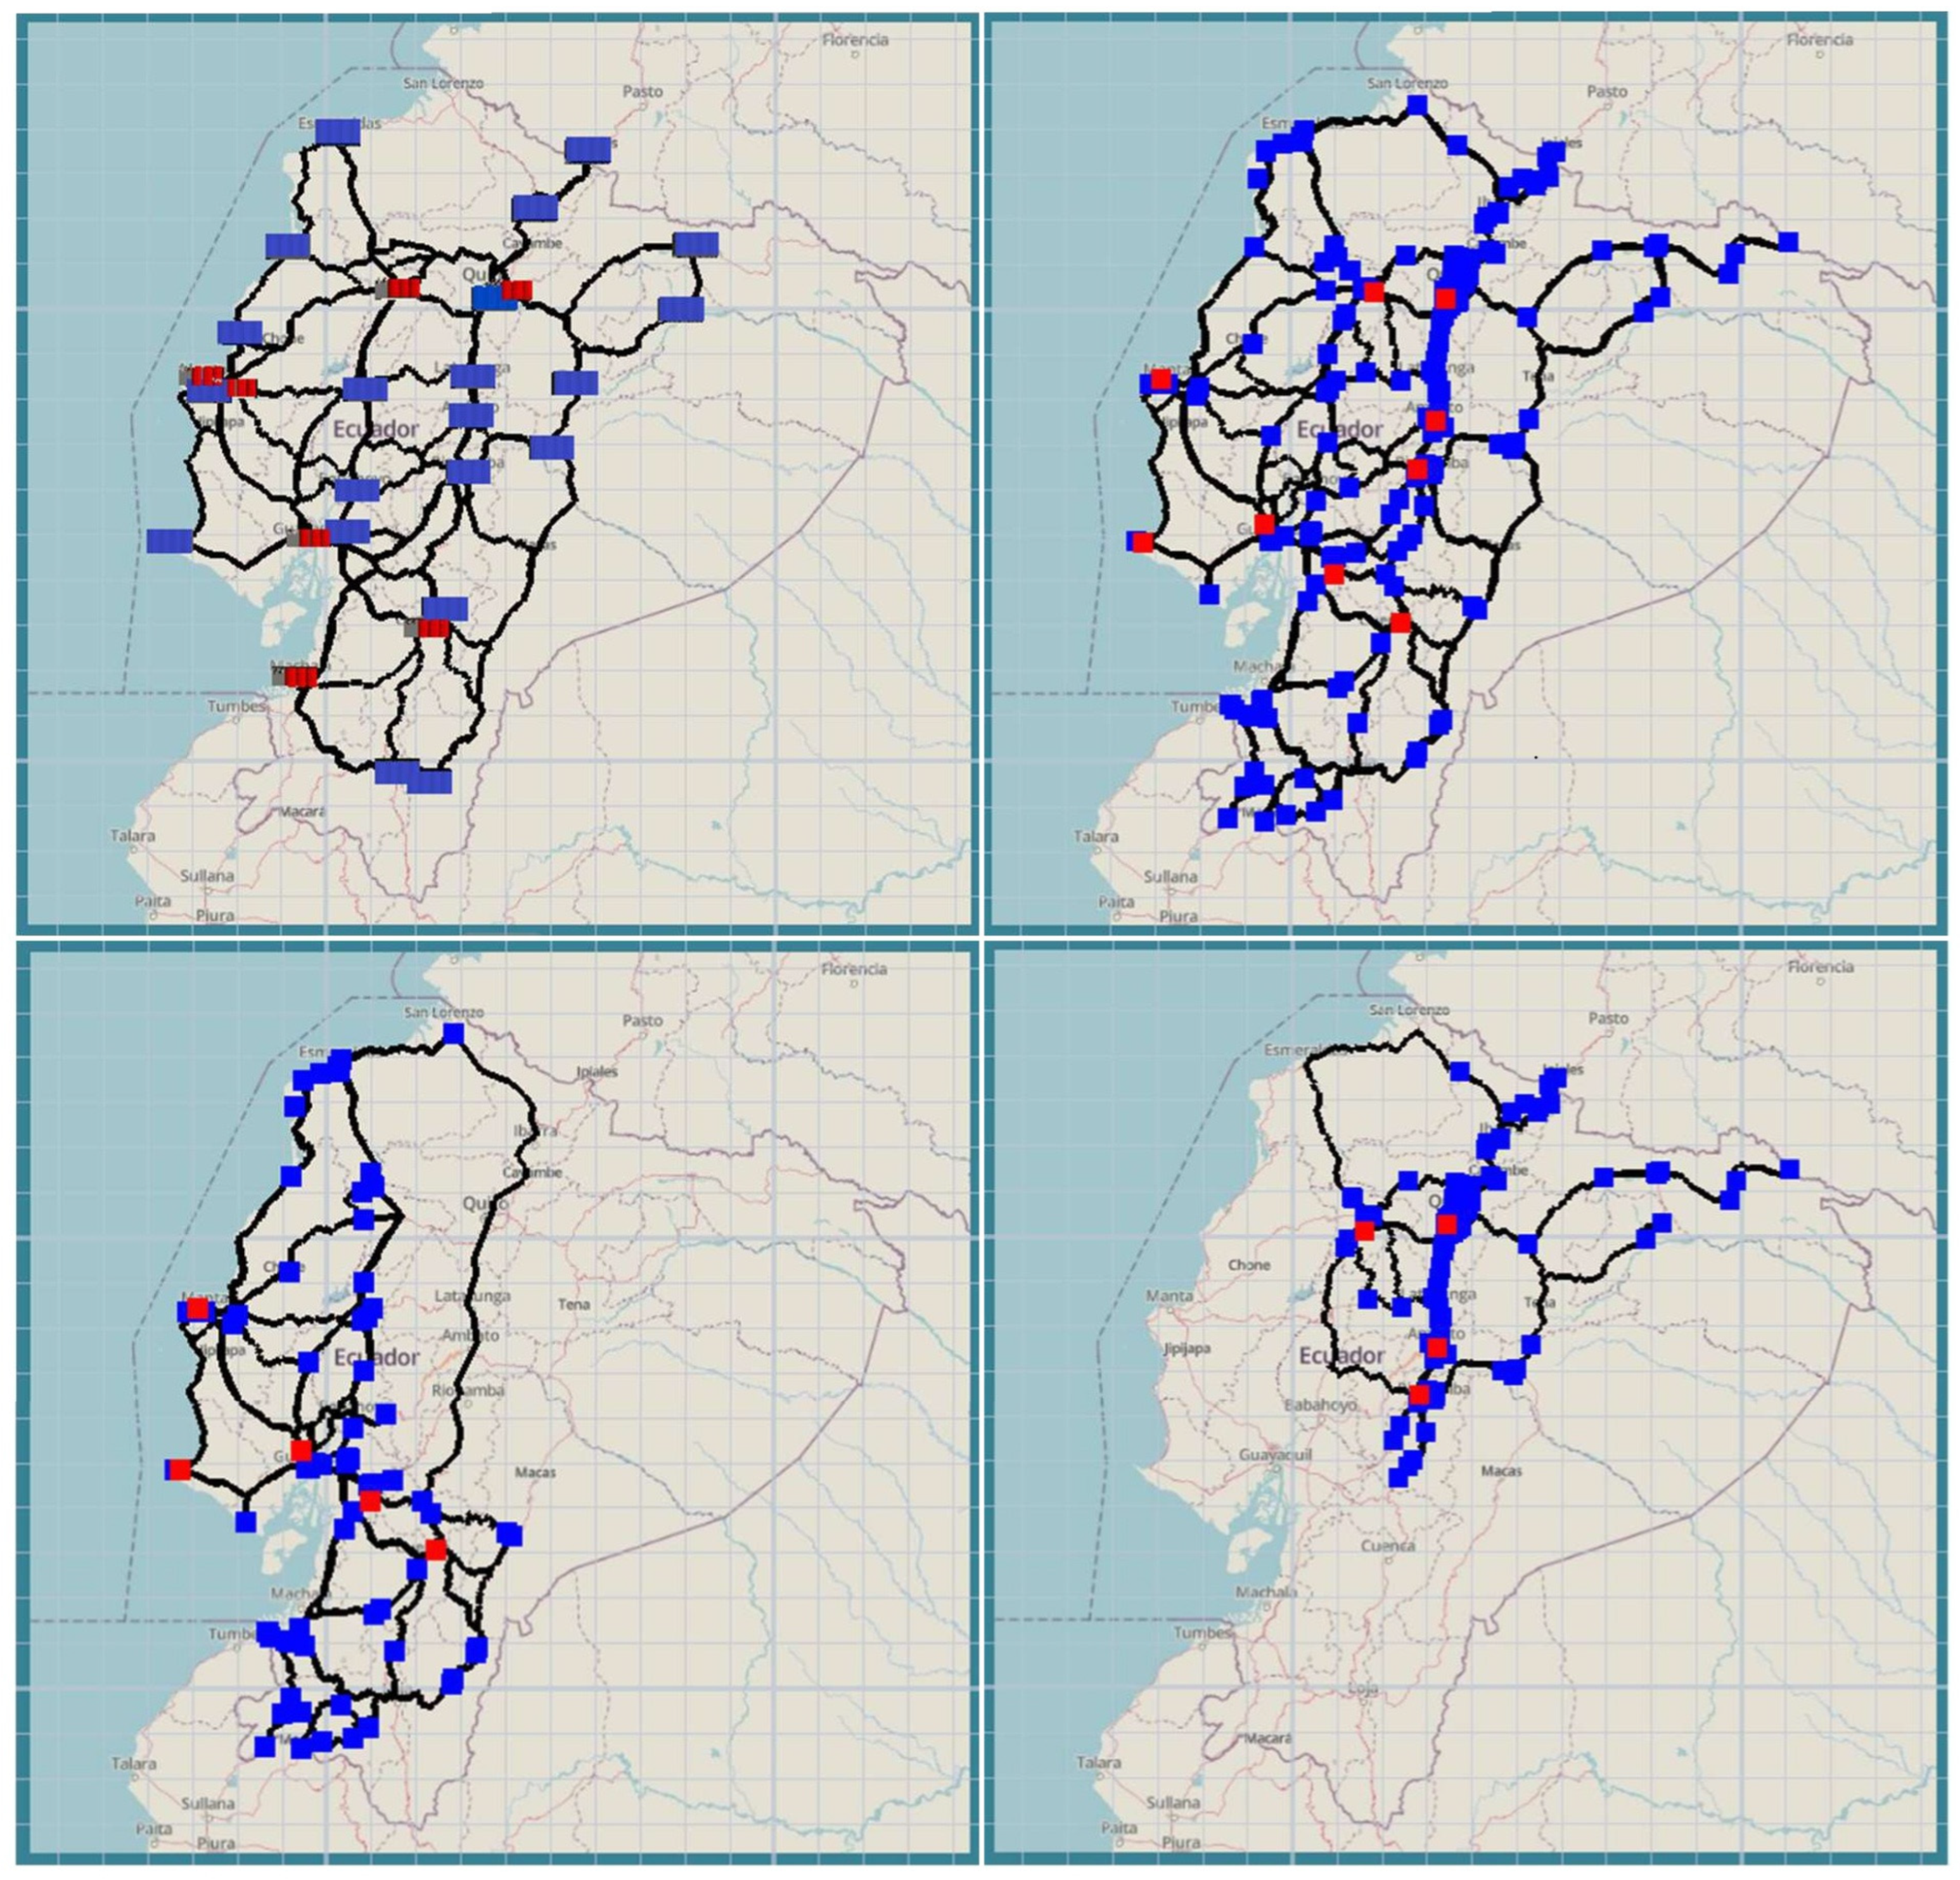
The simulation models were developed in FlexSim 2027 using the GIS Navigator module to represent the distribution networks on a geographic map of Ecuador. Factories, warehouses, supply terminals, and service stations were positioned using their geographic coordinates. Facility parameters, presented in Table 2, Table 3, Table 4 and Table 5, were assigned through Object Property Tables. Driving routes between supply and demand nodes were calculated using the OSRM routing server (https://router.project-osrm.org/route/v1/driving/, accessed on 27 July 2026). The resulting distances, travel times, and transportation costs were stored in Global Tables and used by the flow allocation algorithms. Figure 4 illustrates the geographic distribution of facilities and the transportation networks considered in the case studies, modeled in FlexSim 2027.
Figure 4.
FlexSim 2027 models: factory–warehouse network (upper left); Diesel Premium network (upper right); Ecopaís gasoline network (lower left); and Extra gasoline network (lower right). Red and blue markers represent supply and demand nodes, respectively, while black lines indicate road transportation routes.
The Lead Time Cost Per Day and Cost Per Km were defined as global parameters, allowing these values to be modified according to the study scenario.
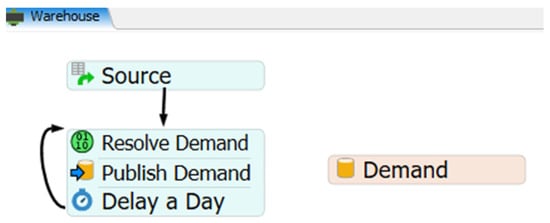
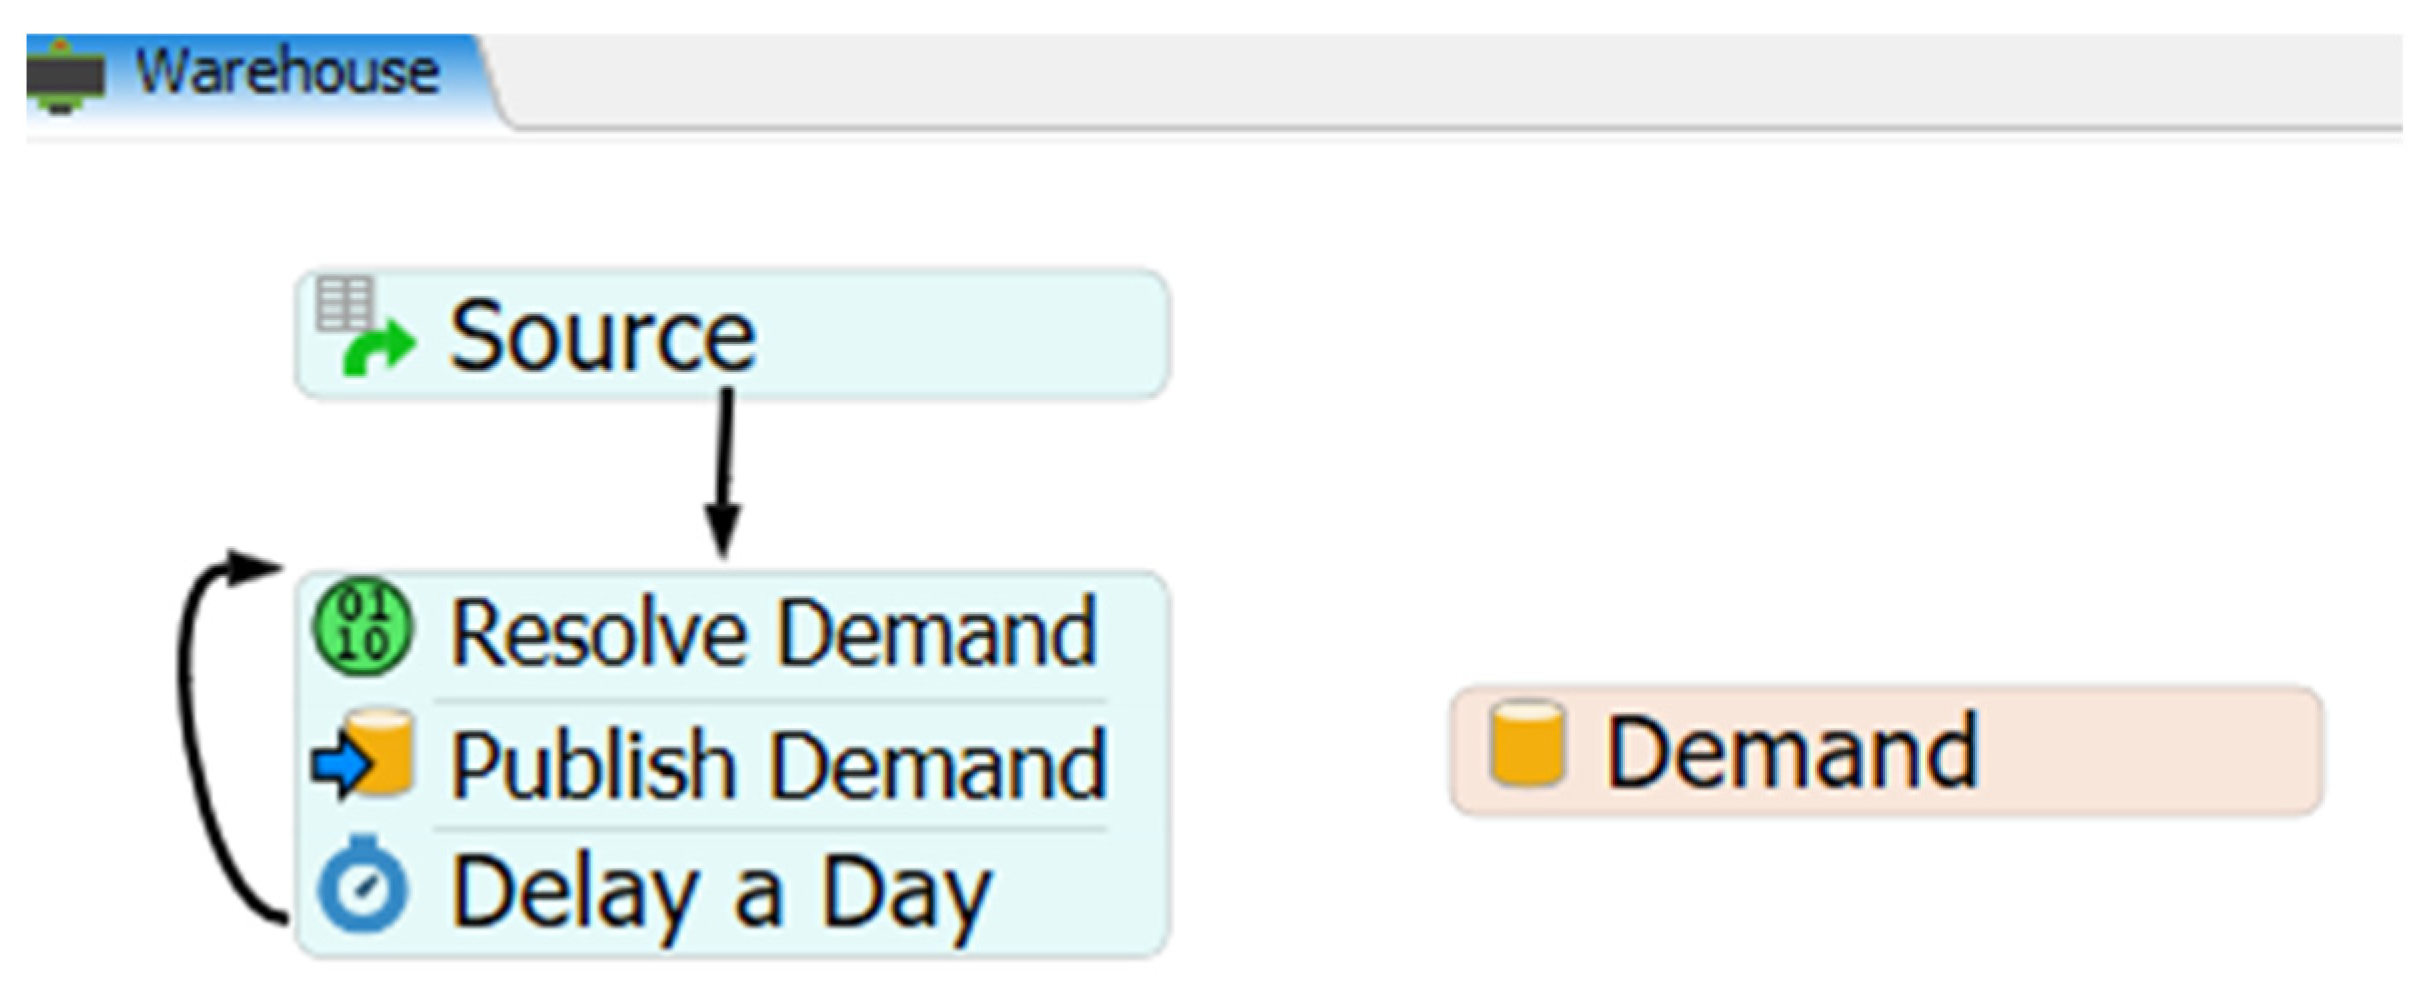
Within Process Flow, a block called Warehouse was defined, where Figure 5 illustrates the demand behavior flow. The process begins with a Source, which generates a token at time zero to initiate the demand cycle. Next, Resolve Demand calculates the quantity required by the warehouse for that period. Demand follows a normal distribution with a coefficient of variation defined for each case study and applied to each warehouse, and this value is published to a global list through the Object Property Table. Finally, the Delay a Day block introduces a one-day time delay, after which the process reconnects to the initial block, allowing demand to be continuously simulated over time.
Figure 5.
Warehouse Process flow.
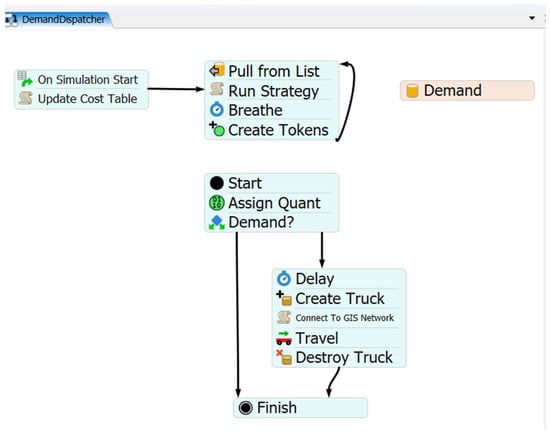
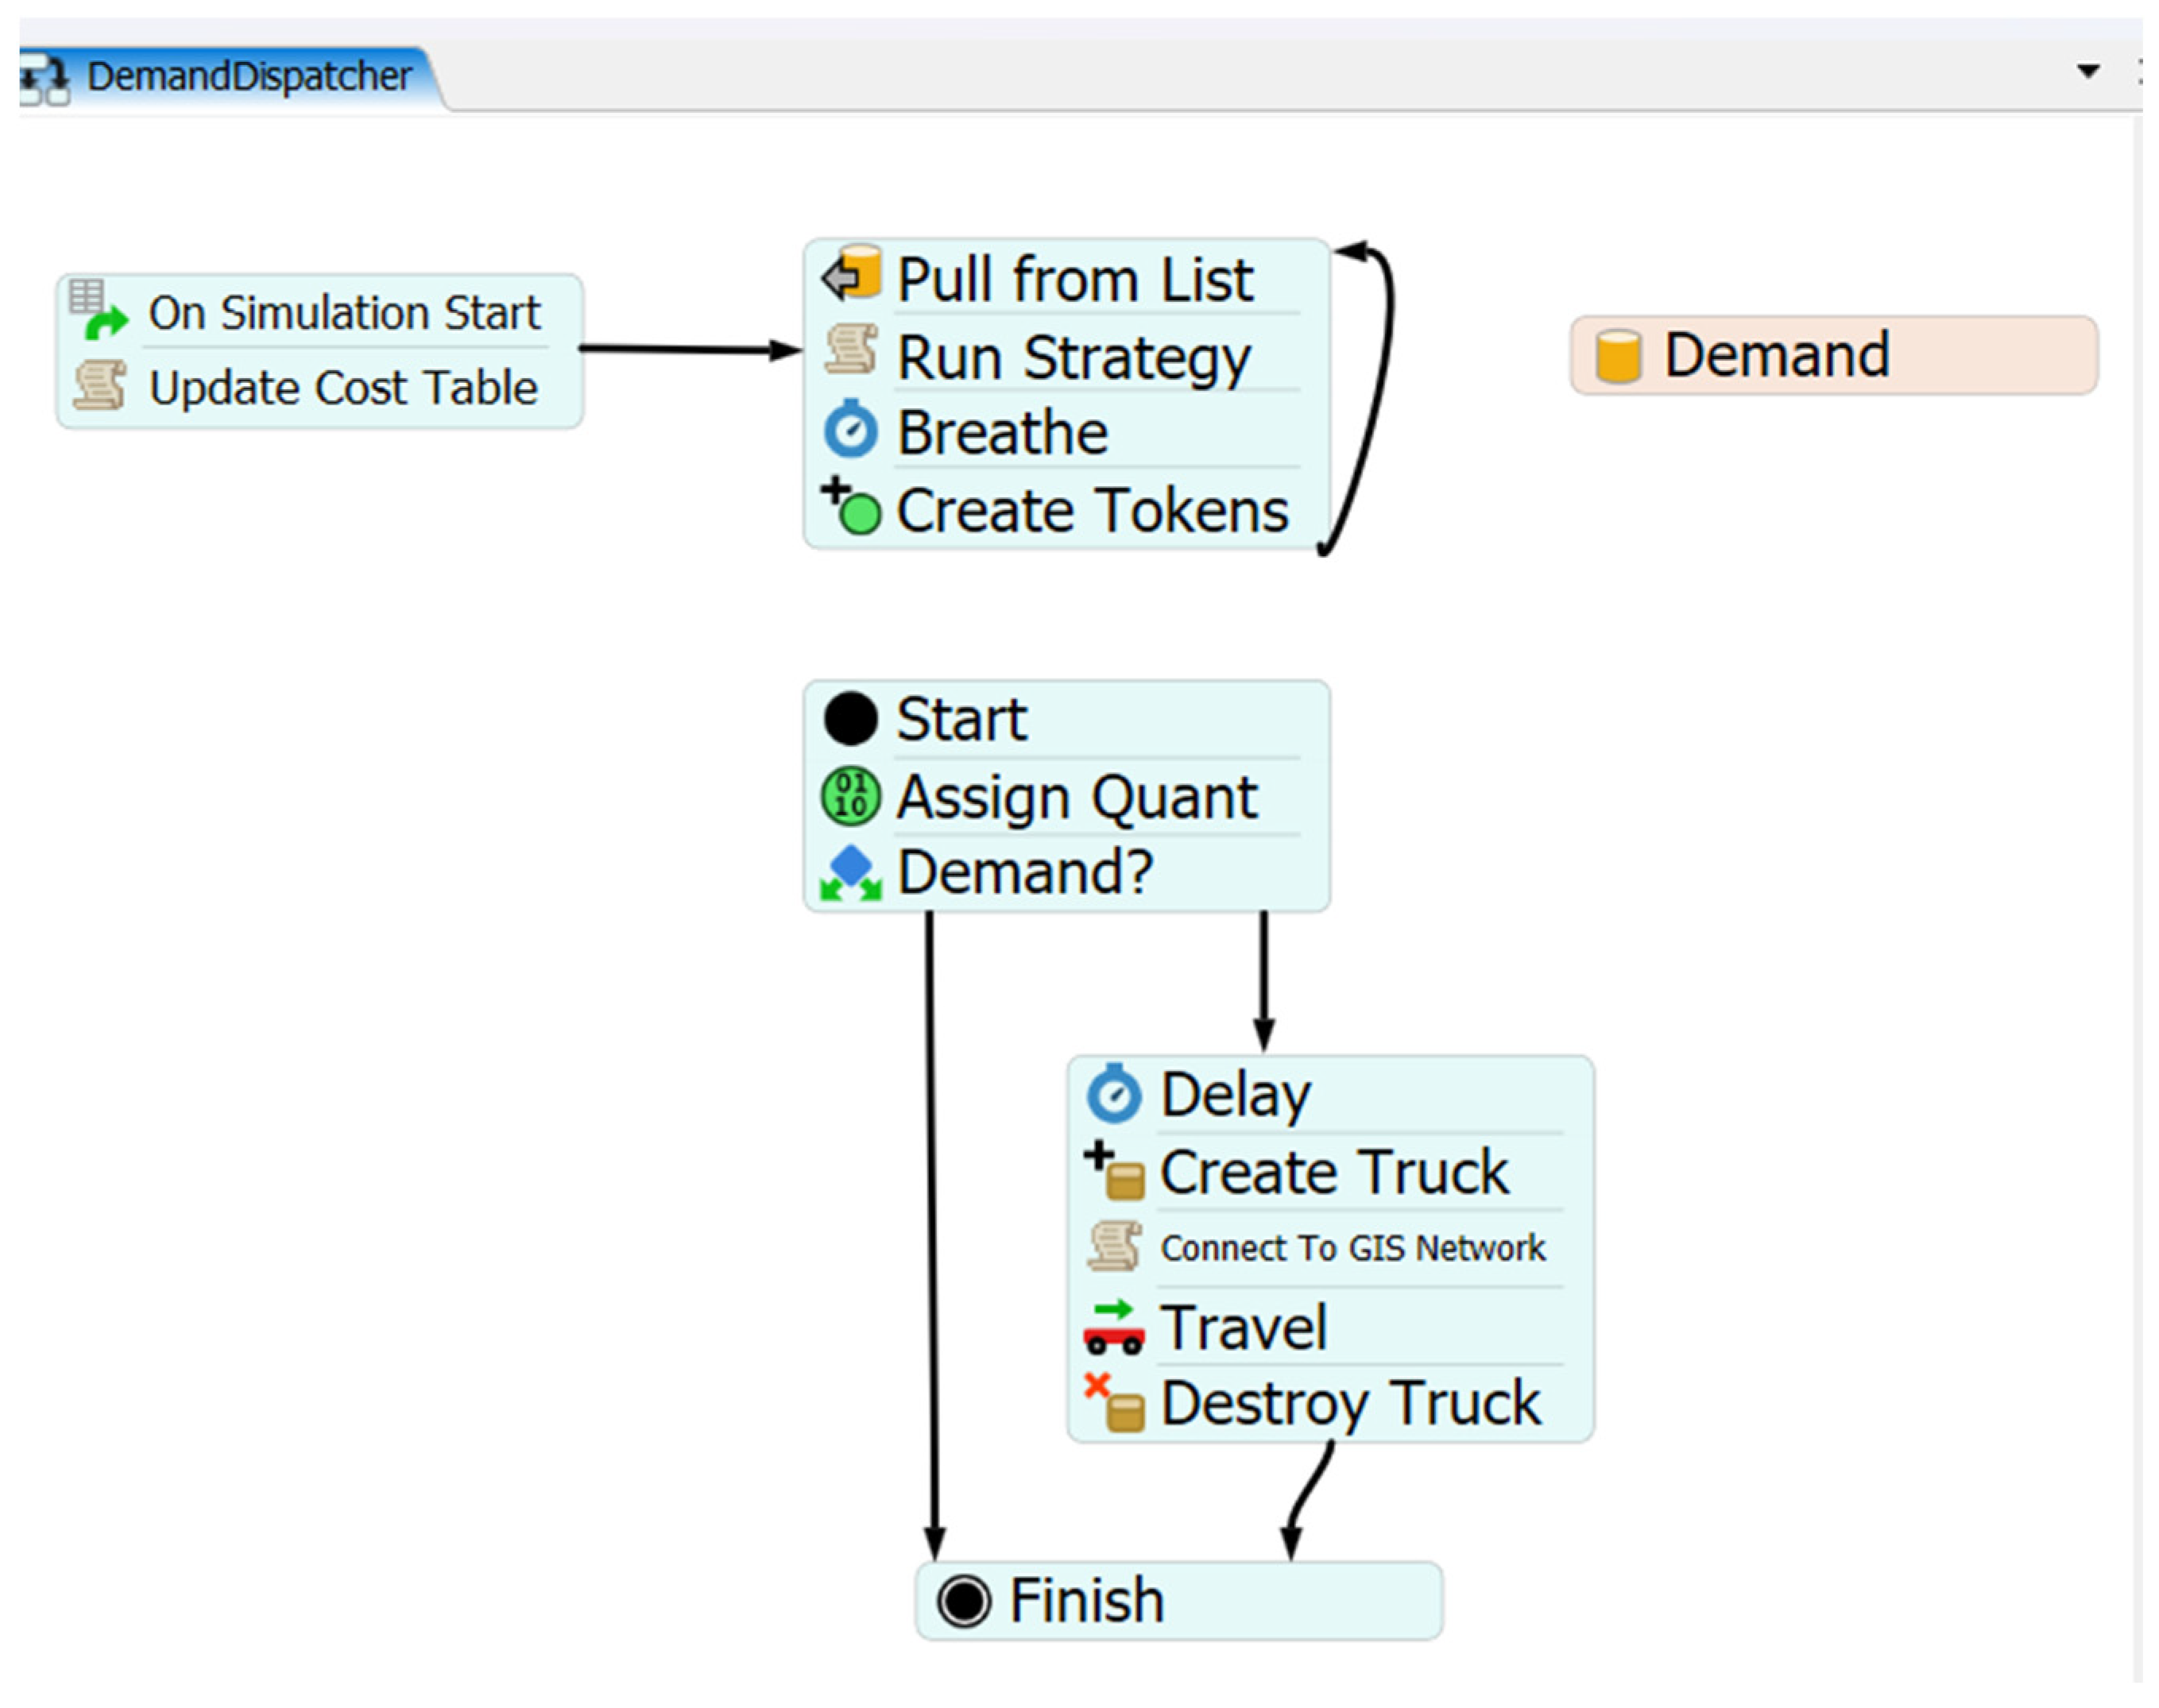
A second Process Flow called DemandDispatcher was created, as shown in Figure 6. It starts with On Simulation Start Source, which creates a token at the beginning of the simulation and executes Update Cost Table custom code, a FlexScript that identifies all factories and warehouses through their Labels and performs the initial cost calculations between factory–warehouse pairs according to the formulas presented earlier. Next, Pull from List retrieves the demand data stored in the global list to initiate the process. Then, Run FlexScript Strategies calls the external optimization algorithm developed in Python through a Process Flow Label, which may correspond to any of the previously mentioned strategies, in order to determine the optimal flow allocation from factories to warehouses.
Figure 6.
Demand Dispatcher Process Flow.
A delay called Breathe was used to prevent token overloads and to allow the generation of one token per demand requirement through Create Tokens, which creates one token for each cell of the CostTable and assigns the corresponding row and column within the matrix. The tokens then move to Start, where the individual dispatch process begins.
In Assign Quant, each token is assigned the specific quantity it must transport. The tokens then pass to the conditional node Demand?, which checks whether the demand is greater than zero. If the condition is satisfied, a token representing the truck is created to transport the demand; if the demand is zero, no truck is created. When the condition is met, the token proceeds to the Delay block, which simulates a waiting time before moving to Create Truck, where the vehicle that will perform the dispatch is generated. Subsequently, the truck connects to the GIS network through Connect to GIS Network, allowing it to travel along the optimal route to its destination. The trip is simulated using Travel, and once completed, the truck moves to Destroy Truck, which removes the vehicle from the system, and finally reaches Finish, marking the end of the process for that token.
Finally, Statistics Collectors were used, in which two main functions were implemented. DemandLog was used to observe the daily demand assigned to each warehouse. ShippingLog allows monitoring and controlling the flow allocation during the simulation by displaying the simulated day, the shipping origin, the destination, the quantity shipped, the unit cost, and the total shipping cost.
The FlexSim 2027 models and Python code used for the implementation of the strategies are provided in [55].
2.1.6. Model Assumptions and Limitations
The simulation models were developed under the following assumptions:
- Distribution flows are allocated according to available supply capacity, transportation costs, and stochastic demand.
- Generic vehicles are used, without restrictions on fleet size, vehicle capacity, or the number of trips.
- Loading and unloading times, traffic congestion, and weather conditions are not explicitly modeled.
- Road distances and travel times are determined using the GIS module and an external routing service.
- The factory–warehouse network represents a hypothetical distribution system with assumed operational parameters.
- The fuel distribution networks use publicly available information and estimate operating parameters, without representing the complete operational constraints of EP Petroecuador.
These assumptions allow the analysis to focus on flow allocation performance. Consequently, the fuel distribution results should be interpreted as comparative simulation outcomes rather than estimates of actual operational performance.
2.2. Flow Allocation Methods
In this study, seven different approaches are implemented to solve the minimum-cost flow problem between factories and warehouses. They are divided into two categories: three heuristic methods and four Python-based optimization approaches. The heuristic methods follow a structured sequence of operational steps without requiring a mathematical optimization formulation, allowing a feasible initial solution to be obtained quickly, although it may not be optimal. In contrast, the optimization-based approaches use formal algorithms to solve the minimum-cost flow problem and obtain solutions that satisfy the established constraints.
2.2.1. Formulation of the Minimum-Cost Flow Problem
The minimum-cost flow problem consists of determining the optimal quantity of product to be shipped from a set of factories to a set of warehouses or clients, minimizing total transportation cost while satisfying supply and demand constraints. Mathematically, the problem is formulated with the following objective function and constraints to minimize the total transportation cost [56,57].
The model constraints ensure that the total quantity shipped from each factory does not exceed its production capacity and that each warehouse receives exactly its assigned demand, thereby guaranteeing full compliance with the system’s requirements. In addition, the model requires that the overall system supply be sufficient to cover total demand; otherwise, the problem would not yield an optimal solution.
This formulation serves as the basis for applying the optimization strategies evaluated in this study.
2.2.2. Northwest Corner Method
The method begins by allocating flow in the upper-left cell of the matrix, then assigns the maximum possible quantity. The corresponding values are reduced, and the process moves horizontally or vertically until all demand is satisfied and all supply in the matrix is exhausted.
Procedure:
- Start in the cell located at the upper-left corner of the matrix.
- Assign to that cell the maximum possible quantity according to the available supply or demand.
- If the supply of the current row is exhausted, move down to the next row. If the demand of the current column is exhausted, move to the next column.
- Repeat the process until all allocations in the matrix are completed.
2.2.3. Minimum Cost Method
The method repeatedly selects the cells with the lowest unit cost in the matrix to assign the maximum possible flow, prioritizing lower costs from the outset. The available and required quantities are then updated, and the process is repeated until demand is fully satisfied.
Procedure:
- Identify the cell with the lowest unit cost within the entire matrix.
- Assign to that cell the maximum possible quantity according to the available supply and demand.
- Remove the row or column whose supply or demand has been satisfied.
- Repeat the procedure by selecting the next lowest-cost cell until all allocations are completed.
2.2.4. Vogel’s Approximation Method
It improves the solution by calculating penalties defined as the difference between the two lowest costs in each row or column. In this way, the method prioritizes the cell with the highest penalty, which helps minimize the total cost of the final solution and supports better allocation decisions.
Procedure:
- Identify the row or column with the highest penalty.
- Within that row or column, select the cell with the lowest cost.
- Assign the maximum possible quantity to that cell and adjust the corresponding supply or demand.
- Remove the satisfied row or column and recalculate the penalties.
- Repeat the process until all allocations are completed.
2.2.5. CVXPY Python Library
The CVXPY library allows linear programming problems to be formulated and solved declaratively in Python under defined constraints, automatically selecting the appropriate solver according to the problem structure. In this case, it uses automatic selection of the solver to obtain the optimal solution. This enables logistics systems to be modeled in a flexible and clear manner.
2.2.6. OR-Tools Python Library
OR-Tools is an optimization library designed to solve complex combinatorial problems under multiple constraints. It automatically selects the appropriate solver to obtain an optimal solution; for this problem, it uses the SimpleMinCostFlow solver, which is specifically designed for minimum-cost flow problems.
2.2.7. NetworkX Python Library
NetworkX is a Python library oriented toward the creation, analysis, and manipulation of complex graphs, used to represent logistics systems as directed networks of origins, destinations, and edges that model transportation routes. It provides different solvers to obtain optimal solutions depending on the formulated system. In this case, the solution is obtained using the network_simplex solver for minimum-cost flow problems, which allows all demand to be satisfied while maintaining flow balance between nodes.
2.2.8. Gurobi Optimizer
Gurobi was implemented as an additional optimization method to solve the minimum-cost flow allocation problem. The same objective function and supply and demand constraints were applied as in the other methods. Gurobi was used as a common reference solution for comparative purposes, without implying that it represented the preferred or superior method. The costs obtained by the heuristic and optimization-based approaches were evaluated relative to this common reference.
All optimization implementations use nonnegative integer shipment quantities, exact demand satisfaction, and supply-capacity constraints. CVXPY uses automatic solver selection, OR-Tools implements SimpleMinCostFlow, NetworkX employs network simplex, and Gurobi solves an integer optimization model. OR-Tools and NetworkX scale unit costs by 106 to satisfy integer-cost requirements. Solutions are accepted only after verifying demand satisfaction, capacity feasibility, and solver-reported optimality status.
2.3. Statistical Analysis
The performance of the heuristic methods and Python-based optimization approaches was evaluated for the minimum-cost flow problem implemented within the FlexSim 2027 simulation model. The response variables were average total cost per unit and algorithm execution time, based on 31 replications per treatment. The experimental design included two factors: allocation method, with seven levels corresponding to the evaluated algorithms, and demand level, with three levels (low: 25%, medium: 50%, and high: 100% of total demand). A constant transportation cost of USD 0.50/km was used in all experiments. Table 6 summarizes the experimental design.
Table 6.
Summary of the experimental design with the treatments for each network.
A common random numbers (CRN) approach was adopted to ensure comparability among allocation strategies. For each replication, the same random seed was used across all seven methods within each network and demand level, ensuring identical stochastic demand realizations and enabling paired comparisons.
Descriptive statistics were calculated for unit cost and algorithm execution time. The common random numbers approach enabled paired comparisons across the seven strategies. The Friedman test was used to assess overall differences, followed by paired Wilcoxon signed-rank tests with Holm correction to compare each strategy against Gurobi. All analyses were conducted separately for each network and demand level, using 31 paired replications and a significance level of 0.05.
3. Results
The seven allocation strategies were evaluated under three demand levels: 25%, 50%, and 100% of total demand. The response variables were average total cost per unit (USD) and algorithm execution time (ms), evaluated over a one-month delivery period under identical conditions for all strategies. For each network model, 21 treatments were evaluated, with 31 replications per treatment.
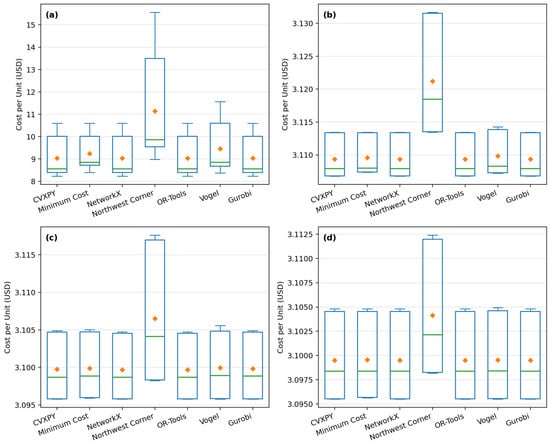
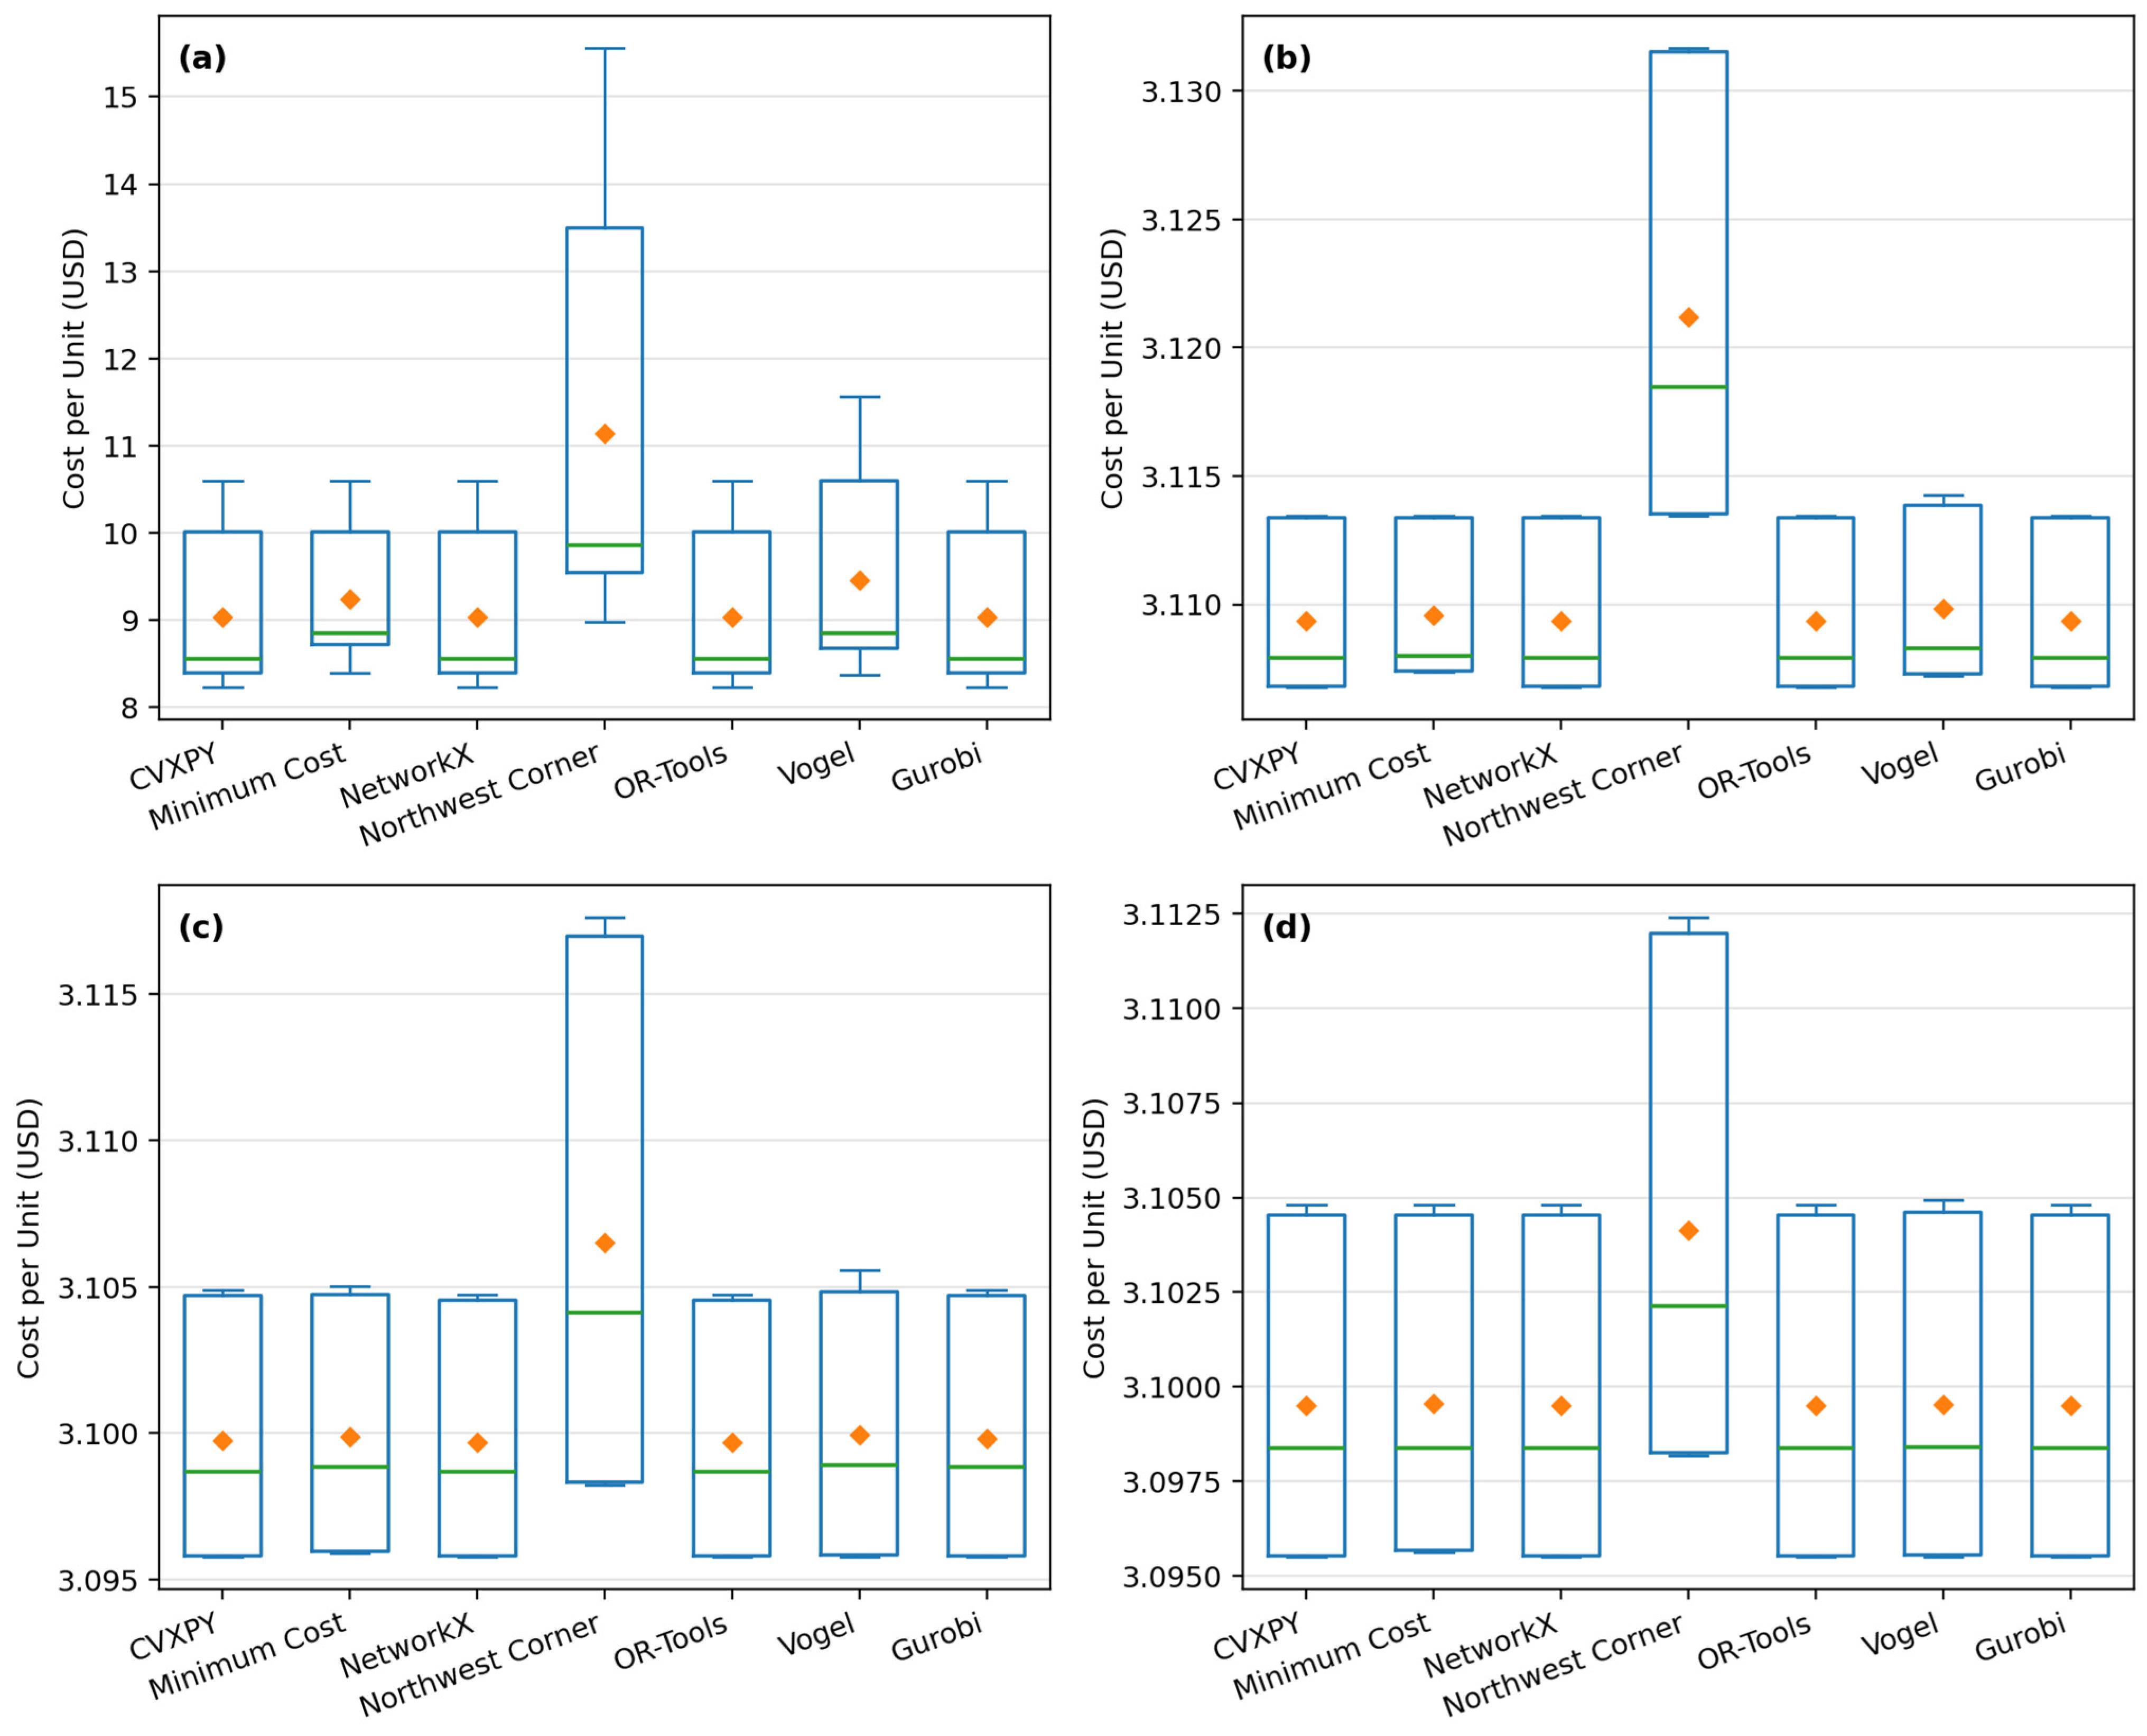
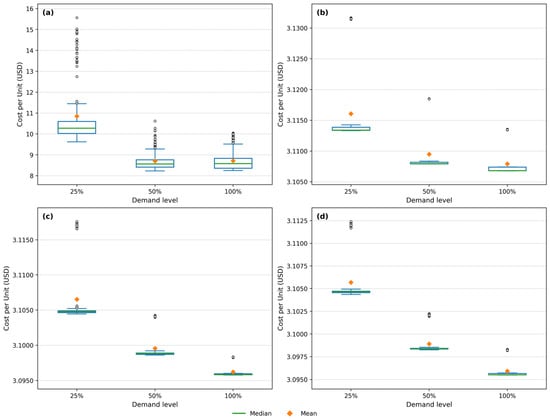
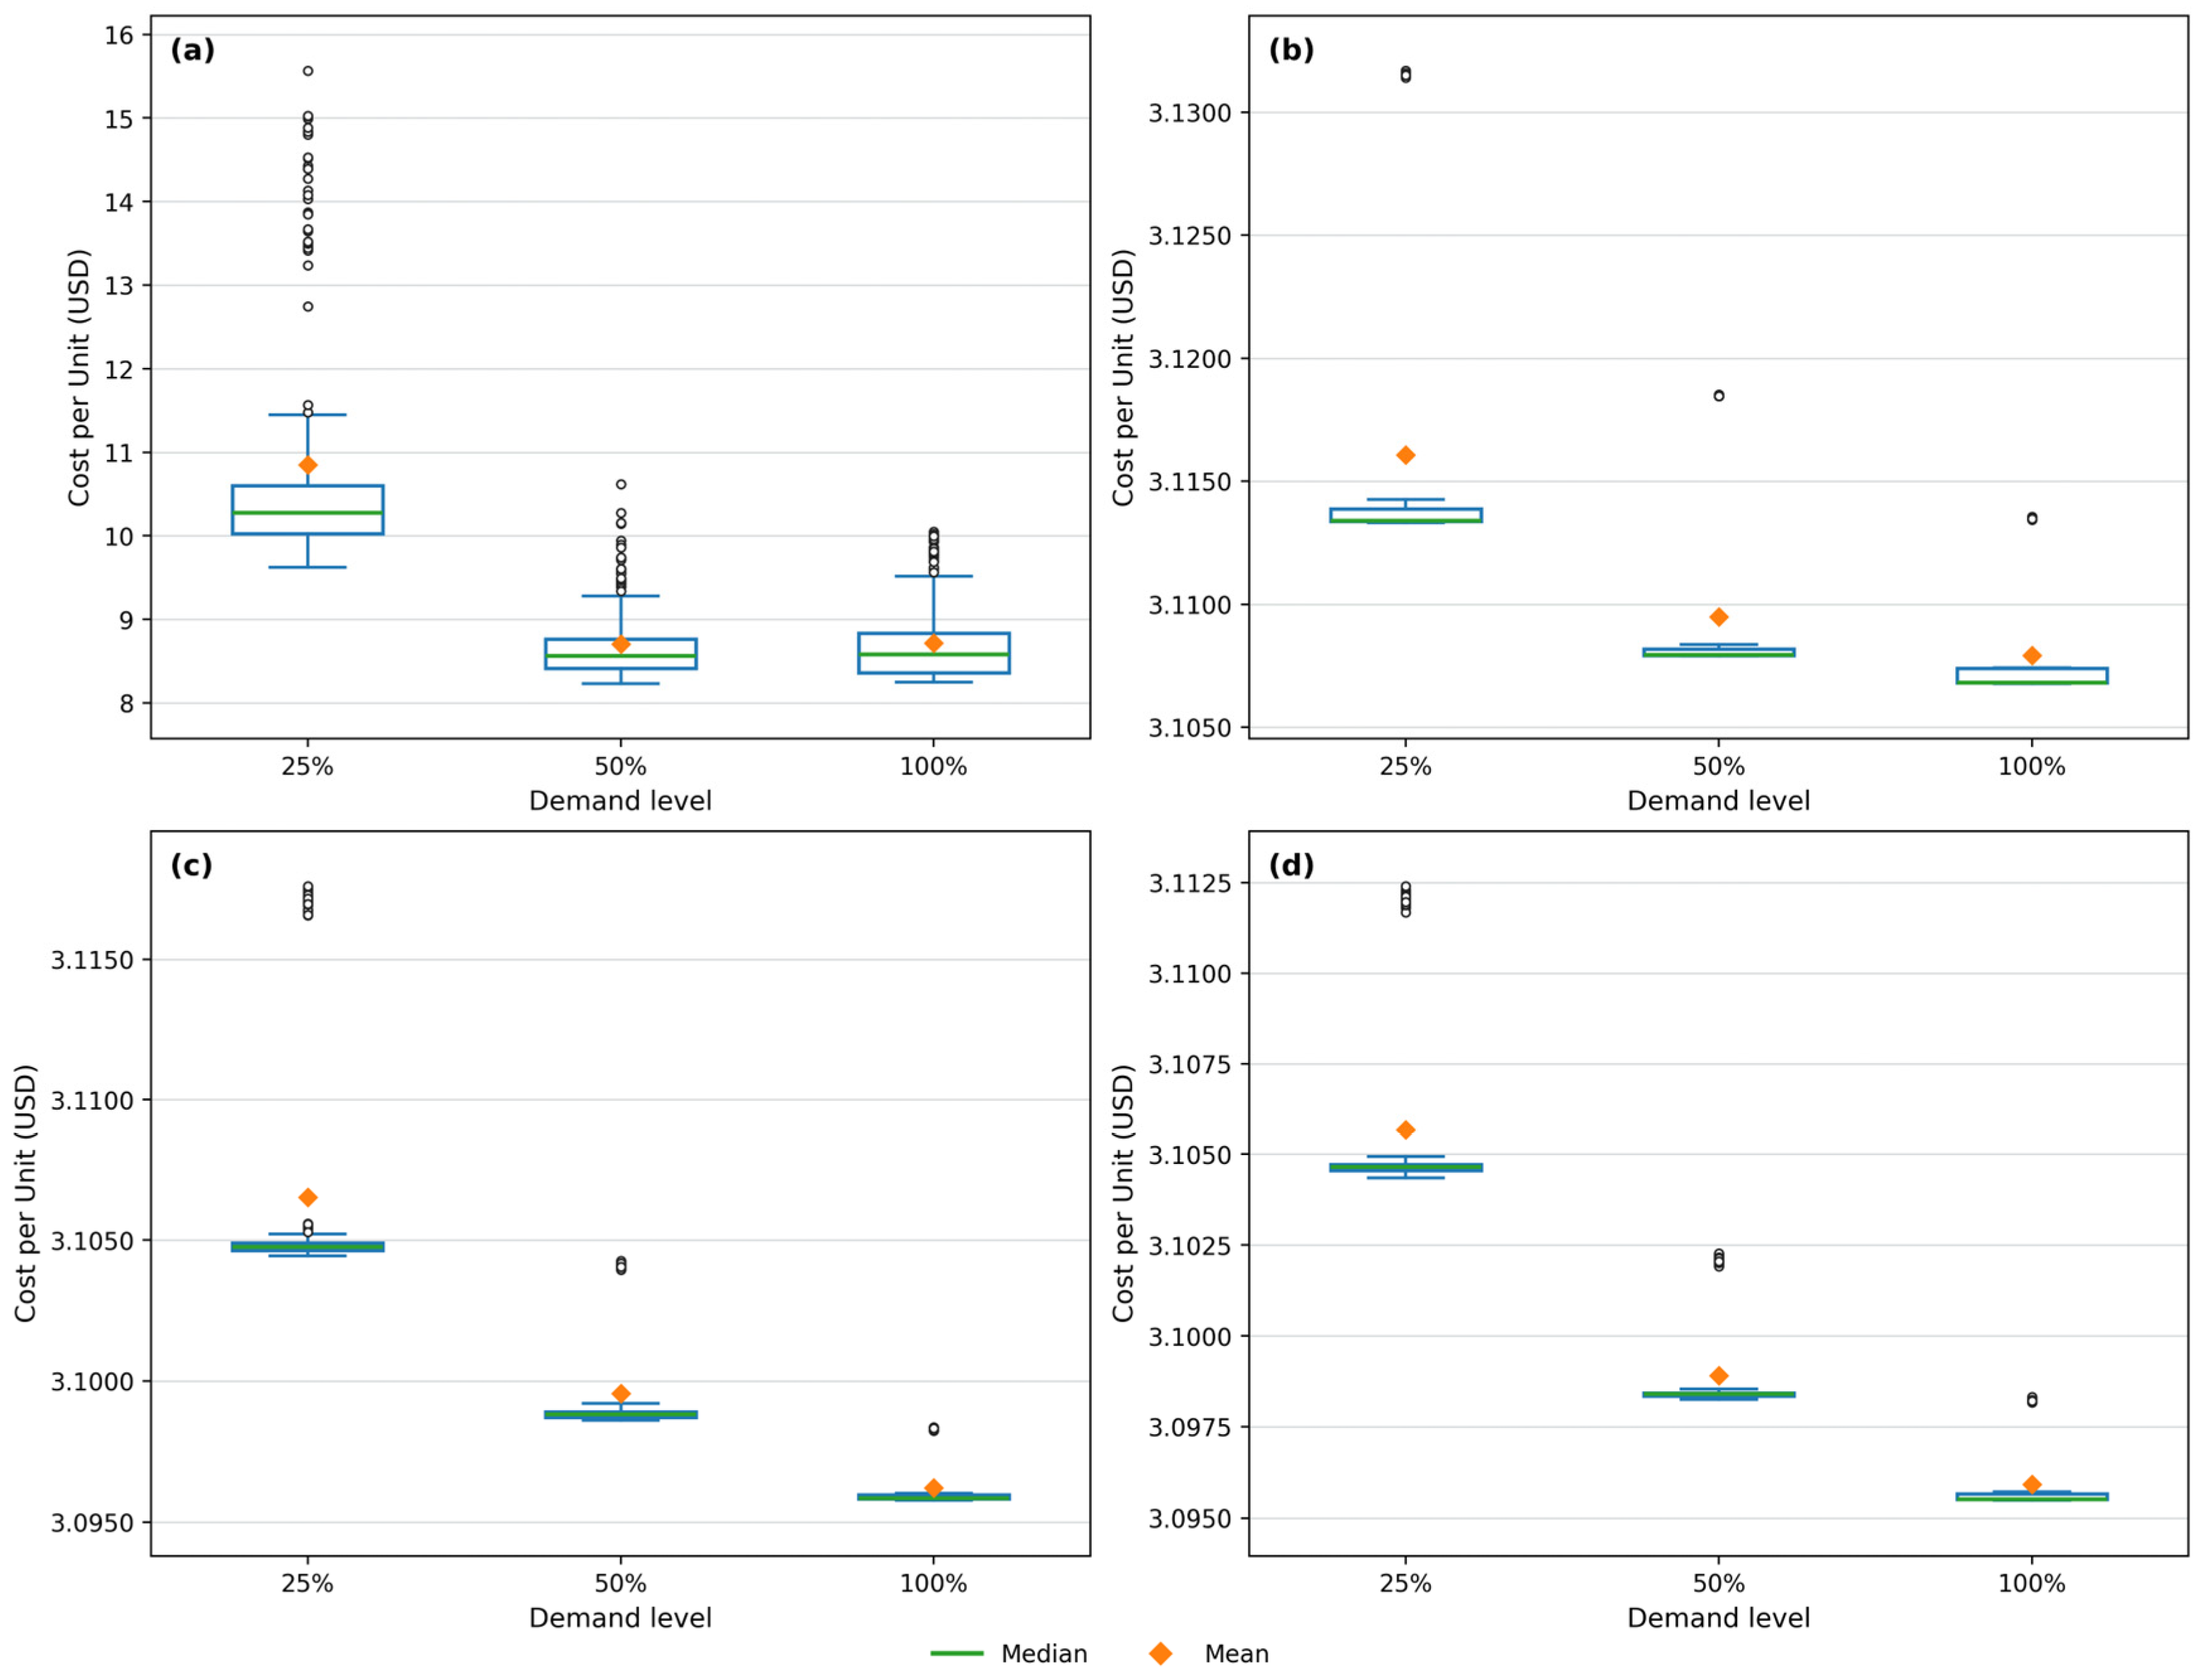
The boxplots shown in Figure 7 illustrate the differences among the strategies, where the Northwest Corner method stands out for presenting higher costs and greater dispersion compared to CVXPY, NetworkX, and OR-Tools, which exhibit greater stability (Table 7). Similarly, the boxplots by demand level in Figure 8 show that unit costs generally decrease as demand increases, partly reflecting the quantity-dependent transportation cost formulation adopted in the model (Table 8).
Figure 7.
Boxplots of cost per unit (USD) by flow allocation strategy for the four distribution networks: (a) factory–warehouse, (b) Diesel Premium, (c) Ecopaís gasoline, and (d) Extra gasoline. Green lines indicate medians, and orange diamonds indicate means.
Table 7.
Descriptive statistics of unit cost by strategy in USD.
Figure 8.
Boxplots of cost per unit (USD) across three demand scenarios for the four distribution networks: (a) factory–warehouse, (b) Diesel Premium, (c) Ecopaís gasoline, and (d) Extra gasoline. Green lines indicate medians, orange diamonds represent means, and circles denote outliers.
Table 8.
Descriptive statistics of unit cost by demand level in USD.
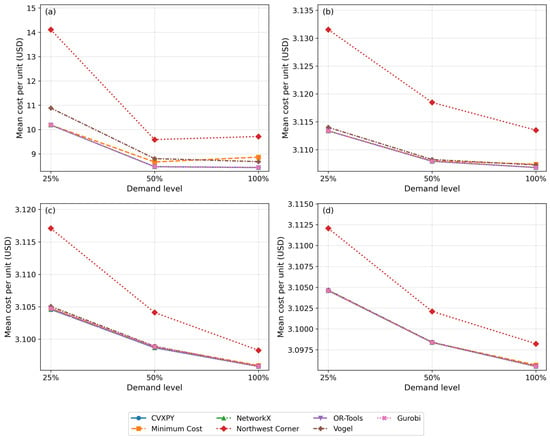
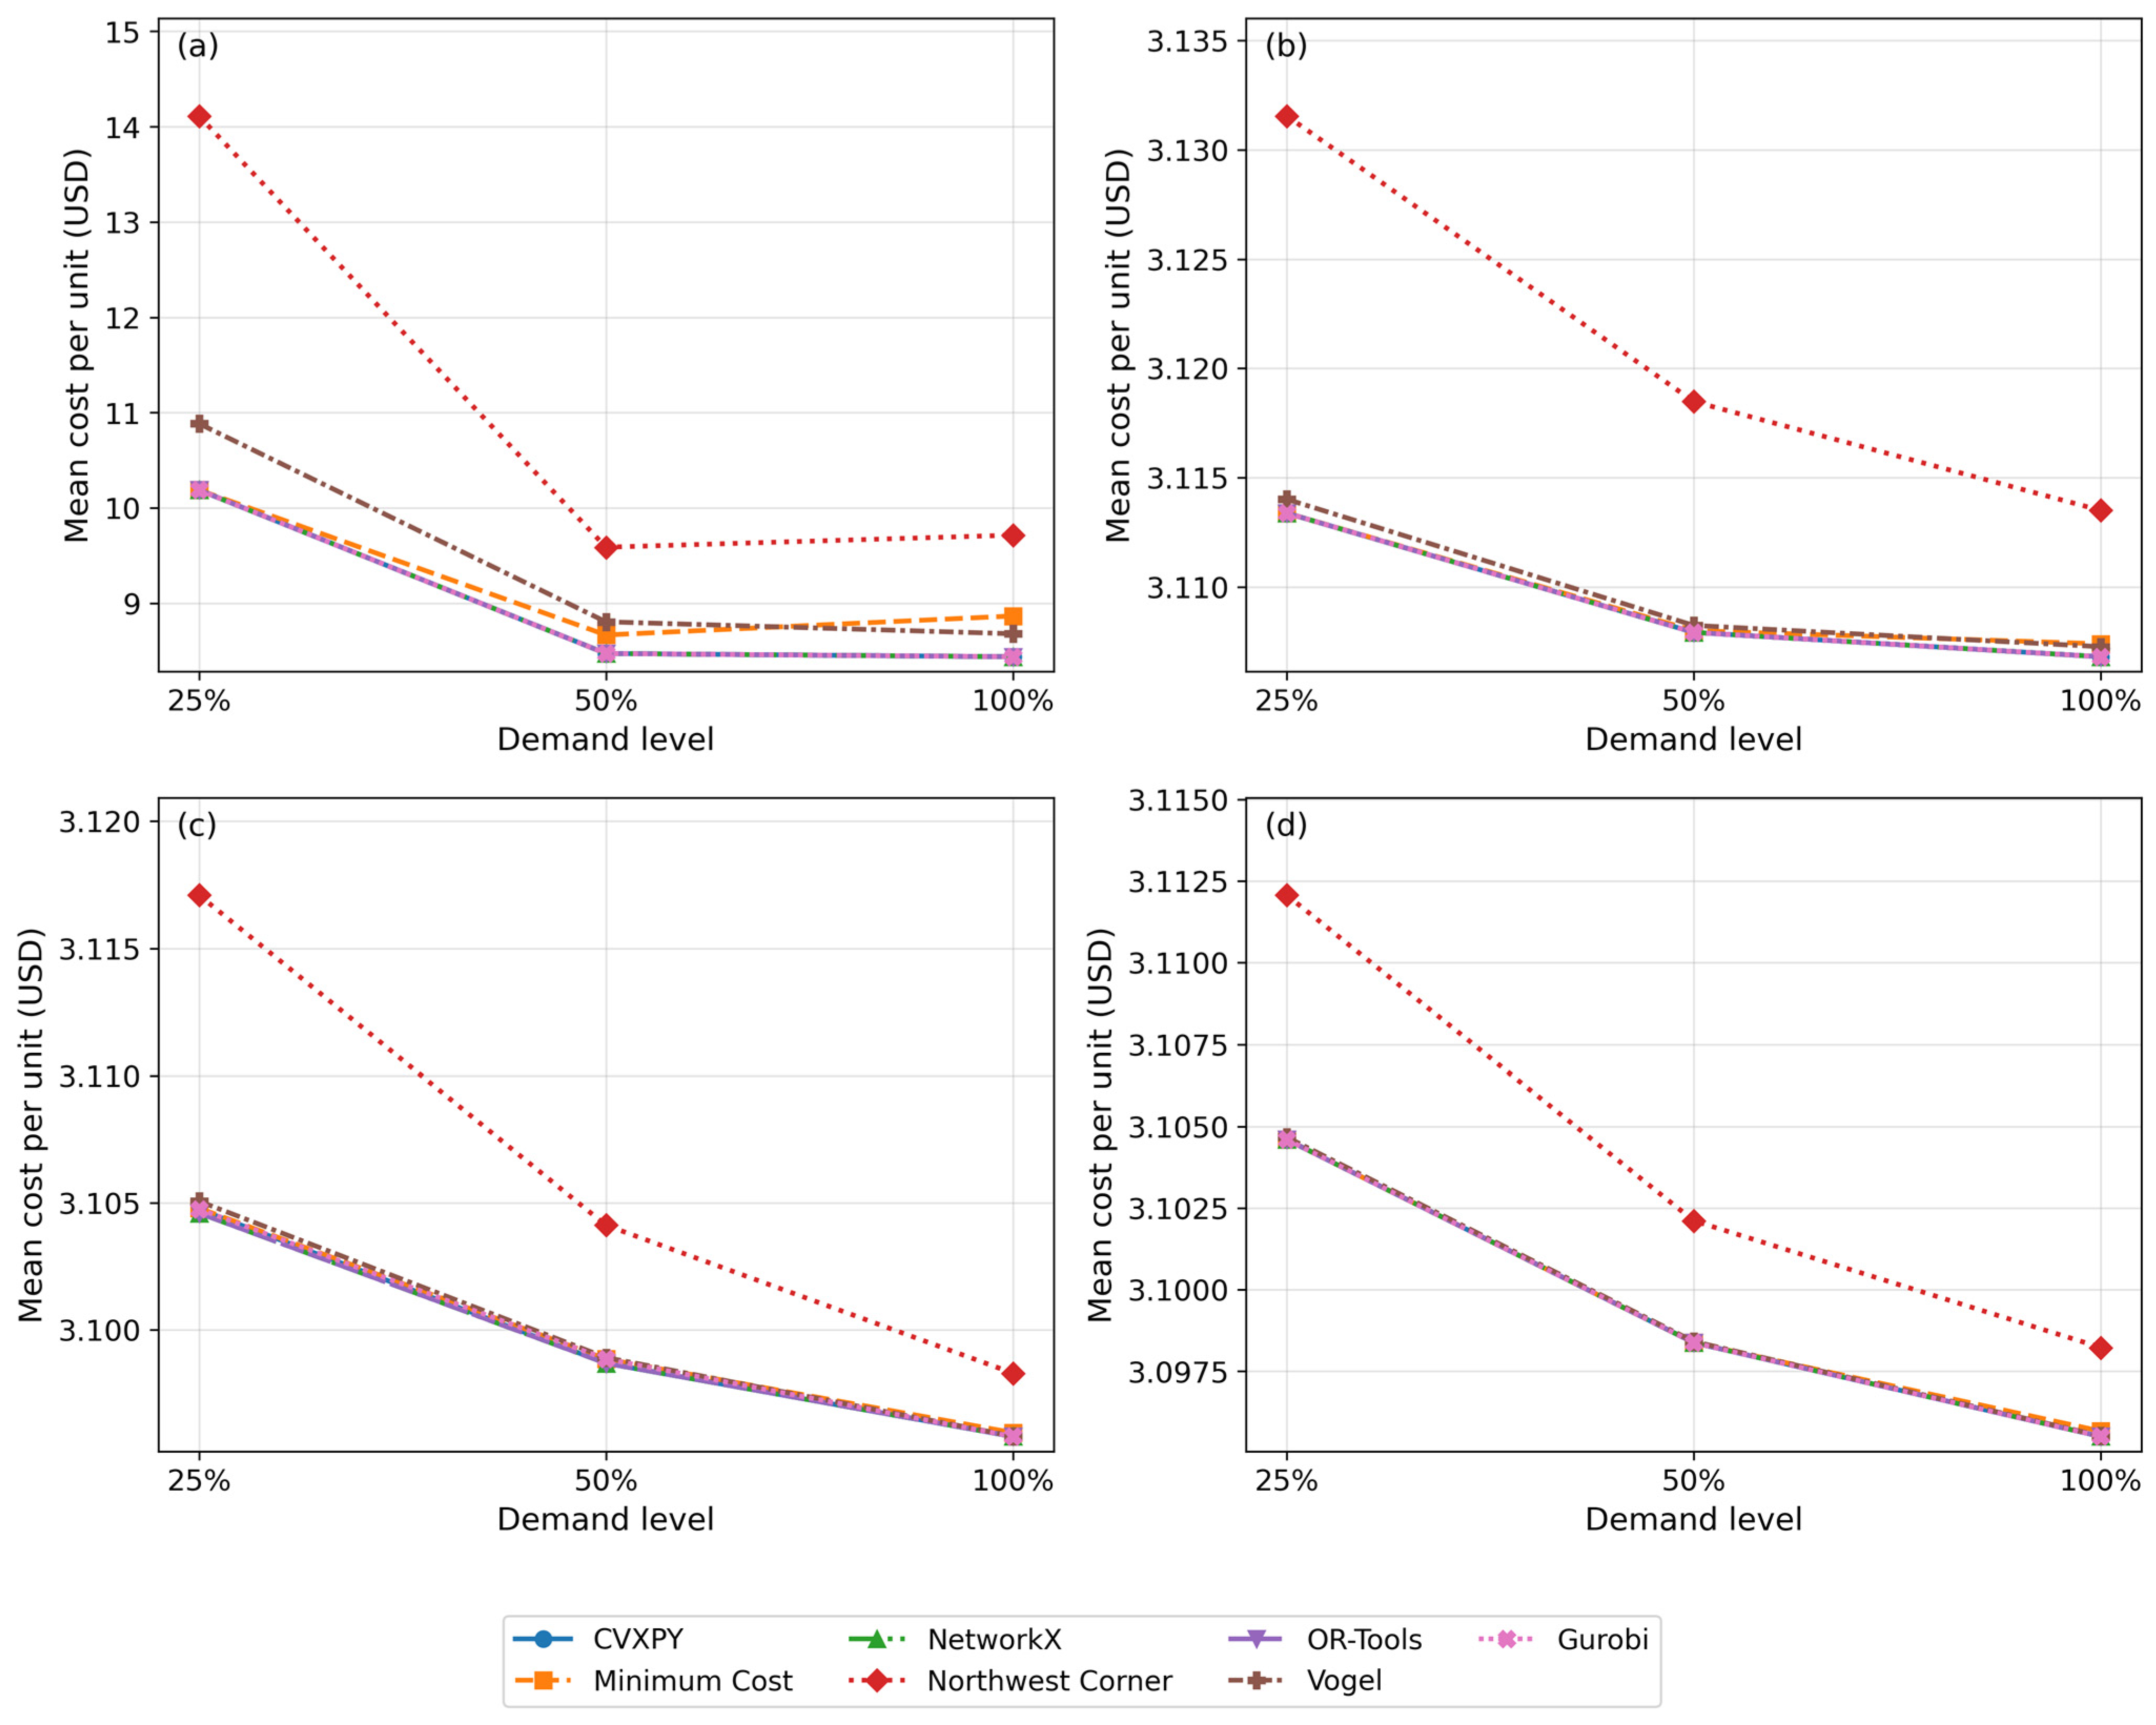
Figure 9 illustrates the interaction between allocation strategies and demand levels. Unit costs generally decrease as demand increases, reflecting both allocation decisions and the quantity-dependent cost formulation. However, the behavior of the strategies differs across demand levels. The Northwest Corner method shows poor performance, with the highest unit costs compared to the other strategies at all demand levels. Its curve remains above the others, indicating inefficiency under low-demand scenarios. Although unit costs decrease as demand increases, they remain relatively high compared to the other methods.
Figure 9.
Interaction plots of mean cost per unit (USD) by allocation strategy and demand level (25%, 50%, and 100%) for the four distribution networks: (a) factory–warehouse, (b) Diesel Premium, (c) Ecopaís gasoline, and (d) Extra gasoline.
In contrast, CVXPY, Minimum Cost, NetworkX, OR-Tools, and Gurobi converged in performance under high-demand conditions. This indicates that, when demand is high, the heuristic Minimum Cost method can approach the cost levels achieved by the optimization-based methods. Vogel’s method also improves noticeably as demand increases but remains slightly above the other methods, indicating a reasonably efficient initial solution without reaching the same cost levels as the best-performing approaches.
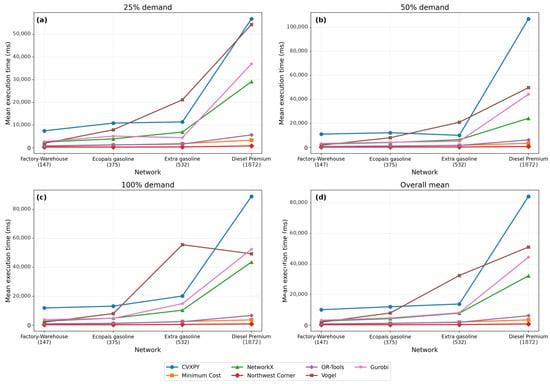
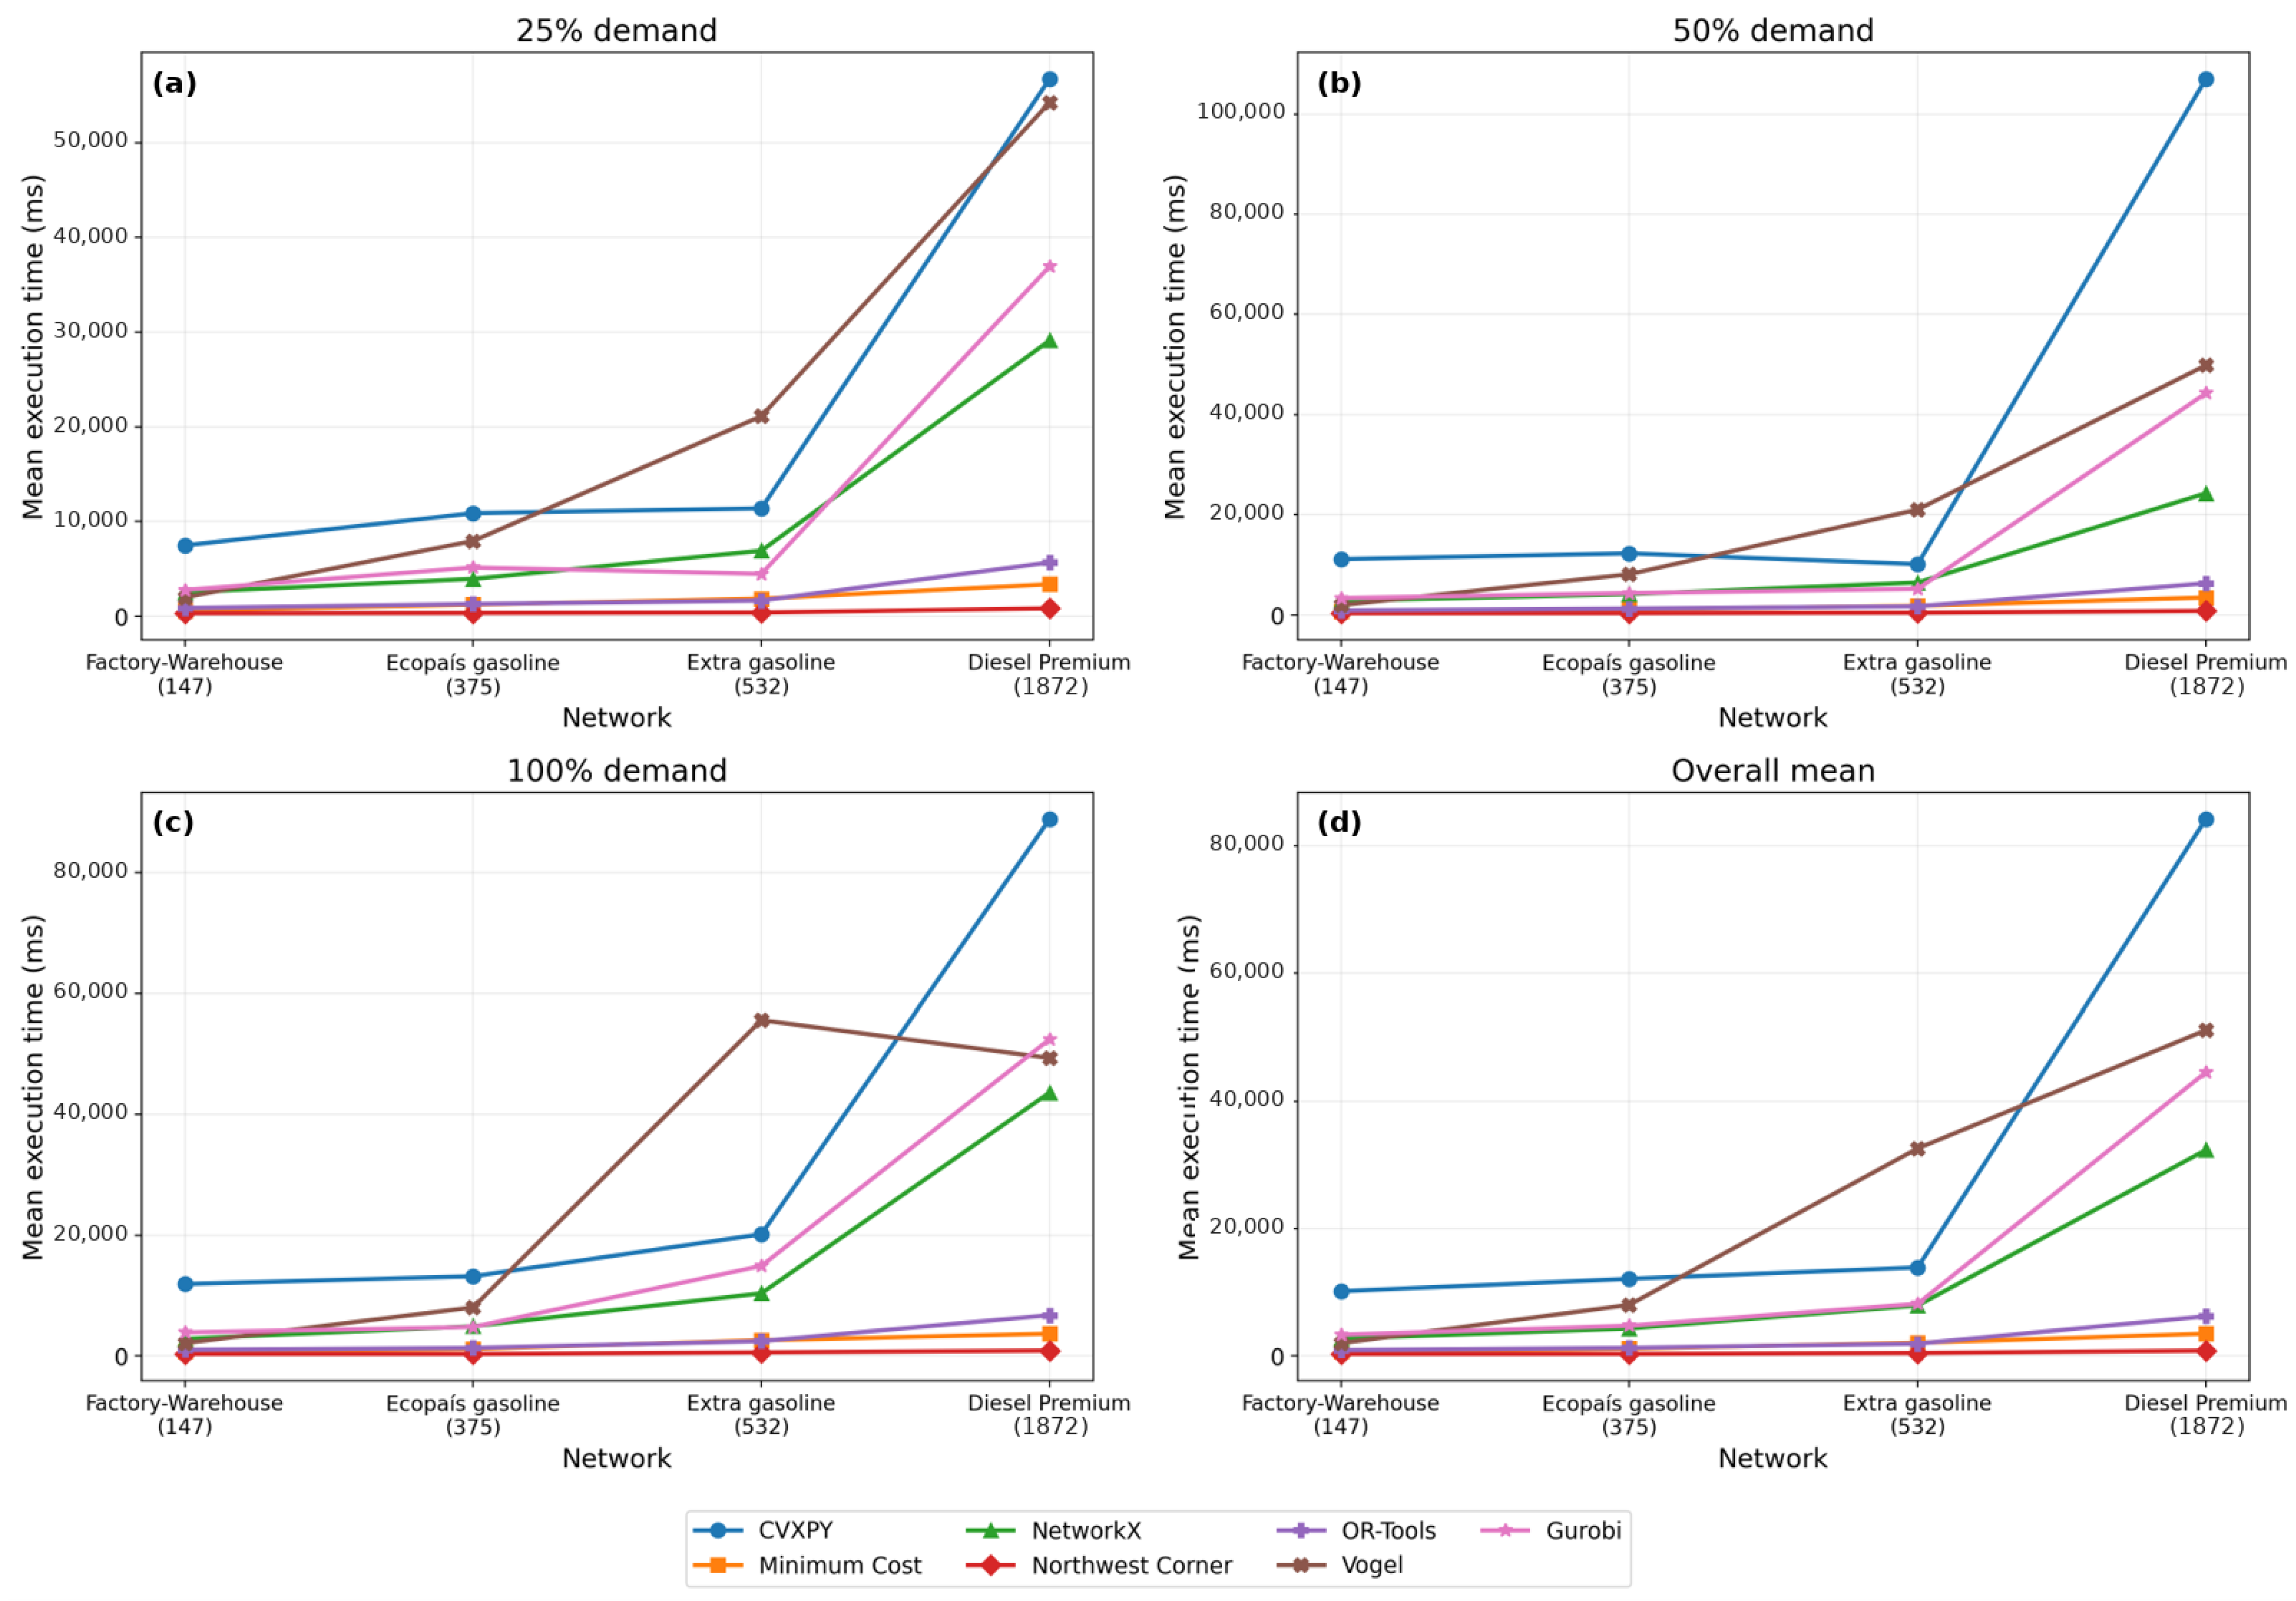
Algorithm execution time was evaluated across the four distribution networks and three demand levels (25%, 50%, and 100%), using 31 replications per configuration. Table 9 summarizes the mean execution times, while Figure 10 illustrates the scalability of each method as network size and demand increase. Northwest Corner consistently exhibited the shortest execution times, followed by Minimum Cost and OR-Tools, whereas CVXPY, Vogel, and Gurobi showed substantially higher computational requirements, particularly in the Diesel Premium network. These results highlight the trade-off between computational efficiency and solution quality when selecting flow allocation strategies for increasingly complex distribution networks.
Table 9.
Mean algorithm execution time across the four distribution networks (31 replications, averaged across all demand levels).
Figure 10.
Algorithm execution time and scalability across four distribution networks at (a) 25%, (b) 50%, and (c) 100% demand levels, and (d) overall mean across all demand levels. Each point represents the mean execution time (ms) over 31 simulation replications. The number of possible connections for each network is indicated in parentheses.
Paired statistical comparisons were conducted to evaluate differences in unit cost and execution time relative to Gurobi. Friedman tests indicated significant differences among the seven strategies across all network and demand configurations (p < 0.001). Table 10 presents the relative unit cost difference, calculated as the percentage difference in mean unit cost compared with Gurobi, and the execution time ratio, calculated as the mean execution time of each strategy divided by that of Gurobi. Ratios below 1 indicate faster execution than Gurobi. The table also reports the number of demand levels showing statistically significant differences according to paired Wilcoxon signed-rank tests with Holm correction.
Table 10.
Relative unit cost and execution time compared with Gurobi across the four distribution networks.
Post hoc comparisons showed that Northwest Corner consistently produced higher unit costs than Gurobi (Holm-adjusted p < 0.001), whereas CVXPY, NetworkX, and OR-Tools generally achieved identical or very similar costs, with some differences observed in the Ecopaís network. Regarding execution time, Northwest Corner, Minimum Cost, and OR-Tools were significantly faster than Gurobi across all configurations (adjusted p < 0.001), while CVXPY required significantly longer execution times. These findings confirm a trade-off between computational efficiency and allocation cost.
To identify the most computationally efficient strategies while maintaining solution quality, methods with unit costs lower than Gurobi or without statistically significant differences were selected and ranked according to their mean execution time (Table 11). OR-Tools ranked first in most configurations, while Minimum Cost achieved the shortest execution times in selected scenarios. These results highlight the potential of alternative methods to reduce computational effort while maintaining costs comparable to or lower than the reference solution.
Table 11.
Execution-time ranking of strategies with unit costs lower than or not statistically significantly different from Gurobi.
4. Discussion
The results demonstrate that optimization-based methods generally achieve lower unit costs than traditional heuristics across the four distribution networks. CVXPY, NetworkX, OR-Tools, and Gurobi produced identical or closely comparable costs in most configurations, although small differences were observed in some cases. No optimization implementation showed a consistent overall advantage across all evaluated conditions, as their relative performance varied depending on both allocation cost and execution time. Minimum Cost also provided competitive results, particularly in the fuel distribution networks. The paired statistical comparisons further demonstrated that statistical significance must be interpreted alongside the magnitude of cost differences, which was often very small in the fuel distribution cases. Although all optimization implementations satisfied the same demand and capacity constraints and were accepted only when the corresponding solver reported an optimal status, they rely on different solution procedures and numerical implementations. In particular, OR-Tools and NetworkX require integer scaling of unit costs. Therefore, solver-reported optimality does not imply numerically identical objective values across implementations, and a non-significant difference relative to Gurobi should not be interpreted as evidence of equivalence or overall superiority. The reduction in unit costs at higher demand levels is partly attributable to the transportation cost formulation, which divides distance-based costs by transported quantities. Therefore, this trend should not be interpreted independently as evidence of operational economies of scale.
Computational performance revealed a different pattern. Northwest Corner consistently achieved the shortest execution times, although its higher allocation costs limited its suitability when solution quality was prioritized. Among strategies achieving costs equal to, lower than, or not significantly different from Gurobi, OR-Tools ranked fastest in nine of the twelve configurations, while Minimum Cost ranked first in the remaining three. These findings extend the comparison beyond solution quality by identifying computationally efficient alternatives across networks of different sizes.
Previous studies have demonstrated the potential of integrating simulation and optimization in freight transportation and supply chain planning [12,32]. Similarly, Ni et al. [39] applied FlexSim to manufacturing logistics, while Kordos et al. [40] investigated warehouse optimization using genetic algorithms. Building on these applications, the present study compares seven flow allocation strategies across four distribution networks under consistent stochastic demand conditions. By evaluating both allocation costs and execution times, the study provides additional evidence for selecting computationally efficient methods according to network characteristics.
The results indicate that the distinction between heuristic and optimization-based methods alone is insufficient to characterize their cost and computational performance. Averaged across demand levels, OR-Tools achieved lower unit costs and shorter execution times than Vogel in all four networks (Table 7 and Table 9). This provides empirical evidence that, within the evaluated conditions, improved allocation costs need not entail greater computational effort. For distribution planners, these findings support comparing specific implementations rather than whether heuristic methods necessarily offer a computational advantage. However, these implications remain conditional on the tested implementations, demand assumptions, and quantity-dependent transportation cost formulation. The hypothetical factory–warehouse case, estimated capacities and station demands in the fuel networks, omission of fleet and vehicle-capacity constraints, and lack of operational validation limit the generalizability of the findings.
5. Conclusions
This study evaluated seven flow allocation strategies through discrete-event simulation in FlexSim 2027, considering four distribution networks and three demand levels. The integration of heuristic and optimization-based methods enabled a comparative assessment of allocation costs and computational performance under common stochastic demand conditions.
CVXPY, NetworkX, OR-Tools, and Gurobi generally achieved the lowest allocation costs, while Northwest Corner consistently produced higher costs but required the shortest execution times. When considering strategies with costs equal to, lower than, or not significantly different from Gurobi, OR-Tools ranked fastest in nine of the twelve configurations, followed by Minimum Cost in the remaining three. These results highlight the importance of considering both solution quality and execution time when selecting allocation methods. No optimization implementation showed a consistent overall advantage across all evaluated conditions, as relative performance depended on both allocation cost and execution time.
The proposed FlexSim–Python framework provides a basis for comparing distribution strategies across networks of different sizes. Its application to Ecuadorian fuel distribution networks illustrates its potential to support logistics planning, while future research should incorporate actual operating constraints to evaluate its applicability in real distribution systems.
Supplementary Materials
The following supporting information can be downloaded at: https://www.mdpi.com/article/10.3390/logistics10110273/s1, Table S1: Geographic coordinates of fuel stations (FuelStations_FlexSim.csv); Table S2: Geographic coordinates of fuel supply terminals (FuelTerminals_FlexSim_Actualizado.csv); Datasets S1–S4: Simulation results for the factory–warehouse (ShippingLog_Base.csv), Diesel Premium (ShippingLog_Large.csv), Extra gasoline (ShippingLog_Extra.csv), and Ecopaís gasoline (ShippingLog_Ecopais.csv) distribution networks, respectively.
Author Contributions
Conceptualization, L.X.A.-G. and J.G.M.-L.; methodology, L.X.A.-G. and J.G.M.-L.; software, L.X.A.-G. and J.G.M.-L.; validation, L.X.A.-G. and J.G.M.-L.; formal analysis, L.X.A.-G. and J.G.M.-L.; investigation, L.X.A.-G. and J.G.M.-L.; resources, J.G.M.-L.; data curation, L.X.A.-G. and J.G.M.-L.; writing—original draft preparation, L.X.A.-G. and J.G.M.-L.; writing—review and editing, L.X.A.-G. and J.G.M.-L.; visualization, L.X.A.-G. and J.G.M.-L.; supervision, J.G.M.-L.; project administration, J.G.M.-L.; funding acquisition, J.G.M.-L. All authors have read and agreed to the published version of the manuscript.
Funding
This research was funded by Universidad Politécnica Salesiana of Ecuador (UPS) through a research project approved under Resolution No. 108-06-2026-10-02.
Institutional Review Board Statement
Not applicable.
Informed Consent Statement
Not applicable.
Data Availability Statement
The datasets supporting the findings of this study are provided in the Supplementary Materials. The FlexSim simulation models and Python code are available on Zenodo at https://doi.org/10.5281/zenodo.23906188.
Conflicts of Interest
The authors declare no conflict of interest.
Nomenclature and Abbreviations
The following abbreviations are used in this manuscript:
| Index of supply origins (factories or terminals) | |
| Index of demand destinations (warehouses or service stations) | |
| Number of supply origins | |
| Number of demand destinations | |
| Quantity shipped from origin i to destination j | |
| Available supply capacity at origin i | |
| Demand at destination j | |
| Production or product cost per unit at origin i | |
| Transportation cost per unit from origin i to destination j | |
| Total cost per unit from origin i to destination j | |
| Distance between origin i and destination j | |
| Transportation cost per kilometer | |
| Total distribution cost to be minimized | |
| USD | United States Dollar |
| CRN | Common Random Numbers |
| GIS | Geographic Information System |
| CVXPY | Convex Optimization for Python |
| OR-Tools | Operations Research Tools |
| RON | Research Octane Number |
References
- Solari, F.; Bottani, E.; Romagnoli, G. Sustainable Logistics and Supply Chain Management in the Post-COVID-19 Era: Future Challenges and Challenging Futures. Sustainability 2025, 17, 1772. [Google Scholar] [CrossRef] [Scilit]
- Ferraro, S.; Cantini, A.; Leoni, L.; De Carlo, F. Sustainable Logistics 4.0: A Study on Selecting the Best Technology for Internal Material Handling. Sustainability 2023, 15, 7067. [Google Scholar] [CrossRef] [Scilit]
- Stojanović, Đ.; Ivetić, J.; Veličković, M. Assessment of International Trade-Related Transport CO2 Emissions—A Logistics Responsibility Perspective. Sustainability 2021, 13, 1138. [Google Scholar] [CrossRef] [Scilit]
- Moshood, T.; Nawanir, G.; Sorooshian, S.; Okfalisa, O. Digital Twins Driven Supply Chain Visibility within Logistics: A New Paradigm for Future Logistics. Appl. Syst. Innov. 2021, 4, 29. [Google Scholar] [CrossRef] [Scilit]
- Boldyrieva, L.; Zelinska, H.; Krapkina, V.; Komelina, A. Problems and Solutions of Transport Logistics. In Proceedings of the 2019 7th International Conference on Modeling, Development and Strategic Management of Economic System (MDSMES 2019), Ivano-Frankivsk, Ukraine, 24–25 October 2019; Atlantis Press: Paris, France, 2019. [Google Scholar]
- Zu, E.; Shu, M.-H.; Huang, J.-C.; Hsu, B.-M.; Hu, C.-M. Management Problems of Modern Logistics Information System Based on Data Mining. Mob. Inf. Syst. 2021, 2021, 5241921. [Google Scholar] [CrossRef] [Scilit]
- Nielsen, P.; Dahanayaka, M.; Perera, H.N.; Thibbotuwawa, A.; Kilic, D.K. A Systematic Review of Vehicle Routing Problems and Models in Multi-Echelon Distribution Networks. Supply Chain Anal. 2024, 7, 100072. [Google Scholar] [CrossRef] [Scilit]
- Pan, Q.; He, X.; Skouri, K.; Chen, S.-C.; Teng, J.-T. An Inventory Replenishment System with Two Inventory-Based Substitutable Products. Int. J. Prod. Econ. 2018, 204, 135–147. [Google Scholar] [CrossRef] [Scilit]
- Wu, H.; Xu, S.; Huang, S.; Wang, J.; Yang, X.; Liu, C.; Zhang, Y. Optimal Road Matching by Relaxation to Min-Cost Network Flow. Int. J. Appl. Earth Obs. Geoinf. 2022, 114, 103057. [Google Scholar] [CrossRef] [Scilit]
- Tan, S.-Y.; Yeh, W.-C. The Vehicle Routing Problem: State-of-the-Art Classification and Review. Appl. Sci. 2021, 11, 10295. [Google Scholar] [CrossRef] [Scilit]
- Guo, D.; Su, Y.; Zhang, X.; Yang, Z.; Duan, P. Multi-Objective Optimization of Short-Inverted Transport Scheduling Strategy Based on Road–Railway Intermodal Transport. Sustainability 2024, 16, 6310. [Google Scholar] [CrossRef] [Scilit]
- Ferjani, A.; El Yaagoubi, A.; Boukachour, J.; Duvallet, C. An Optimization-Simulation Approach for Synchromodal Freight Transportation. Multimodal Transp. 2024, 3, 100151. [Google Scholar] [CrossRef] [Scilit]
- Pasaribu, M. Implementation of Northwest Corner Transportation Method for Optimizing Item Shipping Cost. Login 2019, 13, 1–4. [Google Scholar]
- Harahap, L.M.; Febrianda, D.; Ariani, P.; Syahfitri, R.S.; Ritonga, Z.A. Optimizing Transportation Costs Using the Minimum Cell Cost Method in the “Yusril Medan Bread Distribution” Business. Econ. J. Econ. Bus. 2024, 3, 55–58. [Google Scholar] [CrossRef] [Scilit]
- Babu, M.A.; Hoque, M.A.; Uddin, M.S. A Heuristic for Obtaining Better Initial Feasible Solution to the Transportation Problem. OPSEARCH 2020, 57, 221–245. [Google Scholar] [CrossRef] [Scilit]
- Amaliah, B.; Fatichah, C.; Suryani, E. Two Highest Penalties: A Modified Vogels Approximation Method to Find Initial Basic Feasible Solution of Transportation Problem. In Proceedings of the 2021 13th International Conference on Information & Communication Technology and System (ICTS), Virtual, 20–21 October 2021; IEEE: Piscataway, NJ, USA, 2021; pp. 318–323. [Google Scholar]
- Wang, X.; Peng, Y.; Ma, W. SPO-VCS: An End-to-End Smart Predict-Then-Optimize Framework with Alternating Differentiation Method for Relocation Problems in Large-Scale Vehicle Crowd Sensing. Transp. Res. E Logist. Transp. Rev. 2026, 205, 104515. [Google Scholar] [CrossRef] [Scilit]
- Lin, Y.; Wang, Y.; Lee, L.H.; Chew, E.P. Profit-Maximizing Parcel Locker Location Problem under Threshold Luce Model. Transp. Res. E Logist. Transp. Rev. 2022, 157, 102541. [Google Scholar] [CrossRef] [Scilit]
- Amine Masmoudi, M.; Mancini, S.; Baldacci, R.; Kuo, Y.-H. Vehicle Routing Problems with Drones Equipped with Multi-Package Payload Compartments. Transp. Res. E Logist. Transp. Rev. 2022, 164, 102757. [Google Scholar] [CrossRef] [Scilit]
- Assaf, A.; Yaşar, R.; Şahin, M. Optimizing Türkiye’s Natural Gas Infrastructure Using Network Flow Modeling and AI-Based Network Flow Optimization System (NFOS). J. Eng. Res. 2025, 14, 2618–2631. [Google Scholar] [CrossRef] [Scilit]
- Garus, A.; Christidis, P.; Mourtzouchou, A.; Duboz, L.; Ciuffo, B. Unravelling the Last-Mile Conundrum: A Comparative Study of Autonomous Delivery Robots, Delivery Bicycles, and Light Commercial Vehicles in 14 Varied European Landscapes. Sustain. Cities Soc. 2024, 108, 105490. [Google Scholar] [CrossRef] [Scilit]
- Montemanni, R.; Smith, D. On Solving the Assignment Problem with Conflicts 2025. arXiv 2025, arXiv:2506.04274. [Google Scholar]
- Omar, A.; Omar, Y.; Solayman, M.; Mansour, H. Comparative Analysis of Ant Colony Optimization and Google OR-Tools for Solving the Open Capacitated Vehicle Routing Problem in Logistics 2025. In Proceedings of the 2025 Intelligent Methods, Systems, and Applications (IMSA), Giza, Egypt, 12–13 July 2025. [Google Scholar]
- Ramasamy, S.; Reddinger, J.-P.F.; Dotterweich, J.M.; Childers, M.A.; Bhounsule, P.A. Coordinated Route Planning of Multiple Fuel-Constrained Unmanned Aerial Systems with Recharging on an Unmanned Ground Vehicle for Mission Coverage. J. Intell. Robot. Syst. 2022, 106, 30. [Google Scholar] [CrossRef] [Scilit]
- Cruz, M.; Carvalho, R.; Costa, A.; Pinto, L.; Dias, L.; Cerqueira, P.; Machado, R.; Batista, T.; Castro, P.; Ribeiro, J. A Contribution of Shortest Paths Algorithms to the NetworkX Python Library. Appl. Sci. 2025, 15, 8273. [Google Scholar] [CrossRef] [Scilit]
- Xu, Q.; Wang, J.; Huang, J.; Deng, H.; Wang, X.; Wu, Q. Research on the Optimization of Public Transportation Networks: The Big Data and NetworkX Framework. In Proceedings of the Tenth International Conference on Electromechanical Control Technology and Transportation (ICECTT 2025), Guilin, China, 6–8 June 2025; Goh, H.H., Wu, J., Eds.; SPIE: Bellingham, WA, USA, 2025; p. 233. [Google Scholar]
- Sarma, N.J.S.; Hyland, M. Metrics for Quantifying Shareability in Transportation Networks: The Maximum Network Flow Overlap Problem. Transp. Res. Part C Emerg. Technol. 2024, 158, 104420. [Google Scholar] [CrossRef] [Scilit]
- Wasik, E.; Sidor, T.; Wolowiec, T.; Piwkowski, J.; Jasienski, M. Supporting Supply Chain Risk Management: An Innovative Approach Using Graph Theory and Forecasting Algorithms. Eur. Res. Stud. J. 2024, XXVII, 25–37. [Google Scholar] [CrossRef] [Scilit]
- Agalianos, K.; Ponis, S.T.; Aretoulaki, E.; Plakas, G.; Efthymiou, O. Discrete Event Simulation and Digital Twins: Review and Challenges for Logistics. Procedia Manuf. 2020, 51, 1636–1641. [Google Scholar] [CrossRef] [Scilit]
- Tako, A.A.; Robinson, S. The Application of Discrete Event Simulation and System Dynamics in the Logistics and Supply Chain Context. Decis. Support Syst. 2012, 52, 802–815. [Google Scholar] [CrossRef] [Scilit]
- Bottani, E.; Casella, G. Discrete-Event Simulation in Logistics and Supply Chain Management: A Scientometric Perspective. Prod. Manuf. Res. 2024, 12, 2415038. [Google Scholar] [CrossRef] [Scilit]
- Ivanov, D.; Dolgui, A.; Sokolov, B.; Ivanova, M. Integrated Simulation-Optimization Modeling Framework of Resilient Design and Planning of Supply Chain Networks. IFAC-PapersOnLine 2022, 55, 2713–2718. [Google Scholar] [CrossRef] [Scilit]
- Deng, J.; Chen, X.; Wei, W.; Liang, J. Resource Coordination Scheduling Optimisation of Logistics Information Sharing Platform Considering Decision Response and Competition. Comput. Ind. Eng. 2023, 176, 108892. [Google Scholar] [CrossRef] [Scilit]
- Solano-de-la-Sala, A.-F.; Montenegro-Cobo, F.-I.; Collaguazo-Arellano, A.-M.; Mollocana-Lara, J.-G. Simulation of Carbonated Beverages Production Process Using MATLAB; Springer: Cham, Switzerland, 2024; pp. 713–728. [Google Scholar]
- Hu, W.; Deng, H. An Investigation of Inbound Process Optimization Using Flexsim: A Case Study of J E-Commerce Platform. In Proceedings of the 2023 International Conference on Data Science and Network Security (ICDSNS), Tiptur, India, 28–29 July 2023; IEEE: Piscataway, NJ, USA, 2023; pp. 1–7. [Google Scholar]
- Krynke, M. Optimizing Supply Chain in a Foundry Through Computer Simulation Using Flexsim—A Case Study. Syst. Saf. Hum.-Tech. Facil.-Environ. 2023, 5, 172–181. [Google Scholar] [CrossRef] [Scilit]
- Wang, S.; Wang, S.; Zhang, N. Flexsim-Based Simulation and Optimization of Green Logistics Distribution Center. In Proceedings of the 2022 the 14th International Conference on Computer Modeling and Simulation, Chongqing, China, 24–26 June 2022; ACM: New York, NY, USA, 2022; pp. 76–82. [Google Scholar]
- Ma, X.; Yin, Y.; Liu, T. The Simulation and Optimizing of Different Distribution Strategies for the Distribution Centre Based on Flexsim. In Proceedings of the 2011 IEEE International Conference on Automation and Logistics (ICAL), Chongqing, China, 15–16 August 2011; IEEE: Piscataway, NJ, USA, 2011; pp. 201–204. [Google Scholar]
- Ni, P.; Wang, Y.; Chen, D. Logistics Analysis and Simulation in the Intelligent Manufacturing Workshop. J. Phys. Conf. Ser. 2019, 1311, 012020. [Google Scholar] [CrossRef] [Scilit]
- Kordos, M.; Boryczko, J.; Blachnik, M.; Golak, S. Optimization of Warehouse Operations with Genetic Algorithms. Appl. Sci. 2020, 10, 4817. [Google Scholar] [CrossRef] [Scilit]
- Ge, L.; Song, Z.; Xu, X.; Bai, X.; Yan, J. Dynamic Networking of Islanded Regional multi-microgrid Networks Based on Graph Theory and multi-objective Evolutionary Optimization. Int. Trans. Electr. Energy Syst. 2021, 31. [Google Scholar] [CrossRef] [Scilit]
- Guerrero, N.; Escobar, L. Process Optimization with Discrete Event Simulation Software: An Experience in Ecuador Small Enterprise. In Proceedings of the XV Multidisciplinary International Congress on Science and Technology, Madrid, Spain, 19–22 August 2022; Springer: Berlin/Heidelberg, Germany, 2022; pp. 211–224. [Google Scholar]
- Sablón Cossío, N.; Orozco Crespo, E.; Pancorbo Sandoval, J.; Cuétara Sánchez, L.; Leyva Ricardo, S.; Moreno-Monge, A. Evaluation of Performance in the Supply Chain of T-Shirts in the North of Ecuador. In Proceedings of the 1st GCC International Conference on Industrial Engineering and Operations Management, Riyadh, Saudi Arabia, 26–28 November 2019; IEOM Society International: Southfield, MI, USA, 2019. [Google Scholar]
- Espin-Castro, J.; Thirumuruganandham, S.; Yánez-Rueda, H.; Chuncha-Ashqui, E.; Clavon-Taipe, D.; Conrado-Mestanza, B.; Abril-Flores, B.; Kumarasamy, M. Energy Optimization of the Post-Harvest Area of Roses in Quiroga, Ecuador: A Comparative Analysis. In Proceedings of the 3rd International Symposium on Automation, Information and Computing, Beijing, China, 9–11 December 2022; pp. 138–149. [Google Scholar]
- Tasigchana-Falcon, S.-A.; Mollocana-Lara, J.-G.; Caranqui-Chanalata, A.-S. Comparative Study of Optimization Strategies of Galvanized Steel Ventilation Duct Production Using Discrete Event Simulation Software, Ambato, Ecuador, 21–25 October 2024; Springer: Berlin/Heidelberg, Germany, 2026; pp. 967–980. [Google Scholar]
- Schwinn, J.; Werner, R. On the Effectiveness of Primal and Dual Heuristics for the Transportation Problem. IMA J. Manag. Math. 2019, 30, 281–303. [Google Scholar] [CrossRef] [Scilit]
- Vieira, C.L.D.S.; Luna, M.M.M.; Azevedo, J.M. Minimum-Cost Flow Algorithms: A Performance Evaluation Using the Brazilian Road Network. World Rev. Intermodal Transp. Res. 2019, 8, 3. [Google Scholar] [CrossRef] [Scilit]
- Szkutnik-Rogoż, J.; Ziółkowski, J.; Małachowski, J.; Oszczypała, M. Mathematical Programming and Solution Approaches for Transportation Optimisation in Supply Network. Energies 2021, 14, 7010. [Google Scholar] [CrossRef] [Scilit]
- Johnson, A. A Supply Chain Model That Uses Mixed Integer Programming with Python. Available online: https://forums.autodesk.com/t5/flexsim-knowledge-base/a-supply-chain-model-that-uses-mixed-integer-programming-with/ta-p/13535183 (accessed on 30 September 2026).
- EP Petroecuador Estructura de Precios Del 12 de Junio al 11 de Julio de 2026. Available online: https://www.eppetroecuador.ec/wp-content/uploads/2026/06/ESTRUCTURA-DE-PRECIOS-DEL-12-DE-JUNIO-AL-11-DE-JULIO-DE-2026.pdf (accessed on 19 October 2026).
- EP Petroecuador Despachos Mensuales Por Terminal y Producto: Enero–Septiembre 2026. Available online: https://www.eppetroecuador.ec/wp-content/plugins/download-monitor/download.php?id=3292 (accessed on 19 October 2026).
- El Universo Conoce Las 10 Provincias de Ecuador Donde El Subsidio a La Gasolina Es Más Alto. Available online: https://www.eluniverso.com/noticias/economia/subsidio-gasolina-ecuador-provincias-ecuador-nota/ (accessed on 19 October 2026).
- Paredes Jácome, D.C.; Naranjo Armijo, D.L.; Cedeño González, M.P. Estimación Del Costo Por Kilómetro Recorrido En La Distribución de Carga Por La Empresa Tramaco Express Cía. Ltda., En El Cantón Santo Domingo Año 2024. Código Científico Rev. Investig. 2025, 6, 3257–3279. [Google Scholar] [CrossRef] [Scilit]
- Azaña-Zhuzhingo, J.F.; Andrade-Cordero, C.F.; Banegas-Peña, T.M. Aplicación Del Costeo ABC En El Servicio de Transporte de Modalidad Mixta. Rev. Arbitr. Interdiscip. Koinonía 2020, 5, 150. [Google Scholar] [CrossRef] [Scilit]
- Mollocana-Lara, J.G.; Avila-Gonzalez, L.X. FlexSim Simulation Models and Python Code for Minimum-Cost Distribution Flow Allocation in Ecuador. Zenodo 2026. [Google Scholar] [CrossRef]
- Soria-Arguello, I.; Villicaña-García, E. Logistics Optimization Applied to Redesign Operations Involving Merchandise Location, Employee Ergonomics and Distribution Network. Mathematics 2025, 13, 639. [Google Scholar] [CrossRef] [Scilit]
- Das, A.; Lee, G.M. A Multi-Objective Stochastic Solid Transportation Problem with the Supply, Demand, and Conveyance Capacity Following the Weibull Distribution. Mathematics 2021, 9, 1757. [Google Scholar] [CrossRef] [Scilit]

Disclaimer/Publisher’s Note: The statements, opinions and data contained in all publications are solely those of the individual author(s) and contributor(s) and not of MDPI and/or the editor(s). MDPI and/or the editor(s) disclaim responsibility for any injury to people or property resulting from any ideas, methods, instructions or products referred to in the content. |
© 2026 by the authors. Licensee MDPI, Basel, Switzerland. This article is an open access article distributed under the terms and conditions of the Creative Commons Attribution (CC BY) license.