


Abstract
Background: Pallet-label identification underpins warehouse inventory accuracy, but how imaging geometry affects optical character recognition (OCR) of robot-captured labels has not been characterized. This study evaluates a robotic OCR pipeline with database validation. Methods: An Ava Telepresence Robot captured label images, which the Google Cloud Vision API read and a simulated warehouse management system validated. A full-factorial experiment varied font size (12–16 pt), distance (1.00–1.50 m), and horizontal angle (0–60°) across 108 images; 120 validation reads assessed identifier accuracy. Results: In a conservative analysis, all three main effects on OCR confidence were significant (p ≤ 0.006). Confidence was stable to 45° at 1.00 m and, for 16 pt, at all distances, but fell for smaller fonts at longer distances and, in most conditions, at 60°. Cloud Vision read 80.8% of serial numbers exactly (character error rate 1.9%), against 37.5% for Tesseract. A calibrated 88.5% confidence criterion defined an operating envelope of 16 pt to 1.50 m and 14 pt to 1.25 m at angles up to 45°. Database validation produced no false accepts. Conclusions: Font size, distance, and viewing angle bound reliable label verification; the envelope guides label printing and camera placement, pending confirmation with repositioned replicates.
1. Introduction
Modern warehouse operations increasingly rely on automation to meet the growing demands of global supply chains. The need for rapid fulfillment, accurate inventory tracking, and minimized human error has accelerated the adoption of smart technologies in logistics. Among the most critical components of this transformation is the reliable identification and traceability of pallets throughout the warehousing life cycle. Inventory records are frequently inaccurate: in one large retail study, 65% of nearly 370,000 records did not match physical stock [1]. Traditionally, barcode scanning has served as the primary method for product and pallet identification, with radio-frequency identification (RFID) adopted in some supply chains to improve inventory accuracy [2]. While effective in controlled conditions, barcode systems have known limitations: they require precise alignment and an unobstructed line of sight, and they are sensitive to surface damage, dirt, or improper label placement. These constraints frequently lead to misreads or failed scans, resulting in delays, manual intervention, and reduced throughput. Barcode scanning is also inherently sequential, since each code must be aligned and read individually. Optical character recognition (OCR) can in principle capture several labels within a single image frame, which motivates the approach taken here; this throughput advantage is a motivation only: it was not measured in this study, and no barcode comparison was performed (Section 4.4).
This study was conducted in partnership with JTEKT North America, Inc., which provided all physical warehouse labels used in the experimental evaluation. The use of authentic production labels from a real automotive components manufacturer ensures that the findings are grounded in practical industrial conditions rather than synthetic test environments. OCR presents a compelling complement to barcode-based identification. Unlike barcodes, OCR can recognize human-readable alphanumeric text under suboptimal conditions such as angled views, varied lighting, or moderate surface wear. Deep-learning OCR services achieve high accuracy on noisy and oblique text [3,4] without the precise alignment that barcode scanners demand. Implementing OCR for pallet verification nonetheless raises practical questions that have not been answered empirically. Label readability depends on camera resolution, font size, imaging distance, and horizontal viewing angle, and the quantitative form of that dependence determines where cameras can be placed and how labels must be printed. Empirical studies show that recognition accuracy declines with distance and viewing angle [3], but this dependence has not been characterized for pallet labels imaged by a mobile robot. Prior work has addressed OCR performance or database verification in isolation; few studies have evaluated a physically deployed pipeline end to end under a controlled experimental design.
This paper addresses that gap through a full-factorial physical experiment conducted with warehouse labels at the Georgia Southern University Remotely Operated Warehouse Services (ROWS) Lab. The key contributions are:
- A full-factorial physical experiment: three font sizes, three imaging distances, and four horizontal angles, with three repeated captures per condition (108 images), analyzed by general factorial regression and by a conservative analysis of condition means.
- A correction of the pixels-per-character readability model using a field of view measured from the images, and a fit of recognition confidence against effective pixels per character with a cos θ foreshortening term.
- A physically deployed acquisition pipeline using the Ava Telepresence Robot as the imaging platform, feeding a Flask-based OCR microservice built on the Google Cloud Vision API.
- An inventory database validation module that verifies recognized JTEKT identifiers against a simulated warehouse management system (WMS) and flags mismatched labels, evaluated with identifier-level accuracy, character error rate, and database accept/reject outcomes on a validation session of 120 serial-number reads, together with an operating envelope derived from a criterion calibrated against read accuracy.
Prior research can be organized into two streams: text recognition and automatic identification in industrial logistics, and inventory verification and automated stocktaking.
1.1. Text Recognition and Automatic Identification in Logistics
Scene-text recognition has advanced rapidly with deep learning. Long et al. [5] survey detection and recognition methods, and Baek et al. [6] show that most modern recognizers share a four-stage structure whose first stage normalizes distorted text. Rectification networks such as ASTER [7] explicitly correct perspective and curved text before recognition, which is directly relevant to labels viewed at oblique angles. Open-source engines provide practical baselines: Tesseract [8] is the most widely used classical engine, and PP-OCR [9] offers a lightweight deep-learning alternative. In a benchmarking study on noisy documents, server-based engines substantially outperformed Tesseract [4]. Feng et al. [3] compared Google Vision, PaddleOCR, EasyOCR, and Tesseract at distances of 1–7 m and viewing angles of 0–75°; Google Vision was most accurate, PaddleOCR was close behind, and accuracy fell at wider angles. These findings motivate both our choice of Google Cloud Vision and the comparison with an open-source baseline in Section 3.5.
In industrial settings, Monteiro et al. [10] combined YOLO-based detection with PaddleOCR to read printed stickers in a manufacturing plant, also extracting barcodes and QR codes, and reported a macro accuracy of 0.88 across three sticker patterns. That study did not vary imaging geometry under a controlled design or link recognition to inventory validation.
1.2. Inventory Verification and Automated Stocktaking
Inventory record inaccuracy is a persistent problem: DeHoratius and Raman [1] found 65% of nearly 370,000 retail inventory records to be inaccurate. RFID has been widely studied as a means of improving record accuracy and supply chain performance [2]. Automated stocktaking has been demonstrated on robotic platforms: Kalinov et al. [11] used an unmanned aerial vehicle with convolutional neural network-based barcode detection for warehouse stocktaking, and Naumann et al. [12] review computer vision applications across transportation logistics and warehousing. These systems rely on barcodes or RFID tags rather than human-readable text, and none reports how imaging geometry affects recognition of printed identifiers before database verification.
1.3. Research Gaps
Three gaps remain. First, nearly all OCR evaluations use offline or handheld image capture; few use robotic platforms under parameterized conditions. Second, the dependence of recognition on font size, distance, and angle has not been characterized for pallet labels in a physically deployed system, nor has it been related to the pixels per character available at the sensor. Third, no prior work reports an integrated pipeline in which robot-captured images flow automatically through a cloud OCR service to database validation with measured accept and reject outcomes. This work addresses all three.
2. Materials and Methods
2.1. Camera Configuration and Imaging Requirements
The camera parameters used in this study are grounded in the ROWS Lab technical specification Video Camera Requirements for Label Reading, which defines the mathematical relationship between resolution, font size, imaging distance, and the pixels-per-character threshold required for reliable OCR.
2.1.1. Core Readability Model
The maximum distance at which a label can be reliably read is governed by:
where D is the camera-to-label distance (m), S is the character height (m), R is the vertical resolution (pixels), Pmin is the minimum pixels per character (typically 12–30), and FOV is the vertical field of view (degrees). Equation (1) contains no angle term. With S = 4.2 mm (the em height of 12 pt type), R = 1080, and the nominal 40° vertical field of view, Equation (1) gives D ≤ 6.23/Pmin m, that is, 0.52 m for Pmin = 12 and 0.21 m for Pmin = 30, so the nominal parameters cannot explain the reads observed at 1.00–1.50 m. The effective field of view at the 66% zoom setting was therefore measured from the images. Taking digit height as 0.716 of the em height, as in common sans-serif faces, serial-number digits were 10.5, 13, and 14 pixels tall for 12, 14, and 16 pt at 1.00 m, and 11 pixels for 14 and 16 pt at 1.25 m, giving an effective vertical field of view of 17.2° (standard deviation 0.9°), far narrower than the nominal 40°. With this field of view and a threshold of about 9 pixels (Section 3.5), Equation (1), with S taken as the digit height, gives 1.2, 1.4, and 1.6 m for 12, 14, and 16 pt. To include horizontal foreshortening, the effective pixels per character is defined as
where ph is the digit height in pixels predicted from the geometry of Equation (1) with the measured field of view and θ is the horizontal viewing angle.
peff = ph · cos θ
2.1.2. Experimental Platform
The Ava Telepresence Robot (Ava Robotics, Inc., Boston, MA, USA) [13] was used as the image acquisition platform in all physical experiments. The robot’s integrated camera operates at 1920 × 1080 pixels with a 66% zoom setting and was positioned at heights and distances corresponding to typical warehouse overhead or eye-level camera placements. Its autonomous navigation capability enables repeatable positioning across test runs, providing consistent geometric conditions that would be difficult to replicate with handheld equipment.
2.1.3. Environmental Factors Affecting OCR
The ROWS Lab specification identifies several secondary factors that influence OCR performance beyond the core geometric model:
- Lighting: Contrast and ambient brightness directly affect text legibility; all experiments were conducted under controlled indoor lighting.
- Camera angle: Recognition accuracy is expected to degrade as the horizontal viewing angle deviates from perpendicular. Angles of 0°, 30°, 45°, and 60° were systematically evaluated.
- Surface reflections: Glossy labels can introduce specular highlights that reduce contrast; matte labels were used where possible.
- Font size: Larger text produces more pixels per character at a given distance, and is therefore expected to increase recognition confidence.
2.2. System Architecture
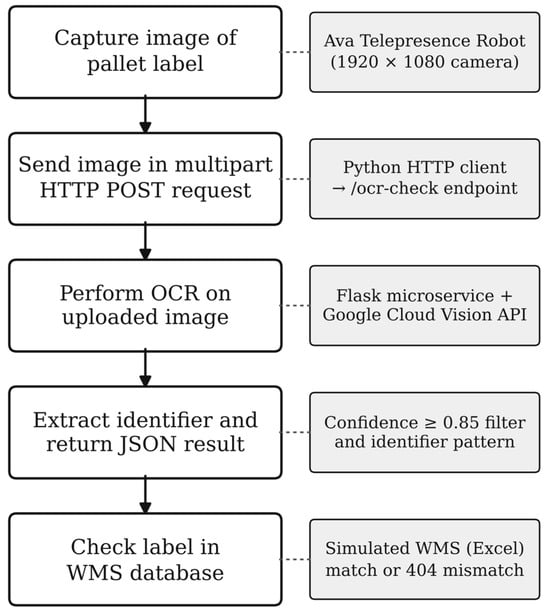
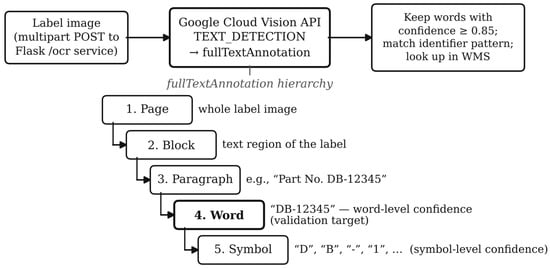
The proposed system comprises three tightly integrated components that form a complete label-to-database verification pipeline, as illustrated in Figure 1:
Figure 1.
End-to-end OCR and inventory database validation pipeline: pallet labels are imaged by the Ava Telepresence Robot, processed by the Flask-based OCR microservice via the Google Cloud Vision API, and validated against the simulated WMS.
- Image Acquisition: The Ava Telepresence Robot captures high-resolution images of pallet labels under parameterized conditions of font size, distance, and angle. Images are saved locally and transmitted to the OCR service.
- OCR Microservice: A Python Flask server (https://flask.palletsprojects.com/en/stable/ (accessed on 19 October 2026)) [14] receives images via a multipart HTTP POST request, forwards them to the Google Cloud Vision API [15], and extracts recognized text with confidence scores.
- Inventory Database Validation: The extracted JTEKT part or serial number is matched against a simulated WMS implemented as an Excel workbook. A successful match confirms the label; a mismatch or missing entry triggers a verification alert.
2.3. OCR Microservice
The OCR backend is implemented as a Flask microservice exposing two RESTful endpoints: /ocr for standalone text recognition and /ocr-check for recognition combined with database validation.
2.3.1. /ocr Endpoint
The /ocr route accepts image files transmitted by a multipart HTTP POST request and is field-agnostic, accepting the first uploaded file regardless of form key name. The server stores the image, submits it to the Google Cloud Vision API using the TEXT_DETECTION feature, traverses the returned annotation hierarchy to word level, retains only words with confidence above 0.85, and applies a regular expression to identify valid JTEKT part numbers. The endpoint returns a JSON response containing the full OCR output, the filtered text, and any detected identifier. The confidence threshold and the identifier pattern act only in this identifier extraction; the confidence score analyzed in the factorial experiment is computed separately (Section 2.7.2). Both steps are described in Section 2.4.
2.3.2. /ocr-Check Endpoint with Database Validation
The /ocr-check route extends the same image processing with a database lookup. It loads the wms_lookup.xlsx file into a Pandas DataFrame, normalizes the identifier column to uppercase with whitespace removed, and compares the extracted identifier against it. A successful match returns the associated metadata—quantity, location, Oracle number, and PCL number—while an absent identifier returns a 404 response with a mismatch warning.
2.3.3. Error Handling and Logging
The server implements comprehensive logging to support debugging and operational monitoring, reporting missing files, content-type mismatches, malformed multipart requests, empty OCR responses, failed pattern matches, and file I/O exceptions. This logging infrastructure was essential during experiments for diagnosing image quality issues and partial reads.
2.3.4. Deployment
The microservice runs on port 4001 and is stateless by design. Its HTTP interface allows any imaging client—robotic, fixed camera, or handheld—to submit images for recognition and verification without modification to the server. Deployment, concurrency, and latency under production load were not evaluated (Section 4.4).
2.4. Label Recognition and OCR Processing
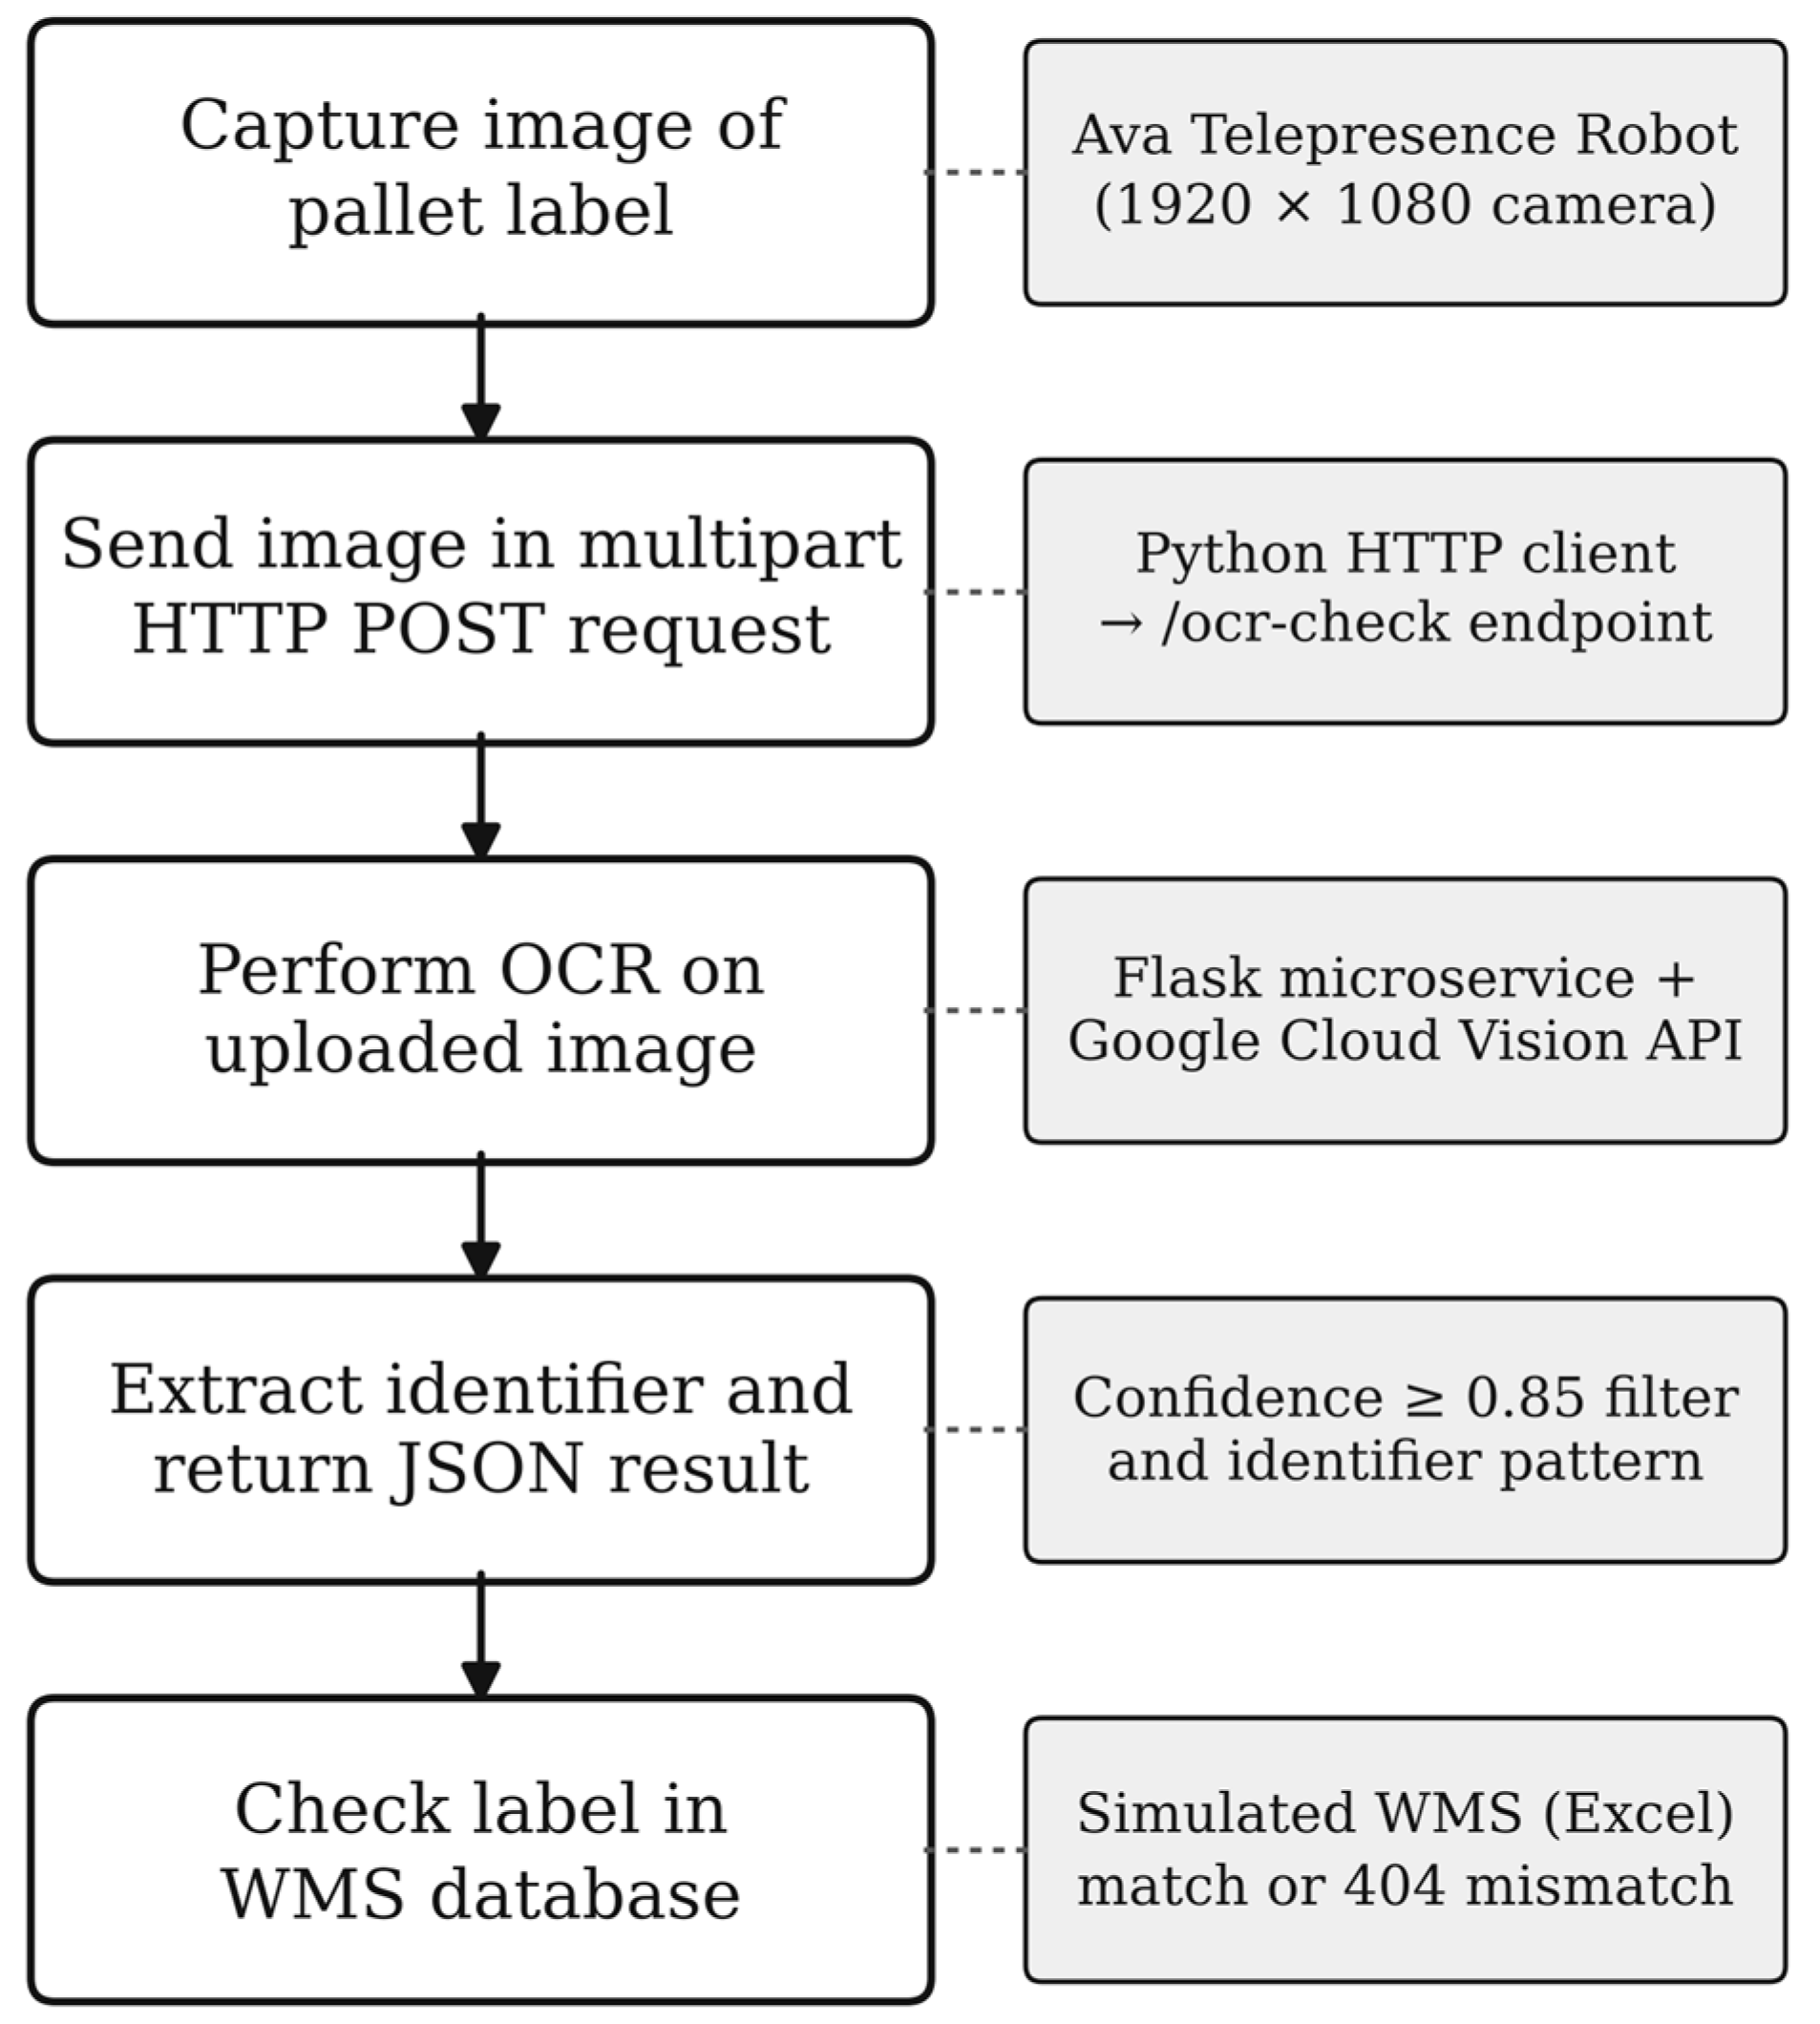
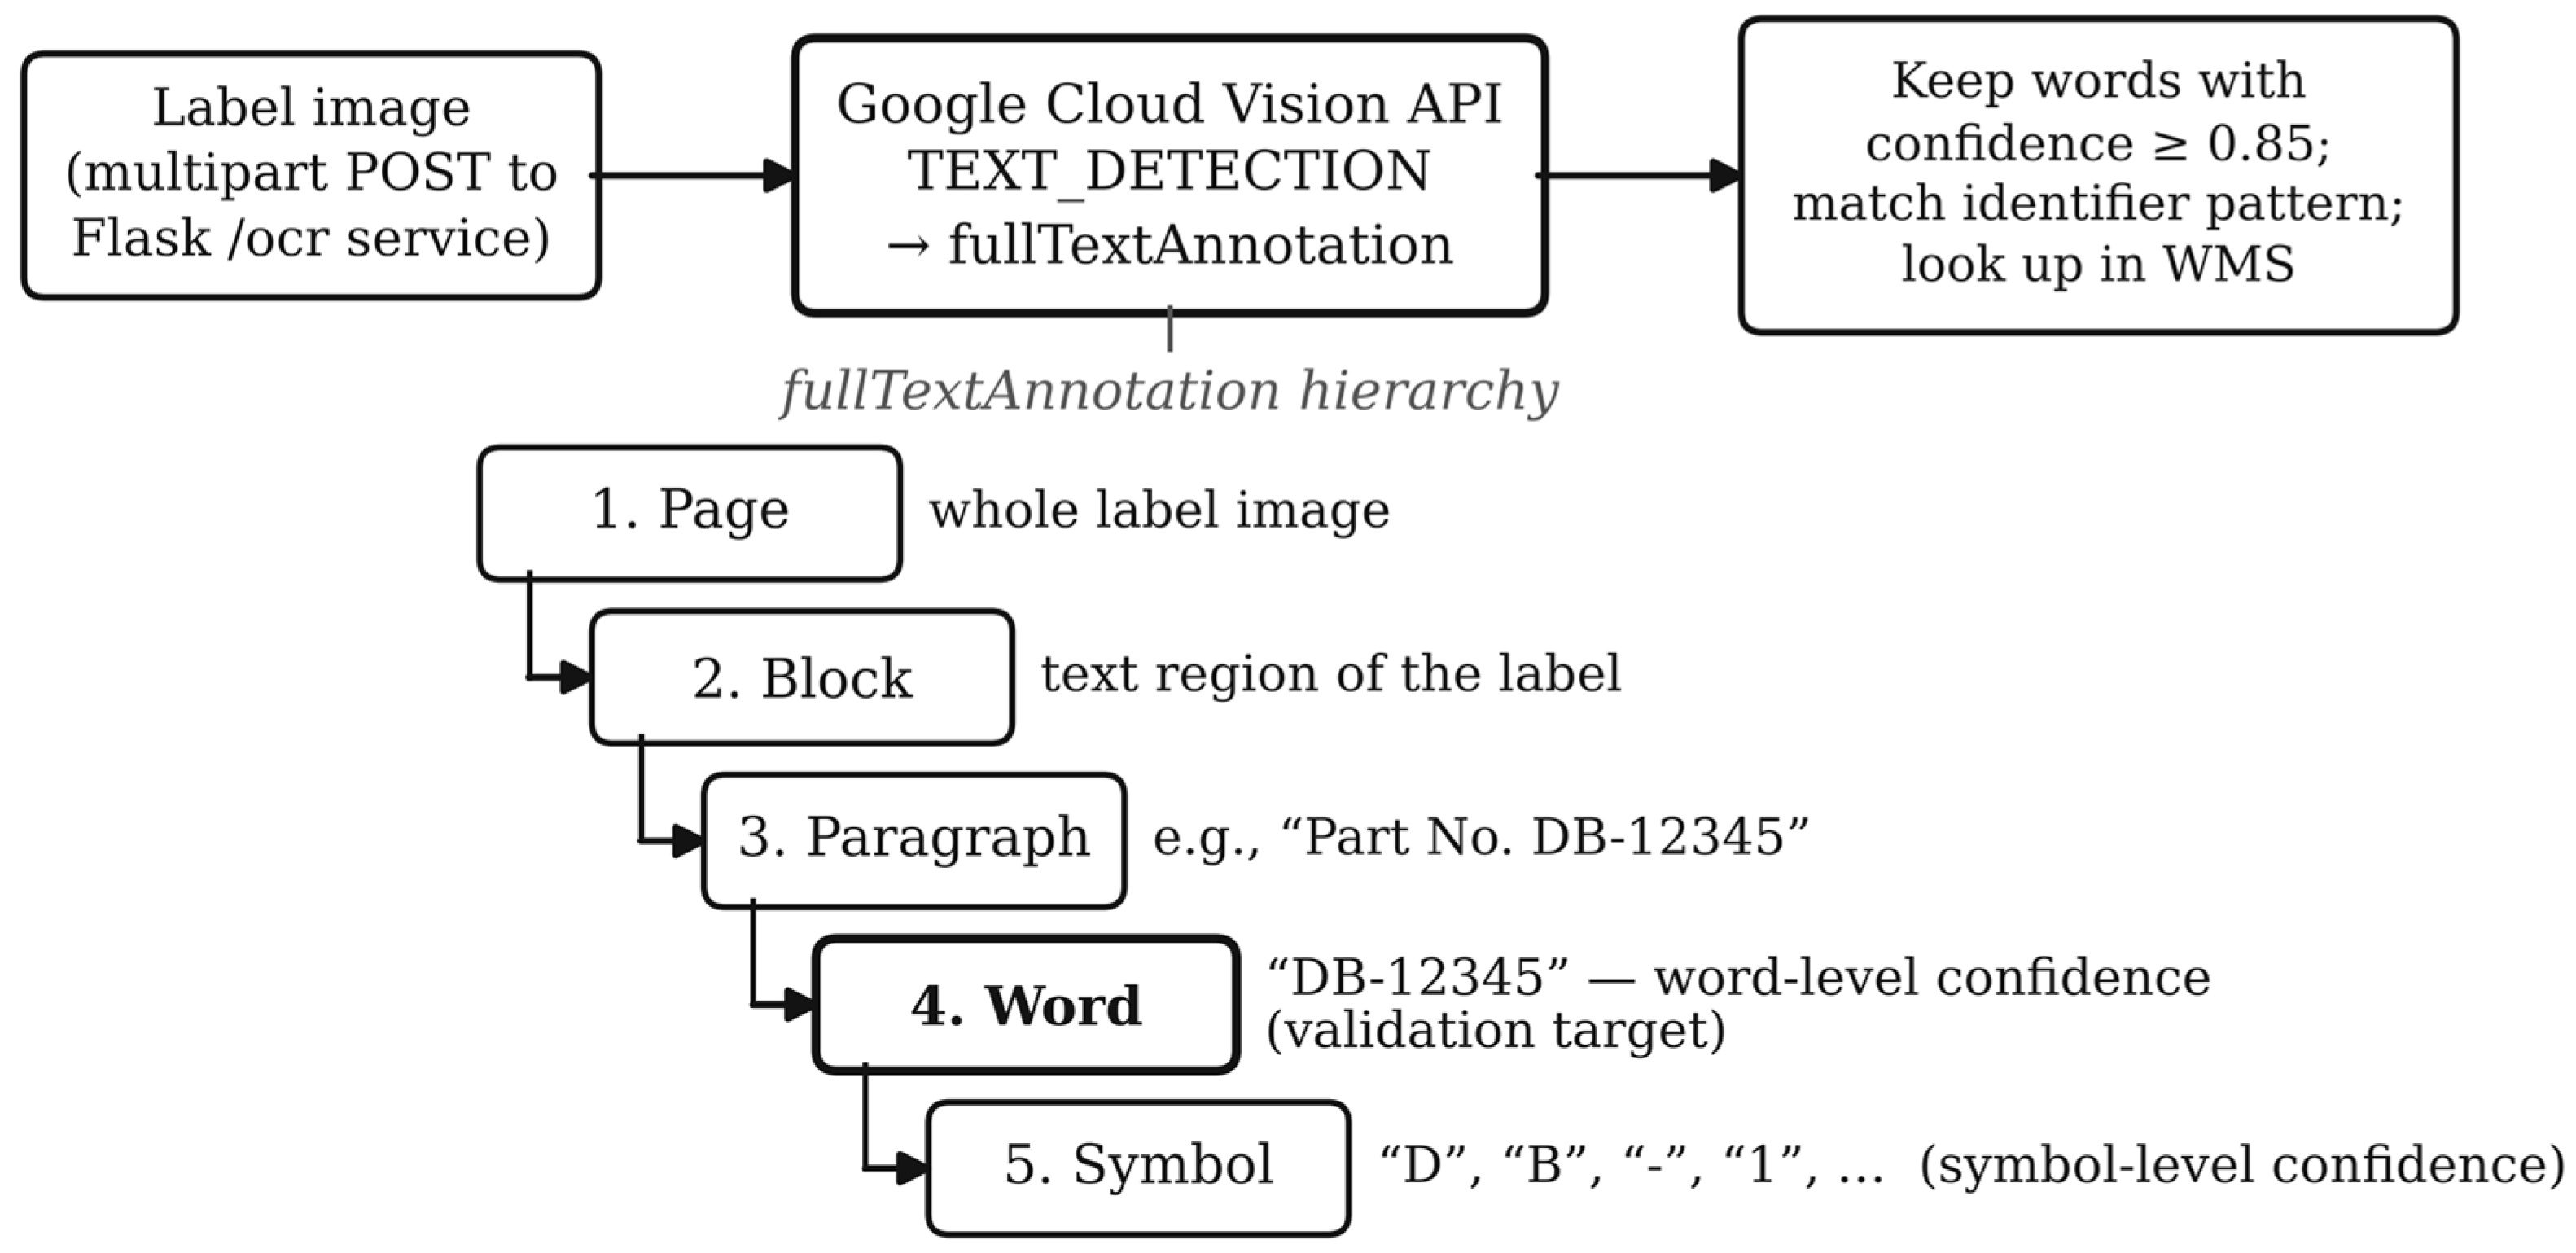
Recognition is powered by the Google Cloud Vision API, a cloud-based deep learning service providing enterprise-grade text recognition without local model deployment or manual preprocessing. As shown in Figure 2, the pipeline operates in three stages.
Figure 2.
Google Cloud Vision structural hierarchy: text is decomposed from page to symbol level, enabling precise extraction of industrial part numbers from complex label images.
First, the captured image is encoded in Base64 and submitted using the TEXT_DETECTION feature, which is optimized for sparse text within larger image regions—the pattern typical of warehouse labels, where alphanumeric identifiers are surrounded by blank space, logos, and secondary fields. The API returns a structured fullTextAnnotation object that decomposes the image from page through block, paragraph, and word down to individual symbols, carrying confidence scores at word and symbol level. Word level is the primary validation target, corresponding to tokens such as “DB-12345”. Second, word-level results with confidence below 0.85 are discarded, reducing noise and minimizing spurious matches against database entries. Third, the pattern \b(DB|LS)-[0-9A-Z-]+\b is applied to the filtered text to extract JTEKT-format identifiers, suppressing lot numbers, QR-code artifacts, and background printing from being forwarded to the database.
The 0.85 threshold and the identifier pattern determine only which string the /ocr-check service forwards to the database. The confidence score analyzed in the factorial experiment is a separate quantity: the experiment script sent each image directly to the Cloud Vision DOCUMENT_TEXT_DETECTION feature, and the score is the mean confidence of all words returned, with no threshold or pattern applied (Section 2.7.2).
2.5. Inventory Database Lookup and Validation
The inventory database is a simulated WMS, represented as an Excel workbook (wms_lookup.xlsx) loaded into a Pandas DataFrame at query time. It was populated with JTEKT product records covering part number, Oracle number, PCL number, serial number, quantity, and storage location. Two configurations were used in experiments:
- Complete database: Contains all label types and serial numbers that could appear on a pallet in the ROWS Lab, used for full-coverage validation testing.
- Targeted database: A subset containing exactly eight entries, used to evaluate detection of both matching and non-matching labels on an eight-box pallet.
The validation logic normalizes both the extracted identifier and the database column to uppercase with whitespace removed before comparison, ensuring robustness to minor formatting differences between printed labels and stored entries. For serial-number-based validation, the system extracts the S/N field from the OCR output and compares it against the corresponding column. This design supports detection of intentional mismatches—where a box from a different lot or part family is placed on an incorrect pallet—even when OCR confidence for that label is high. The current validation layer verifies only whether a recognized identifier is present in the database; it does not confirm that the label is assigned to the correct order or shipment. Because OCR reads text as captured by the camera, it also cannot verify label authenticity: a manually produced or counterfeit label bearing a valid part number would be accepted as legitimate. These limitations are revisited in Section 4.4.
2.6. HTTP Client and Data Flow
Images captured by the Ava Telepresence Robot are transferred to the Flask microservice using a Python HTTP client built with the requests library. The client constructs a multipart/form-data POST request containing the image file and submits it to the /ocr-check endpoint on port 4001. A 200 response is parsed to extract the OCR text, confidence scores, and matched record, which are logged to the local workstation together with the part number, quantity, location, and match status; a 404 response is logged as a mismatch warning; any other response is logged for inspection. The per-image confidence score is recorded in every case for the statistical analysis of Section 3.
Algorithm 1 summarizes the client data flow.
| Algorithm 1. Client data flow for OCR-based label verification |
| Require: File path to label image, OCR-check API URL 1: Read image file into memory 2: Construct multipart POST request with image as image field 3: Submit request to /ocr-check endpoint 4: if HTTP response == 200 then 5: Parse JSON: extract OCR text, confidence scores, WMS match record 6: Log: part number, quantity, location, match status 7: else if HTTP response == 404 then 8: Log mismatch warning: extracted identifier not found in WMS 9: else 10: Log error response for inspection 11: end if 12: Record confidence scores per image for statistical analysis |
This stateless request-response model means any imaging source can be substituted for the robot without modifying the server, supporting future integration with fixed overhead cameras or other mobile robotic platforms.
2.7. Experimental Methods
All experiments were conducted at the Georgia Southern University ROWS Lab using the Ava Telepresence Robot as the imaging platform. The robot’s integrated camera (1920 × 1080 pixels, 66% zoom setting) was positioned at controlled distances and angles relative to printed pallet labels.
2.7.1. Single-Label Imaging Tests
To isolate the effect of individual imaging parameters on OCR confidence, a single label was affixed at the center of a pallet face. The tested variable levels were:
- Font sizes: 12, 14, and 16 pt, em heights 4.2, 4.9, and 5.6 mm; the font family was not recorded.
- Distances: 1.00, 1.25, and 1.50 m from camera to label.
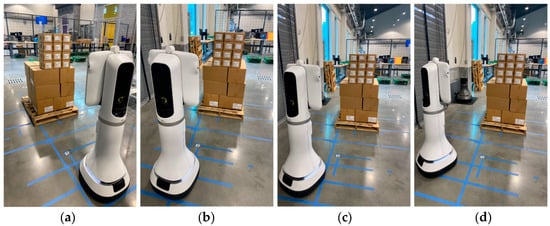
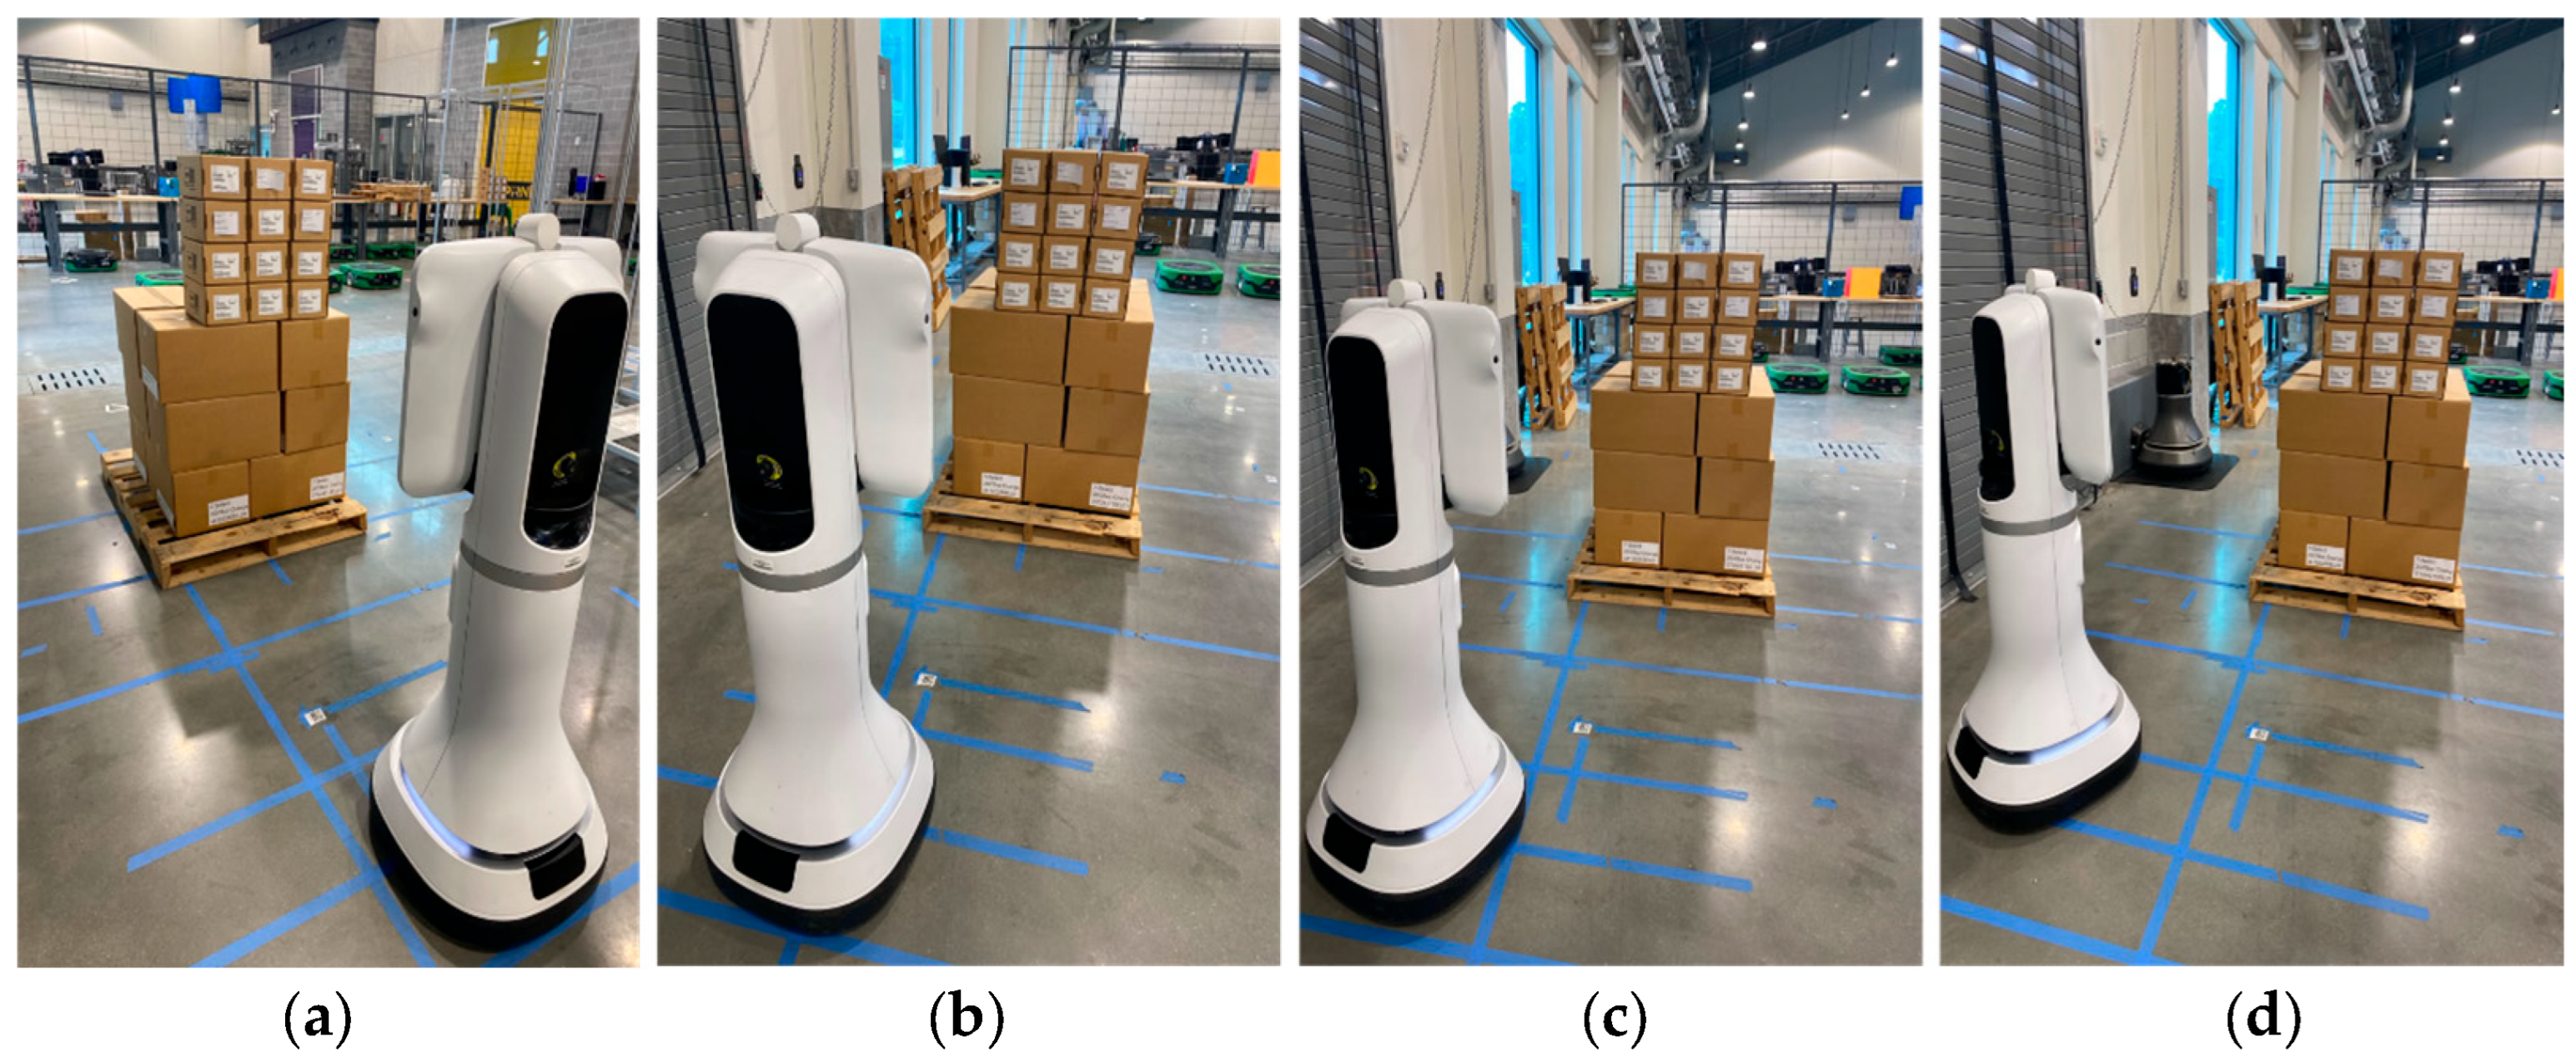
- Horizontal angles: 0°, 30°, 45°, and 60° off perpendicular (Figure 3).
Figure 3.
Experimental setup: the Ava Telepresence Robot positioned at four horizontal angles relative to the label-bearing box faces, with distance held constant at 1.25 m. (a) 0° (perpendicular), (b) 30°, (c) 45°, (d) 60°.
These parameter ranges were selected using the design rule of Equation (1) and refined in preliminary trials. Distances beyond 1.50 m, font sizes below 12 pt, and horizontal angles beyond 60° were tested during preliminary trials but produced consistently unreadable or unreliable results with the Ava camera at its configured zoom level, confirming those boundaries as practical limits of the imaging platform rather than arbitrary cutoffs.
This yielded a balanced general full-factorial design of 3 × 3 × 4 = 36 test conditions. Each condition was captured three times from a single robot pose with one printed label per font size, resulting in 108 images in total. These repeated captures measure capture repeatability rather than full experimental error, which would also include variation from repositioning the robot and from label copies (Section 2.8).
2.7.2. Confidence Score Calculation
For the factorial experiment, each image was sent directly by the experiment script to the Google Cloud Vision DOCUMENT_TEXT_DETECTION feature, which returns a confidence score for each recognized word. The image-level confidence score is the mean confidence of all words in the image. No 0.85 threshold or identifier pattern is applied, so the score reflects all text on the label, including logos, lot numbers, and background printing, rather than the identifier alone, and it can fall below 0.85 even when the identifier is legible. All statistical analysis in Section 3.2 was performed on these 108 image-level scores; the condition means reported in Table 1 are averages of the three repeated captures and are presented for readability only.
Table 1.
Mean OCR confidence (%) by condition, averaged over three repeated captures.
2.7.3. Multi-Label Database Validation Tests
To evaluate the full pipeline under realistic conditions, a pallet loaded with six to eight boxes was imaged with labels affixed to the bottom-right face of each box. Three label types were used, all containing standard JTEKT product fields: part number, Oracle number, PCL number, serial number, and quantity. The system extracted the S/N field from each detected label and queried the database to determine whether the box belonged to the correct pallet. One box was intentionally mislabeled to verify that the system correctly flagged the mismatch. A second test used a pallet with eight boxes against the targeted eight-entry configuration, evaluating the system’s ability to confirm all present labels and detect absent entries.
2.7.4. Validation Session for Identifier Accuracy
To measure identifier-level accuracy, a validation session was recorded on 4 November 2025 with the same robot camera and processing script. Twenty-four images were captured at 0° with 14 and 16 pt labels at distances of 1.00–1.75 m, giving 120 serial-number reads, each scored against the labels in view. The successful-read rate is the share of serial numbers read exactly. The character error rate (CER) is the Levenshtein edit distance between the extracted and true serial number divided by the length of the true serial number; a label for which no serial number was extracted is counted as a failed read with CER = 1. Each extracted serial number was also checked against the WMS table: 84 reads were of labels present in the WMS and 36 of labels absent from it, so that false accepts (an absent or misread label accepted) and false rejects (a correct label rejected) could be counted. Every pair of serial numbers in the WMS table was screened for near-duplicates differing by a single character. As an on-premise baseline, the same images were processed with Tesseract 5.0 [8]. Per-image results are given in Supplementary Table S1.
2.8. Statistical Analysis
A general factorial regression was fitted to the 108 image-level scores with angle, font size, and distance as fixed factors and all interaction terms. Because the three captures per condition share one robot pose and one printed label, its error term measures capture repeatability only, and its tests are anticonservative. A conservative analysis was therefore also performed on the 36 condition means, with the three-way interaction serving as the error term (12 df), a standard approach for factorial experiments without true replication [16]. Tukey comparisons were computed under both error terms. Finally, condition-mean confidence was related to the effective pixels per character of Equation (2) by fitting a saturating exponential, and by a linear model with separate log digit-height and log cos θ terms.
3. Results
3.1. OCR Confidence Across Imaging Parameters
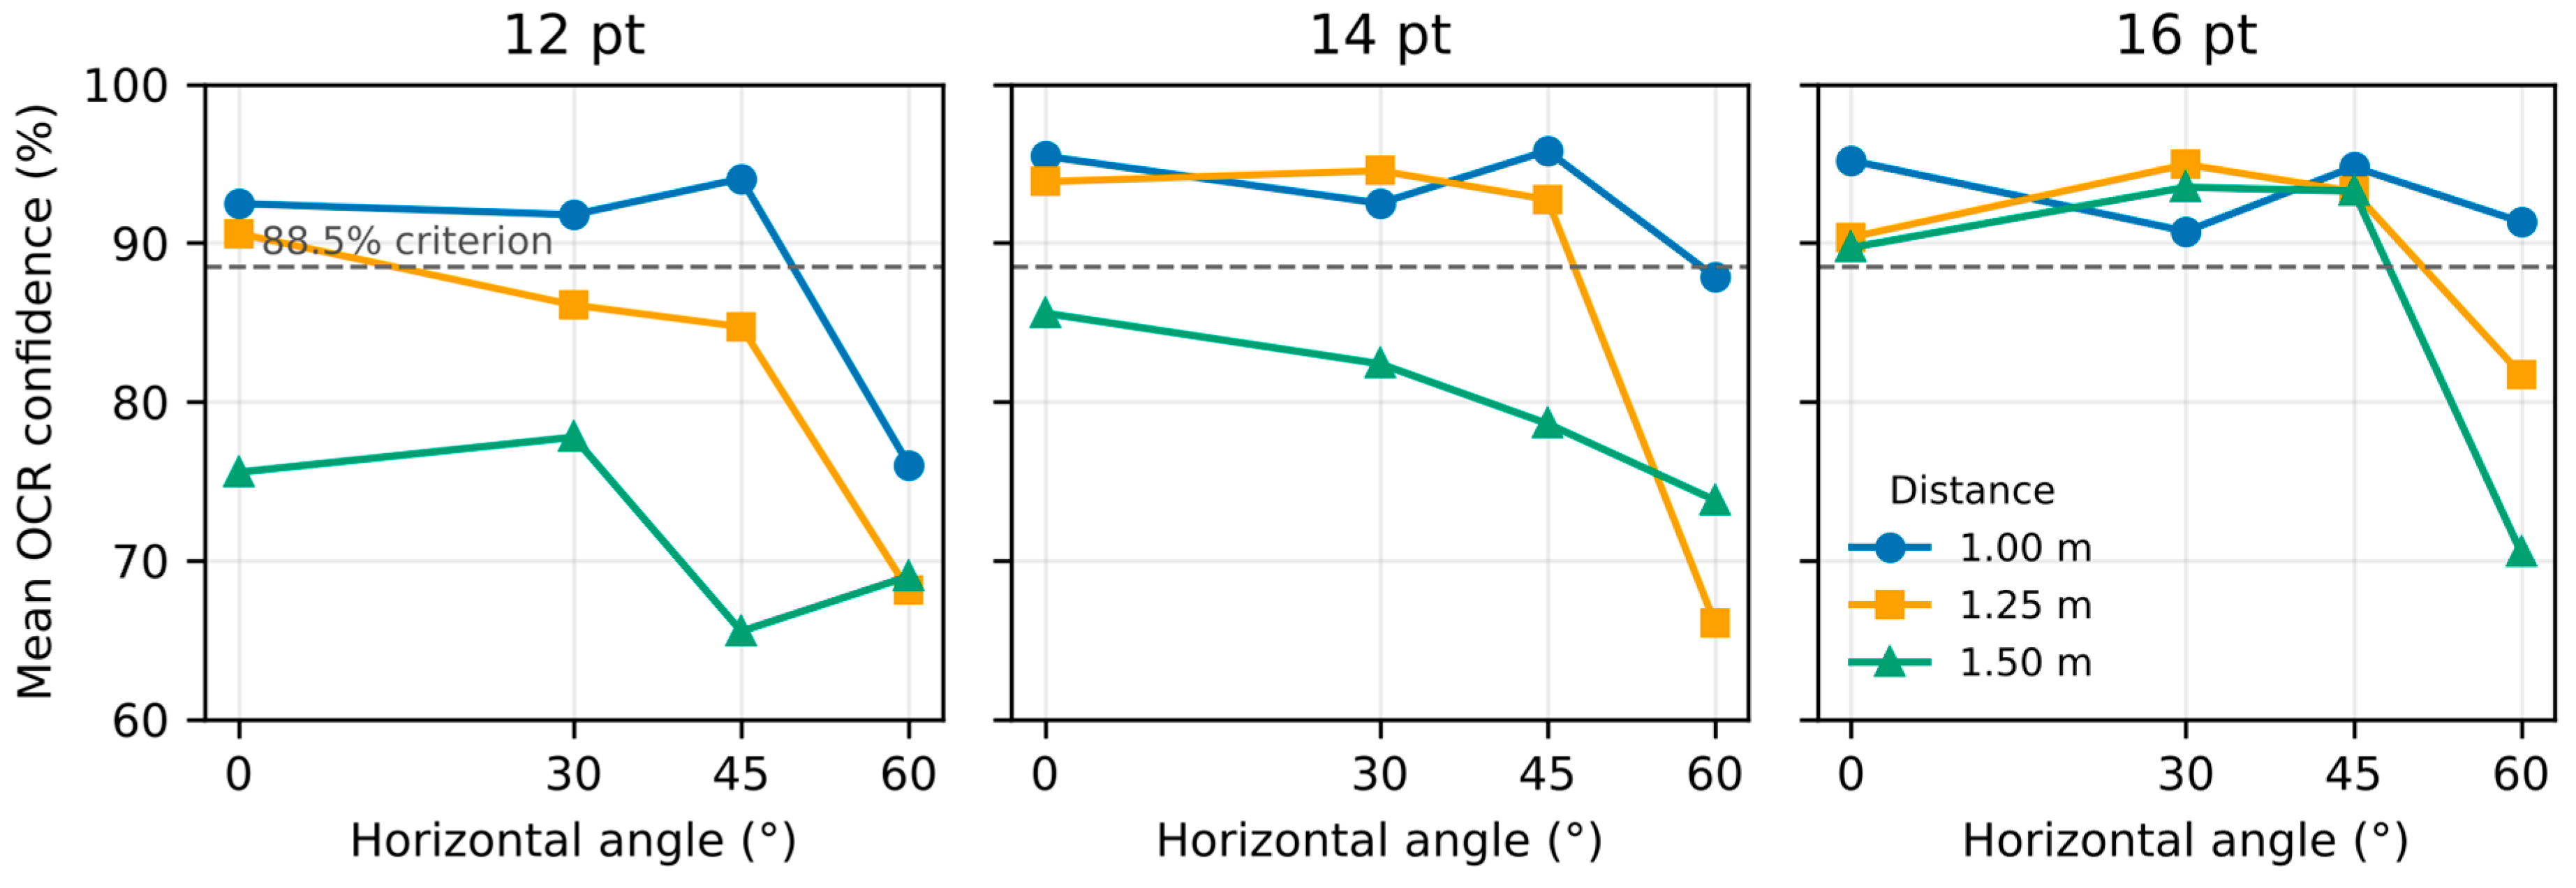
Table 1 summarizes the mean OCR confidence scores, averaged over three repeated captures, for all 36 test conditions. Confidence exceeds 65% across the entire tested range, and the majority of conditions exceed 85%. Mean confidence ranges from 65.54% at the least favorable condition (12 pt, 45°, 1.50 m) to 95.80% at the most favorable (14 pt, 45°, 1.00 m).
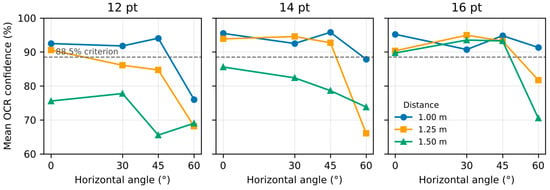
Two patterns qualify the marginal trends (Figure 4). First, the effect of angle depends on distance and font size: confidence is nearly unchanged from 0° to 45° at 1.00 m for every font size, and at every distance for 16 pt, but not at longer distances for smaller fonts (12 pt at 1.50 m: 65.54% at 45° against 75.56% at 0°), and 60° falls below 85% in all but two conditions. Second, distance is not monotone in three angle–font slices (14 pt at 30° and 60°, and 16 pt at 30°), where confidence at a longer distance exceeds that at the next shorter distance by more than the repeated-capture standard deviation of 1.87 points. These reversals point to uncontrolled condition-specific factors such as reflection, focus, or label placement.
Figure 4.
Mean OCR confidence against horizontal angle for each font size, with one line per imaging distance. Error bars show ±1 pooled repeated-capture standard deviation (1.87 points); the dashed line marks the 88.5% envelope criterion (Section 4.1).
3.2. Analysis of Variance
A general factorial regression was fitted to the 108 individual confidence scores, with horizontal angle, font size, and imaging distance as fixed factors and all two-way and three-way interaction terms included. Results are given in Table 2.
Table 2.
General factorial regression of OCR confidence on angle, font size, and distance.
All three main effects are significant (all p < 0.001), as are all two-way interactions and the three-way interaction. The model accounts for 97.5% of the variance in OCR confidence, with a pooled within-condition standard deviation of 1.87 percentage points against condition means spanning more than 30 points. Because this error term reflects repeated captures from one pose, these tests are anticonservative (Section 2.8).
Because the three-way interaction is significant, the main effects are interpreted in the context of the interaction rather than independently. Tukey pairwise comparisons at the 95% family-wise confidence level, computed against the model error term, are summarized in Table 3, together with the honestly significant difference (HSD) for each factor. Levels not sharing a letter differ significantly.
Table 3.
Tukey groupings and marginal means by factor level.
Under the repeated-capture error term, 0° and 30° are indistinguishable, and 60° is lowest. Because this term is anticonservative, the smaller differences in Table 3, such as that between 45° and 0°, are not presented as findings.
Table 4 gives the conservative analysis. All three main effects remain significant (angle F(3,12) = 12.83, p < 0.001; font size F(2,12) = 8.14, p = 0.006; distance F(2,12) = 14.13, p < 0.001), but none of the two-way interactions is (all p ≥ 0.43), and the Tukey HSD widens from 1.06–1.34 to 5.99–7.70 percentage points. Under this error term, 0°, 30°, and 45° do not differ from each other, and 60° is lower than all three; 16 pt differs from 12 pt, with 14 pt indistinguishable from both; and 1.50 m differs from 1.00 m and 1.25 m, which do not differ from each other.
Table 4.
Conservative analysis of the 36 condition means, with the three-way interaction as the error term (SS in squared percentage points).
Model diagnostics support the analysis. Levene’s test across the 36 conditions gives p = 0.936, supporting the equal-variance assumption. The Shapiro–Wilk test on residuals gives W = 0.974, p = 0.031, indicating a mild departure from normality; given the balanced design and the magnitude of the effects, this does not affect the conclusions. The largest standardized residual is 2.60, and no observations warrant exclusion.
3.3. Confidence and Effective Pixels per Character
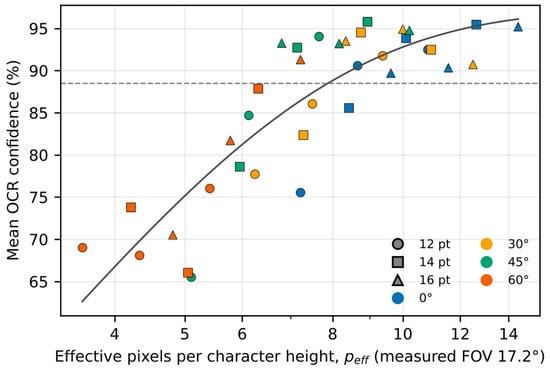
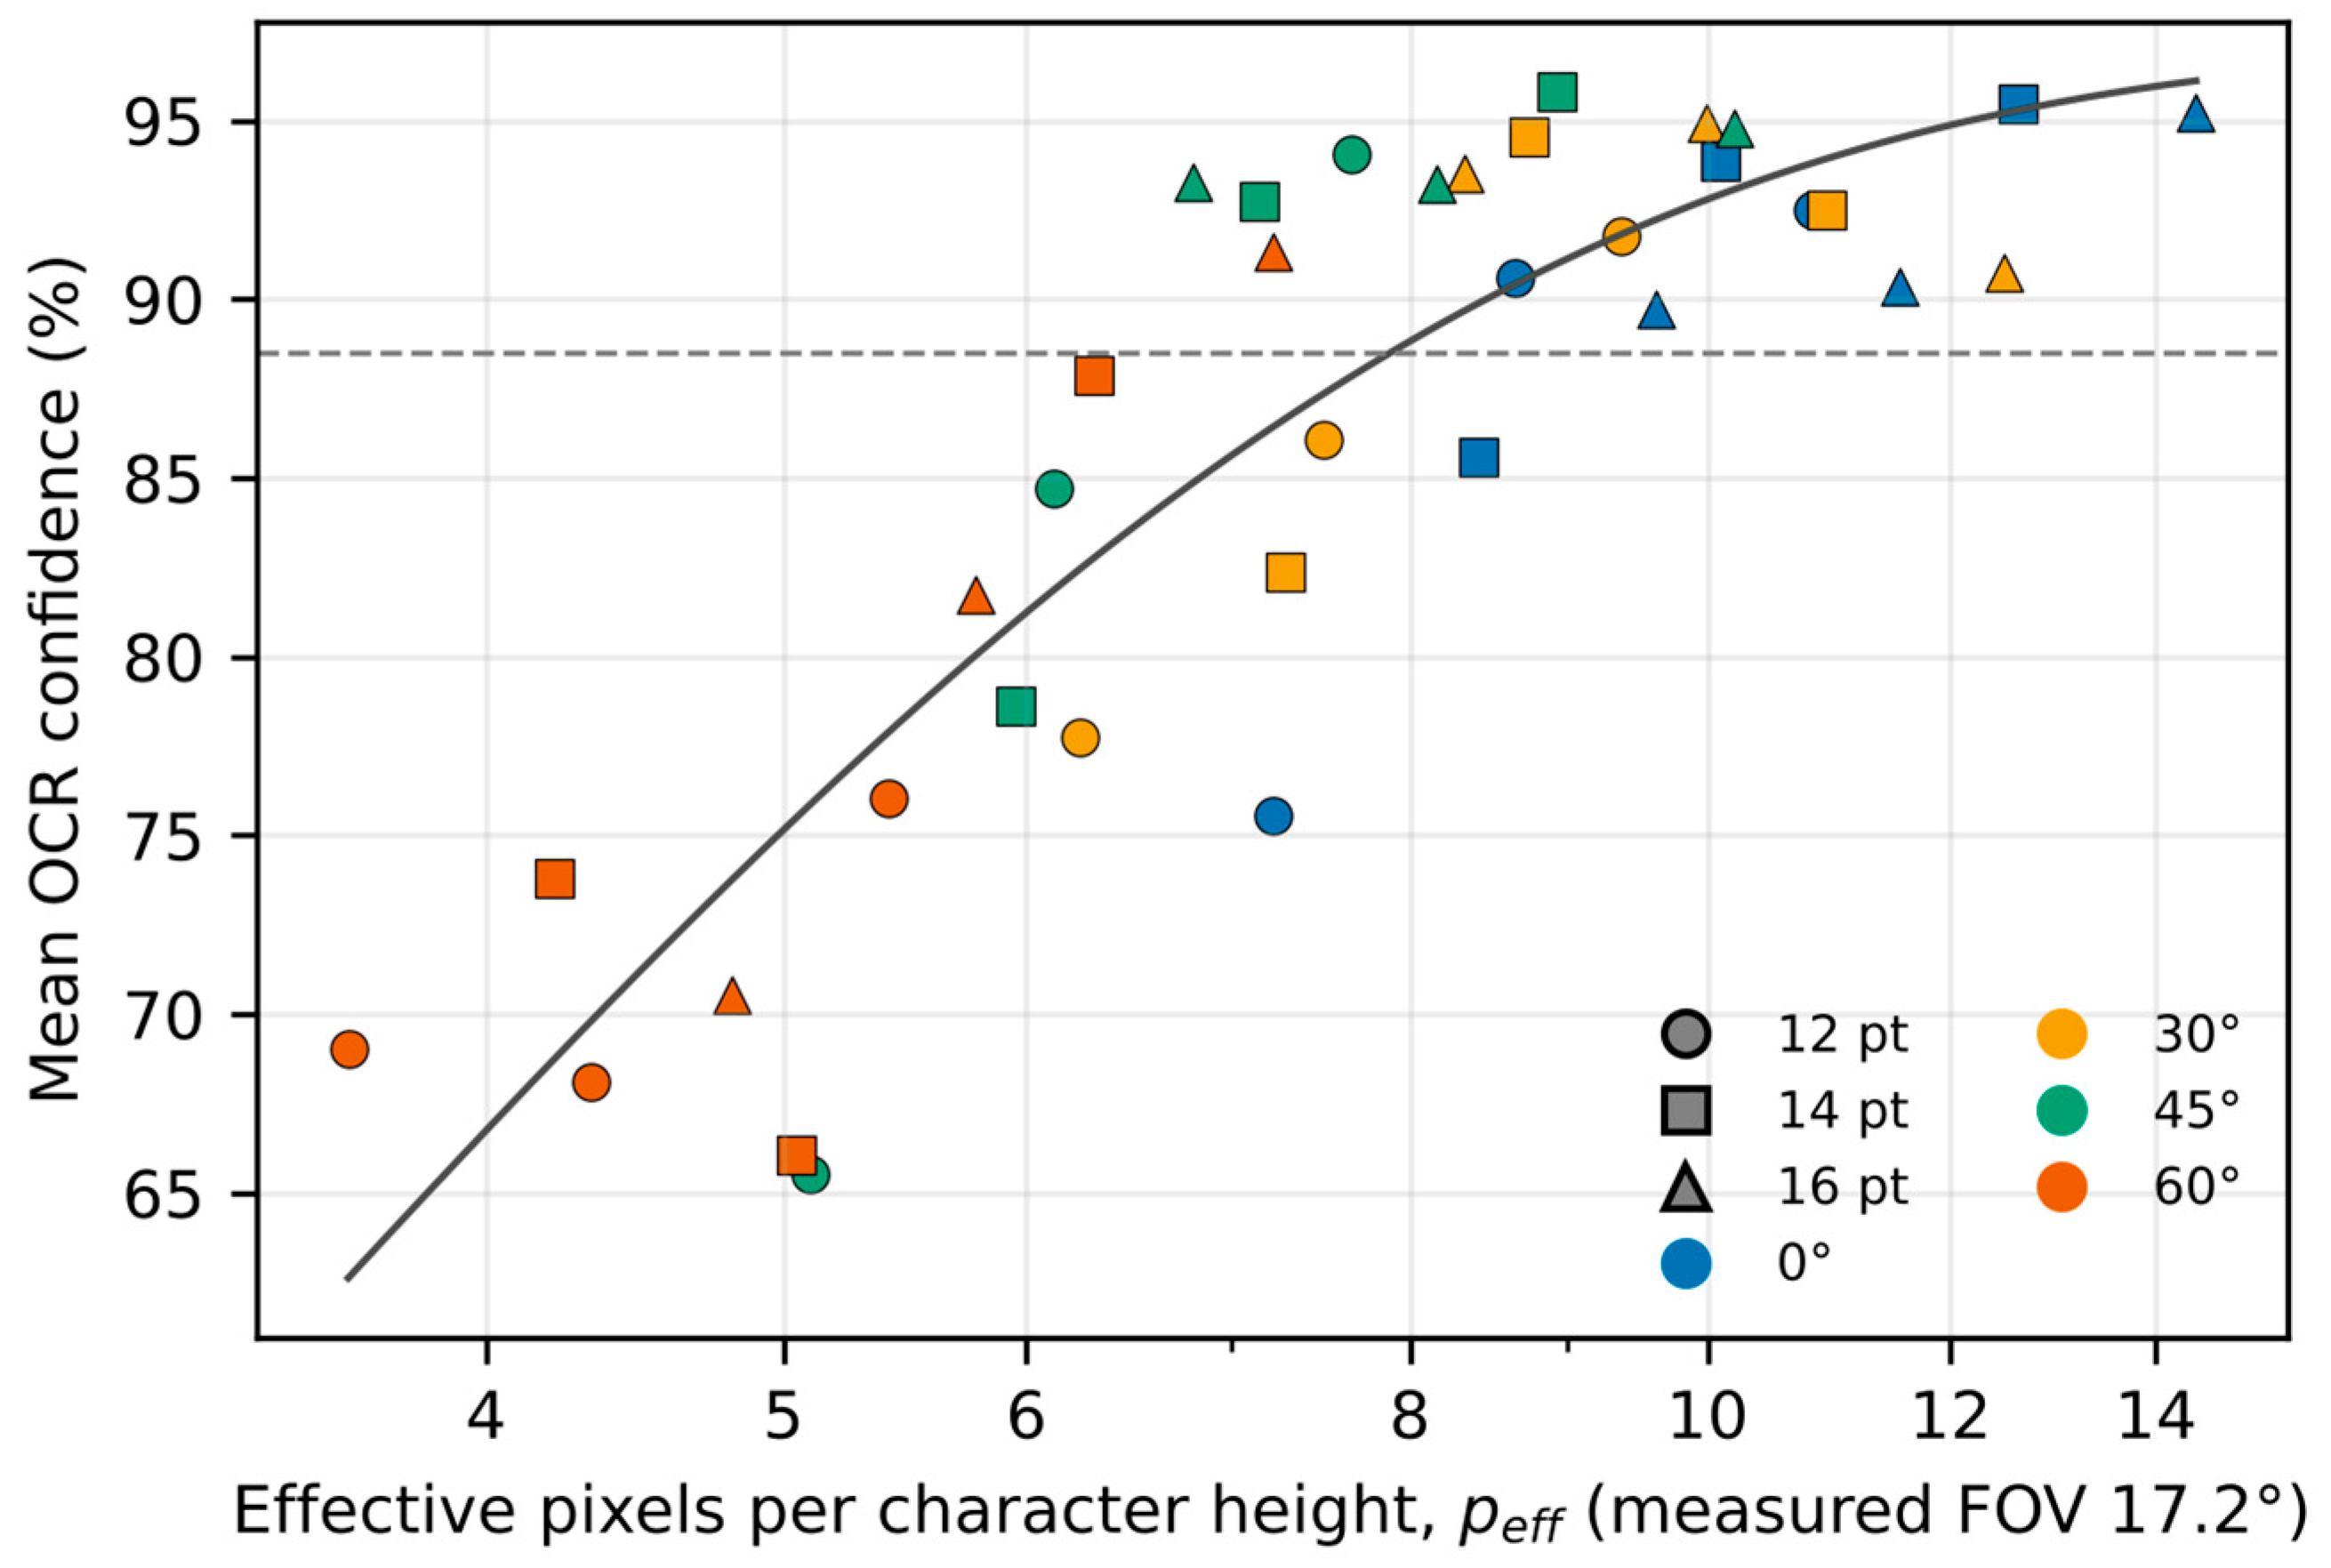
Figure 5 plots condition-mean confidence against peff. A saturating exponential, C = 97.1 − 111.0 exp(−peff/3.09), explains 75% of the variance among the 36 condition means. In a linear model with separate terms, the slopes on log digit height and log cos θ are 29.8 and 20.3 points (R2 = 0.72), so loss of resolution with distance and horizontal foreshortening both contribute substantially.
Figure 5.
Mean OCR confidence of the 36 conditions against effective pixels per character, peff = ph cos θ, with the fitted saturating exponential (R2 = 0.75).
3.4. Database Validation Results
The full pipeline was tested against both database configurations. In the complete-database test, all captured label images were successfully matched against their correct records, and the intentionally mislabeled box was correctly identified as a mismatch: the system returned a 404 response with a mismatch warning for that label while returning valid records for all others. In the targeted eight-entry test, the system correctly verified all eight present labels and reported no false positives or false negatives. These tests contained a single mismatch and cannot establish reliability. In the validation session, the 84 reads of labels present in the WMS were accepted 70 times and rejected 14 times, all rejections caused by misreads, and all 36 reads of labels absent from the WMS were correctly rejected. None of the 23 misreads produced another valid serial number, so no false accept occurred (0 of 36 absent-label reads; exact 95% upper confidence bound 9.7%), and no false reject occurred inside the operating envelope (Section 4.1). Screening the WMS table showed that 25 of its 26 serial numbers have a valid neighbor one character away, and four pairs differ by one commonly confused digit (1/7, 3/8, 5/6).
3.5. Identifier Accuracy and Open-Source Baseline
Overall, 80.8% of the 120 serial numbers were read exactly, with a character error rate of 1.9% (Table 5). Reading was error-free at 1.00–1.25 m for 14 pt and at 1.00–1.50 m for 16 pt, but only 44% were correct for 14 pt at 1.50 m, a condition with 85.4% mean confidence. Every condition with mean confidence of 91.4% or more was read without error, and misreads occurred in every condition at 85.4% or less, so average confidence alone can hide identifier failures. Error-free reads occurred at predicted digit heights down to 9.6 pixels, and failures at 8.4 pixels. As an on-premise baseline, Tesseract 5.0 read 37.5% of the same serial numbers correctly, against 80.8% for Cloud Vision.
Table 5.
Serial-number recognition in the 0° validation session (Ava camera, three captures per condition).
4. Discussion
4.1. Interpretation of OCR Performance Trends
The experimental results show that OCR confidence varies with imaging geometry in the directions expected from the pixels-per-character relationship. With the nominal 40° field of view and conventional thresholds of 12–30 pixels, Equation (1) cannot explain the observed reads; with the measured 17.2° field of view and a threshold of about 9 pixels, it gives 1.2, 1.4, and 1.6 m for 12, 14, and 16 pt, consistent with the limits observed at 0° (Section 3.5). Adding horizontal foreshortening as a cos θ term explains 75% of the variance among condition means (Section 3.3).
Figure 4 and Table 6 show how font size modifies the other two factors: larger fonts buffer recognition mainly against distance, and only weakly and not monotonically against angle. Table 6 summarizes this across the twelve angle–distance combinations tested at each font size.
Table 6.
Robustness by font size across the twelve angle–distance combinations.
At 12 pt, confidence falls 16.6 percentage points across the distance range and only four of twelve combinations reach 90%. At 16 pt, the distance penalty narrows to 6.3 points and nine of twelve combinations reach 90%, including 45° at 1.50 m—the geometry at which 12 pt produces the worst result in the entire experiment. Larger characters raise the pixels-per-character margin, so a given loss of resolution to distance or foreshortening consumes a smaller share of that margin. The spread across angle, by contrast, is 15.2, 15.7, and 12.6 points at 12, 14, and 16 pt, so the buffering against angle is weak and non-monotone.
The angular result is operationally important but conditional. Confidence is nearly unchanged from 0° to 45° at 1.00 m for every font size, and at every distance for 16 pt, but not at longer distances for smaller fonts. At 60°, confidence falls below 85% in all but two conditions, so viewing angles near 60° should be avoided. Camera placement need not prioritize perpendicularity when the pixel margin is large, but oblique views should be avoided when small labels are read near the maximum distance.
The reliability criterion is calibrated against read accuracy. In the validation session, every condition with mean confidence of 91.4% or more was read without error, while conditions at 85.4% or less contained misreads. We use 88.5%, close to the midpoint of these two values, as the criterion; the envelope is identical for any threshold between 87.9% and 89.7%. Table 7 gives the resulting envelope: 16 pt up to 1.50 m and 14 pt up to 1.25 m at angles up to 45°; 12 pt up to 1.25 m at 0° and 1.00 m at 30–45°; and 60° only for 16 pt at 1.00 m. No condition within the envelope falls below 89.7% mean confidence. Because the calibration uses 0° images from one session, applying it at oblique angles is an assumption.
Table 7.
Operating envelope: maximum distance at which mean confidence meets the 88.5% criterion, by font size and horizontal angle.
4.2. Importance of Database Validation Beyond OCR Confidence
The intentionally mislabeled box in the complete-database test returned a high-confidence OCR read of a valid but incorrect identifier. Confidence measures how clearly text was recognized, not whether the label belongs where it was found, so database lookup supplies a semantic check that no visual metric can replicate. Recognition confidence and inventory correctness are complementary layers rather than interchangeable ones. The validation session also shows the opposite risk. None of its 23 misreads produced another valid serial number, but 25 of the 26 serial numbers in the WMS table have a valid neighbor one character away, and four pairs differ by one commonly confused digit (1/7, 3/8, 5/6), so a single misread could be accepted as a different valid label. A check character in the identifier format, or cross-checking a second label field such as the part number, would close this gap.
4.3. Practical Implications
Reliable OCR-based label verification can be achieved without extreme camera precision or costly high-magnification optics, provided the minimum readability constraints are satisfied. The tolerance to viewing angles up to 45°, where the pixel margin is sufficient, is particularly valuable, since it accommodates the misalignments common in real warehouse environments. The modular stateless design of the Flask microservice is intended to allow integration with fixed-mount cameras, autonomous mobile robots, or forklift-mounted systems without server modification, although such integrations were not tested here. The Excel-based inventory database, while a simplified representation, demonstrated sufficient fidelity for experimental validation; production deployment would replace it with a live enterprise resource planning (ERP) or WMS database accessed through an application programming interface (API) or Open Database Connectivity (ODBC) connection. No claim of industrial readiness is made; the untested conditions are listed in Section 4.4.
4.4. Limitations
Several limitations should inform future work. The inventory database is a flat Excel file rather than a production-grade relational system, and the system was not evaluated for latency, concurrent requests, moving pallets, integration with a live WMS, network or cloud outages, or API version changes; cloud round-trip latency was not logged in the original experiments and cannot be recovered from the saved data. Experiments focused on a limited set of JTEKT label formats with English alphanumeric text; other character sets or label designs may require different extraction patterns or OCR configurations. Only single-camera, static-capture scenarios were evaluated; pallets with labels on multiple faces or partially occluded by shrink wrap were not included.
The error term of the 108-capture analysis rests on three repeated captures per condition taken from a single robot pose with one printed label per font size, so it measures capture repeatability rather than full experimental error, and font size is confounded with label. The conservative analysis of condition means (Table 4) addresses this only in part, and a random-effects model for pose and label cannot be estimated from these data. A new experiment with repositioned replicates was not possible within this study. Confirming the envelope boundaries requires a follow-up design in which the robot is repositioned between captures and several printed labels are used for each font size, so that pose and label can be treated as random effects. The non-monotone distance results in three angle–font slices also suggest uncontrolled factors such as reflection, focus, or label placement.
The validation session was recorded at 0° only, so identifier-level accuracy at oblique angles was not measured, and applying the 88.5% criterion there is an assumption. Its 23 misreads are too few to bound the rate at which a misread produces another valid serial number. The label font family was not recorded, so the field-of-view estimate assumes a digit height of 0.716 of the em height. In addition, no barcode comparison was performed: the throughput advantage of multi-label capture over sequential barcode scanning motivates the work but was not measured.
Finally, as noted in Section 2.5, the validation layer confirms only that a recognized identifier exists in the database, and OCR cannot authenticate label origin. Production deployments would need to address both through order-level database constraints and secure label encoding such as cryptographic barcodes or RFID.
5. Conclusions
This paper presented a physically deployed framework for OCR-based pallet label verification integrated with inventory database validation, evaluated through a controlled full-factorial experiment. Using an Ava Telepresence Robot as the imaging platform and the Google Cloud Vision API as the recognition engine, 108 images were captured across three font sizes, three imaging distances, and four horizontal angles at the Georgia Southern University ROWS Lab.
General factorial regression on the 108 captures found all factors and interactions significant (p < 0.001), but its error term reflects repeated captures from one pose; in a conservative analysis of condition means, all three main effects remained significant (p ≤ 0.006) and no two-way interaction was. Larger fonts mainly reduced the distance penalty: at 16 pt, nine of twelve angle–distance combinations exceeded 90% mean confidence, against four of twelve at 12 pt. The effect of horizontal angle was conditional: negligible up to 45° at 1.00 m and, for 16 pt, at every distance, but present at longer distances for smaller fonts, and 60° fell below 85% in all but two conditions. With a field of view measured from the images, the pixels-per-character relationship with a cos θ term explained 75% of the variance among condition means.
In a validation session of 120 serial-number reads, Cloud Vision read 80.8% of serial numbers exactly (CER 1.9%), against 37.5% for Tesseract, and reads were error-free at mean confidence of 91.4% or more. A criterion of 88.5% calibrated on these reads yields the operating envelope of Table 7: 16 pt labels up to 1.50 m and 14 pt labels up to 1.25 m at viewing angles up to 45°, with 60° admissible only for 16 pt labels at 1.00 m. Database validation produced no false accepts, and all false rejects arose from misreads outside the envelope; because most serial numbers have a one-character neighbor, a check character is recommended. These results describe a laboratory prototype with an evaluated operating envelope, not an industrially ready system: confirming the envelope requires repositioned replicates, and deployment requires integration with a live WMS and evaluation under motion and concurrent load.
Future Work
The present study evaluated OCR performance exclusively in static scenarios, where both the Ava Telepresence Robot and the labeled boxes remained stationary during image capture. A natural and critical extension is to dynamic setups that reflect real warehouse workflows, where boxes move continuously on conveyor belts during loading, or as pallets are transported by forklifts and autonomous mobile robots. Future work will investigate OCR performance under relative motion between the camera and the label, either by moving the imaging platform past a static pallet or by transporting labeled boxes past a fixed overhead camera. Key variables of interest include relative velocity, imaging frame rate, and the resulting motion blur characteristics at different label sizes and distances.
Specifically, future experiments will determine minimum font size and maximum relative velocity thresholds at which reliable recognition can be sustained, and how these interact with the static-scenario parameters characterized here. Integration with conveyor-speed feedback and adaptive frame-rate triggering will also be explored as mechanisms for maintaining recognition accuracy in high-throughput inline inspection, such as label verification as boxes are loaded onto trucks or sortation systems.
Three further extensions are planned. First, the simulated WMS will be replaced with a live WMS or ERP integration through an API or ODBC connection, and validation will be extended from identifier presence to order-level assignment—confirming not only that a label is known but that it belongs to the correct shipment and destination. Second, the throughput advantage of multi-label frame capture over sequential barcode scanning, which motivated this work but was not measured, will be quantified. Third, the factorial experiment will be repeated with repositioned replicates and several label copies, and accuracy at oblique angles, together with latency and throughput under concurrent multi-reader load, will be measured.
Supplementary Materials
The following supporting information can be downloaded at: https://www.mdpi.com/article/10.3390/logistics10110263/s1, Table S1 (Per-image serial-number recognition in the 0° validation session).
Author Contributions
Conceptualization, K.K. and R.G.; methodology, K.K. and M.I.M.; validation, V.P. and A.R.; investigation, M.I.M., V.P. and A.R.; writing—original draft preparation, M.I.M., V.P. and A.R.; writing—review and editing, K.K. and R.G.; supervision, K.K.; project administration, K.K. and R.G.; funding acquisition, K.K. and R.G. All authors have read and agreed to the published version of the manuscript.
Funding
This research was funded by Crider Food Inc. and Georgia Southern Foundation (Grant # 39G6445).
Institutional Review Board Statement
Not applicable.
Informed Consent Statement
Not applicable.
Data Availability Statement
The data presented in this study are available on request from the corresponding author. (the 108 factorial images and per-image confidence scores) are available on request from the corresponding author. The per-image results of the validation session are provided in Supplementary Table S1. The 108 factorial images and per-image confidence scores are available from the corresponding author on request.
Acknowledgments
The authors would like to acknowledge the Advanced Processing Research Network (APRN) and Remotely Operated Warehouse Services (ROWS) of Georgia Southern University for providing the experimental environment, resources, and support required to carry out this research. The authors also gratefully acknowledge JTEKT North America, Inc. for providing the physical warehouse labels used in this study and for supporting access to authentic industrial label samples from their production environment. Special appreciation is extended to Ava Robotics team for their technical support, guidance on camera integration, and valuable insights during setup of the robotic imaging platform.
Conflicts of Interest
The authors declare no conflicts of interest.
References
- DeHoratius, N.; Raman, A. Inventory record inaccuracy: An empirical analysis. Manag. Sci. 2008, 54, 627–641. [Google Scholar] [CrossRef] [Scilit]
- Sarac, A.; Absi, N.; Dauzère-Pérès, S. A literature review on the impact of RFID technologies on supply chain management. Int. J. Prod. Econ. 2010, 128, 77–95. [Google Scholar] [CrossRef] [Scilit]
- Feng, J.; Ballem, N.; Beheshti, M.; Hamilton-Fletcher, G.; Hudson, T.; Porfiri, M.; Seiple, W.H.; Rizzo, J.-R. Evaluating OCR performance for assistive technology: Effects of walking speed, camera placement, and camera type. arXiv 2026, arXiv:2602.02223. [Google Scholar]
- Hegghammer, T. OCR with Tesseract, Amazon Textract, and Google Document AI: A benchmarking experiment. J. Comput. Soc. Sci. 2022, 5, 861–882. [Google Scholar] [CrossRef] [Scilit]
- Long, S.; He, X.; Yao, C. Scene text detection and recognition: The deep learning era. Int. J. Comput. Vis. 2021, 129, 161–184. [Google Scholar] [CrossRef] [Scilit]
- Baek, J.; Kim, G.; Lee, J.; Park, S.; Han, D.; Yun, S.; Oh, S.J.; Lee, H. What is wrong with scene text recognition model comparisons? Dataset and model analysis. In Proceedings of the IEEE/CVF International Conference on Computer Vision (ICCV), Seoul, Republic of Korea, 27 October–2 November 2019; IEEE: Piscataway, NJ, USA, 2019; pp. 4715–4723. [Google Scholar] [CrossRef] [Scilit]
- Shi, B.; Yang, M.; Wang, X.; Lyu, P.; Yao, C.; Bai, X. ASTER: An attentional scene text recognizer with flexible rectification. IEEE Trans. Pattern Anal. Mach. Intell. 2019, 41, 2035–2048. [Google Scholar] [CrossRef] [Scilit] [PubMed]
- Smith, R. An overview of the Tesseract OCR engine. In Proceedings of the 9th International Conference on Document Analysis and Recognition (ICDAR), Curitiba, Brazil, 23–26 September 2007; IEEE: Piscataway, NJ, USA, 2007; Volume 2, pp. 629–633. [Google Scholar] [CrossRef] [Scilit]
- Du, Y.; Li, C.; Guo, R.; Yin, X.; Liu, W.; Zhou, J.; Bai, Y.; Yu, Z.; Yang, Y.; Dang, Q.; et al. PP-OCR: A practical ultra lightweight OCR system. arXiv 2020, arXiv:2009.09941. [Google Scholar]
- Monteiro, G.; Camelo, L.; Aquino, G.; Fernandes, R.D.A.; Gomes, R.; Printes, A.; Torné, I.; Silva, H.; Oliveira, J.; Figueiredo, C. A comprehensive framework for industrial sticker information recognition using advanced OCR and object detection techniques. Appl. Sci. 2023, 13, 7320. [Google Scholar] [CrossRef] [Scilit]
- Kalinov, I.; Petrovsky, A.; Ilin, V.; Pristanskiy, E.; Kurenkov, M.; Ramzhaev, V.; Idrisov, I.; Tsetserukou, D. WareVision: CNN barcode detection-based UAV trajectory optimization for autonomous warehouse stocktaking. IEEE Robot. Autom. Lett. 2020, 5, 6647–6653. [Google Scholar] [CrossRef] [Scilit]
- Naumann, A.; Hertlein, F.; Dörr, L.; Thoma, S.; Furmans, K. Literature review: Computer vision applications in transportation logistics and warehousing. arXiv 2023, arXiv:2304.06009. [Google Scholar]
- Ava Robotics. Ava Telepresence Robot. Available online: https://www.avarobotics.com (accessed on 19 October 2026).
- Pallets. Flask Web Framework. Available online: https://flask.palletsprojects.com (accessed on 19 October 2026).
- Google. Cloud Vision API. Available online: https://cloud.google.com/vision (accessed on 19 October 2026).
- Montgomery, D.C. Design and Analysis of Experiments, 9th ed.; Wiley: Hoboken, NJ, USA, 2017. [Google Scholar]

Disclaimer/Publisher’s Note: The statements, opinions and data contained in all publications are solely those of the individual author(s) and contributor(s) and not of MDPI and/or the editor(s). MDPI and/or the editor(s) disclaim responsibility for any injury to people or property resulting from any ideas, methods, instructions or products referred to in the content. |
© 2026 by the authors. Licensee MDPI, Basel, Switzerland. This article is an open access article distributed under the terms and conditions of the Creative Commons Attribution (CC BY) license.