Correction: Endrizzi et al. Relationships between Intensity and Liking for Chemosensory Stimuli in Food Models: A Large-Scale Consumer Segmentation. Foods 2022, 11, 5

 , ,
, ,  ,
,  , , , , ,
  ,
,  , , , ,
  and
and 
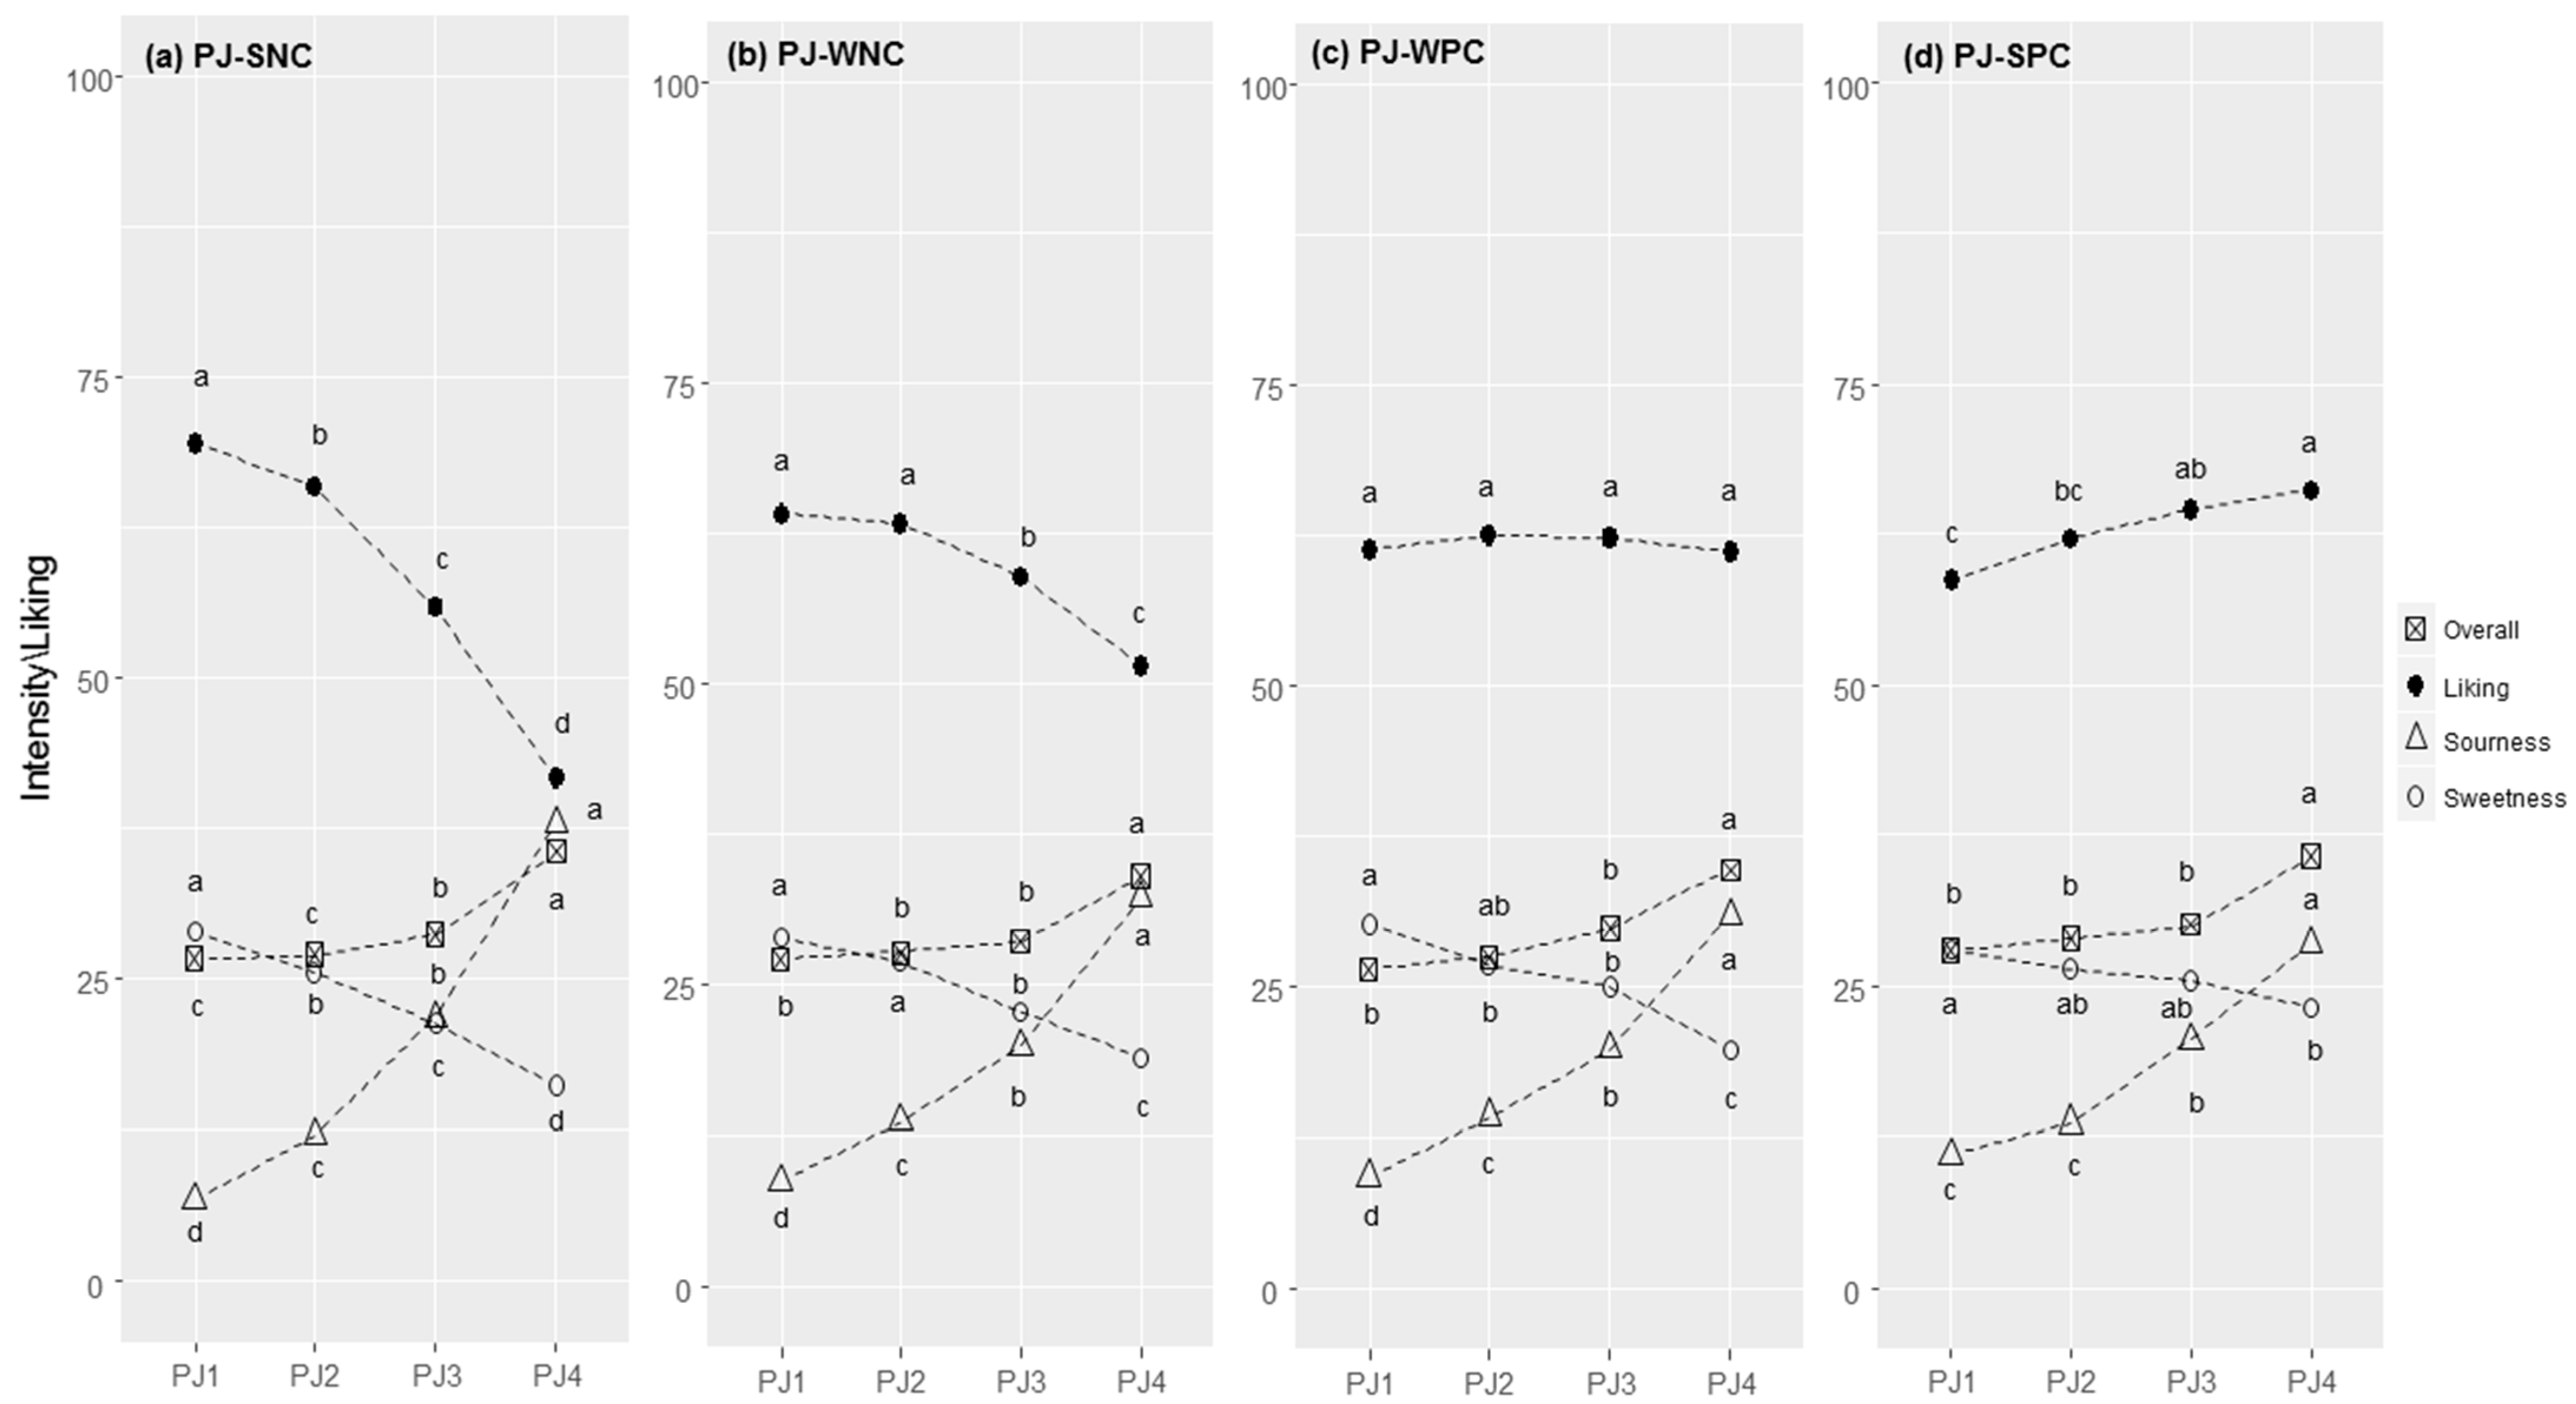
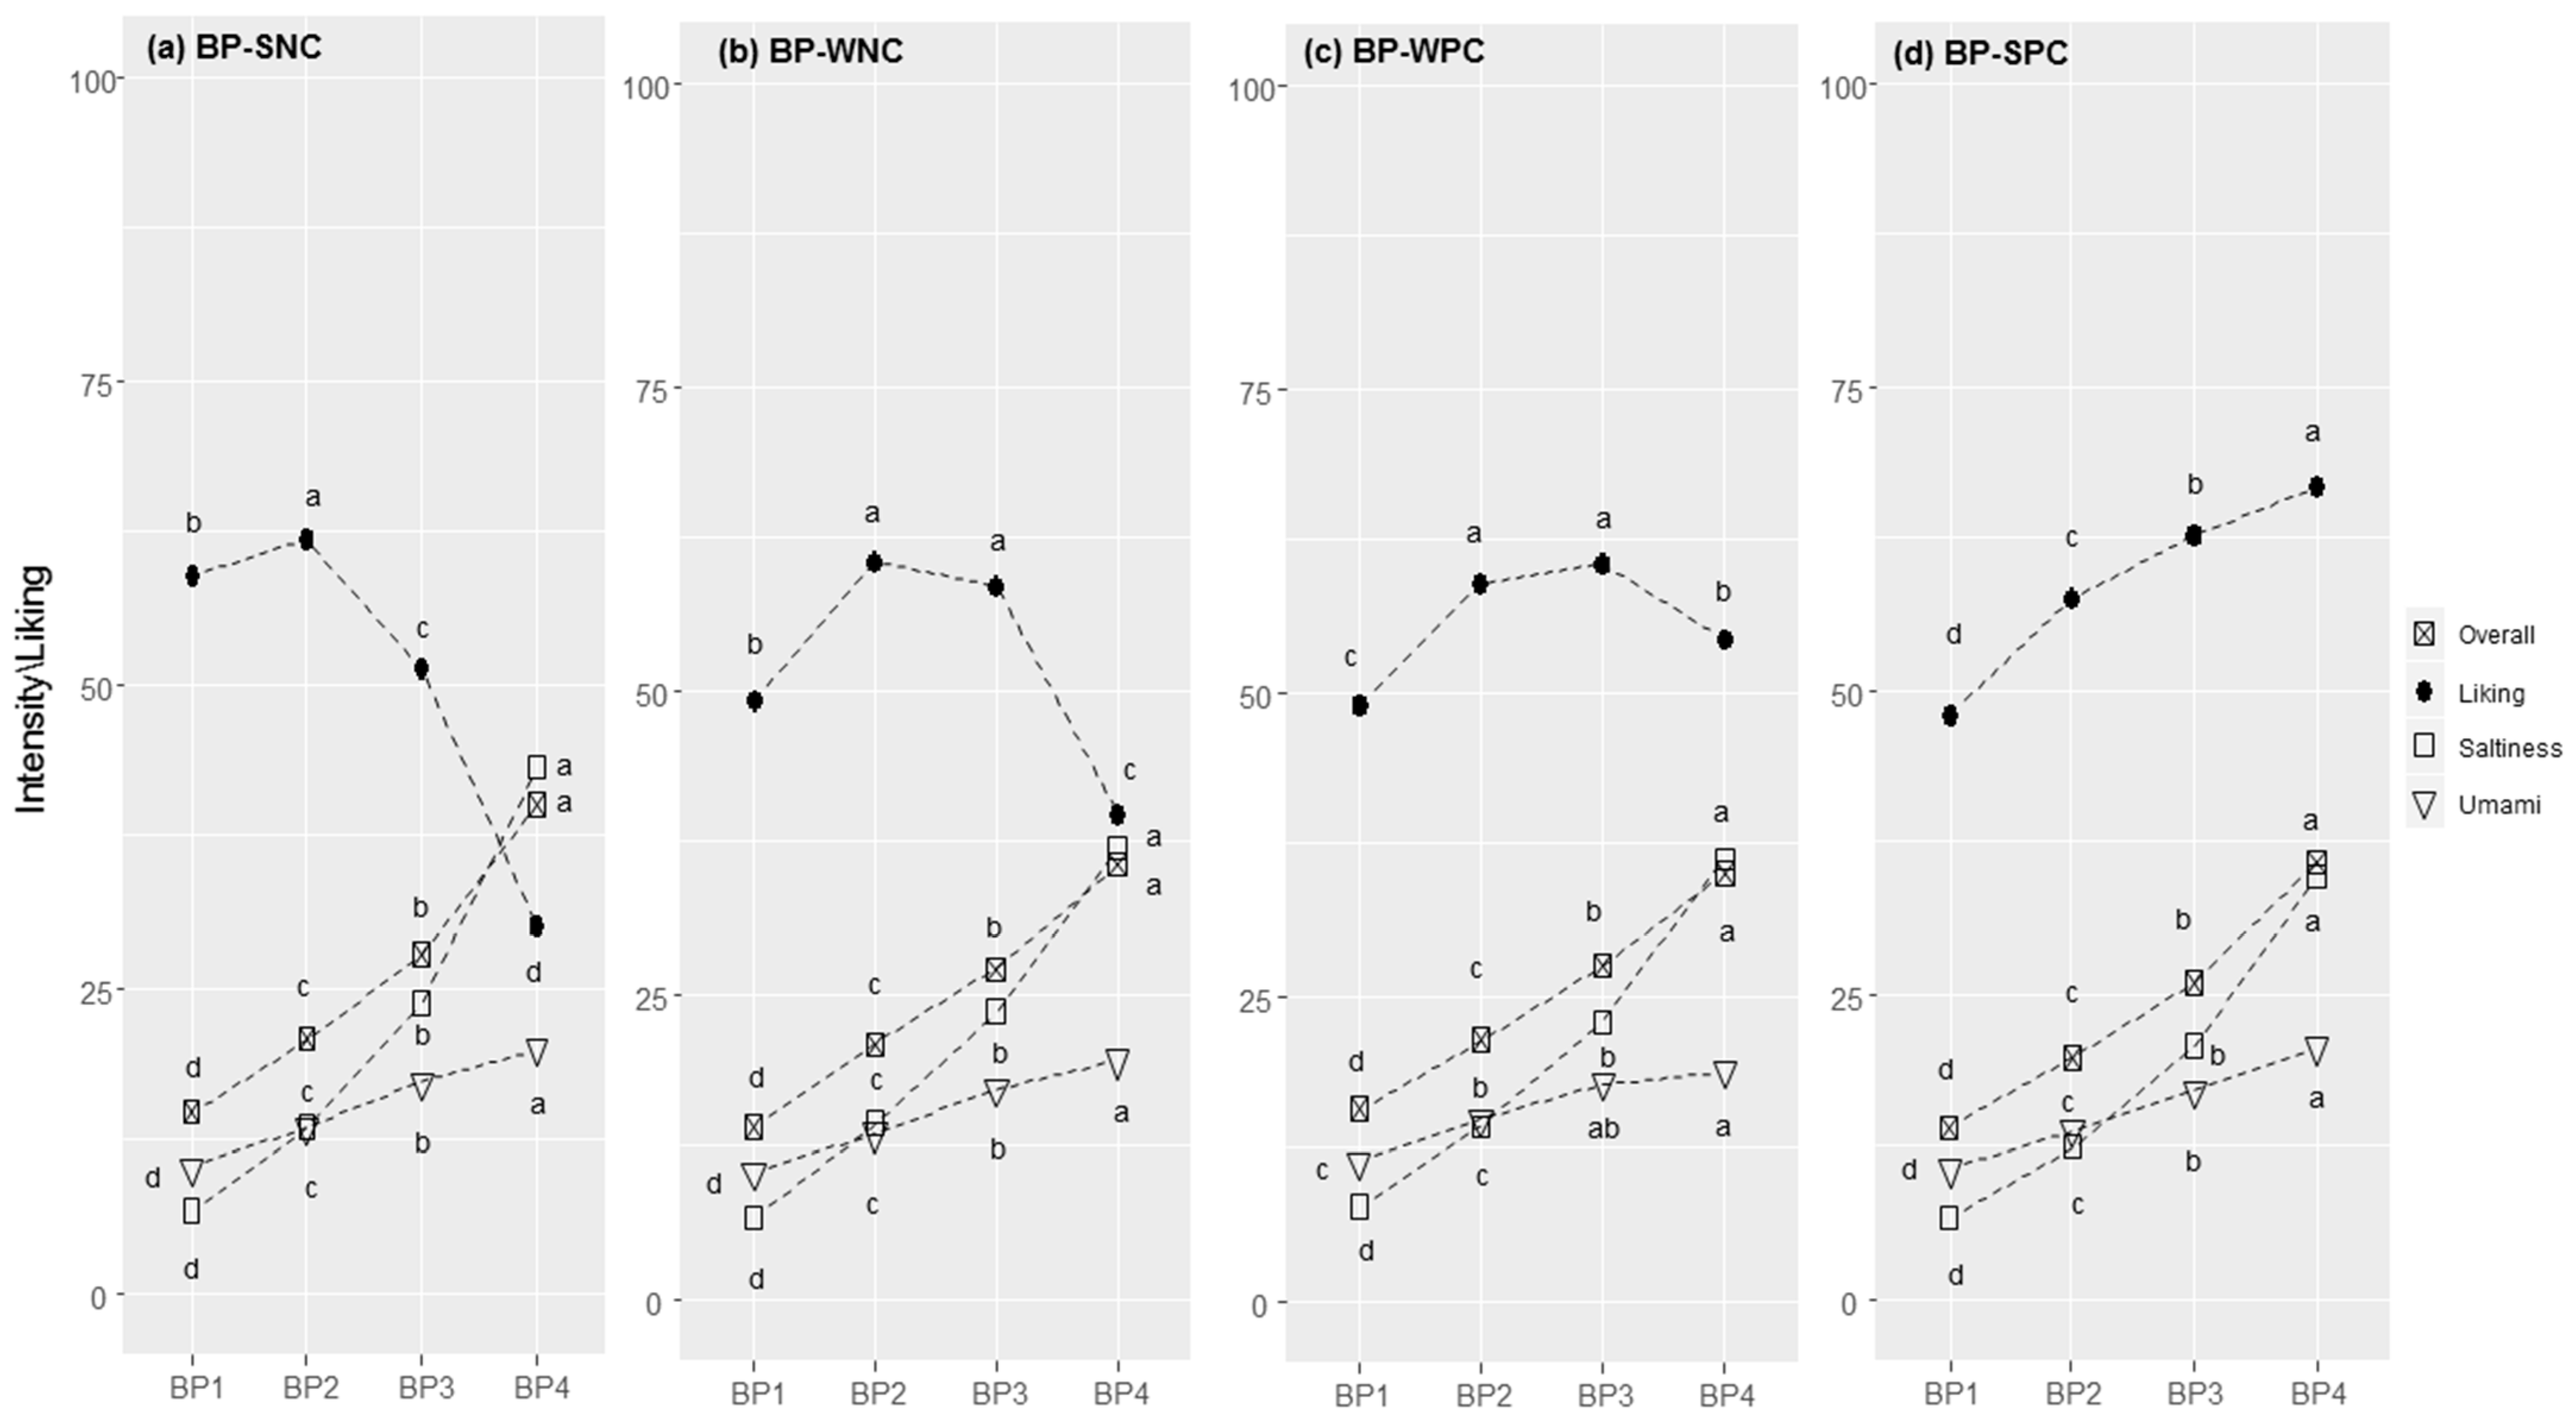
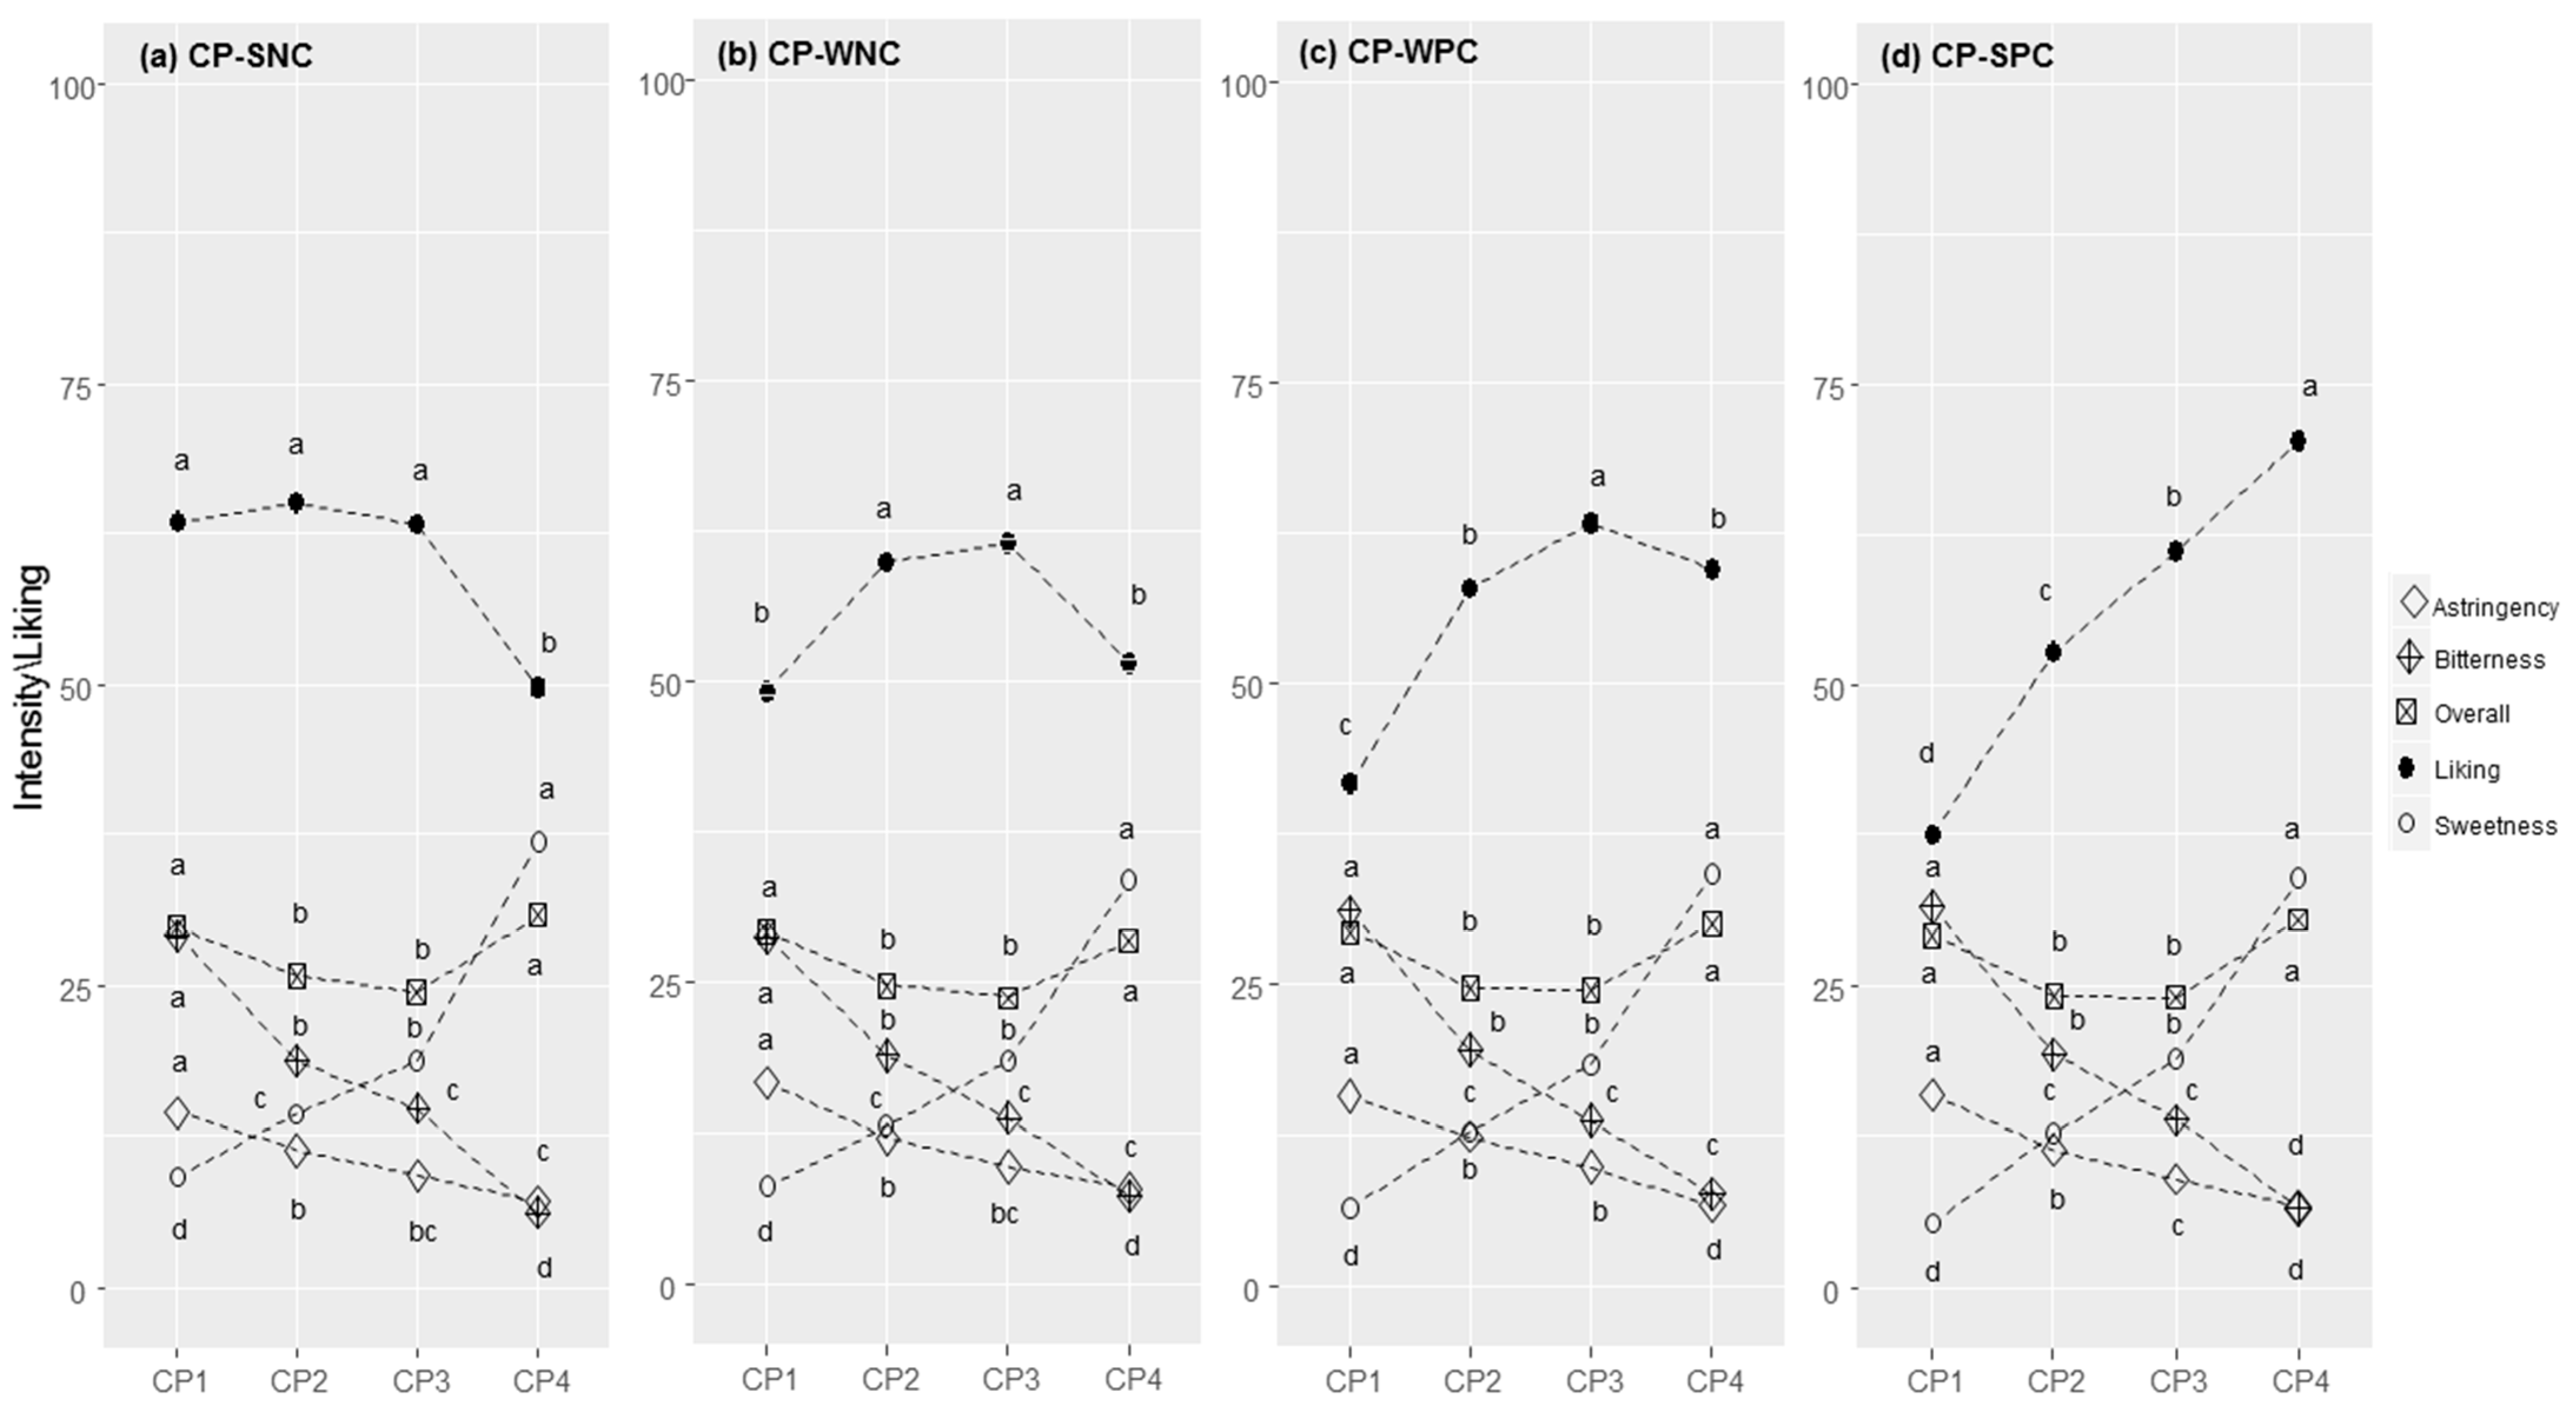
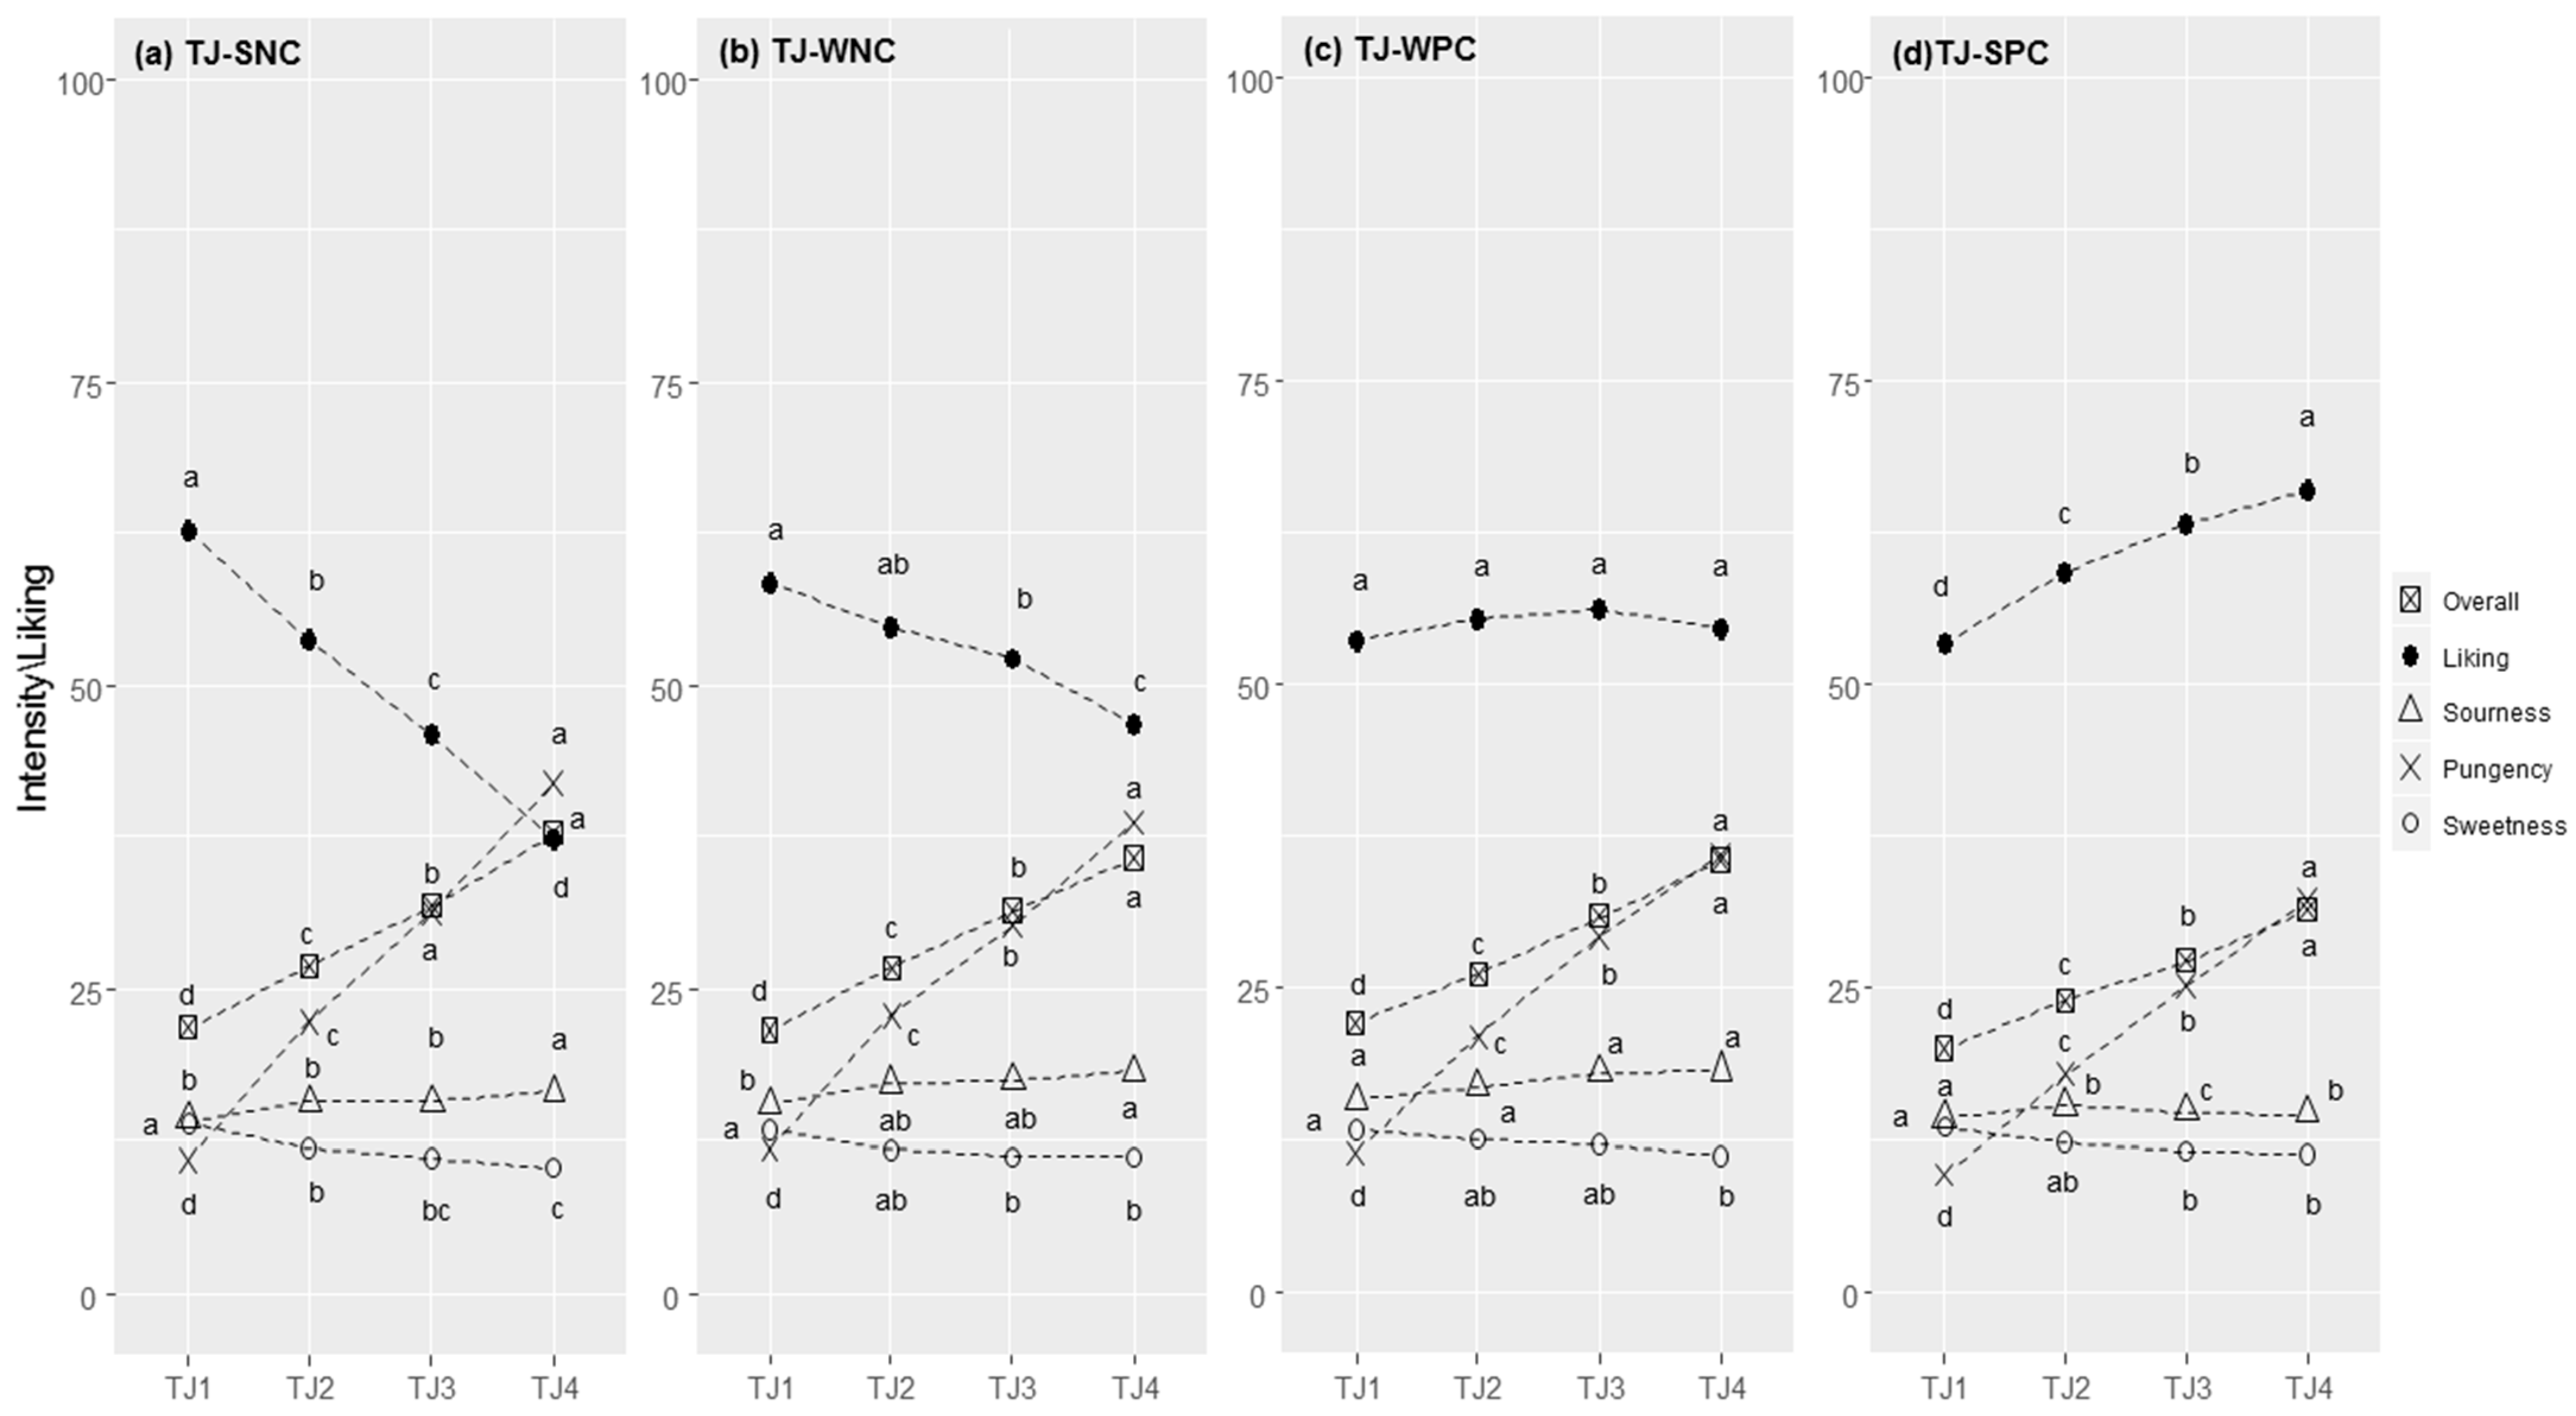
Error in Figures
Reference
- Endrizzi, I.; Cliceri, D.; Menghi, L.; Aprea, E.; Charles, M.; Monteleone, E.; Dinnella, C.; Spinelli, S.; Pagliarini, E.; Laureati, M.; et al. Relationships between Intensity and Liking for Chemosensory Stimuli in Food Models: A Large-Scale Consumer Segmentation. Foods 2022, 11, 5. [Google Scholar] [CrossRef] [PubMed]
Publisher’s Note: MDPI stays neutral with regard to jurisdictional claims in published maps and institutional affiliations. |
© 2022 by the authors. Licensee MDPI, Basel, Switzerland. This article is an open access article distributed under the terms and conditions of the Creative Commons Attribution (CC BY) license (https://creativecommons.org/licenses/by/4.0/).
Share and Cite
Endrizzi, I.; Cliceri, D.; Menghi, L.; Aprea, E.; Charles, M.; Monteleone, E.; Dinnella, C.; Spinelli, S.; Pagliarini, E.; Laureati, M.; et al. Correction: Endrizzi et al. Relationships between Intensity and Liking for Chemosensory Stimuli in Food Models: A Large-Scale Consumer Segmentation. Foods 2022, 11, 5. Foods 2022, 11, 2174. https://doi.org/10.3390/foods11152174
Endrizzi I, Cliceri D, Menghi L, Aprea E, Charles M, Monteleone E, Dinnella C, Spinelli S, Pagliarini E, Laureati M, et al. Correction: Endrizzi et al. Relationships between Intensity and Liking for Chemosensory Stimuli in Food Models: A Large-Scale Consumer Segmentation. Foods 2022, 11, 5. Foods. 2022; 11(15):2174. https://doi.org/10.3390/foods11152174
Chicago/Turabian StyleEndrizzi, Isabella, Danny Cliceri, Leonardo Menghi, Eugenio Aprea, Mathilde Charles, Erminio Monteleone, Caterina Dinnella, Sara Spinelli, Ella Pagliarini, Monica Laureati, and et al. 2022. "Correction: Endrizzi et al. Relationships between Intensity and Liking for Chemosensory Stimuli in Food Models: A Large-Scale Consumer Segmentation. Foods 2022, 11, 5" Foods 11, no. 15: 2174. https://doi.org/10.3390/foods11152174
APA StyleEndrizzi, I., Cliceri, D., Menghi, L., Aprea, E., Charles, M., Monteleone, E., Dinnella, C., Spinelli, S., Pagliarini, E., Laureati, M., Torri, L., Bendini, A., Toschi, T. G., Sinesio, F., Predieri, S., & Gasperi, F. (2022). Correction: Endrizzi et al. Relationships between Intensity and Liking for Chemosensory Stimuli in Food Models: A Large-Scale Consumer Segmentation. Foods 2022, 11, 5. Foods, 11(15), 2174. https://doi.org/10.3390/foods11152174