
Effect of Different Winemaking Conditions on Organic Acids Compounds of White Wines

 ,
, 
 ,
,  and
and 
Abstract
:
1. Introduction
2. Materials and Methods
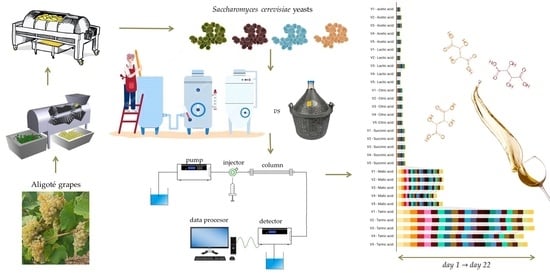
2.1. Winemaking Process
2.2. Methods of Analysis
3. Results and Discussion
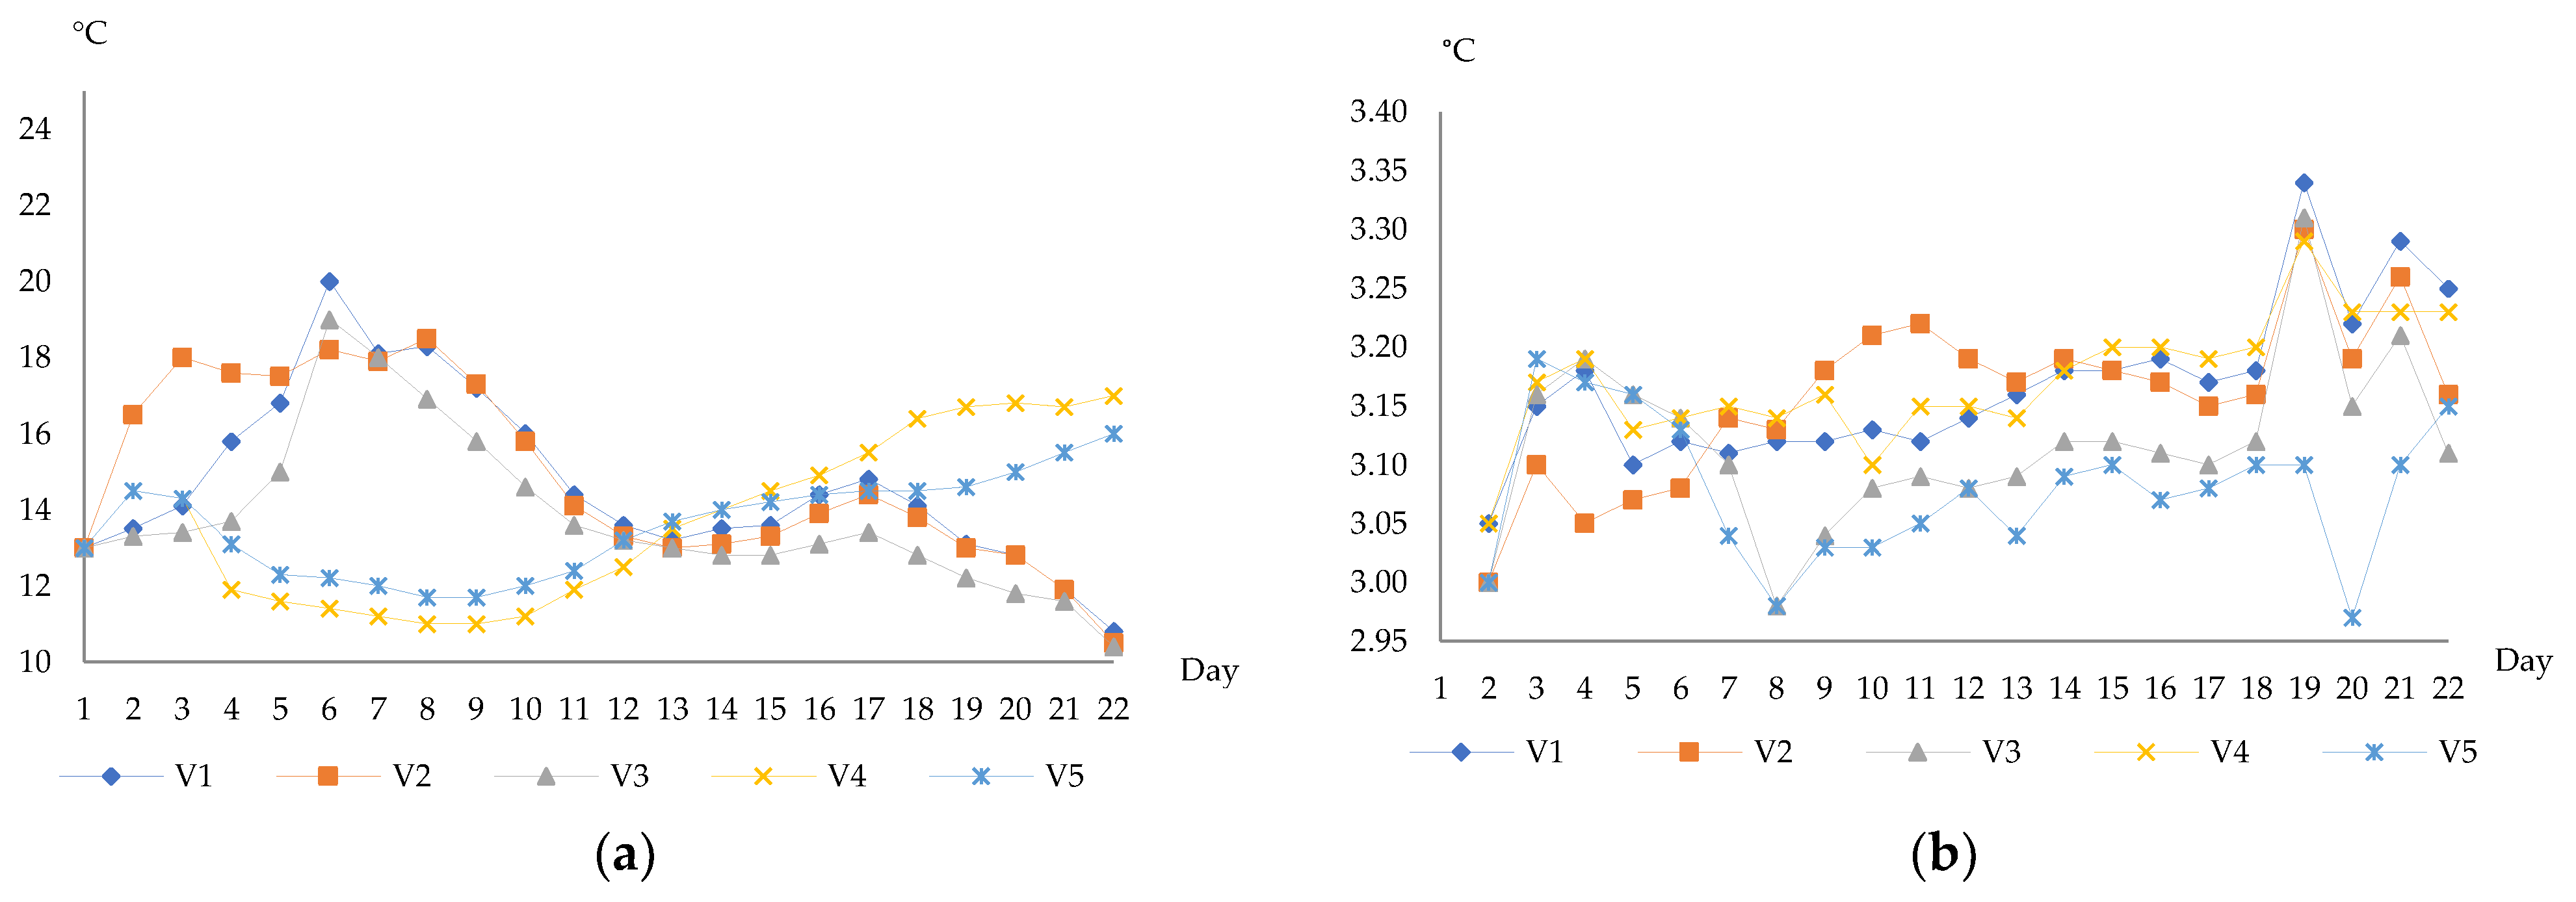
3.1. Physicochemical Characteristics of Wines
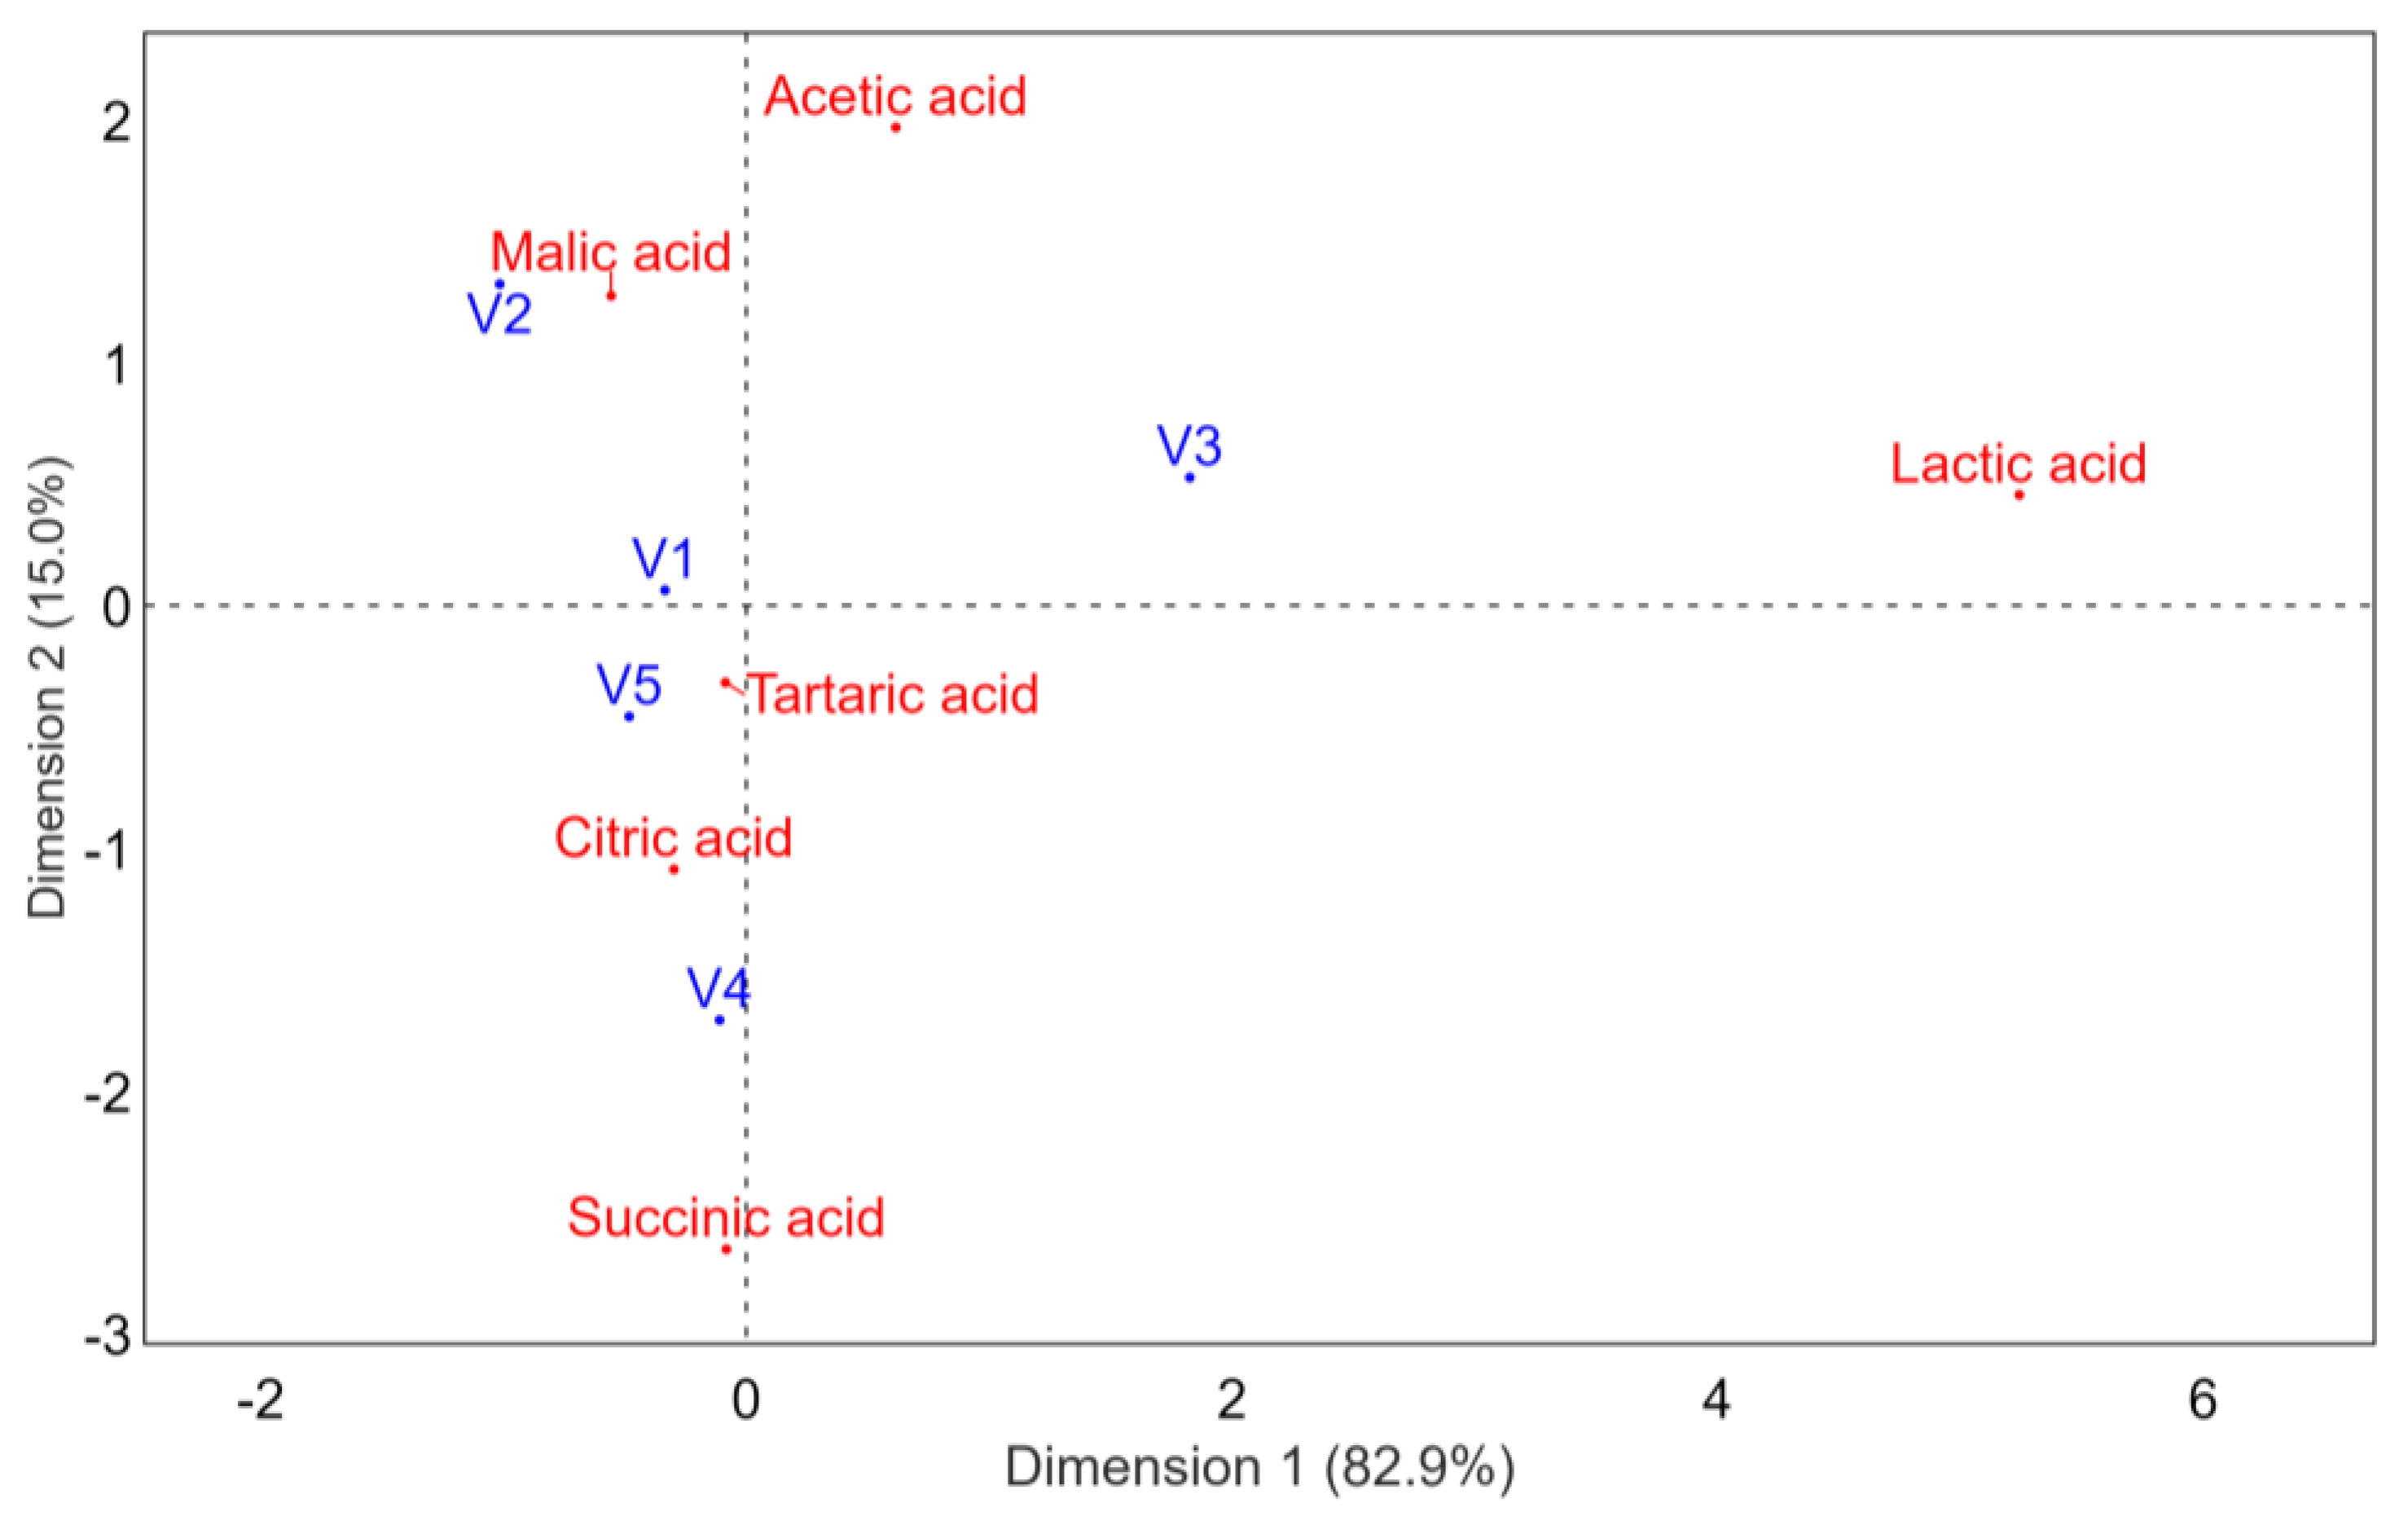
3.2. Organic Acid Concentrations
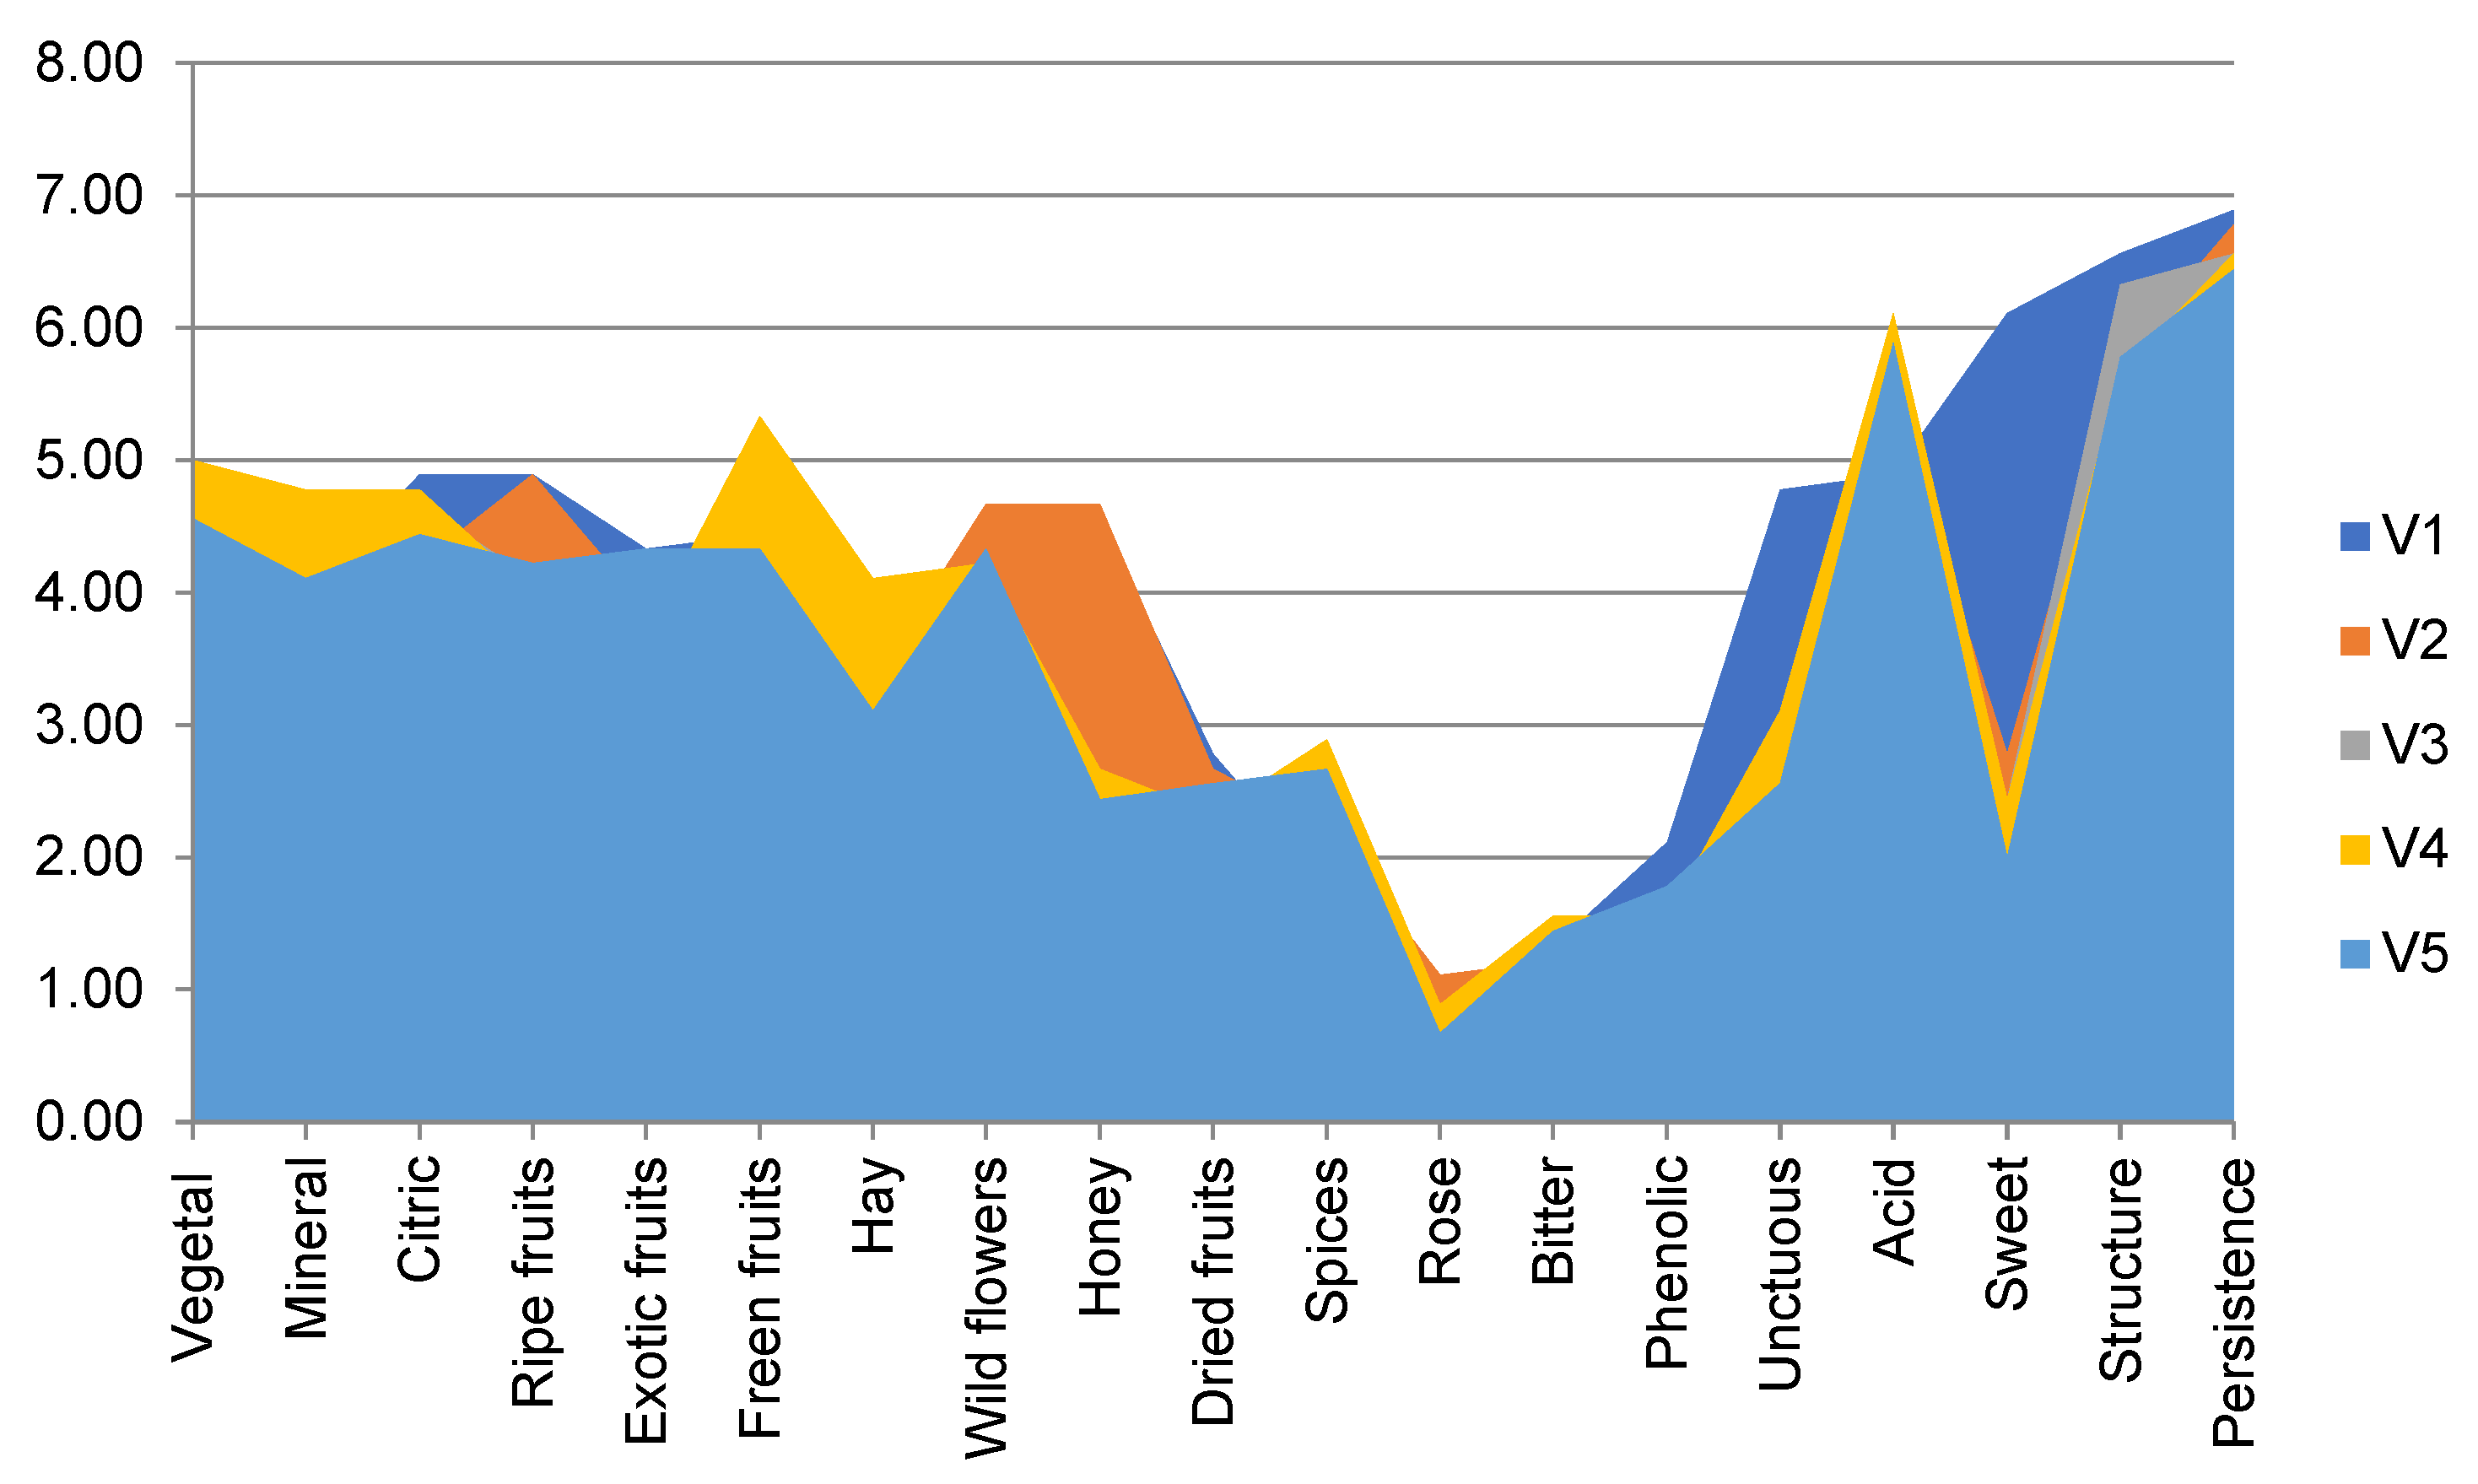
3.3. Sensory Description
4. Conclusions
Author Contributions
Funding
Conflicts of Interest
References
- Samoticha, J.; Wojdyło, A.; Chmielewska, J.; Nofer, J. Effect of different yeast strains and temperature of fermentation on basic enological parameters, polyphenols and volatile compounds of Aurore white wine. Foods 2019, 8, 599. [Google Scholar] [CrossRef] [PubMed] [Green Version]
- Jurado-Sánchez, B.; Ballesteros, E.; Gallego, M. Gas chromatographic determination of 29 organic acids in food stuffs after continuous solid-phase extraction. Talanta 2011, 84, 924–930. [Google Scholar] [CrossRef]
- Chidi, B.; Rossouw, D.; Buica, A.; Bauer, F. Determining the impact of industrial wine yeast strains on organic acid production under white and red wine-like fermentation conditions. S. Afr. J. Enol. 2015, 36, 316–327. [Google Scholar] [CrossRef] [Green Version]
- Robles, A.; Fabjanowicz, M.; Chmiel, T.; Płotka-Wasylka, J. Determination and identification of organic acids in wine samples. Problems and challenges. Trends Analyt. Chem. 2019, 120, 115630. [Google Scholar] [CrossRef]
- Zotou, A.; Loukou, Z.; Karava, O. Method development for the determination of seven organic acids in wines by reversed-phase high performance liquid chromatography. Chromatographia 2004, 60, 39–44. [Google Scholar] [CrossRef]
- Cotea, D.V.; Zănoagă, C.; Cotea, V.V. Tratat de Oenochimie; Romanian Academy Publishing House: Bucharest, Romania, 2009. [Google Scholar]
- Borneman, A.R.; Forgan, A.H.; Chambers, P.J.; Pretorius, I.S. Unravelling the genetic blueprint of wine yeast. Aust. N. Z. Wine Ind. 2008, 23, 23–25. [Google Scholar]
- Zheng, Y.J.; Duan, Y.T.; Zhang, Y.F.; Pan, Q.H.; Li, J.M.; Huang, W.D. Determination of organic acids in red wine and must on only one RP-LC-column directly after sample dilution and filtration. Chromatographia 2009, 69, 1391–1395. [Google Scholar] [CrossRef]
- González-Sáiz, J.M.; Esteban-Díez, I.; Rodríguez-Tecedor, S.; Pérez-del-Notario, N.; Arenzana-Rámila, I.; Pizarro, C. Modulation of the phenolic composition and colour of red wines subjected to accelerated ageing by controlling process variables. Food Chem. 2014, 165, 271–281. [Google Scholar] [CrossRef]
- Bayraktar, V.N. Organic acids concentration in wine stocks after Saccharomyces cerevisiae fermentation. Biotechnol. Acta 2013, 6, 97–106. [Google Scholar] [CrossRef]
- Chidi, B.; Bauer, F.; Rossouw, D. Organic acid metabolism and the impact of fermentation practices on wine acidity: A review. S. Afr. J. Enol. 2018, 39. [Google Scholar] [CrossRef] [Green Version]
- Ramon-Portugal, F.; Seiller, I.; Taillandier, P.; Favarel, J.L.; Nepveu, F.; Strehaiano, P. Kinetics of production and consumption of organic acids during alcoholic fermentation by Saccharomys cerevisae. Food Technol. Biotechnol. 1999, 37, 235–240. [Google Scholar]
- Baiano, A.; Terracone, C.; Longobardi, F.; Ventrella, A.; Agostiano, A.; Del Noble, M.A. Effects of different vinification technologies on physical and chemical characteristics of Sauvignon blanc wines. Food Chem. 2012, 135, 2694–2701. [Google Scholar] [CrossRef] [PubMed]
- Torija, M.J.; Rozes, N.; Poblet, M.; Guillamon, J.M.; Mas, A. Yeast population dynamics in spontaneous fermentations: Comparison between two different wine-producing areas over a period of three years. Antonie Leeuwenhoek 2001, 79, 345–352. [Google Scholar] [CrossRef]
- Orlic, S.; Arroyo-Lopez, F.N.; Huic-Babic, K.; Lucilla, I.; Querol, A.; Barrio, E. A comparative study of the wine fermentation performance of Saccharomyces paradoxus under different nitrogen concentrations and glucose/fructose ratios. J. Appl. Microbiol. 2010, 108, 73–80. [Google Scholar] [CrossRef] [Green Version]
- Bely, M.; Masneuf-Pomarede, I.; Dubourdieu, D. Influence of physiological state of inoculum on volatile acidity production by Saccharomyces cerevisiae during high sugar fermentation. J. Int. Sci. Vigne Vin 2005, 39, 191–197. [Google Scholar] [CrossRef] [Green Version]
- Shimazu, Y.; Watanabe, M. Effects of yeast strains and environmental conditions on formation of organic acids in must during fermentation. J. Ferment. Technol. 1981, 59, 27–32. [Google Scholar]
- Samuelov, N.S. Kinetics and regulation of 3-lactamase formation in methylotrophic bacterium. Biotechnol. Bioeng. 1988, 31, 125–129. [Google Scholar] [CrossRef]
- Lee, P.C.; Lee, W.G.; Lee, S.Y.; Chang, H.N. Effects of medium components on the growth of Anaerobiospirillum succiniciproducens and succinic acid production. Process Biochem. 1999, 35, 49–55. [Google Scholar] [CrossRef]
- Spiller, G.A.; Story, J.A.; Furumoto, E.J.; Chezem, J.C.; Spiller, M. Effect of tartaric acid and dietary fibre from sun-dried raisins on colonic function and on bile acid and volatile fatty acid excretion in healthy adults. Br. J. Nutr. 2003, 90, 803–807. [Google Scholar] [CrossRef] [Green Version]
- Younes, M.; Aquilina, G.; Castle, L.; Engel, K.; Fowler, P.; Frutos Fernandez, M.J.; Fürst, P.; Gürtler, R.; Gundert-Remy, U.; Husøy, T.; et al. Re-evaluation of l(+)-tartaric acid (E 334), sodium tartrates (E 335), potassium tartrates (E 336), potassium sodium tartrate (E 337) and calcium tartrate (E 354) as food additives. EFSA J. 2020, 18, e06030. [Google Scholar] [CrossRef] [Green Version]
- Wang, H.; Xia, B.; Lin, M.; Wang, Y.; Sun, B.; Li, Y. Succinic acid inhibits the activity of cytochrome P450 (CYP450) enzymes. Pharm. Biol. 2020, 58, 1159–1164. [Google Scholar] [CrossRef]
- Ocak, N.; Erener, G.; Altop, A.; Kop, C. The effect of malic acid on performance and some digestive tract traits of Japanese quails. J. Poult. Sci. 2009, 46, 25–29. [Google Scholar] [CrossRef] [Green Version]
- Schmidt, S.A.; Kolouchova, R.; Forgan, A.H.; Borneman, A.R. Evaluation of Saccharomyces cerevisiae wine yeast competitive fitness in enologically relevant environments by barcode sequencing. Genes Genom. Genet. 2020, 10, 591–603. [Google Scholar] [CrossRef] [Green Version]
- OIV. Compendium of International Methods of Analysis of Wines and Musts; OIV Publishing House: Paris, France, 2020. [Google Scholar]
- Niculaua, M.; Cotea, M.; Zamfir, C.I.; Odăgeriu, G.; Nechita, B.; Chiriță, O. Assessment of organic acids of wine of grape varieties from the Romanian ampelography collection of UASVM Iasi. Bull. UASVM Hortic. 2009, 66, 1–6. [Google Scholar]
- Moroșanu, A.M.; Cotea, V.V.; Luchian, E.C.; Niculaua, M.; Colibaba, L.C.; Tarțian, A.C. The influence of pre-fermentative treatments on the volatile, chromatic features, organic acids and phenolic content of Fetească albă Romanian wine. BIO Web Conf. 2016, 7, 02017. [Google Scholar] [CrossRef] [Green Version]
- Cotea, V.V.; Focea, M.C.; Luchian, C.E.; Colibaba, L.C.; Scutarașu, E.C.; Niculaua, M.; Zamfir, C.I.; Popîrdă, A. Influence of different commercial yeasts on volatile fraction of sparkling wines. Foods J. 2021, 10, 247. [Google Scholar] [CrossRef] [PubMed]
- Benucci, I.; Esti, M. Novel microencapsulated yeast for the production of sparkling wine by traditional method. Int. J. Vitic. Enol. 2020, 12, 1–9. [Google Scholar]
- Volschenk, H.; van Vuuren, H.J.J.; Viljoen-Bloom, M. Malic acid in wine: Origin, function and metabolism during vinification. S. Afr. J. Enol. Vitic. 2006, 27, 123–136. [Google Scholar] [CrossRef] [Green Version]
- Waterhouse, A.L.; Sacks, G.L.; Jeffery, D.W. Understanding Wine Chemistry; Wiley Online Library: Hoboken, NJ, USA, 2016. [Google Scholar] [CrossRef]
- Rajkovic, M.; Novakovic, I.; Petrovic, A. Determination of titratable acidity in white wine. J. Agric. Sci. 2007, 52, 169–184. [Google Scholar] [CrossRef]
- Mendes-Ferreira, A.; Mendes-Faia, A. The role of yeasts and lactic acid bacteria on the metabolism of organic acids during winemaking. Foods 2020, 9, 1231. [Google Scholar] [CrossRef]
- Ribéreau-Gayon, P.; Dubourdieu, D.; Donèche, B.; Lonvaud, A. The microbiology of wine and vinifications. In Handbook of Enology, 1st ed.; John Wiley & Sons: New York, NY, USA, 2000. [Google Scholar]
- Vilela, A. Biological demalication and deacetification of musts and wines: Can wine yeasts make the wine taste better? J. Ferment. 2017, 3, 51. [Google Scholar] [CrossRef] [Green Version]
- Amerine, A.M.; Kunkee, R.E. Microbiology of winemaking. Annu. Rev. Microbiol. 1968, 22, 323–358. [Google Scholar] [CrossRef] [PubMed]
- Baroñ, M.; Fiala, J. Chasing after minerality, relationship to yeasts nutritional stress and succinic acid production. Czech J. Food Sci. 2012, 30, 188–193. [Google Scholar] [CrossRef] [Green Version]
- Whiting, G.C. Organic acid metabolism of yeasts during fermentation of alcoholic beverages—A review. J. Inst. Brew. 1975, 82, 84–92. [Google Scholar] [CrossRef]
- Ugliano, M.; Henschke, P.A. Wine Chemistry and Biochemistry; Springer Science Business Media Publisher, LLC: Berlin/Heidelberg, Germany, 2009. [Google Scholar]
- Chidi, B.S.; Rossow, D.; Bauer, F. The impact of changes in environmental conditions on organic acid production by commercial wine yeast strains. S. Afr. J. Enol. Vitic. 2018, 39, 297–304. [Google Scholar] [CrossRef]
- Sharma, R.K. Citric Acid; CRC Press LLC: Boca Raton, FL, USA, 2000. [Google Scholar]
- Margalit, Y. Must and Wine Composition—Concepts in Wine Chemistry; Wine Appreciation Guild Ltd.: San Francisco, CA, USA, 1997; pp. 76–82. [Google Scholar]
- Garrido-Delgado, R.; López-Vidál, S.; Arce, L.; Valcarcel, M. Differentiation and identification of white wine varieties by using electropherogram fingerprints obtained with CE. J. Sep. Sci. 2009, 32, 3809–3816. [Google Scholar] [CrossRef]
- Mathur, H.; Beresford, T.P.; Cotter, P.D. Health benefits of lactic acid bacteria (LAB) fermentates. Nutrients 2020, 12, 1679. [Google Scholar] [CrossRef]
- Wiebe, M.G.; Rintala, E.; Tamminen, A.; Simolin, H.; Salusjärvi, L.; Toivari, M.; Kokkonen, J.T.; Kiuru, J.; Ketola, R.A.; Jouhten, P.; et al. Central carbon metabolism of Saccharomyces cerevisiae in anaerobic, oxygen-limited and fully aerobic steady-state conditions and following a shift to anaerobic conditions. FEMS Yeast Res. 2008, 8, 140–154. [Google Scholar] [CrossRef]
- Pan, W.; Jussier, D.; Terrade, N.; Yada, R.Y.; Mira De Orduña, R. Kinetics of sugars, organic acids and acetaldehyde during simultaneous yeast-bacterial fermentations of white wine at different pH values. Food Res. Int. 2011, 44, 660–666. [Google Scholar] [CrossRef]
- Torrens, J.; Urpí, P.; Riu-Aumatell, M.; Vichi, S.; López-Tamames, E.; Buxaderas, S. Different commercial yeast strains affecting the volatile and sensory profile of cava base wine. Int. J. Food Microbiol. 2008, 124, 48–57. [Google Scholar] [CrossRef]
- Picariello, L.; Rinaldi, A.; Martino, F.; Petracca, F.; Moio, L.; Gambuti, A. Modification of the organic acid profile of grapes due to climate changes alters the stability of red wine phenolics during controlled oxidation. Vitis 2019, 58, 127–133. [Google Scholar] [CrossRef]


| Variant | Volatile Acidity (g/L C2H4O2) | Total Acidity (g/L C4H6O6) | pH | Density | Alcoholic Strength (% vol.) | Sugar (g/L) |
|---|---|---|---|---|---|---|
| V1 | 0.38 ± 0.00 | 6.47 ± 0.00 * | 3.00 ± 0.00 | 0.9940 ± 0.00 * | 11.00 ± 0.01 | 6.30 ± 0.00 * |
| V2 | 0.32 ± 0.00 | 6.88 ± 0.00 * | 3.09 ± 0.00 | 0.9918 ± 0.00 * | 11.20 ± 0.00 | 2.40 ± 0.01 * |
| V3 | 0.29 ± 0.00 | 6.89 ± 0.00 * | 3.04 ± 0.00 | 0.9928 ± 0.00 * | 11.20 ± 0.00 | 3.60 ± 0.00 * |
| V4 | 0.29 ± 0.00 | 5.92 ± 0.00 * | 3.02 ± 0.00 | 0.9927 ± 0.00 * | 11.50 ± 0.00 | 3.50 ± 0.01 * |
| V5 | 0.28 ± 0.00 | 6.26 ± 0.00 * | 3.02 ± 0.00 | 0.9925 ± 0.00 * | 11.30 ± 0.00 | 3.30 ± 0.00 * |
| p-value | ns | p < 0.05 | ns | p < 0.05 | ns | p < 0.05 |
| Fermentation Stage | Tartaric Acid | Malic Acid | Lactic Acid | Acetic Acid | Citric Acid | Succinic Acid |
|---|---|---|---|---|---|---|
| Day 1 (a) | 5.07 ± 0.02 efg | 1.87 ±0.02 * | 0.10 ± 0.00 * | 0.10 ± 0.00 * | 0.20 ± 0.00 * | 0.26 ± 0.00 * |
| Day 2 (b) | 5.12 ± 0.0 cde | 1.83 ± 0.02 * | 0.11 ± 0.00 * | 0.11 ± 0.00 * | 0.20 ± 0.00 * | 0.26 ± 0.00 * |
| Day 3 (c) | 5.15 ±0.00 b | 1.74 ± 0.01 * | 0.14 ± 0.00 * | 0.12 ±0.00 d | 0.20 ± 0.00 d | 0.26 ± 0.00 * |
| Day 4 (d) | 5.11 ±0.00 be | 1.70 ± 0.01 * | 0.14 ± 0.00 * | 0.13 ± 0.00 ce | 0.20 ± 0.00 ce | 0.27 ± 0.00 e |
| Day 5 (e) | 5.09 ± 0.00 abdf | 1.66 ± 0.02 * | 0.15 ± 0.00 f | 0.13 ±0.00 d | 0.20 ± 0.00 d | 0.27 ± 0.00 df |
| Day 6 (f) | 5.064 ±0.00 aeg | 1.621 ±0.01 * | 0.148 ±0.00 eg | 0.13 ± 0.00 g | 0.204 ±0.00 gh | 0.27 ± 0.00 e |
| Day 7 (g) | 5.05 ± 0.01 afh | 1.60 ± 0.004 h | 0.15 ± 0.00 fhi | 0.13 ± 0.00 fh | 0.20 ± 0.00 fh | 0.27 ± 0.00 * |
| Day 8 (h) | 5.03 ± 0.01 gi | 1.59 ± 0.00 g | 0.15 ± 0.00 gi | 0.13 ± 0.00 gij | 0.21 ± 0.00 fgi | 0.28 ± 0.00 * |
| Day 9 (i) | 5.00 ± 0.01 h | 1.57 ± 0.00 * | 0.15 ± 0.00 ghj | 0.131 ±0.00 hj | 0.21 ± 0.00 hj | 0.29 ± 0.00 * |
| Day 10 (j) | 4.95 ± 0.00 * | 1.56 ± 0.00 * | 0.15 ± 0.00 ik | 0.13 ± 0.00 hi | 0.21 ± 0.00 ik | 0.29 ± 0.00 k |
| Day 11 (k) | 4.88 ±0.03 * | 1.54 ± 0.00 l | 0.15 ± 0.00 jl | 0.13 ± 0.00 * | 0.21 ± 0.00 jlm | 0.29 ± 0.00 j |
| Day 12 (l) | 4.67 ± 0.03 * | 1.53 ± 0.00 km | 0.15 ± 0.00 km | 0.14 ± 0.00 * | 0.21 ± 0.001 km | 0.30 ± 0.00 * |
| Day 13 (m) | 4.59 ± 0.03 * | 1.51 ± 0.00 ln | 0.16 ± 0.00 l | 0.14 ± 0.00 * | 0.21 ± 0.00 kln | 0.30 ±0.00 * |
| Day 14 (n) | 4.46 ±0.02 * | 1.50 ± 0.00 mo | 0.16 ± 0.00 * | 0.14 ± 0.00 * | 0.201 ± 0.00 mo | 0.30 ± 0.00 * |
| Day 15 (o) | 4.40 ± 0.02 * | 1.49 ± 0.00 np | 0.16 ± 0.00 * | 0.14 ± 0.00 * | 0.21 ± 0.00 npq | 0.30 ± 0.00 p |
| Day 16 (p) | 4.23 ± 0.04 * | 1.48 ± 0.00 oq | 0.16 ± 0.00 q | 0.15 ± 0.00 * | 0.21 ± 0.00 oq | 0.31 ± 0.00 oq |
| Day 17 (q) | 4.16 ± 0.02 * | 1.47 ± 0.00 pr | 0.17 ± 0.00 p | 0.15 ± 0.00 * | 0.21 ± 0.00 opr | 0.31 ± 0.00 p |
| Day 18 (r) | 4.10 ± 0.02 * | 1.46 ± 0.00 qs | 0.17 ± 0.00 * | 0.17 ± 0.00 * | 0.21 ± 0.00 q | 0.31 ± 0.00 s |
| Day 19 (s) | 4.01 ± 0.04 * | 1.45 ± 0.00 rt | 0.17 ± 0.00 * | 0.18 ± 0.00 * | 0.21 ± 0.00 t | 0.31 ± 0.00 r |
| Day 20 (t) | 3.92 ± 0.03 * | 1.44 ± 0.00 su | 0.18 ± 0.00 * | 0.18 ± 0.00 * | 0.21 ± 0.00 s | 0.31 ± 0.00 * |
| Day 21 (u) | 3.86 ± 0.02 * | 1.43 ± 0.00 tv | 0.18 ± 0.00 * | 0.19 ± 0.00 * | 0.21 ± 0.00 * | 0.32 ± 0.00 * |
| Day 22 (v) | 3.80 ± 0.03 * | 1.42 ± 0.00 u | 0.18 ± 0.00 * | 0.20 ± 0.00 * | 0.21 ± 0.00 * | 0.32 ± 0.00 * |
| Fermentation Stage | Tartaric Acid | Malic Acid | Lactic Acid | Acetic Acid | Citric Acid | Succinic Acid |
|---|---|---|---|---|---|---|
| Day 1 (a) | 5.07 ± 0.02 * | 1.87 ± 0.02 * | 0.10 ± 0.00 b | 0.10 ± 0.00 * | 0.20 ± 0.00 * | 0.26 ± 0.00 b |
| Day 2 (b) | 5.19 ± 0.02 * | 1.84 ± 0.00 * | 0.10 ± 0.00 a | 0.11 ± 0.00 | 0.20 ± 0.00 * | 0.26 ± 0.00 a |
| Day 3 (c) | 5.12 ± 0.05 * | 1.82 ± 0.00 * | 0.13 ± 0.00 de | 0.14 ± 0.00 de | 0.21 ± 0.00 de | 0.26 ± 0.00 * |
| Day 4 (d) | 5.63 ± 0.04 * | 1.80 ± 0.00 * | 0.13 ± 0.00 cef | 0.14 ± 0.00 ce | 0.21 ± 0.00 cefg | 0.27 ± 0.00 * |
| Day 5 (e) | 5.29 ± 0.02 * | 1.75 ± 0.01 * | 0.13 ± 0.00 cdfg | 0.14 ± 0.00 cd | 0.21 ± 0.00 cdfghij | 0.27 ± 0.00 * |
| Day 6 (f) | 5.24 ± 0.02 * | 1.72 ± 0.01 * | 0.13 ± 0.00 degh | 0.15 ± 0.00 g | 0.21 ± 0.00 deghijk | 0.28 ± 0.00 * |
| Day 7 (g) | 4.89 ± 0.05 * | 1.69 ± 0.00 * | 0.13 ± 0.00 efhi | 0.16 ± 0.00 fh | 0.21 ± 0.00 defhijkl | 0.28 ± 0.00 * |
| Day 8 (h) | 4.78 ± 0.00 * | 1.67 ± 0.00 * | 0.13 ± 0.00 fgij | 0.16 ± 0.00 gi | 0.21 ± 0.00 efgijklm | 0.29 ± 0.00 * |
| Day 9 (i) | 4.63 ± 0.04 * | 1.65 ± 0.00 * | 0.13 ± 0.00 ghjk | 0.16 ± 0.00 hj | 0.21 ± 0.00 efghjklmn | 0.29 ± 0.00 * |
| Day 10 (j) | 4.52 ± 0.03 * | 1.64 ± 0.00 k | 0.13 ± 0.00 hiklm | 0.16 ± 0.00 ik | 0.21 ± 0.00 efghiklmno | 0.30 ± 0.00 k |
| Day 11 (k) | 4.48 ± 0.01 l | 1.63 ± 0.00 jl | 0.13 ± 0.00 ijlm | 0.16 ± 0.00 j | 0.21 ± 0.00 fghijlmnop | 0.30 ± 0.00 jl |
| Day 12 (l) | 4.44 ± 0.01 km | 1.62 ± 0.00 kmn | 0.14 ± 0.00 jkmn | 0.17 ± 0.00 m | 0.21 ± 0.00 ghijkmnop | 0.30 ± 0.00 km |
| Day 13 (m) | 4.40 ± 0.00 ln | 1.62 ± 0.00 ln | 0.14 ± 0.00 jklno | 0.18 ± 0.00 ln | 0.21 ± 0.00 hijklnopq | 0.30 ± 0.00 ln |
| Day 14 (n) | 4.37 ± 0.02 m | 1.61 ± 0.00 lmo | 0.14 ± 0.00 lmop | 0.18 ± 0.00 m | 0.22 ± 0.00 ijklmopq | 0.30 ± 0.00 mo |
| Day 15 (o) | 4.31 ± 0.00 p | 1.61 ± 0.00 npq | 0.14 ± 0.00 mnp | 0.19 ± 0.00 * | 0.22 ± 0.00 jklmnpqr | 0.30 ± 0.00 np |
| Day 16 (p) | 4.27 ± 0.00 oq | 1.60 ± 0.00 oqr | 0.14 ± 0.00 noq | 0.19 ± 0.00 * | 0.22 ± 0.00 klmnoqrs | 0.31 ± 0.00 oq |
| Day 17 (q) | 4.24 ± 0.00 pr | 1.60 ± 0.00 opr | 0.14 ± 0.00 pr | 0.19 ± 0.00 * | 0.22 ± 0.00 mnoprs | 0.31 ± 0.00 pr |
| Day 18 (r) | 4.20 ± 0.00 qs | 1.59 ± 0.00 pqst | 0.14 ± 0.00 qs | 0.20 ± 0.00 * | 0.22 ± 0.00 opqs | 0.31 ± 0.00 qs |
| Day 19 (s) | 4.16 ± 0.00 rt | 1.59 ± 0.00 rtu | 0.14 ± 0.00 rtv | 0.20 ± 0.00 * | 0.22 ± 0.00 pqr | 0.31 ± 0.00 rt |
| Day 20 (t) | 4.13 ± 0.02 s | 1.58 ± 0.00 rsu | 0.15 ± 0.00 suv | 0.21 ± 0.00 * | 0.22 ± 0.00 * | 0.31 ± 0.00 s |
| Day 21 (u) | 4.08 ± 0.02 * | 1.58 ± 0.01 st | 0.15 ± 0.00 tv | 0.22 ± 0.00 * | 0.23 ± 0.00 v | 0.32 ± 0.00 v |
| Day 22 (v) | 3.88 ± 0.03 * | 1.56 ± 0.01 * | 0.15 ± 0.01 stu | 0.24 ± 0.00 * | 0.23 ± 0.00 u | 0.32 ± 0.00 u |
| Fermentation Stage | Tartaric Acid | Malic Acid | Lactic Acid | Acetic Acid | Citric Acid | Succinic Acid |
|---|---|---|---|---|---|---|
| Day 1 (a) | 5.07 ± 0.02 f | 1.87 ± 0.02 * | 0.10 ± 0.00 * | 0.10 ± 0.00 bc | 0.20 ± 0.00 b | 0.26 ± 0.00 * |
| Day 2 (b) | 5.24 ± 0.03 c | 1.85 ± 0.00 * | 0.13 ± 0.03 * | 0.10 ± 0.00 ac | 0.20 ± 0.00 a | 0.27 ± 0.00 * |
| Day 3 (c) | 5.21 ± 0.02 bd | 1.83 ± 0.00 d | 0.20 ± 0.00 * | 0.10 ± 0.00 ab | 0.20 ± 0.00 * | 0.28 ± 0.00 * |
| Day 4 (d) | 5.17 ± 0.00 ce | 1.82 ± 0.01 c | 0.28 ± 0.00 * | 0.11 ± 0.00 * | 0.21 ± 0.00 * | 0.28 ± 0.00 * |
| Day 5 (e) | 5.14 ± 0.02 d | 1.80 ± 0.01 * | 0.31 ± 0.00 fghijkl | 0.16 ± 0.00 * | 0.21 ± 0.00 f | 0.30 ± 0.00 * |
| Day 6 (f) | 5.09 ± 0.03 a | 1.77 ± 0.02 * | 0.31 ± 0.00 eghijklm | 0.17 ± 0.00 * | 0.21 ± 0.00 eg | 0.31 ± 0.00 * |
| Day 7 (g) | 5.00 ± 0.05 * | 1.71 ± 0.02 * | 0.31 ± 0.00 efhijklm | 0.18 ± 0.00 * | 0.21 ± 0.00 fh | 0.32 ± 0.00 hi |
| Day 8 (h) | 4.90 ± 0.05 * | 1.61 ± 0.01 * | 0.31 ± 0.00 efgijklmn | 0.19 ± 0.00 * | 0.21 ± 0.00 gi | 0.32 ± 0.00 gi |
| Day 9 (i) | 4.77 ± 0.02 * | 1.59 ± 0.00 * | 0.31 ± 0.00 efghjklmno | 0.19 ± 0.00 * | 0.21 ± 0.00 hj | 0.32 ± 0.00 ghjk |
| Day 10 (j) | 4.71 ± 0.02 k | 1.57 ± 0.01 * | 0.31 ± 0.00 efghiklmno | 0.20 ± 0.00 * | 0.21 ± 0.00 ik | 0.32 ± 0.00 ikl |
| Day 11 (k) | 4.66 ± 0.02 j | 1.54 ± 0.01 * | 0.32 ± 0.00 efghijlmnop | 0.21 ± 0.00 l | 0.21 ± 0.00 jl | 0.32 ± 0.00 ijl |
| Day 12 (l) | 4.60 ± 0.02 * | 1.51 ± 0.00 m | 0.32 ± 0.00 efghijkmnopq | 0.21 ± 0.00 km | 0.22 ± 0.00 km | 0.32 ± 0.00 jkm |
| Day 13 (m) | 4.54 ± 0.03 * | 1.50 ± 0.00 ln | 0.32 ± 0.00 fghijklnopqr | 0.21 ± 0.00 ln | 0.22 ± 0.00 ln | 0.32 ± 0.00 lno |
| Day 14 (n) | 4.47 ± 0.03 * | 1.49 ± 0.00 mo | 0.32 ± 0.00 hijklmopqrs | 0.21 ± 0.00 m | 0.22 ± 0.00 mo | 0.32 ± 0.00 mo |
| Day 15 (o) | 4.41 ± 0.02 * | 1.48 ± 0.00 np | 0.32 ± 0.00 ijklmnpqrst | 0.22 ± 0.00 p | 0.22 ± 0.00 np | 0.32 ± 0.00 mnp |
| Day 16 (p) | 4.35 ± 0.02 * | 1.47 ± 0.00 oqr | 0.33 ± 0.00 klmnoqrst | 0.22 ± 0.00 oq | 0.22 ± 0.00 oq | 0.33 ± 0.00 oq |
| Day 17 (q) | 4.30 ± 0.03 * | 1.47 ± 0.00 prs | 0.33 ± 0.00 lmnoprstu | 0.22 ± 0.00 p | 0.22 ± 0.00 pr | 0.33 ± 0.00 p |
| Day 18 (r) | 4.26 ± 0.01 s | 1.46 ± 0.00 pqst | 0.33 ± 0.00 mnopqstu | 0.23 ± 0.00 * | 0.22 ± 0.00 qs | 0.33 ± 0.00 * |
| Day 19 (s) | 4.22 ± 0.02 rt | 1.45 ± 0.00 qrtu | 0.33 ± 0.00 nopqrtu | 0.23 ± 0.00 * | 0.22 ± 0.00 rt | 0.33 ± 0.00 * |
| Day 20 (t) | 4.18 ± 0.02 s | 1.45 ± 0.00 rsu | 0.33 ± 0.00 opqrsuv | 0.23 ± 0.00 * | 0.22 ± 0.00 s | 0.34 ± 0.00 * |
| Day 21 (u) | 4.05 ± 0.04 * | 1.44 ± 0.00 stv | 0.34 ± 0.00 qrstv | 0.25 ± 0.00 * | 0.22 ± 0.00 * | 0.34 ± 0.00 * |
| Day 22 (v) | 3.97 ± 0.04 * | 1.43 ± 0.00 u | 0.34 ± 0.00 tu | 0.26 ± 0.00 * | 0.23 ± 0.00 * | 0.34 ± 0.00 * |
| Fermentation Stage | Tartaric Acid | Malic Acid | Lactic Acid | Acetic Acid | Citric Acid | Succinic Acid |
|---|---|---|---|---|---|---|
| Day 1 (a) | 5.07 ± 0.02 d | 1.87 ± 0.02 * | 0.10 ± 0.00 * | 0.10 ± 0.00 * | 0.20 ± 0.00 b | 0.26 ± 0.00 b |
| Day 2 (b) | 5.22 ± 0.03 * | 1.82 ± 0.02 * | 0.10 ± 0.00 * | 0.10 ± 0.00 * | 0.20 ± 0.00 a | 0.26 ± 0.00 a |
| Day 3 (c) | 5.14 ± 0.01 * | 1.51 ± 0.00 * | 0.13 ± 0.00 * | 0.10 ± 0.00 * | 0.20 ± 0.00 * | 0.26 ± 0.00 * |
| Day 4 (d) | 5.07 ± 0.04 a | 1.49 ± 0.01 * | 0.15 ± 0.00 * | 0.11 ± 0.00 * | 0.20 ± 0.00 * | 0.26 ± 0.00 * |
| Day 5 (e) | 4.90 ± 0.02 * | 1.39 ± 0.01 * | 0.15 ± 0.00 f | 0.11 ± 0.00 * | 0.21 ± 0.00 * | 0.27 ± 0.00 * |
| Day 6 (f) | 4.82 ± 0.02 * | 1.36 ± 0.00 * | 0.15 ± 0.00 eg | 0.11 ± 0.00 * | 0.21 ± 0.00 * | 0.27 ± 0.00 * |
| Day 7 (g) | 4.73 ± 0.05 * | 1.35 ± 0.00 h | 0.15 ± 0.00 fh | 0.11 ± 0.00 * | 0.21 ± 0.00 hi | 0.27 ± 0.00 * |
| Day 8 (h) | 4.57 ± 0.05 * | 1.335 ±0.00 gi | 0.153 ± 0.00 gi | 0.111 ± 0.00 i | 0.21 ± 0.00 gi | 0.27 ± 0.00 * |
| Day 9 (i) | 4.30 ± 0.02 * | 1.33 ± 0.00 hj | 0.15 ± 0.00 hj | 0.11 ± 0.00 h | 0.21 ± 0.00 ghj | 0.28 ± 0.00 * |
| Day 10 (j) | 4.24 ± 0.02 * | 1.32 ± 0.00 ik | 0.15 ± 0.00 ik | 0.11 ± 0.00 * | 0.21 ± 0.00 ik | 0.28 ± 0.00 * |
| Day 11 (k) | 4.16 ± 0.02 * | 1.32 ± 0.00 jl | 0.16 ± 0.00 j | 0.12 ± 0.00 * | 0.21 ± 0.00 jlm | 0.29 ± 0.00 * |
| Day 12 (l) | 4.09 ± 0.02 * | 1.31 ± 0.00 km | 0.16 ± 0.00 * | 0.12 ± 0.00 m | 0.21 ± 0.00 kmn | 0.29 ± 0.00 m |
| Day 13 (m) | 4.05 ± 0.02 n | 1.30 ± 0.00 l | 0.16 ± 0.00 * | 0.12 ± 0.00 ln | 0.21 ± 0.00 kln | 0.29 ± 0.00 ln |
| Day 14 (n) | 4.01 ± 0.01 mo | 1.28 ± 0.00 o | 0.16 ± 0.00 * | 0.12 ± 0.00 m | 0.21 ± 0.00 lmo | 0.29 ± 0.00 mo |
| Day 15 (o) | 3.97 ± 0.01 n | 1.26 ± 0.00 np | 0.16 ± 0.00 * | 0.12 ± 0.00 * | 0.21 ± 0.00 np | 0.29 ± 0.00 np |
| Day 16 (p) | 3.92 ± 0.02 * | 1.26 ± 0.00 oq | 0.17 ± 0.00 * | 0.12 ± 0.00 * | 0.21 ± 0.00 oq | 0.29 ± 0.00 o |
| Day 17 (q) | 3.82 ± 0.02 r | 1.25 ± 0.00 pr | 0.17 ± 0.00 * | 0.13 ± 0.00 * | 0.21 ± 0.00 prs | 0.30 ± 0.00 r |
| Day 18 (r) | 3.79 ± 0.02 qs | 1.24 ± 0.00 qs | 0.17 ± 0.00 * | 0.13 ± 0.00 s | 0.21 ± 0.00 qs | 0.30 ± 0.00 q |
| Day 19 (s) | 3.76 ± 0.01 rt | 1.23 ± 0.00 rt | 0.17 ± 0.00 * | 0.13 ± 0.00 rt | 0.21 ± 0.00 qrt | 0.30 ± 0.00 t |
| Day 20 (t) | 3.73 ± 0.01 s | 1.23 ± 0.00 su | 0.17 ± 0.00 * | 0.13 ± 0.00 s | 0.21 ± 0.00 su | 0.30 ± 0.00 s |
| Day 21 (u) | 3.58 ± 0.04 * | 1.22 ± 0.00 tv | 0.17 ± 0.00 * | 0.13 ± 0.00 * | 0.21 ± 0.00 t | 0.30 ± 0.00 * |
| Day 22 (v) | 3.49 ± 0.03 * | 1.21 ± 0.00 u | 0.17 ± 0.00 * | 0.19 ± 0.00 * | 0.21 ± 0.00 * | 0.34 ± 0.00 * |
| Fermentation Stage | Tartaric Acid | Malic Acid | Lactic Acid | Acetic Acid | Citric Acid | Succinic Acid |
|---|---|---|---|---|---|---|
| Day 1 (a) | 5.07 ± 0.02 ef | 1.87 ± 0.01 * | 0.10 ± 0.00 * | 0.10 ± 0.00 b | 0.20 ± 0.00 * | 0.26 ± 0.00 * |
| Day 2 (b) | 5.21 ± 0.03 * | 1.82 ± 0.00 c | 0.10 ± 0.00 * | 0.10 ± 0.00 a | 0.20 ± 0.00 * | 0.29 ± 0.00 * |
| Day 3 (c) | 5.16 ± 0.03 * | 1.81 ± 0.01 b | 0.11 ± 0.00 * | 0.11 ± 0.00 * | 0.21 ± 0.00 * | 0.30 ± 0.00 * |
| Day 4 (d) | 5.11 ± 0.03 e | 1.79 ± 0.01 * | 0.12 ± 0.00 * | 0.12 ± 0.00 * | 0.21 ± 0.00 * | 0.30 ± 0.00 efg |
| Day 5 (e) | 5.07 ± 0.00 adf | 1.75 ± 0.02 * | 0.13 ± 0.00 f | 0.15 ± 0.00 * | 0.21 ± 0.00 * | 0.30 ± 0.00 dfg |
| Day 6 (f) | 5.04 ± 0.02 ae | 1.70 ± 0.02 * | 0.13 ± 0.00 eg | 0.15 ± 0.00 * | 0.21 ± 0.00 * | 0.30 ± 0.00 degh |
| Day 7 (g) | 5.00 ± 0.02 * | 1.65 ± 0.02 * | 0.13 ± 0.00 fh | 0.16 ± 0.00 * | 0.21 ± 0.00 * | 0.30 ± 0.00 defhij |
| Day 8 (h) | 4.48 ± 0.02 * | 1.62 ± 0.01 * | 0.13 ± 0.00 gi | 0.16 ± 0.00 * | 0.21 ± 0.00 i | 0.30 ± 0.00 fgijk |
| Day 9 (i) | 4.440 ±0.02 j | 1.56 ± 0.01 * | 0.13 ± 0.00 h | 0.17 ± 0.00 * | 0.21 ± 0.00 hj | 0.30 ± 0.00 ghjk |
| Day 10 (j) | 4.41 ± 0.01 i | 1.53 ± 0.01 * | 0.14 ± 0.00 * | 0.17 ± 0.00 * | 0.21 ± 0.00 ik | 0.31 ± 0.00 ghikl |
| Day 11 (k) | 4.36 ± 0.02 * | 1.50 ± 0.01 * | 0.14 ± 0.00 l | 0.18 ± 0.00 * | 0.21 ± 0.00 j | 0.31 ± 0.00 hijlm |
| Day 12 (l) | 4.24 ± 0.03 * | 1.47 ± 0.00 * | 0.14 ± 0.00 km | 0.18 ± 0.00 * | 0.21 ± 0.00 * | 0.31 ± 0.00 jkmno |
| Day 13 (m) | 4.19 ± 0.00 n | 1.46 ± 0.00 n | 0.14 ± 0.00 ln | 0.19 ± 0.00 n | 0.21 ± 0.00 n | 0.31 ± 0.00 klno |
| Day 14 (n) | 4.15 ± 0.01 mo | 1.44 ± 0.00 mop | 0.14 ± 0.00 mo | 0.19 ± 0.00 mo | 0.21 ± 0.00 mo | 0.31 ± 0.00 lmo |
| Day 15 (o) | 4.14 ± 0.00 np | 1.43 ± 0.00 npq | 0.14 ± 0.00 np | 0.19 ± 0.00 n | 0.21 ± 0.00 np | 0.31 ± 0.00 lmn |
| Day 16 (p) | 4.11 ± 0.01 oq | 1.43 ± 0.00 noqr | 0.14 ± 0.00 o | 0.20 ± 0.00 * | 0.21 ± 0.00 o | 0.31 ± 0.00 * |
| Day 17 (q) | 4.10 ± 0.00 p | 1.43 ± 0.00 oprs | 0.15 ± 0.00 * | 0.20 ± 0.00 v | 0.21 ± 0.00 * | 0.32 ± 0.00 * |
| Day 18 (r) | 4.06 ± 0.00 * | 1.43 ± 0.00 pqst | 0.15 ± 0.00 * | 0.20 ± 0.00 v | 0.21 ± 0.00 s | 0.33 ± 0.00 * |
| Day 19 (s) | 3.81 ± 0.00 * | 1.41 ± 0.00 qrt | 0.15 ± 0.00 * | 0.21 ± 0.00 * | 0.21 ± 0.00 rt | 0.33 ± 0.00 * |
| Day 20 (t) | 3.76 ± 0.01 * | 1.40 ± 0.00 rsu | 0.15 ± 0.00 * | 0.21 ± 0.00 * | 0.22 ± 0.00 s | 0.33 ± 0.00 * |
| Day 21 (u) | 3.72 ± 0.01 * | 1.39 ± 0.01 t | 0.16 ± 0.00 * | 0.212 ± 0.00 * | 0.22 ± 0.00 * | 0.34 ± 0.00 v |
| Day 22 (v) | 3.64 ± 0.03 * | 1.37 ± 0.01 * | 0.17 ± 0.00 * | 0.20 ± 0.00 qr | 0.22 ± 0.00 * | 0.34 ± 0.00 u |
Publisher’s Note: MDPI stays neutral with regard to jurisdictional claims in published maps and institutional affiliations. |
© 2021 by the authors. Licensee MDPI, Basel, Switzerland. This article is an open access article distributed under the terms and conditions of the Creative Commons Attribution (CC BY) license (https://creativecommons.org/licenses/by/4.0/).
Share and Cite
Scutarașu, E.C.; Teliban, I.V.; Zamfir, C.I.; Luchian, C.E.; Colibaba, L.C.; Niculaua, M.; Cotea, V.V. Effect of Different Winemaking Conditions on Organic Acids Compounds of White Wines. Foods 2021, 10, 2569. https://doi.org/10.3390/foods10112569
Scutarașu EC, Teliban IV, Zamfir CI, Luchian CE, Colibaba LC, Niculaua M, Cotea VV. Effect of Different Winemaking Conditions on Organic Acids Compounds of White Wines. Foods. 2021; 10(11):2569. https://doi.org/10.3390/foods10112569
Chicago/Turabian StyleScutarașu, Elena Cristina, Iulian Valentin Teliban, Cătălin Ioan Zamfir, Camelia Elena Luchian, Lucia Cintia Colibaba, Marius Niculaua, and Valeriu V. Cotea. 2021. "Effect of Different Winemaking Conditions on Organic Acids Compounds of White Wines" Foods 10, no. 11: 2569. https://doi.org/10.3390/foods10112569
APA StyleScutarașu, E. C., Teliban, I. V., Zamfir, C. I., Luchian, C. E., Colibaba, L. C., Niculaua, M., & Cotea, V. V. (2021). Effect of Different Winemaking Conditions on Organic Acids Compounds of White Wines. Foods, 10(11), 2569. https://doi.org/10.3390/foods10112569