


Abstract
Background/Objectives: Chronic periodontal inflammation and Porphyromonas gingivalis (Pg)-derived inflammatory signals have been implicated in head and neck squamous cell carcinoma (HNSCC) progression and chemotherapy responsiveness. However, whether acquired cisplatin resistance alters subsequent responses of HNSCC cells to Pg-derived lipopolysaccharide (Pg-LPS) remains unclear. This study investigated the responses of parental and cisplatin-resistant HN18 and HN17 HNSCC cells to Pg-LPS stimulation. Methods: Cisplatin-resistant sublines (HN18R and HN17R) were established by repeated exposure to cisplatin at the half-maximal inhibitory concentration (IC50). Basal proliferation was compared between parental and resistant cells, followed by Pg-LPS stimulation (0.25–2 μg/mL). Cell proliferation was assessed by MTT assay, interleukin-6 (IL-6) concentrations by enzyme-linked immunosorbent assay, nitrite concentrations as an indirect indicator of nitric oxide (NO) production by Griess assay, and matrix metalloproteinase (MMP)-2 and MMP-9 activity by gelatin zymography. Results: HN18 cells were less sensitive to cisplatin than HN17 cells, with IC50 values of approximately 60 and 30 μM, respectively. Following acquisition of cisplatin resistance, HN18R showed lower basal proliferation than HN18, whereas HN17R showed higher basal proliferation than HN17. Pg-LPS elicited distinct responses in the two resistant sublines. HN18R cells showed lower proliferation and nitrite concentrations but higher pro-MMP-2 band intensity than HN18. In contrast, HN17R exhibited greater proliferation and IL-6 concentration but lower pro-MMP-2 band intensity than HN17. No distinct MMP-9 activity was detected. Conclusions: Acquired cisplatin resistance was associated with distinct, lineage-dependent responses to Pg-LPS, highlighting heterogeneous responses of cisplatin-resistant HNSCC cells to periodontal inflammatory stimulation.
1. Introduction
Head and neck squamous cell carcinoma (HNSCC) is the predominant histological type of malignancy arising in the oral cavity and accounts for more than 90% of oral cancers [1]. Despite advances in surgery, radiotherapy, and systemic therapy, treatment failure, recurrence, and metastasis remain major clinical challenges [2]. Cisplatin (cis-diamminedichloroplatinum, CDDP) is widely used in the treatment of advanced and recurrent HNSCC; however, its therapeutic efficacy is frequently compromised by the development of acquired chemoresistance. Cisplatin resistance is a multifactorial process involving enhanced DNA repair, altered drug accumulation and efflux, dysregulated apoptosis, epithelial–mesenchymal transition, and activation of pro-survival signaling pathways [3,4].
In addition to tumor-intrinsic mechanisms, accumulating evidence suggests that chronic inflammation within the oral microenvironment may influence HNSCC development and progression [5]. Periodontitis, a chronic inflammatory disease driven by dysbiotic periodontal microbiota, has been increasingly associated with oral and head and neck cancers in epidemiological studies. Systematic reviews and meta-analyses have demonstrated a significant association between periodontal disease and head and neck cancer, while more recent evidence specifically showed a positive association with HNSCC, particularly among individuals with severe periodontal disease [6,7]. Although these epidemiological findings do not establish causality, they support a potential link between chronic periodontal inflammation and oral carcinogenesis and provide a clinical rationale for investigating the biological interactions between periodontal pathogens and oral cancer cells.
Porphyromonas gingivalis (Pg), a major periodontal pathogen, has been implicated in oral cancer progression through chronic inflammatory stimulation and activation of tumor-promoting signaling pathways [8,9]. Lipopolysaccharide derived from Pg (Pg-LPS) can activate Toll-like receptor 4 (TLR4)-dependent signaling and downstream NF-κB pathways, thereby modulating cancer cell survival, migration, and inflammatory responses [10]. Previous studies have suggested an interaction between bacterial inflammatory stimulation and chemotherapy responsiveness in oral cancer cells. LPS-mediated TLR4 activation has been shown to reduce cisplatin-induced apoptosis in HNSCC cells [11]. Prolonged exposure to Pg can also promote aggressive phenotypes and resistance to chemotherapeutic agents [12]. More recently, Pg-LPS was reported to attenuate 5-fluorouracil-induced cytotoxicity in HNSCC cells through activation of TLR4/NF-κB signaling [10]. Collectively, these findings suggest that periodontal pathogen-derived inflammatory signals may influence not only tumor progression but also the response of oral cancer cells to anticancer therapy.
Among the biological mediators associated with LPS-induced inflammation, interleukin-6 (IL-6) and nitric oxide (NO) are particularly relevant to HNSCC progression and chemoresistance. IL-6 promotes cancer cell proliferation, survival, epithelial–mesenchymal transition, and chemoresistance, particularly through activation of the JAK/STAT3 signaling pathway [13,14]. NO exerts context- and concentration-dependent effects on cancer cells and has also been implicated in cellular responses to cisplatin [15,16]. In addition, matrix metalloproteinases (MMPs), particularly MMP-2 and MMP-9, contribute to extracellular matrix remodeling [17] and may be modulated by periodontal pathogen-derived inflammatory stimulation [18].
Despite growing evidence linking periodontal inflammation, Pg-LPS signaling, and chemotherapy responsiveness, it remains unclear whether HNSCC cells with acquired cisplatin resistance respond differently to Pg-LPS compared with their parental counterparts. Furthermore, whether such responses differ between tumor cells derived from primary and metastatic sites remains poorly understood. Addressing this question is particularly relevant because acquired chemoresistance can be accompanied by phenotypic reprogramming [19], potentially altering how cancer cells respond to inflammatory signals within the tumor microenvironment. Therefore, the present study established cisplatin-resistant sublines from the isogenic primary HN18 and metastatic HN17 HNSCC cell lines, designated HN18R and HN17R, respectively, and compared their responses to Pg-LPS with those of their parental counterparts. Cell proliferation, IL-6 concentration, nitrite concentrations as an indirect indicator of NO production, and gelatinolytic MMP profiles were evaluated to determine whether acquired cisplatin resistance is associated with distinct proliferative, inflammatory, and extracellular matrix-remodeling responses to periodontal pathogen-derived inflammatory stimulation.
2. Materials and Methods
2.1. Culture of Human Primary and Metastatic HNSCC
The isogenic HNSCC cell lines representing the primary and metastatic sites from the same patient were initially established by Ensley J. [20] and were kindly provided by Professor Silvio Gutkind from the Moores Cancer Center, Department of Pharmacology, University of California San Diego (UCSD). HN18 cells were derived from primary tongue lesions, whereas HN17 cells were obtained from neck dissection showing metastasis from the same patient (T2N2M0 stage). HN18 and HN17 cells were cultured in Dulbecco’s Modified Eagle’s Medium (DMEM) (Gibco™, Thermo Fisher Scientific, Grand Island, NY, USA) supplemented with 10% fetal bovine serum (FBS) and 1% penicillin-streptomycin-amphotericin (both from Gibco™) at 37 °C in a humidified 5% CO2 incubator.
2.2. Induction of Cisplatin Resistance in Primary and Metastatic HNSCC Cells
Cisplatin resistance was induced by repeated exposure to the IC50 concentration of cisplatin (Sigma-Aldrich; Merck KGaA, Darmstadt, Germany), which was initially determined using the 3-(4,5-dimethylthiazol-2-yl)-2,5-diphenyltetrazolium bromide (MTT) (Sigma-Aldrich) assay. Briefly, HN18 and HN17 cells were seeded in 96-well plates at densities of 10,000 cells/well and incubated overnight at 37 °C to allow cell adherence and recovery. Cells were then treated with increasing concentrations of cisplatin for 72 h. Following cisplatin treatment, the culture medium was removed and replaced with 150 µL of fresh working medium and 50 µL of MTT solution (2 mg/mL in PBS; Sigma-Aldrich). The cells were then incubated for 4 h at 37 °C. The resulting violet formazan crystals were dissolved in 200 µL of dimethyl sulfoxide (DMSO) (Sigma-Aldrich) and 25 µL of glycine buffer, and absorbance was measured at 570 nm using a microplate reader (Tecan Trading, Salzburg, Austria). Cell viability was expressed as a percentage relative to untreated control cells, which were defined as 100%, and the IC50 value was determined as the concentration that reduced cell viability by 50%.
For resistance induction, HN18 and HN17 cells were seeded in 6-well plates at a density of 500,000 cells/well and serum-starved overnight prior to treatment with cisplatin at the IC50 concentration for 72 h. After treatment, the medium was replaced with complete medium, and the cells were allowed to recover until they reached approximately 90% confluence. The surviving cells were then subjected to a second round of cisplatin treatment under the same conditions. Cells that survived two cycles of IC50 cisplatin exposure were considered cisplatin-resistant and were designated as HN18R and HN17R, respectively. Cisplatin resistance was subsequently confirmed using the MTT assay under the same conditions described above.
2.3. LPS Stimulation and Proliferation Assay
Parental HN18 and HN17 cells, along with their cisplatin-resistant counterparts (HN18R and HN17R), were seeded in 96-well plates at a density of 5000 cells/well and serum-starved overnight. Cells were then cultured in the absence or presence of Pg-LPS (InvivoGen, San Diego, CA, USA) at concentrations of 0.25, 0.5, 1, and 2 µg/mL in serum-free medium for 48 h. Basal proliferation of parental and cisplatin-resistant cells was compared after 48 h of culture in the absence of Pg-LPS. Cell proliferation was assessed using the MTT assay as described in Section 2.2.
To enable direct comparisons between parental and cisplatin-resistant cells, cell proliferation was expressed relative to the untreated parental control of each cell-line pair, which was defined as 100%. Specifically, untreated HN18 cells served as the reference for both HN18 and HN18R cells, whereas untreated HN17 cells served as the reference for both HN17 and HN17R cells. Relative cell proliferation was calculated using the following formula [21]:
Cell proliferation (%) = (Abs570 of experimental group/Abs570 of untreated parental control) × 100.
2.4. IL-6 Production Quantification
Parental HN18 and HN17 cells and their cisplatin-resistant counterparts (HN18R and HN17R) were seeded in 6-well plates at 500,000 cells/well and treated with Pg-LPS (0, 0.25, 0.5, 1, and 2 µg/mL) in serum-free medium for 72 h. Conditioned media were collected and aliquoted for IL-6, NO, and MMP activity assays. Total protein concentrations were measured using a Pierce™ BCA Protein Assay Kit (Thermo Fisher Scientific, Waltham, MA, USA). IL-6 concentrations were determined using a human IL-6 ELISA kit (R&D Systems, Minneapolis, MN, USA) according to the manufacturer’s instructions and calculated from a standard curve generated using known IL-6 concentrations and their corresponding optical density values.
2.5. Determination of NO Production by Griess Reagent
Nitric oxide (NO) production was indirectly assessed by measuring nitrite accumulation in the conditioned medium described in Section 2.4 using the Griess Reagent System (Promega, Madison, WI, USA). Briefly, 100 µL of conditioned medium was mixed with 100 µL of Griess reagent, and absorbance was measured at 550 nm. Nitrite concentrations were calculated from a sodium nitrite standard curve.
2.6. MMP Activity by Gelatin Zymography
Gelatin zymography was performed to evaluate the activity of MMPs using the conditioned medium described in Section 2.4. Samples were centrifuged at 1000× g at 4 °C for 10 min. Equal volumes of conditioned medium (20 µL) were mixed with 5 µL of 5X non-reducing sample buffer and loaded onto 10% SDS-PAGE gels containing 0.2% gelatin (Bloom 300, Sigma-Aldrich). Following electrophoresis, gels were washed with 2.5% Triton X-100 (Sigma-Aldrich) for 30 min at 37 °C, incubated overnight at 37 °C in developing buffer, stained with 0.5% Coomassie Brilliant Blue G-250 (Sigma-Aldrich) in 30% methanol and 10% glacial acetic acid (Sigma-Aldrich) for 30 min, and destained using the same solution without dye. Gelatinolytic bands were visualized using a G:BOX gel documentation system (Syngene, Frederick, MD, USA) and band intensities were quantified using ImageJ software (version 1.54; National Institutes of Health, Bethesda, MD, USA). Band intensities were measured using consistent regions of interest with background subtraction. Conditioned medium from HT1080 fibrosarcoma cells served as a positive control [22].
2.7. Statistical Analysis
All assays were performed in three independent experiments (n = 3). Technical replicate measurements within each independent experiment were averaged to obtain a single value per experimental condition. These independent experimental values were used for statistical analysis, and the results are presented as mean ± SEM. Data were analyzed using GraphPad Prism version 11 (GraphPad Software, San Diego, CA, USA). Multiple-group comparisons were performed using one-way analysis of variance (ANOVA) followed by Dunnett’s multiple comparison test to compare each treatment group with its respective untreated control. Direct comparisons between two groups, including the first and second cisplatin induction cycles and parental versus cisplatin-resistant cells at corresponding Pg-LPS concentrations, were performed using unpaired Student’s t-tests. A p-value < 0.05 was considered statistically significant.
3. Results
3.1. Cisplatin Cytotoxicity
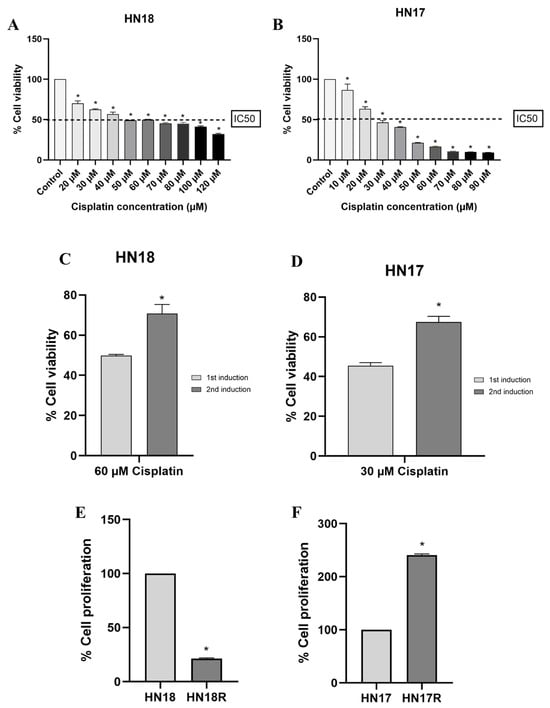
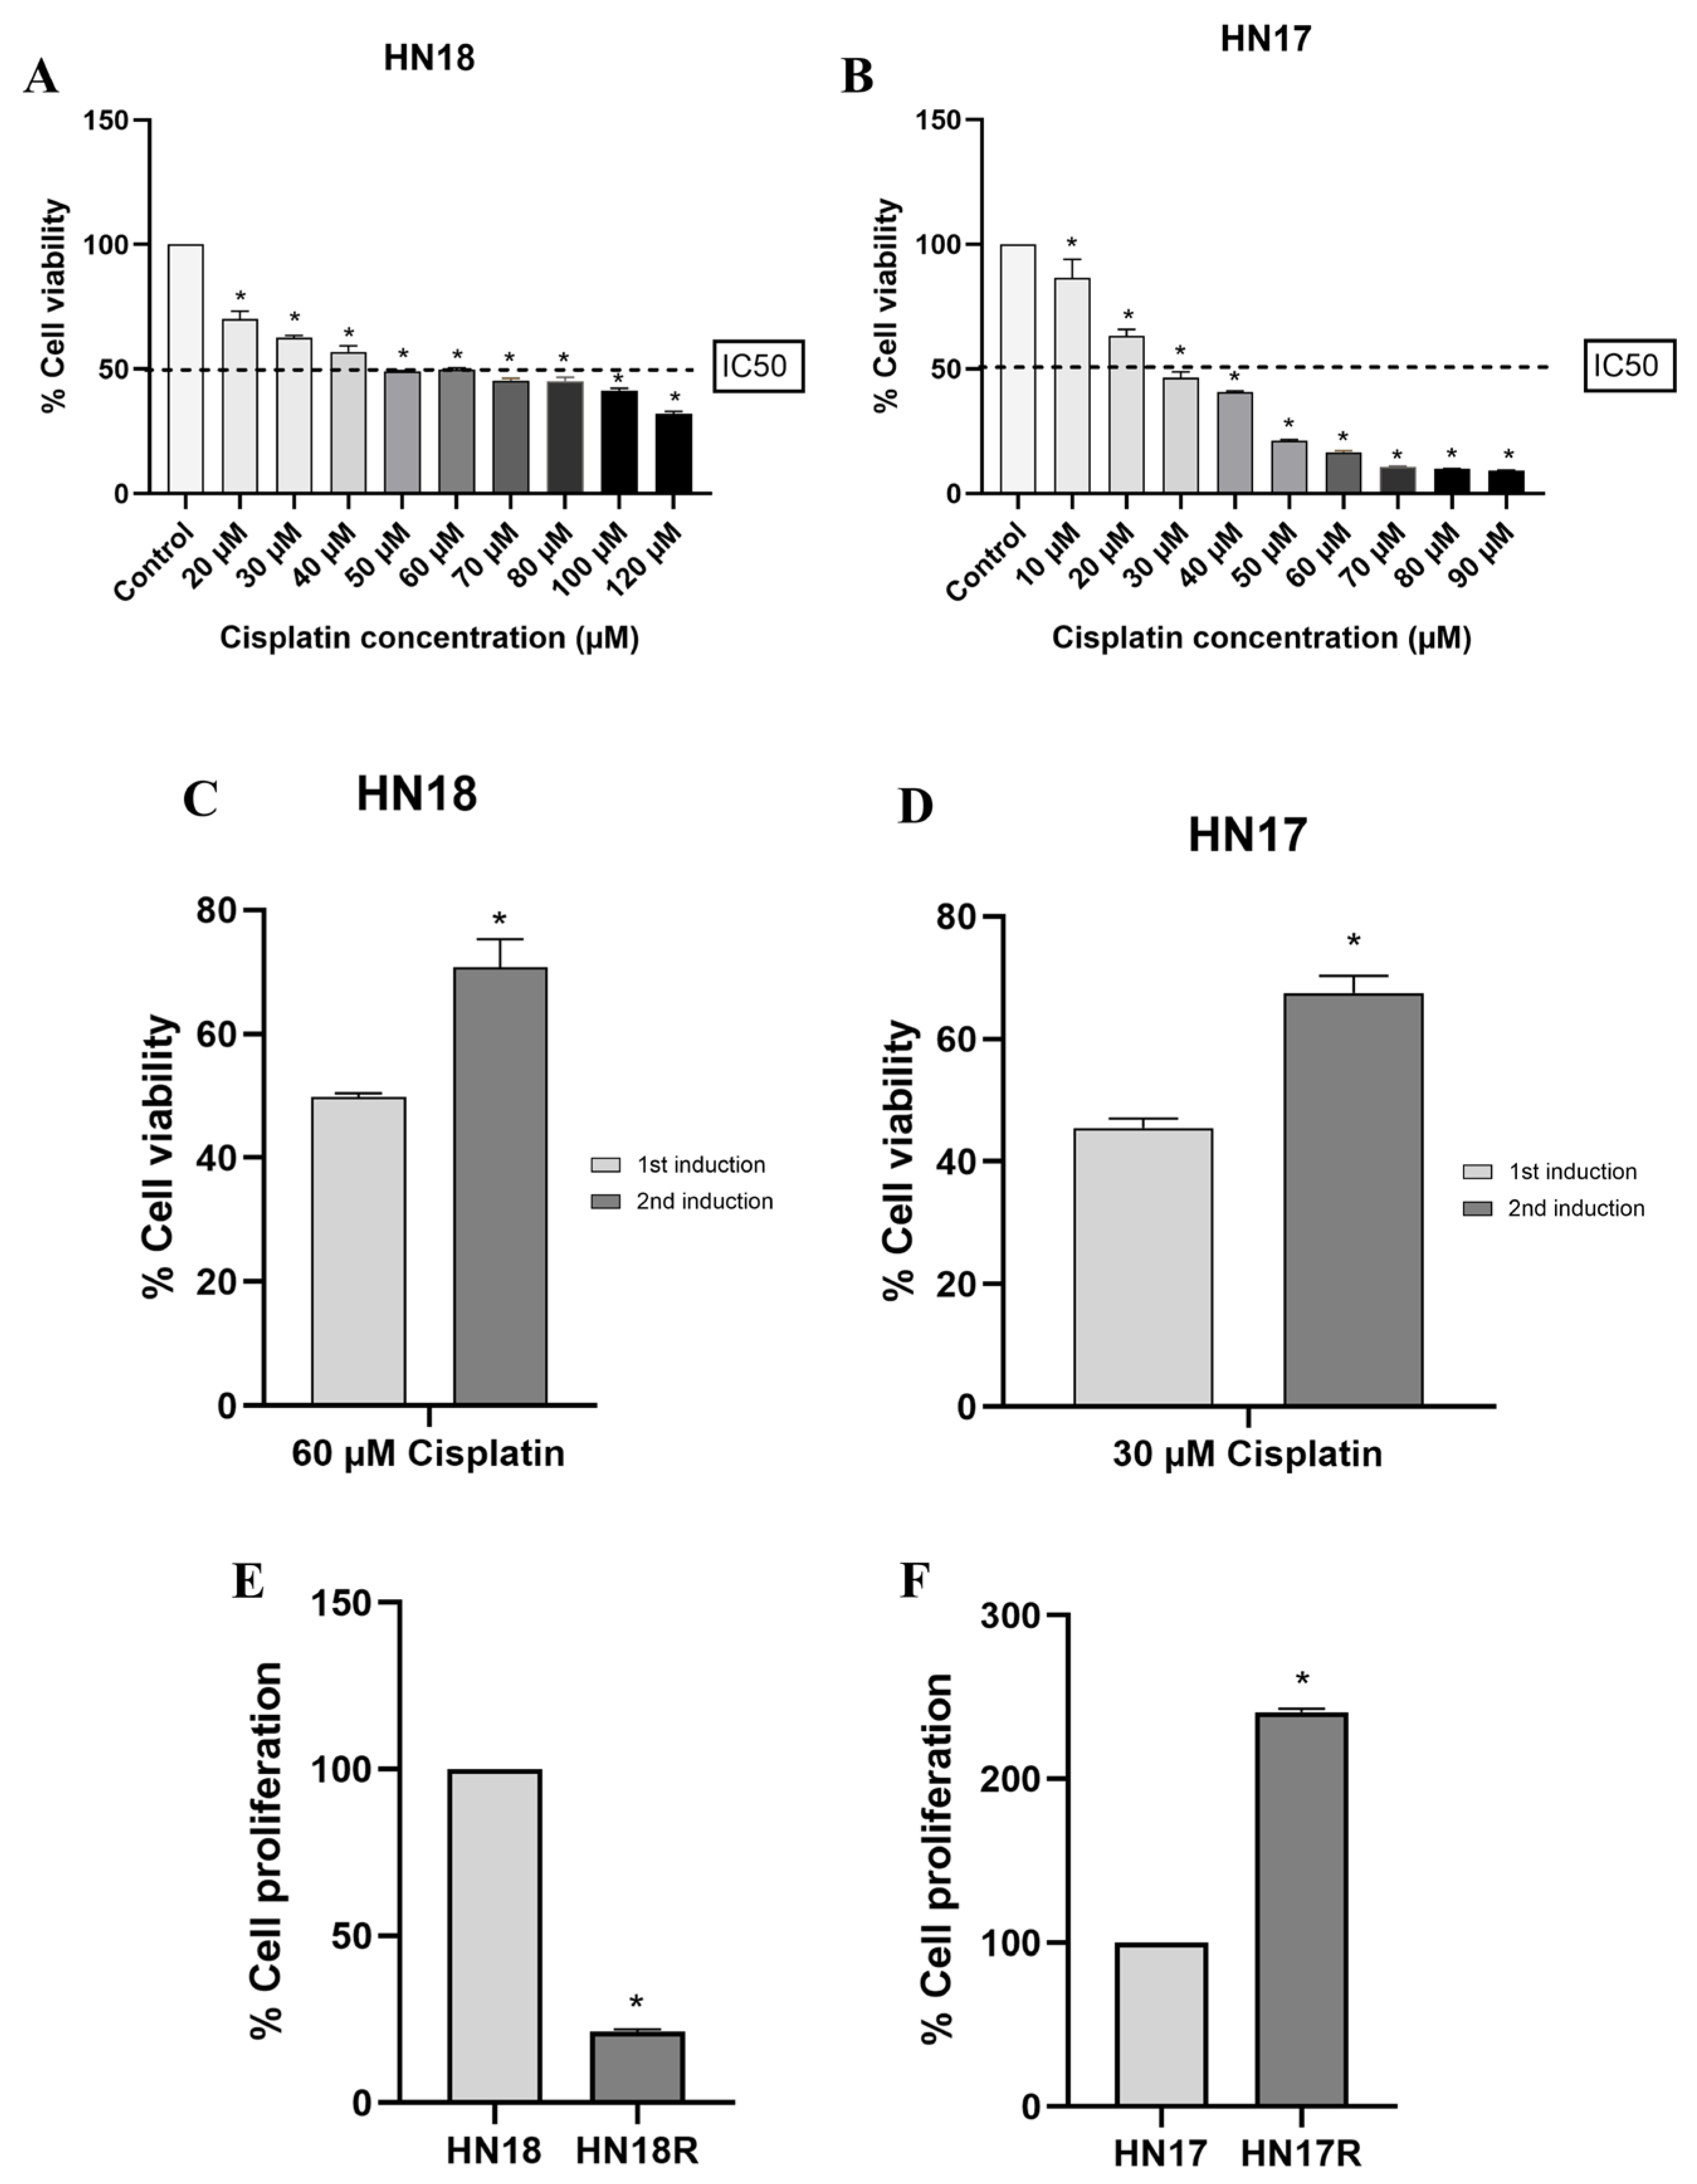
HN18 and HN17 cells showed concentration-dependent reductions in cell viability following cisplatin treatment. The IC50 values were approximately 60 μM for HN18 and 30 μM for HN17 cells, and these concentrations were subsequently used to induce cisplatin resistance (Figure 1A,B).
Figure 1.
Establishment and characterization of cisplatin-resistant HNSCC cells. Cisplatin cytotoxicity in HN18 (A) and HN17 (B) cells following treatment with increasing cisplatin concentrations. The dashed line indicates 50% cell viability (IC50), corresponding to approximately 60 μM for HN18 and 30 μM for HN17 cells. Cisplatin resistance was confirmed by increased cell viability following repeated exposure to the respective IC50 concentrations in HN18 (C) and HN17 (D) cells. Basal proliferation of parental and cisplatin-resistant HN18/HN18R (E) and HN17/HN17R (F) cells was assessed after 48 h of culture in the absence of Pg-LPS. Data are presented as mean ± SEM from three independent experiments (n = 3). Statistical significance was assessed using one-way ANOVA followed by Dunnett’s multiple comparison test (A,B) or an unpaired Student’s t-test (C–F). * p < 0.05 versus the untreated control (A,B), first induction (C,D), or corresponding parental cells (E,F).
3.2. Confirmation of Cisplatin Resistance
Following two cycles of cisplatin exposure and recovery, cell viability upon re-exposure to the respective IC50 concentrations was significantly higher after the second induction cycle than after the first cycle in both HN18 and HN17 cells, supporting the successful establishment of the cisplatin-resistant sublines HN18R and HN17R (Figure 1C,D).
3.3. Basal Proliferation of Parental and Cisplatin-Resistant Cells
At 48 h in the absence of Pg-LPS, HN18R cells showed significantly lower basal proliferation than HN18 cells, whereas HN17R cells showed significantly higher basal proliferation than HN17 cells (Figure 1E,F).
3.4. Effects of Pg-LPS on Cell Proliferation
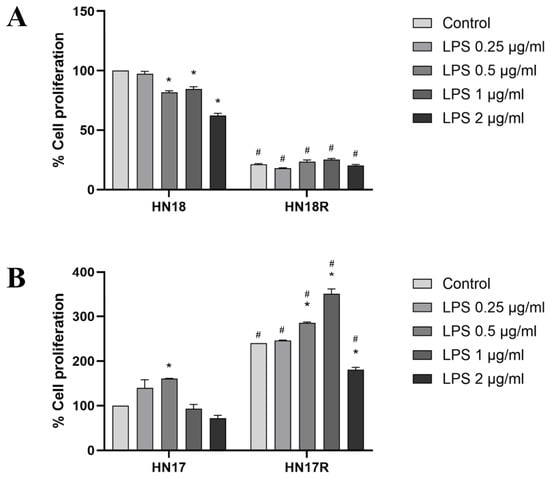
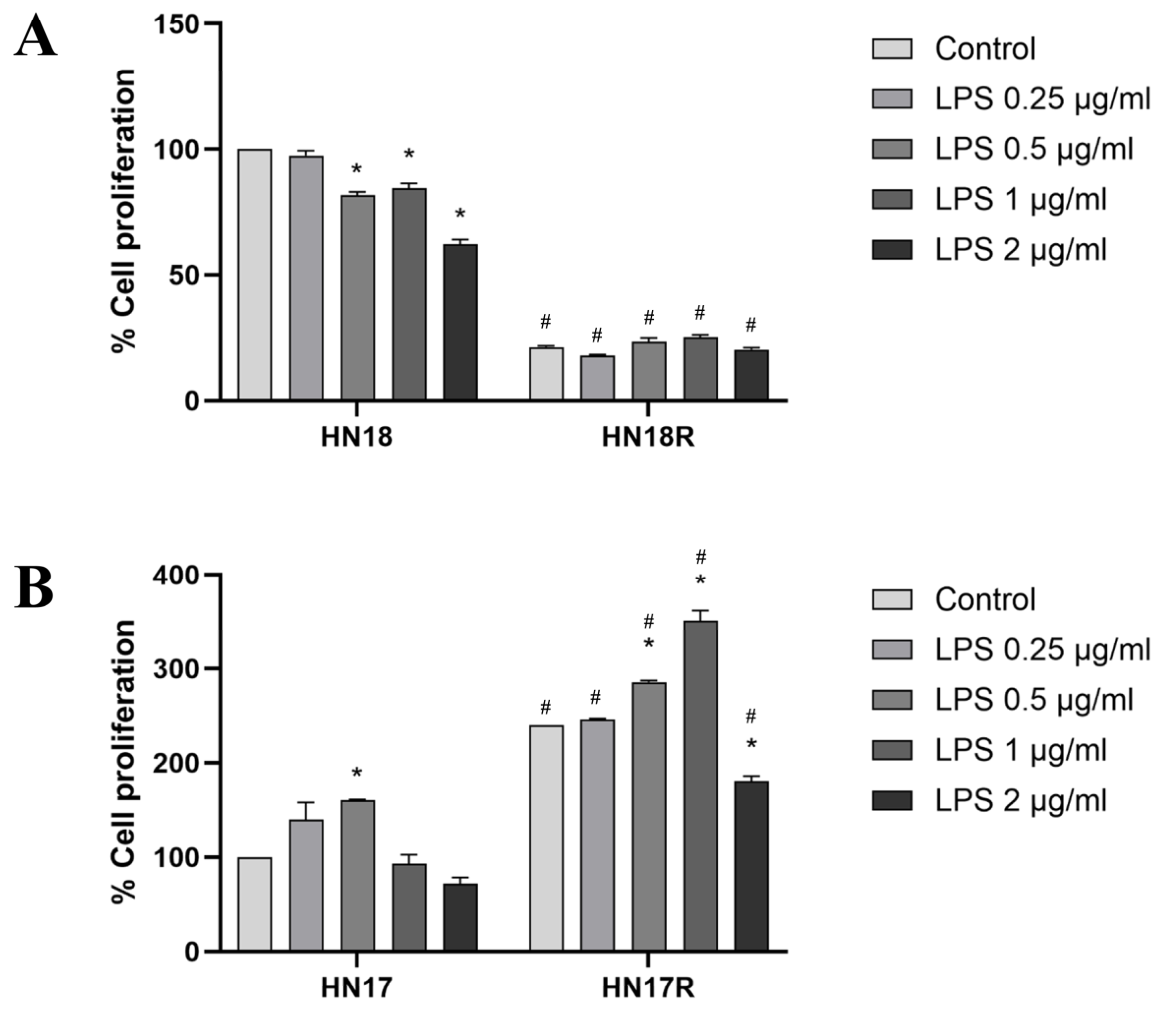
At 48 h, Pg-LPS significantly reduced HN18 cell proliferation at 0.5–2 µg/mL compared with the untreated control (p < 0.05), whereas no significant changes were observed in HN18R cells. HN18R cells showed significantly lower proliferation than HN18 cells at all Pg-LPS concentrations, including the untreated control (p < 0.05) (Figure 2A).
Figure 2.
Effects of Pg-LPS on proliferation of parental and cisplatin-resistant HNSCC cells. Cell proliferation of HN18 and HN18R (A) and HN17 and HN17R (B) cells was assessed after 48 h of treatment with Pg-LPS (0.25–2 μg/mL) using the MTT assay. Cell proliferation was expressed relative to untreated HN18 cells (100%) for both HN18 and HN18R, and untreated HN17 cells (100%) for both HN17 and HN17R. Data are presented as mean ± SEM from three independent experiments (n = 3). Statistical significance was assessed using one-way ANOVA followed by Dunnett’s multiple comparison test for comparisons with the untreated control within each cell line and an unpaired Student’s t-test for comparisons between parental and cisplatin-resistant cells at corresponding Pg-LPS concentrations. * p < 0.05 versus the untreated control within the same cell line; # p < 0.05 versus the corresponding parental cells at the same Pg-LPS concentration.
In HN17 cells, Pg-LPS significantly increased proliferation at 0.5 µg/mL, whereas HN17R cells showed significant increases at 0.5–2 µg/mL compared with their respective untreated controls (p < 0.05). HN17R cells exhibited significantly higher proliferation than HN17 cells at all Pg-LPS concentrations, including the untreated control (p < 0.05) (Figure 2B).
3.5. Effects of Pg-LPS on IL-6 Production
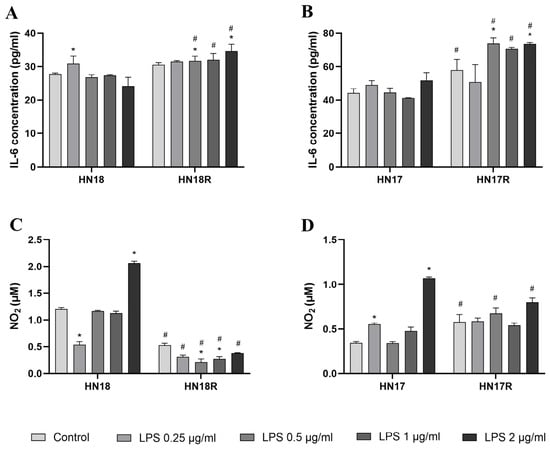
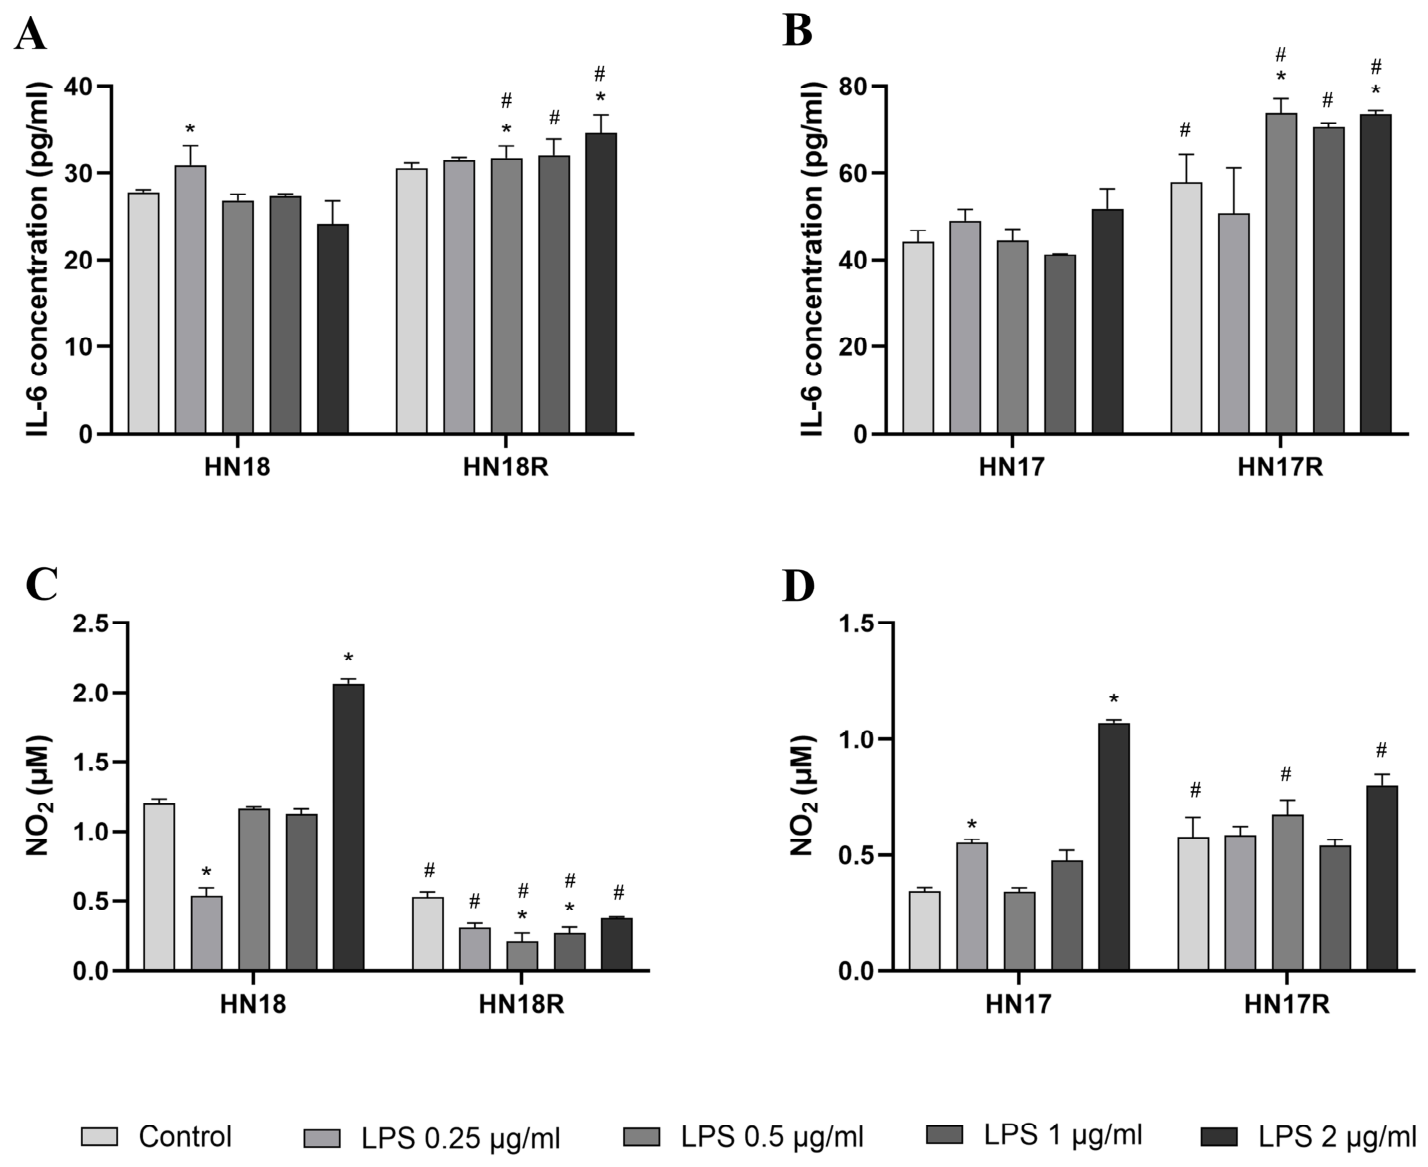
At 72 h, Pg-LPS significantly increased IL-6 concentrations in HN18 cells at 0.25 µg/mL and in HN18R cells at 0.5 and 2 µg/mL compared with their respective untreated controls (p < 0.05). IL-6 concentrations were significantly higher in HN18R than in HN18 cells at 0.5, 1, and 2 µg/mL (p < 0.05) (Figure 3A).
Figure 3.
Effects of Pg-LPS on IL-6 and nitric oxide production in parental and cisplatin-resistant HNSCC cells. IL-6 concentrations in HN18/HN18R (A) and HN17/HN17R (B) cells were determined by ELISA, whereas nitrite concentrations, as an indirect measure of nitric oxide (NO) production, were assessed in HN18/HN18R (C) and HN17/HN17R (D) cells using the Griess assay after 72 h of treatment with Pg-LPS (0–2 µg/mL). Data are presented as mean ± SEM from three independent experiments (n = 3). Statistical significance was assessed using one-way ANOVA followed by Dunnett’s multiple comparison test for comparisons with the untreated control within each cell line and an unpaired Student’s t-test for comparisons between parental and cisplatin-resistant cells at corresponding Pg-LPS concentrations. * p < 0.05 versus the untreated control within the same cell line; # p < 0.05 versus the corresponding parental cells at the same Pg-LPS concentration.
In HN17 cells, Pg-LPS did not significantly alter IL-6 concentrations at any tested concentration. In contrast, HN17R cells showed significant increases at 0.5 and 2 µg/mL compared with the untreated control (p < 0.05). IL-6 concentrations were significantly higher in HN17R than in HN17 cells under untreated conditions and at 0.5, 1, and 2 µg/mL (p < 0.05) (Figure 3B).
3.6. Effects of Pg-LPS on NO Production
At 72 h, Pg-LPS significantly increased nitrite concentrations in HN18 cells at 2 µg/mL compared with the untreated control (p < 0.05), whereas HN18R cells showed significantly lower nitrite concentrations than HN18 cells under all experimental conditions (p < 0.05) (Figure 3C).
Similarly, Pg-LPS significantly increased nitrite concentrations in HN17 cells at 2 µg/mL compared with the untreated control (p < 0.05), whereas HN17R cells showed no significant changes across the tested concentrations. Compared with HN17 cells, HN17R cells exhibited significantly higher nitrite concentrations under untreated conditions and at 0.5 µg/mL, but significantly lower concentrations at 2 µg/mL (p < 0.05) (Figure 3D).
3.7. MMP Activity by Gelatin Zymography
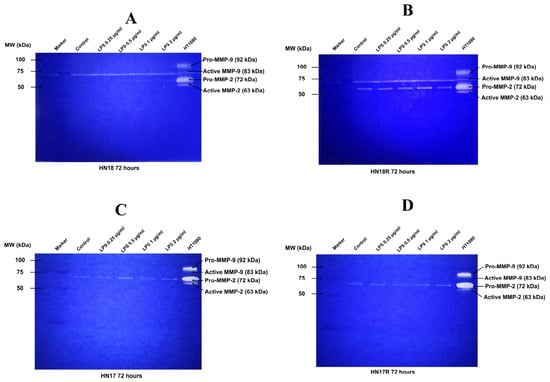
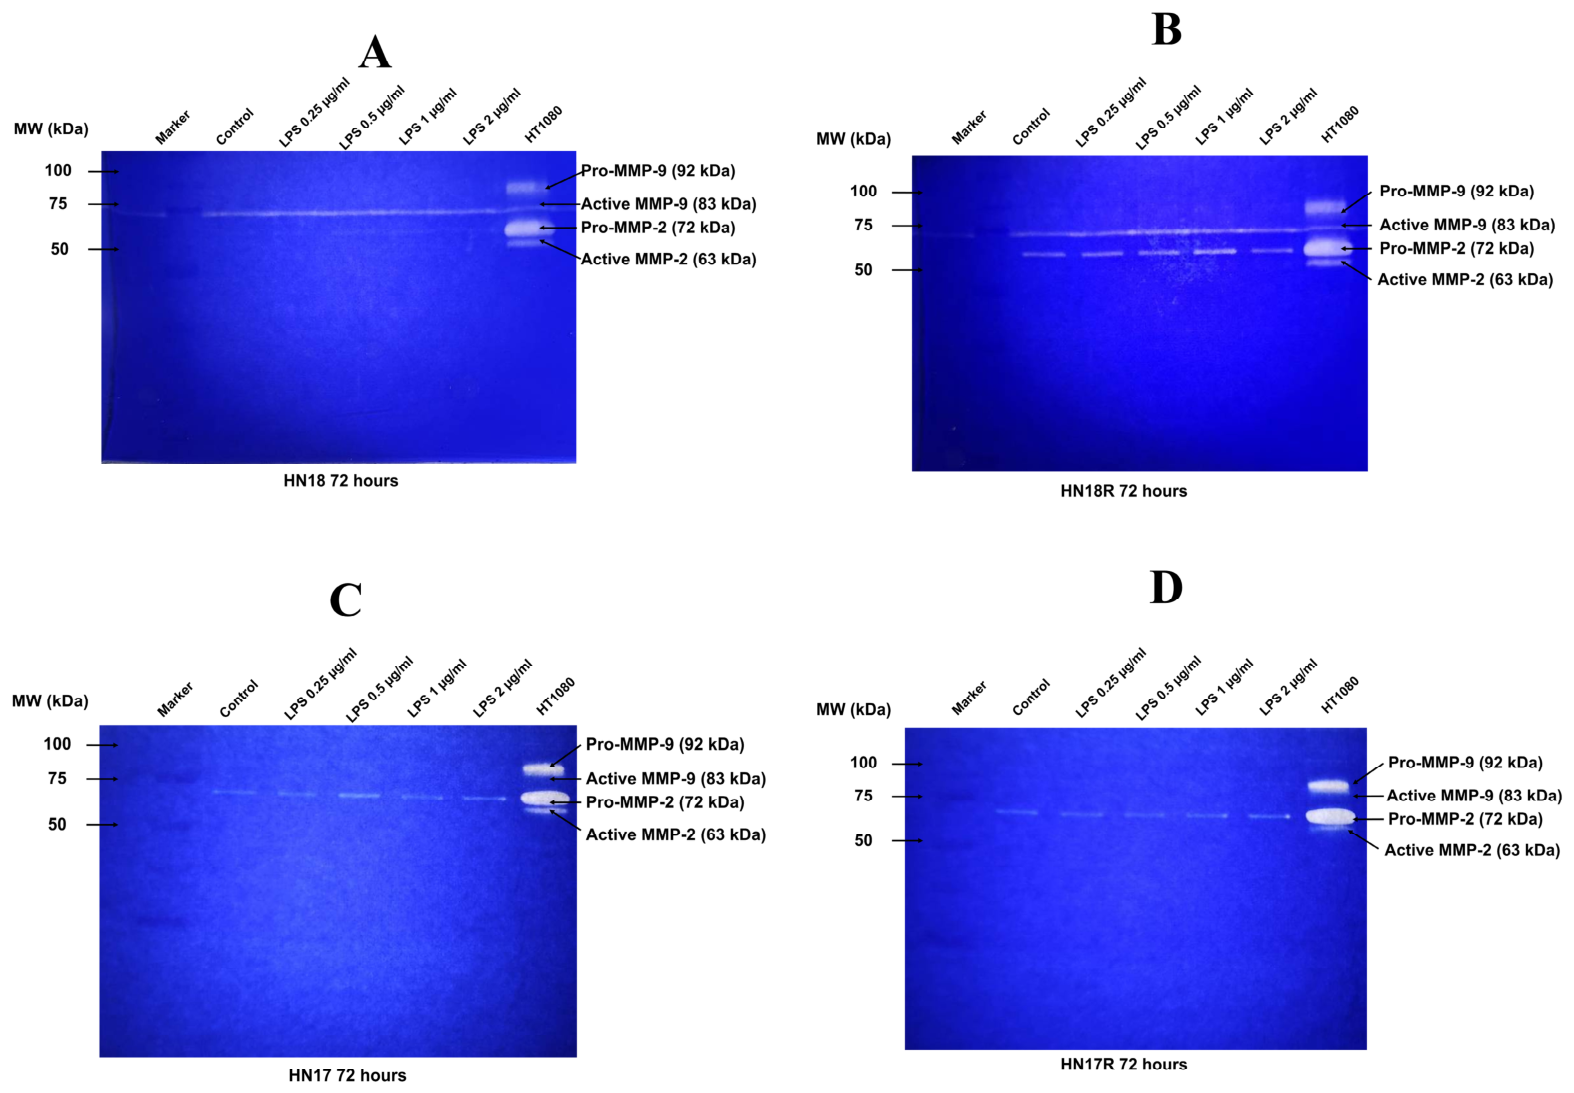
Gelatin zymography revealed a distinct band corresponding to pro-MMP-2 (approximately 72 kDa), whereas no distinct bands corresponding to active MMP-2 or MMP-9 were detected in the HNSCC samples (Figure 4). Therefore, only pro-MMP-2 band intensity was quantified.
Figure 4.
Representative gelatin zymograms of parental and cisplatin-resistant HNSCC cells following Pg-LPS treatment. Gelatinolytic bands in conditioned medium from HN18 (A), HN18R (B), HN17 (C), and HN17R (D) cells were examined after 72 h of treatment with Pg-LPS (0–2 µg/mL). A distinct band corresponding to pro-MMP-2 (approximately 72 kDa) was detected, whereas no distinct bands corresponding to active MMP-2 or MMP-9 were observed in the HNSCC samples. Conditioned medium from HT1080 fibrosarcoma cells served as a positive control. Pro-MMP-2 band intensities were quantified separately and are presented in Figure 5.
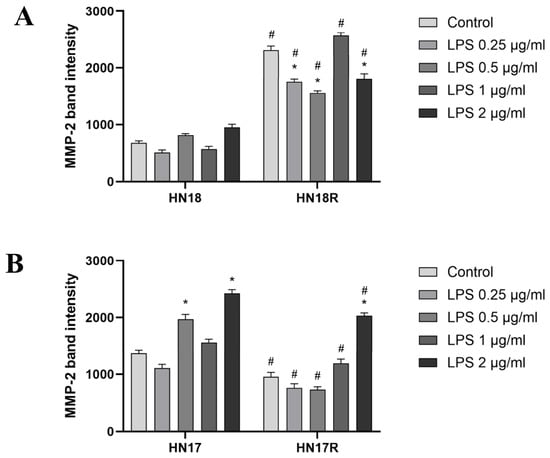
At 72 h, Pg-LPS did not significantly alter pro-MMP-2 band intensity in HN18 cells, whereas HN18R cells showed significant reductions at 0.25, 0.5, and 2 µg/mL compared with the untreated control (p < 0.05). Pro-MMP-2 band intensities were significantly higher in HN18R than in HN18 cells under all experimental conditions (p < 0.05) (Figure 5A).
Figure 5.
Effects of Pg-LPS on pro-MMP-2 band intensity in parental and cisplatin-resistant HNSCC cells. Pro-MMP-2 (approximately 72 kDa) band intensities in HN18/HN18R (A) and HN17/HN17R (B) cells were quantified from gelatin zymograms using ImageJ after 72 h of treatment with Pg-LPS (0–2 µg/mL). Equal volumes of conditioned medium were loaded, and band intensities were measured using consistent regions of interest with background subtraction. Data are presented as mean ± SEM from three independent experiments (n = 3). Statistical significance was assessed using one-way ANOVA followed by Dunnett’s multiple comparison test for comparisons with the untreated control within each cell line and an unpaired Student’s t-test for comparisons between parental and cisplatin-resistant cells at corresponding Pg-LPS concentrations. * p < 0.05 versus the untreated control within the same cell line; # p < 0.05 versus the corresponding parental cells at the same Pg-LPS concentration.
In HN17 cells, pro-MMP-2 band intensity increased significantly at 0.5 and 2 µg/mL, whereas HN17R cells showed a significant increase only at 2 µg/mL compared with the untreated control (p < 0.05). Pro-MMP-2 band intensities were significantly lower in HN17R than in HN17 cells under all experimental conditions (p < 0.05) (Figure 5B).
4. Discussion
The present study demonstrated that Pg-LPS elicited distinct biological responses in parental and cisplatin-resistant HNSCC cells, with response patterns varying according to both tumor lineage and resistance status. Previous studies have shown that Pg and Pg-LPS can promote tumor-associated inflammatory signaling and influence chemotherapy responsiveness in oral cancer cells [10,11]. The present study extends these observations by examining cells that had already acquired cisplatin resistance and comparing their subsequent responses to Pg-LPS with those of their parental counterparts. The divergent patterns observed between the HN18/HN18R and HN17/HN17R pairs suggest that acquired chemoresistance may be associated with lineage-dependent phenotypic adaptation rather than a uniform biological response.
Acquisition of cisplatin resistance was accompanied by opposing basal proliferative characteristics. HN18R cells showed lower basal proliferation than HN18 cells, whereas HN17R cells showed higher proliferation than HN17 cells. Pg-LPS further revealed distinct proliferative responses: HN18 proliferation decreased at several concentrations, whereas HN18R cells showed no significant changes following Pg-LPS treatment and maintained lower proliferation than HN18 cells. In contrast, HN17R cells exhibited greater proliferation than HN17 cells, with Pg-LPS further increasing proliferation, particularly at several concentrations. Cisplatin resistance is known to involve cellular reprogramming beyond drug tolerance, including alterations in survival signaling, apoptosis, and epithelial–mesenchymal plasticity [4,19]. A previous study also reported differential responses to cisplatin treatment between parental and cisplatin-resistant HNSCC cells, further highlighting the biological differences associated with acquired resistance [23]. Such adaptations may therefore modify subsequent responses to inflammatory stimulation. The enhanced proliferative response to Pg-LPS in HN17R cells is also consistent with previous evidence that periodontal bacterial stimulation can activate tumor-promoting pathways and reduce chemotherapy responsiveness in oral cancer cells [10,11,12].
The inflammatory mediator profiles further supported differential adaptation associated with acquired cisplatin resistance. Pg-LPS induced significant IL-6 concentration increases at selected concentrations in both resistant sublines, with HN17R generally exhibiting higher IL-6 concentration than HN17 and the HN17 lineage showing greater IL-6 concentration overall. IL-6 is an important mediator of tumor-promoting inflammation, with IL-6/JAK/STAT3 signaling implicated in cancer cell proliferation, survival, epithelial–mesenchymal transition, and therapeutic resistance [13,14]. The concurrent enhancement of proliferation and IL-6 concentration in HN17R cells may therefore reflect an inflammation-responsive phenotype, although a causal relationship between IL-6 and proliferation cannot be established from the present study.
Nitrite concentrations, as an indirect indicator of NO production, showed a distinct response pattern. HN18 cells showed significantly increased nitrite concentrations at the highest Pg-LPS concentration, whereas HN18R cells showed lower nitrite concentrations than HN18 cells. Similarly, HN17 cells showed significantly increased nitrite concentrations at 2 µg/mL Pg-LPS, whereas HN17R cells showed no significant changes in nitrite concentrations following Pg-LPS treatment, despite higher basal levels. NO exerts concentration- and context-dependent effects in cancer, ranging from modulation of cell survival and proliferation to cytotoxicity at higher concentrations [16,24]. The altered nitrite responses in the resistant cells may therefore represent another aspect of resistance-associated phenotypic adaptation. However, the relationship between NO and the other inflammatory responses observed here requires further investigation.
Pg-LPS also differentially modulated pro-MMP-2 band intensity. Although Pg-LPS did not significantly alter pro-MMP-2 band intensity in HN18 cells, band intensity was higher in HN18R cells than in HN18 cells. Conversely, pro-MMP-2 band intensity was lower in HN17R than in HN17 cells, although Pg-LPS significantly increased pro-MMP-2 band intensity at selected concentrations in HN17 cells and at 2 µg/mL in HN17R cells. MMP-2 contributes to extracellular matrix degradation and tumor invasion, while P. gingivalis has been reported to enhance MMP-associated invasive responses in oral cancer cells [17,18]. These contrasting patterns suggest that acquisition of cisplatin resistance does not uniformly increase pro-MMP-2 band intensity. Rather, the HN18R and HN17R sublines appear to acquire different combinations of proliferative, inflammatory, and extracellular matrix-related characteristics.
Collectively, the findings support heterogeneous biological adaptation following acquired cisplatin resistance. HN18R was characterized by lower proliferation and nitrite concentrations but higher pro-MMP-2 band intensity relative to its parental counterpart, whereas HN17R displayed a predominantly proliferative and inflammatory phenotype, characterized by increased proliferation and IL-6 concentrations but generally lower pro-MMP-2 band intensity. These phenotypic differences were further evident following Pg-LPS exposure, raising the possibility that periodontal pathogen-derived inflammatory signals may differentially influence chemoresistant tumor cell populations and potentially contribute to heterogeneous tumor behavior following chemotherapy. Nevertheless, the present study has several limitations. First, IL-6 and nitrite concentrations and pro-MMP-2 band intensity were measured from fixed volumes of conditioned medium without normalization to viable cell number or cellular protein content at 72 h. Therefore, differences between cell lines may partly reflect variations in cell number rather than changes in mediator production or secretion on a per-cell basis. Second, although increased cell viability following repeated cisplatin exposure supported the acquisition of resistance, subsequent IC50 measurements and assessments of resistance stability after culture without cisplatin were not performed. Thus, the long-term stability of the resistant phenotype remains to be established. Finally, the present study used an in vitro model derived from a single isogenic primary–metastatic HNSCC pair, and the underlying signaling pathways were not directly investigated. Additional HNSCC models, mechanistic inhibition studies, and clinically relevant models of periodontal inflammation will be required to determine the translational significance of these findings.
5. Conclusions
In conclusion, acquired cisplatin resistance was associated with distinct, lineage-dependent biological adaptations that influenced subsequent responses to Pg-LPS. HN18R cells showed lower proliferation and nitrite concentrations but higher pro-MMP-2 band intensity, whereas HN17R cells exhibited increased proliferation and IL-6 concentration but lower pro-MMP-2 band intensity. These findings highlight the heterogeneous responses of cisplatin-resistant HNSCC cells to periodontal pathogen-derived inflammatory stimulation and warrant further investigation in additional HNSCC models.
Author Contributions
Conceptualization, K.P., N.A. and A.P.; methodology, K.P., N.A. and A.P.; validation, K.P. and P.A.; formal analysis, K.P. and P.A.; investigation, N.A. and A.P.; resources, K.P.; writing—original draft preparation, K.P., N.A. and A.P.; writing—review and editing, K.P. and P.A.; supervision, K.P. and P.A.; project administration, K.P.; funding acquisition, K.P. All authors have read and agreed to the published version of the manuscript.
Funding
This research was funded by THE THAMMASAT UNIVERSITY RESEARCH FUND, Contract No. TUFT 59/2567.
Institutional Review Board Statement
This study was conducted exclusively using previously established human head and neck squamous cell carcinoma cell lines (HN18 and HN17) and their experimentally derived cisplatin-resistant sublines (HN18R and HN17R). No human participants were recruited, no new human tissues were collected, and no identifiable patient information was accessed. Ethical review and approval were waived for this study due to the guidelines of the Human Research Ethics Committee of Thammasat University (Science), research involving previously established human cell lines falls within a category eligible for exemption from ethics review.
Informed Consent Statement
Not applicable.
Data Availability Statement
Data are contained within the article.
Acknowledgments
The authors gratefully acknowledge Silvio Gutkind, Moores Cancer Center, University of California San Diego, San Diego, CA, USA, for generously providing the HNSCC cell lines. The authors also thank Sittichai Koontongkaew, Faculty of Dentistry, Western University, and Kusumawadee Utispan, Faculty of Dentistry, Thammasat University, for their valuable guidance throughout this study. During the preparation of this manuscript, the authors used ChatGPT (OpenAI; GPT- 6.1 Sol, Light reasoning setting) solely to create the graphical abstract and to improve the grammar and fluency of the manuscript’s language. The authors have reviewed and edited the output and take full responsibility for the content of this publication.
Conflicts of Interest
The authors declare no conflicts of interest.
Abbreviations
The following abbreviations are used in this manuscript:
| HNSCC | Head and neck squamous cell carcinoma |
| Pg | Porphyromonas gingivalis |
| Pg-LPS | Lipopolysaccharide derived from Pg |
| TLR | Toll-like receptor |
| IL | Interleukin |
| NO | Nitric oxide |
| MMPs | Matrix metalloproteinases |
| DMEM | Dulbecco’s Modified Eagle’s Medium |
| FBS | Fetal bovine serum |
| MTT | Methyl thiazolyl tetrazolium |
| DMSO | Dimethyl sulfoxide |
| SEM | Standard error of the mean |
| ANOVA | One-way analysis of variance |
References
- Warnakulasuriya, S. Global epidemiology of oral and oropharyngeal cancer. Oral Oncol. 2009, 45, 309–316. [Google Scholar] [CrossRef] [Scilit] [PubMed]
- Dong, L.; Xue, L.; Cheng, W.; Tang, J.; Ran, J.; Li, Y. Comprehensive survival analysis of oral squamous cell carcinoma patients undergoing initial radical surgery. BMC Oral Health 2024, 24, 919. [Google Scholar] [CrossRef] [Scilit] [PubMed]
- Sancho-Martínez, S.M.; Prieto-García, L.; Prieto, M.; López-Novoa, J.M.; López-Hernández, F.J. Subcellular targets of cisplatin cytotoxicity: An integrated view. Pharmacol. Ther. 2012, 136, 35–55. [Google Scholar] [CrossRef] [Scilit] [PubMed]
- Cheng, Y.; Li, S.; Gao, L.; Zhi, K.; Ren, W. The Molecular basis and therapeutic aspects of cisplatin resistance in oral squamous cell carcinoma. Front. Oncol. 2021, 11, 761379. [Google Scholar] [CrossRef] [Scilit] [PubMed]
- Goertzen, C.; Mahdi, H.; Laliberte, C.; Meirson, T.; Eymael, D.; Gil-Henn, H.; Magalhaes, M. Oral inflammation promotes oral squamous cell carcinoma invasion. Oncotarget 2018, 9, 29047–29063. [Google Scholar] [CrossRef] [Scilit] [PubMed]
- Gopinath, D.; Kunnath Menon, R.S.K.V.; George Botelho, M.; Johnson, N.W. Periodontal diseases as putative risk factors for head and neck cancer: Systematic review and meta-analysis. Cancers 2020, 12, 1893. [Google Scholar] [CrossRef] [Scilit] [PubMed]
- Li, R.; Hou, M.; Yu, L.; Luo, W.; Liu, R.; Wang, H. Association between periodontal disease and oral squamous cell carcinoma: A systematic review and meta-analysis. Br. J. Oral Maxillofac. Surg. 2023, 61, 394–402. [Google Scholar] [CrossRef] [Scilit] [PubMed]
- Kamarajan, P.; Ateia, I.; Shin, J.M.; Fenno, J.C.; Le, C.; Zhan, L.; Chang, A.; Darveau, R.; Kapila, Y.L. Periodontal pathogens promote cancer aggressivity via TLR/MyD88 triggered activation of Integrin/FAK signaling that is therapeutically reversible by a probiotic bacteriocin. PLoS Pathog. 2020, 16, e1008881. [Google Scholar] [CrossRef] [Scilit] [PubMed]
- Lafuente Ibáñez de Mendoza, I.; Maritxalar Mendia, X.; García de la Fuente, A.M.; Quindós Andrés, G.; Aguirre Urizar, J.M. Role of Porphyromonas gingivalis in oral squamous cell carcinoma development: A systematic review. J. Periodontal. Res. 2020, 55, 13–22. [Google Scholar] [CrossRef] [Scilit] [PubMed]
- Yamashita, Y.; Shigeishi, H.; Yokoyama, S.; Uetsuki, R.; Shiba, F.; Ono, S.; Ohta, K.; Aikawa, T. Porphyromonas gingivalis-derived lipopolysaccharide confers chemotherapy resistance and migratory ability on oral cancer cells by activating toll-like receptor 4 signaling pathway. Mol. Biol. Rep. 2026, 53, 551. [Google Scholar] [CrossRef] [Scilit] [PubMed]
- Sun, Z.; Luo, Q.; Ye, D.; Chen, W.; Chen, F. Role of toll-like receptor 4 on the immune escape of human oral squamous cell carcinoma and resistance of cisplatin-induced apoptosis. Mol. Cancer 2012, 11, 33. [Google Scholar] [CrossRef] [Scilit] [PubMed]
- Ha, N.H.; Woo, B.H.; Kim, D.J.; Ha, E.S.; Choi, J.I.; Kim, S.J.; Park, B.S.; Lee, J.H.; Park, H.R. Prolonged and repetitive exposure to Porphyromonas gingivalis increases aggressiveness of oral cancer cells by promoting acquisition of cancer stem cell properties. Tumour. Biol. 2015, 36, 9947–9960. [Google Scholar] [CrossRef] [Scilit] [PubMed]
- Johnson, D.E.; O’Keefe, R.A.; Grandis, J.R. Targeting the IL-6/JAK/STAT3 signalling axis in cancer. Nat. Rev. Clin. Oncol. 2018, 15, 234–248. [Google Scholar] [CrossRef] [Scilit] [PubMed]
- Wei, L.Y.; Lin, H.C.; Tsai, F.C.; Ko, J.Y.; Kok, S.H.; Cheng, S.J.; Lee, J.J.; Chia, J.S. Effects of Interleukin-6 on STAT3-regulated signaling in oral cancer and as a prognosticator of patient survival. Oral Oncol. 2022, 124, 105665. [Google Scholar] [CrossRef] [Scilit] [PubMed]
- Godoy, L.C.; Anderson, C.T.; Chowdhury, R.; Trudel, L.J.; Wogan, G.N. Endogenously produced nitric oxide mitigates sensitivity of melanoma cells to cisplatin. Proc. Natl. Acad. Sci. USA 2012, 109, 20373–20378. [Google Scholar] [CrossRef] [Scilit] [PubMed]
- Kokilakanit, P.; Koontongkaew, S.; Utispan, K. Nitric oxide has diverse effects on head and neck cancer cell proliferation and glycolysis. Biomed. Rep. 2024, 21, 106. [Google Scholar] [CrossRef] [Scilit] [PubMed]
- Kato, K.; Hara, A.; Kuno, T.; Kitaori, N.; Huilan, Z.; Mori, H.; Toida, M.; Shibata, T. Matrix metalloproteinases 2 and 9 in oral squamous cell carcinomas: Manifestation and localization of their activity. J. Cancer Res. Clin. Oncol. 2005, 131, 340–346. [Google Scholar] [CrossRef] [Scilit] [PubMed]
- Ha, N.H.; Park, D.G.; Woo, B.H.; Kim, D.J.; Choi, J.I.; Park, B.S.; Kim, Y.D.; Lee, J.H.; Park, H.R. Porphyromonas gingivalis increases the invasiveness of oral cancer cells by upregulating IL-8 and MMPs. Cytokine 2016, 86, 64–72. [Google Scholar] [CrossRef] [Scilit] [PubMed]
- de Morais, E.F.; de Oliveira, L.Q.R.; Marques, C.E.; Téo, F.H.; Rocha, G.V.; Rodini, C.O.; Gurgel, C.A.; Salo, T.; Graner, E.; Coletta, R.D. Generation and characterization of cisplatin-resistant oral squamous cell carcinoma cells displaying an epithelial-mesenchymal transition signature. Cells 2025, 14, 1311. [Google Scholar] [CrossRef] [Scilit] [PubMed]
- Cardinali, M.; Pietraszkiewicz, H.; Ensley, J.F.; Robbins, K.C. Tyrosine phosphorylation as a marker for aberrantly regulated growth-promoting pathways in cell lines derived from head and neck malignancies. Int. J. Cancer 1995, 61, 98–103. [Google Scholar] [CrossRef] [Scilit] [PubMed]
- Utispan, K.; Pugdee, K.; Koontongkaew, S. Porphyromonas gingivalis lipopolysaccharide-induced macrophages modulate proliferation and invasion of head and neck cancer cell lines. Biomed. Pharmacother. 2018, 101, 988–995. [Google Scholar] [CrossRef] [Scilit] [PubMed]
- Pugdee, K.; Wongpattaraworakul, W.; Hitakomate, E. Role of tumor-associated macrophages on cathepsin-B, cathepsin-D, MMP-2, and MMP-9 in HSC-3 oral cancer cells. J. Int. Dent. Med. Res. 2021, 14, 156–162. [Google Scholar]
- Luffman, N.; Ahmadinejad, F.; Finnegan, R.M.; Raymond, M.; Gewirtz, D.A.; Harada, H. Effectiveness of PROTAC BET Degraders in Combating Cisplatin Resistance in Head and Neck Cancer Cells. Int. J. Mol. Sci. 2025, 26, 6185. [Google Scholar] [CrossRef] [Scilit] [PubMed]
- Soundararajan, L.; Dharmarajan, A.; Samji, P. Regulation of pleiotropic physiological roles of nitric oxide signaling. Cell Signal. 2023, 101, 110496. [Google Scholar] [CrossRef] [Scilit] [PubMed]
Disclaimer/Publisher’s Note: The statements, opinions and data contained in all publications are solely those of the individual author(s) and contributor(s) and not of MDPI and/or the editor(s). MDPI and/or the editor(s) disclaim responsibility for any injury to people or property resulting from any ideas, methods, instructions or products referred to in the content. |
© 2026 by the authors. Licensee MDPI, Basel, Switzerland. This article is an open access article distributed under the terms and conditions of the Creative Commons Attribution (CC BY) license.