


Abstract
Non-contact diffuse reflectance to below-surface absorption disguised by a thick superficial layer is challenging to instrument and model. We develop a semi-empirical “capsule” model of non-contact diffuse reflectance, configured as center-illuminated-area-detection (CIAD), to model below-surface absorption. The “capsule” approach extends a principle of modeling the effect of a thin (<1 mm) top layer on radially resolved diffuse reflectance for contact probing to the effect of a thick (1~3 mm) surface layer on radially integrated CIAD diffuse reflectance for non-contact probing. The model treats diffuse reflectance of CIAD from a two-layer medium by weighing between two limiting cases of monolayer taking either the top or bottom of the two-layer properties. The semi-empirical model of CIAD diffuse reflectance over an area of a radius of ≤15 mm responding to variation of single inter-layer contrast is examined against Monte Carlo simulations of two-layer media with a 1–3 mm top layer, three orders of magnitude change in absorption, and two orders of magnitude change in reduced scattering. Compared to MC simulations, the modeled CIAD diffuse reflectance of the two layers gives total ensemble errors of up to 18.6% and 12.2% over the range of a single inter-layer contrast of absorption and reduced scattering, respectively. The results provide insights into the challenges of using CIAD diffuse reflectance to assess spectral absorption of the below-surface layer, which will be examined experimentally in a subsequent paper.
1. Introduction
Diffuse reflectance spectroscopy (DRS) is useful for assessing spectrally or functionally important below-surface media [1,2], such as subcutaneous pigments [3], defects of semiconductor materials [4], and layers of painting [5]. Due to the lack of spatial localization of the light-medium interaction within the sampled volume, DRS needs two or more channels of measurements differing substantially in source detector separation (SDS) for inter-layer discrimination of spectral absorption [6] without engaging coherent techniques for detecting multiple scattering [7]. Contact-based diffuse reflectance implementing two or more channels is common [8,9,10]. However, for applications such as on wounds [11], porous particles [12], and meat [13], non-contact assessment may be required, but duplicating the non-contact configuration of a single channel [14] to dual channels for differential probing of the below-surface medium might face design constraints and signal issues substantially different from those of contact-based dual-channel diffuse reflectance.
Setting aside instrumentation challenges to realize two channels of non-contact DRS, there arises the need for a forward model of diffuse reflectance suitable for a non-contact dual-channel configuration, as is true for any contact DRS that must customize a model for the applicator probe geometry. In a recent work [13], we have demonstrated a configuration of non-contact DRS referred to as center-illuminated area detection (CIAD). The CIAD implements two non-contact channels for relatively angled light illumination and collection paths. In CIAD, the light escaping the medium after diffusely propagating in the medium to carry the information of light–tissue interaction is collected over a circular area centered around and much greater than the spot of illumination. This makes CIAD different from common contact or existing non-contact DRS that acquires diffuse reflectance from a small spot displaced from the spot of illumination. A notable advantage of CIAD is significant boosting of the signal collected from a scattering medium compared to collecting diffuse reflectance at only a small spot associated with a comparatively long SDS of the same size as the radius of the area of detection in CIAD. This advantage of CIAD in signal is important for non-contact measurements and balancing machine parameters between two channels of different radial dimensions for probing different depths. CIAD geometry, however, requires the model to account for collecting diffuse reflectance over a circular area centered at the spot of illumination, not at a spot displaced from the spot of illumination as in reflection geometries conventional to contact DRS, and also not like in a transmission geometry [15]. The diffuse reflectance of CIAD is thus mathematically the integration of radially resolved diffuse reflectance over a radial dimension of the area, sans the effect of coupling loss of non-contact measurement.
We have demonstrated CIAD geometry implemented in one channel for non-contact assessment of turbid medium [12]. The use of one-channel CIAD means lacking sensitivity to inter-layer differences in spectral absorption. To enable probing of below-surface spectral absorption, two channels of CIAD rendering different sampling depths are necessary, and that requires modeling diffuse reflectance from a two-layer medium specific to the unique CIAD geometry. Qualitatively, this model must predict that a thicker top layer with stronger inter-layer contrast over the below-surface layer makes measurement less sensitive to the below-surface layer. Quantitatively, this model shall help answer the following questions: (1) Of a geometric dimension suitable for implementation using 1” cage components as in [12], how does the measurement over the entire manageable dimension respond to various inter-layer contrasts of absorption or scattering? (2) Given an inter-layer contrast, which practical dual-channel configuration within the geometry can result in greater discrimination of inter-channel responses to guide design?
A model of diffuse reflectance in CIAD geometry from a two-layer medium can, in principle, be formulated by radially integrating a model of radially resolved diffuse reflectance from a two-layer medium. There are a number of models available for radially resolved diffuse reflectance from a two-layer geometry [14,15,16,17,18,19,20,21,22,23,24]. These models, however, may not be robust near the point of entry that must be accounted for in CIAD, which makes integrating them as the base function potentially undesirable. Another way to formulate a model for CIAD diffuse reflectance from a two-layer medium may be via considering that diffuse reflectance from a two-layer medium must be bound between the values of diffuse reflectance from monolayers, taking the property of either the top or bottom layer of the two-layer medium. Thus, if a model of CIAD diffuse reflectance from a monolayer is available, proper weighting between the two values of CIAD diffuse reflectance corresponding, respectively, to two monolayer media can construct CIAD diffuse reflectance of a two-layer medium. A model formulated as such ideally shall meet the following constraints: As the top-layer reduces in thickness and the contrast over the below-surface layer, the diffuse reflectance from the two-layer medium shall relax to that from a monolayer medium taking the below-surface properties of the former one. Conversely, as the top-layer increases in thickness and the contrast over the below-surface layer, the diffuse reflectance from the two-layer medium will become closer to the one measured over a monolayer, taking the properties of the top-layer of the former two-layer one. Therefore, how much the top layer disguises diffuse reflectance of the below-surface layer of a two-layer medium must depend upon the combination of inter-layer contrast and thickness of the top layer. Such a principle was utilized in developing a “capsule” model of radially resolved diffuse reflectance, concerning a two-layer medium having a thin (<1 mm) top layer that approximates a solid organ with a “capsule” [25]. The “capsule” model of radially resolved diffuse reflectance from human livers of ~50 μm capsules and human kidneys of ~250 μm capsules has accounted for the effect of “capsule” on spectral diffuse reflectance measured with a contact applicator probe of 3 mm SDS.
This work extends and expands the “capsule” approach, which is semi-empirical in the weighting operation, to radially integrated CIAD diffuse reflectance from a two-layer medium with a thicker (1~3 mm) surface layer. The resulting model of CIAD diffuse reflectance from a two-layer medium has been compared against Monte Carlo (MC) simulations of two-layer geometries with a 1–3 mm top layer, single inter-layer contrast of absorption varying three orders of magnitude (0.001 to 1 mm−1) imposed by either a top or bottom-layer, single inter-layer contrast of reduced scattering changing two orders of magnitude (0.1 to 10 mm−1) imposed by either a top or bottom layer, and the radius of CIAD up to 15 mm considering the common 1” cage configuration. This work examines forward performance of the model against MC simulations. Experimental examination of the model with non-contact dual-channel DRS configured in CIAD geometry will be presented in a subsequent paper.
2. The “Capsule” Model
2.1. The “Capsule” Model Approach to Diffuse Reflectance of Two-Layer Media
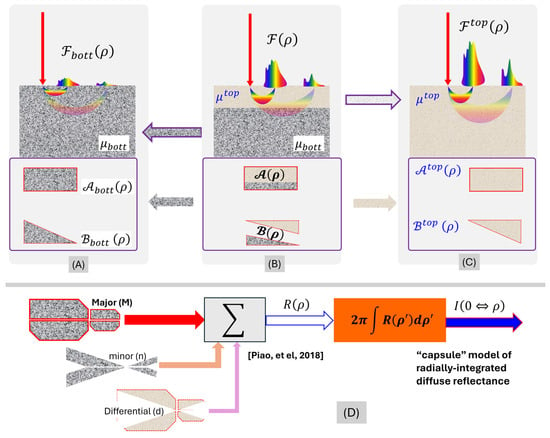
Irrespective of the configuration, a model for the measurement shall predict diffuse reflectance from a two-layer medium to differ from that from a monolayer medium, taking the property of either of the two layers. In a reciprocal perspective, model prediction of diffuse reflectance from a two-layer medium ideally shall become that from a monolayer medium, taking the properties of either the top or bottom layer, upon vanishing of inter-layer contrasts of optical properties. Such cases of a two-layer medium relaxing to a monolayer medium, and how that relaxation of medium configuration shall dictate the limiting cases of model prediction of diffuse reflectance, are conceptualized in Figure 1A–C.
Figure 1.
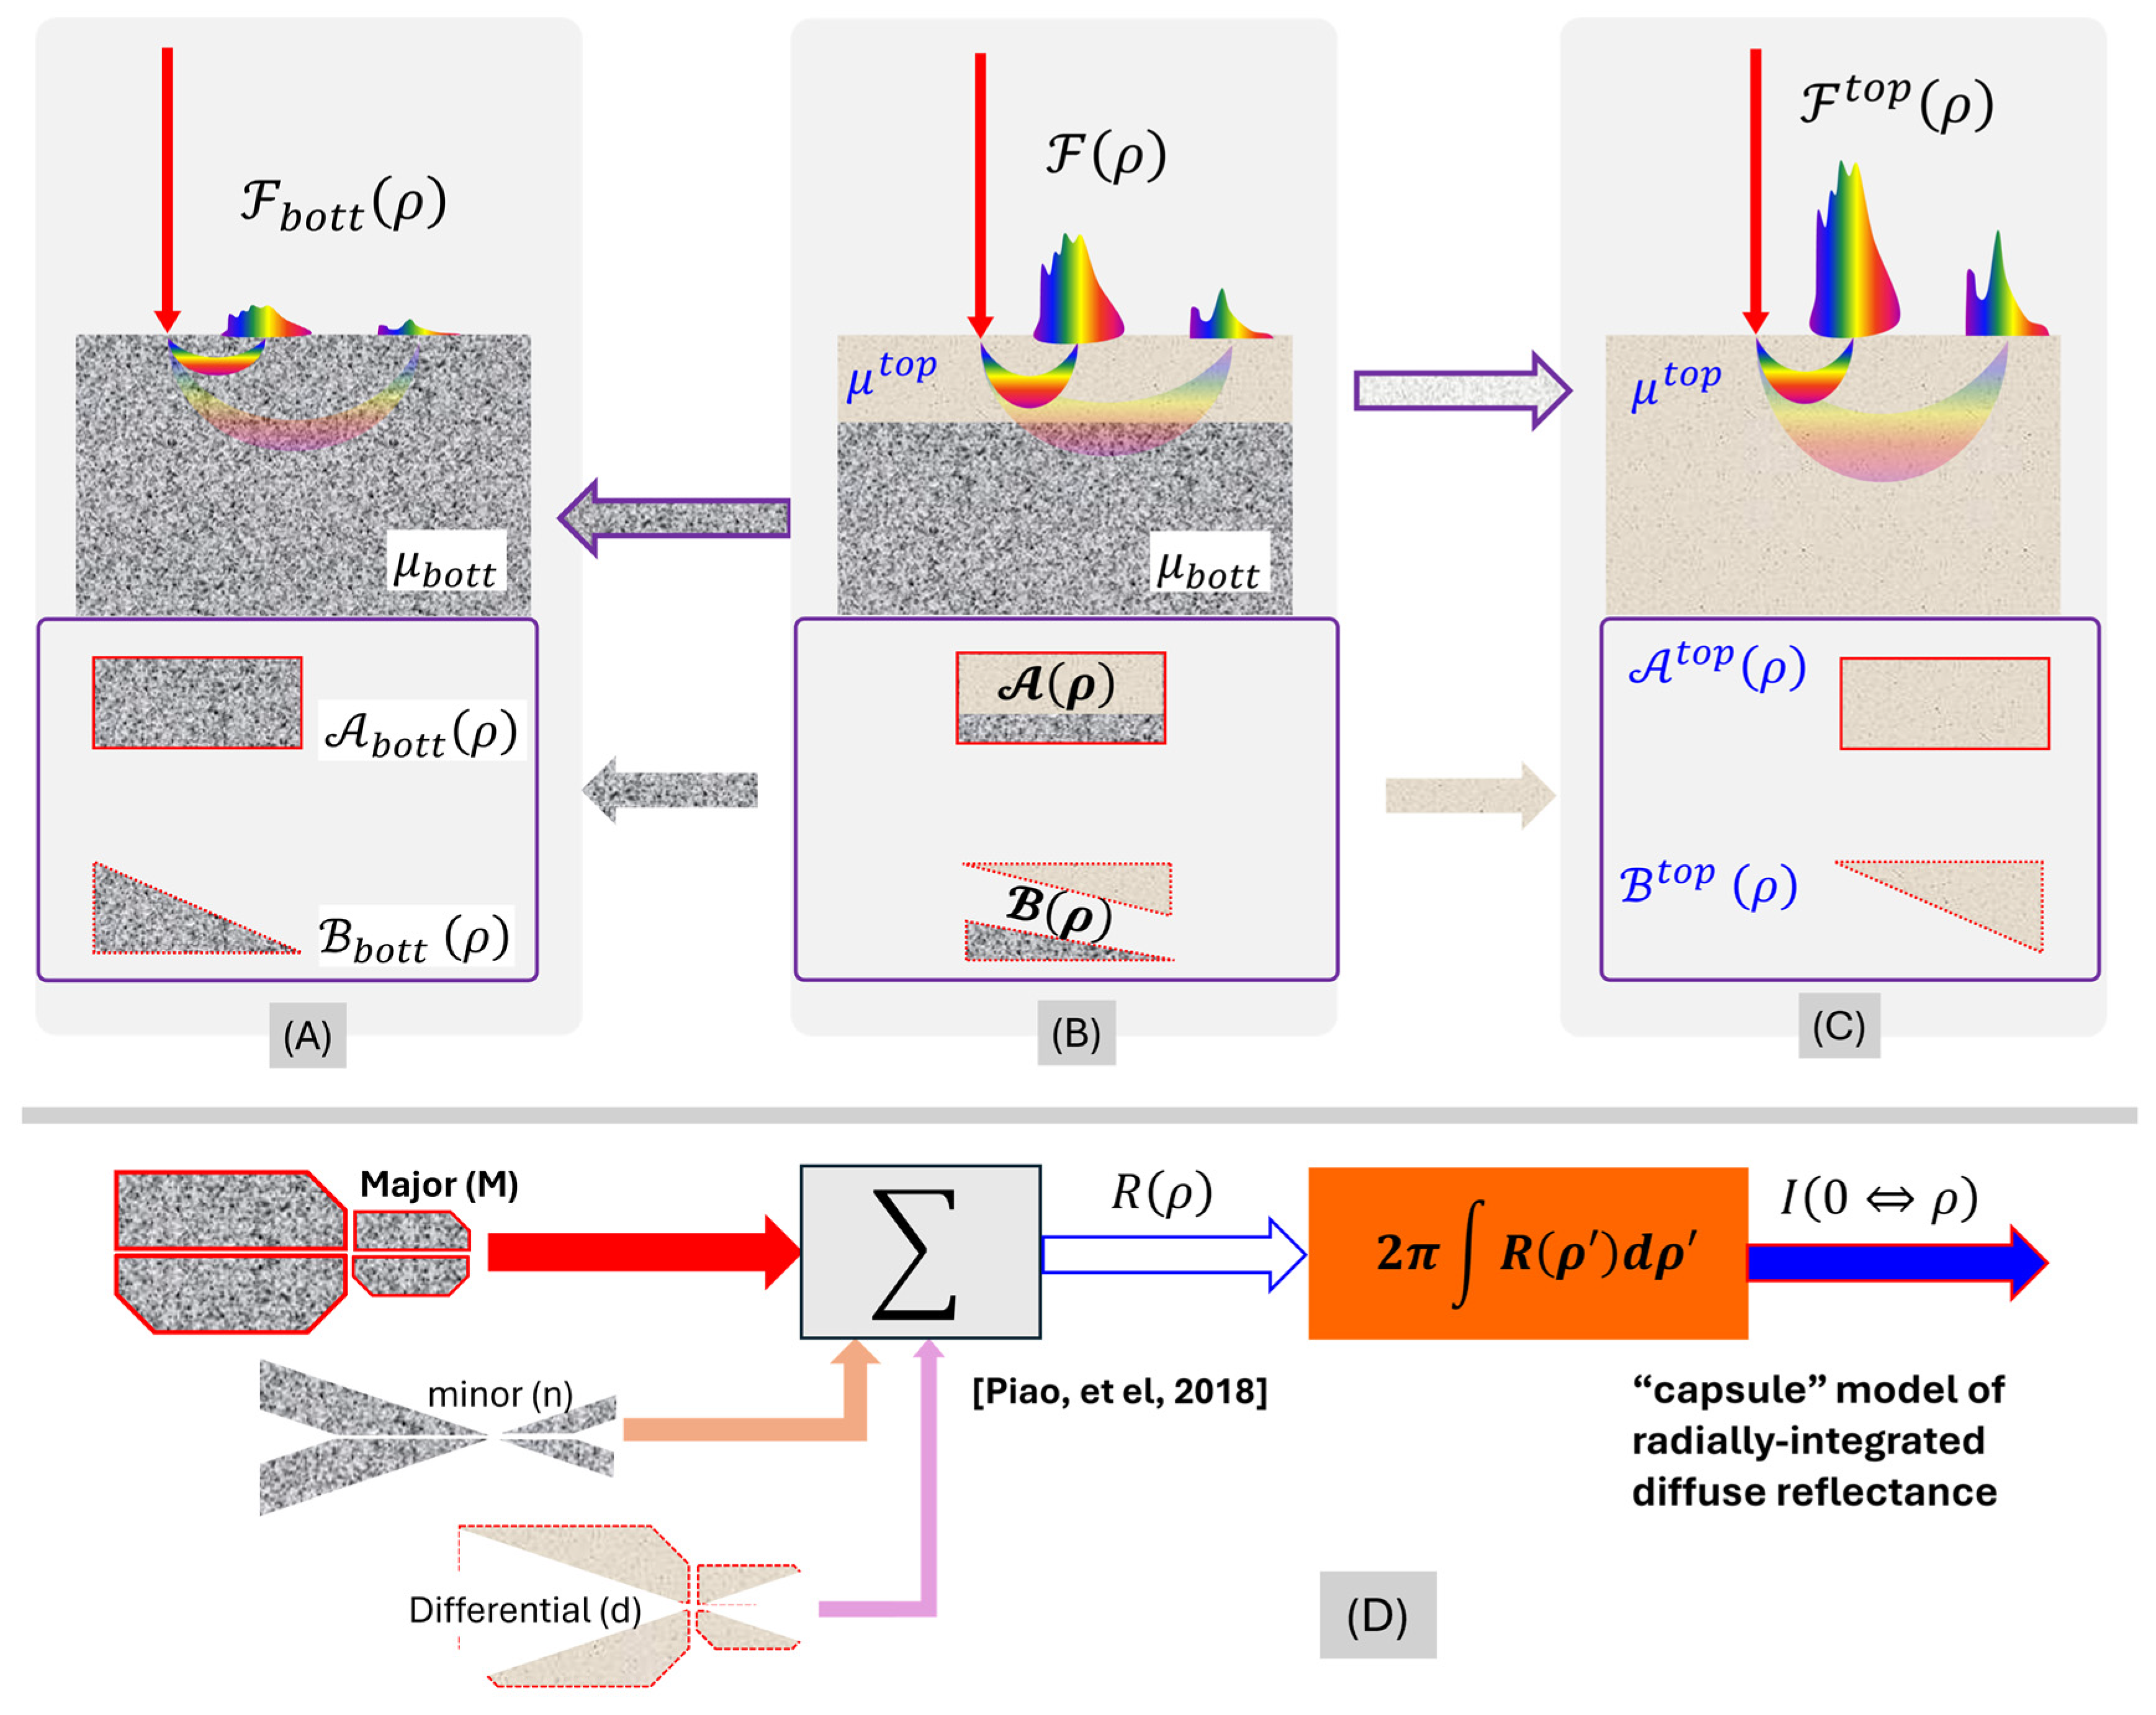
Idealized and limiting geometries (upper panel) and model components (lower panel) of diffuse reflectance from a two-layer medium. The color represents broadband light. (A) A monolayer medium. (B) A two-layer medium with the bottom layer taking the properties of the monolayer medium of (A). (C) A monolayer medium taking the properties of the top layer of the medium of (B). If (B) is a general case of a two-layer medium assessed by diffuse reflectance, (A,C) are the limiting cases of (B), by merging the properties of the two layers to that of either the bottom or top layer. The model components (rectangle for the “Major” and triangle for the “minor” component, respectively, of the diffuse reflectance as specified in Section 2.1) shown in the lower panel associated with the geometries shown above illustrate the same limiting approach: both (A,C) are monolayers, and they differ in only the optical property of the medium; therefore, models for the two cases shall contain the same components that differ by the properties of the monolayer property. Comparatively, (B) differs from (A,C) in both the optical properties and geometry of the medium. Therefore, the model for (B) could differ from the model for either (A, C) in both optical properties and geometric configuration. The model shall allow the evolution of (B) to either (A) or (C) by making the top layer vanish or dominant. (D). Each of the major (M), minor (n), and differential (d) contributions to the “capsule-mode” radially resolved diffuse reflectance sums of four functional blocks [25], and integrating the “capsule-mode” radially resolved diffuse reflectance leads to the “capsule-mode” radially integrated diffuse reflectance.
Figure 1A–C illustrates three cases of medium geometry, including a monolayer case (A), a two-layer case (B), and another monolayer case (C). We consider the two-layer medium of a semi-infinite domain in (B), with a slab layer atop a below-surface layer. The ensemble of the optical properties carrying the unit of [] of the below-surface (bottom) layer is denoted as , and that of the top layer is denoted as . In comparison to (B), the monolayer of (A) takes , and the monolayer of (C) takes . The geometries (A)–(C) thus make (A) and (C) two respective limiting cases of (B).
The diffuse reflectance from the medium geometry of (B) using a configuration of illumination and collection that is specifiable with a physical dimension of [mm] (i.e., SDS) is denoted as . may have a unit of , , , , , or , depending upon whether it is assessed at a spot or over an area, along a direction or within a spatial angle, normalized over photon energy, and normalized over the incident irradiance. If the top layer of the medium vanishes to effectively make the medium a monolayer of a specification of as (A), the corresponding diffuse reflectance will become . Comparatively, if the top layer of the medium expands deeply into the bottom layer to effectively make the medium monolayer of a specification of as (C), the corresponding diffuse reflectance will become . Because must be bound between and , we can have the following representation of by weighting between and :
where is a dimensionless factor that shall weigh the difference of the geometry of (B) with respect to the difference between (A) and (C). The weighting of Equation (1) makes the measurement of geometry (B) approach that of geometry (A) at = 0 and that of geometry (C) at = 1, respectively.
The perspective heretofore on the limiting cases serves not only as a “safety” check of a model on diffuse reflectance from a two-layer medium but also guides how a model of diffuse reflectance for a two-layer medium could be constructed using a model for the monolayer case. For (A) and (C) that are both monolayer cases differing only in the optical properties, whichever analytical form of the model fits to represent the diffuse reflectance, and shall be expressed with the same formulae except switching between and . Our prior model of diffuse reflectance from a monolayer medium covering SDS near the point-of-entry [26] has semi-empirically assumed a major or primary contributor dominating the reflectance at an SDS of a diffusive region, and a minor or secondary contributor that is monopolized by the primary contributor but dictates the reflectance at a SDS much smaller than the reduced scattering path length or near the point of entry. Accordingly, we split both and into two components of unequal weight, with the one having a primary or monopolistic role denoted as and the other one of secondary or monopolized role as . We have the following:
We then group the two primary components of and as follows
And weight the two secondary components of and , respectively, as
In Equations (4)–(6), the weighting term functioning as in Equation (1), which is developed manually and adjusted according to numerical data, could have a complex dependence upon , , and . Equation (1) can then be rearranged to the following:
As the developed form of approaches 0, ideally, and shall become, respectively, and , while vanishes. Likewise, as the developed form of approaches 1, ideally, shall become , and vanishes, while becomes . Therefore, the set of Equations (5)–(7) represents how much the top layer of the two-layer geometry alters the diffuse reflectance measurement, with respect to a baseline corresponding to diffuse reflectance from a monolayer geometry having the properties of the below-surface layer of the two-layer cases. As the top layer vanishes in both the contrast over the baseline and the thickness, the modeled effect of the top layer on the diffuse reflectance ideally shall vanish, and as the top layer increases in both the contrast over the baseline and the thickness, its modeled effect on the diffuse reflectance with respect to the baseline must increase.
2.2. The CIAD Geometry of Total Diffuse Reflectance Applying to a Two-Layer Medium
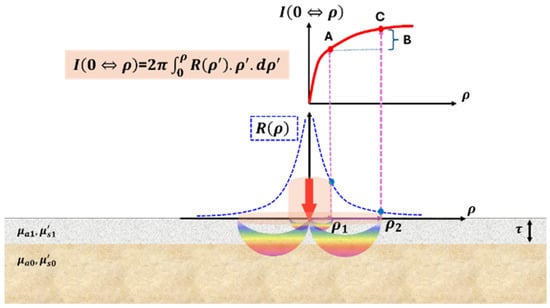
This work specifies that the illumination collection associated with the two-layer medium of Figure 1B is configured as CIAD geometry [13] suited for non-contact implementation. The dual-layer medium for diffuse reflectance assessment in association with CIAD geometry is re-illustrated in Figure 2, where the below-surface (base) layer is marked as layer 0, and the top (disguising) layer is marked as layer 1. Consequently, and are replaced with the set of and , respectively, with representing absorption coefficient [] and representing reduced scattering coefficient []. In this geometry, light is directed perpendicularly onto the air–medium interface at the point of illumination (POI), which defines the origin of an azimuthally symmetric coordinate system. After undergoing diffuse propagation within the medium, the re-emitted light emerging from the surface is collected over a circular region centered at the POI.
Figure 2.
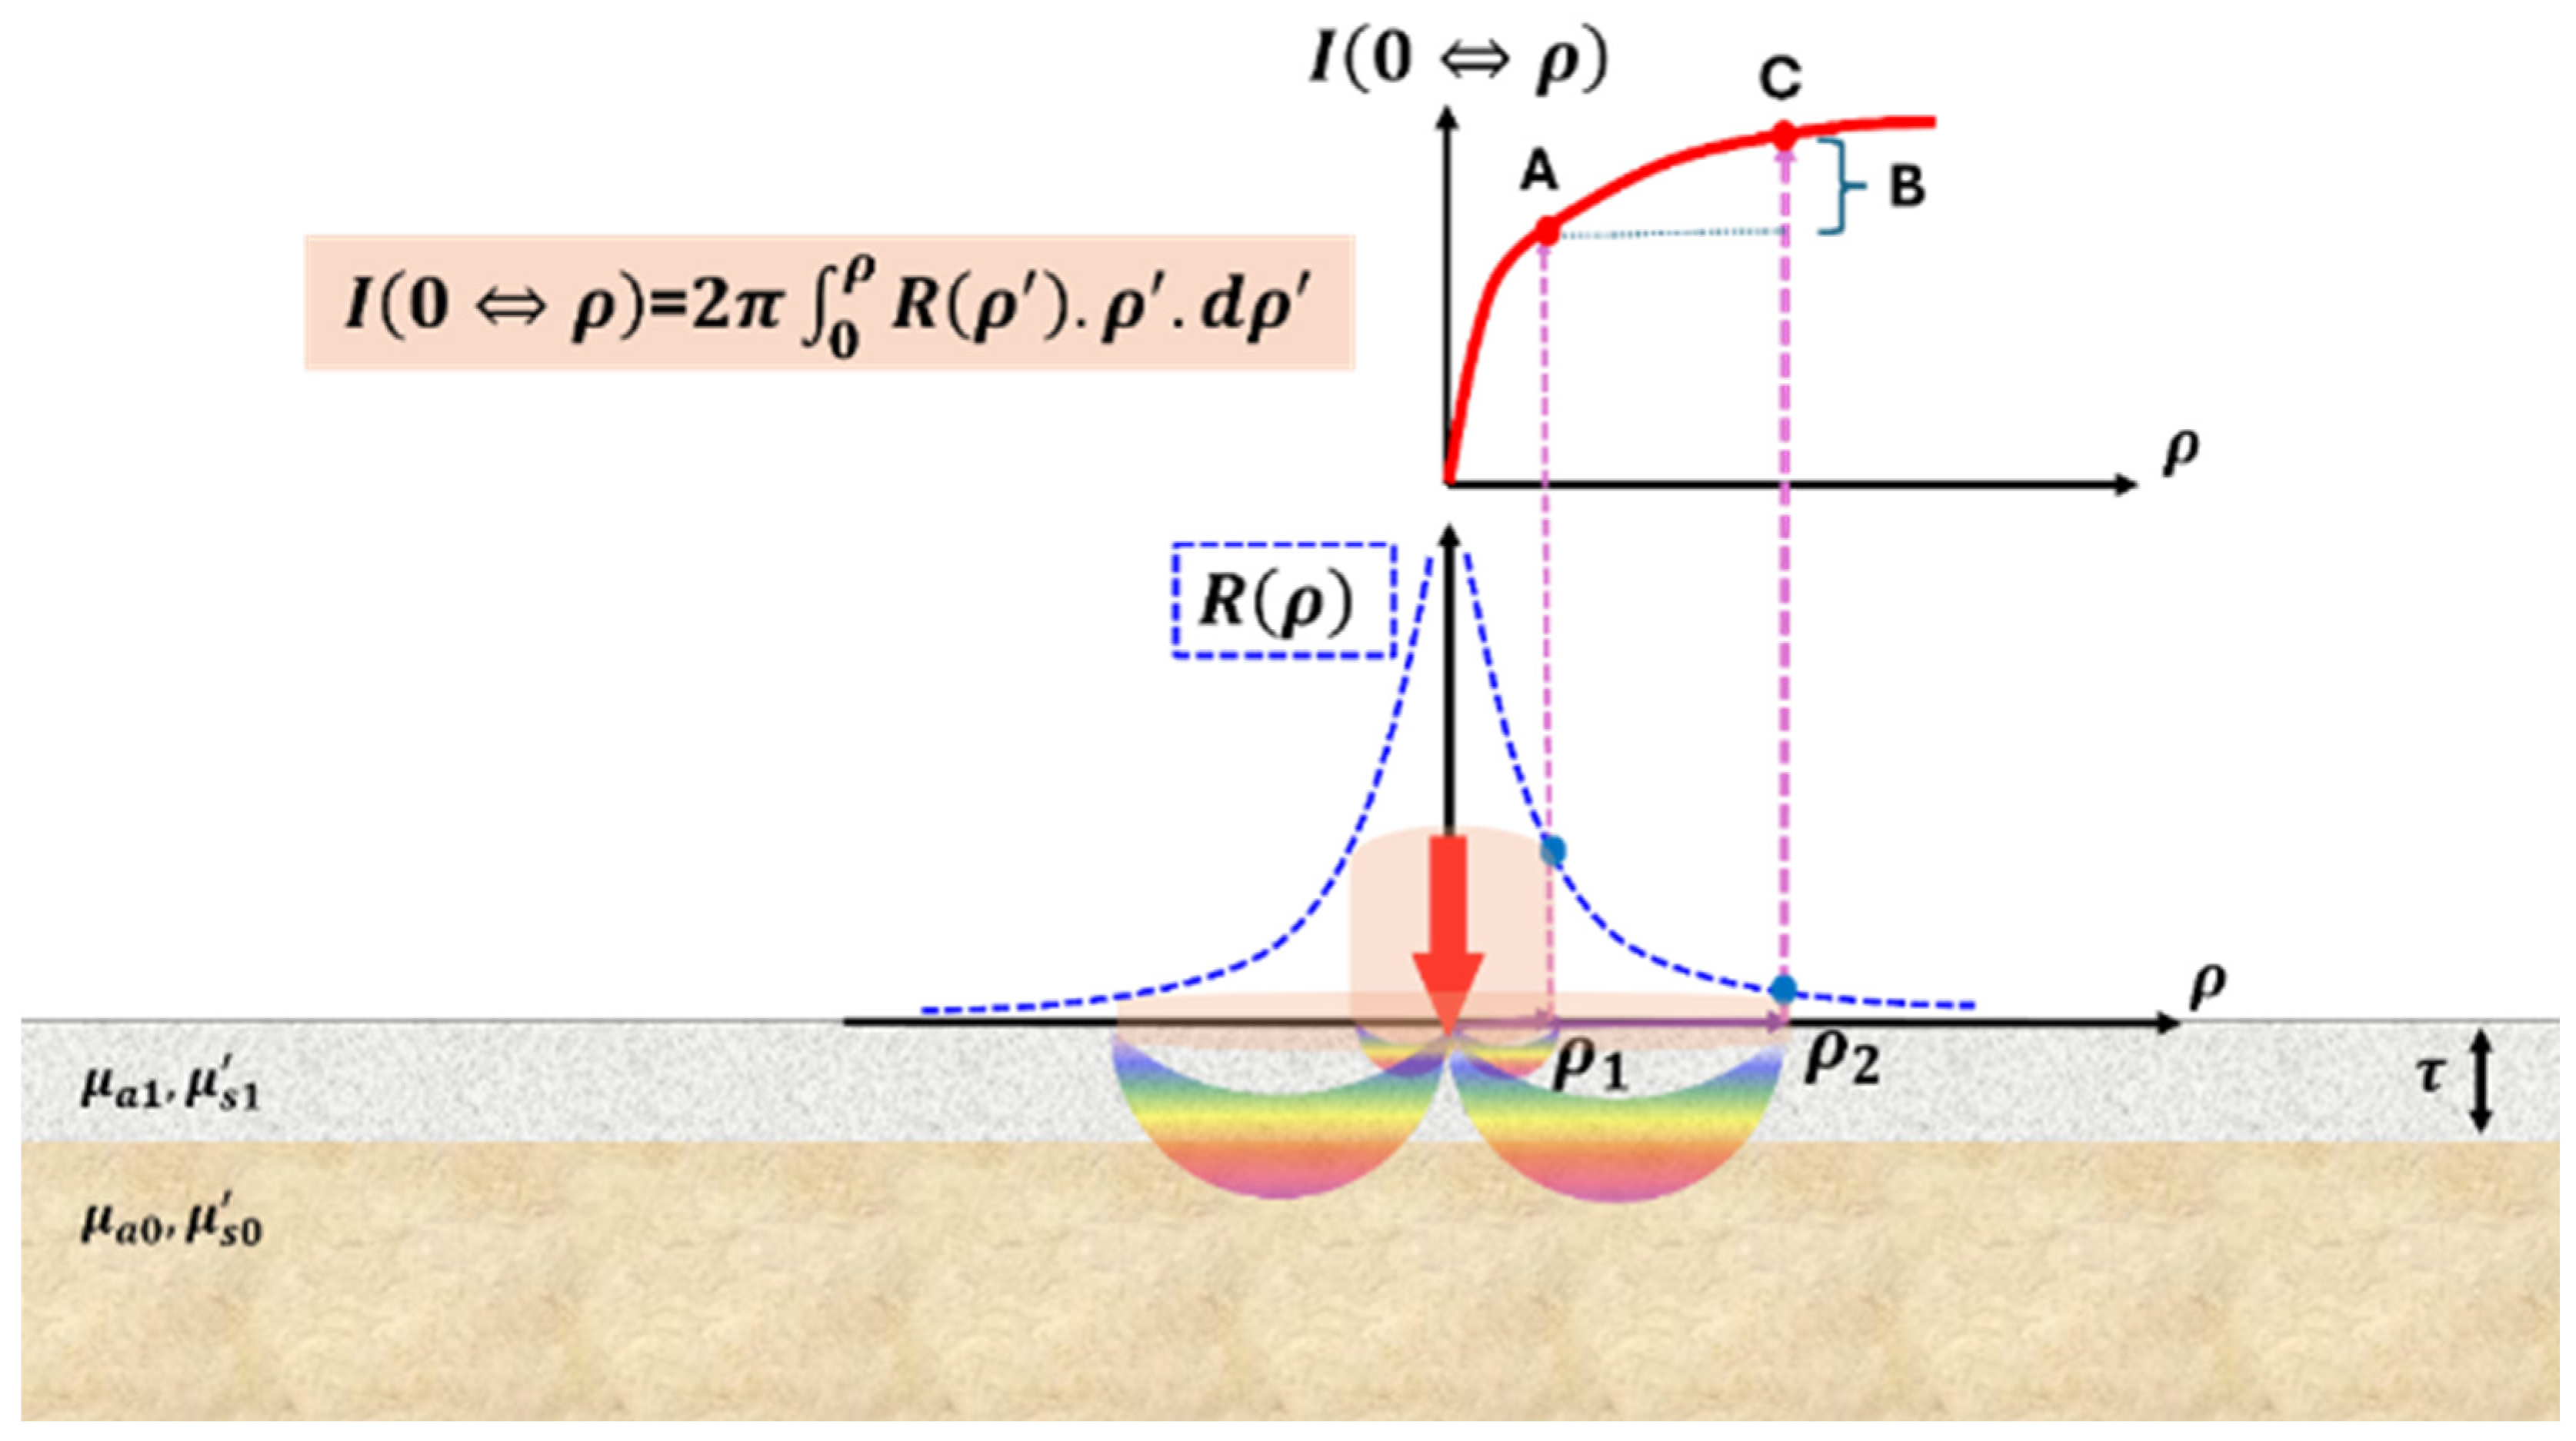
Radially resolved and radially integrated diffuse reflectance from a two-layer medium illuminated at one point. The radially resolved diffuse reflectance drops as the radial distance from the POI increases until reaching the noise level, whereas the radially integrated diffuse reflectance increases as the radial distance from the POI increases until saturating. The extent of the bottom layer’s effects on the radially resolved or integrated diffuse reflectance is determined by the relative thickness of the top layer with respect to the reduced scattering path length and the radial dimension, and the contrast of the bottom layer with respect to the top layer. Color represents broadband light.
For this geometry, contact or non-contact surface assessment could be applied to two measurements that result from the same illumination at the POI. One assessment is on the light escaping the surface, versus the radial distance of the position of escape with respect to the POI. This leads to radially resolved diffuse reflectance having a unit of [] after normalizing over photon energy, the common form measured in DRS. The other assessment is regarding the light escaping the surface over an area significantly greater than the size of the individual channel of collection. If the area of collection centers around the POI, this becomes radially integrated diffuse reflectance having a unit of [] after normalizing over photon energy and a value less than 1 after scaling against the total photon counts of the irradiation. Geometries incurring partially radially integrated diffuse reflectance, due to collecting light reflectance over multiple spots associated with the same source of illumination, can be found with probes having a centered fiber of source channel surrounded by fiber-acquired collection channels arranged in a circle [27]. The reciprocal form of area integration can also be found with a centered fiber of collection channel surrounded by fiber-delivered source channels arranged in a circle [28]. The principles of modeling CIAD can apply to these partially radially integrated geometries by scaling the area of integration and adjusting the efficiency of coupling light into the applicator probe.
The radially resolved diffuse reflectance at a radial distance [mm] from the POI in response to a unitary spatially impulsive illumination at the POI is to be represented as And the radial integration of makes total diffuse reflectance over an area of radius of and centered at the POI as:
For the dual-layer geometry, if the radially revolved diffuse reflectance becomes split into the following form per Equation (7):
The corresponding radially integrated diffuse reflectance must also be expressed similarly as a split form of the following:
For notational convenience, the superscripts representing “Major”, “minor”, and “diff” that follow will be replaced with “M”, “n”, and “d”. It is also noted that a CIAD geometry in realization always has an outer limit of the aperture of collection. If the radius of this maximum area of collection is denoted as , the diffuse reflectance collected over an area bound by is to be called the C channel (C stands for center complete) as follows:
The diffuse reflectance collected over an area bound by a radius of that is smaller than is to be called the A channel (A stands for center acquired) as follows:
2.3. “Capsule” Model of Total Diffuse Reflectance from the Two-Layer Medium
In our prior model of radially resolved diffuse reflectance [26] containing the semi-empirically weighted primary and secondary contributions, each of the primary and secondary contributors is further composed of four functional blocks. Four functional blocks were necessary to account for the boundary effect realized by introducing the “image-source” method with respect to an extrapolated zero boundary and the association between photon flux and photon fluence rate per diffusion approximation. This use of four functional blocks in the primary and secondary contributes, when cascaded to the “capsule” model approach, makes each of the major (M), minor (n), and differential (d) contributors to the diffuse reflectance consist of four functional blocks as well. The radially resolved diffuse photon count at a surface position at a radial distance from the POI that is modeled according to the “capsule” approach, illustrated in the (D) panel of Figure 1, is thus given by the summation of four functional blocks expressed as [26]:
Each of the terms in Equation (13) that has a superscript of “M” represents a primary contribution to the diffuse reflectance at a radial distance relatively greater than the reduced scattering path length of the below-surface layer. “M” attribution is illustrated in Figure 1D as the corner-missing rectangular-like component. Each of the terms in Equation (13) that has a superscript of “n” represents a contribution secondary to the former “primary” one to the diffuse reflectance at a radial distance substantially greater than the reduced scattering path length of the below-surface (base or to be probed) layer. This “n” component, however, could outweigh the “M” component at a radial distance substantially smaller than the reduced scattering path length of the below-surface layer, e.g., in the region near the POI generally requiring sub-diffusive or single-scattering treatments. The “n” attribution is visualized in Figure 1D as the corner-missing triangular-like component of darker shade. Each of the terms in Equation (14) that has a superscript of “d” represents a “differential” contribution to the diffuse reflectance relating to inter-layer contrast imposed by the top layer. The “d” attribution is visualized in Figure 1D as the corner-missing triangular-like component of lighter shade that is oriented in an opposing direction to those of “n” attributions.
The first two terms in the R.H.S. of Equation (13) are, respectively, as follows:
and in Equations (14) and (15) represent, respectively, the effective diffusion coefficient and the effective “effective” attenuation coefficient for the modeled “M, n, d” contributions to the diffuse reflectance. and in Equations (14) and (15) represent, respectively, effective weight and depth of the model sources of “M, n, d” contributions to the diffuse reflectance. of Equation (13) is obtained by replacing in Equation (14) with , which is the position of the image of the modeled source at with respect to an extrapolated zero boundary. And of Equation (13) is obtained by replacing in Equation (15) with . The details of model source configurations to form the radially resolved diffuse reflectance from a two-layer medium [25] are reprinted in Supplementary Materials A, B and C1.
The radial integration of Equation (13) leads to the following:
where the first two terms are, respectively,
of Equation (15) is obtained by replacing in Equation (16) with . of Equation (15) is obtained by replacing in Equation (17) with . The details of the four terms of Equation (16) are given in Supplementary Materials C2 and C3.
The final form of the radially integrated diffuse reflectance of the CIAD geometry from a two-layer medium is as follows:
where the terms are additional absorption contrast controllers that are manually selected by adjusting to numerical data while attending to the limiting case constraints, referred to in Supplementary Materials C5. Equation (19) has a scattering-dependent term of
The term in Equation (20) represents inter-layer scattering contrast and is defined as:
And represents the thickness of the top layer within [1, 3] mm as modeled. The scattering-dependent term of Equation (20), which becomes 1 as the scattering contrast vanishes, functions to improve the model performance to inter-layer contrast of scattering without affecting that of inter-layer contrast of absorption. Likewise, the inter-layer contrast of absorption embedded in Equation (19) is defined as:
The forms of inter-layer contrasts of absorption of Equation (22) and reduced scattering of Equation (21) are similar in terms of physical limitations, as they are bound over [0, 1]: 0 represents the disappearance of the contrast between the two layers to make the medium monolayer, and 1 represents the upper limit of the increase in contrast between the two layers.
3. MC Simulations
Monte Carlo (MC) simulations based on Virtual Photonics Technology Initiative [29] were conducted to examine the semi-empirical “capsule” model of total diffuse reflectance from a two-layer medium when acquired via CIAD. The general configurations of MC simulations followed those implemented in several studies on monolayer geometry [30,31], by adapting the previously implemented interface to two-layer medium geometry, which appropriates four cases of single inter-layer contrast of the optical properties at a specific thickness of the top layer. Keeping the total thickness of the two-layer medium at 10 cm, the top layer was set at 1 mm, 1.6 mm, 2 mm, or 3 mm thick. Setting the top-layer thickness to 1 mm to 3 mm was based on the target problem that this “capsule” model is intended to be used for non-contact assessment of below-surface myoglobin forms affecting spectral absorption associated with color stability of beef [32] that has been shown by needle-based measurement to differ across a depth of 1 mm [33]. A 1.6 mm thickness of the top layer is also taken into simulations according to a specific experimental configuration constrained by practical conditions to be detailed in Part II.
At each value of the top-layer thickness, the properties of the two layers were configured to make a single inter-layer contrast in either absorption or reduced scattering, while keeping either the bottom layer or top layer in a baseline setting of the combination of and . The absorption coefficient of the layer not at the baseline was varied by three orders of magnitude, 0.001, 0.01, 0.1, and 1.0 , at . And the reduced scattering coefficient of the layer not at the baseline was varied by two orders of magnitude, 0.1, 1, and 10 , at . Within each decade of the variation of the property, the values were equally spaced at the decimal of the decade. When combined, there were four cases of the single inter-layer contrast for each thickness of the top layer: (1) the absorption of the top layer was varied to result in an inter-layer contrast of absorption coefficient with respect to the below-surface layer set at the baseline; (2) the absorption of the below-surface layer was varied to result in an inter-layer contrast of absorption coefficient with respect to the top layer set at the baseline; (3) the reduced scattering of the top layer was varied to result in an inter-layer contrast of reduced scattering coefficient with respect to the below-surface layer set at the baseline; and (4) the reduced scattering of the below-surface layer was varied to result in a contrast of reduced scattering coefficient with respect to the top layer set at the baseline. In combination, each of the four settings of the single inter-layer contrast was applied to a 1.0, 1.6, 2.0, and 3.0 mm thick top layer, as tabulated in Table 1a for the cases of keeping the below-surface layer at the baseline and Table 1b for the cases of keeping the top layer at the baseline.
Table 1.
(a). Parameters of the top layer with the below-surface layer at the baseline. (b) Parameters of the below-surface layer with the top layer at the baseline.
The MC simulation was limited to only the Heyney–Greinstain phase function of scattering due to the availability of the package. We note that diffuse reflectance corresponding to CIAD is an integration of radially resolved diffuse reflectance, and integration functions as a low-pass filter. Therefore, small radial variations of radially resolved diffuse reflectance affected by the scattering phase function will be smoothed out by radial integration to make the CIAD diffuse reflectance not sensitive to the scattering phase function. The settings, including a scattering anisotropy of 0.9, a refractive index of 1.40 for the medium, and launching 100,000 photons in each run, were the same as in [13,30,31,34]. The launch of 100,000 photons, as implemented elsewhere [35], was shown to be adequate for the integration analysis of counting all photons escaping the medium–air interface. The MC simulation produced photon counts at a radial resolution of 1 over a radius up to 15 mm, corresponding to a 30 mm diameter, which is greater than the maximum operating diameter of the area of collection in the experimental CIAD geometry to be reported in Part II. If the radial resolution was denoted as , the photon counts were assessed for two radii of 1.5 mm and 15 mm, corresponding to what could have been manageable in the experimental developments. The radial dimension was discretized as
Denoting the MC-generated photon counts at a radial position of k times the radial interval as , the total photon counts at the two radii of and are, respectively,
4. Results
The results are presented in two categories. The first category examines the model performance to fixed-value strong single inter-layer contrast applied to varied top-layer thickness at various radial dimensions of the area of collection up to the 15 mm radius. This category addresses the question of “how does the model in comparison to MC over the entire manageable dimension of CIAD respond to strong single inter-layer contrast of a 1–3 mm top-layer?” The strong single-layer contrast is set to stress-test the model. The second category exemplifies the model’s responses to varied inter-layer contrast originating from either the top or below-surface layer, at a fixed top-layer thickness and a fixed size of the area of light collection of CIAD. This category provides insights into the extent of the top layer affecting diffuse reflectance from the two-layer medium presenting single inter-layer contrast. Assessing the single inter-layer contrast imposed by either the top or bottom layer is necessary to address the question of “given a single inter-layer contrast, will the model adequately predict discriminable inter-channel responses between two configurable channels of CIAD to warrant or guide design and implementation?”
4.1. Performance of the “Capsule” Model of CIAD Diffuse Reflectance Against MC Simulations at a Fixed Stressed Inter-Layer Contrast Versus the Radial Dimension of Collection
This section examines model predictions of diffuse reflectance from two-layer media acquired in CIAD geometry as a function of the radial dimension of the area of collection, against the MC simulation results, for the two-layer medium to have a stressed single inter-layer contrast. The model–MC comparisons are presented for the medium geometries to present only one type of stressed inter-layer contrast in the optical properties varied, with the top-layer thickness set at 1, 2, and 3 mm, respectively. The single inter-layer contrast was created by varying one property of a target layer versus the other layer set at the baseline condition of and . Either the top or bottom layer is set at the target layer to have a stressed single-layer contrast with respect to the other layer set at the baseline properties. In the results presented, discrete markers represent MC simulations, and lines (solid or broken/dashed) represent model predictions. The results are presented for the two-layer medium to carry a strong single inter-layer contrast of absorption of 100 times and a strong single inter-layer contrast of reduced scattering of 10 times. The strong single inter-layer contrast functions to stress-test the model.
In each of the sub-figures presented, green-trace (triangle) markers represent MC simulations of the two-layer medium in the absence of single inter-layer contrast to make it effectively a homogeneous medium of the baseline properties to be used as the common reference. The dashed blue line represents the model prediction of the two-layer medium in the absence of single inter-layer contrast to approach a homogeneous medium having the baseline properties. The ordinate corresponds to the total CIAD diffuse reflectance over an area of collection up to 15 mm in radius, which is the abscissa. Each of the sub-figures also marks the changes of CIAD diffuse reflectance from the two-layer medium with respect to the baseline monolayer medium, at two sizes of the center-acquired areas with radii of 1.5 mm and 15 mm, respectively. The green-shaded numbers show the percentage deviation of the non-baseline condition with respect to the baseline values given by MC, and the dashed line framed numbers show the percentage deviation of the non-baseline condition with respect to the baseline values predicted by the model. The merit of model prediction with respect to MC simulations assessed across the entire set of the single inter-layer contrast is visualized in Supplementary Materials D as scattering plots, where the diagonal line indicates a perfect match of model to MC simulations. Over the entire number of runs denoted as of the single inter-layer contrast, an ensemble error representing average absolute relative deviation is calculated as follows:
In the results presented below, there are numbers in the boxes specifying the percentage changes of the CIAD diffuse reflectance with respect to the baseline conditions, calculated from both model and MC simulations. The numbers given by the model are framed in dashed empty boxes, and the numbers given by MC are enclosed in green-filled boxes.
4.1.1. Inter-Layer Contrast of Absorption Imposed by the Top Layer That Is 1, 2, and 3 mm Thick
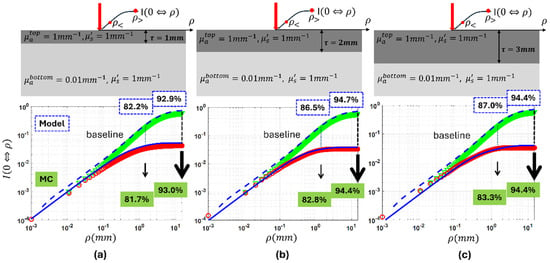
Figure 3 presents how the “capsule” model performs against MC simulations for the case of single inter-layer contrast of absorption imposed by a top layer having a thickness of 1 mm in (a), 2 mm in (b), and 3 mm in (c), respectively. The below-surface layer was set at the baseline properties, and the top layer was set to have 100 times the absorption of the baseline properties. As the top layer’s thickness increased from 1 mm to 2 mm and to 3 mm at a 100 times inter-layer contrast of absorption imposed by the top layer, the CIAD diffuse reflectance over the radii of 1.5 mm and 15 mm dropped by 82.2%, 86.5%, and 87.0% and by 92.9%, 94.7%, and 94.4%, respectively, from the baseline monolayer cases by model prediction. The corresponding drops by MC are 81.7%, 82.8%, and 83.3% and 93.0%, 94,4%, and 94.4%, respectively. Supplementary Materials Figure S2a shows an 18.6% ensemble error of the model prediction.
Figure 3.
MC results showing the effect of increasing the area of collection when the absorption of the top layer is 100 times more than the bottom layer with the same reduced scattering of the baseline for the thickness of the top layer: (a) , (b) , (c) . Discrete markers represent the MC results, while the solid and dashed lines show the model response. The green markers correspond to the homogeneous baseline case (), and the red markers represent the MC results for the two-layer medium.
4.1.2. Inter-Layer Contrast of Absorption Imposed by the Below-Surface Layer over the Top Layer That Is 1, 2, and 3 mm Thick at the Baseline
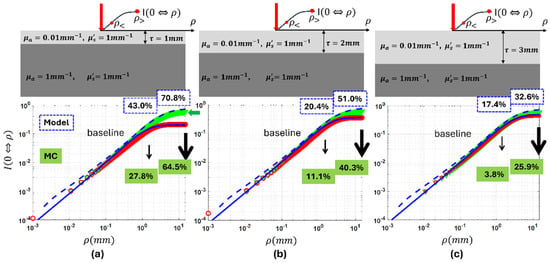
Figure 4 presents how the “capsule” model performs against MC simulations for the case of single inter-layer contrast of absorption imposed by the below-surface layer, with the top layer having a thickness of 1 mm in (a), 2 mm in (b), and 3 mm in (c), respectively. The top layer was set at the baseline properties, and the below-surface layer was set to have 100 times the baseline absorption. As the top layer’s thickness increased from 1 mm to 2 mm and to 3 mm at a 100 times inter-layer contrast of absorption imposed by the bottom layer, the CIAD diffuse reflectance over radii of 1.5 mm and 15 mm dropped by 43.0%, 20.4%, and 17.4% and by 70.8%, 51.0%, and 32.6%, respectively, from the baseline monolayer cases by model prediction. The corresponding drops by MC are 27.8%, 11.1%, and 3.8% and 64.5%, 40.3%, and 25.9%, respectively. Supplementary Materials Figure S2b shows a 6.23% ensemble error of the model prediction.
Figure 4.
MC results showing the effect of increasing the area of collection when the absorption of the bottom layer is 100 times more than the top layer, with the same reduced scattering of the baseline for the thickness of the top layer: (a) , (b) , (c) . Discrete markers represent the MC results, while the solid and dashed lines show the model response. The green markers correspond to the homogeneous baseline case (), and the red markers represent the MC results for the two-layer medium.
The results of MC simulations presented in both Figure 3 and Figure 4 combined suggest that the same amount of inter-layer contrast in the absorption results in much greater relative change to CIAD diffuse reflectance if the contrast localizes at the top layer rather than the below-surface layer. The results also demonstrate that a greater size of the centered collection corresponds to a greater relative change over the baseline for a given single inter-layer contrast of absorption, regardless of the layer with localized contrast in absorption. And the projections by the “capsule” model are in good agreement with MC simulations.
4.1.3. Inter-Layer Contrast of Reduced Scattering Imposed by the Top Layer That Is 1, 2, and 3 mm Thick
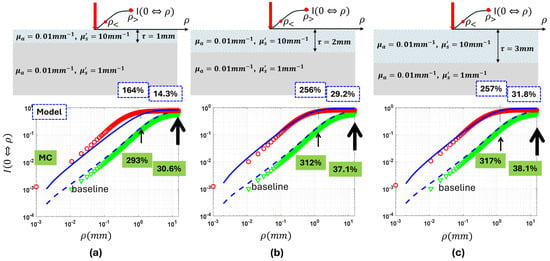
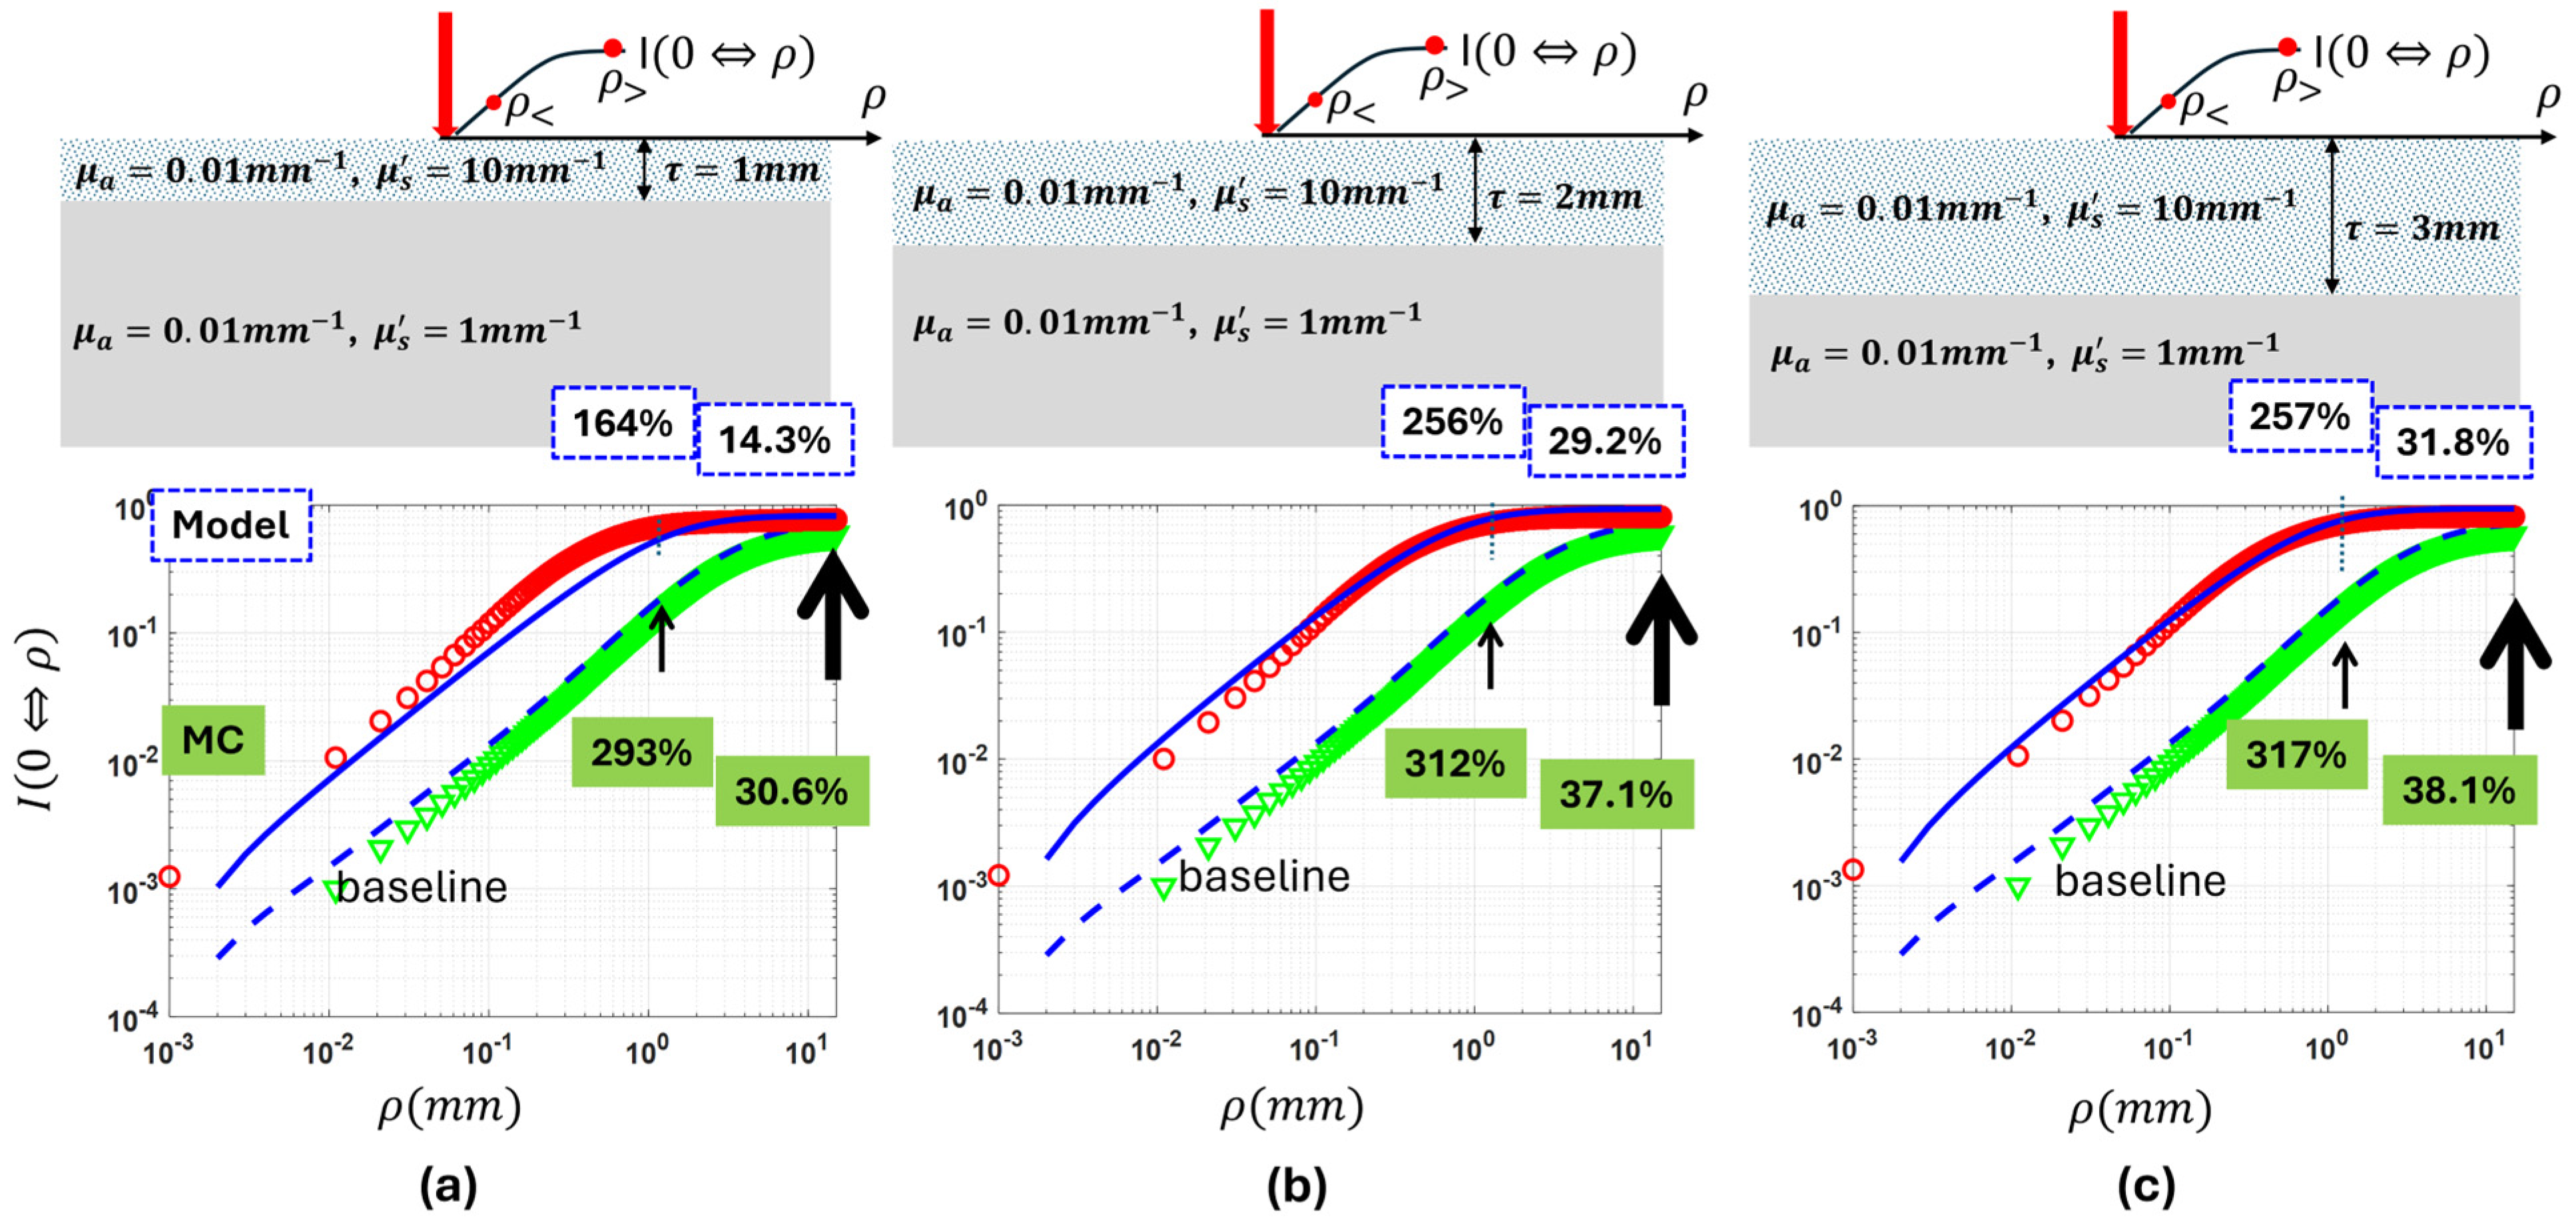
Figure 5 presents how the “capsule” model performs against MC simulations for the case of single inter-layer contrast of reduced scattering imposed by a top layer having a thickness of 1 mm in (a), 2 mm in (b), and 3 mm in (c), respectively. The below-surface layer was set at the baseline, and the top layer was set to have 10 times the baseline reduced scattering. As the top layer’s thickness increased from 1 mm to 2 mm and to 3 mm at the 10 times inter-layer contrast of reduced scattering imposed by the top layer, the CIAD diffuse reflectance over radii of 1.5 mm and 15 mm increased by 164%, 256%, and 257% and by 14.3%, 29.2%, and 31.8%, respectively, from the baseline monolayer cases by model prediction. The corresponding increases by MC are 293%, 312%, and 317% and 30.6%, 37.1%, and 38.1%, respectively. Supplementary Materials Figure S2c shows a 12.1% ensemble error of the model prediction.
Figure 5.
The CIAD diffuse reflectance over an area of collection up to 15 mm in a radius from a two-layer medium having a fixed strong inter-layer contrast in reduced scattering set by the top layer. The substrative bottom layer is set at the baseline, and the top layer is set to have 10 times reduced scattering over the bottom layer with the absorption coefficient at the baseline. The thickness of the top layer varied in reduced scattering is set at 1 mm (a), 2 mm (b), and 3 mm (c).
4.1.4. Inter-Layer Contrast of Reduced Scattering Imposed by the Below-Surface Layer over the Top Layer That Is 1, 2, and 3 mm Thick at the Baseline
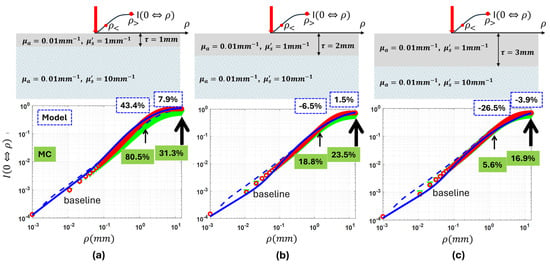
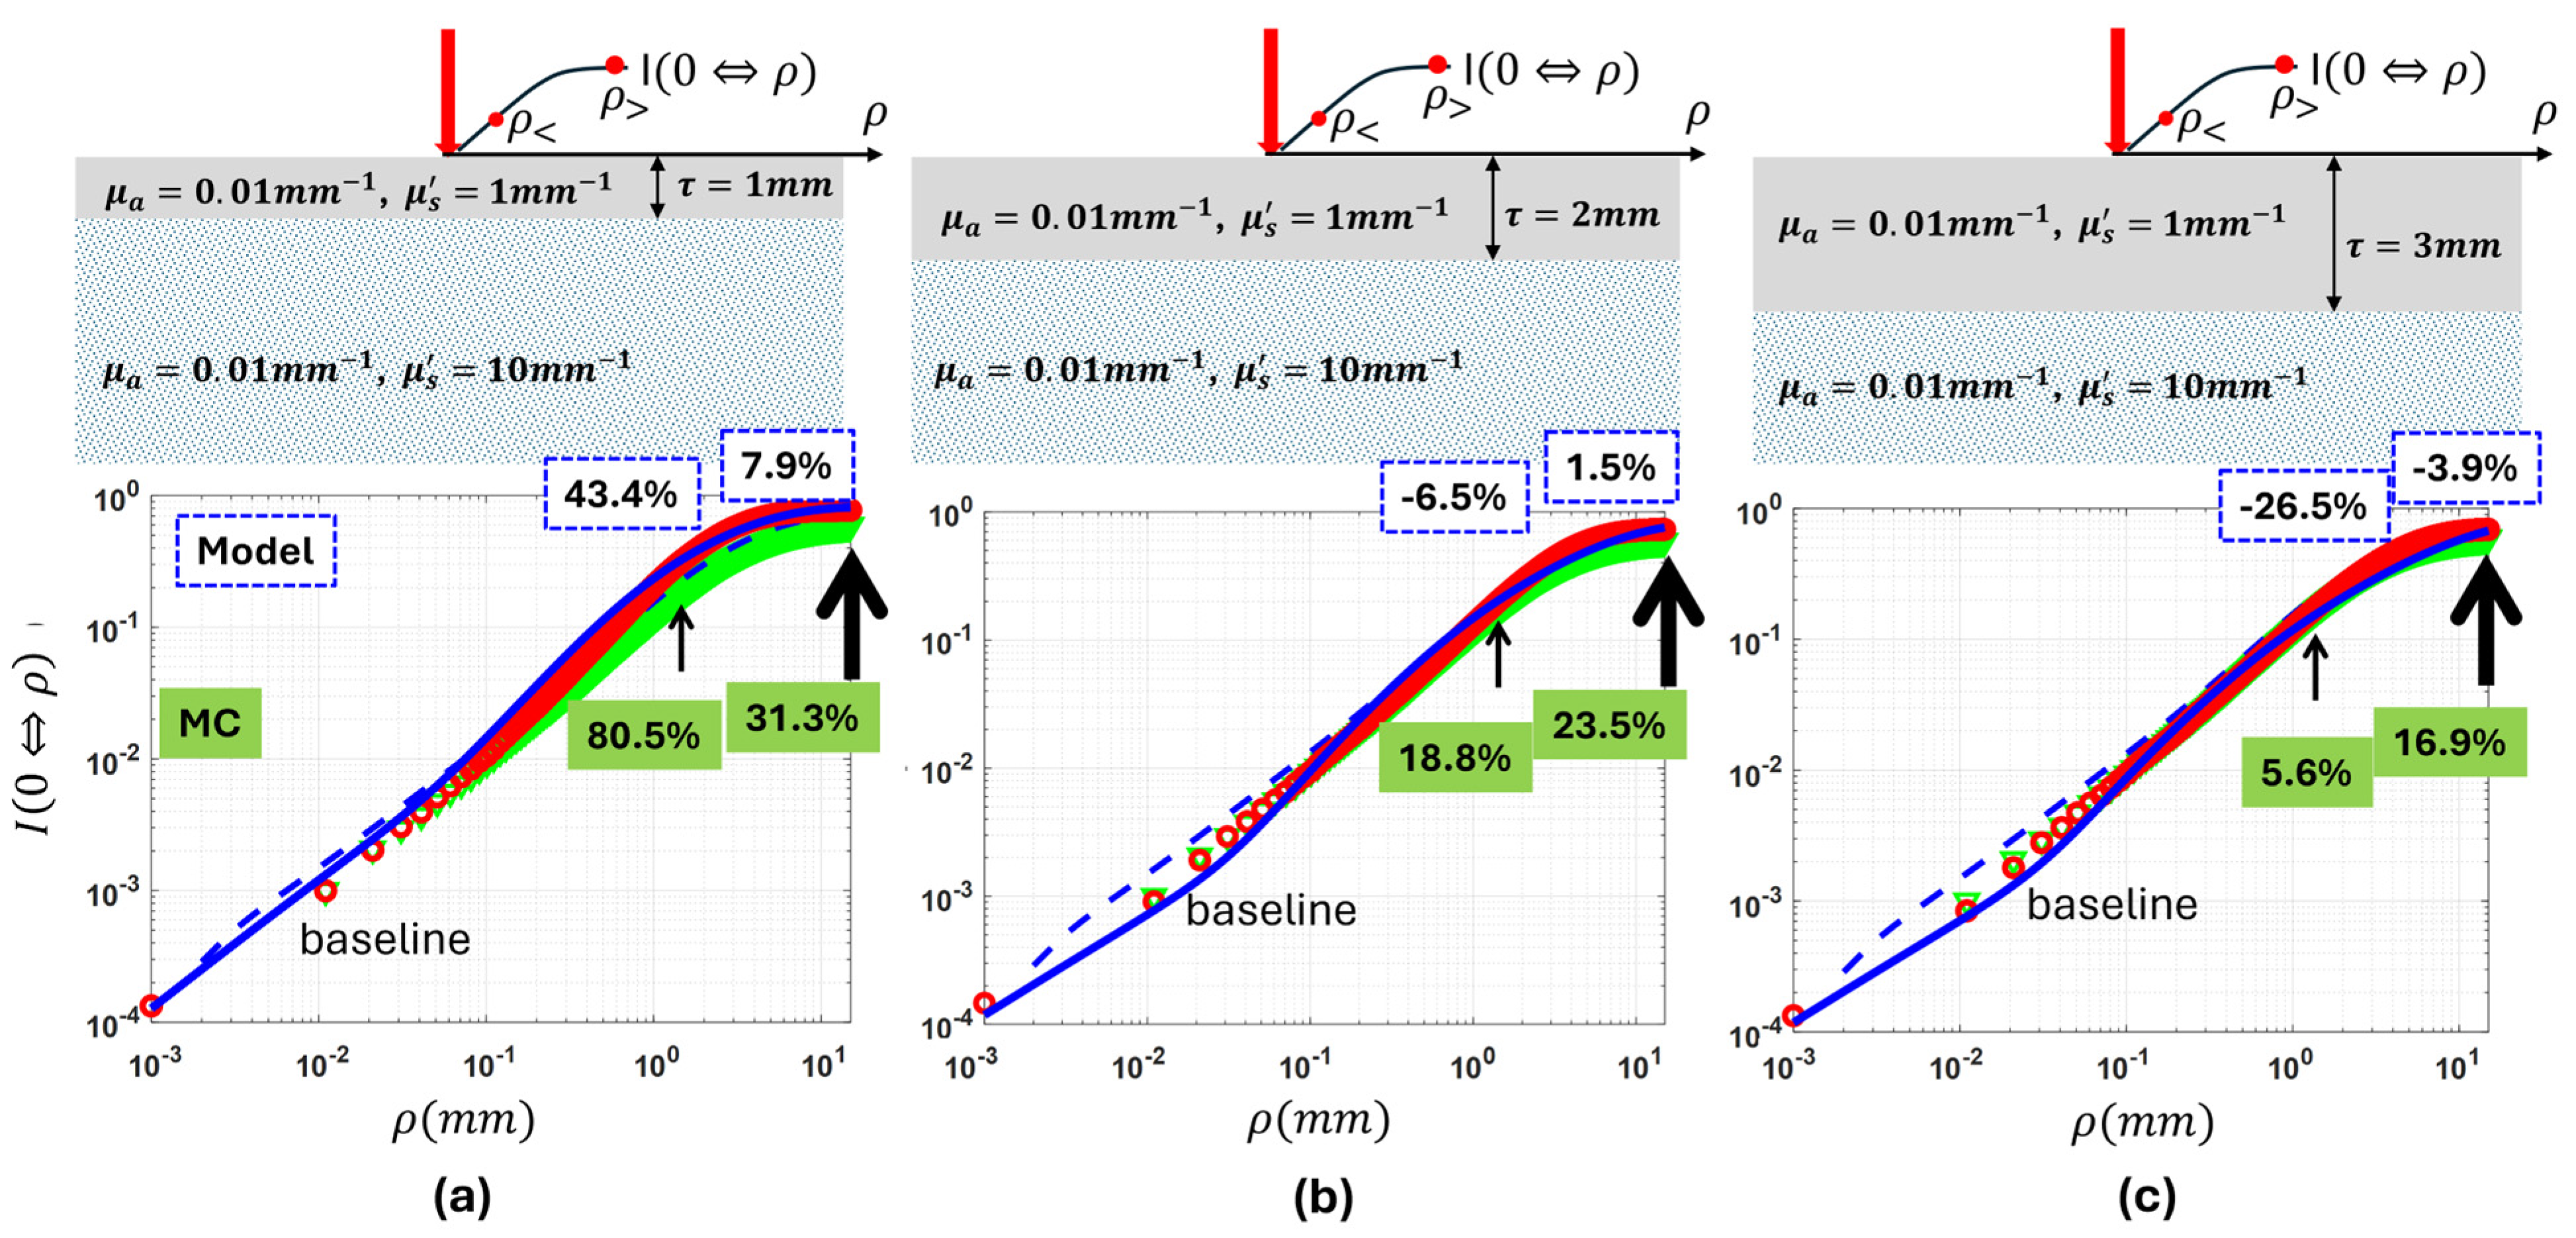
Figure 6 presents how the “capsule” model performs against MC simulations for the case of single inter-layer contrast of reduced scattering imposed by the below-surface layer, with the top layer having a thickness of 1 mm in (a), 2 mm in (b), and 3 mm in (c), respectively. The top layer was set at the baseline properties, and the below-surface layer was set to have 10 times the baseline reduced scattering. As the top layer’s thickness increased from 1 mm to 2 mm and to 3 mm at 10 times the inter-layer contrast of reduced scattering imposed by the below-surface layer, the model predicted that CIAD total diffuse reflectance over radii of 1.5 mm and 15 mm deviated from the baseline monolayer cases at 43.4%, −6.5%, and −26.5% and 7.9%, 1.5%, and −3.9%, respectively. In comparison, MC gives the deviation from the corresponding baseline monolayer cases as 80.5, 18.8%, and 5.6% and 31.3%, 23.5%, and 16.9%, respectively. At the top-layer thickness of 2 mm, the model’s projection of the deviations of CIAD diffuse reflectance from the baseline value is opposite in polarity to that projected by MC for the radius of 1.5 mm. At the top-layer thickness of 3 mm, the model’s projection of the deviations of CIAD diffuse reflectance from the baseline value is opposite in polarity to that projected by MC for radii of 1.5 mm and 15 mm. The model’s performance in responding to the scattering variation of the below-surface layer degrades as the top layer becomes thicker. Supplementary Materials Figure S2d shows a 12.2% ensemble error of the model prediction.
Figure 6.
The CIAD diffuse reflectance over an area of collection up to 15 mm in radius from a two-layer medium having a fixed strong inter-layer contrast in reduced scattering set by the below-surface layer. The top layer is at the baseline, and the substrative bottom layer is set to have 10 times the reduced scattering over the top layer with the absorption coefficient at the baseline. The thickness of the top layer having the baseline properties is set at 1 mm (a), 2 mm (b), and 3 mm (c).
The results of MC simulations presented in both Figure 5 and Figure 6 combined suggest that the same amount of inter-layer contrast of reduced scattering results in a dominating change to the CIAD diffuse reflectance if the contrast localizes to the top layer rather than the below-surface layer. The results of MC simulations also demonstrate that, if the single inter-layer contrast of the reduced scattering is localized to the top layer, the centered collection having a greater size, such as 15 mm in diameter, could make less amount of change with respect to the baseline, in comparison to that having a radius of 1.5 mm. For the cases of the single inter-layer contrast of the reduced scattering localized to the top layer, the projections by the “capsule” model are in good agreement with MC simulations. Comparatively, if the single inter-layer contrast of the reduced scattering is localized to the bottom layer, there is a very small change to the centered collection with respect to the baseline values. This suggests that the CIAD diffuse reflectance has significantly reduced sensitivity to scattering variations if occurring below the 1–3 mm depth than above the 1–3 mm depth. And for the cases of the single inter-layer contrast of reduced scattering localized to below the surface, the model projections deviate notably from MC simulations in polarity and numbers. The capsule model as developed may be challenging to assess below-surface scattering.
4.2. Performance of the “Capsule” Model of CIAD Total Diffuse Reflectance Against MC Simulations Versus Single Inter-Layer Contrast Associated with a 1.6 mm Top Layer
This section compares model predictions of the diffuse reflectance from two-layer media acquired in a CIAD geometry as a function of single inter-layer contrast, against the MC simulation results, for a specific top-layer thickness and a fixed size of the geometry of CIAD. The model–MC comparisons are presented for the medium geometries to present only one type of inter-layer contrast that is, however, varied over a great range, with the top-layer thickness set at 1.6 mm. The value of 1.6 mm was chosen to represent the top-layer tissue available to the experimental measurements to be presented in a subsequent paper. The single inter-layer contrast was created by varying one property of a target layer versus the other layer set at the baseline reference condition of having and . Four conditions of single inter-layer contrast are thus represented, considering the type of contrast and which layer is varied in the contrast.
In each of the sub-figures presented that follow, the red and green markers represent MC simulations of the two-layer medium corresponding to the collection over, respectively, an A channel with a diameter of 3 mm and a C channel with a diameter of 30 mm. These two channels, which differ by 10 times in the size of the radial dimension, are assessed here as their size difference potentiates differential sensitivity to the below-surface layer. The traces pointed by the box with a smaller white center correspond to a 1.5 mm radius of the area of collection or the A channel. The traces pointed by the box with a greater white center correspond to a 12.5 mm radius of the area of collection or the C channel. The solid and dashed lines represent model predictions of the two-layer medium corresponding to the collection over, respectively, the A channel and C channel. The abscissa represents the property of the layer presenting the single inter-layer contrast over the other layer kept at the baseline properties. Each of the sub-figures presented also has a broken vertical line that represents the reference value corresponding to a monolayer medium with both absorption and reduced scattering properties set at the baseline values.
4.2.1. Single Inter-Layer Contrast of Absorption Varied over Four Orders of Magnitude Associated with a 1.6 mm Thick Top Layer
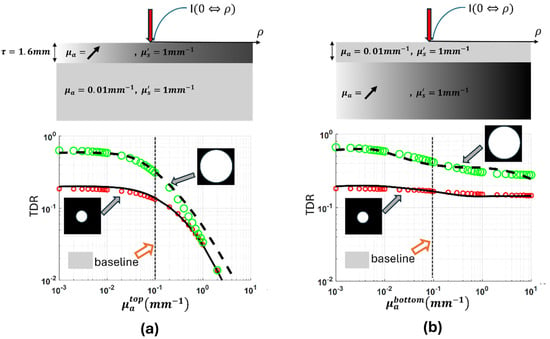
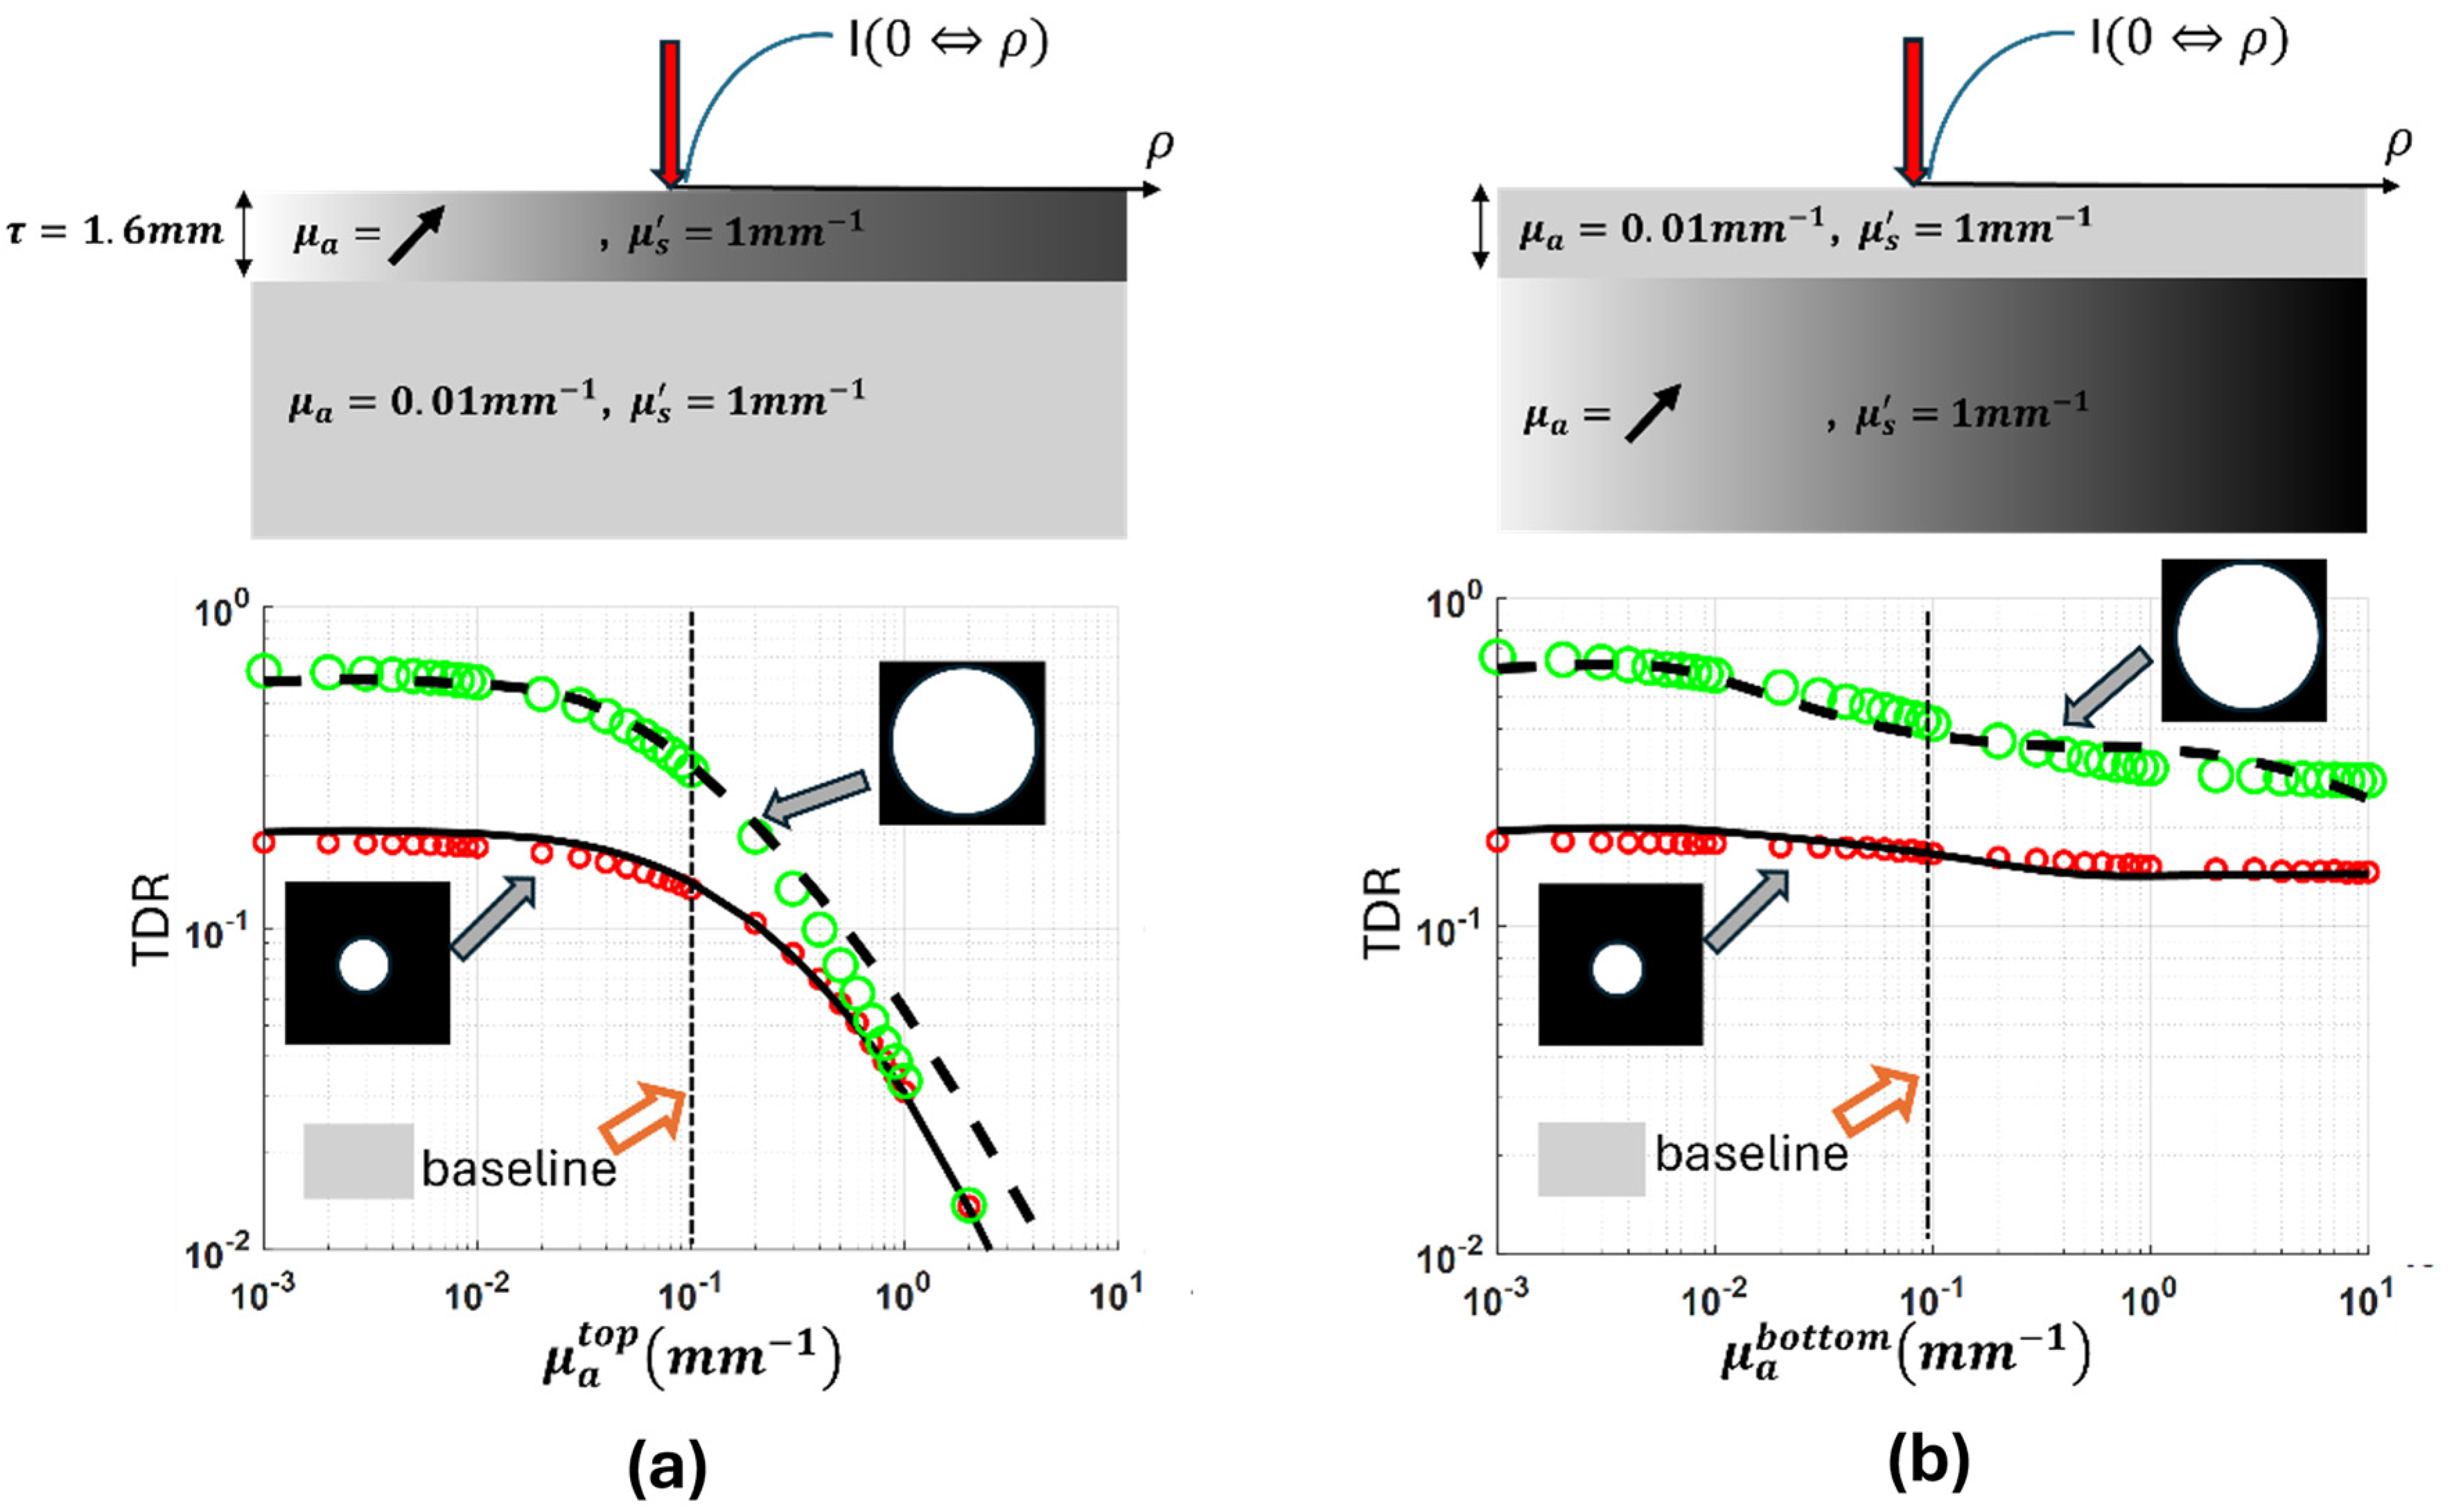
Figure 7 presents how the “capsular” model performs against MC simulations for the case of varying single inter-layer contrast of absorption with a 1.6 mm thick top layer. Figure 7a corresponds to varying the absorption of the top layer while keeping the below-surface layer at the baseline, and Figure 7b corresponds to keeping the top layer at the baseline and varying the absorption of the below-surface layer. The absorption of the layer not kept at the baseline was varied from 1/10 to 1000 times the baseline properties to cover four orders of magnitude. To make the scales consistent with other results of inter-layer contrasts, the range of the ordinate has been set as two orders of magnitude, which makes the data points at an inter-layer contrast greater than three below the abscissa line.
Figure 7.
The total CIAD diffuse reflectance over two different radii of the area of collection, including 1.5 mm and 12.5 mm, respectively, from a two-layer medium having the inter-layer contrast of absorption varied over four orders of magnitude. (a) The below-surface layer is set at the baseline properties, and the top layer, having a baseline reduced scattering coefficient of 1.0 mm−1, is set to have the absorption coefficient varied over 0.001 and 10 mm−1. (b) The top layer is set at the baseline properties, and the below-surface layer, having a baseline reduced scattering coefficient of 1.0 mm−1, is set to have the absorption coefficient varied over 0.001 and 10 mm−1.
The diffuse reflectance acquired at both the 3 mm diameter of channel A and the 30 mm diameter of channel C dropped remarkably as the top layer increased in absorption over the range shown. As the top layer’s absorption increases from 1/10th to the same as that of the baseline value of the below-surface layer, the diffuse reflectance acquired at both the 3 mm diameter of channel A and the 30 mm diameter of channel C reduced relatively slowly to their respective baseline values. As the top layer’s absorption increases from the same as that of the bottom layer to 1000 times the baseline value of the bottom layer, the diffuse reflectance acquired at both the 3 mm diameter of channel A and the 30 mm diameter of channel C reduced at much greater and accelerated rates compared to the former situation from their respective baseline values. Comparatively, if the variation of the inter-layer contrast of absorption localizes at the below-surface layer, the diffuse reflectance of the A channel had negligible change over the range of absorption change, though that of the C channel has a response that is slightly greater than that of the A channel.
4.2.2. Single Inter-Layer Contrast of Reduced Scattering Varied over Two Orders of Magnitude Associated with a 1.6 mm Top Layer
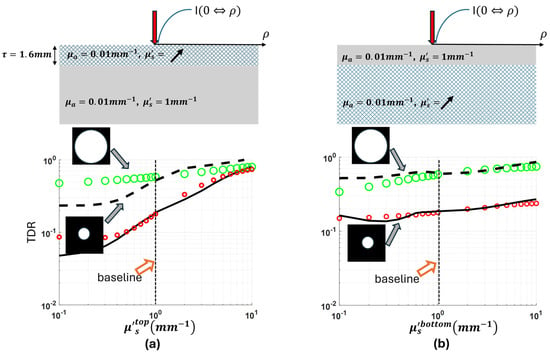
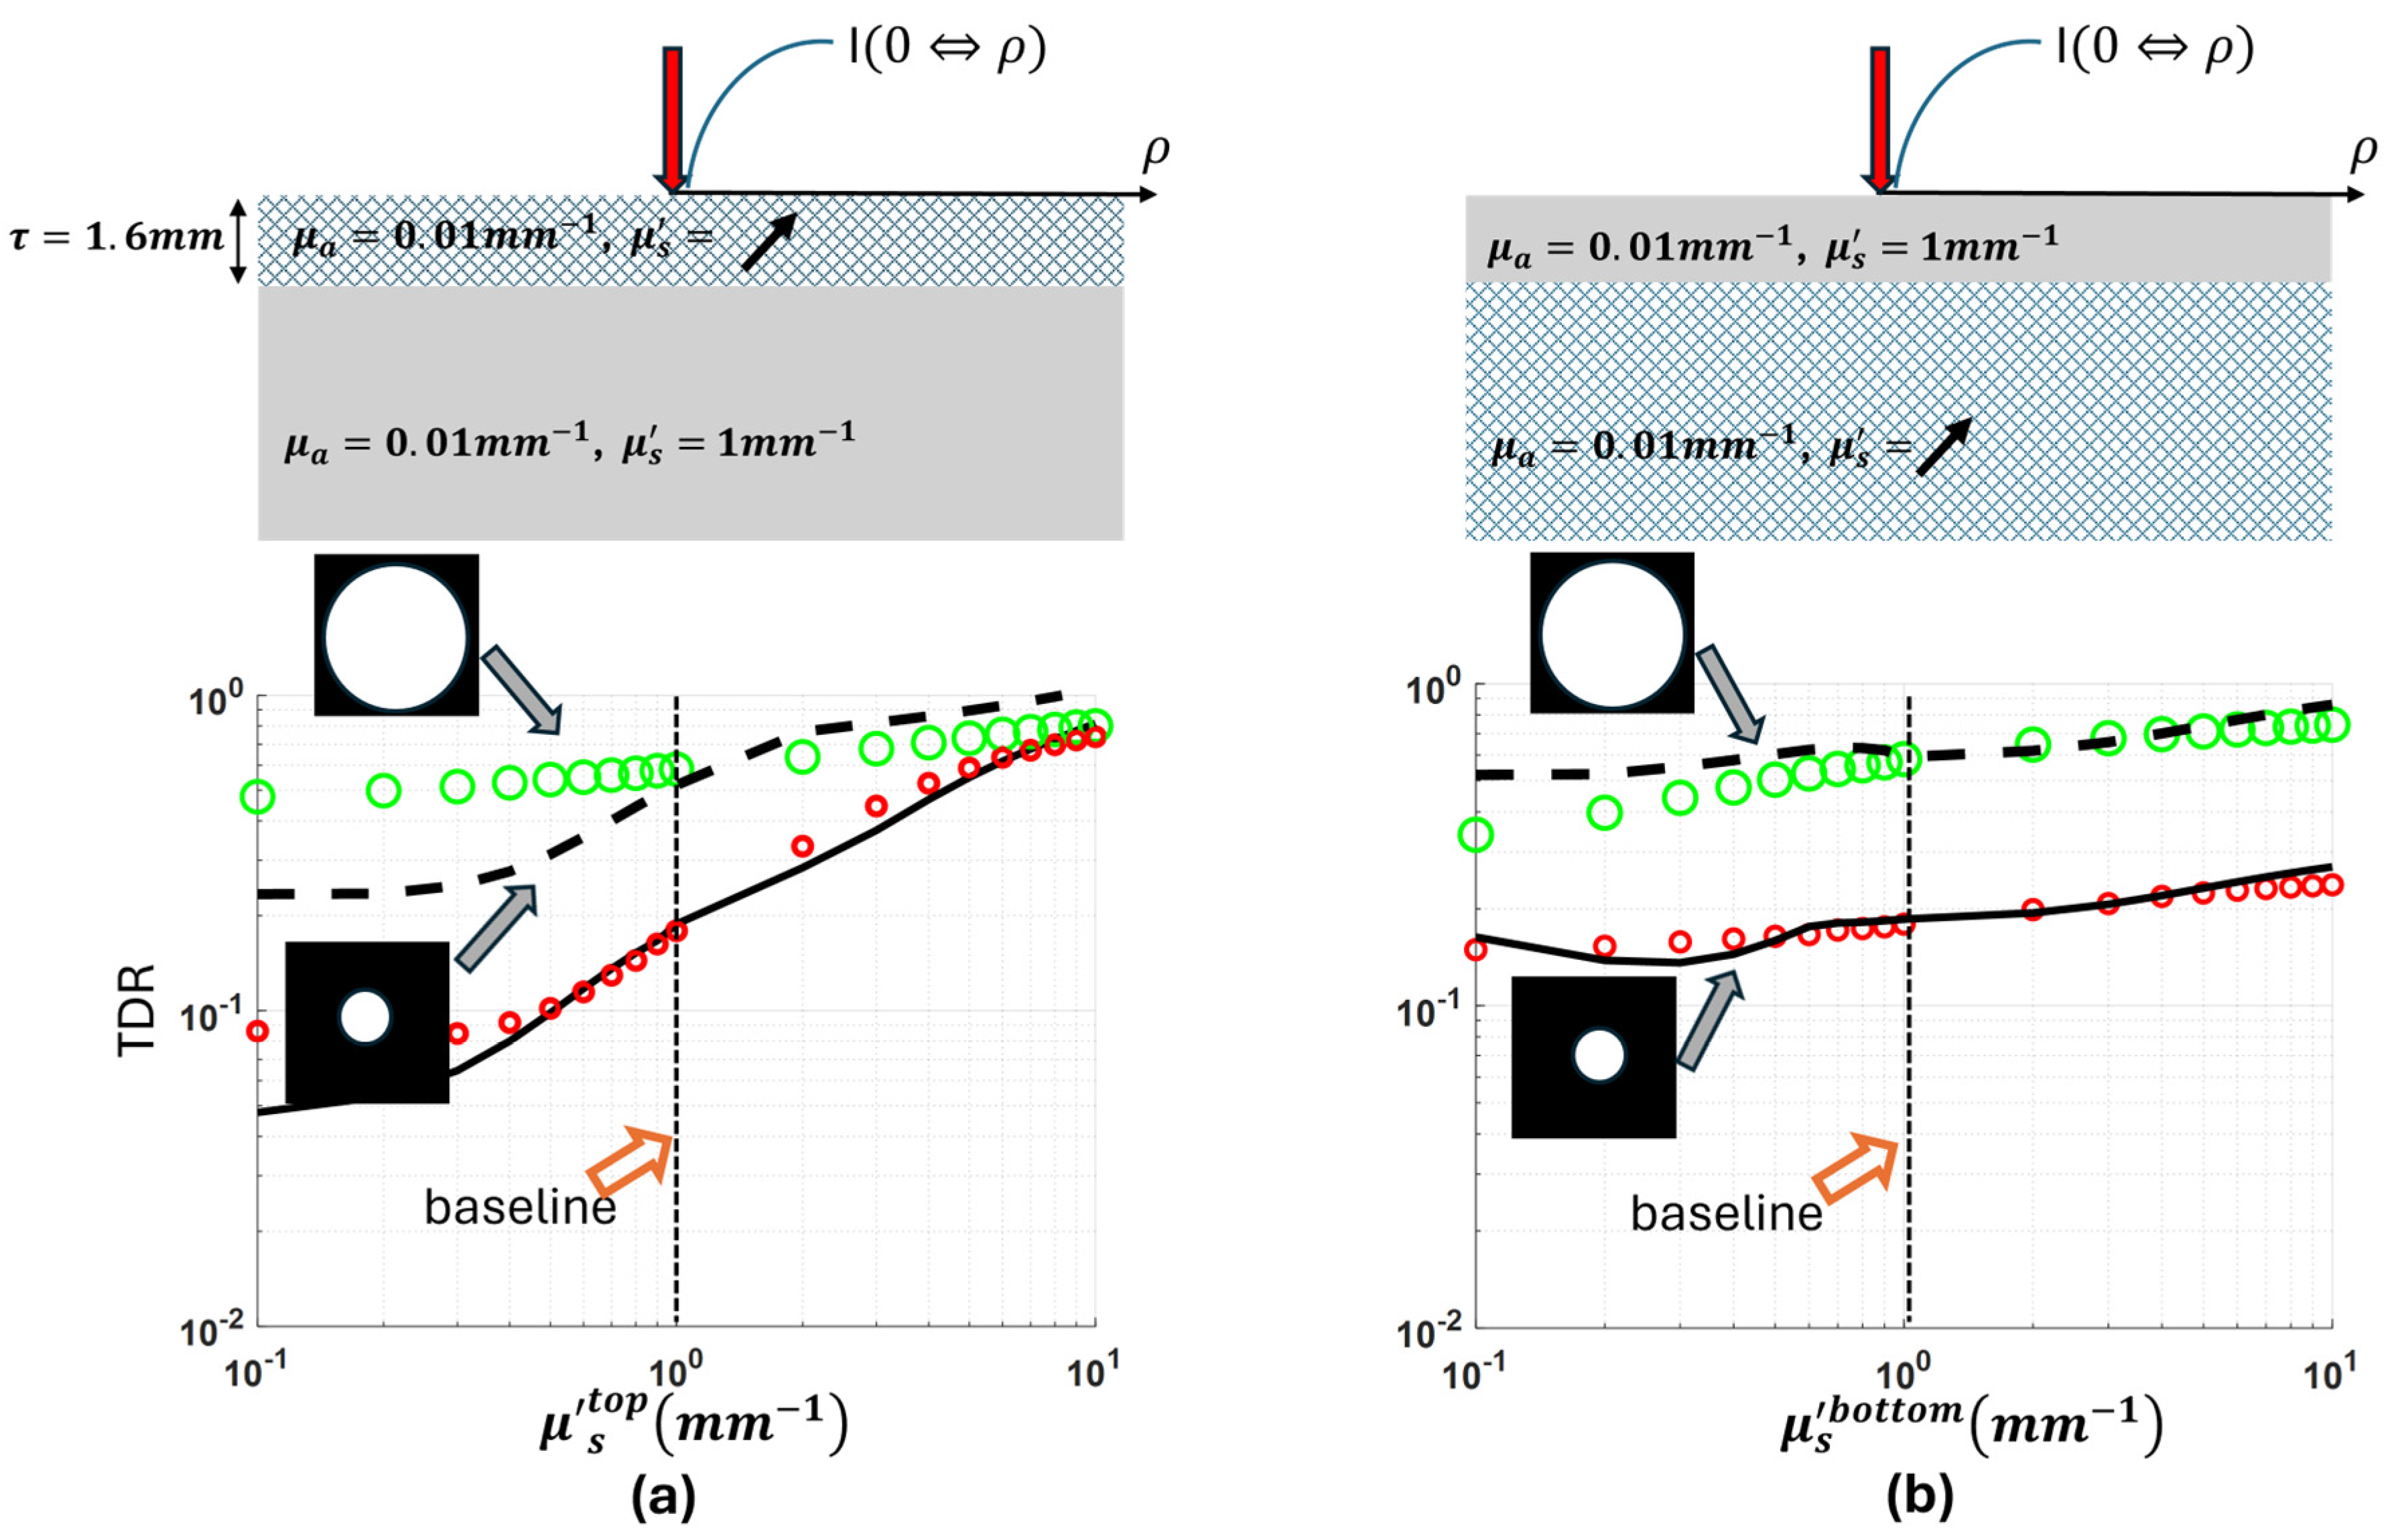
Figure 8 presents how the “capsular” model performs against MC simulations for the case of varying single inter-layer contrast of reduced scattering for a top layer that is 1.6 mm thick. Figure 8a corresponds to varying the reduced scattering of the top layer while keeping the below-surface layer at the baseline, and Figure 8b corresponds to keeping the top layer at the baseline and varying the reduced scattering of the below-surface layer. The reduced scattering of the layer not kept at the baseline was varied from 1/10 to 10 times the baseline properties.
Figure 8.
The total CIAD diffuse reflectance over two different radii of the area of collection, including 1.5 mm and 12.5 mm, respectively, from a two-layer medium having the inter-layer contrast of reduced scattering varied over two orders of magnitude. (a) The below-surface layer is set at the baseline properties, and the top layer, having a baseline absorption coefficient of 0.01 mm−1, is set to have the reduced scattering coefficient varied over 0.1 and 10 mm−1. (b) The top layer is set at the baseline properties, and the below-surface layer, having a baseline absorption coefficient of 0.01 mm−1, is set to have the reduced scattering coefficient varied over 0.1 and 10 mm−1.
The diffuse reflectance acquired at both the 3 mm diameter of channel A and the 30 mm diameter of channel C increases as the top layer increased in reduced scattering. As the top layer’s reduced scattering increases from 1/10 to 10 times the baseline value of the below-surface layer, the diffuse reflectance acquired at the 3 mm diameter of channel A increased much more in scale compared to that of the 30 mm diameter of channel C. For a less scattering top layer than the below-surface layer, the model has overestimated the effects caused by the inter-layer scattering contrast, and the overestimation is greater for a larger radius dimension of the area of collection. For a more scattering top layer than the below-surface layer, the model’s projection of the effect of the inter-layer scattering contrast has been consistent with MC simulations, which was explicit at a small dimension of the area of collection.
5. Discussion
The difference in the forms of myoglobin in beef in retail display has been verified to be associated with biochemically dictated formation of metmyoglobin that starts in the deeper layer of muscle first and then evolves towards the superficial layer [33]. It is worth noting that there could be various choices of DRS applicator probe configuration to realize two different sampling volumes for reaching different depths (e.g., superficial and deeper than 1 mm). However, the two channels of sampling different volumes with depth disparity must be consistent in system configuration, signal pattern, and dynamic range of the spectral signal affecting the operating workflow of data acquisition, whereas meeting the need of non-contact measurement is complicated and requires design consideration of compromising issues. The CIAD configuration utilized in a single non-contact channel has shown the capability of resolving the myoglobin forms on the superficial layer of beef [13]. Developing the capacity to assess the myoglobin forms on both the surface and the layer deeper than 1 mm requires at least two channels of DRS, justifying the use of two channels configured in the same CIAD geometry for instrumental considerations. In that regard, a model based on the “capsular” idea for assessing a two-layer medium has been developed specifically to address the CIAD geometry.
The performance of the “capsular” model of two-layer medium developed for the CIAD geometry has been compared against MC simulations in this study over extensive ranges of, albeit single-type, inter-layer contrasts. The results are encouraging, but the modeling challenges for guiding instrumentation remain. The A channel and C channel assessments differ in size by 10 times in the radial dimension and are configurable experimentally using two channels of collection with different optical magnifications of the same area centered on the POI. The 10 times greater radial dimension of the C channel over the A channel corresponds to a 10 times greater maximal SDS of the photons collected by the C channel compared to the A channel. That 10 times longer maximal SDS of the C channel versus the A channel shall provide deeper depth sensitivity of the C channel than the A channel. However, the longer path length is integrated with much lower weight of the diffuse reflectance signals than that of the shorter path length, and it reduces sensitivity to deeper layer spectral changes.
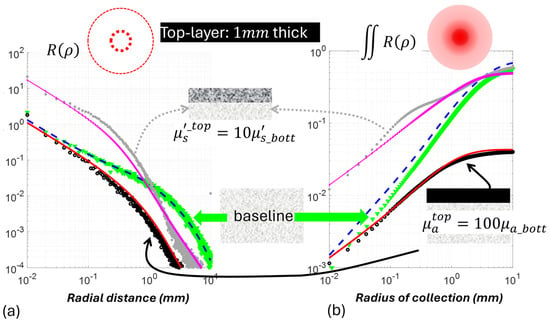
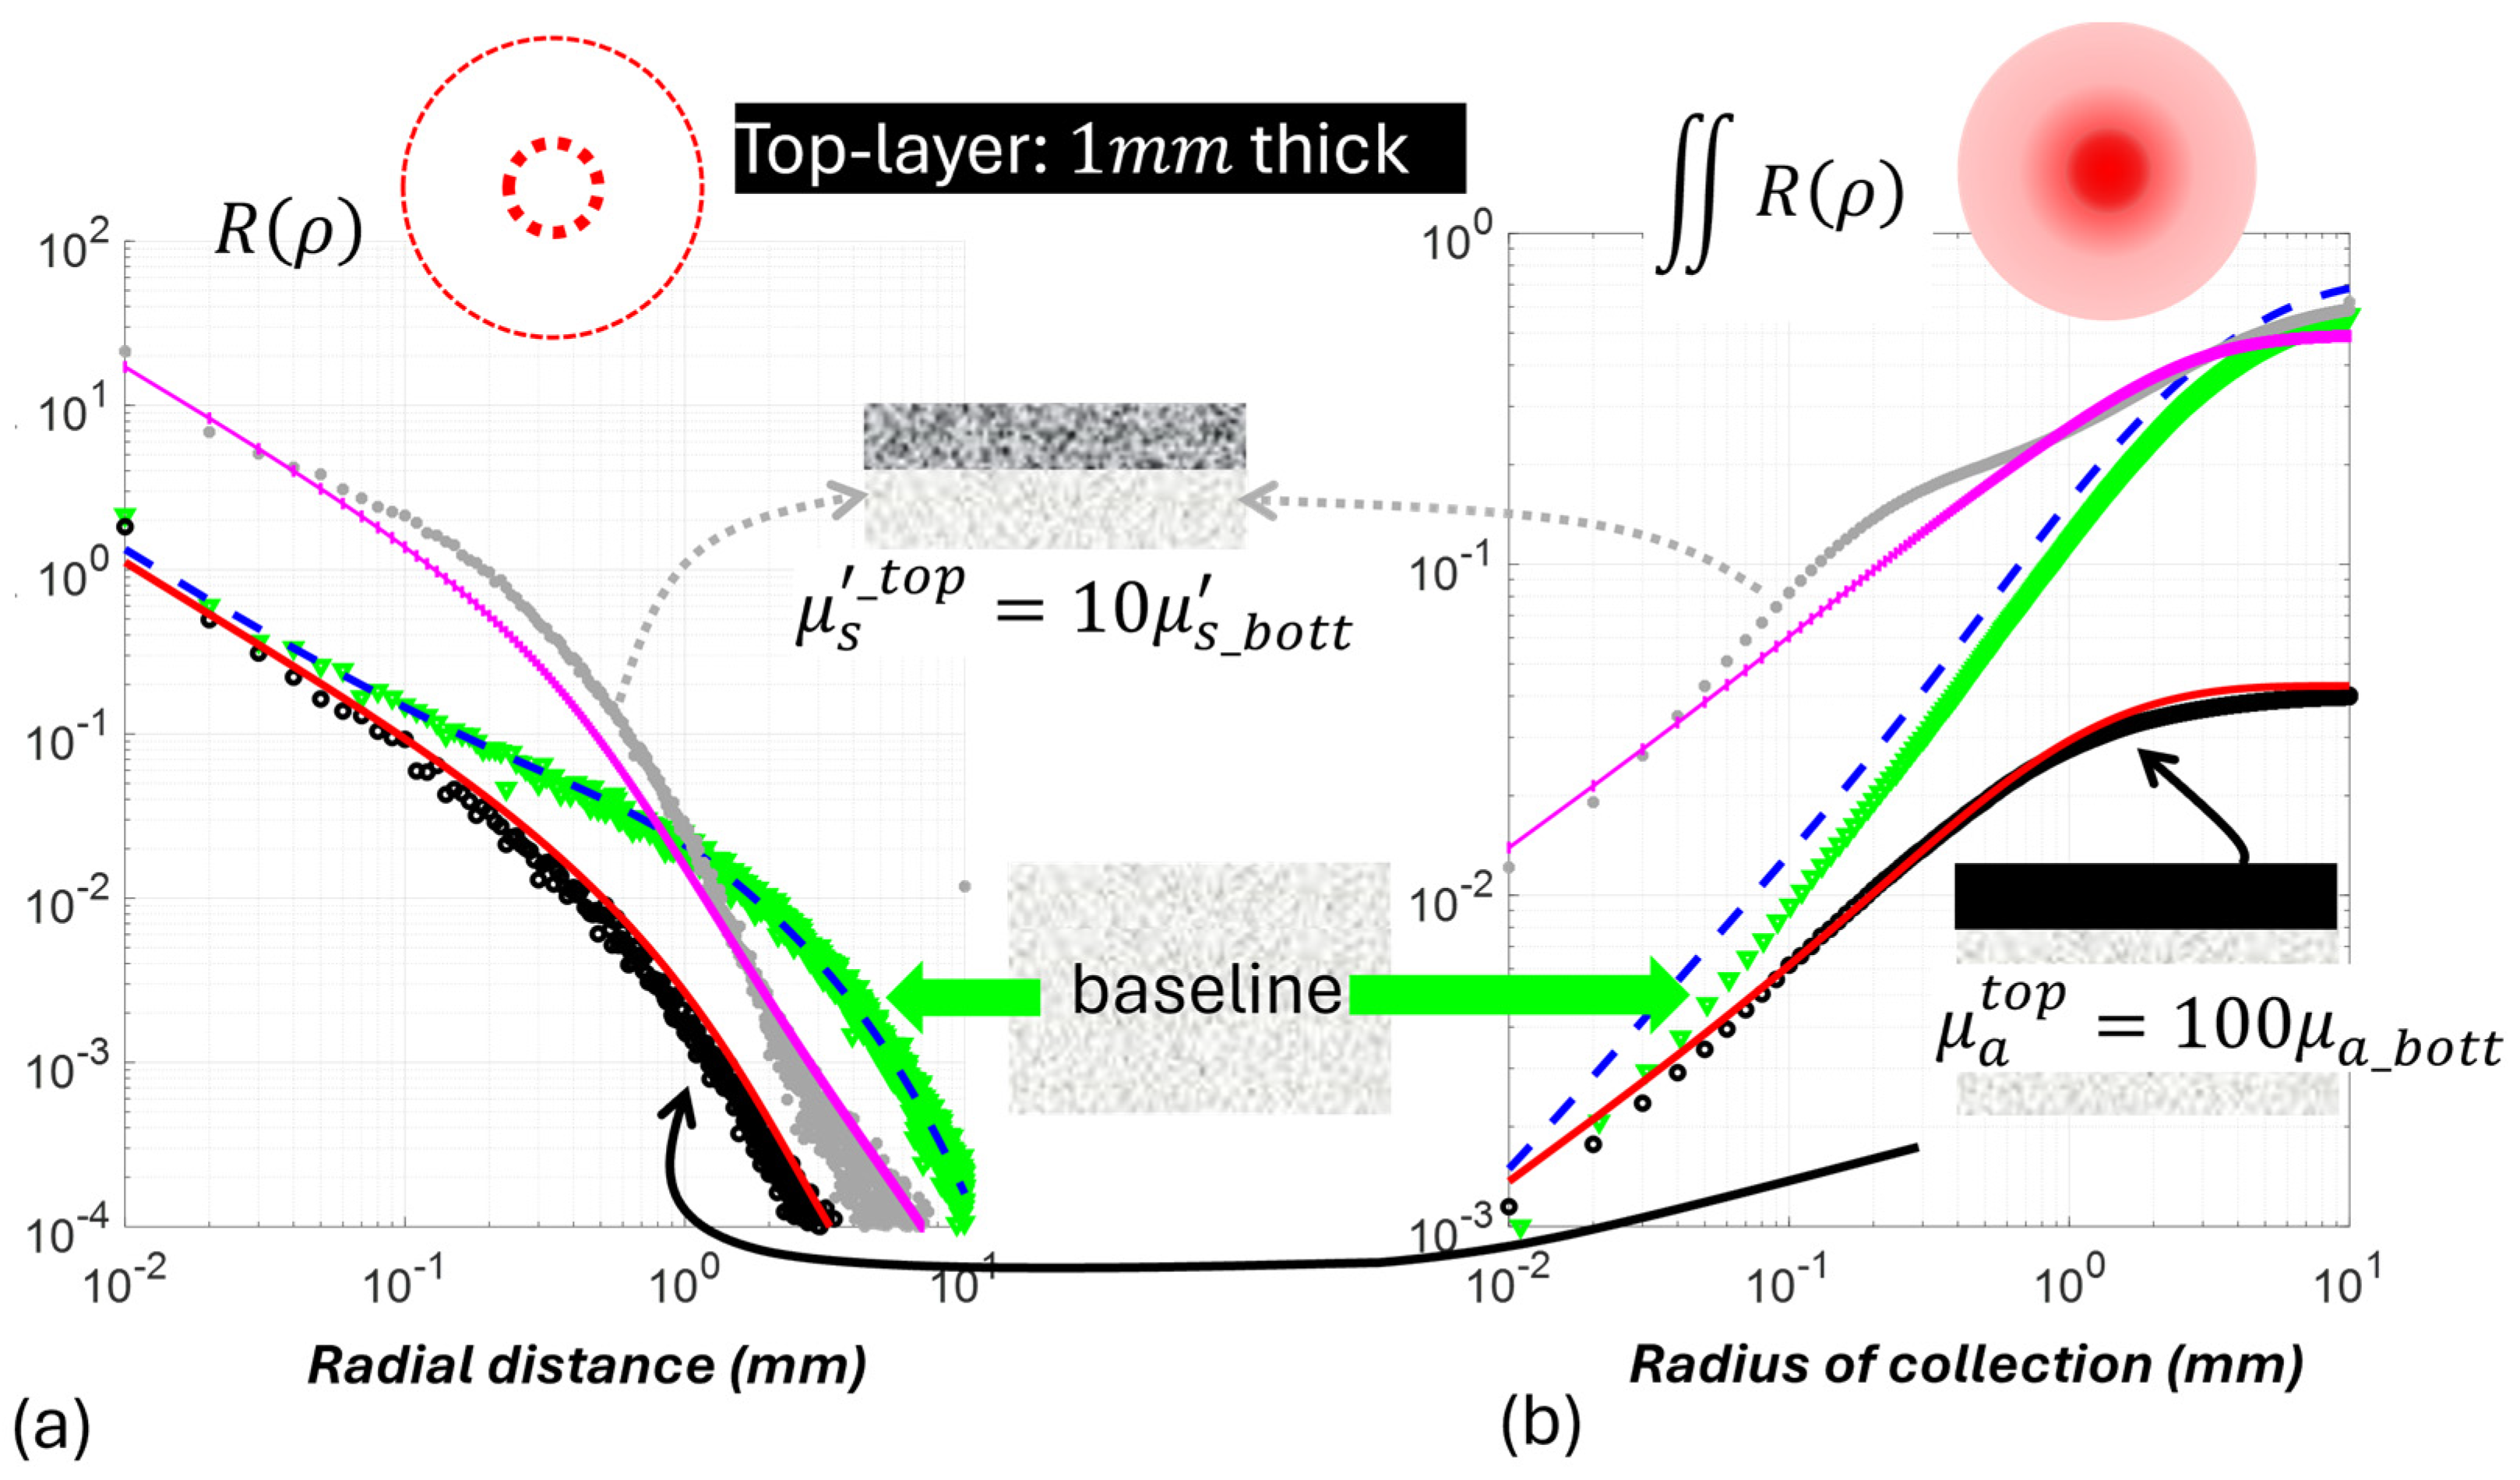
Both the A channel and the C channel respond to the single inter-layer contrast of absorption or scattering if occurring in the top layer, but their responses differ between the type of the single inter-layer contrast. The A channel is more sensitive than the C channel to the scattering variation of the top layer, whereas the C channel incurred a greater change than the A channel to the absorption variation of the top layer. This is not unexpected if we consider that this “capsule” model for radially integrated diffuse reflectance of CIAD shall inherit the characteristics of the “capsule” model of radially resolved diffuse reflectance shown previously. Figure 9 has the responses of the radially resolved capsule model of [23] and the radially integrated capsule model of this work applied to a 1 mm thick top layer that is either 100 times stronger in absorption or 10 times greater in reduced scattering as stress cases over the below-surface layer set at the baseline. The medium trace of green discrete markers shows the baseline pattern corresponding to a monolayer medium. The radially resolved diffuse reflectance in (a) decreases versus the increase in radial dimension, and the radially integrated diffuse reflectance in (b) increases versus the increase in radial dimension of integration until reaching a plateau. In response to the increase in the top-layer absorption, there is an across-the-board reduction in diffuse reflectance over that of the baseline, and the relative scale of reduction is greater for greater radial distance, as shown in (a). This translates to a greater reduction in the radially integrated diffuse reflectance, as shown in (b), and the absolute deviation from the baseline is greater at a greater radial dimension. Comparatively, the increase in top-layer scattering causes a large increase in diffuse reflectance over that of the baseline near the POI but a reduction in diffuse reflectance below the baseline at a radial distance that seems to be equivalent to a reduced scattering path length of the baseline medium. This translates to increased radially integrated diffuse reflectance, but the absolute deviation from the baseline is smaller at a greater radial dimension, and that could also make the response at larger radial dimensions go below the baseline. These patterns indicate that between the A channel and C channel, the A channel could be useful for assessing inter-layer scattering contrast, but the C channel might be more useful for assessing inter-layer absorption contrast.
Figure 9.
Comparisons of “capsule” model predicted radially dependent (a) and radially integrated (b) diffuse reflectance as a function of the geometric dimension, i.e., the radius of the geometry, from a two-layer medium of the top layer that is hyper-scattering or hyper-absorbing. The below-surface layer is set at the baseline properties, and the top layer has the reduced scattering coefficient of 10 mm−1 (10 times more scattering than the below-surface layer) and an absorption coefficient of 1.0 mm−1 (100 times stronger than the below-surface layer).
The limitations of this “capsule” model approach shall be noted as relating to the semi-empirical nature of weighting. The “capsule” model as developed has shown better overall performance on predicting the response to single inter-layer contrast of absorption than that to single inter-layer contrast of reduced scattering. The “capsule” model of CIAD diffuse reflectance from a two-layer medium has been developed using semi-empirical weighting between the CIAD diffuse reflectance of two monolayer media that individually take the top-layer and bottom-layer properties of the modeled two-layer medium. The weighing must involve single inter-layer contrast of absorption and single inter-layer contrast of scattering and convolve those contrasts with the top-layer thickness in algebraic forms to ease the implementation. Even though the model of CIAD diffuse reflectance of the monolayer medium may be robust, the weighing may have under- or over-modeled the relative scales of the dual-layer CIAD diffuse reflectance with respect to each of the monolayer diffuse reflectance. Another factor contributing to the much different performance of the model in predicting responses to single inter-layer contrasts of absorption and reduced scattering may relate to how realistic the model setting of the property is for the one that is the same for the two layers. In the modeling of single inter-layer contrast of absorption, the dual-layer medium has been assumed to be uniform in reduced scattering, whereas in the modeling of single inter-layer contrast of reduced scattering, the dual-layer medium has been assumed to be uniform in absorption. In a soft medium like beef, it is realistic to have grossly uniform morphology giving globally uniform scattering mixed with depth-varying myoglobin oxygenation that could potentially be modeled as layered differences of spectral absorption. Conversely, it may be unrealistic in beef to have uniform spectral absorption requiring uniform myoglobin oxygenation everywhere that is mixed with globally significantly different morphology to cause substantial spectral contrast in reduced scattering. Therefore, the modeled condition of single inter-layer contrast of reduced scattering without inter-layer contrast of absorption is unlikely realistic for application to beef. Future work is necessary to investigate if this “capsule” model approach specific to CIAD geometry for non-contact application can address the interplay between inter-layer contrast in absorption and inter-layer contrast in reduced scattering. Additionally, given that scattering contrast is often substantial in applications to tissue optics and other turbid media, the model developed could have notable limitations for heterogeneous or multilayer biological tissues with more complex geometries than those considered in this study. Testing with more realistic inter-layer geometries of scattering contrast will be needed to assess the potential of this model for monitoring tissue perfusion [36], blood oxygenation [37], tissue injury [38], and wound assessment [11,39], among other physiological changes.
To test the applicability of the model presented experimentally, however, will face challenges in developing a reliable dual-layer medium representing inter-layer contrast that either is continuously varied over a large range or has a more realistic inter-layer contrast. This reality is that interfacing between two layers in the experimental samples is not going to be consistent with the idealized interfacing of the two layers in the model that assumes the two layers to have the same refractive indices. Using layered media that have better optical interfacing between the two layers may make the medium closer to the condition that has been modeled upon to ease the model prediction; however, better-interfaced layered media could also mean less inter-layer contrast in the reduced scattering and absorption properties to provide sufficient sensitivity to the model prediction. Therefore, the true performance of this forward model may only be tested with samples that do have only one type of strong inter-layer contrast in the optical properties affecting the diffuse light propagation. Until the model can be tested on samples presenting idealizable inter-layer contrast, and the depth-dependent absorption can be verified with additional technologies, the applicability of this forward model will be uncertain. A subsequent paper of this work will report forward testing of the model on two-layer phantoms consisting of a 1.6 mm thick tissue covering an aqueous medium that has the scattering varied over more than two orders of magnitude by dissolving titanium oxide powders and absorption varied also over more than two orders of magnitude by mixing Indian ink.
Supplementary Materials
The following supporting information can be downloaded at: https://www.mdpi.com/article/10.3390/photonics13090866/s1.
Author Contributions
Conceptualization, D.P.; methodology, N.F.; software, N.F.; validation, N.F.; formal analysis, N.F.; investigation, N.F. and D.P.; resources, D.P.; data curation, N.F.; writing—original draft preparation, D.P.; writing—review and editing, N.F.; visualization, N.F. and D.P.; supervision, D.P.; project administration, D.P.; funding acquisition, D.P. All authors have read and agreed to the published version of the manuscript.
Funding
This work was supported by the U.S. Department of Agriculture, National Institute of Food and Agriculture (100005825) (2022-67017-36538).
Data Availability Statement
Data underlying the results presented in this paper are not publicly available at this time but may be obtained from the authors upon reasonable request.
Conflicts of Interest
The authors declare no conflicts of interest.
References
- Rudraiah, P.S.; Duadi, H.; Fixler, D. Bottom layer absorption coefficients extraction from two-layer phantoms based on crossover point in diffuse reflectance. J. Biomed. Opt. 2021, 26, 117001. [Google Scholar] [CrossRef] [Scilit] [PubMed]
- Takatani, S.; Graham, M.D. Theoretical Analysis of Diffuse Reflectance from a Two-Layer Tissue Model. IEEE Trans. Biomed. Eng. 1979, BME-26, 656–664. [Google Scholar] [CrossRef] [PubMed]
- Hennessy, R.; Markey, M.K.; Tunnell, J.W. Impact of one-layer assumption on diffuse reflectance spectroscopy of skin. J. Biomed. Opt. 2015, 20, 027001. [Google Scholar] [CrossRef] [Scilit] [PubMed]
- Mishra, V.; Warshi, M.K.; Sati, A.; Kumar, A.; Mishra, V.; Sagdeo, A.; Kumar, R.; Sagdeo, P.R. Diffuse reflectance spectroscopy: An effective tool to probe the defect states in wide band gap semiconducting materials. Mater. Sci. Semicond. Process. 2018, 86, 151–156. [Google Scholar] [CrossRef] [Scilit]
- Fovo, A.D.; Martínez-Weinbaum, M.; Oujja, M.; Castillejo, M.; Fontana, R. Reflectance Spectroscopy as a Novel Tool for Thickness Measurements of Paint Layers. Molecules 2023, 28, 4683. [Google Scholar] [CrossRef] [Scilit] [PubMed]
- Greening, G.; Mundo, A.; Rajaram, N.; Muldoon, T.J. Sampling depth of a diffuse reflectance spectroscopy probe for in-vivo physiological quantification of murine subcutaneous tumor allografts. J. Biomed. Opt. 2018, 23, 1. [Google Scholar] [CrossRef] [Scilit] [PubMed]
- Matthews, T.E.; Medina, M.; Maher, J.R.; Levinson, H.; Brown, W.J.; Wax, A. Deep tissue imaging using spectroscopic analysis of multiply scattered light. Optica 2014, 1, 105. [Google Scholar] [CrossRef] [Scilit]
- Fantini, S.; Blaney, G.; Sassaroli, A. Transformational change in the field of diffuse optics: From going bananas to going nuts. J. Innov. Opt. Health Sci. 2020, 13, 1930013. [Google Scholar] [CrossRef] [Scilit] [PubMed]
- Cheng, N.-Y.; Tzeng, S.-Y.; Fang, M.-C.; Kuo, C.-Y.; Lu, W.-H.; Yang, C.-C.; Tseng, S.-H. Handheld diffuse reflectance spectroscopy system for noninvasive quantification of neonatal bilirubin and hemoglobin concentrations: A pilot study. Biomed. Opt. Express 2023, 14, 467. [Google Scholar] [CrossRef] [Scilit] [PubMed]
- Milej, D.; Abdalmalak, A.; Janusek, D.; Diop, M.; Liebert, A.; Lawrence, K.S. Time-resolved subtraction method for measuring optical properties of turbid media. Appl. Opt. 2016, 55, 1507. [Google Scholar] [CrossRef] [Scilit] [PubMed]
- Schmidt, W.D.; Fassler, D.; Liebold, K.; Wollina, U. Contact-Free Spectroscopy of Leg Ulcers: Principle, Technique, and Calculation of Spectroscopic Wound Scores. J. Investig. Dermatol. 2001, 116, 531–535. [Google Scholar] [CrossRef] [Scilit] [PubMed]
- Gesesse, G.D.; Gomis-Berenguer, A.; Barthe, M.-F.; Ania, C.O. On the analysis of diffuse reflectance measurements to estimate the optical properties of amorphous porous carbons and semiconductor/carbon catalysts. J. Photochem. Photobiol. Chem. 2020, 398, 112622. [Google Scholar] [CrossRef] [Scilit]
- Piao, D.D.; Farahzadi, N.; Sharma, A.; Pfeifer, M.; Mafi, G.; Ramanathan, R. Non-contact diffuse reflectance spectroscopy using center-illuminated-area-detection modeled by a simple formulae for assessing myoglobin. Appl. Opt. 2024, 64, 681–693. [Google Scholar] [CrossRef] [Scilit] [PubMed]
- Bish, S.F. Development of a noncontact diffuse optical spectroscopy probe for measuring tissue optical properties. J. Biomed. Opt. 2011, 16, 120505. [Google Scholar] [CrossRef] [Scilit] [PubMed]
- Galaktionov, I.V.; Kudryashov, A.V.; Sheldakova, Y.V.; Byalko, A.A.; Borsoni, G. Measurement and correction of the wavefront of the laser light in a turbid medium. Quantum Electron. 2017, 47, 32–37. [Google Scholar] [CrossRef] [Scilit]
- Taitelbaum, H.; Havlin, S.; Weiss, G.H. Approximate theory of photon migration in a two-layer medium. Appl. Opt. 1989, 28, 2245. [Google Scholar] [CrossRef] [Scilit] [PubMed]
- Fabbri, F.; Sassaroli, A.; Henry, M.E.; Fantini, S. Optical measurements of absorption changes in two-layered diffusive media. Phys. Med. Biol. 2004, 49, 1183–1201. [Google Scholar] [CrossRef] [Scilit] [PubMed]
- Yudovsky, D.; Pilon, L. Simple and accurate expressions for diffuse reflectance of semi-infinite and two-layer absorbing and scattering media. Appl. Opt. 2009, 48, 6670. [Google Scholar] [CrossRef] [Scilit] [PubMed]
- Mantis, G.; Zonios, G. Simple two-layer reflectance model for biological tissue applications. Appl. Opt. 2009, 48, 3490. [Google Scholar] [CrossRef] [Scilit] [PubMed]
- Lisenko, S.A.; Kugeiko, M.M.; Firago, V.A.; Sobchuk, A.N. Analytical model of diffuse reflectance spectrum of skin tissue. Quantum Electron. 2014, 44, 69–75. [Google Scholar] [CrossRef] [Scilit]
- Zonios, G.; Dimou, A. Simple two-layer reflectance model for biological tissue applications: Lower absorbing layer. Appl. Opt. 2010, 49, 5026. [Google Scholar] [CrossRef] [Scilit] [PubMed]
- Sergeeva, E.; Kurakina, D.; Turchin, I.; Kirillin, M. A refined analytical model for reconstruction problems in diffuse reflectance spectroscopy. J. Innov. Opt. Health Sci. 2024, 17, 2342002. [Google Scholar] [CrossRef] [Scilit]
- Hennessy, R.; Goth, W.; Sharma, M.; Markey, M.K.; Tunnell, J.W. Effect of probe geometry and optical properties on the sampling depth for diffuse reflectance spectroscopy. J. Biomed. Opt. 2014, 19, 107002. [Google Scholar] [CrossRef] [Scilit] [PubMed][Green Version]
- Shahin, A. Simple and accurate model of diffuse reflectance for two-layer medium mimics brain tissues based on diffusion approximation. J. Opt. 2024, 53, 1779–1787. [Google Scholar] [CrossRef] [Scilit]
- Piao, D.; Borron, H.; Hawxby, A.; Wright, H.; Rubin, E.M. Effects of capsule on surface diffuse reflectance spectroscopy of the subcapsular parenchyma of a solid organ. J. Biomed. Opt. 2018, 23, 1. [Google Scholar] [CrossRef] [Scilit] [PubMed]
- Piao, D.; Patel, S. Simple empirical master–slave dual-source configuration within the diffusion approximation enhances modeling of spatially resolved diffuse reflectance at short-path and with low scattering from a semi-infinite homogeneous medium. Appl. Opt. 2017, 56, 1447. [Google Scholar] [CrossRef] [Scilit]
- Stelzle, F.; Zam, A.; Adler, W.; Tangermann-Gerk, K.; Douplik, A.; Nkenke, E.; Schmidt, M. Optical Nerve Detection by Diffuse Reflectance Spectroscopy for Feedback Controlled Oral and Maxillofacial Laser Surgery. J. Transl. Med. 2011, 9, 20. [Google Scholar] [CrossRef] [Scilit] [PubMed]
- Karsten, A.E.; Singh, A.; Karsten, P.A.; Braun, M.W.H. Diffuse reflectance spectroscopy as a tool to measure the absorption coefficient in skin: System calibration. Lasers Med. Sci. 2013, 28, 437–444. [Google Scholar] [CrossRef] [Scilit] [PubMed]
- Hayakawa, C.K.; Malenfant, L.; Ranasinghesagara, J.; Cuccia, D.J.; Spanier, J.; Venugopalan, V. MCCL: An open-source software application for Monte Carlo simulations of radiative transport. J. Biomed. Opt. 2022, 27, 083005. [Google Scholar] [CrossRef] [Scilit] [PubMed]
- Sun, T.; Piao, D. Simple analytical total diffuse reflectance over a reduced-scattering-pathlength scaled dimension of [10−5, 10−1] from a medium with HG scattering anisotropy. Appl. Opt. 2019, 58, 9279. [Google Scholar] [CrossRef] [Scilit] [PubMed]
- Sun, T.; Piao, D. Diffuse photon remission associated with the center-illuminated-area-detection geometry: Part I, an approach to the steady-state model. Appl. Opt. 2022, 61, 9143. [Google Scholar] [CrossRef] [Scilit] [PubMed]
- Piao, D.; Denzer, M.L.; Mafi, G.; Ramanathan, R. Daily Quantification of Myoglobin Forms on Beef Longissimus Lumborum Steaks Over 7 Days of Display by Near-infrared Diffuse Reflectance Spectroscopy. Meat Muscle Biol. 2022, 5, 1–14. [Google Scholar] [CrossRef] [Scilit]
- Denzer, M.L.; Piao, D.; Pfeiffer, M.; Mafi, G.; Ramanathan, R. Novel needle-probe single-fiber reflectance spectroscopy to quantify sub-surface myoglobin forms in beef psoas major steaks during retail display. Meat Sci. 2024, 210, 109439. [Google Scholar] [CrossRef] [Scilit] [PubMed]
- Piao, D.; Sun, T.; Farahzadi, N. Diffuse photon remission associated with the center-illuminated-area-detection geometry. III. Perspectives on the patterns of saturation. Appl. Opt. 2024, 63, 2294. [Google Scholar] [CrossRef] [Scilit] [PubMed]
- Arai, K. Monte Carlo Ray Tracing based Method for Investigation of Multiple Reflection among Trees. Int. J. Adv. Comput. Sci. Appl. 2021, 12, 176–183. [Google Scholar] [CrossRef] [Scilit]
- Geldof, F.; Dashtbozorg, B.; Hendriks, B.H.W.; Sterenborg, H.J.C.M.; Ruers, T.J.M. Layer thickness prediction and tissue classification in two-layered tissue structures using diffuse reflectance spectroscopy. Sci. Rep. 2022, 12, 1698. [Google Scholar] [CrossRef] [Scilit] [PubMed]
- Fredriksson, I. Inverse Monte Carlo method in a multilayered tissue model for diffuse reflectance spectroscopy. J. Biomed. Opt. 2012, 17, 047004. [Google Scholar] [CrossRef] [Scilit] [PubMed]
- Stelzle, F.; Tangermann-Gerk, K.; Adler, W.; Zam, A.; Schmidt, M.; Douplik, A.; Nkenke, E. Diffuse reflectance spectroscopy for optical soft tissue differentiation as remote feedback control for tissue-specific laser surgery. Lasers Surg. Med. 2010, 42, 319–325. [Google Scholar] [CrossRef] [Scilit] [PubMed]
- Lei, J.; Rodriguez, S.; Jayachandran, M.; Solis, E.; Epnere, K.; Perez-Clavijo, F.; Wigley, S.; Godavarty, A. Assessing the Healing of Venous Leg Ulcers Using a Noncontact Near-Infrared Optical Imaging Approach. Adv. Wound Care 2018, 7, 134–143. [Google Scholar] [CrossRef] [Scilit] [PubMed]

Disclaimer/Publisher’s Note: The statements, opinions and data contained in all publications are solely those of the individual author(s) and contributor(s) and not of MDPI and/or the editor(s). MDPI and/or the editor(s) disclaim responsibility for any injury to people or property resulting from any ideas, methods, instructions or products referred to in the content. |
© 2026 by the authors. Licensee MDPI, Basel, Switzerland. This article is an open access article distributed under the terms and conditions of the Creative Commons Attribution (CC BY) license.