


Abstract
Stimulated Brillouin scattering (SBS) constrains the launch peak power in long Erbium-Doped Fiber Amplifier (EDFA)-amplified pulsed fiber-optic sensing links, but its dependence on duty cycle is not determined by peak power alone. When the repetition rate is fixed and the pulse width is varied, the duty cycle changes both the pulse-limited Brillouin interaction length in the fiber and the pulse peak power delivered by the EDFA. Here, we treat duty cycle as a coupled SBS operating margin parameter and examine this dependence in a 25 km standard single-mode fiber link operated at 4 kHz. The analysis compares the duty-cycle-dependent SBS threshold, estimated from the pulse-limited interaction length, with the launched on-state pulse power extracted from Amplified Spontaneous Emission (ASE)-filtered signal band average power measurements. A Continuous-Wave (CW) sweep gave a reference SBS threshold of 5.5 dBm. In pulsed operation, the extracted launched pulse peak power decreased by 23.8 dB across the investigated duty cycle range, whereas the measured backward optical power increased by 20.3 dB up to its maximum and then decreased by 7.1 dB at higher duty cycle. Variable Optical Attenuator (VOA)-controlled launch power sweeps showed no 3 dB onset at duty cycle (D) of 0.5% within the measured range, while onsets between 1.76 dBm and 3.49 dBm were extracted for duty cycles from 1% to 50%. These results show that SBS risk in EDFA-assisted pulsed sensing links cannot be assessed only from total EDFA output power. Signal band launch power calibration after ASE rejection is required to estimate the pulse peak power relevant to SBS onset. The validation is limited to power-meter-based backward power measurements and does not spectrally resolve the Brillouin Stokes component.
1. Introduction
Distributed fiber optic sensing (DFOS) systems obtain spatially resolved information over extended fiber links and are used in structural, infrastructure, marine, pipeline, and geophysical monitoring applications [1,2,3,4,5]. In pulsed implementations, the detected signal is generated by weak optical backscatter from the sensing fiber. Phase-sensitive optical time domain reflectometry relies on Rayleigh backscatter [6], whereas Brillouin optical time domain reflectometry extracts spatial information from the Brillouin backscattered response [7,8]. Brillouin-based distributed sensing has also been implemented in the frequency domain for simultaneous temperature and strain measurement in standard telecom fibers [9]. In all cases, increasing the sensing range or the detected signal level requires sufficient optical energy in each interrogation pulse [10]. The launched pulse peak power is therefore a central design parameter in long-range pulsed fiber links.
In standard single-mode fiber (SMF), the maximum usable launch peak power is constrained by stimulated Brillouin scattering (SBS). SBS transfers optical power from the forward wave to a backward-propagating Stokes wave through an acoustic interaction [11]. When the launched pulse peak power exceeds the SBS threshold, the backward Stokes component grows rapidly and distorts the forward signal [12]. This limitation creates a practical trade-off in pulsed fiber links, where increasing the pulse energy improves the available backscatter signal, at the cost of increased nonlinear backward scattering [13]. Therefore, assessing SBS onset in pulsed fiber links requires consideration of both the launched pulse peak power and the effective Brillouin interaction length.
Several methods have been developed to increase the SBS threshold or reduce the SBS gain experienced by the optical signal. Phase or frequency modulation can broaden the optical linewidth and reduce the spectral power density that drives the Brillouin interaction [14]. Related implementations include pseudo-random phase modulation and linearly chirped diode laser operation in narrow-linewidth fiber systems [15,16]. The achievable suppression depends on the modulation format and on the transmitter configuration [17]. Other approaches broaden the effective Brillouin gain spectrum through distributed strain or temperature variations along the fiber [18], while combined spectral and temporal redistribution of optical power has also been examined for high-power fiber transmission [13]. These approaches act mainly on the optical spectrum or on the fiber response. In EDFA-amplified sensing fiber links, however, the amplifier operating point and the pulse timing also determine the launched pulse peak power.
Duty cycle affects an EDFA-amplified pulsed link through two separate mechanisms. On the fiber side, when the repetition rate is fixed and the duty cycle is varied by changing the pulse width, the counter-propagating pump Stokes overlap length changes. Analytical treatments of SBS thresholds for square pulses and experimental studies of pulsed fiber amplifiers have shown that pulse duration and repetition rate affect the SBS threshold under pulsed operation [19,20], while pulse duration SBS threshold measurements have been reported in fiber amplifiers [21]. On the transmitter side, EDFAs are commonly used to increase the optical energy delivered to the fiber, but their gain depends on the extracted optical power. Pulse amplification can also introduce systematic errors in Brillouin sensing measurements if the amplifier response is not considered [22]. This behavior is expected because EDFA operation is governed by the coupled evolution of the pump, signal, erbium population, and amplified spontaneous emission [23]. Consequently, adjusting the duty cycle can modify both the effective SBS threshold of the fiber and the pulse peak power delivered by the EDFA.
The combined effect of these two duty-cycle-dependent quantities has not been fully investigated in EDFA-amplified pulsed fiber links. Existing SBS threshold descriptions account for the fiber interaction length, and EDFA models describe amplifier gain saturation, but these effects are often treated separately. This separation is inadequate for a duty cycle sweep, where a single control parameter simultaneously changes the pulse limited Brillouin interaction length and the pulse peak power delivered by the EDFA. A low duty cycle can provide high launched pulse peak power but a short interaction length, whereas a larger duty cycle can increase the interaction length while reducing the available pulse peak power through duty cycle averaging and EDFA gain compression. The resulting SBS response, result of interaction length and pulse peak power, becomes non-monotonic.
In this work, we experimentally examine this coupled duty cycle dependence in an EDFA-amplified 25 km SMF link operated at a fixed repetition rate of 4 kHz. The study combines pulse-limited SBS threshold scaling with ASE-filtered launch power calibration to interpret the measured backward power response as an operating margin problem. A CW sweep is used to establish a reference SBS threshold. A duty cycle sweep is then used to measure the non-monotonic backward-power response, and VOA-controlled launch-power sweeps are used to extract the duty-cycle-dependent onset of nonlinear backward-power growth. The measurements show that the backward optical power increases by 20.3 dB up to its maximum and then decreases by 7.1 dB at higher duty cycle, while the extracted launched pulse peak power decreases by 23.8 dB across the investigated range. These results identify duty cycle as an SBS operating margin parameter in EDFA-amplified fiber links. The study treats SBS not only as a transmitter power limit, but as a nonlinear fiber link constraint set by the sensing fiber length, the pulse duration, and the pulse peak power delivered to the fiber.
2. Materials and Methods
The duty cycle dependence of the measured backward optical power is described using a power-margin model that compares the launched pulse peak power with the effective SBS threshold of the fiber link. At fixed repetition rate, varying the duty cycle by changing the pulse width modifies the temporal overlap between the forward pulse and the backward-propagating Stokes wave. This changes the effective Brillouin interaction length and, consequently, the peak power threshold for SBS onset. In an EDFA-amplified pulsed transmitter, the launched peak power varies with duty cycle since gain compression depends on the average optical power extracted from the amplifier. The measured SBS response is therefore interpreted from the relative evolution of two quantities: the duty-cycle-dependent threshold and the launched pulse peak power .
2.1. Experimental Configuration
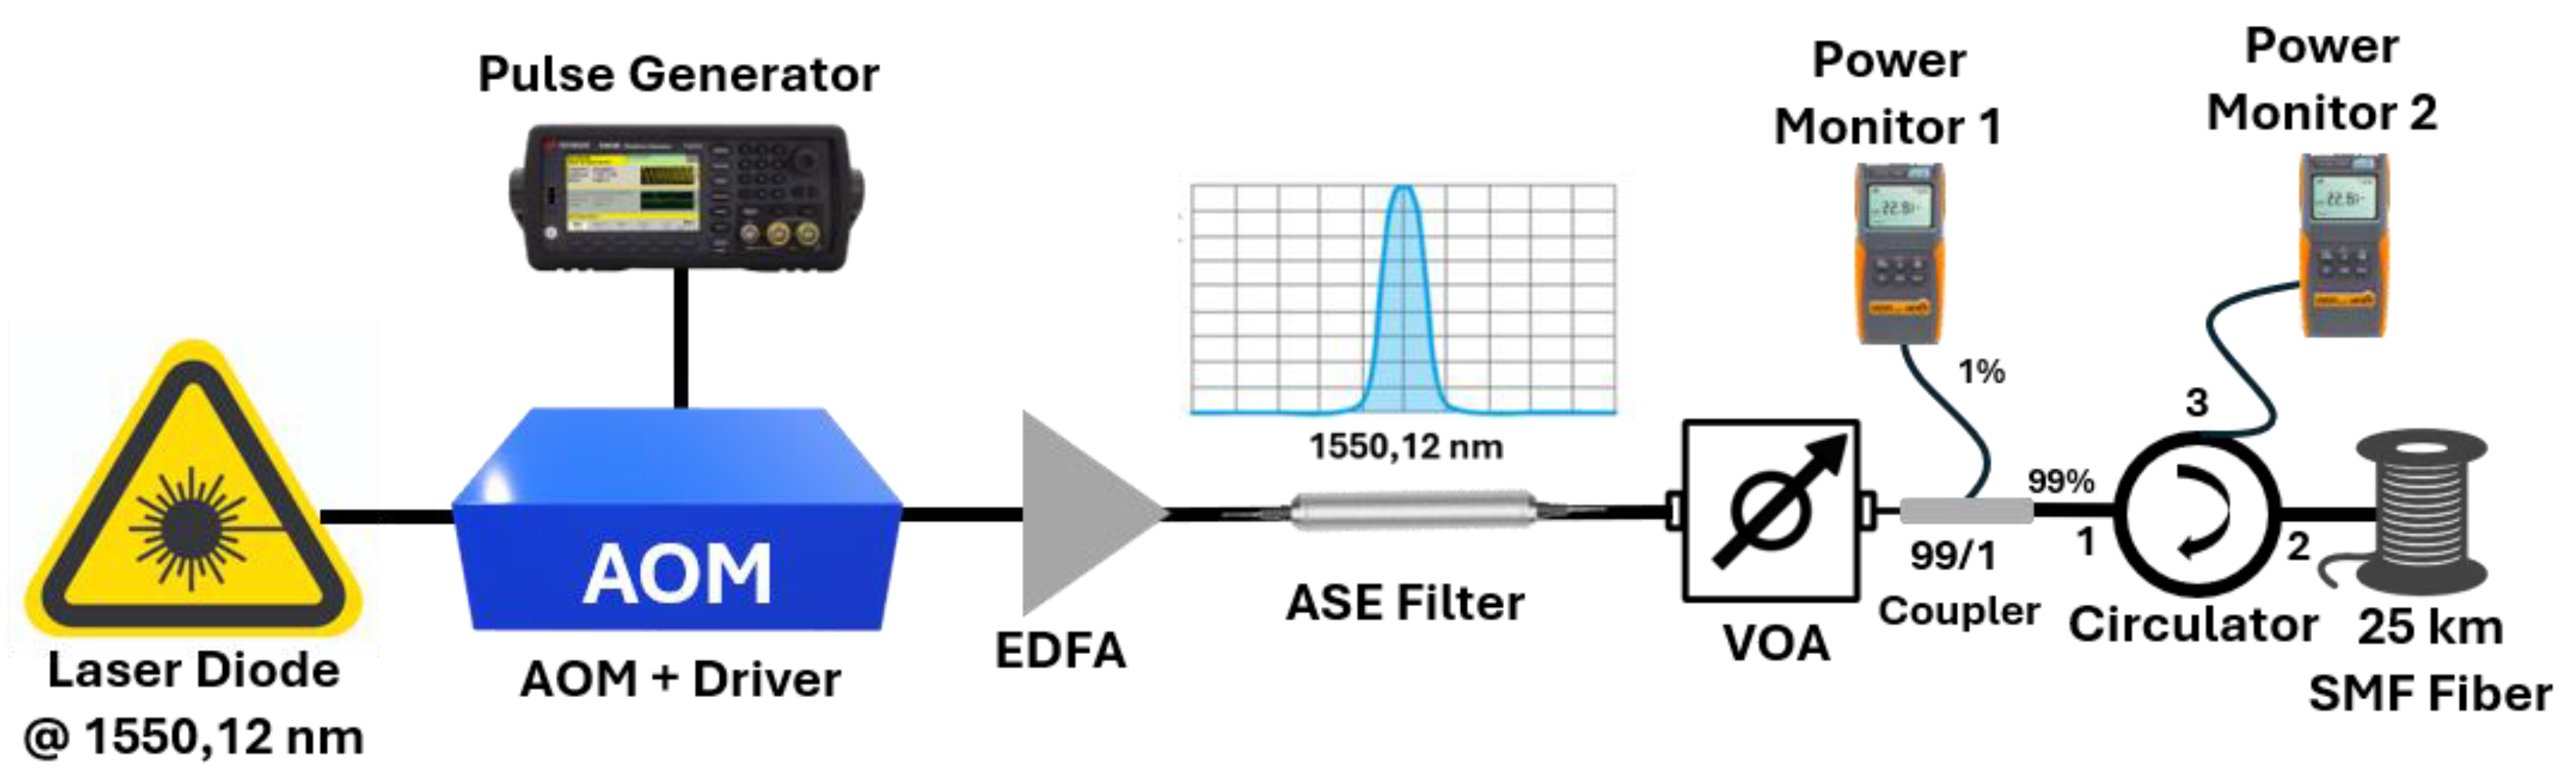
The experimental setup was configured to measure duty-cycle-dependent nonlinear backward optical power in an EDFA-amplified pulsed SMF link and is shown in Figure 1. A narrow-linewidth continuous-wave laser operating at 1550.12 nm was used as the optical source. Rectangular optical pulses were generated using a two-port fiber-coupled acousto-optic modulator operating at 1550 nm (Gooch & Housego/NEOS Technologies, model 23080-1-1.55-LTD-FO, S/N:197945). The AOM has RF frequency of 80 MHz, maximum optical rise time of 50 ns, and extinction ratio of 60 dB. The RF drive was gated using a Keysight 33600A pulse generator to generate an optical pulse train at a fixed repetition rate of 4 kHz, corresponding to a pulse period of 250 μs. The duty cycle varied by changing the pulse width. The pulsed optical signal was amplified by an erbium-doped fiber amplifier (EDFA). An OPNETI C34 25 GHz DWDM optical filter centered at 1550.12 nm (OPNETI DWDM-1x2-0.25-1-34-250-1-1-FA) was inserted after the EDFA to suppress out-of-band amplified spontaneous emission (ASE) before launch-power calibration. The filter has a specified channel passband of at least 0.10 nm at the −0.8 dB level, a maximum pass-channel insertion loss of 1.5 dB, and a center wavelength accuracy of ±0.02 nm. The filtered signal was launched into a 25 km standard single-mode fiber link through a 99/1 tap coupler used to monitor the launched optical power. A circulator was used to route the backward-propagating optical power from the fiber to an optical power meter. The measured backward optical power includes all backward components reaching the detection path, including SBS, Rayleigh backscatter, residual reflections, and any ASE-related contribution transmitted through the detection path. Since the detection was performed with an optical power meter, the Brillouin Stokes component was not spectrally isolated in this measurement. The experiment therefore corresponds to an unseeded, self-seeded Stimulated Brillouin Scattering (SBS) threshold configuration, in which the backward Stokes field originates from the spontaneous Brillouin background and is amplified through stimulated Brillouin gain.
Figure 1.
Experimental setup used for the EDFA-amplified pulsed fiber-link measurements.
2.2. Pulse-Limited Brillouin Interaction Length
For a rectangular optical pulse train, the duty cycle is where D is the duty cycle, is the pulse repetition rate, and is the optical pulse width. Supposing is fixed and D is varied by changing , the duty cycle sweep changes the temporal extent of the optical pulse. For pulses longer than the acoustic lifetime, the SBS interaction can be treated locally as quasi-steady state during the passage of each pulse. In a counter-propagating pump Stokes geometry, the interaction is limited by the distance over which the forward pulse and the backward Stokes wave overlap in time. Following the round-trip overlap condition used in square-pulse SBS analyses, the pulse-limited interaction length was estimated from the distance over which the forward pulse and the backward Stokes wave overlap [19,20]. With , the interaction length is given by , capped by the physical fiber length (L), thus:
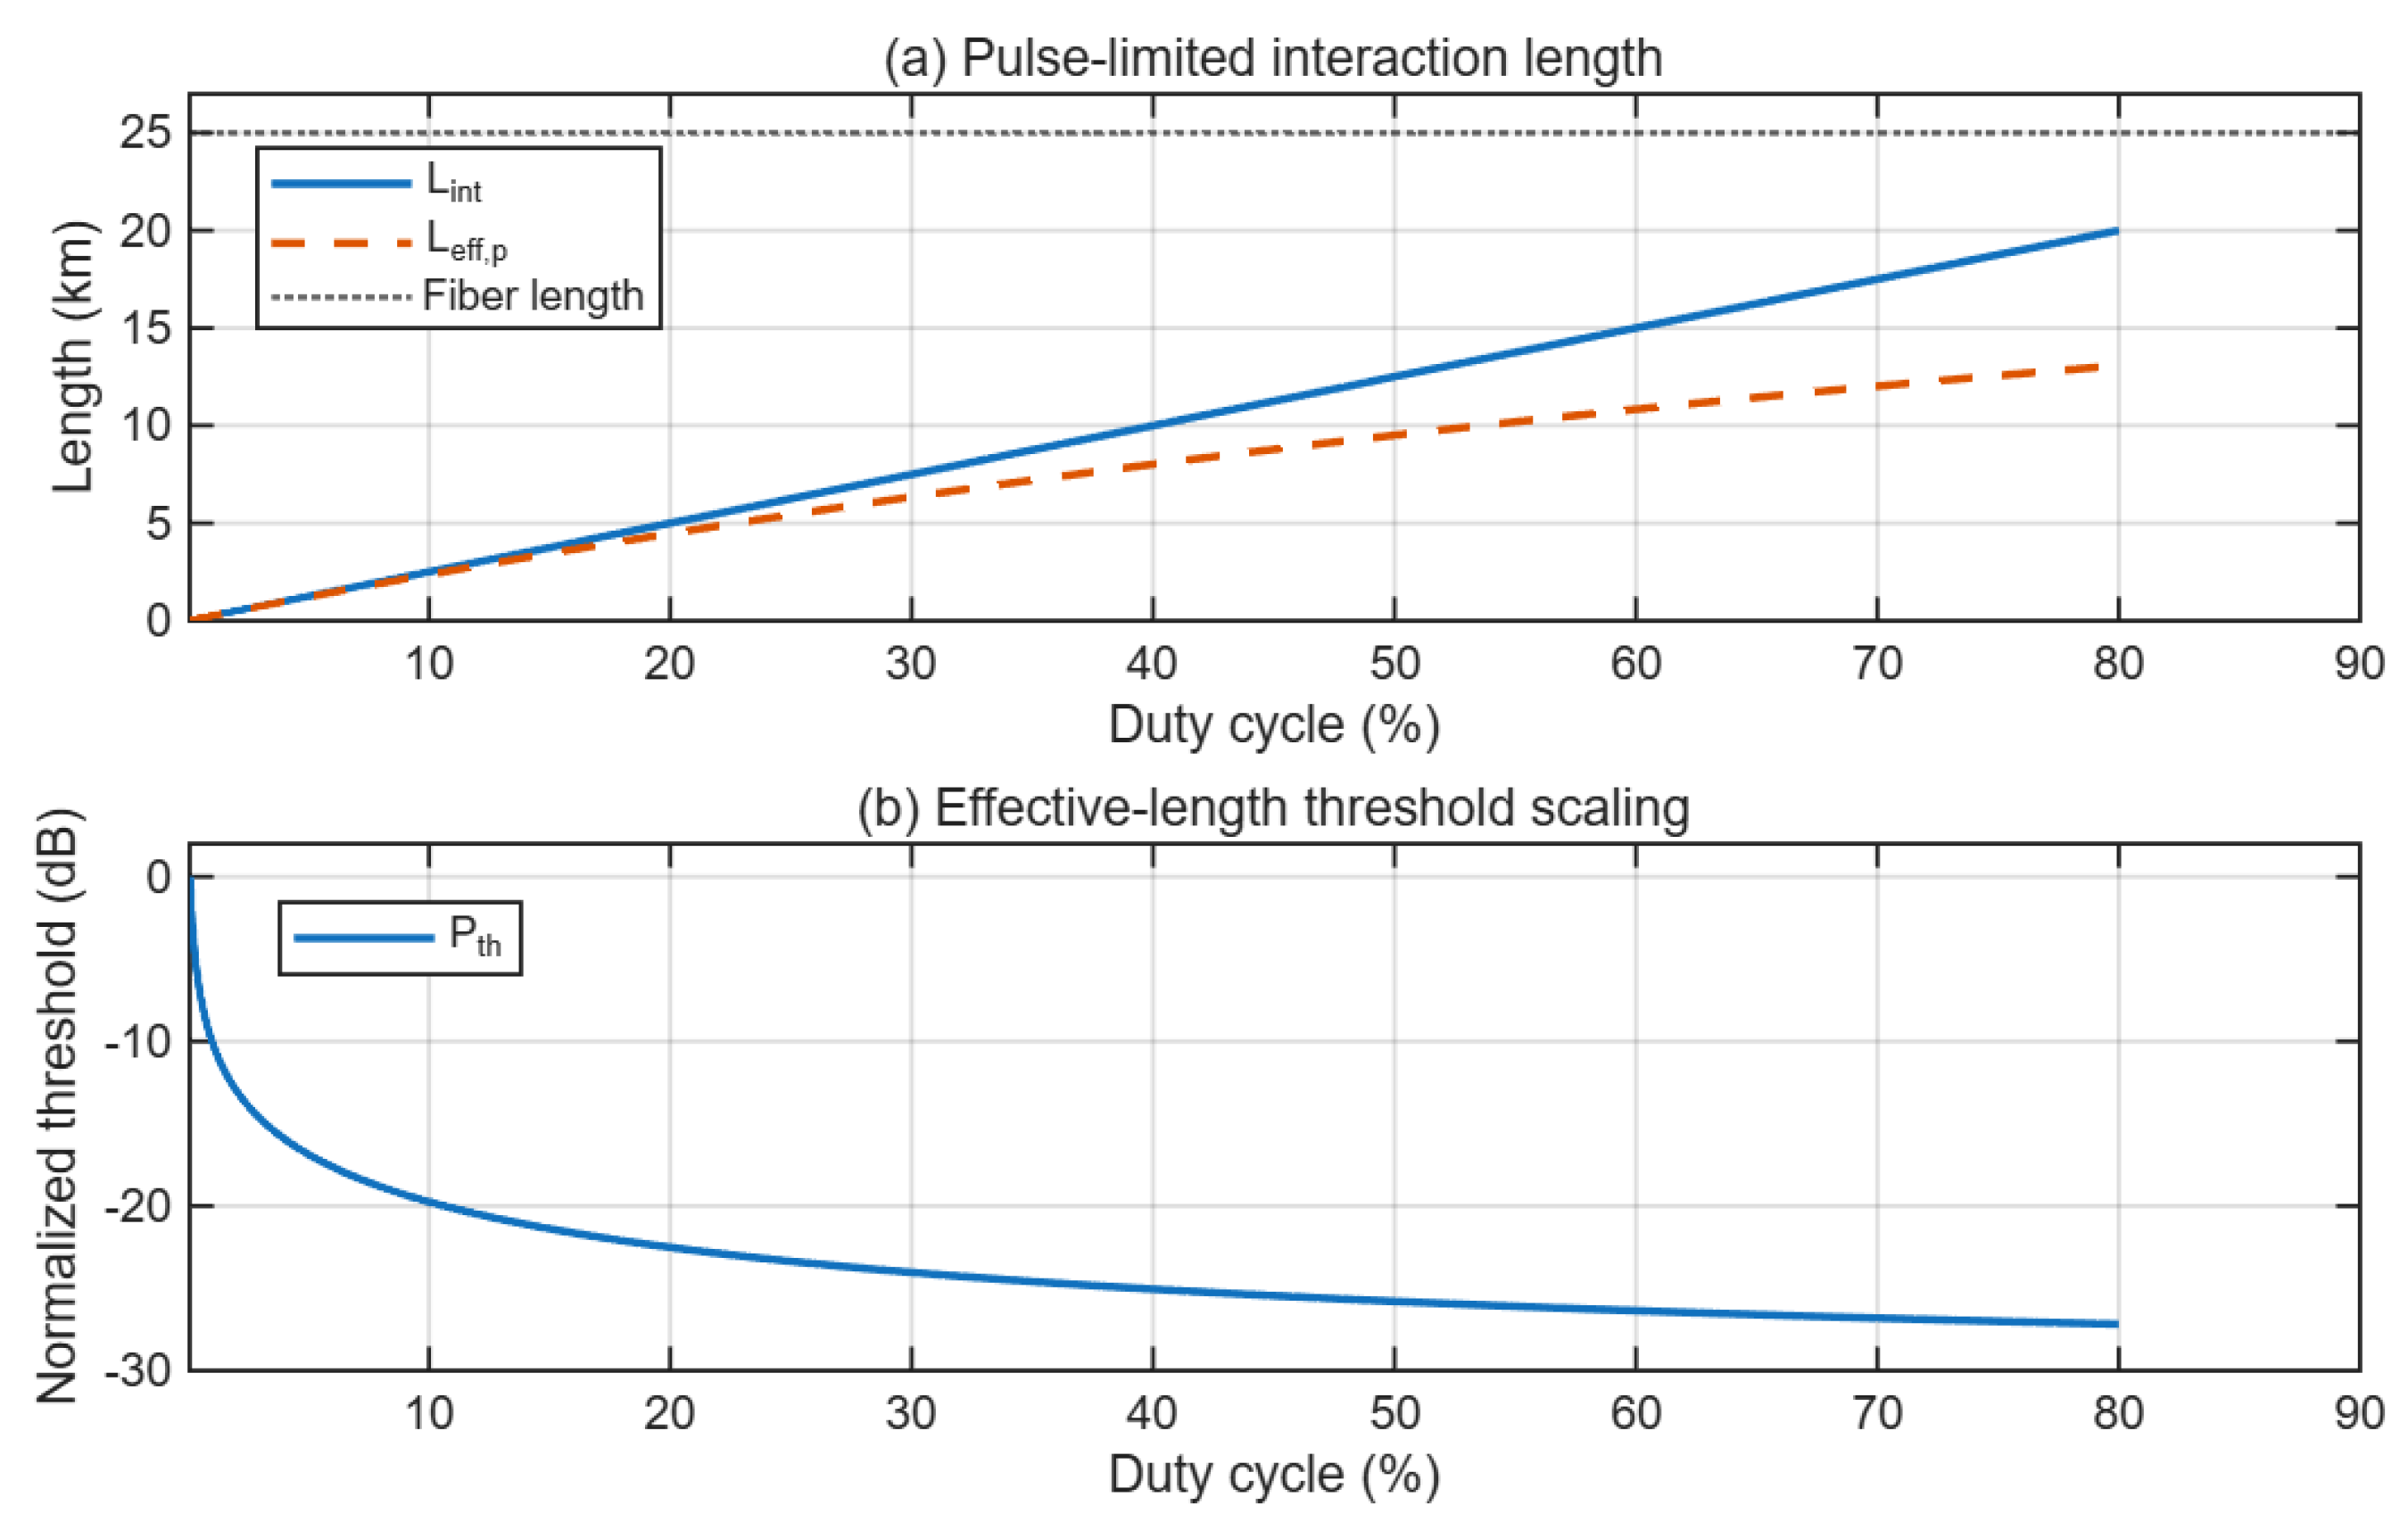
where L is the physical fiber length and is the optical group velocity. The factor of “2” accounts for the counter-propagating propagation of the pump and Stokes waves. Including fiber attenuation, the corresponding effective interaction length (Figure 2a) is:
where is the attenuation coefficient. Equation (1) reduces to the conventional effective length when . For , the SBS interaction remains pulse-length-limited. The peak-power threshold is then calculated using the standard SBS effective-length scaling [11,12], with the pulse-limited effective length replacing the continuous-wave (CW) effective length:
where is the fiber effective mode area, is the Brillouin gain coefficient, and is the threshold constant. The calculated is shown in Figure 2b. Equation (3) is used as a scaling relation, since the measured SBS onset also depends on optical linewidth, polarization state, insertion losses, and detection sensitivity. This scaling approach is consistent with reported measurements showing that the SBS threshold in fiber amplifiers depends on pulse duration [21]. In the analysis below, is used to describe the duty cycle trend of the threshold.
Figure 2.
Duty cycle dependence of the pulse-limited SBS interaction length. (a) Pulse-limited interaction length and effective interaction length calculated for a 25 km SMF link at a repetition rate of 4 kHz. The horizontal dotted line marks the physical fiber length. (b) SBS threshold scaling calculated from , and normalized at .
2.3. Launched Peak Power Under EDFA Operation
Full EDFA dynamics can be described with coupled rate and propagation equations for the erbium population, pump, signal, and amplified spontaneous emission fields [23], however in this study the EDFA is treated as a launch power source. For a finite-extinction pulse train, the launched on-state power is:
where is the signal band average launch power and is the residual off-state launch power. The average power in Equation (4) refers to the signal band launch power measured after ASE rejection. The total unfiltered EDFA output power is not used for peak power extraction because it includes a non-gated ASE contribution that is not proportional to the optical pulse duty cycle. This calibrated quantity contains the effect of EDFA gain compression without requiring an explicit EDFA saturation fit. Under weak compression operation, remains approximately constant during a duty cycle sweep. Under saturated operation, increasing D increases the average extracted power and can reduce the launched pulse peak power. At the 4 kHz repetition rate, transient EDFA gain recovery and depletion may also produce duty-cycle-dependent intra-pulse variations, including leading-edge enhancement and pulse-top droop. These variations are not resolved by the average power measurement, and therefore the calculated value does not represent the instantaneous optical power throughout the pulse.
2.4. SBS Power Margin
The onset condition is expressed through the ratio of the launched pulse peak power to the duty-cycle-dependent SBS threshold:
Values M(D) < 1 correspond to sub-threshold operation, whereas values M(D) > 1 indicate that the launched pulse peak power exceeds the estimated SBS threshold, and thus the margin is used as an operating metric. The model predicts three regimes during a duty cycle sweep at a fixed repetition rate.
- •
- At low duty cycle, the pulse-limited interaction length is short and remains high, which keeps the SBS operating margin below threshold over the tested conditions.
- •
- At intermediate duty cycle, increases and decreases, while the EDFA can still provide a sufficiently high launched peak power. In this range, M(D) can exceed unity and SBS backscatter is increased.
- •
- At high duty cycle, EDFA gain compression reduces When this reduction exceeds the further decrease of , the margin decreases and the backward SBS power is reduced.
This interpretation does not require a change in the material Brillouin gain coefficient or in the intrinsic fiber nonlinearity. The duty cycle dependence arises from the finite pulse interaction length of the fiber link and from the calibrated duty cycle dependence of the EDFA-launched pulse peak power. The model is therefore used to interpret the measured duty cycle trend in terms of operating margin, while time-resolved SBS growth and EDFA inversion dynamics remain outside the scope of the present analysis.
3. Results
3.1. CW Extraction of the SBS Reference Threshold
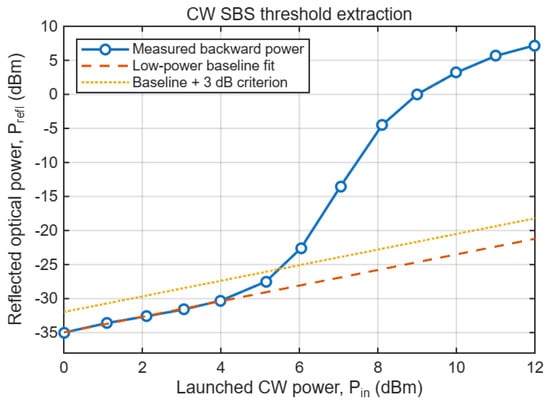
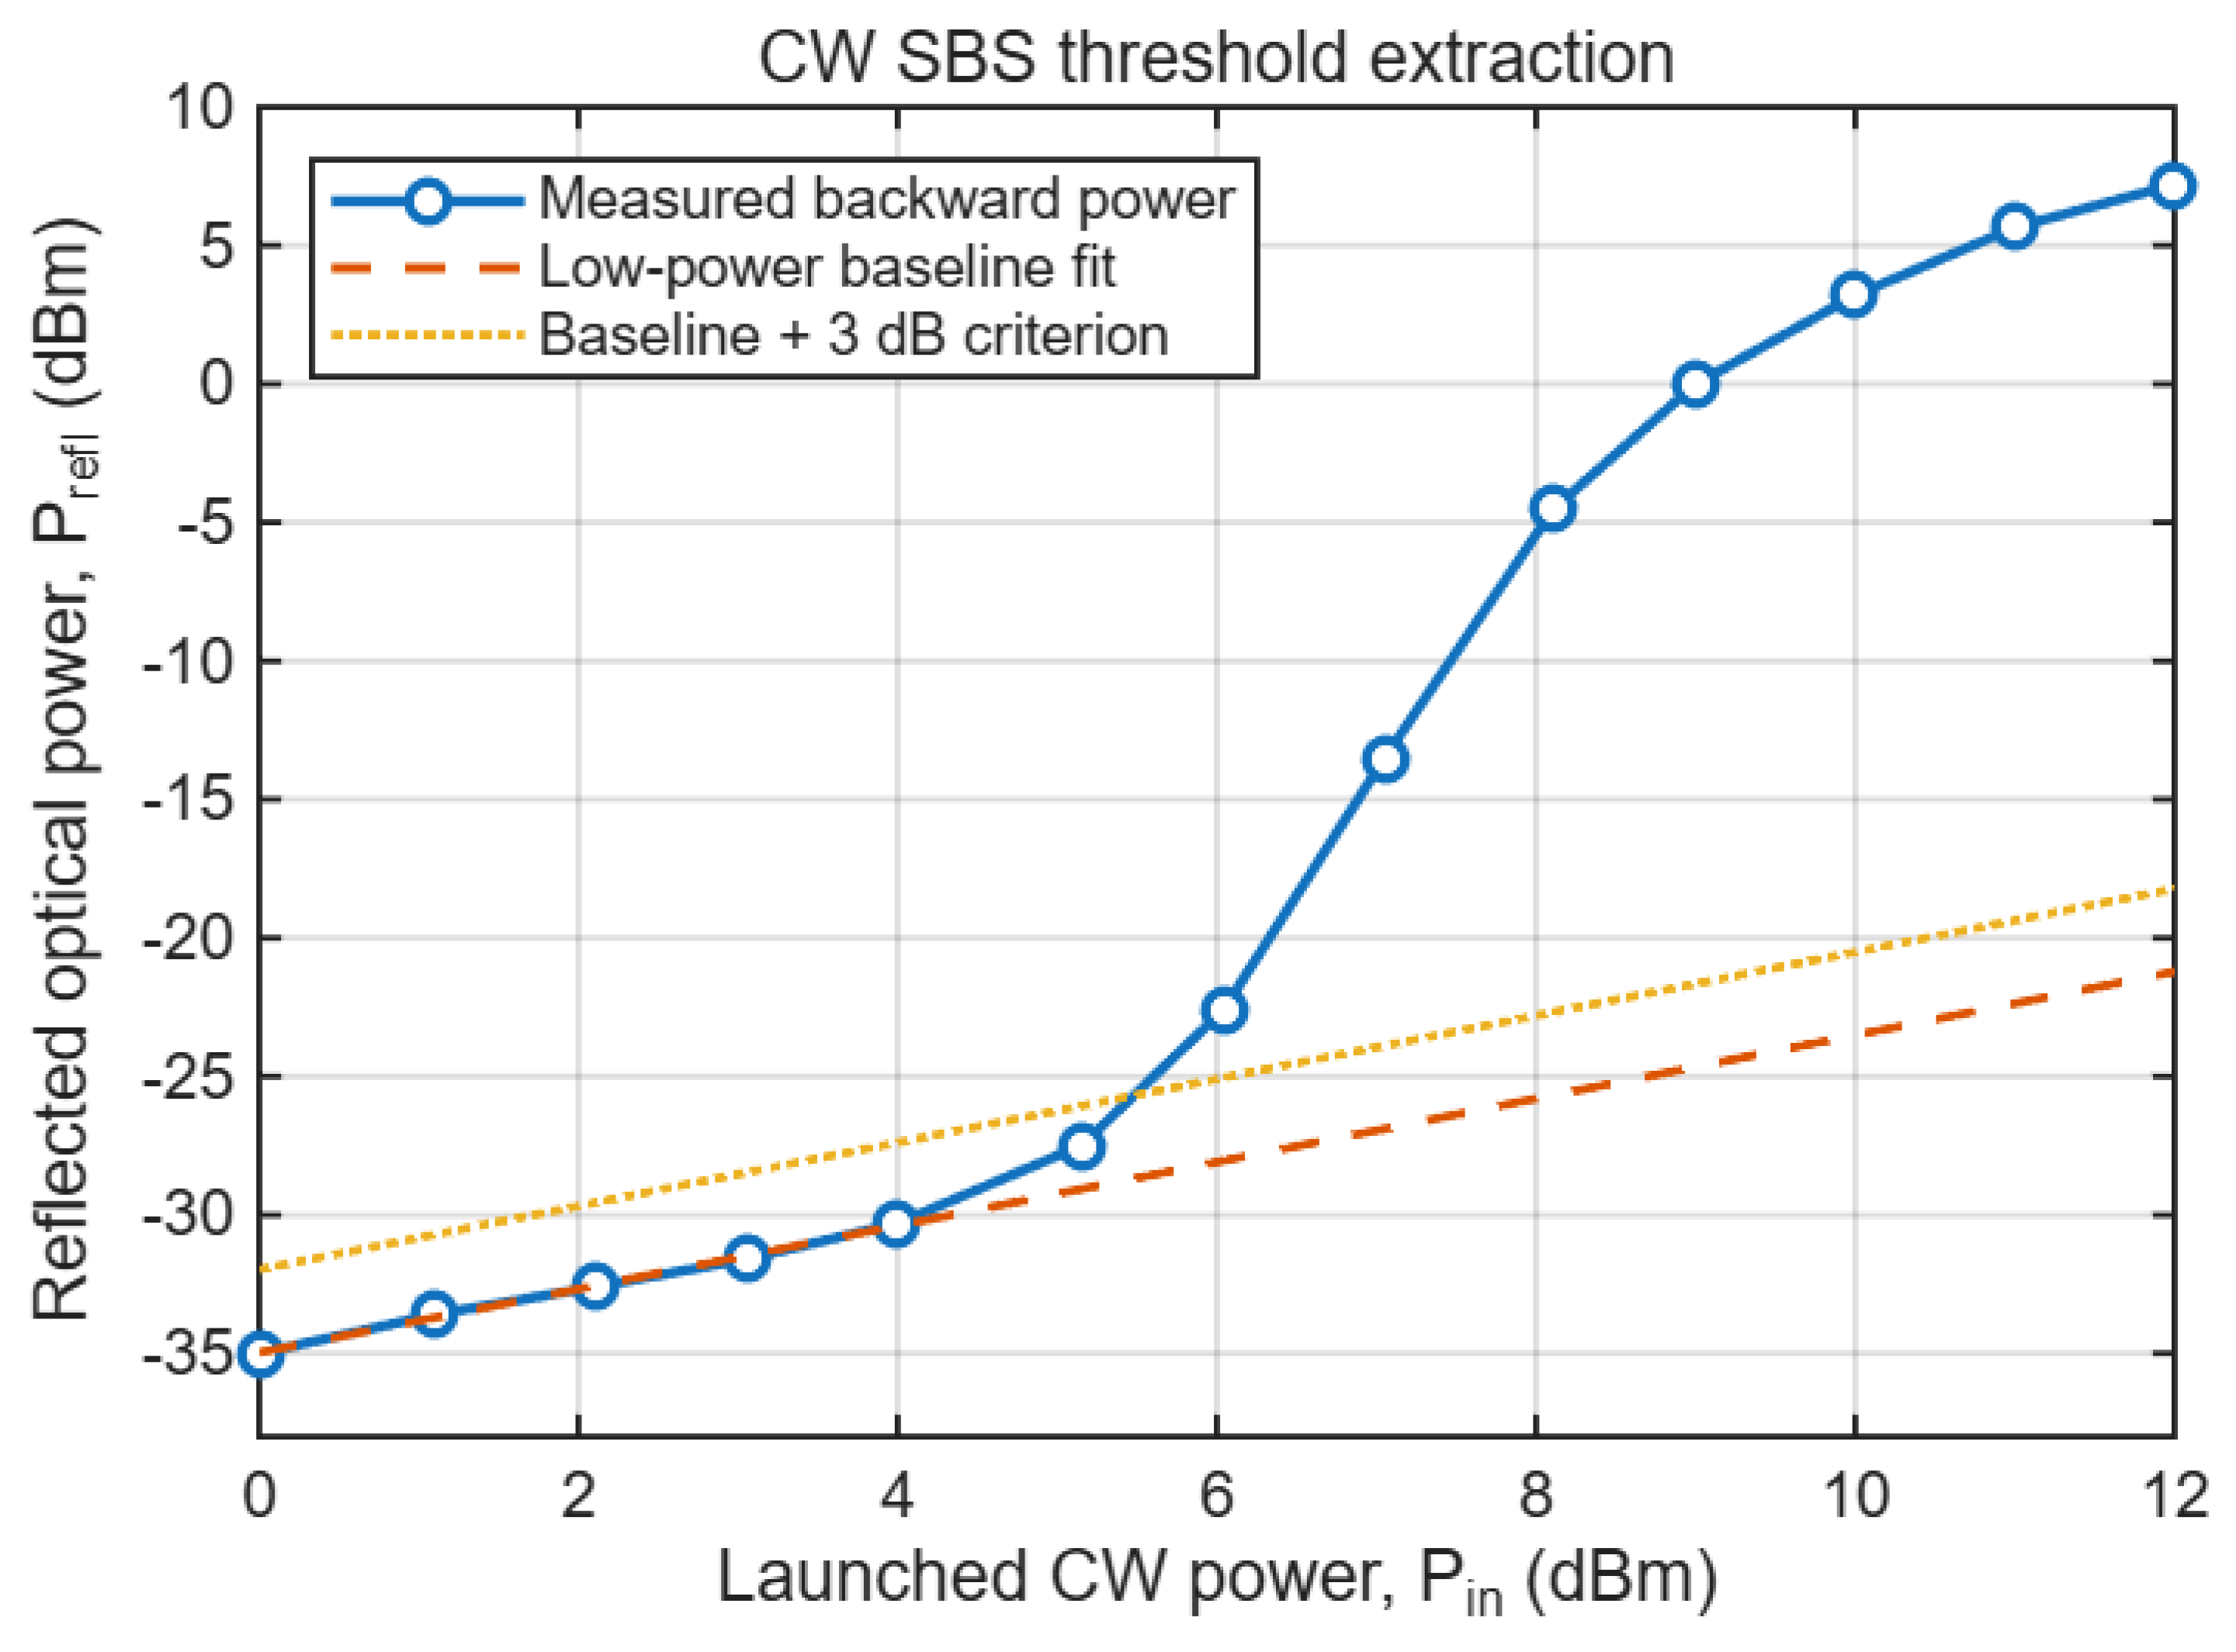
A continuous-wave launch power sweep was first performed to establish a reference SBS threshold for the 25 km SMF link. The launched CW power was increased from 0 to +12 dBm, and the corresponding backward optical power was measured, with the results presented in Figure 3. At low launch powers, the response followed an approximately linear Rayleigh-like baseline, increasing from −35.0 dBm at 0 dBm launch power to −30.3 dBm at 4.0 dBm. Above this range, the backward power increased more rapidly, reaching −27.5 dBm at 5.15 dBm and −22.6 dBm at 6.04 dBm launch power.
Figure 3.
CW extraction of the SBS reference threshold for the 25 km fiber link.
The low-power points up to 4.0 dBm were fitted with a linear baseline, and the CW SBS threshold was extracted using a 3 dB increase above this baseline as the onset criterion. This procedure gave an onset power of 5.48 dBm, which is used as the CW reference SBS threshold for the 25 km link. For the pulsed measurements, the effective SBS threshold is duty-cycle-dependent because the interaction length changes with pulse width, as described by Equation (1).
3.2. ASE-Filtered Launch Power Calibration
The launched pulse peak power used in the duty cycle analysis was extracted from signal band average launch power measurements performed after ASE rejection. The C34 optical filter was used to suppress out-of-band EDFA ASE before the average launch power was measured. Since the AOM extinction ratio was 60 dB, the residual off-state contribution was neglected. The launched on-state pulse power was therefore calculated from .
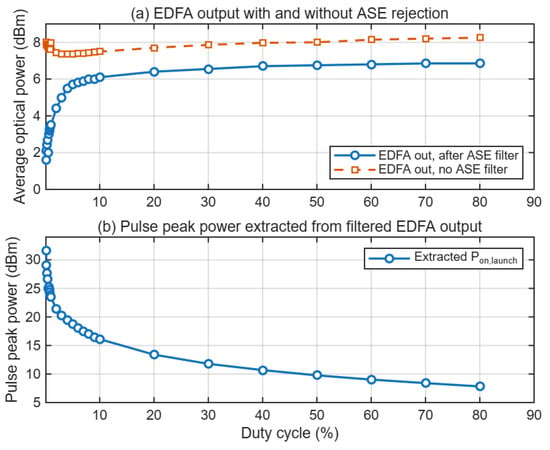
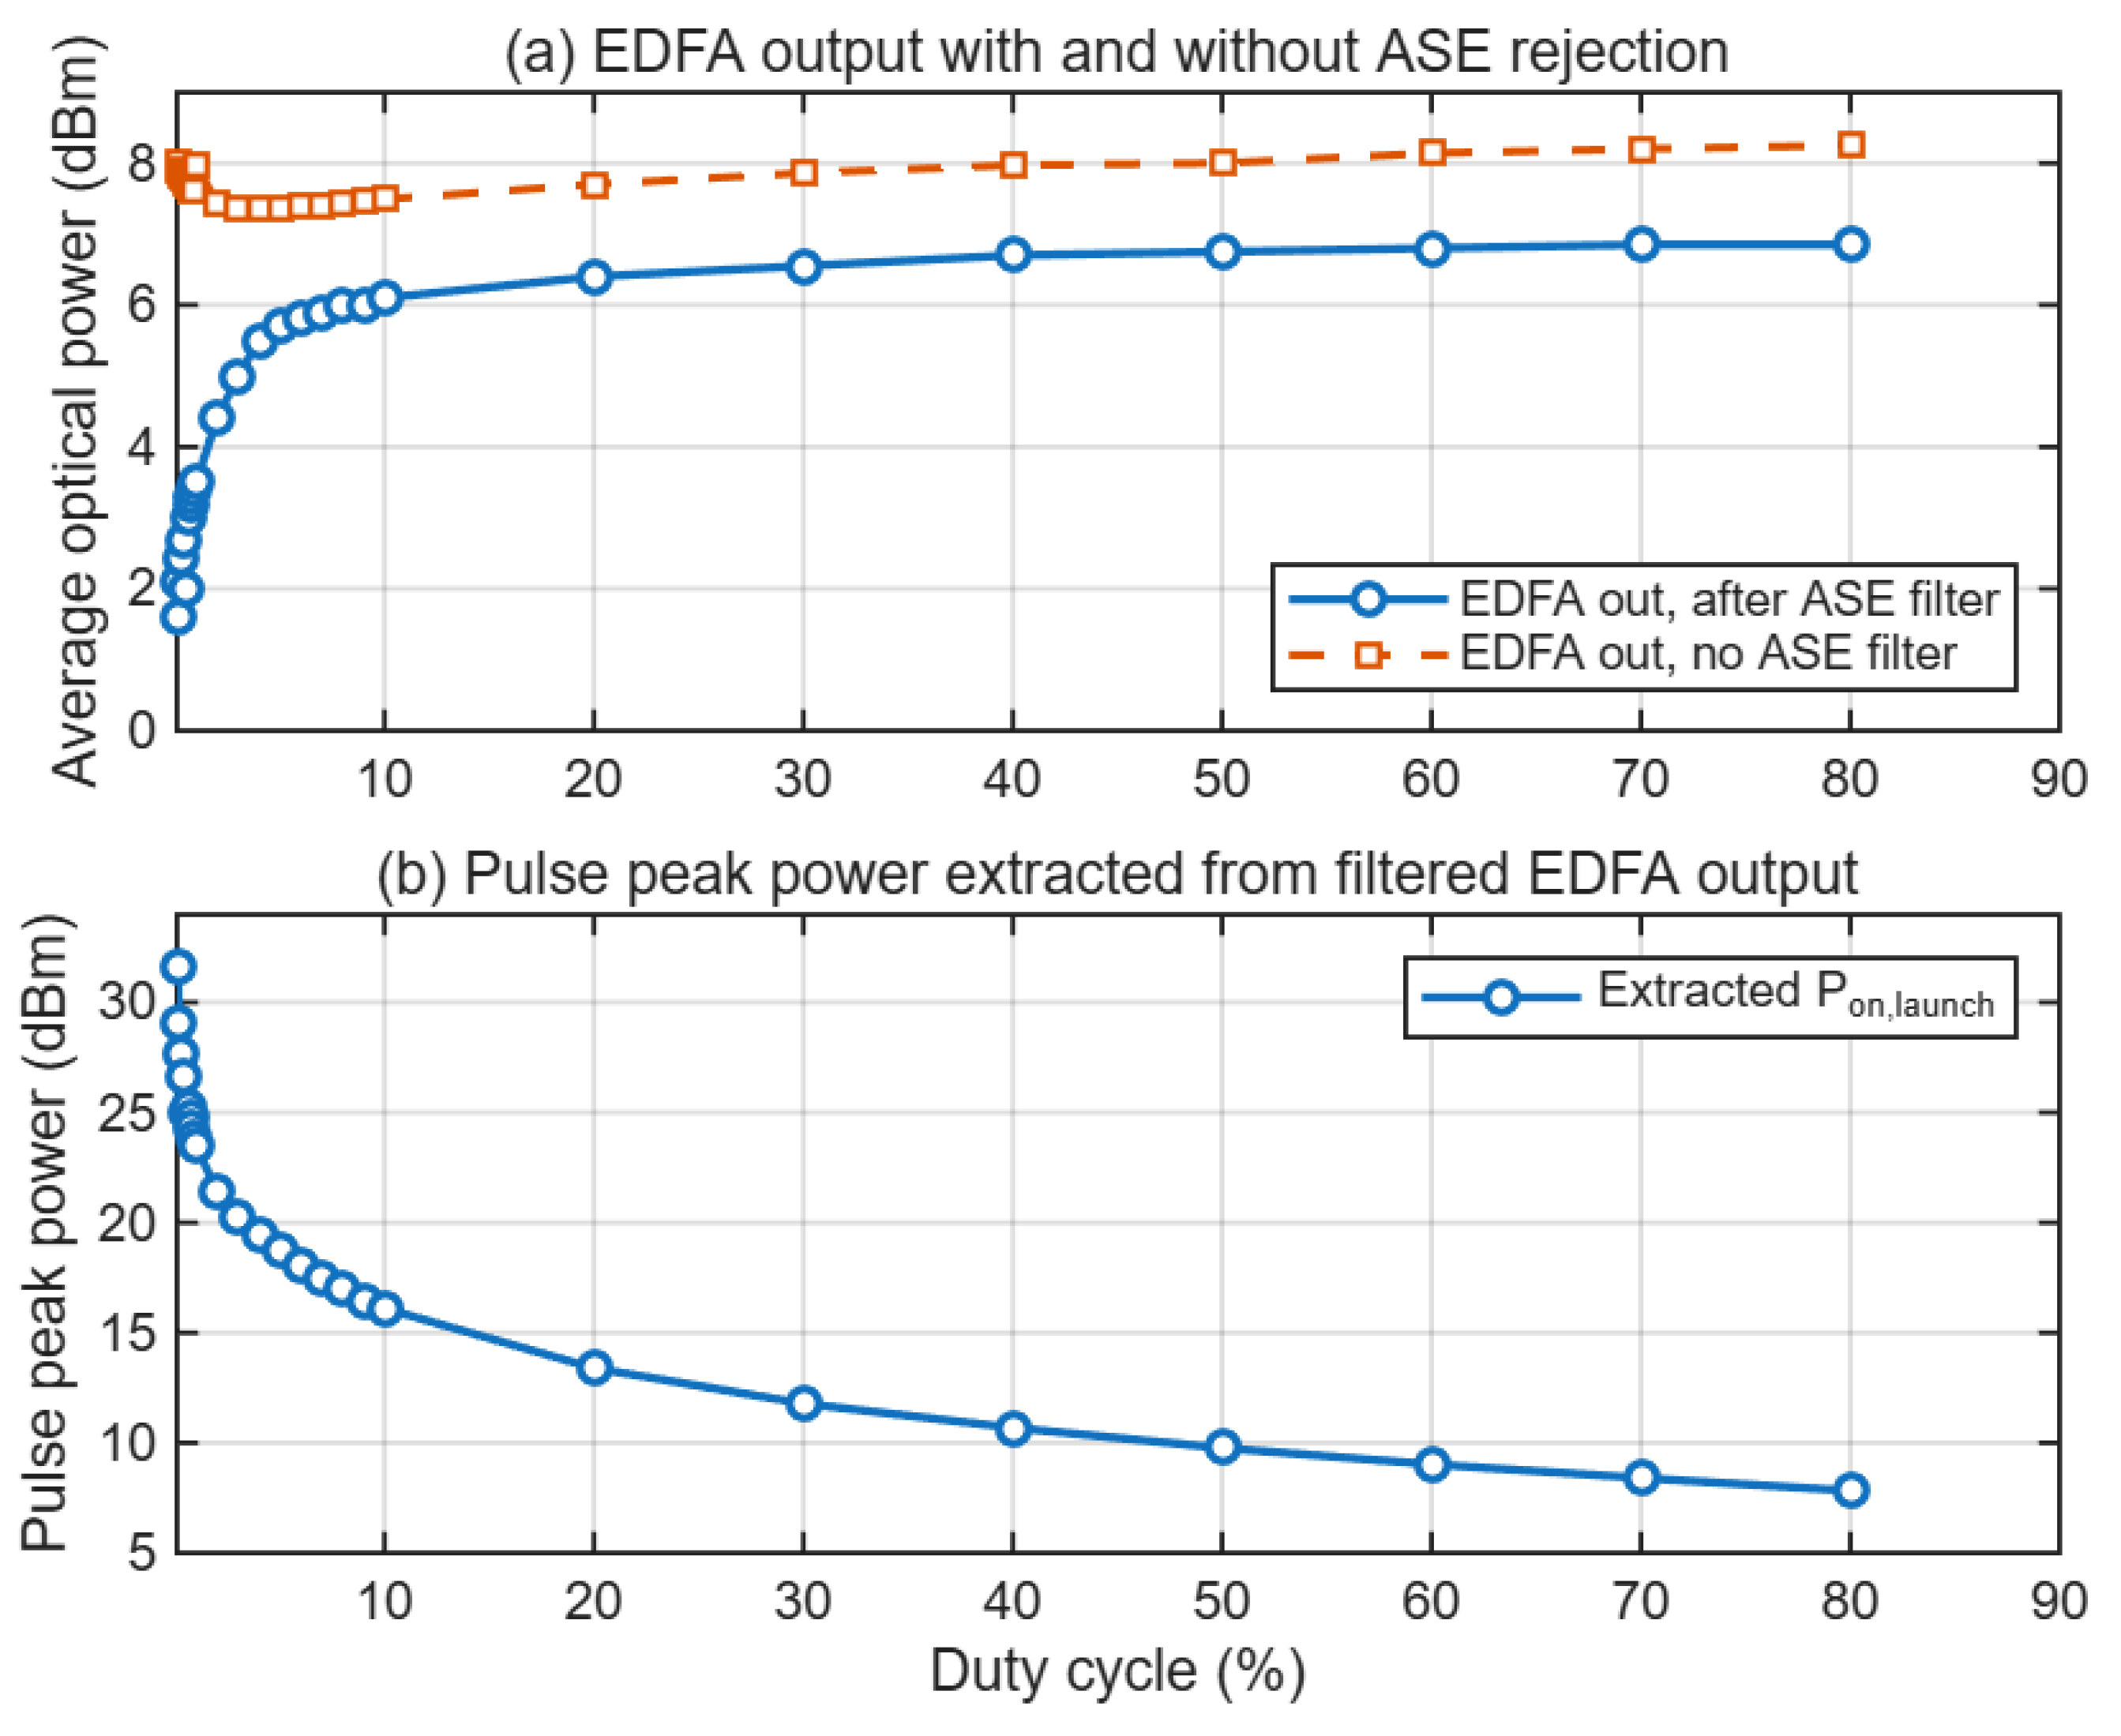
The signal band average launch power measured after the C34 filter increased from 1.6 dBm at D = 0.1% to 6.85 dBm at D = 80%(Figure 4a). Despite this 5.25 dB increase in filtered average power, the extracted launched on-state pulse power decreased from 31.6 dBm to 7.82 dBm over the same duty cycle range (Figure 4b). The corresponding reduction in launched pulse peak power was 23.8 dB. This decrease occurs because the optical energy is distributed over a progressively larger fraction of the pulse period as the duty cycle increases. A control measurement was also performed without the ASE rejection filter. The total unfiltered EDFA output (Figure 4a) varied only within 0.88 dB over the duty cycle sweep, from 7.37 to 8.25 dBm. This behavior differs from the filtered signal band power and shows that the unfiltered EDFA output contains an ASE contribution that is not proportional to the optical pulse duty cycle.
Figure 4.
(a) Filtered and unfiltered EDFA output power versus duty cycle. (b) Extracted launched on-state pulse power versus duty cycle.
3.3. Duty Cycle Sweep at Fixed EDFA Operating Condition
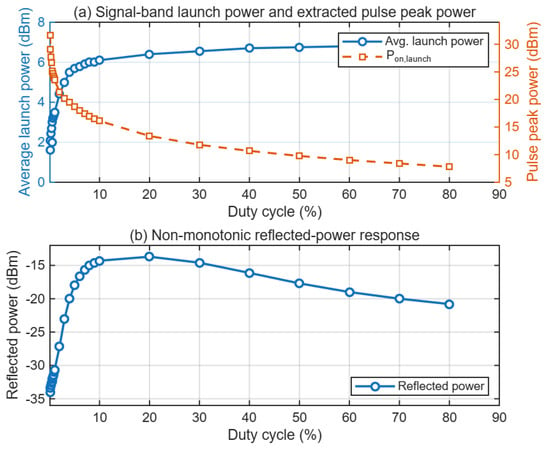
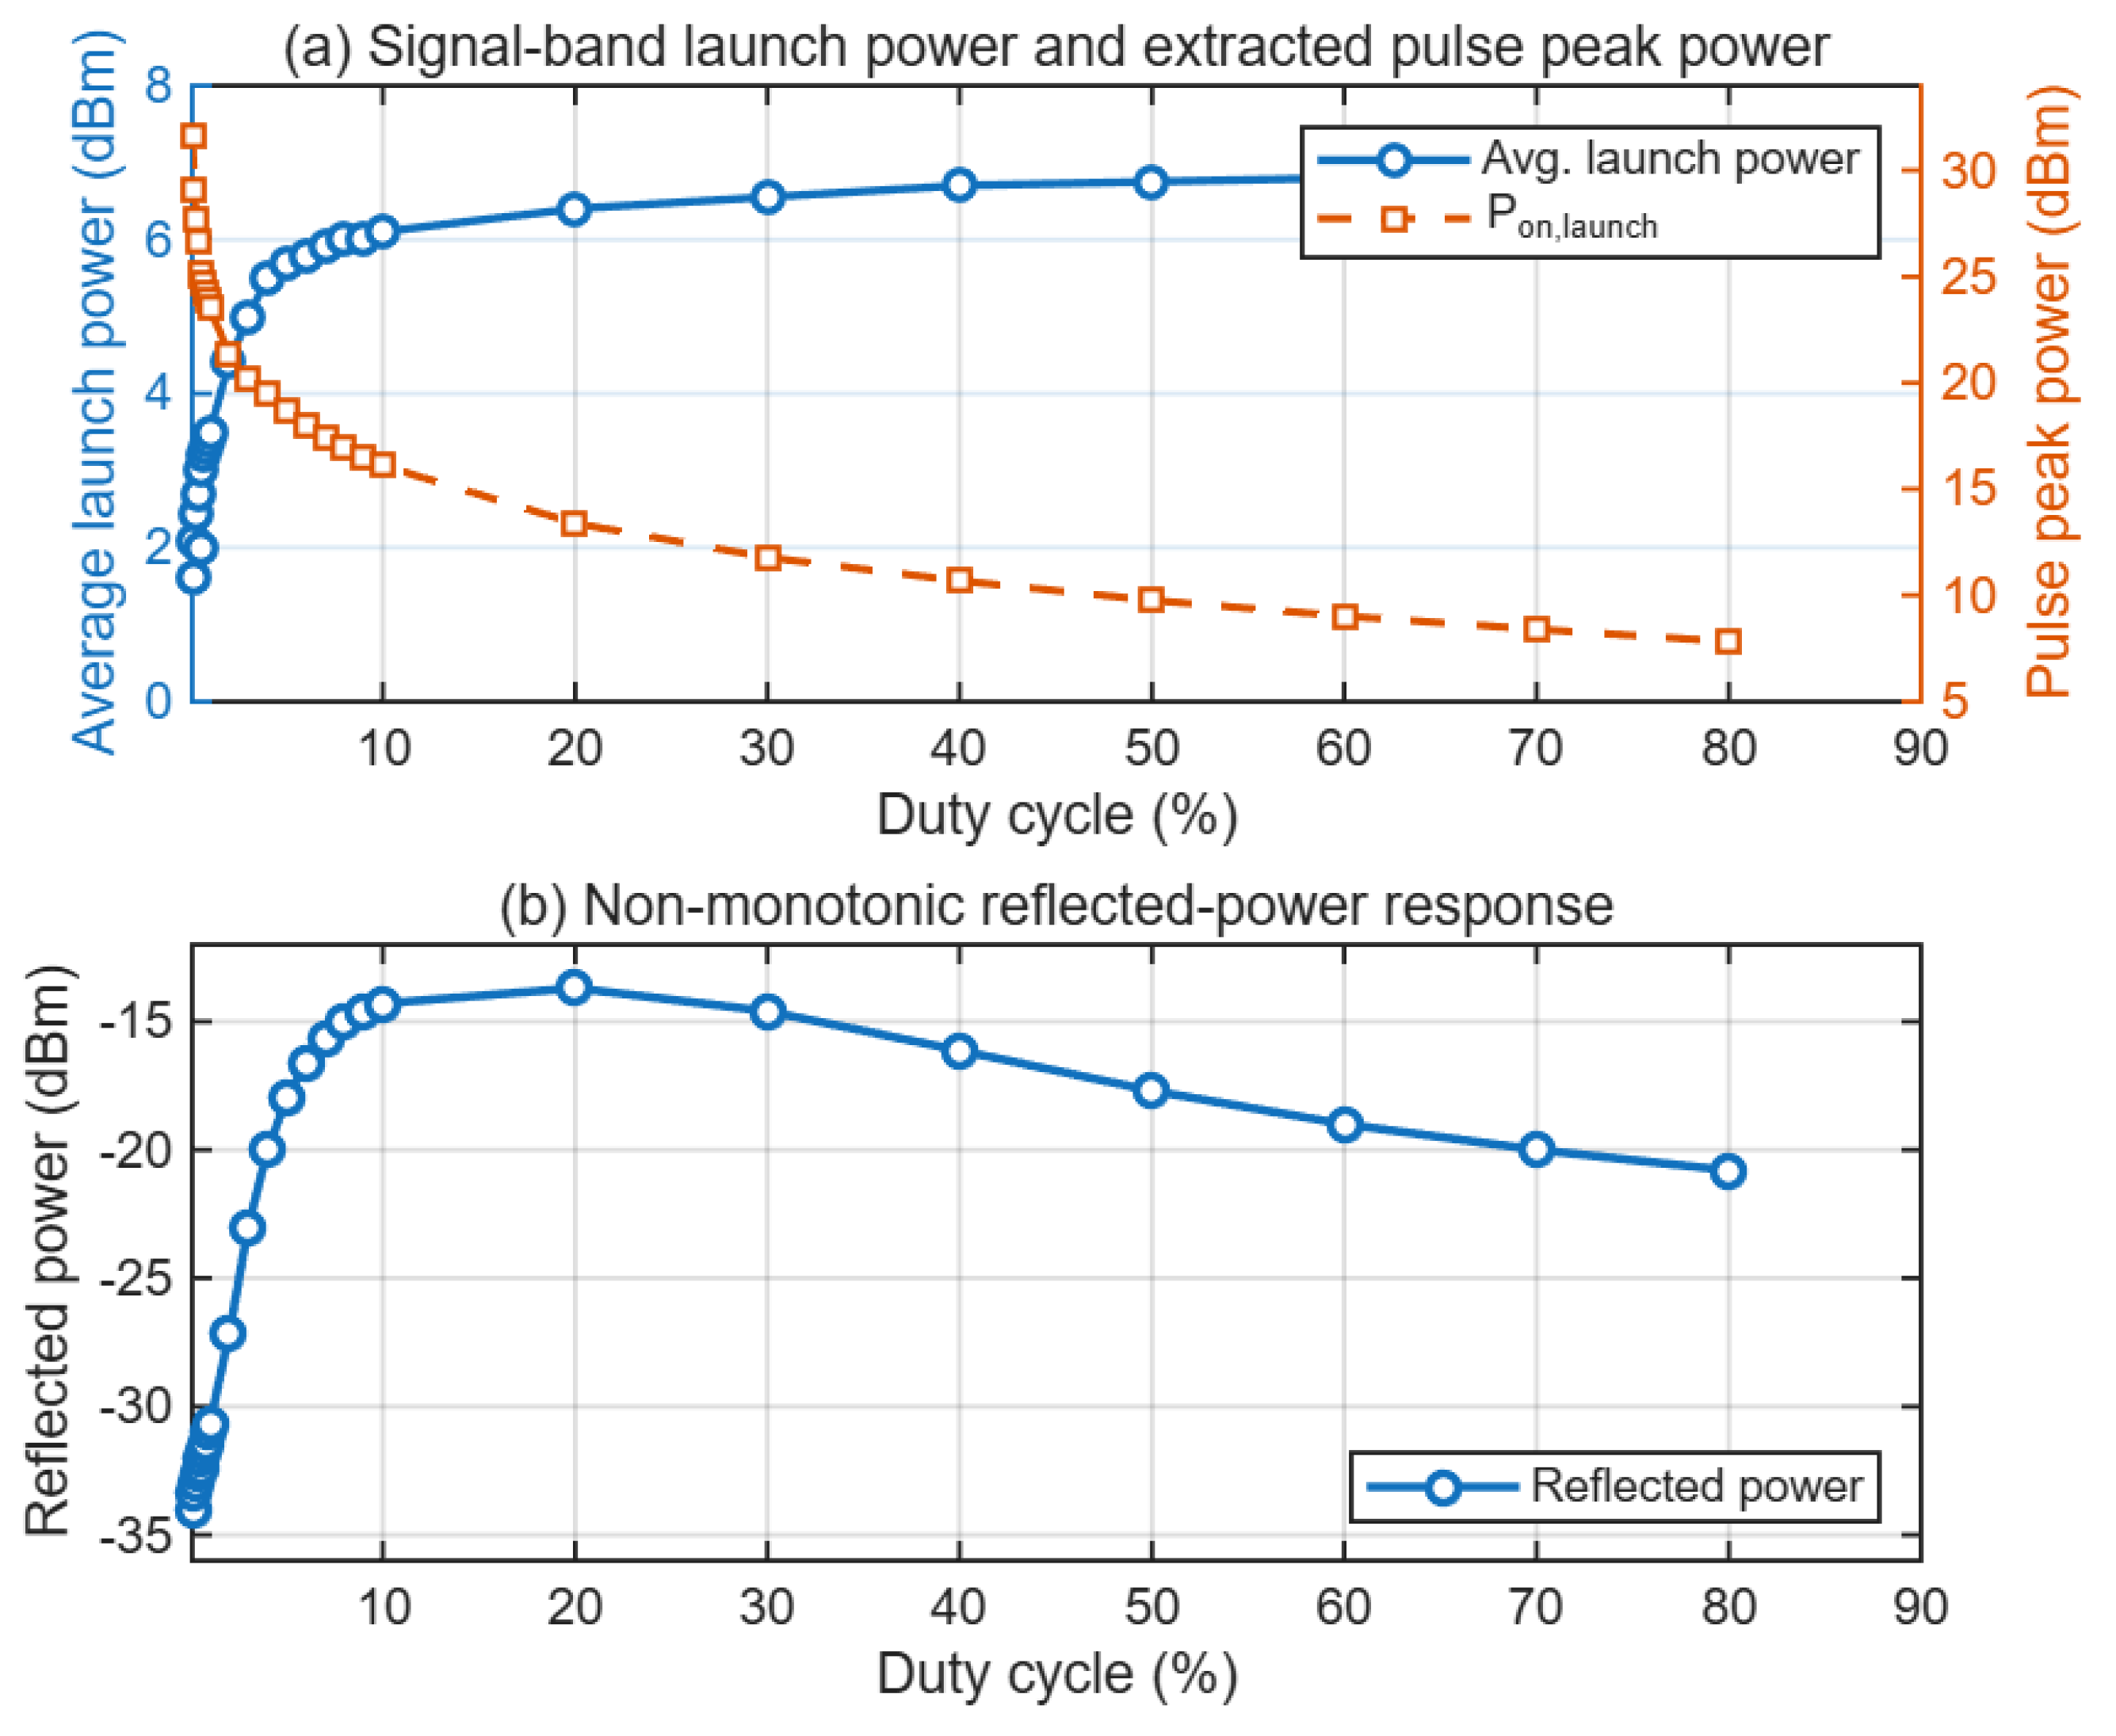
The duty cycle measurement was performed at fixed EDFA operating condition and fixed launch configuration. No additional VOA attenuation was applied after the EDFA. The repetition rate was set at 4 kHz, the fiber length was 25 km, and the duty cycle was varied from 0.1% to 80% by changing the AOM pulse width. For each duty cycle, the signal band average launch power after ASE rejection and the backward optical power were recorded. The launched on-state pulse power was then calculated from the ASE-filtered average launch power using the high-extinction approximation. Figure 5a compares the ASE-filtered average launch power with the extracted launched on-state pulse power. Although the filtered average launch power increases with duty cycle, the corresponding launched on-state pulse power decreases, following the calibration described in Section 3.2.
Figure 5.
(a) ASE-filtered average launch power and extracted launched on-state pulse power as functions of duty cycle. (b) Backward optical power measured during the fixed-EDFA duty-cycle sweep.
The backward optical power measured in the same sweep followed a non-monotonic trend, as shown in Figure 5b. It increased from at D = 0.1%to a maximum of dBm at D = 20%, corresponding to a increase. At larger duty cycles, the backward optical power decreased and reached -20.8 dBm at D = 80%, giving a 7.1 dB reduction from the maximum value. Since the launched pulse peak power decreases throughout this range, the initial rise in backward optical power cannot be attributed to an increase in transmitter peak power. It is instead consistent with the increase in pulse-limited Brillouin interaction length, which rises from approximately 25 m at D = 0.1% to 5 km at D = 20%. At higher duty cycle, the interaction length continues to increase, reaching approximately 20 km at D = 80%, but the EDFA-delivered pulse peak power is strongly reduced. The maximum backward optical power at D = 20% therefore corresponds to the operating region where the increasing fiber-side interaction length and the decreasing transmitter-side pulse peak power produce the largest experimentally inferred SBS operating margin. In terms of M(D), defined in Section 2.4, Figure 5 indicates the duty cycle region where the margin is maximized.
To estimate the contribution of the linear backward background, the points at duty cycles of 0.1%, 20%, and 80% were compared using the ASE-filtered signal band average launch power. In the absence of nonlinear Brillouin gain, the Rayleigh-type contribution is expected to scale with the signal band average launch power delivered to the fiber. The lowest duty cycle point was used as the reference background, because the pulse-limited interaction length is shortest under this condition. So, the linear backward scattering can be approximated by:
where is the estimated Rayleigh-type backward level at duty cycle D, is the measured backward optical power at the reference duty cycle, and is the ASE-filtered signal band average launch power. The reference duty cycle was , and all power quantities in Equation (5) are expressed in dBm. At the reference point, the measured backward optical power was −34.0 dBm and the average launch power was 1.60 dBm. At D = 20%, the average launch power was 6.40 dBm, so the giving an estimated linear background of −29.2 dBm, whereas the measured backward optical power was -13.7 dBm. At D = 80%, the average launch power was 6.85 dBm, giving an estimated linear background of −28.8 dBm, whereas the measured backward optical power was −20.8 dBm. The measured backward power remained above the estimated linear background at both duty cycles. Moreover, the average launch power increased by only 0.45 dB between D = 20% and D = 80%, so the Rayleigh-type background was expected to increase only slightly, while the measured backward optical power decreased by 7.1 dB. This comparison indicates that the high-duty-cycle decrease cannot be explained only by Rayleigh background scaling alone and is consistent with a reduction in the nonlinear SBS-related backward-power contribution superimposed on a finite linear background.
3.4. VOA-Controlled Launch-Power Sweeps
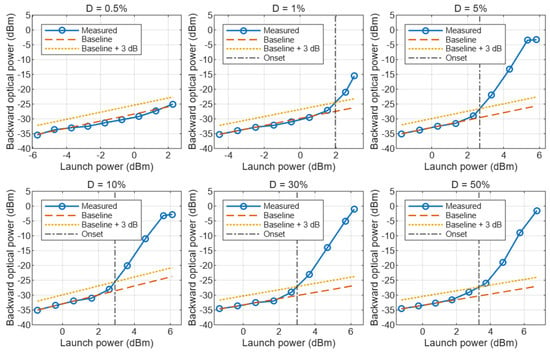
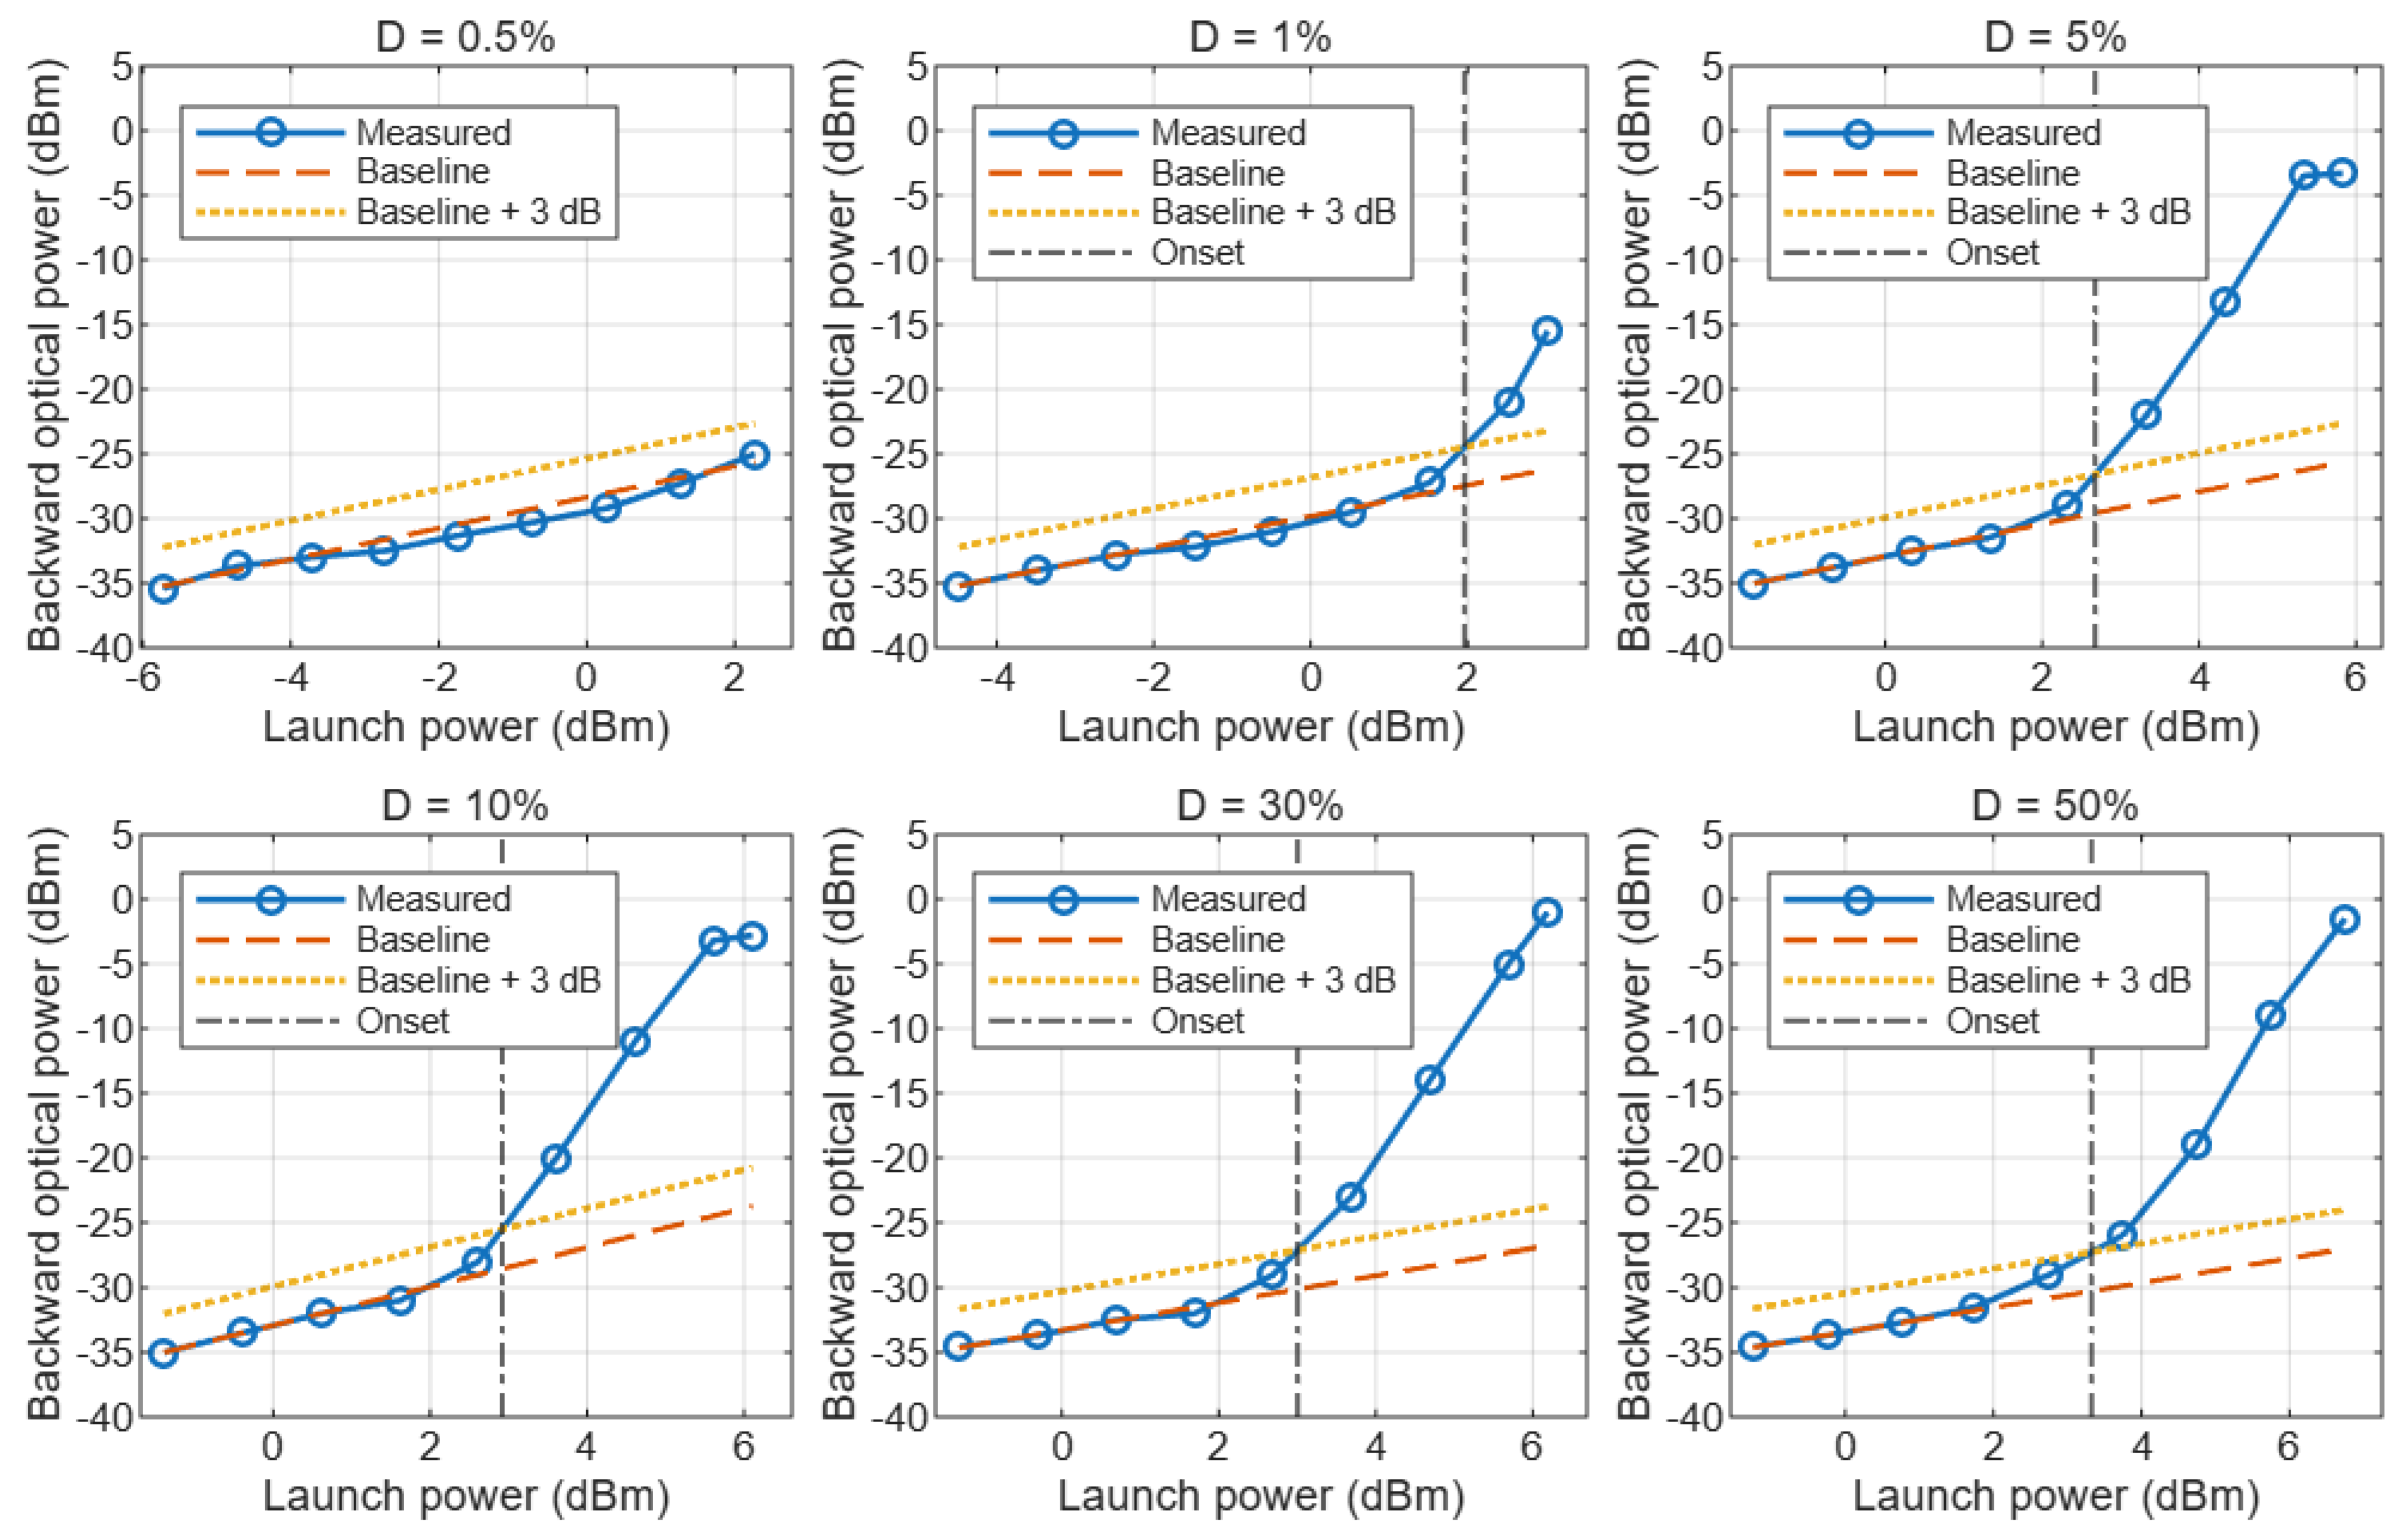
The VOA-controlled measurements were performed to determine whether the duty cycle dependence observed in the fixed-EDFA sweep also appears as a shift in the onset of nonlinear backward power growth. For each selected duty cycle, the launch power was swept and the backward optical power was monitored to identify the point at which the response rises above the low-power background. For these sweeps, the VOA was placed after the EDFA so that the launch power into the 25 km fiber could be varied while the EDFA operating condition remained fixed for each duty cycle. The launch power values in Figure 6 are reported at the same calibrated fiber input reference plane used for the duty cycle measurements. Measurements were acquired at duty cycles of 0.5%, 1%, 5%, 10%, 30%, and 50%. In each trace, the low-power part of the backward power response was fitted with a linear baseline, and the onset power was defined as the launch power at which the measured backward optical power exceeded this baseline by +3 dB.
Figure 6.
VOA-controlled launch power sweeps at selected duty cycles. The dashed curve in each panel is the low-power baseline, and the dotted curve is the baseline +3 dB criterion used to extract the onset of nonlinear backward power growth.
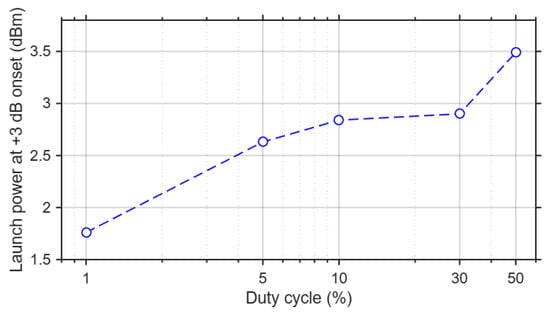
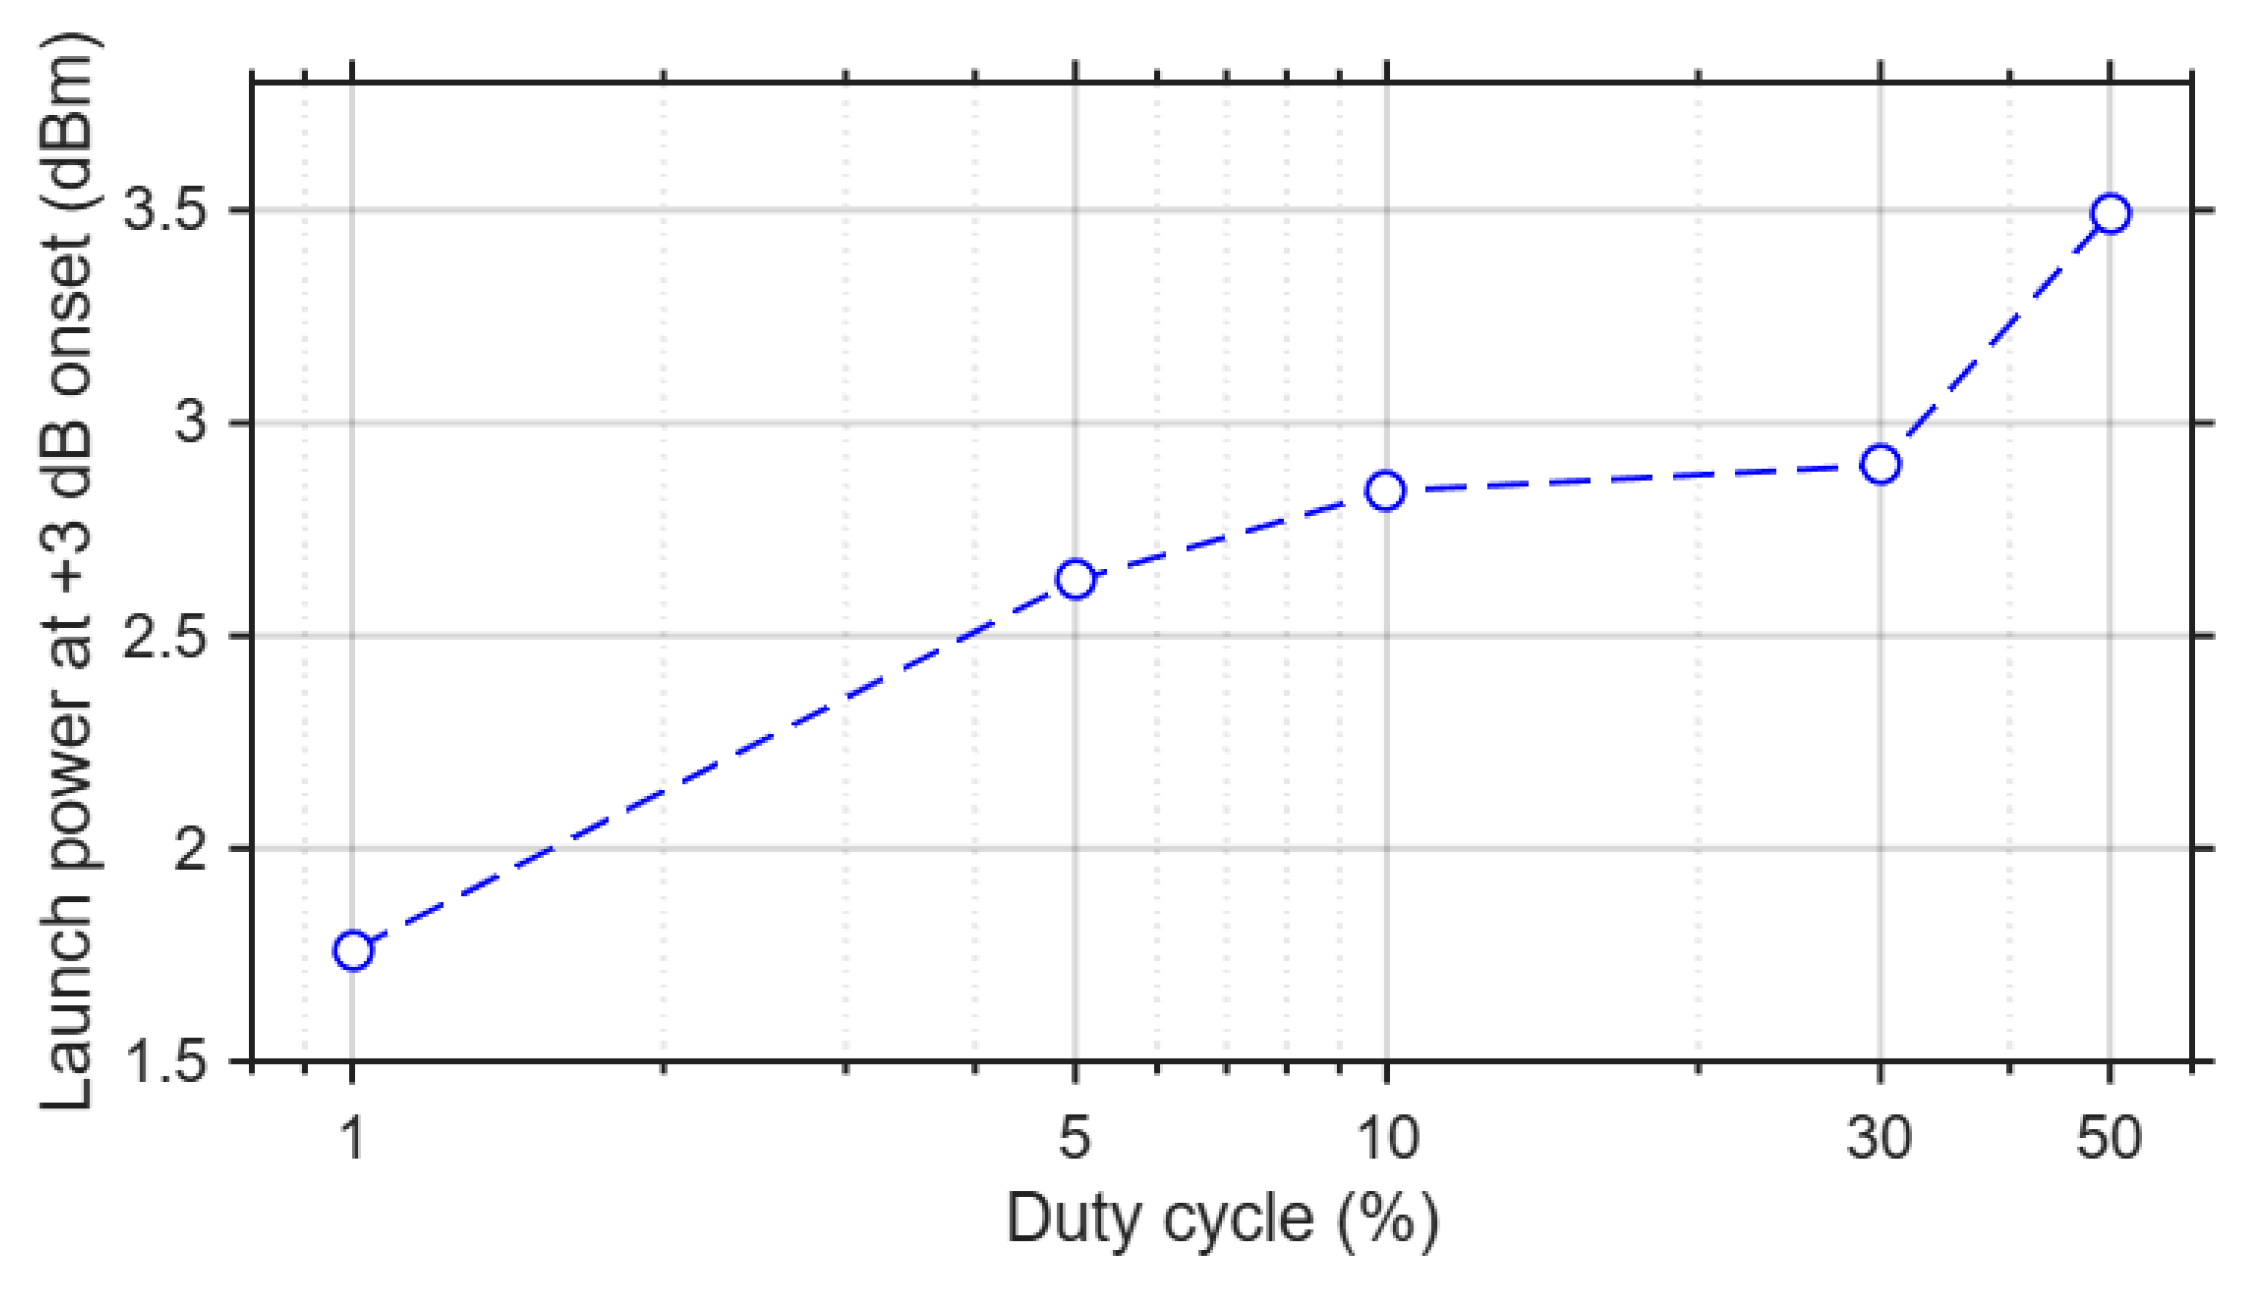
The resulting launch power sweeps are shown in Figure 6. At D = 0.5%, no onset was detected within the measured launch power range, consistent with the short pulse-limited Brillouin interaction length at low duty cycle. Once the duty cycle was increased, nonlinear onset became measurable at low launch powers: 1.76 dBm at D = 1% and 2.63–2.90 dBm for duty cycles between 5% and 30%. At D = 50%, the onset increased to 3.49 dBm, consistent with the reduction in the EDFA-delivered launched pulse peak power at larger duty cycle. The VOA-controlled sweeps therefore support the interpretation from Figure 5 that the SBS operating margin is determined by the combined duty cycle dependence of the fiber interaction length and the transmitter-delivered pulse peak power.
To summarize the onset extraction from the VOA-controlled sweeps, Figure 7 plots the launch power at which the backward optical power exceeded the low power baseline by 3 dB as a function of duty cycle. Only duty cycles for which a clear onset was extracted are included. The onset power increases from 1.76 dBm at D = 1% to 3.49 dBm at D = 50%, with intermediate values of 2.63–2.90 dBm between D = 5% and D = 30%. The D = 0.5% case is not included in the plot because no 3 dB onset was observed within the measured launch power range. The summary plot therefore confirms that the onset of nonlinear backward power growth depends on duty cycle, consistent with the operating margin interpretation.
Figure 7.
Extracted launch power onset of nonlinear backward power growth as a function of duty cycle. The onset was defined by the baseline +3 dB criterion applied to the VOA-controlled launch power sweeps. The case D = 0.5% is not plotted because no onset was observed within the measured launch power range.
4. Discussion
The measured non-monotonic response can be interpreted as the result of two duty-cycle-dependent effects acting in opposite directions. Increasing the duty cycle increases the pulse duration and therefore the pulse-limited Brillouin interaction length, which reduces the effective SBS threshold. At the same time, the EDFA-amplified transmitter delivers a lower launched pulse peak power as duty cycle increases. Figure 5 provides the main evidence for this competition: the backward optical power increased by 20.3 dB up to D = 20%, although the extracted launched pulse peak power decreased over the same interval. Figure 6 provides a complementary onset test. No baseline +3 dB onset was observed at D = 0.5% over the measured launch power range, whereas onset powers of 1.76 dBm at D = 1%, 2.63–2.90 dBm between D = 5% and D = 30%, and 3.49 dBm at D = 50% were extracted. Together, the two measurements show that the backward power response is not governed by launched peak power alone, but by the duty-cycle-dependent balance between fiber interaction length and EDFA-delivered pulse peak power. For pulsed fiber-optic sensing links, this means that duty cycle should be selected together with launch power and fiber length, and not treated only as a timing parameter.
The practical implication is that SBS in EDFA-amplified pulsed fiber links cannot be assessed from total average EDFA output power alone. The unfiltered EDFA output varied only weakly over the duty cycle sweep because it contained non-gated ASE. Using the ASE-filtered signal band calibration, the extracted launched pulse peak power decreased by 23.8 dB across the investigated duty cycle range. This distinction is important for pulsed sensing and interrogation systems, where the relevant quantity for SBS onset is the signal band pulse peak power delivered to the fiber, together with the interaction length over which the Brillouin gain accumulates. The power margin interpretation therefore provides a practical calibration procedure for EDFA-amplified pulsed links. The signal band average launch power is first measured, converted to launched on-state pulse power, and then compared with the duty-cycle-dependent SBS threshold trend. For long SMF links, this procedure supports the selection of duty cycle and launch power without relying on the total EDFA output power as a proxy for the optical power that drives SBS in the fiber.
The measurements quantify nonlinear backward power in one EDFA-amplified 25 km SMF link operated at 4 kHz. Because the backward signal was measured with an optical power meter, the detected power was not spectrally separated into Brillouin, Rayleigh, Fresnel, and ASE-related components. The CW threshold sweep and the VOA controlled nonlinear growth support the SBS interpretation, but the extracted onset powers should be treated as operating thresholds for the present transmitter, fiber length, repetition rate, and detection configuration. The linear background estimate shows that the high-duty-cycle response is above the expected Rayleigh-type background, while the comparison between D = 20% and D = 80% shows that the 7.1 dB decrease is not explained by Rayleigh background scaling. Spectral isolation of the Brillouin Stokes component would allow the nonlinear contribution to be quantified directly and would extend the present operating-threshold analysis to different linewidths, polarization states, fiber lengths, repetition rates, and EDFA operating points.
Transient EDFA pulse shaping is also expected to depend on duty cycle, because changes in pulse duration and inter-pulse recovery time modify the balance between gain recovery and intra-pulse gain depletion. Time-resolved measurements at the calibrated fiber-input reference plane are therefore required to determine how this duty-cycle-dependent pulse evolution modifies the instantaneous power driving SBS. This analysis remains outside the scope of the present study.
5. Conclusions
This work examined the duty cycle dependence of nonlinear backward optical power in an EDFA-amplified pulsed SMF link. In a 25 km fiber link operated at 4 kHz, the backward optical power showed a non-monotonic response, that was increased by 20.3 dB from low duty cycle to its maximum and then decreased by 7.1 dB at higher duty cycle. Over the same duty cycle range, the extracted launched pulse peak power decreased by 23.8 dB. VOA-controlled launch power sweeps showed that the onset of nonlinear backward power growth depends on duty cycle, with no detected onset at D = 0.5% and extracted onsets between 1.76 dBm and 3.49 dBm for duty cycles from 1% to 50%. This result indicates that the backward power response is determined by the launched peak power, as well as the balance between the pulse-limited Brillouin interaction length and the EDFA-delivered pulse peak power. The main practical outcome is that duty cycle should be treated as an SBS operating-margin parameter in EDFA-amplified pulsed links. Signal-band launch power calibration after ASE rejection is required to estimate the pulse peak power relevant to SBS onset. Further validation should use spectrally resolved Brillouin measurements and should examine linewidth, polarization, fiber length, and EDFA operating point dependence.
Author Contributions
Conceptualization, G.P.; methodology, G.P.; software, G.P. and P.T.; validation, G.P. and P.T.; formal analysis, G.P.; investigation, G.P.; resources, G.P. and P.T.; data curation, G.P.; writing—original draft preparation, G.P.; writing—review and editing, G.P., P.T. and H.A.; visualization, G.P.; supervision, G.P. and H.A.; project administration, G.P. All authors have read and agreed to the published version of the manuscript.
Funding
This research received no external funding.
Data Availability Statement
The data that support the findings of this study are available from the corresponding author, G.P., upon reasonable request.
Conflicts of Interest
The authors declare no conflicts of interest.
References
- Bado, M.F.; Casas, J.R. A Review of Recent Distributed Optical Fiber Sensors Applications for Civil Engineering Structural Health Monitoring. Sensors 2021, 21, 1818. [Google Scholar] [CrossRef] [Scilit] [PubMed]
- Min, R.; Liu, Z.; Pereira, L.; Yang, C.; Sui, Q.; Marques, C. Optical Fiber Sensing for Marine Environment and Marine Structural Health Monitoring: A Review. Opt. Laser Technol. 2021, 140, 107082. [Google Scholar] [CrossRef] [Scilit]
- Poulopoulos, G.; Avramopoulos, H. Review of Optical Fiber and Integrated Photonic Sensors for Industry and Smart Manufacturing: Technologies, Applications, Structural Health Monitoring and AI-Enabled Sensing. Sensors 2026, 26, 3581. [Google Scholar] [CrossRef] [Scilit] [PubMed]
- Ren, L.; Jiang, T.; Jia, Z.; Li, D.; Yuan, C.; Li, H. Pipeline Corrosion and Leakage Monitoring Based on the Distributed Optical Fiber Sensing Technology. Measurement 2018, 122, 57–65. [Google Scholar] [CrossRef] [Scilit]
- Jousset, P.; Currenti, G.; Schwarz, B.; Chalari, A.; Tilmann, F.; Reinsch, T.; Zuccarello, L.; Privitera, E.; Krawczyk, C.M. Fibre Optic Distributed Acoustic Sensing of Volcanic Events. Nat. Commun. 2022, 13, 1753. [Google Scholar] [CrossRef] [Scilit] [PubMed]
- Xie, L.; Qiu, J.; Wang, H.; Xu, J.; Hou, P.; Wu, Y. A Broadband Distributed Acoustic Sensing System Integrating Phase-Sensitive OTDR and Mach-Zehnder Interferometer. Opt. Laser Technol. 2026, 197, 114692. [Google Scholar] [CrossRef] [Scilit]
- Motil, A.; Bergman, A.; Tur, M. [INVITED] State of the Art of Brillouin Fiber-Optic Distributed Sensing. Opt. Laser Technol. 2016, 78, 81–103. [Google Scholar] [CrossRef] [Scilit]
- Li, T.; Chen, C.; Jiang, T.; Dong, Y. Recent Progress in Emerging Directions of Brillouin Optical Fiber Sensing: Analyzing, Designing, and Implementing Acoustic Waves [Invited]. Chin. Opt. Lett. 2026, 24, 030005. [Google Scholar] [CrossRef] [Scilit]
- Karapanagiotis, C.; Hicke, K.; Krebber, K. Machine Learning Assisted BOFDA for Simultaneous Temperature and Strain Sensing in a Standard Optical Fiber. Opt. Express 2023, 31, 5027–5041. [Google Scholar] [CrossRef] [Scilit] [PubMed]
- Thévenaz, L. Brillouin Distributed Time-Domain Sensing in Optical Fibers: State of the Art and Perspectives. Front. Optoelectron. China 2010, 3, 13–21. [Google Scholar] [CrossRef] [Scilit]
- Smith, R.G. Optical Power Handling Capacity of Low Loss Optical Fibers as Determined by Stimulated Raman and Brillouin Scattering. Appl. Opt. 1972, 11, 2489–2494. [Google Scholar] [CrossRef] [Scilit] [PubMed]
- Agrawal, G.P. Nonlinear Fiber Optics. In Proceedings of the Nonlinear Science at the Dawn of the 21st Century; Christiansen, P.L., Sørensen, M.P., Scott, A.C., Eds.; Springer: Berlin/Heidelberg, Germany, 2000; pp. 195–211. [Google Scholar]
- Peisakhov, A.; Ben-Ami, U.; Ishaaya, A.A. Significant SBS Suppression in Optical Fibers via Spectral and Temporal Distribution: A Pathway to Scalable Power Transmission. Opt. Laser Technol. 2026, 193, 114395. [Google Scholar] [CrossRef] [Scilit]
- Supradeepa, V.R. Stimulated Brillouin Scattering Thresholds in Optical Fibers for Lasers Linewidth Broadened with Noise. Opt. Express 2013, 21, 4677–4687. [Google Scholar] [CrossRef] [Scilit] [PubMed]
- Flores, A.; Robin, C.; Lanari, A.; Dajani, I. Pseudo-Random Binary Sequence Phase Modulation for Narrow Linewidth, Kilowatt, Monolithic Fiber Amplifiers. Opt. Express 2014, 22, 17735–17744. [Google Scholar] [CrossRef] [Scilit] [PubMed]
- White, J.O.; Vasilyev, A.; Cahill, J.P.; Satyan, N.; Okusaga, O.; Rakuljic, G.; Mungan, C.E.; Yariv, A. Suppression of Stimulated Brillouin Scattering in Optical Fibers Using a Linearly Chirped Diode Laser. Opt. Express 2012, 20, 15872–15881. [Google Scholar] [CrossRef] [Scilit] [PubMed]
- Harish, A.V.; Nilsson, J. Optimization of Phase Modulation Formats for Suppression of Stimulated Brillouin Scattering in Optical Fibers. IEEE J. Sel. Top. Quantum Electron. 2018, 24, 5100110. [Google Scholar] [CrossRef] [Scilit]
- Lee, H.; Agrawal, G.P. Suppression of Stimulated Brillouin Scattering in Optical Fibers Using Fiber Bragg Gratings. Opt. Express 2003, 11, 3467–3472. [Google Scholar] [CrossRef] [Scilit] [PubMed]
- Keaton, G.L.; Leonardo, M.J.; Byer, M.W.; Richard, D.J. Stimulated Brillouin Scattering of Pulses in Optical Fibers. Opt. Express 2014, 22, 13351–13365. [Google Scholar] [CrossRef] [Scilit] [PubMed]
- Su, R.; Zhou, P.; Wang, X.; Xiao, H.; Xu, X. Dependence of Stimulated Brillouin Scattering in Pulsed Fiber Amplifier on Signal Linewidth, Pulse Duration, and Repetition Rate. Chin. Opt. Lett. 2012, 10, 111402. [Google Scholar] [CrossRef] [Scilit]
- Sincore, A.; Bodnar, N.; Bradford, J.; Abdulfattah, A.; Shah, L.; Richardson, M.C. SBS Threshold Dependence on Pulse Duration in a 2053 Nm Single-Mode Fiber Amplifier. J. Light. Technol. 2017, 35, 4000–4003. [Google Scholar] [CrossRef]
- Geinitz, E.; Jetschke, S.; Röpke, U.; Schröter, S.; Willsch, R.; Bartelt, H. The Influence of Pulse Amplification on Distributed Fibre-Optic Brillouin Sensing and a Method to Compensate for Systematic Errors. Meas. Sci. Technol. 1999, 10, 112. [Google Scholar] [CrossRef] [Scilit]
- Giles, C.R.; Desurvire, E. Modeling Erbium-Doped Fiber Amplifiers. J. Light. Technol. 1991, 9, 271–283. [Google Scholar] [CrossRef] [Scilit]
Disclaimer/Publisher’s Note: The statements, opinions and data contained in all publications are solely those of the individual author(s) and contributor(s) and not of MDPI and/or the editor(s). MDPI and/or the editor(s) disclaim responsibility for any injury to people or property resulting from any ideas, methods, instructions or products referred to in the content. |
© 2026 by the authors. Licensee MDPI, Basel, Switzerland. This article is an open access article distributed under the terms and conditions of the Creative Commons Attribution (CC BY) license.