


Abstract
Vibration measurements are essential for the early detection of faults in rotating machinery and are particularly important for hydrogenerators in hydro power plants. Industrial applications of vibration measurements typically rely on displacement, velocity, and acceleration sensors, each offering distinct advantages and limitations. This paper discusses and proposes a cost-effective, contactless optical vibration sensing system based on standard fiber-optic telecommunication components, enabling its integration into existing fiber-optic networks. The proposed system utilizes interferometric sensing principles, providing inherent immunity to electromagnetic interference and galvanic effects while achieving micrometer-scale resolution. The key advancement of the proposed sensor lies in the relatively simple and cost-effective configuration—the realization of the Michelson interferometer. It facilitates a combination of standard optical communication hardware, including a 3 × 3 fiber-optic coupler and two photodetectors for reliable discrimination of vibration displacement directions. The associated signal processing platform is based on a cross-correlation algorithm by which both the direction and the magnitude of displacement are determined. The optical sensor was experimentally validated using a realistic-scenario laboratory setup, which demonstrates the feasibility and performance of the proposed approach.
1. Introduction
Since the very beginning of power generation, equipment vibration has been a severe problem in hydro power plants (HPPs) [1]. Vibration measurement is very important, as it provides early indication of impending failures. Destruction and failure can be prevented with properly scheduled maintenance.
Vibration condition monitoring is essential to ensure proper operation of equipment and enable early detection of hidden faults [2]. Recent studies on active magnetic bearing (AMB) rotor systems have shown that external base excitations can significantly influence rotor dynamics and vibration levels, further emphasizing the importance of accurate vibration monitoring for reliable operation and effective fault prevention in rotating machinery [3].
Three primary types of sensors are most often employed for measurement of machinery vibrations in industrial applications: displacement sensors, velocity sensors, and accelerometers [2,4]. Each sensor type exhibits distinct advantages, as well as limitations, which are largely determined by the specific application and relevant frequency range [5].
Displacement sensors operate based on capacitive, optical, or ultrasonic principles and are suitable for measuring vibration frequencies below 10 Hz [6]. Velocity sensors are electromechanical devices that directly measure displacements induced by vibrations. However, their sensitivity decreases at low vibration frequencies, resulting in inaccurate measurements for frequencies below 10 Hz [2,6].
Accelerometers are sensors designed to measure acceleration. They have been widely used in electronic devices and automotive systems [7]. Their operation is based on the principle of inertia, whereby the force acting on a mass is measured during acceleration [7]. Accelerometers are available in various configurations, including uniaxial and triaxial designs (measuring acceleration along one or three axes), as well as wired and wireless implementations, enabling a wide range of applications [7]. Among the various types of accelerometers, piezoelectric and microelectromechanical systems (MEMSs), accelerometers are most frequently utilized for applications involving rotating machinery.
Accelerometers are widely used due to their high accuracy, wide measurement range, simple installation, and cost-effectiveness. Furthermore, the acceleration signal can be easily integrated to determine velocity and displacement [8].
Nonetheless, piezoelectric accelerometers possess certain limitations. Measurement results and resolution can be adversely affected by connector contamination and cable-induced noise. In addition, the inherently high signal impedance makes these devices more susceptible to noise, thereby requiring the use of shielded cables for proper operation [4].
Recent advances in semiconductor microfabrication techniques have enabled the production of devices composed of mechanical components with dimensions of a few micrometers [9]. Consequently, MEMS accelerometers have been developed. Compared with conventional piezoelectric accelerometers, these devices are significantly smaller [10]. Owing to their miniaturized scale, MEMS accelerometers are particularly well suited for vibration monitoring in rotating structures [11]. MEMS sensors are associated with several advantages, including high sensitivity, reliable performance, and considerable flexibility in terms of integration due to their compact size. However, their principal drawback is the considerable complexity of their design and fabrication processes [4].
Classical sensors used in industry require a power supply, shielding to eliminate electromagnetic interference, and additional modifications and investments for operation at elevated temperatures.
Optical interferometry is based on the wave nature of light and the interference of two or more light beams emitted from a laser or another monochromatic source. The beams propagate through free space or dielectric media, including optical fibers, along different optical paths, and converge at a point in space or on the surface of an object [12]. As a result, an optical phase difference is induced between the beams, causing light intensity to vary periodically with the optical path difference. Recently, self-mixing interferometry (SMI) has also emerged as an attractive optical technique for high-resolution vibration sensing. In [13], nanometer-scale vibration measurements were demonstrated using an intracavity frequency-doubling solid-state laser, achieving sub-nanometer displacement resolution.
A special subgroup of optical interferometers is formed by interferometers implemented using optical fibers (fiber-optic interferometers) [14,15,16,17,18]. These devices use optical fibers to guide and split light, instead of conventional optical components such as mirrors and lenses.
Optical sensors, including fiber-optic sensors employing interferometry, offer several advantages. They are made entirely of dielectric materials, rendering them immune to electromagnetic interference, and capable of withstanding elevated temperatures [15,19,20]. Compared with conventional sensors, the fiber-optic interferometer sensors are highly sensitive; they are a passive measurement device not requiring electrical power (only light), and do not require electromagnetic shielding, since the optical fiber is a dielectric transmission medium. These properties make them particularly suitable for operation in harsh environments [21,22], such as hydrogenerators in hydro power plants and systems where strong electromagnetic interference prevents the use of conventional electronic sensors. Optical interferometers are typically classified into four principal types: Mach–Zehnder, Michelson, Sagnac, and Fabry–Pérot interferometers.
Optical vataibration sensors based on fiber-optic components, including Fabry–Pérot Interferometers (FPIs) and Fiber Bragg Gratings (FBGs), have been widely reported in the literature [23,24,25]. Realizations of sensors based on extrinsic FPIs are of particular interest for measuring surface vibration because they can be implemented without physical contact with the surface under inspection. In addition, they are attractive due to their miniaturization and integration capabilities. However, their key component is a partly reflective (gradient index) lens that is not a standard telecom component (commercial GRIN fiber collimators typically have return losses larger than 60 dB). Therefore, to realize the desired interferometric sensor using standard telecom components, we considered Michelson and Mach–Zehnder interferometers.
Most fiber-optic interferometer designs rely on a 2 × 2 optical coupler and a single photodetector. In contrast, refs. [26,27,28] discuss configurations that use a 3 × 3 fiber-optic coupler and two or three photodetectors with quadrature demodulation, with the goal being to develop a nanometer-scale vibration sensor. The needed signal processing is quite complex—it requires amplitude normalization; ellipse (Lissajous) fitting to compensate for imperfect splitting ratios; and, finally, an arctangent (atan2) operation to recover a continuous, unwrapped optical phase. The vibrations resulting from rotating machinery are on a much larger scale, so micrometer accuracy and, consequently, simpler sensor architecture and signal processing are more appropriate.
This paper presents a different approach to the measurement of vibrations and detection of abnormal operating conditions of, e.g., power generators. This system is intended for integration into an existing fiber-optic network and installation into a harsh EM environment, i.e., inside power generators. The system consists of cost-effective telecommunication components: a laser source, an optical fiber, a fiber-optic coupler, a collimator, a Faraday mirror, and two photodetectors. A sensing principle based on the interferometric principle is used, serving as an alternative to conventional piezoelectric, MEMS, or contactless capacitive sensors. The signal processing is quite simple—it is based on the determination of zero crossings, which correspond to fixed increments of optical path length. Because zero-crossing detection depends only on a threshold/sign transition rather than absolute signal amplitude, it is inherently insensitive to laser intensity and back-reflection fluctuations, coupling loss drift, or detector gain variation. However, additional effort is needed to determine the direction of optical path-length change.
The key contribution of the proposed sensor lies in the deployment of two photodetectors in conjunction with a 3 × 3 fiber-optic coupler, enabling discrimination of the displacement direction of a vibrating measurement object. The associated signal-processing algorithm combines the cross-correlation method to determine displacement direction and the zero-crossing method to calculate vibration magnitudes.
The developed portable measurement system was experimentally tested on a laboratory setup at the Faculty of Electrical Engineering, Mechanical Engineering and Naval Architecture (FESB) in Split, Croatia. The obtained results were compared with those acquired using conventional sensors. Appropriate voltage (and frequency) converters, controlled by a separate computer, were used to adjust the rotational speeds of DC and AC machine groups from 0 to 1560 rpm under various load conditions. Data were acquired at a sampling frequency of 1,562,500 sps and downsampled by a factor of 50, resulting in an effective sampling rate of 31,250 sps for the signal processing workflow, which includes raw data acquisition, decimation and signal conditioning using an HF bandpass Butterworth-type digital filter, zero-crossing-based velocity calculation, a dual-detector-based cross-correlation inversion method, low-pass digital filtering, and result visualization.
2. Development of a Sensor Configuration Aimed at High EM Fields and Integration into an Existing Fiber-Optic Telecommunication Network
With the emergence of optical fibers and the development of optical sensors, new possibilities and trends have emerged for their application in industry [29]. These include very sensitive, all-fiber, light and compact systems immune to electromagnetic interference and galvanic effects. The proposed newly developed sensor based on fiber-optic interferometry inherits these principles. It utilizes affordable, cost-effective telecommunication components for a proof-of-concept study.
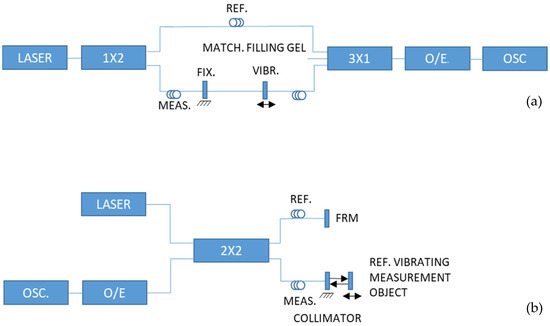
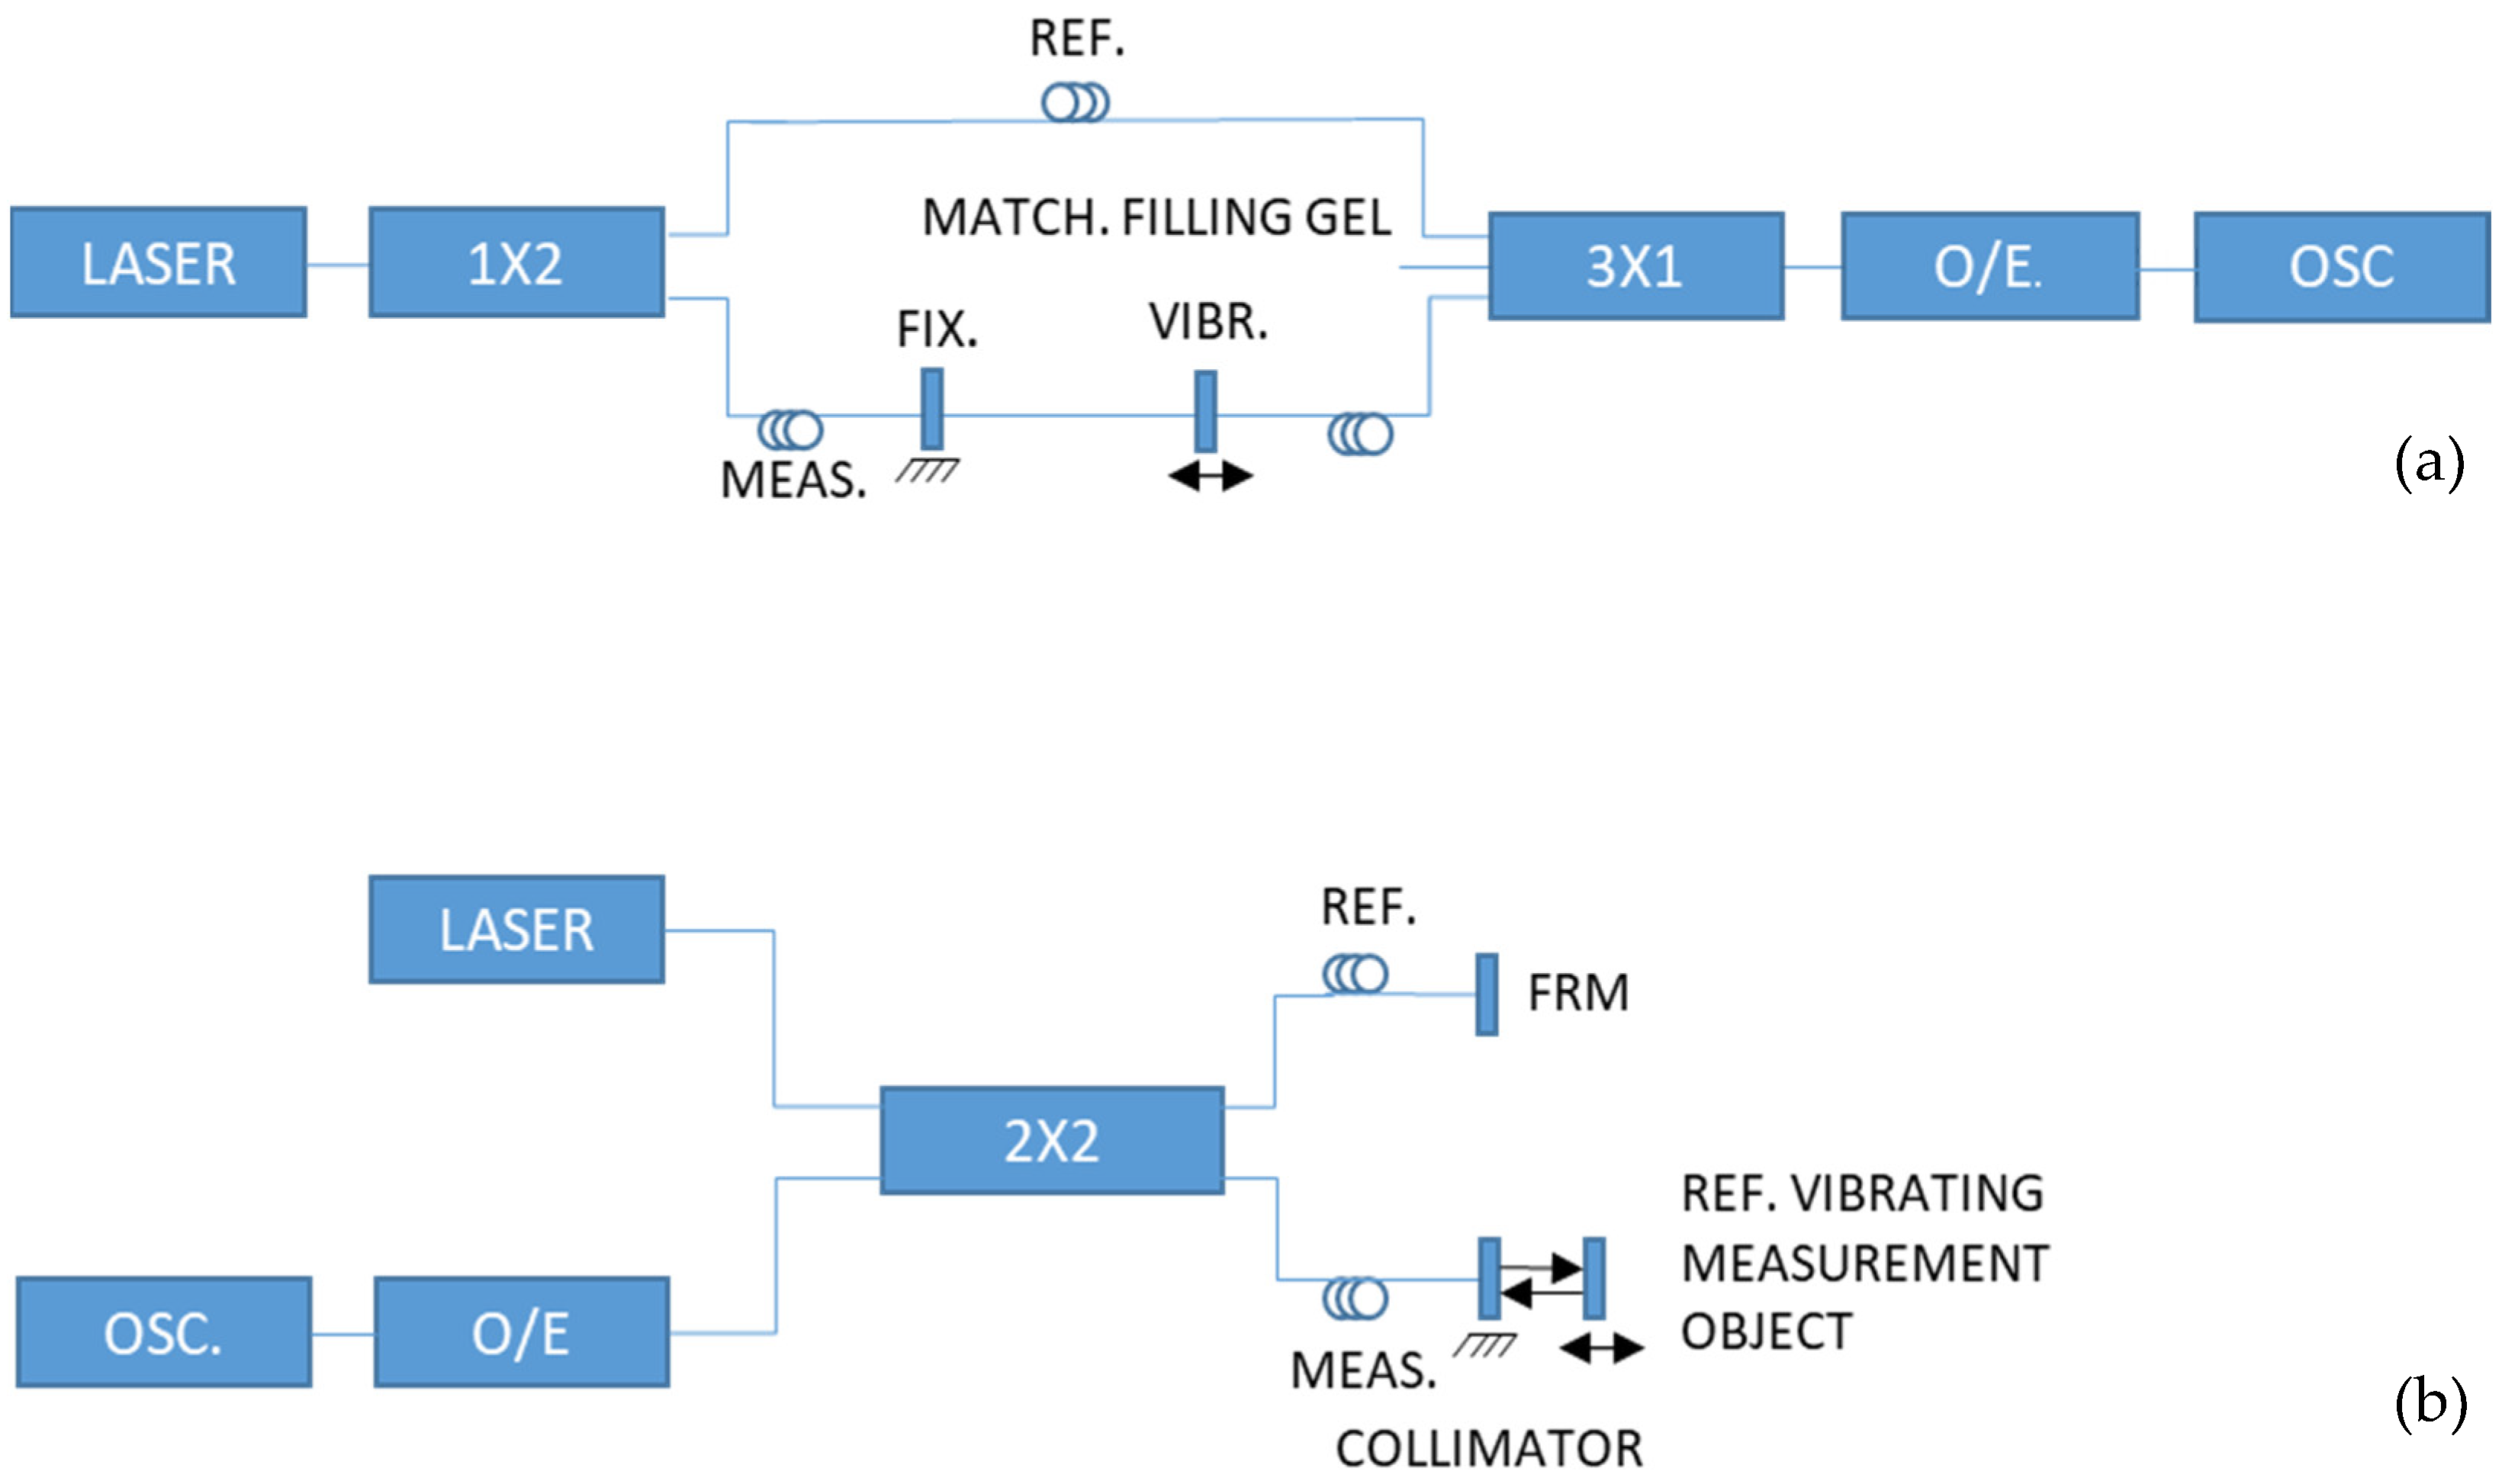
The first sensor configuration considered was a Mach–Zehnder interferometer (Figure 1a) [4]. It was constructed from standard fiber-optic telecommunication components, including optical fiber, 1 × 2 and 3 × 1 Fused Biconical Taper (FBT) couplers, a photodetector, and a laser source with an integrated isolator. The coupler splits the laser light into measurement and reference arms. A section of the measurement arm is tensioned between the vibrating object and a fixed point (Figure 2). This causes vibration-induced phase shifts relative to the reference arm and modulates the interference signal [14]. Experimental results demonstrated a micrometer-scale displacement-magnitude range. This confirmed the potential of fiber-optic interferometric techniques for vibration monitoring of large rotating machinery [4].
Figure 1.
(a) Operating principle of the fiber-optic sensor based on a Mach–Zehnder interferometer and (b) operating principle of the contactless optical sensor based on a Michelson interferometer.
Figure 2.
Measurement arm tensioned between the vibrating measurement object and the fixed point.
However, several limitations were identified [4]. The most important one is the inability to attach and exert the measurement fiber directly to the rotating measurement object. In addition, the sensor is highly sensitive to environmental disturbances, including mechanical vibrations and temperature variations, which introduce phase noise and measurement errors. Finally, the sensing fiber must remain mechanically tensioned, which increases installation complexity, the risk of fiber damage, and the influence of secondary mechanical effects on measurement accuracy. Therefore, the Mach–Zehnder interferometer was considered impractical for reliable vibration measurements in industrial environments.
For the reasons discussed above, the Michelson interferometer was taken as the governing principle and configuration (Figure 1b). Its main advantage is the possibility of contactless measurement, provided that back-reflection is sufficient for detection, which is mostly the case when measuring a vibrating metallic object, such as in this case. This implementation does not require a tensioned sensing fiber between the vibrating measurement object and the fixed point, thereby eliminating the risks of possible mechanical damage in the measurement arm and simplifying the installation procedure. Compared with the Mach–Zehnder configuration, the Michelson interferometer provides twice the sensitivity. This is because the optical signal propagates through the measurement path twice: once towards the measuring, vibrating object and once away from it, thereby doubling the induced phase shift [14].
The early Michelson-based sensor was built using standard fiber-optic telecommunication components. These include a G.652D 9/125 µm optical fiber, a single-mode GRIN fiber collimator operating at 1550 nm, a Faraday mirror, a 2 × 2 FBT-based fiber-optic coupler, a laser source with an integrated isolator, and a photodetector.
Although the Michelson configuration requires precise optical alignment and tuning, resulting in more complex implementation due to free-space reflection management, the overall evaluation indicated that its advantages outweigh its disadvantages. Due to its ability to perform contactless measurements, lack of risk of fiber damage, simplified installation, and high sensitivity, the Michelson interferometer configuration was considered the most appropriate configuration for further development.
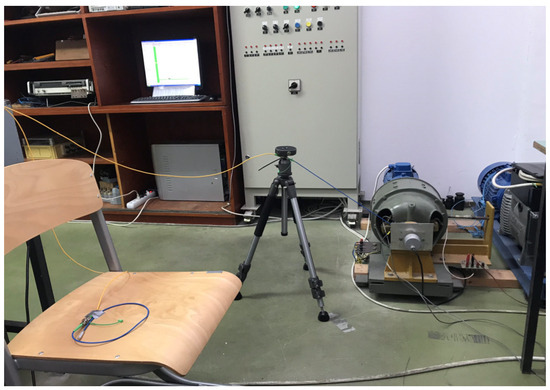
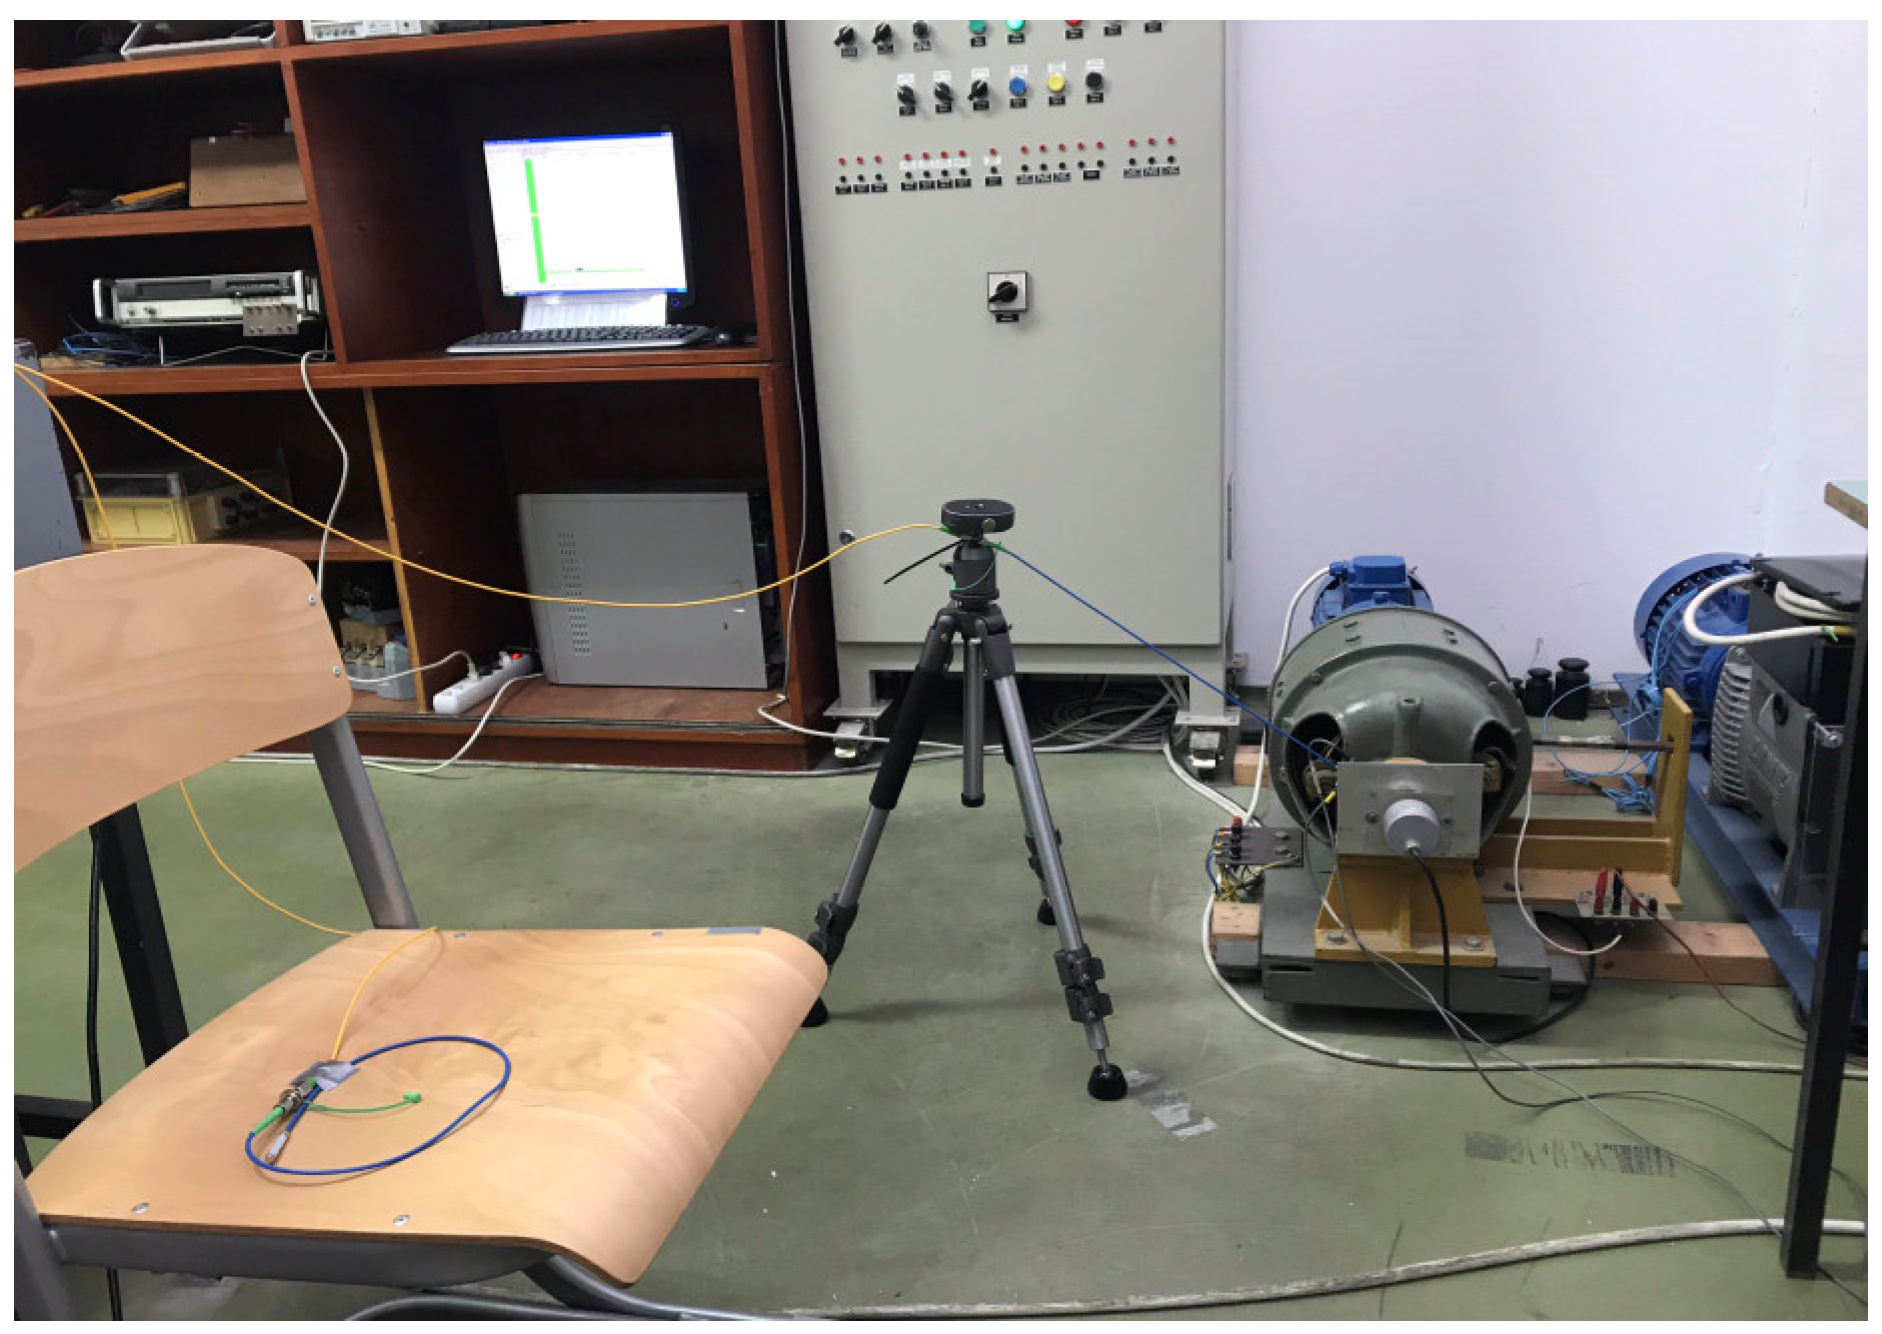
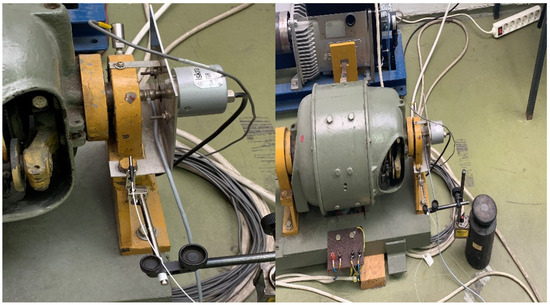
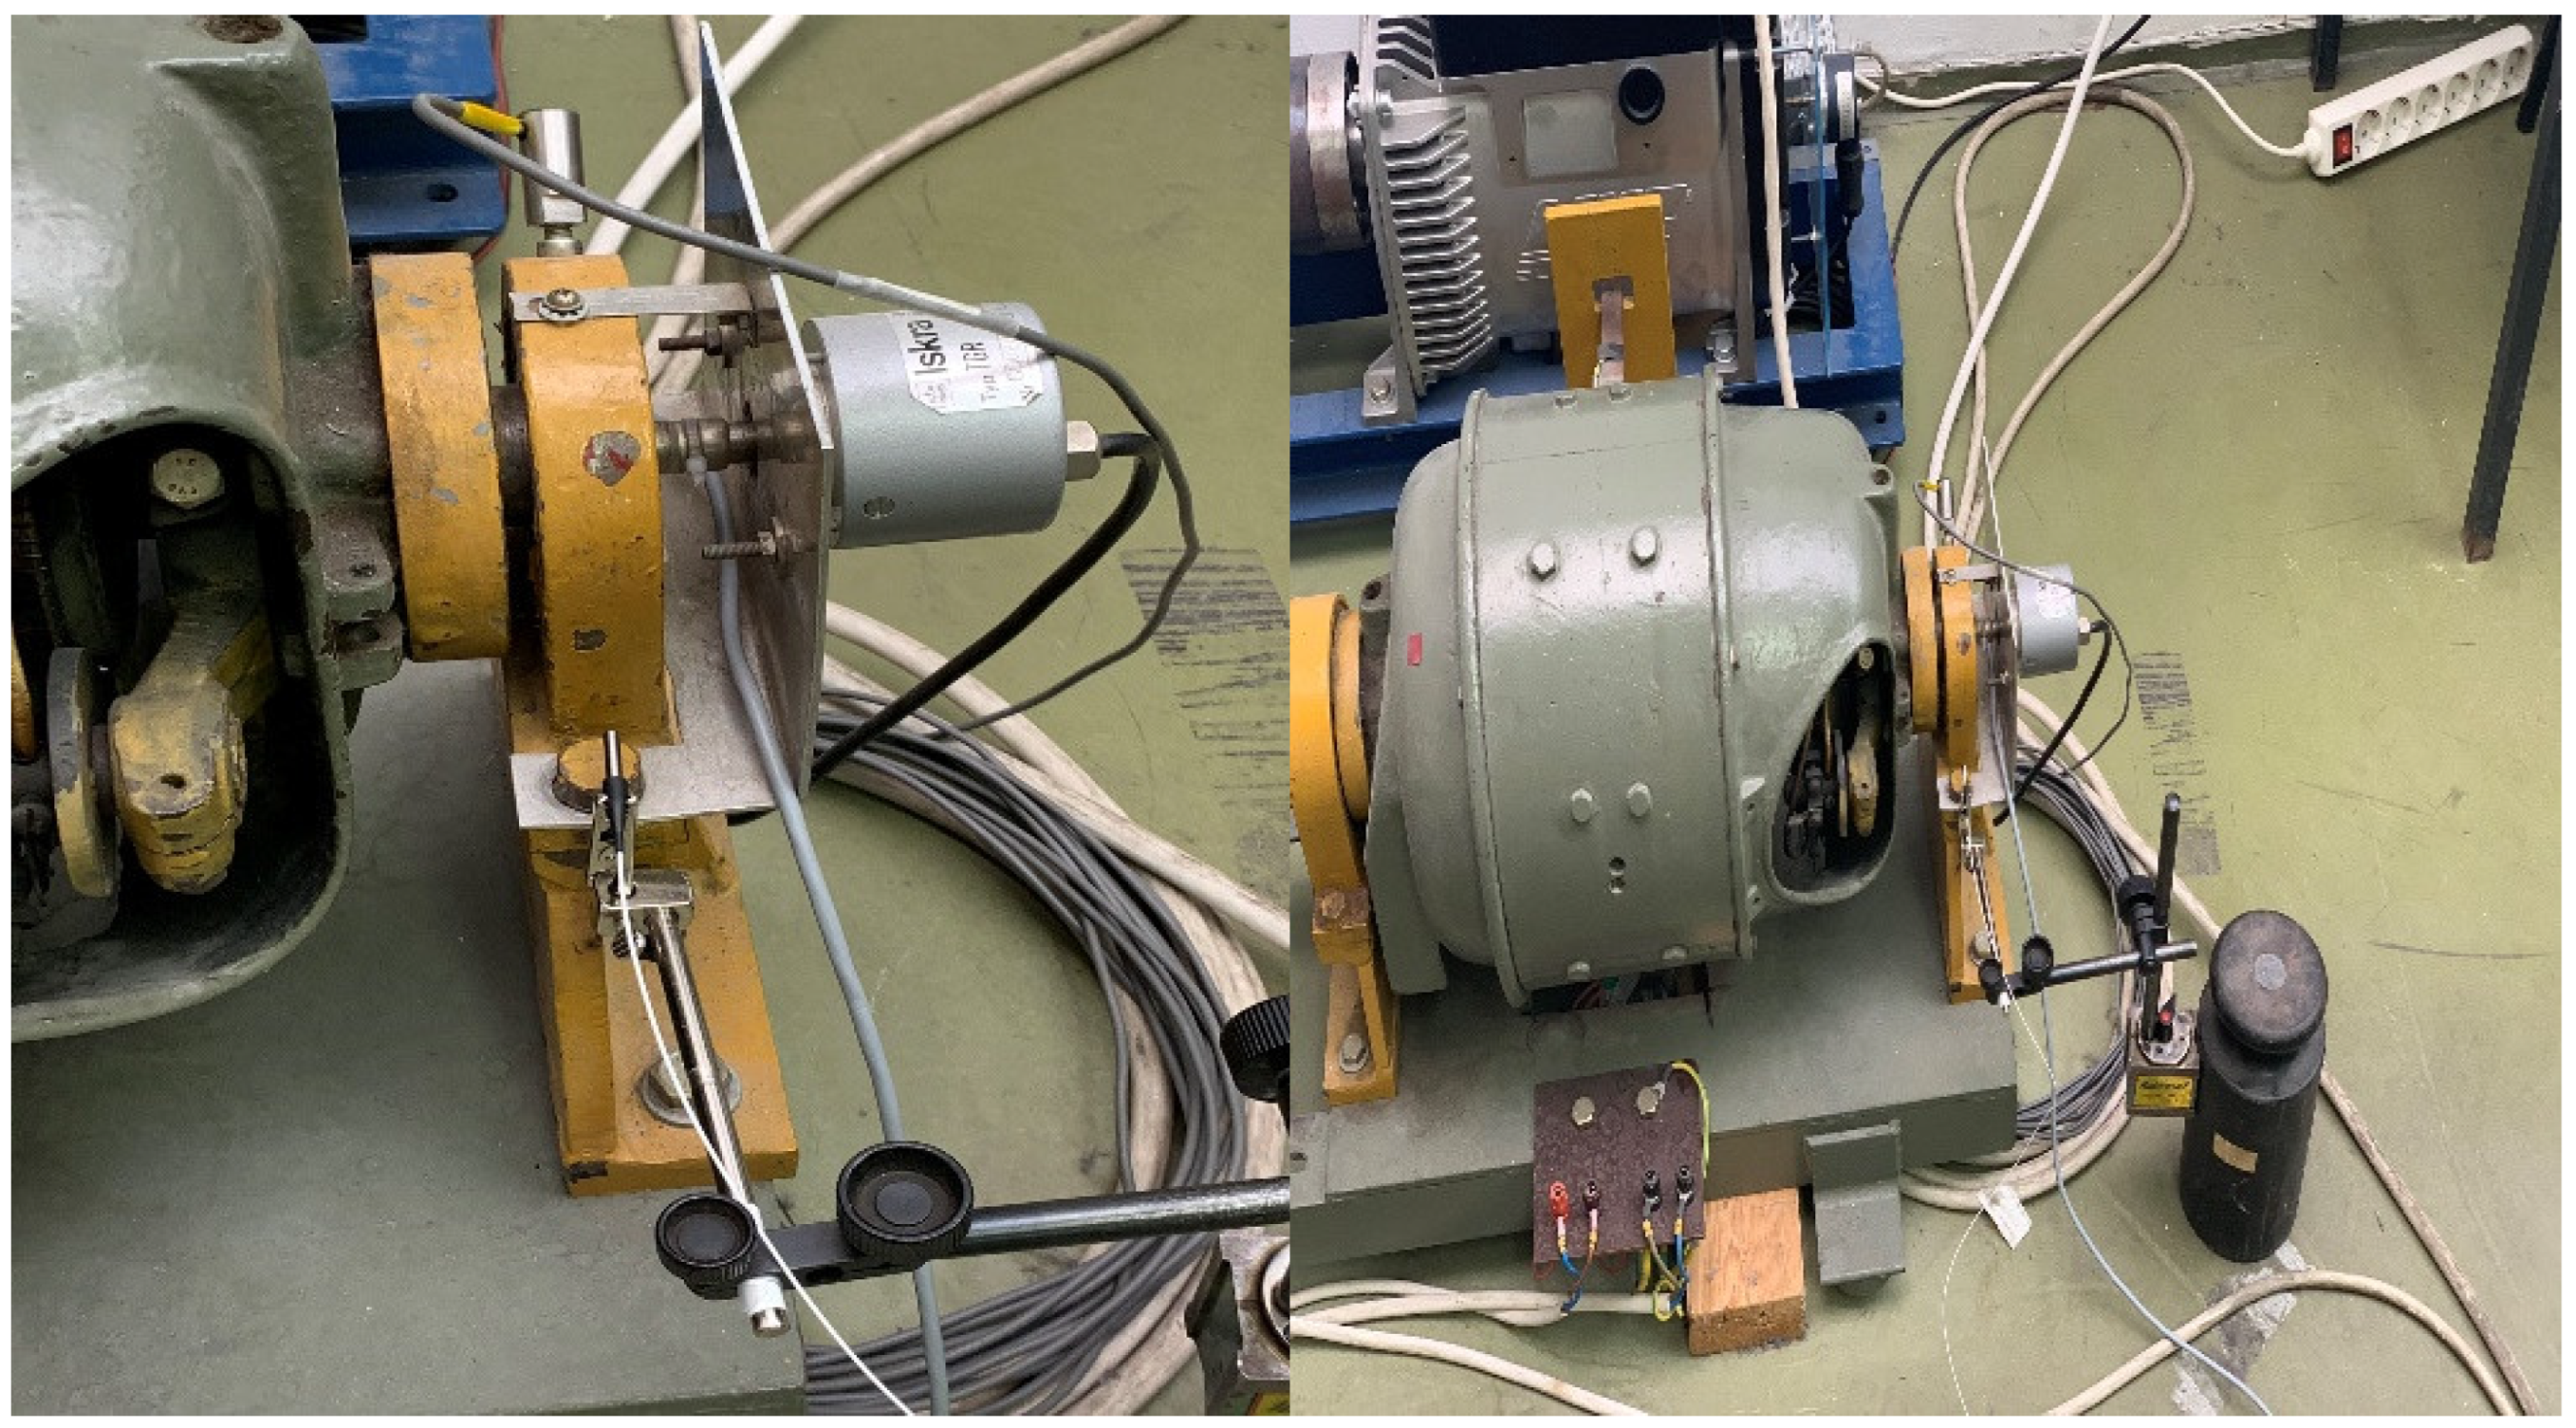
An example of the contactless optical vibration sensor setup based on the Michelson interferometer is shown in Figure 3, from two different angles.
Figure 3.
Experimental setup for contactless measurement based on the Michelson interferometer configuration in the FESB laboratory.
Upon completion of optical-to-electrical (O/E) and subsequent analog-to-digital (A/D) conversion processes, the voltage signal (U(t)) was generated. The laser’s wavelength, specified here as 1550 nm (telecommunication diode laser), was used to determine the time period of the interferometer’s voltage signal (U(t)). Specifically, current at the photodetector (and, therefore, the output voltage) was equal to
Here, I1 and I2 are detector current amplitudes due to the presence of a single optical signal, represents the phase change in the measurement arm caused by the vibration of the object, and φ1 and φ2 are time-invariant phases induced by the interferometer arms.
Successive peaks (bright fringes/maxima) occur whenever the optical path difference changes by one wavelength (1 ). The reflecting object (“the mirror”) in the measurement branch (in our case, a rotating and vibrating object moving at a physical distance of d), changes the optical path by 2d (light travels to the reflecting object, then back from the reflecting object). Therefore, the condition for adjacent maxima is
Hence, the velocity is calculated as
where denotes the time value at which the nth peak is obtained. The spatial separation between two successive peaks is identical to that between successive zero crossings with the same slope (rising or falling) in the interferogram and equals λ/2. For adjacent zero crossings with opposite slopes, the separation is λ/4. The zero-crossing method was chosen because it offers a solution that relies mainly on analog electronics rather than digital signal processing.
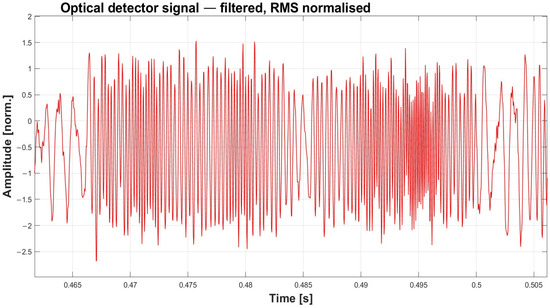
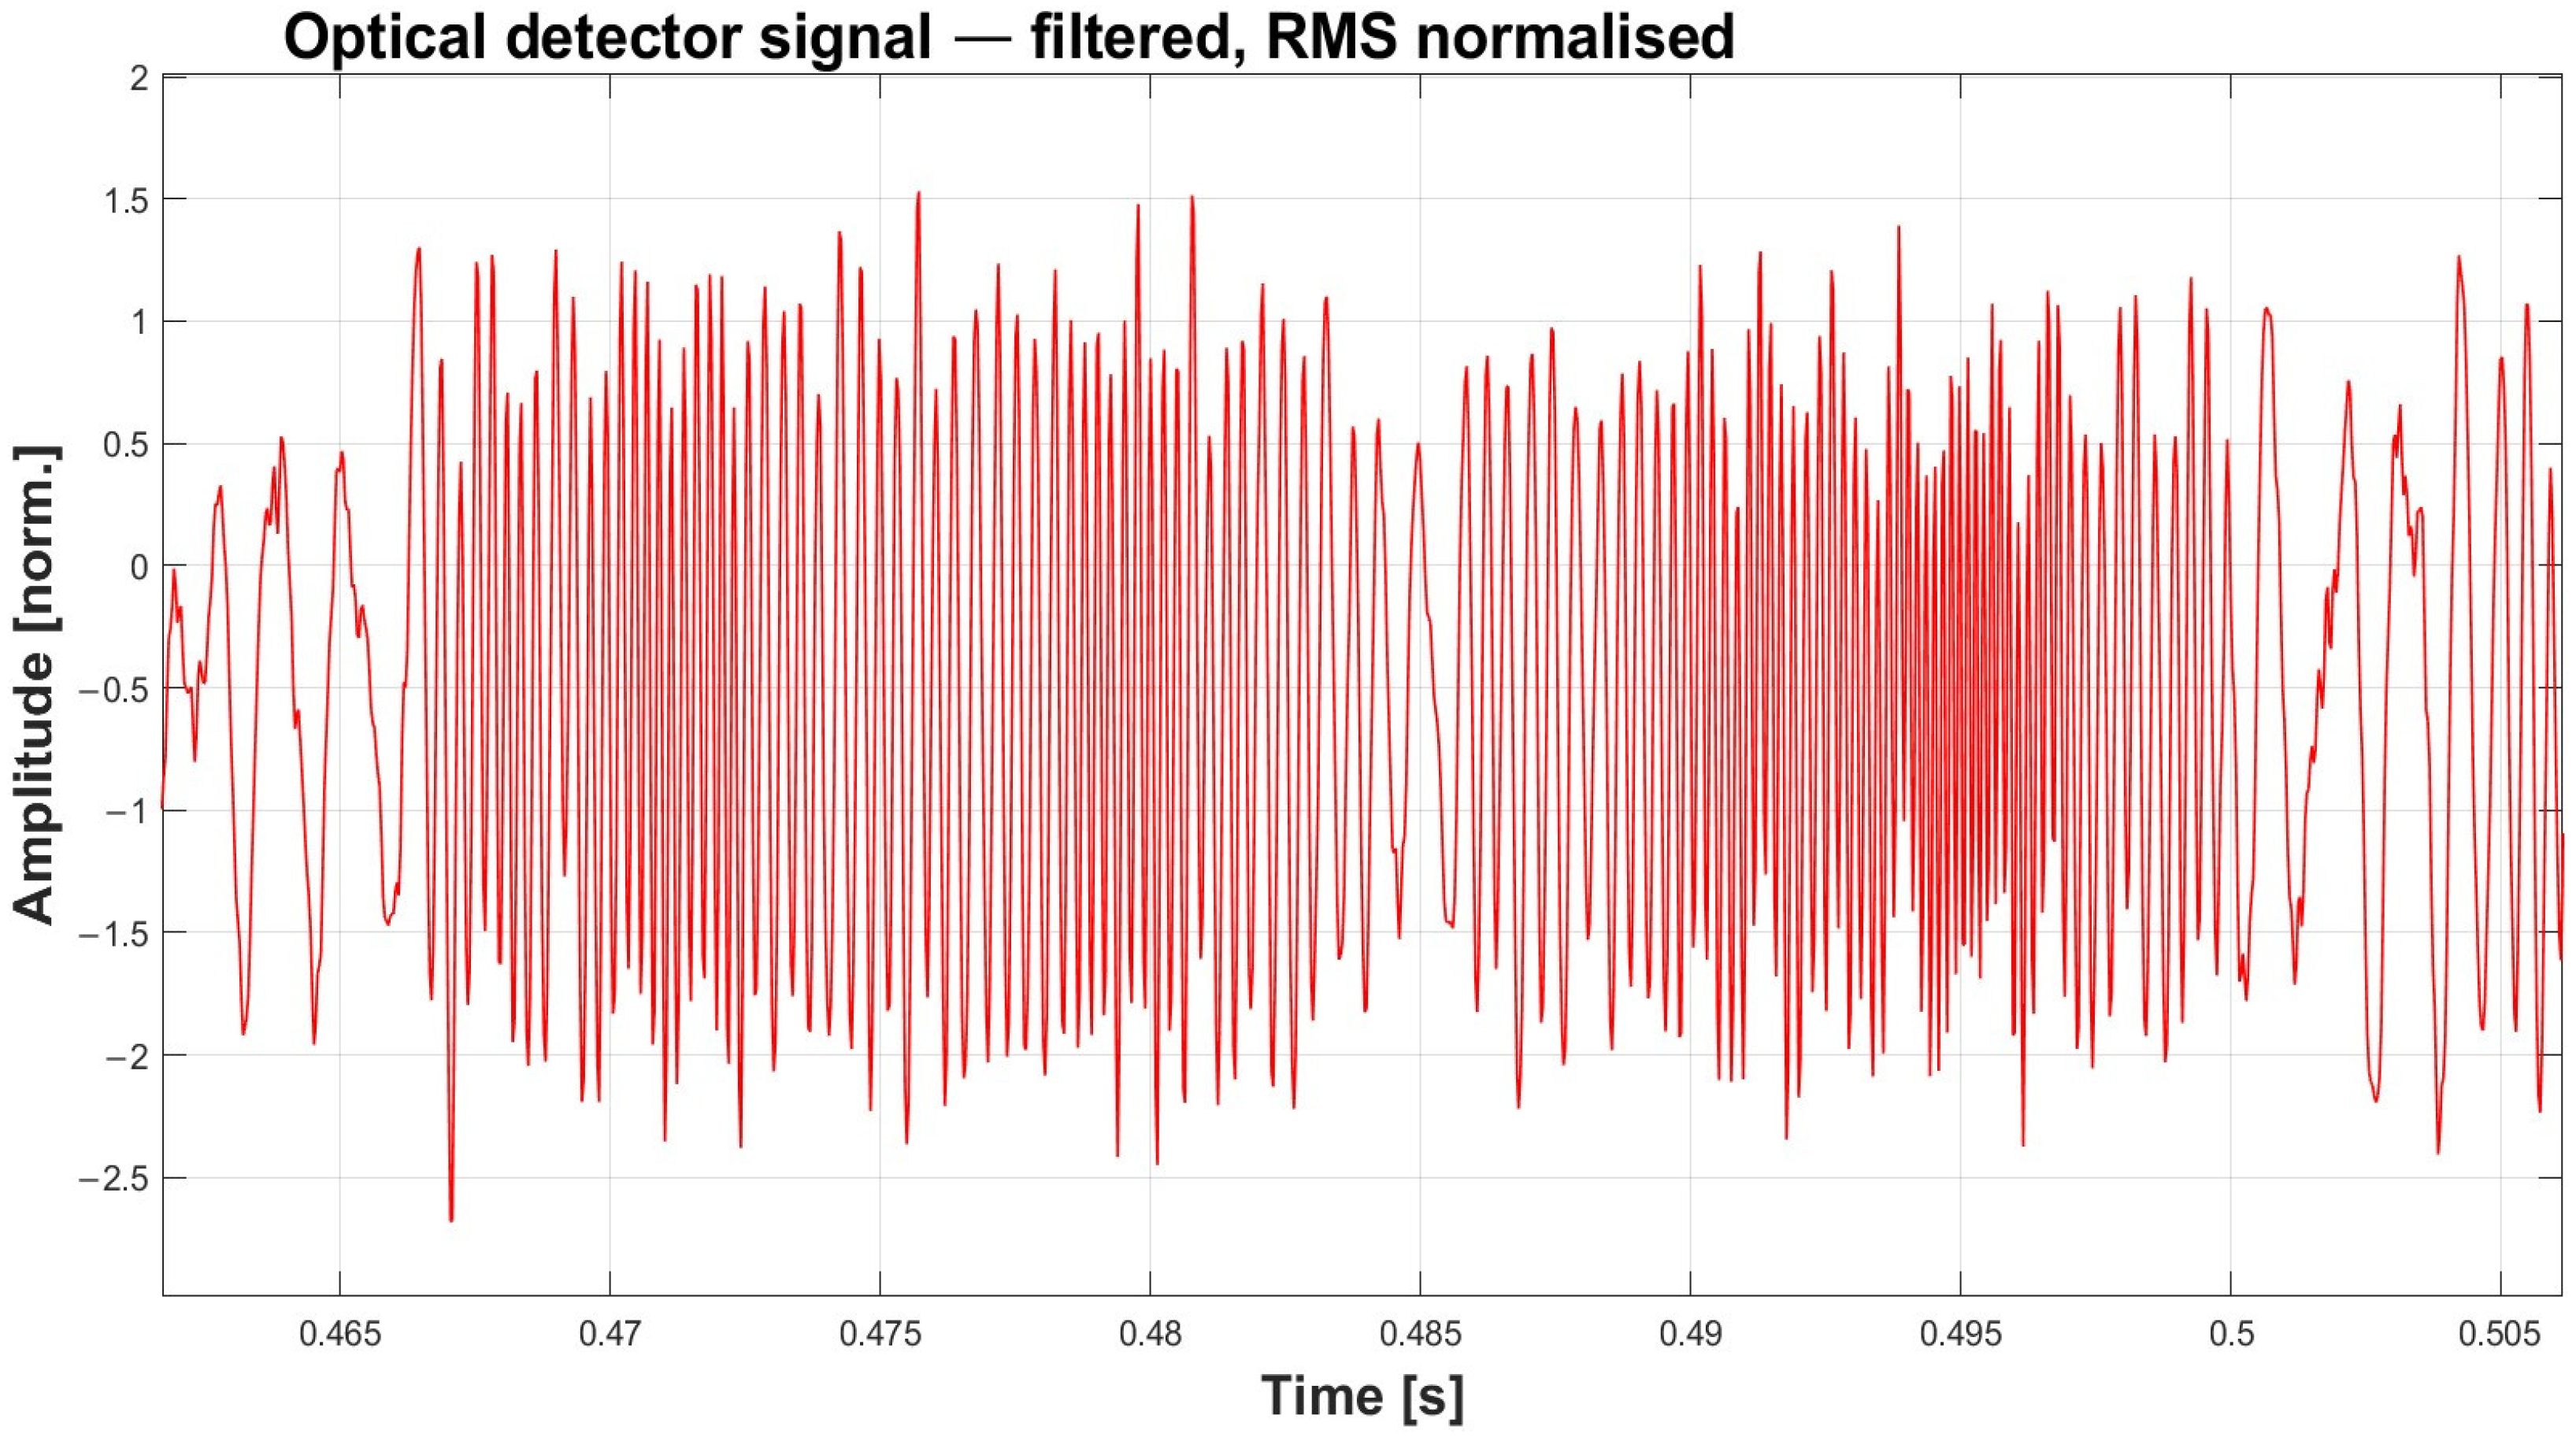
Figure 4 presents the zoomed-in view of the interferometric voltage signal (U(t)), highlighting the interferometric periods.
Figure 4.
Zoomed-in view of the interferometric voltage signal (U(t)), highlighting the interferometric periods.
To remove the DC component and suppress unwanted high-frequency noise, the signal was filtered using a band-pass filter with a passband of 0.02 kHz to 10 kHz. The filter was designed in MATLAB R2023b using the Filter Designer tool. It provides an attenuation of 120 dB/dec per pass (240 dB/dec effective, since the filter is applied in a zero-phase forward–backward manner) above the 10 kHz cutoff. Because all relevant information lies below this cutoff, the filter does not affect the signal’s information content.
To validate the proposed measurement procedure based on the Michelson interferometer, extensive testing was conducted at the FESB laboratory in Split. An industrial MEMS accelerometer (ADXL335, Analog Devices, Inc., Wilmington, MA, USA) was used for comparison of measurement results [30].
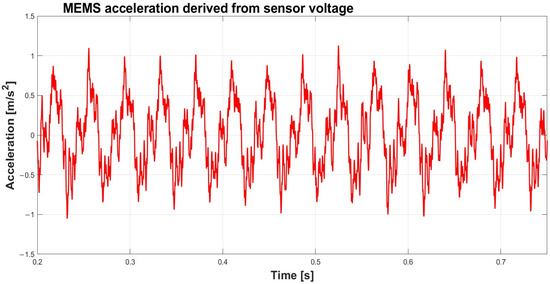
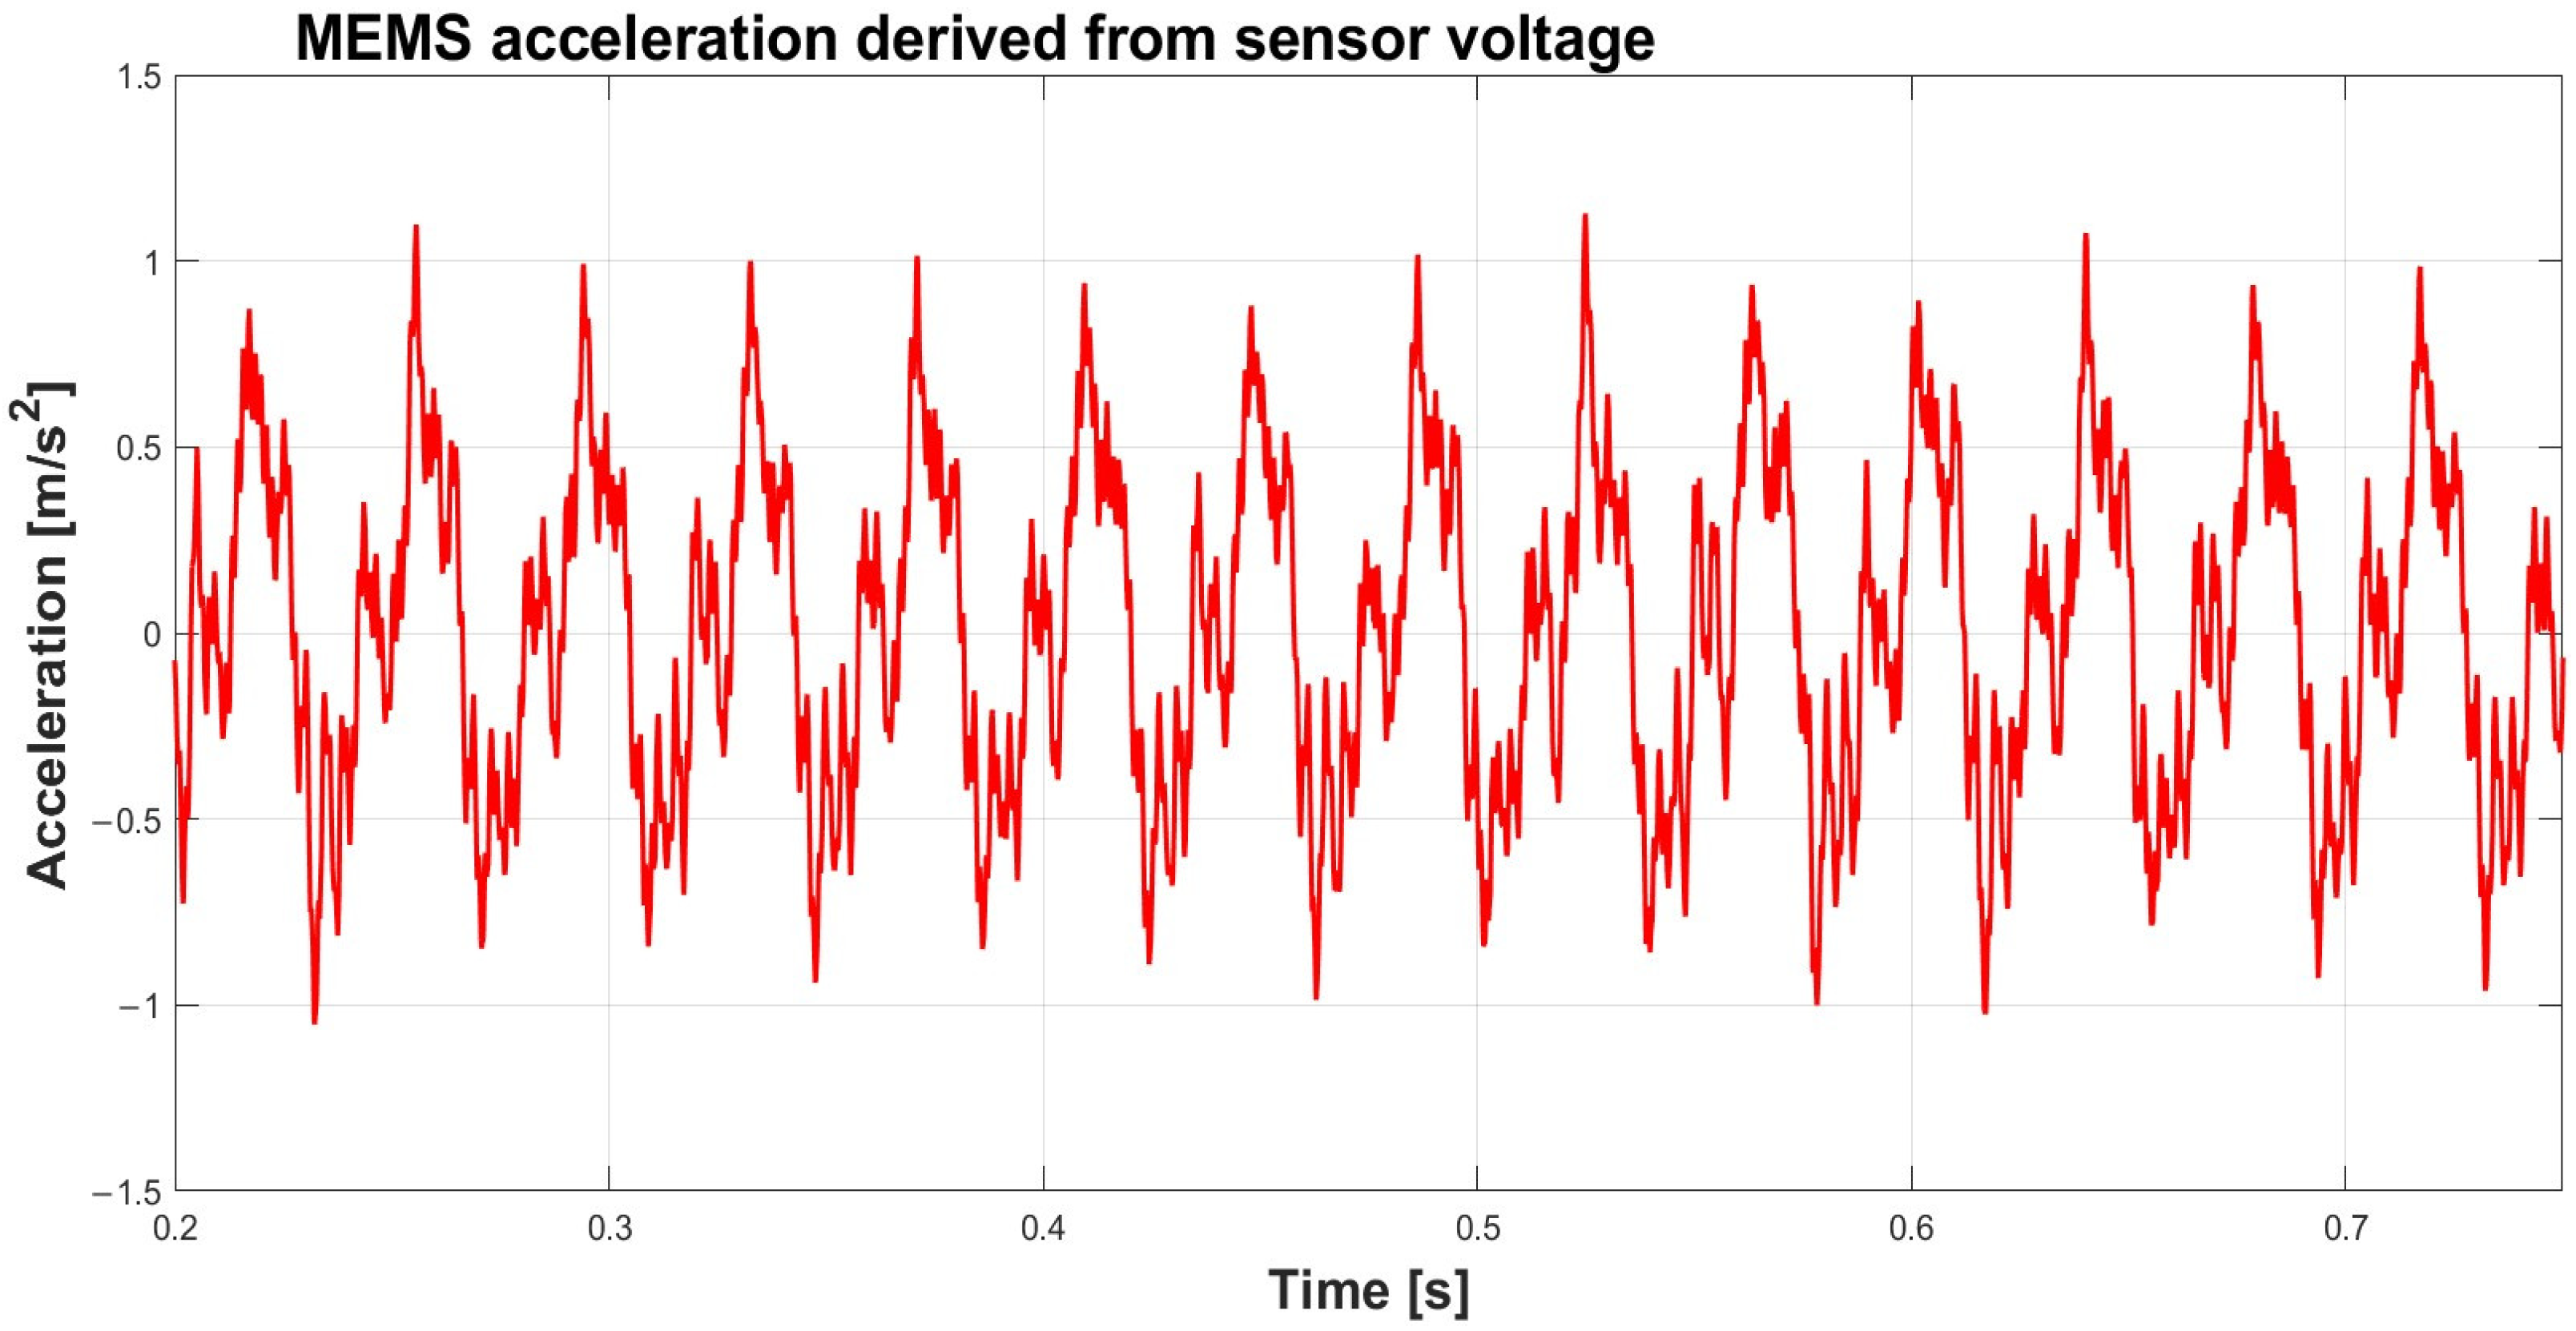
Figure 5 shows the original MEMS accelerometer signal, depicting vibration accelerations.
Figure 5.
Original signal of the MEMS accelerometer.
To enable direct comparison, the velocity of a vibrating measurement object was computed from the acceleration measured by the MEMS accelerometer using a MATLAB code developed for this purpose. This enables comparison between the MEMS accelerometer and the developed contactless optical sensor. Since the original MEMS accelerometer signal also contains noise, the same band-pass filter was applied in order to remove it.
Velocity () was obtained as the time integral of acceleration:
In the numerical implementation, a leaky integration scheme (leakage coefficient of 0.99995) was applied to suppress the DC drift inherent to the numerical integration of the measured acceleration.
Figure 6, Figure 7, Figure 8 and Figure 9 show the measurement results of the Michelson interferometer implementation and of the reference MEMS sensor performed at the FESB laboratory.
Figure 6.
Calculated velocity from MEMS measurements.
Figure 7.
Calculated velocity from interferometer measurements (before applying the inversion procedure).
Figure 8.
FFT of calculated velocity from the interferometer before inversion.
Figure 9.
FFT of calculated velocity from the MEMS accelerometer.
With respect to the signal measured by the MEMS accelerometer oscillating around a zero mean value (Figure 6), it is observed that the velocity values calculated from the interferometer signal dwell only in a positive region (Figure 7), indicating that the two half periods are mapped into the same positive half plane. The reason for this is that the given interferometer does not discriminate against displacement direction. To understand the effect, Fast Fourier Transform (FFT) analysis was performed (Figure 8 and Figure 9). The determined signals, obtained from MEMS and optical sensors, were compared, revealing important differences. The spectrum of the MEMS exhibits a dominant first harmonic and weaker higher harmonics (Figure 9), whereas the optical sensor has a dominant second harmonic at twice the frequency compared to the MEMS base harmonic (Figure 8). These results further indicate that the contactless optical sensor alone does not provide displacement-direction information. To overcome this limitation, a post-processing method was developed to determine the vibration direction, as described in the next section.
3. Cross-Correlation-Based Polarity Inversion in Dual-Photodetector Optical Phase Discrimination
Phase discrimination in interferometric fiber-optic sensing systems is commonly realized using either 2 × 2 or 3 × 3 fiber-coupler architectures. Both approaches aim to recover optical phase variations from interferometric intensity signals. However, they differ significantly in terms of phase-reconstruction capability, directional ambiguity, linearity, and implementation complexity.
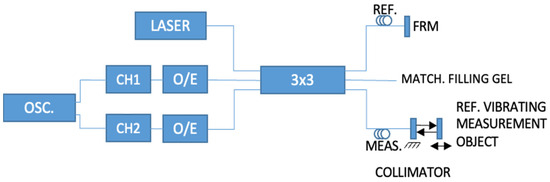
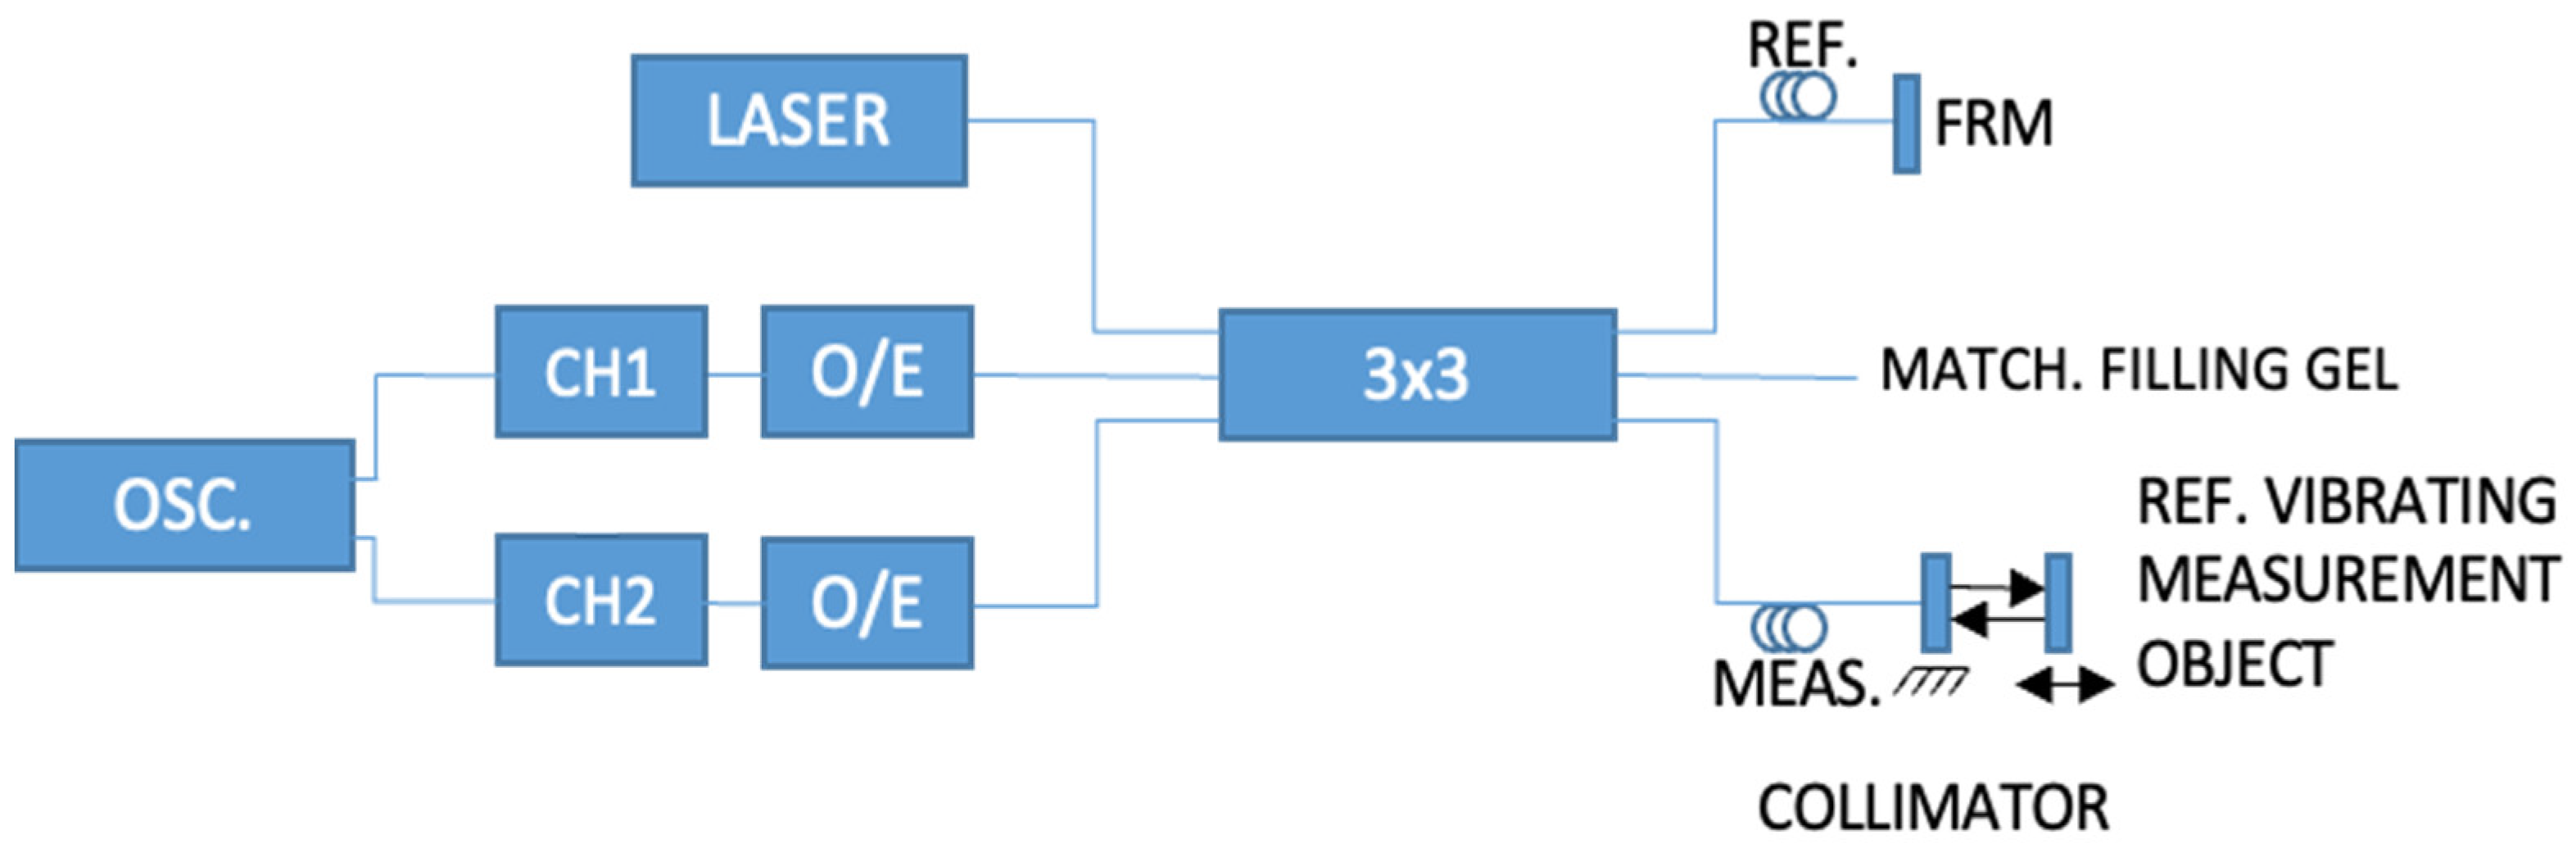
The proposed sensor configuration shown in Figure 10 was implemented using standard fiber-optic telecommunication components. Specifically, we used standard G652D 9/125 µm telecommunication optical fiber, a 1550 nm reference laser with a built-in isolator set at 0.1 mW, two InGaAs photodiodes (900–1700 nm, 17 MHz bandwidth; Thorlabs, Inc., Newton, NJ, USA), a 3 × 3 FBT-based fiber-optic coupler, and a Faraday rotating mirror. One should note that the active components (i.e., the laser and the photodetectors) can be tens of kilometers from the measurement site. In addition, passivation was implemented by suppression of back-reflections at the unused terminals.
Figure 10.
Block diagram of the newly developed optical sensor with a 3 × 3 coupler and two photodetectors.
For contactless measurements, the optical power budget is limited by the received optical power at the measurement head and the dynamic range of the photodetectors. In the present setup, a fiber-coupled collimator (Thorlabs 50-1550A-APC) delivered 0 dBm to the vibrating target at a free-space distance of 70 mm, producing a back-reflection of approximately −15 dBm. Commercial photodetectors with an upper cut-off frequency of 100 kHz can typically detect optical powers as low as −50 dBm, yielding an optical budget of about 35 dB. Since single-mode fiber at 1550 nm has low attenuation of approximately 0.19 dB/km, this budget allows the laser and photodetectors to be located tens of kilometers from the measurement site, even when splice and connector losses are included. To minimize temperature-induced drift, the reference and measurement arms should be short and positioned close to each other so that they experience similar thermal conditions; this may require the placement of the 3 × 3 FBT coupler near the measurement head. In this configuration, the optical path difference is determined primarily by the vibrating object rather than by thermal effects, a condition that is readily achievable in practice, given the size of rotating machinery and the surrounding space typically available.
Laboratory tests evaluated measurement distances ranging from 1 to 7 cm. Depending on the measurement-head design and available optical power budget, back-reflected light may also be detected at greater distances and within a limited angular-misalignment range. Therefore, a carefully designed measurement head can reduce the need for demanding mechanical alignment. Reliable signal acquisition was achieved at shorter distances of approximately 0.5–2 cm, even with a bare optical fiber fixed inside a connector. Since dust and oil deposits reduce the received back-reflected power, the optical head should be cleaned periodically in industrial environments, for example, with isopropyl alcohol, as is common practice in fiber-optic communications.
The conventional 3 × 3 fiber coupler is inherently more appropriate for fiber-optic Michelson interferometry. It integrates both arms of the interferometer on one side and the laser source and two interferometric outputs with fixed relative phase offsets on the other side. This enables direct recovery of independent phase components required for continuous phase tracking and quadrature demodulation. In the ideal case, the 3 × 3 fiber coupler can be described with the following propagation matrix:
The output from the Michelson interferometer (i.e., the input to the 3 × 3 fiber coupler) can be described as
Here, again, we stress the phase change in the measurement arm due to vibration of the object, i.e., If O/E detectors 1 and 2 are at ports 2 and 3, respectively (the same as the measurement and reference interferometer arms), then the detector currents are equal to
Again, I1 and I2 are detector-current amplitudes due to the presence of a single optical signal. To illustrate the signals on the detector, both currents were plotted as a function of time for the case of a 100 Hz vibration with an amplitude of 3 λ and = 0 (see Figure 11). One can immediately notice the moments at which the vibrating object changes the direction of motion (at t = 0, 5, and 10 ms in the considered case). Furthermore, it can be observed that signal lags behind in the first half of the vibration period (i.e., between 0 and 5 ms). In the second half of the vibration period (i.e., between 5 and 10 ms), the opposite was observed. This property results in an idea to use a cross-correlation function to determine the direction of object motion. In more detail, the cross-correlation function of the detector signals is given by
where denotes the observation time. In the first half of the vibration period, , since for small values of , approached (therefore, the value of the cross-correlation function increased). In the second half of the vibration period, the situation was the opposite: Therefore, we can define the polarity inversion function as
Figure 11.
Illustrated signals on detectors for 100 Hz vibration with an amplitude of 3λ.
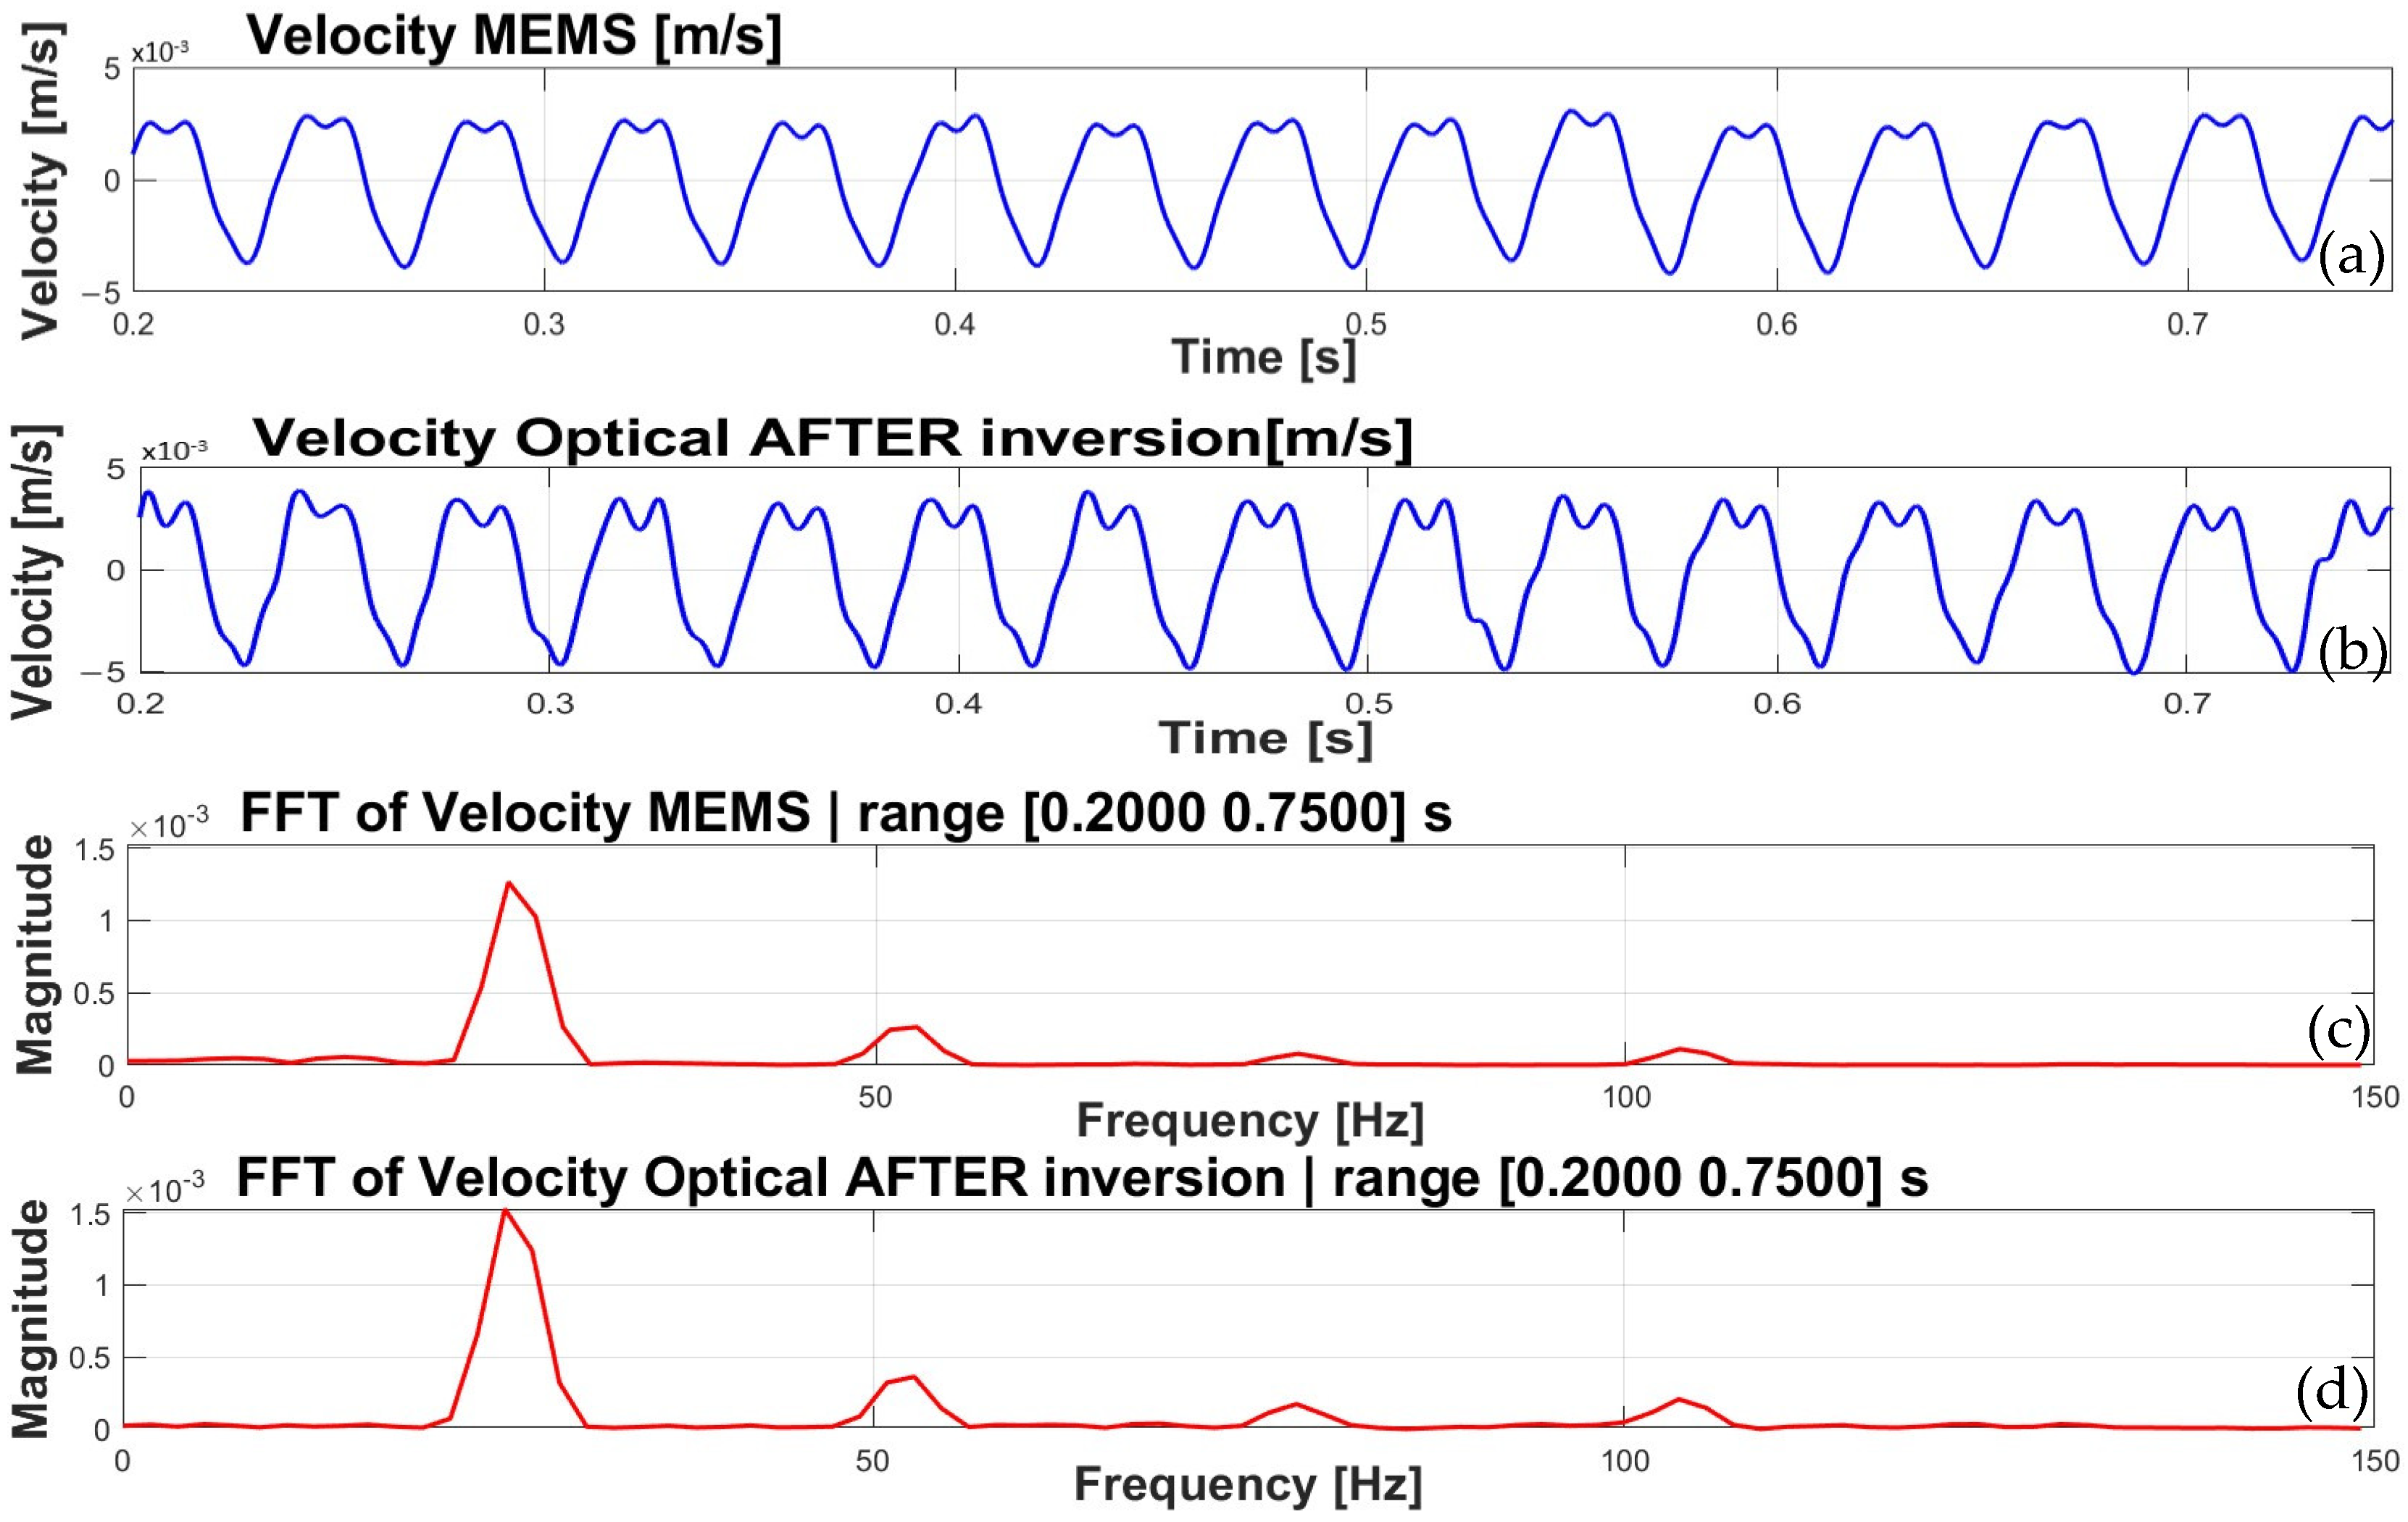
The following graphs depict the inversion mechanism for the optical signal. The calculated velocity obtained from the interferometer before inversion (Figure 12), multiplied by the polarity inversion function (Figure 13), produces the modified measured velocity (Figure 14b). Furthermore, a comparison of velocities measured by the MEMS and optical sensors is presented in Figure 15. It is important to note that noise-reduction filters are applied in figures [12,13,14,15]. The corresponding FFTs of both the MEMS accelerometer and the optical sensor signals are also compared (Figure 14c,d). The presented graphs correspond to a rotational speed of 1560 rpm, i.e., to a frequency of 26 Hz.
Figure 12.
Velocity calculated from the interferometer before inversion.
Figure 13.
The shape of the polarity inversion function.
Figure 14.
(a) Velocity calculated from the MEMS measurements; (b) velocity of the newly developed optical sensor after inversion; (c) FFT of velocity obtained from the MEMS accelerometer; (d) FFT of velocity obtained from the newly developed optical sensor.
Figure 15.
Comparison of velocity obtained by the MEMS accelerometer and the newly developed optical sensor.
The results show strong agreement between the velocities derived from the MEMS accelerometer and those measured by the developed contactless optical sensor. For example, the normalized cross-correlation, expressed as the Pearson correlation coefficient, was calculated to be 0.8924. Only minor discrepancies are visible in the recorded waveforms. These deviations can be partly attributed to the sensitivity tolerance of the MEMS accelerometer, specified by the manufacturer as 270–330 mV/g. This directly affects the amplitude scaling of the calculated vibration velocity. In contrast, the sensitivity of the optical sensor is referenced to the highly stable laser wavelength of 1550 nm, which provides a well-defined and inherently traceable displacement scale. Furthermore, owing to its wavelength-referenced sensitivity, the optical sensor has the potential to serve as a reference instrument for the verification and calibration of conventional non-optical vibration sensors. This is valid, provided that sufficient signal quality, laser stability, and a reference vibration source are ensured. Laser stability is particularly important, since wavelength or phase drift may be superimposed on the measured signal. However, because the two detectors are illuminated by the same source, the configuration provides a basis for a future compensation method for a slow laser wavelength and phase drifts.
4. Conclusions
This paper presented a newly developed portable, contactless optical system for vibration measurement and detection of abnormal operating conditions of rotating machinery. Compared with conventional sensing technologies, the proposed contactless optical sensor provides an all-fiber, metal-free solution. It enables contactless operation and sufficient displacement sensitivity. It operates passively without electrical power at the measurement point. Furthermore, electromagnetic shielding is not required.
The main contribution of the proposed system is simple sensor architecture and signal-processing based on the implementation of two photodetectors, combined with a 3 × 3 FBT-based fiber-optic coupler. By employing a zero-crossing and cross-correlation-based signal processing method, the system determines both the vibration direction and the vibration magnitude, thereby enabling direct comparison with conventional sensing approaches such as MEMS-based sensors. Additionally, the proposed sensor structure can be easily integrated into existing telecommunication infrastructure.
The complete system was developed through iterative hardware and software design stages. It was experimentally validated using a realistic laboratory test setup. Experimental results confirmed the feasibility, stability, and performance of the proposed sensor.
Future work will focus on evaluating the proposed measurement system under real industrial operating conditions on a hydrogenerator in a HPP and on demonstrating the integration of the developed sensor system into the existing telecommunication infrastructure of the Croatian electricity generation company (HEP Generation). It will also focus on incorporating vibration measurements into the supervisory control and data acquisition (SCADA) system of a hydroelectric power plant or of one of the dispatch control centers. Such integration would enable the use of vibration data for further optimization of hydrogenerator operation. In addition, further work will address the compensation of slow laser wavelengths and phase drifts, exploiting the fact that the two detectors are illuminated by the same source.
Author Contributions
Conceptualization, N.R., P.B., Z.Š. and E.S.; data curation, N.R. and P.B.; formal analysis, N.R., P.B. and Z.Š., methodology, N.R., P.B. and Z.Š.; resources, N.R., P.B. and E.S.; software, N.R. and P.B.; writing—original draft preparation, N.R. writing—review and editing, N.R., P.B., Z.Š. and E.S. All authors have read and agreed to the published version of the manuscript.
Funding
This research received no external funding.
Institutional Review Board Statement
Not applicable.
Informed Consent Statement
Not applicable.
Data Availability Statement
The data that support the findings of this study are available from the corresponding author upon request.
Conflicts of Interest
The authors declare no conflicts of interest.
References
- Mohanta, R.K.; Chelliah, T.R.; Allamsetty, S.; Akula, A.; Ghosh, R. Sources of vibration and their treatment in hydro power stations—A review. Int. J. Eng. Sci. Technol. 2017, 20, 637–648. [Google Scholar] [CrossRef] [Scilit]
- Scheffer, C.; Girdhar, P. Practical Machinery Vibration Analysis and Predictive Maintenance; Elsevier: Amsterdam, The Netherlands, 2004. [Google Scholar]
- Zhang, Y.; Xu, Y.; Zhou, J.; Zhou, Y.; Mahfoud, J. Vibration control of AMB-rotor system under base motions based on disturbance observer. IEEE/ASME Trans. Mechatron. 2025, 30, 5398–5407. [Google Scholar] [CrossRef] [Scilit]
- Rozić, N.; Despalatović, M.; Bašić, P.; Sutlović, E.; Marušić, M. Electric Machine Vibration Measurements Based on Fiber Optic Sensor Technology—Preliminary Results. In 2nd International Colloquium on Intelligent/Smart Grid Metrology, Split, Croatia, 9–12 April 2019; IEEE: Piscataway, NJ, USA, 2019; pp. 98–103. [Google Scholar] [CrossRef] [Scilit]
- Romanssini, M.; de Aguirre, P.; César, C.; Compassi-Severo, L.; Girardi, A.G. A Review on Vibration Monitoring Techniques for Predictive Maintenance of Rotating Machinery. J. Eng. 2023, 4, 1797–1817. [Google Scholar] [CrossRef] [Scilit]
- Goyal, D.; Pabla, B. The vibration monitoring methods and signal processing techniques for structural health monitoring: A review. Arch. Comput. Methods Eng. 2016, 23, 585–594. [Google Scholar]
- Hassan, I.U.; Panduru, K.; Walsh, J. An In-Depth Study of Vibration Sensors for Condition Monitoring. Sensors 2024, 24, 740. [Google Scholar] [CrossRef] [Scilit] [PubMed]
- Accelerometers. 2019. Available online: http://www.djbinstruments.com/information/technical-information-hu b/accelerometer-pros-and-cons/ (accessed on 5 March 2019).
- Manikandan, G.; Pannirselvam, K.; Kenned, J.J.; Suresh Kumar, C. Investigations on suitability of MEMS based accelerometer for vibration measurements. Mater. Today Proc. 2021, 45, 6183–6192. [Google Scholar] [CrossRef] [Scilit]
- Varanis, M.; Silva, A.; Mereles, A.; Pederiva, R. MEMS accelerometers for mechanical vibrations analysis: A comprehensive review with applications. J. Braz. Soc. Mech. Sci. Eng. 2018, 40, 527. [Google Scholar] [CrossRef] [Scilit]
- Rossi, A.; Bocchetta, G.; Botta, F.; Scorza, A. Accuracy Characterization of a MEMS Accelerometer for Vibration Monitoring in a Rotating Framework. Appl. Sci. 2023, 13, 5070. [Google Scholar] [CrossRef] [Scilit]
- Hariharan, P. Basics of Interferometry, 2nd ed.; Elsevier Academic Press: Boston, MA, USA, 2007; 213p. [Google Scholar]
- Feng, Y.; Wang, Y.; Zhou, J.; Nie, X.; Sun, S.; Li, J.; Zhang, B. Micro-vibration measurement using self-mixing interferometry with an intracavity frequency-doubling solid-state laser. Opt. Laser Technol. 2026, 198, 114644. [Google Scholar] [CrossRef] [Scilit]
- Wang, L.; Fang, N. Applications of Fiber-Optic Interferometry Technology in Sensor Fields. In Optical Interferometry; Banishev, A.A., Bhowmick, M., Wang, J., Eds.; InTech: London, UK, 2017. [Google Scholar] [CrossRef] [Scilit] [PubMed]
- Berthold, J.W., III. Industrial applications of fiber optic sensors. In Fiber Optic Sensors: An Introduction for Engineers and Scientists; Udd, E., Ed.; John Wiley &Sons: Hoboken, NJ, USA, 1991; pp. 409–437. [Google Scholar]
- Udd, E. Fiber-optic acoustic sensor based on the Sagnac interferometer. In Single Mode Optical Fibers; SPIE: Bellingham, WA, USA, 1983; Volume 0425, pp. 90–95. [Google Scholar] [CrossRef] [Scilit]
- He, X.; Taylor, H.F. Intrinsic fiber Fabry-Perot temperature sensor with fiber Bragg grating mirrors. Opt. Lett. 2002, 27, 1388–1390. [Google Scholar] [CrossRef] [Scilit] [PubMed]
- Posada, J.E.; Rubio-Serrano, J.; Garcia-Souto, J.A. All-fiber interferometric sensor of 150 kHz acoustic emission for the detection of partial discharges within power transformers. In Proceedings of the 21st International Conference on Optical Fiber Sensors, Otawa, ON, Canada, 15–19 May 2011; Volume 7753, pp. 77531S:1–77531S:4. [Google Scholar]
- Udd, E. (Ed.) Fiber Optic Sensors: An Introduction for Engineers and Scientists; John Wiley & Sons, Inc: Hoboken, NJ, USA, 2006; 467p. [Google Scholar]
- Lopez-Higuera, J.M. (Ed.) Handbook of Optical Fiber Sensing Technology, 1st ed.; John Wiley & Sons Ltd.: Chichester, UK, 2002; 789p. [Google Scholar]
- Mihailov, S.J. Fiber Bragg grating sensors for harsh environments. Sensors 2012, 12, 1898–1918. [Google Scholar] [CrossRef] [Scilit] [PubMed]
- Blackburn, T.R.; Phung, B.T.; James, R.E. Optical fibre sensor for partial discharge detection and location in high-voltage power transformer. In Proceedings of the Sixth International Conference on Dielectric Materials, Measurements and Applications, Manchester, UK, 7–10 September 1992; pp. 33–36. [Google Scholar]
- Gangopadhyay, T.K. Prospects for Fibre Bragg Gratings and Fabry-Perot Interferometers in fibre-optic vibration sensing. Sens. Actuators Phys. 2004, 113, 20–38. [Google Scholar] [CrossRef] [Scilit]
- Gangopadhyay, T.K.; Henderson, P.J. Vibration: History and measurement with an extrinsic Fabry–Perot sensor with solid-state laser interferometry. Appl. Opt. 1999, 38, 2471–2477. [Google Scholar] [CrossRef] [Scilit] [PubMed]
- Garcia, Y.R.; Corres, J.M.; Goicoechea, J. Vibration Detection Using Optical Fiber Sensors. J. Sens. 2010, 2010, 936487. [Google Scholar] [CrossRef] [Scilit]
- Brown, D.A.; Cameron, C.B.; Keolian, R.M.; Gardner, D.L.; Garrett, S.L. A symmetric 3 × 3 coupler based demodulator for fiber optic interferometric sensors. In Fiber Optic and Laser Sensors IX; SPIE: Bellingham, WA, USA, 1991; Volume 1584, pp. 328–335. [Google Scholar] [CrossRef] [Scilit]
- Dandridge, A.D.; Wang, C.C.; Tveten, A.B.; Yurek, A.M. Performance of 3 × 3 couplers in fiber optic sensor systems. In Tenth International Conference on Optical Fibre Sensors; SPIE: Bellingham, WA, USA, 1994; Volume 2360, pp. 549–552. [Google Scholar] [CrossRef] [Scilit]
- Park, S.; Lee, J.; Kim, Y.; Lee, B.H. Nanometer-Scale Vibration Measurement Using an Optical Quadrature Interferometer Based on 3 × 3 Fiber-Optic Coupler. Sensors 2020, 20, 2665. [Google Scholar] [CrossRef] [Scilit] [PubMed]
- Bašić, P. Fiber-Optic Sensor Cable for Simultaneous Distributed Measurement of Multiple Physical Quantities. Ph.D. Thesis, University of Zagreb, Zagreb, Croatia, 2019. [Google Scholar]
- MEMS Accelerometer, the Analog Devices ADXL335. 2024. Available online: https://www.analog.com/media/en/technical-documentation/data-sheets/adxl335.pdf (accessed on 10 June 2026).
















Disclaimer/Publisher’s Note: The statements, opinions and data contained in all publications are solely those of the individual author(s) and contributor(s) and not of MDPI and/or the editor(s). MDPI and/or the editor(s) disclaim responsibility for any injury to people or property resulting from any ideas, methods, instructions or products referred to in the content. |
© 2026 by the authors. Licensee MDPI, Basel, Switzerland. This article is an open access article distributed under the terms and conditions of the Creative Commons Attribution (CC BY) license.