


Abstract
Passive Optical Networks (PONs) play a vital role in providing high-speed broadband access in the 5G and F5G generation. However, their shared nature makes them vulnerable to physical-layer attacks like fiber bending, tapping and fiber cut. The problem is more serious in high-density PONs, where high split ratios result in high optical loss and overlapping back-scattered light, making it difficult to distinguish small attacks from background noise. Contrary to most existing works that neglect class imbalance and signal interference in high-density networks, this paper proposes a robust hierarchical two-stage attack detection scheme. First, we employ a binary classifier to distinguish eavesdropping attacks from normal traffic. Then, a second stage focuses on the specific eavesdropping categories (C1–C4). To address the small amount of attack samples, SMOTE is utilized for oversampling the minority class, and PCA-SVM is used to refine feature selection. Finally, the output of both stages is combined using probability score to obtain reliable decision. The experimental results show the effectiveness of our approach, achieving a classification accuracy of 89.07%. When evaluated on the same data, it has shown superior results in comparison to conventional machine learning algorithms, including decision tree (86.3%), k-nearest neighbors (79%), logistic regression (60%), and Naïve Bayes (52.6%).
1. Introduction
The increased use of optical fibers in accessing governmental and financial information and personal communications necessitates effective and secure transmission of optical signals. This is a critical design issue for optical access networks. Passive Optical Network (PON) [1] systems have been at the heart of extensive studies owing to their cost-effectiveness and suitability for large-scale deployment. To meet increasing demands of end users of PON systems, several techniques have been developed to ensure improved PON performance and reliability [2]. In this context, network security has become a major issue of interest, particularly due to the increased presence of heterogeneous devices of diverse sources that have been connecting to the infrastructure [3].
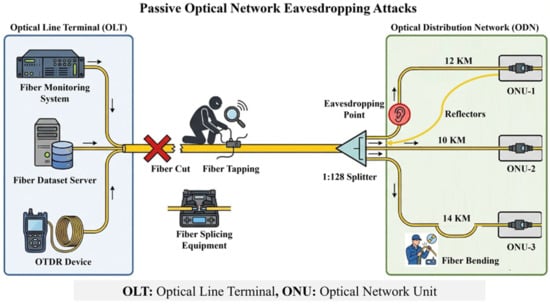
As it is anticipated that with increasing development and use of internet-based applications and services, the very nature of PONs’ fibers will inherently invite unauthorized access into any data transmission without adequate security countermeasures at the physical layer of these systems shown in Figure 1. Thus, PON systems’ security at the physical layer is now a pre-requisite for secure PON services delivery. This very nature of PONs’ open architecture invites passive and/or active eavesdropping attacks through tapping and/or bending and/or reflection of these fibers and thus requires to be addressed [4]. Optical Time Domain Reflectometer (OTDR), which relies upon Rayleigh back-scatter effects, has traditionally been used to monitor and diagnose individual fiber optic links [5]. With regard to PON systems in general, it has been seen that the effectiveness of OTDR is limited in accordance with PON topology arrangements. This is because of superimposed back-scatter from multiple branches of a PON topology [6]. When branch terminations are located at similar distances, event detection becomes challenging because reflected signals from different branches overlap and cannot be easily separated. In addition, the insertion loss introduced by the optical splitters at the remote node further reduces back scattered signal strength [7].
Figure 1.
Passive Optical Network Eavesdropping Attacks (Bending, Tapping, Fiber Cut).
To overcome these limitations, in branched PON architecture, tunable OTDR solutions combined with wavelength-division multiplexing have been proposed; however, their cost and system complexity often hinder large scale deployments [8]. Meanwhile, machine learning (ML) techniques have been widely explored for PON monitoring, primary targeting fault diagnosis and localization rather than security-oriented intrusion characterization [9,10,11]. Existing efforts toward eavesdropping-related analysis are often formulated as single stage learning problems which can increase ambiguity between normal operational variations and intrusion signatures and may lead to elevated false alarms behavior [12].
Moreover, prior work in long haul settings has largely focused on binary eavesdropping detection (e.g., bending) using sequence models, leaving multi class eavesdrop identification in access-level PONs under severe class imbalance insufficiently addressed. Furthermore, when working with imbalanced datasets, the performance of classification algorithms is often compromised, as models tend to be biased toward the majority class, thereby reducing their ability to accurately recognize minority class events [13].
This paper presents a hierarchical two-stage machine learning framework that leverages OTDR-derived features for physical-layer intrusion monitoring in PON. Class-imbalance issues are commonly encountered in practical deployments, where eavesdropping events occur far less frequently than normal operating conditions. In the first stage, a binary classifier is employed to discriminate between normal behavior and anomalous (attack) events. The next stage is multi-class identification, which classifies the detected anomalies into various kinds of eavesdropping (C1 to C4), which are representative of various kinds of eavesdropping cases like fiber bending, tapping, cutting, and reflective disturbances.
In order to improve the accuracy of the learning process of the minority classes, the Synthetic Minority Oversampling Technique (SMOTE) is incorporated into the training process. Moreover, the Principal Component Analysis (PCA) technique is employed on a selective basis to the Support Vector Machine (SVM) classifier in the second stage to reduce feature redundancy while retaining discriminative features, thereby increasing the separability between the intrusion signatures that are closely related. Additionally, the probability-based decision fusion approach is employed to combine the detection confidence with the conditional probabilities computed in the second stage, thereby arriving at the multi-class decision. The experimental results on the multi-class OTDR dataset have confirmed that proposed two-stage PCA-assisted SVM framework attains an accuracy of 89.07% with micro-averaged area under the curve (AUC) of 0.987 in comparison with other baseline classifiers used in the same database, the results show that the performance of the model is high compared with others, including the including decision tree (86.3%), k-Nearest neighbors (79%), logistic Regression (60%), and Naïve Bayes (52.6%).
2. Related Work
Eavesdropping detection in optical networks is now an active area of research, mainly due to the broadcast nature of optical access networks. Hence, a significant number of eavesdropping detection methods have been proposed in the literature, including conventional methods based on signal analysis as well as more recent methods based on machine learning. This section provides a comprehensive overview of all these methods, with a special focus on their pros and cons.
Spurny et al. [14] presented a collaborative study focused on dealing with the issue of information leakage in optical fiber infrastructures. This study analyzes both passive and active components of the network, focusing particularly on the analysis of various possible attack scenarios. Furdek et al. [15]. presented a collaborative study focused on dealing with the issue of information leakage in optical fiber infrastructures. This study analyzes both passive and active components of the network, focusing particularly on the analysis of various possible attack scenarios. In the research by Maslo et al. [16], the authors have attempted to investigate the security issues in optical networks, especially at the physical layer. The authors have addressed various attack scenarios and countermeasures for fiber tapping attacks, which occur at the physical layer. In addition, Atan et al. [17] investigated an advanced security measure, which was proposed to be implemented in Dynamic Bandwidth Allocation (DBA) to address certain security issues. This security measure involves a recognition phase to identify abnormal behavior from Optical Network Units (ONUs). After recognizing an attacker, appropriate actions are taken, with special emphasis on fairness among all ONU users.
Song et al. [4] also proposed an unsupervised learning approach through clustering, as well as an extensive diagnostic framework that is intended to identify and pinpoint eavesdropping activities in WDM systems. The paper highlights the importance of mitigating data dependency issues using basic optical performance monitoring (OPM) data to dynamically identify, classify, and pinpoint different types of eavesdropping activities, including single-point and multi-point attack.
In a study by Qin et al. [18], research focuses on physical layer security in dual polarization coherent optical systems by developing a detection method for fiber bending eavesdropping attacks using a Convolutional Neural Network (CNN) architecture. A relationship is established between the coefficients of power loss and bending radii, thereby providing a theoretical basis for identifying the proposed eavesdropping attack. Moreover, a hardware-efficient detection method is proposed by utilizing a CNN architecture in the detection of the proposed eavesdropping attacks, thereby detecting the attacks at various severity levels.
Despite the introduction of this architectural paradigm leading to the effective use of resources, the approach also creates basic security vulnerabilities. Both the broadcast transmission mechanism that supports downstream traffic and the common 1310 nm wavelength channel used to support upstream traffic subject the network to a plethora of threat vectors comprising distributed denial-of-service attacks, unauthorized access requests, signal manipulation, and physical-layer security [19].
A number of improvement schemes have been explored to eliminate the drawbacks of the PON-specific optical time-domain reflectometer (OTDR). Wavelength-selective monitoring methods which apply tunable OTDR system together with wavelength division multiplexing may also allocate separate supervision wavelengths to each branch, which enhance discrimination. This solution [20], however, also adds significant complexity and cost of implementation in terms of instrumentation, and may deter wide usage. Other methodologies made use of optical reference reflectors at the branch endpoints to increase the visibility of events, but generally such realizations need non-uniform branch-length distributions as well as extra passive components. Further methods propose to identify the branches based on the analysis of the power variations on the ONU-side, but the performance data of this nature is often limited by the operational policies. In turn, in modern studies, the trend is moving to the methods of discriminative features extraction out of composite OTDR measurements at the optical line terminal (OLT) using advanced signal-processing models, with machine learning (ml) algorithms showing promising results in providing models of complex optical signatures [10].
Physical-layer attacks in infrastructures of PON not only provide security issues related to eavesdropping. Fiber tapping, most commonly done by means of controlled macro-bending manipulations, leads to modal coupling that generates optical power leakage in the absence of necessarily incurring service-affecting degradation [21]. These complex scenarios of threat have shown the need for intelligent surveillance systems that can differentiate between normal differences in operational patterns and the presence of a signature of malicious intrusion. This, in turn, has shown an increased urge to explore information-based identification systems that can detect abnormal patterns in complex and overprinting signals of OTDR, without requiring any major hardware changes.
3. Proposed Research Methodology
3.1. Machine Learning Model Architecture
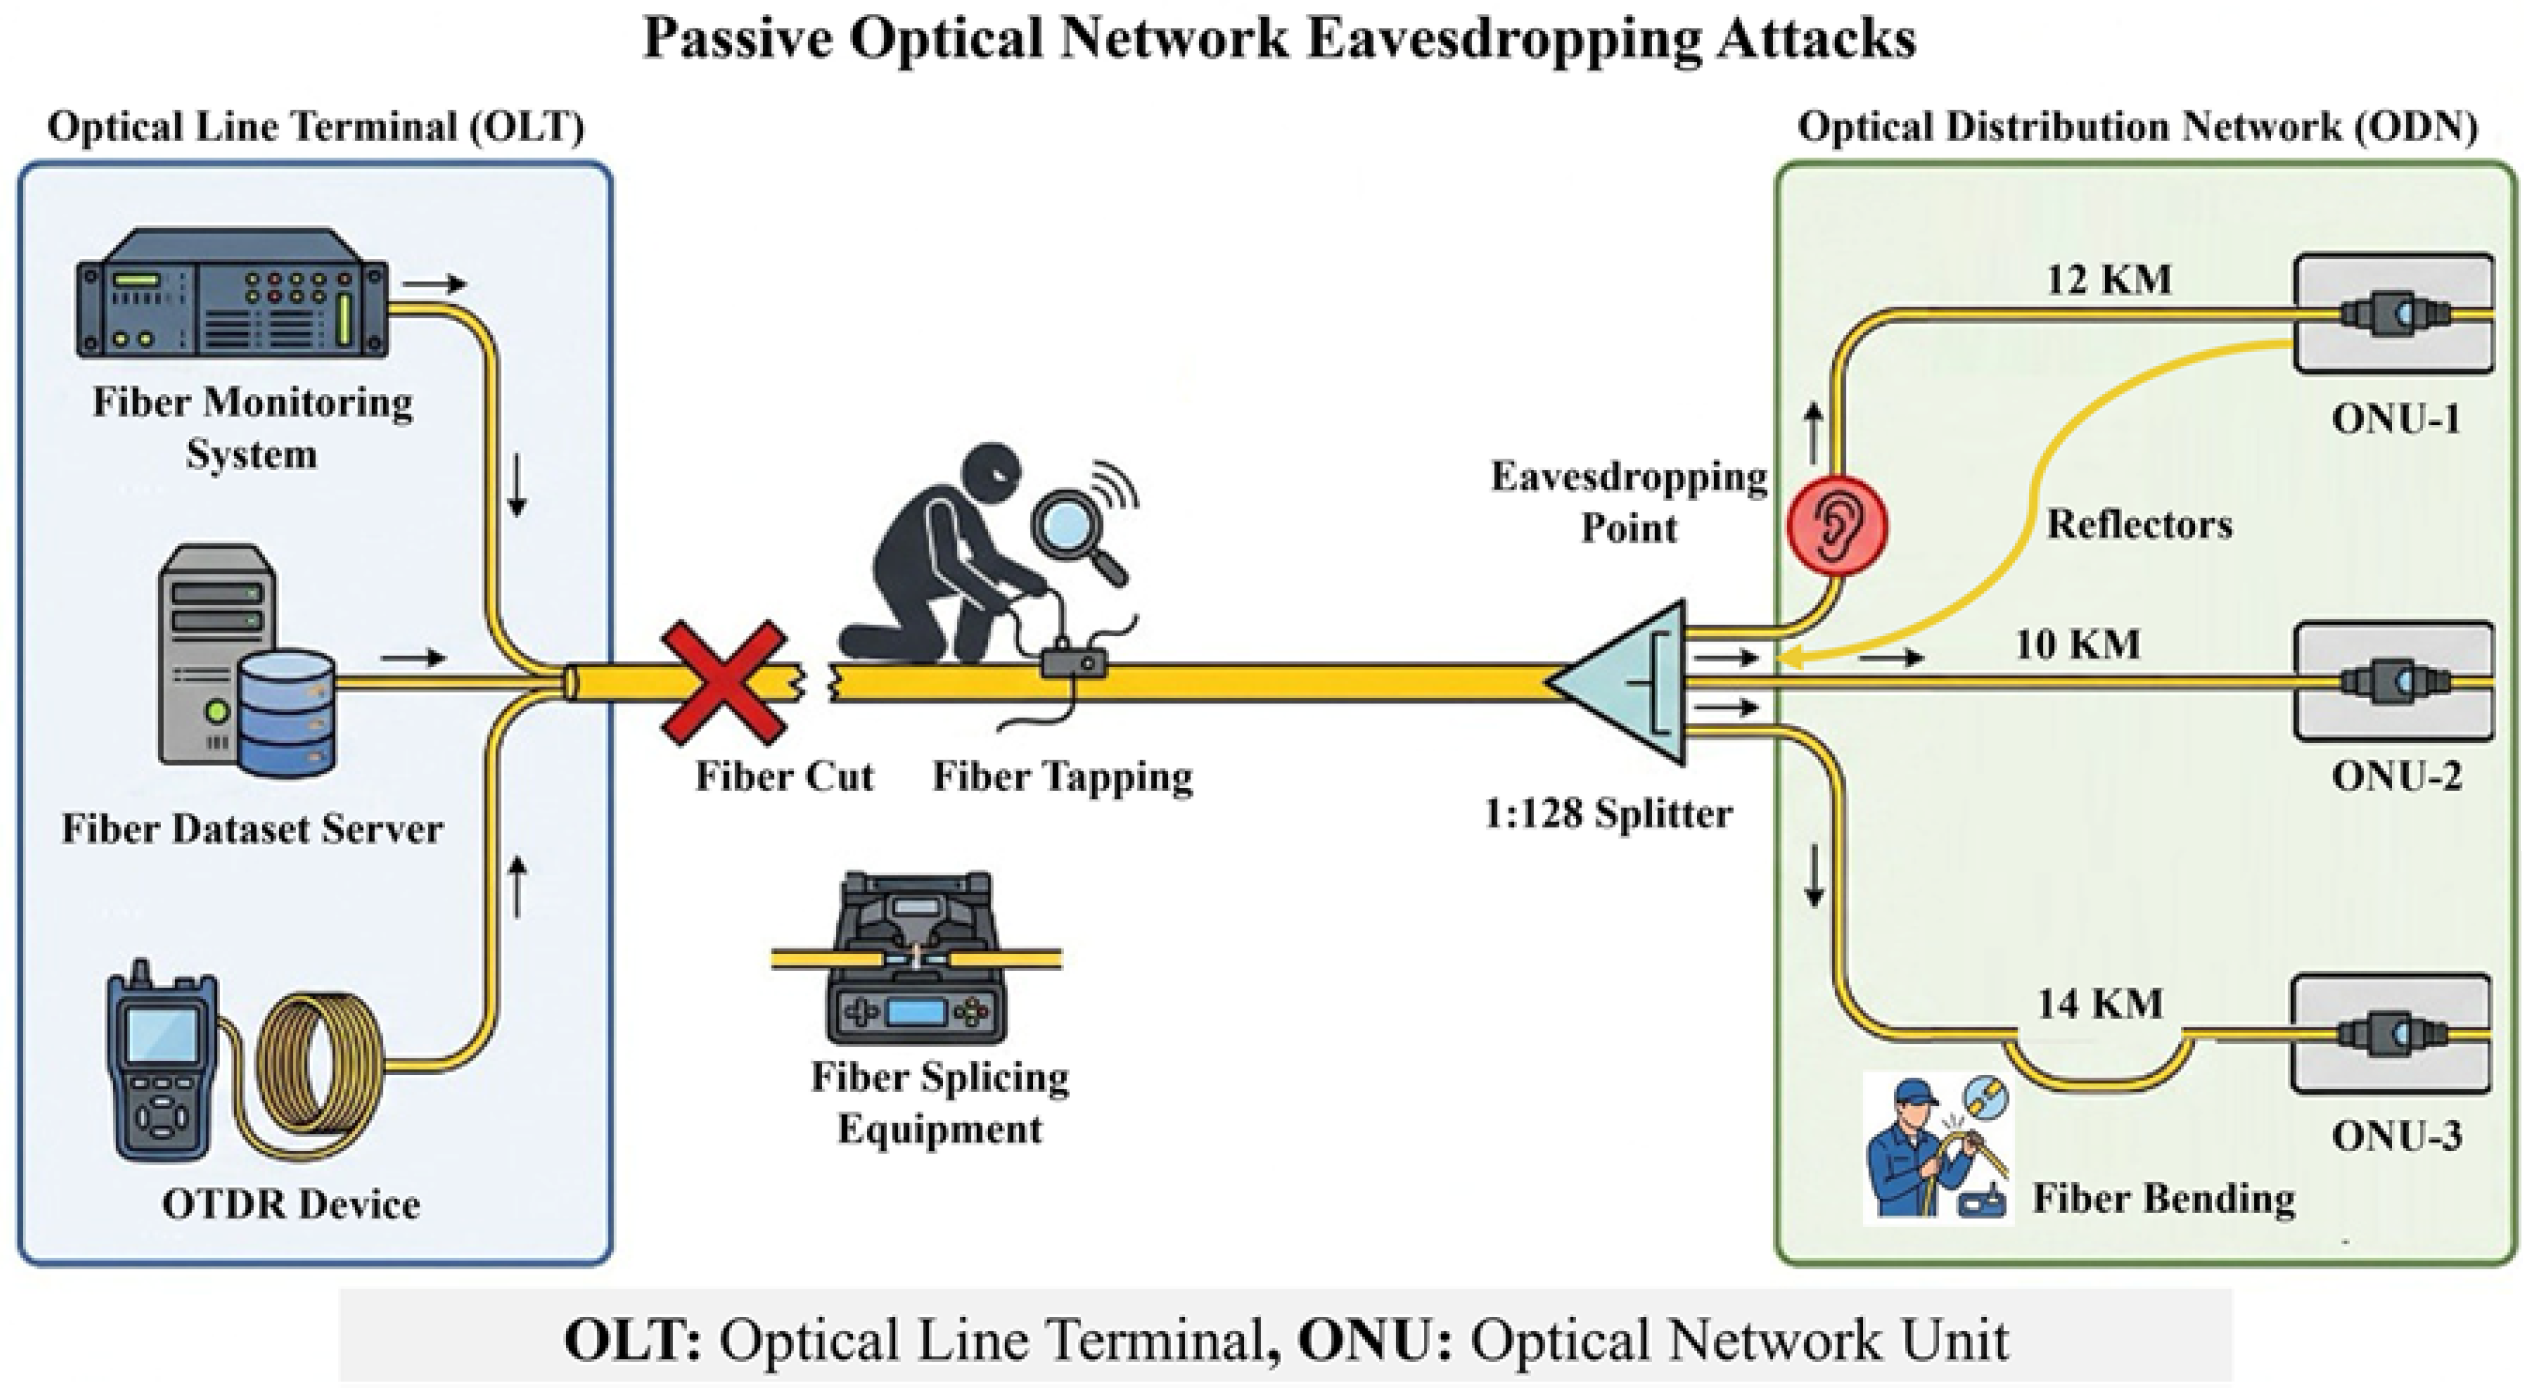
In this section, the proposed methodology for the detection and identification of physical layer eavesdropping attacks in PONs using the characteristics of the OTDR traces will be discussed in this section. As shown in Figure 2, the proposed system architecture consists of an Optical Line Terminal (OLT) connected with a Fiber Monitoring Unit. The Fiber Monitoring Unit continuously monitors the deviations in the OTDR traces and the variation in the power levels. These monitored data are then provided as input to the Eavesdropping Detection and Attack Classification modules. The output of these modules is then provided as input to the SDN Controller. One of the major challenges faced by PONs is the presence of a high level of class imbalance in the optical network, where the number of eavesdropping attacks is much less compared to normal network operations.
Figure 2.
Proposed System Architecture of Detection and Classification of Eavesdropping Attacks in Passive Optical Network.
In order to address this limitation, the following sub-sections discuss a hierarchical two-stage detection scheme that separates anomaly detection from the classification of anomalies. In the first stage, emphasis will be placed on distinguishing between normal and abnormal OTDR traffic, while in the second stage, classification of anomalies will be performed in detail. In this stage, PCA will be employed to enhance the distinguishability of high-dimensional feature space to improve the efficiency of the SVM classifier. Additionally, the Synthetic Minority Over-sampling Technique (SMOTE) was incorporated in the classifier to address the problem of data scarcity and achieve a better balance between the various classes of eavesdropping attacks [22].
3.2. Proposed Framework
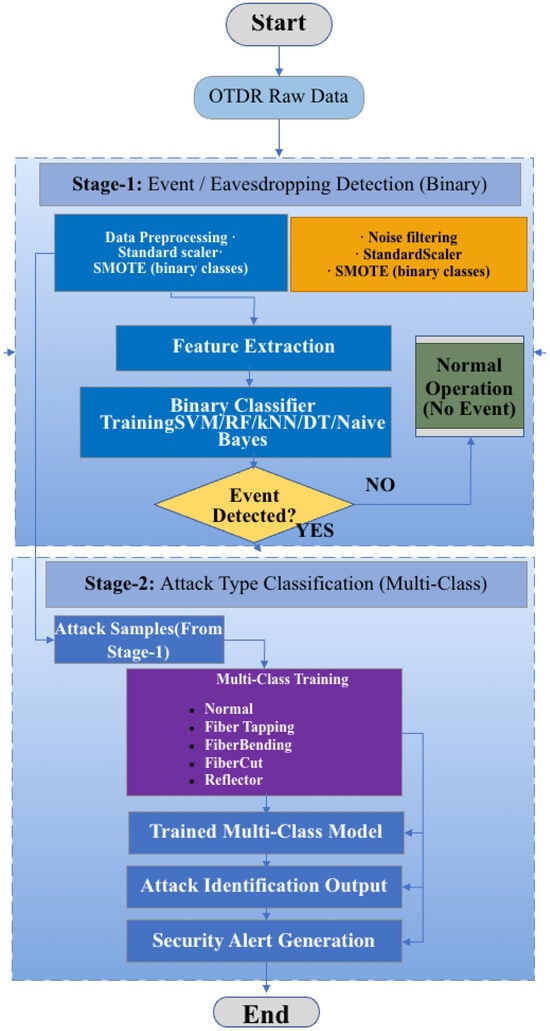
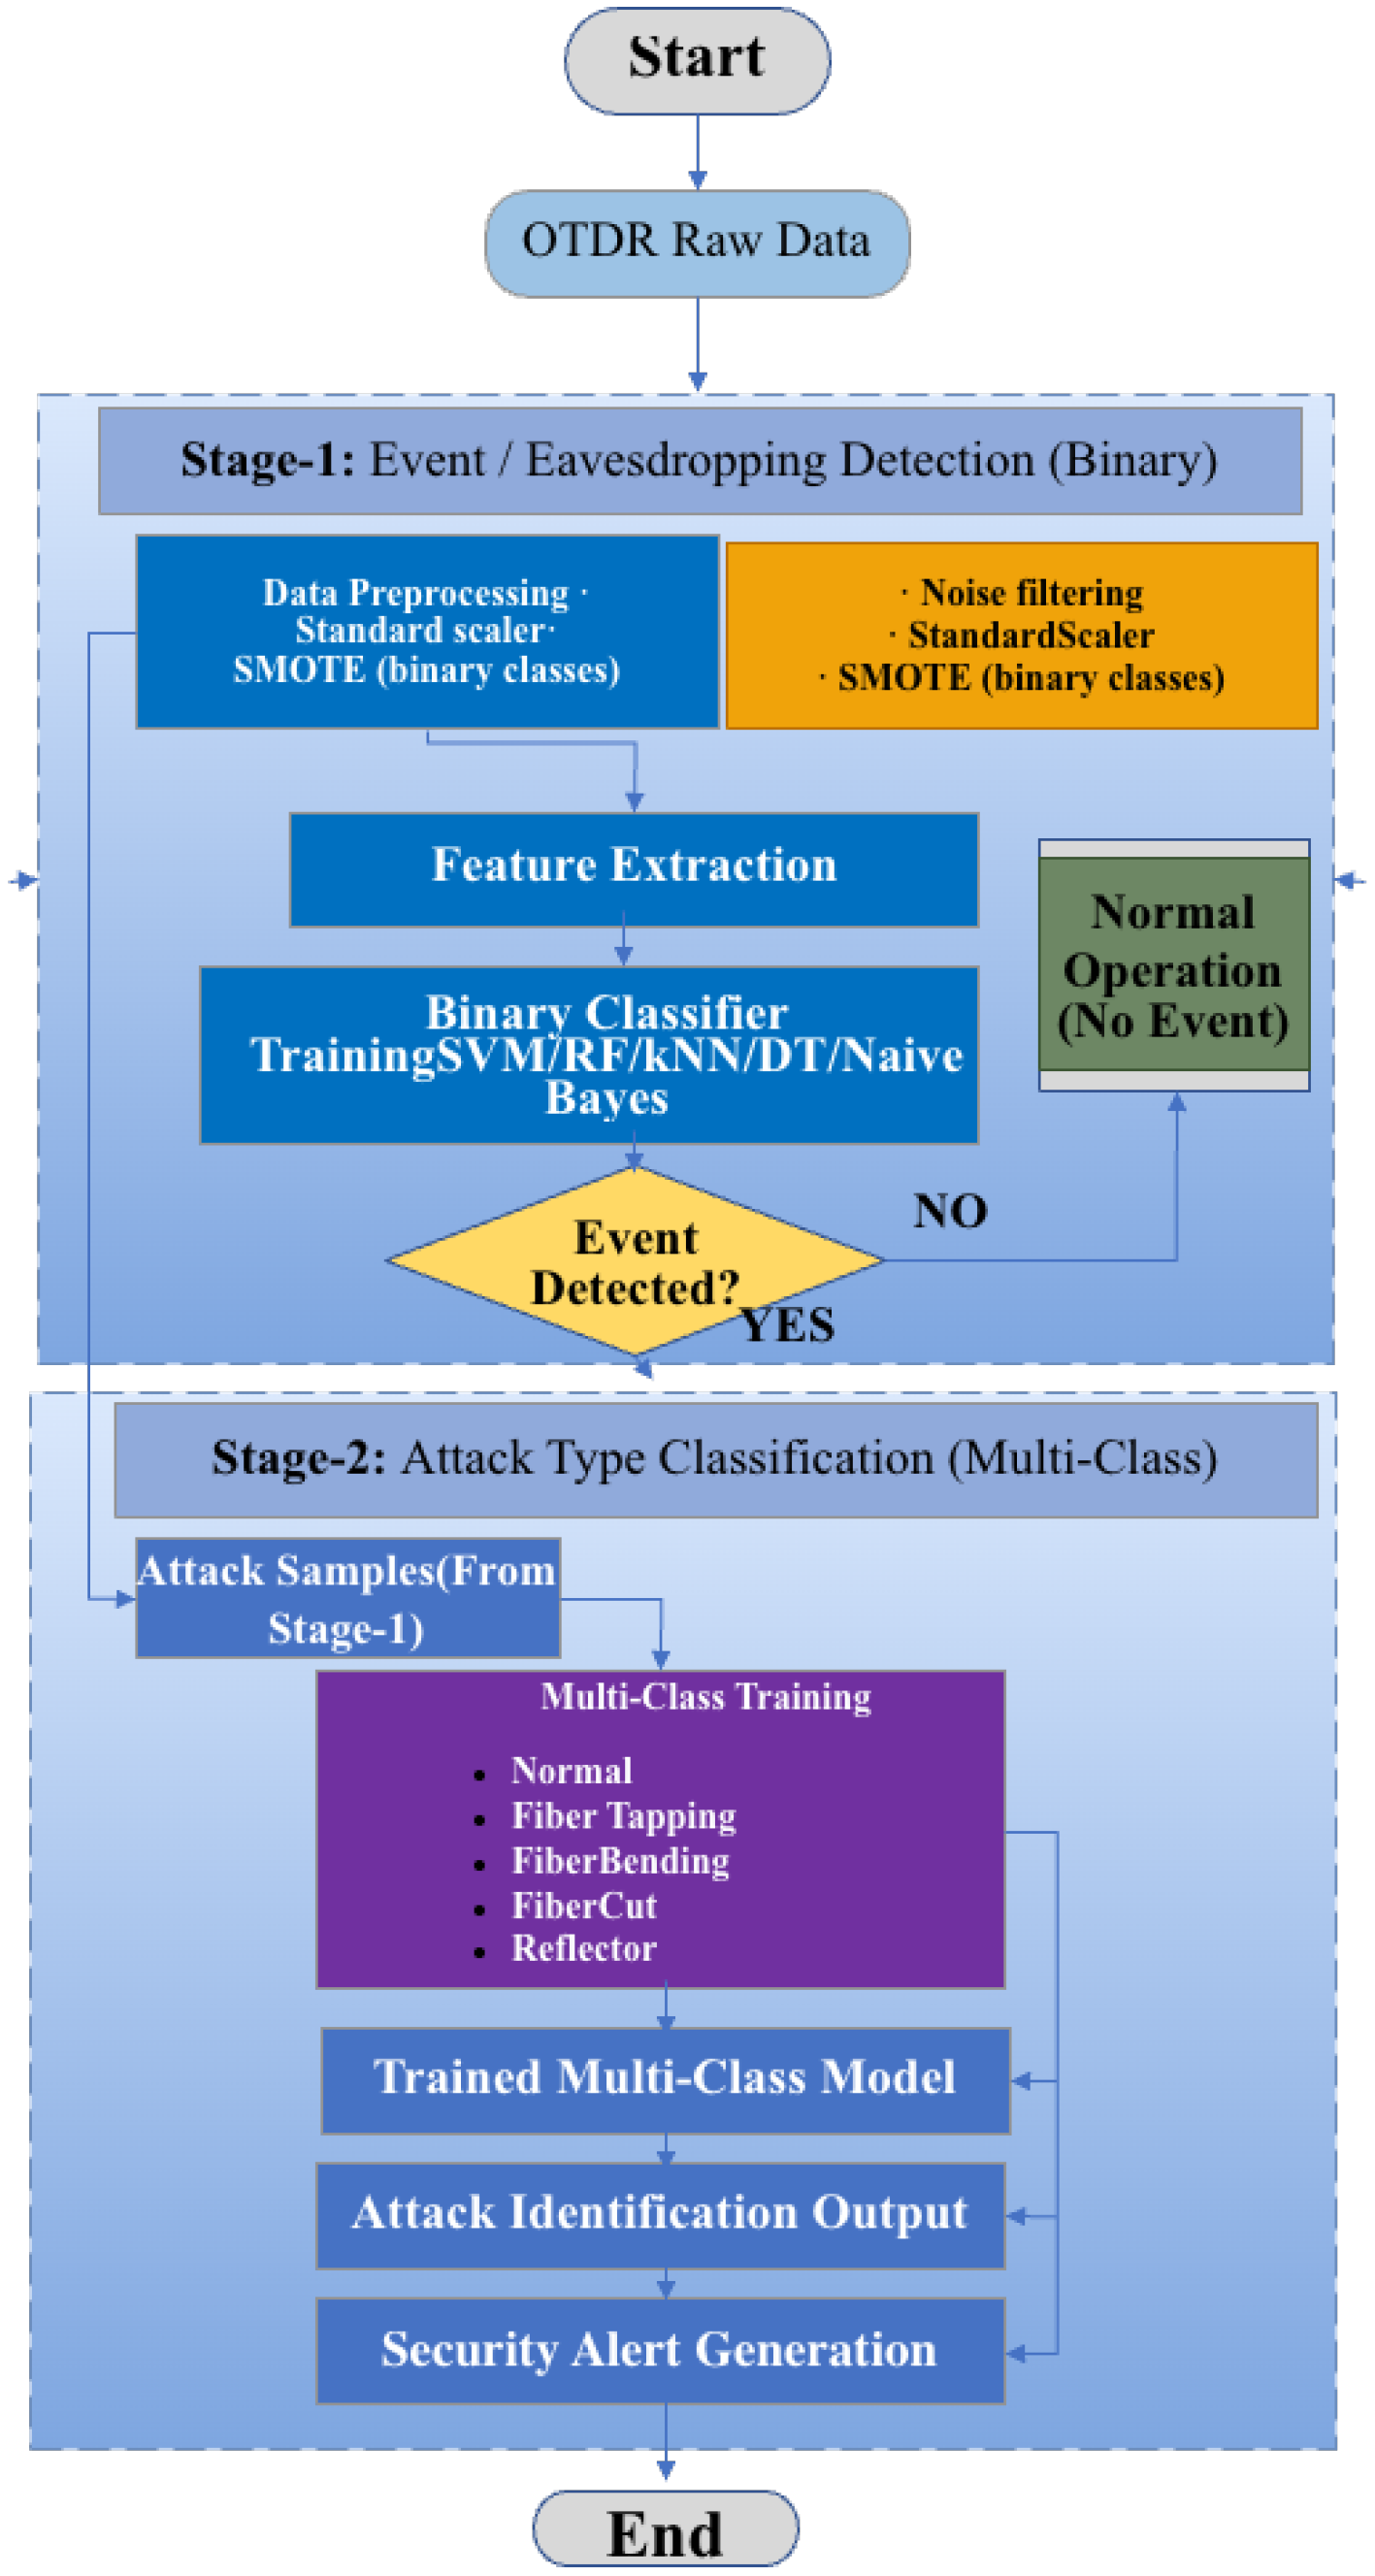
In this section, we developed a two-stage machine learning framework to maximize threat detection and minimize false alarms in PON environments as illustrated Figure 3. The pipeline begins by collecting raw OTDR traces. Since eavesdropping is rare, this initial dataset is highly imbalanced toward normal traffic. In the stage-1, we clean the raw data using noise filtering and Standard Scaler normalization, followed by SMOTE oversampling to build a balanced binary dataset. The system extracts key features and uses a binary classifier to separate normal network behavior from anomalies. Flagged samples advance to the second stage, while normal traffic returns to standard operation. The stage-2 categorizes the flagged anomalies into five specific groups: normal, fiber tapping (C1), fiber bending (C2), fiber cut (C3), and reflector (C4). We apply PCA to an SVM classifier to remove redundant features and improve class separation, while reusing SMOTE to balance the attack classes. Finally, the system identifies the specific attack type and triggers a security alert, completing the end-to-end pipeline.
Figure 3.
Two-stage machine learning framework for OTDR-based physical layer attack detection and classification in optical fiber networks.
3.3. Machine Learning Model Selection for Attack Classification
To validate the effectiveness of the proposed framework, a thorough comparative evaluation was conducted using several popular supervised learning techniques. The classifiers considered in the present study—logistic regression, k-Nearest Neighbors (k-NN), Decision Tree, and Naïve Bayes—are commonly used as benchmark classifiers in optical network monitoring and fault management studies [23]. In the context of the proposed two-stage framework, the PCA-based SVM classifier is used as the primary classifier, and the remaining classifiers are used as benchmark classifiers to evaluate the effectiveness of the proposed framework.
Support Vector Machine (SVM): The role of the SVM classifier is two-fold: it is used for anomaly detection and threat identification, as discussed in the proposed framework [24]. It deals with the non-linear patterns in OTDR trace signatures by using the Radial Basis Function (RBF) kernel. By maximizing the margin between two classes in a higher-dimensional space, the classifier finds the best decision boundary. The parameters of the kernel are selected such that the margin is maximized while minimizing the error in classification.
Logistic Regression: Logistic Regression was used as a statistical classifier that serves as a baseline to compute the probabilities using a linear decision boundary. Though it has limitations in dealing with nonlinear relationships, it can be useful to evaluate the improvements of more complex nonlinear methods [9].
k-Nearest Neighbors (k-NN): The k-NN method relies on the k-NN algorithm, which classifies samples according to the relationships of proximity in the feature space. The classification is done by majority voting of the k-NN samples based on the distance metric, e.g., Euclidean distance [25]. The value of k was optimized. Decision Tree: Decision Trees use a hierarchical decision process by recursively splitting the dataset based on thresholds of features [26]. While the rule-based approach of Decision Trees is good for interpret ability, they are prone to overfitting when dealing with complex OTDR spectral features. To mitigate the overfitting problem, tree depth constraints were imposed during validation.
Naïve Bayes (NB): This classifier is based on a probabilistic learning model using Bayes’ theorem with a strong assumption of conditional independence of features. When this assumption is well satisfied, the NB classifier shows rapid convergence with minimal training data.
3.4. Algorithm Execution and Mathematical Logic
Algorithm 1 details the step-by-step execution and the mathematical logic of our proposed Two-Stage Framework. The algorithm takes the preprocessed OTDR dataset as input, where represents the 30 extracted features (P1–P30) and SNR and represents the actual class labels.
| Algorithm 1 Two-stage OTDR eavesdropping detection and identification |
|
3.4.1. Initialization & Preprocessing
The algorithm first initializes the base classifiers (e.g., SVM, k-NN). The input data X is scaled, and SMOTE is applied to generate a balanced training set and .
3.4.2. Stage 1: Binary Detection
In this step, the algorithm maps the multi-class labels into binary labels (0 for Normal, 1 for Attack). The Stage 1 classifier outputs a binary probability vector. We define as the probability of the instance being normal, and as the probability of an attack.
3.4.3. Stage 2: Multi-Class Classification
The algorithm then isolates the attack samples. Specifically for the SVM classifier, an intermediate function PCA(X, 0.95) is called to reduce the dimensionality while retaining 95% variance. The Stage 2 classifier then computes the conditional probabilities for each specific attack class, denoted as where .
3.4.4. Probability Fusion & Output
Finally, the algorithm calculates the joint probability for each attack class by multiplying with . The Argmax function is then applied across all final probabilities (including ) to output the predicted class label .
4. Experiments and Results
In this section, experimental evaluations are performed using the publicly available OTDR dataset [27], wherein the proposed model is bench-marked against multiple machine learning classifiers to assess its effectiveness in detecting optical fiber eavesdropping attacks. The training and evaluation of the proposed model were performed using the hardware and software configurations All experiments were conducted on an Apple Silicon-based system featuring an Apple M3 CPU with an integrated 10-core M3 GPU and 8 GB of unified memory.
The software environment consisted of macOS 26.1 (ARM, Apple Silicon) and Python 3.13.5, with NumPy 2.1.3, Pandas 2.2.3, Scikit-Learn 1.6.1, and PyTorch 2.9.1 installed. To understand the practicality of the proposed framework, analysis of the time taken for training and inference was conducted, as depicted in Table 1. From the table, it can be observed that although the SVM classifier offers high accuracy, the time taken by the classifier for inference (24.20 s) is high. On the other hand, the classifiers such as Decision Tree and Naïve Bayes offer low inference time (0.006 s and 0.015 s, respectively), making them highly efficient for use in real-time systems.
Table 1.
Training and inference time comparison across classifiers.
4.1. PON Architecture and Dataset Acquisition
The dataset used for this study is based on an OTDR, which is publicly available [27]. The dataset has a wide range of uses for the analysis of optical fiber eavesdropping conditions. The dataset is based on a PON with a standard tree topology. The PON includes an Optical Line Terminal (OLT) located at the central office, optical splitters to form the optical distribution network, and Optical Network Units (ONUs) located at customer premises. In this configuration, the optical signal transmitted by the OLT will be distributed to the various subscriber branches through optical splitters with a splitting ratio of 1:128. The OTDR measurements are obtained from the OLT side for the data set. Optical pulses are transmitted into the feeder fibers to evaluate the network conditions. To identify the branches within the PON network, reflective markers and optical attenuators are placed within the network.
4.2. Dataset Description
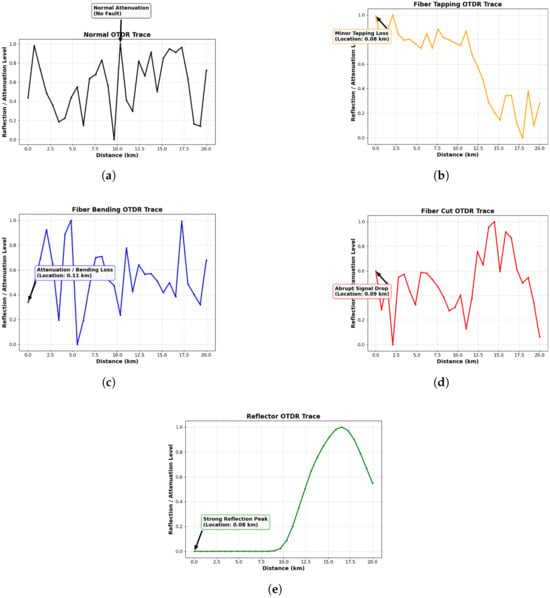
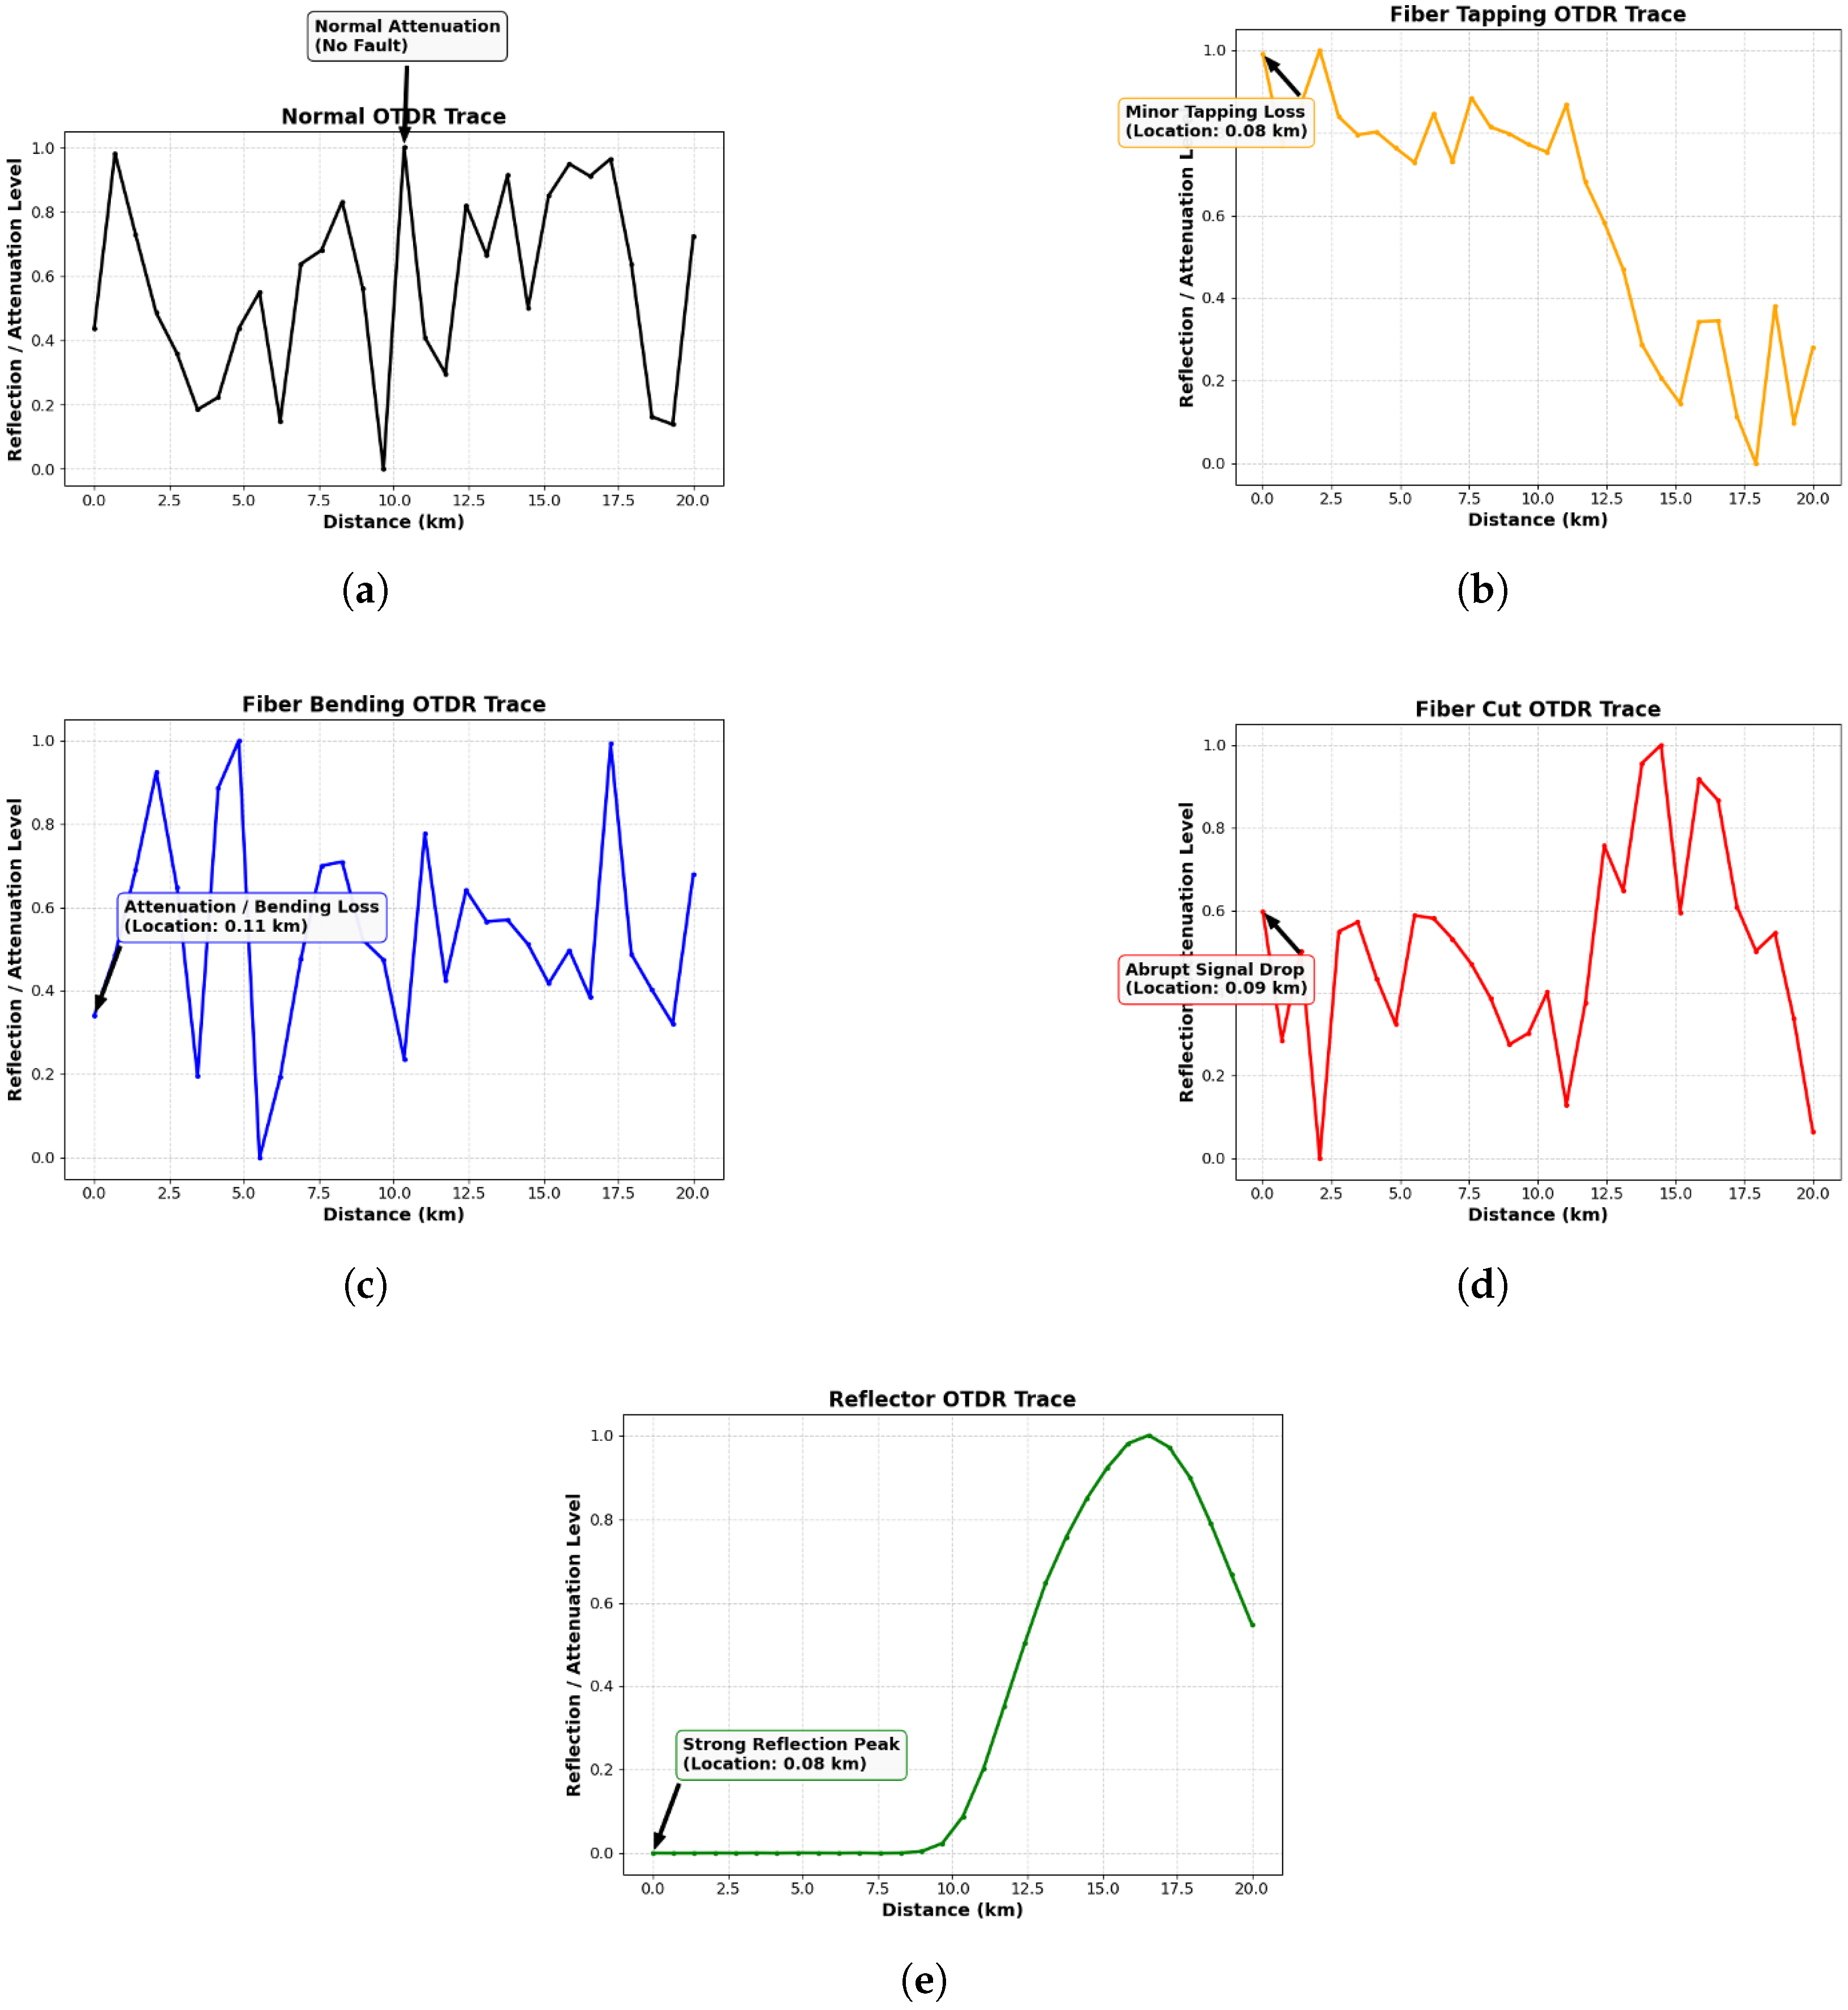
The dataset collects the OTDR trace that corresponds to normal operation as well as four different abnormal scenarios related to eavesdropping attacks. The normal operation is referred to as Class 0, and the abnormal scenarios related to eavesdropping are referred to as Classes 1–4. The total number of records is 77,832, with 30 features extracted from the OTDR trace, as shown in Table 1. The data was preprocessed before the measurement was carried out, and the OTDR was configured with a pulse width of 10 ns, a wavelength of 1650 nm, and a sampling interval of 1 ns. The optical fiber link is approximately 14 km long. The features are the sampled values of the OTDR trace, with the values sampled at 30 points, referred to as P1–P30. The OTDR trace for various eavesdropping scenarios shows various signal characteristics such as abrupt fall, attenuation, and steady state, as shown in Figure 4.
Figure 4.
Representative OTDR signal trace for each class. (a) Class 0 (Normal). (b) Class 1 (Fiber tapping). (c) Class 3 (Bending event). (d) Class 5 (Fiber cut). (e) Class 7 (Reflector).
OTDR Trace Sequence
It is vital to gain a clear physical intuition of the data set and the features learned by the machine learning algorithm. This is achieved by understanding the physical phenomena associated with each of eavesdropping classes. The OTDR traces have unique optical signatures based on the type of physical event. Sample OTDR trace segments are 233, shown in Figure 4 Class: The Class feature represents the type of event in Table 2. Fiber Tapping (Class 1): Eavesdropping via a fiber tap using clip on coupler is a small insertion loss. The OTDR trace has a minor step down in power. This insertion loss is extremely small. The power drop is close to the background noise level. Because of this, it is difficult to identify. This is why machine learning is required. Fiber Bending (Class 3): When a fiber is subjected to severe bending, light rays are totally internally reflected, or they bend until they reach a critical angle, causing them to leave the fiber. This is seen on an OTDR trace as a step down in power, or an attenuation drop, at the point of bending. The light is not totally lost; it continues to propagate Fiber Cut (Class 5): The physical disruption of an optical fiber totally severs the communications link. From an optical standpoint, there is an abrupt termination of the back scattered light to a level equivalent to the noise floor. Depending on the fiber cut characteristics, such as a clean cut causing a glass-air interface, a strong Fresnel reflection spike is often seen. Beyond this point, no further light is propagated Reflector (Class 7): Eavesdropping anomalies such as physical damage, bad mechanical connections, or specific types of eavesdropping devices cause a significant amount of light to reflect to the source. The OTDR trace has a sharp localized peak. This is a reflection peak. Beyond this point, normal attenuation is seen.
Table 2.
Fiber classes datasets.
Signal-to-Noise Ratio (SNR): The dataset contains a Signal-to-Noise Ratio (SNR) value, which represents the quality of the signal on a continuous scale between 0–30 dB. Alongside the SNR, the features consist of the sampled optical power values of the OTDR trace, specifically utilizing 30 continuous points referred to as P1 to P30. Together, these make up the exact 30 features used for classification. These spatial features determine the intensity of events, which helps in differentiating visually similar eavesdropping attack traces (Class 1 to Class 4).
Data Preprocessing: In the raw form of the OTDR spectrum, noise is present, and the features are of high dimensions with varying scales, which may have a negative impact on the performance of the classification model developed using machine learning techniques. To ensure the training of a stable model, several preprocessing techniques were applied to the raw data, as described below.
Label Encoding: The categorical class identifiers were converted into numerical form to accommodate the learning algorithms.
Stratified Split: The dataset was split into training and testing sets, with 70% for training and 30% for testing, while maintaining the proportional ratio of all classes.
Standardization: The normalization of input features was done through Standard Scaler, where all input features are normalized to have zero mean and unit variance.
Class Balancing: Synthetic Minority Over-sampling Technique (SMOTE) is used to balance the classes, in which artificial data points are added to the minority classes.
4.3. Confusion Matrix
The role of the confusion matrix is to act as a key performance indicator in supervised learning, as it offers a detailed quantitative description of classification. By comparing the class labels predicted by the model with their true labels, it is possible to extensively evaluate the model’s capacity for discriminating between numerous event classes. As indicated in Table 3, the matrix is defined as a 2D table, where actual labels and predicted labels are used. In this case, true positives (TP) and true negatives (TN) represent data points that are correctly classified as being in or out of a particular class. On the contrary, false positives (FP) represent data points classified incorrectly as being in a class, while false negatives (FN) represent data points classified incorrectly as being out of a class.
Table 3.
Structure of confusion matrix.
Evaluation metrics for the classification ability of the proposed model. Accuracy is a measure of the number of correctly classified instances over the total number of instances tested, which shows the reliability of the classifier in differentiating between the given classes.
Precision is the ratio of the number of positive instances correctly classified to the total number of samples that the model classifies as positive. It is a measure of the model’s capacity to make minimal false positive predictions.
Recall is the ratio of correctly classified positive samples to the total number of positive samples. Recall is used to evaluate the model’s ability to capture all positive samples and is also called the sensitivity.
F1-score is defined as the harmonic mean of precision and recall, which provides a fair performance metric that takes into account the impact of FP and FN at the same time.
minimal delay in the classification of the attack types. In the proposed framework, the delay is defined as the average time taken by each machine learning classifier in the process of testing. This analysis will help in the selection of the classifiers that provide the best trade-off between classification accuracy and computational speed in the process of fault detection. The (AUC ROC) was used to evaluate the classification potential of the machine learning models. The ROC curve is a plot of the true positive rate (TPR) against the false positive rate (FPR) for a classification model. For a multi-class anomaly detection problem, like the one considered in this research, a (one vs. rest) approach was used, where an ROC curve was plotted for each class, considering it as positive and all other classes as negative. The AUC value of each ROC curve was used to evaluate the classification potential of the model with respect to each class. TPR and FPR are calculated as
where TP, TN, FP, and FN represent the true positive, true negative, false positive, and false negative, respectively. An AUC value close to 1.0 represents high separability of the classes, whereas a value close to 0.5 represents random guessing. The reason why AUC-ROC is useful for the current problem is that it has the ability to provide threshold-independent measures of the model’s ability to distinguish between different types of anomaly events in optical fiber networks.
5. Simulation Results and Analysis
In this section, the detailed performance analysis of the proposed hierarchical two-stage model for the identification and classification of physical layer eavesdropping attacks in optical fiber networks will be discussed. The real-world operational environment of PONs is highly imbalanced, as physical-layer attacks are extremely rare anomalies compared to the dominant normal traffic. Our proposed framework is designed to tackle this practical imbalance. To reduce the impact of data scarcity and effectively train the model, the synthetic minority over-sampling technique (SMOTE) is used. The performance of the model will also be evaluated using various metrics such as accuracy, precision, recall, and F1-score. In addition, the classification performance of the model will also be discussed using stage-wise confusion matrices and ROC curves.
5.1. Stage 1 Binary Detection Performance
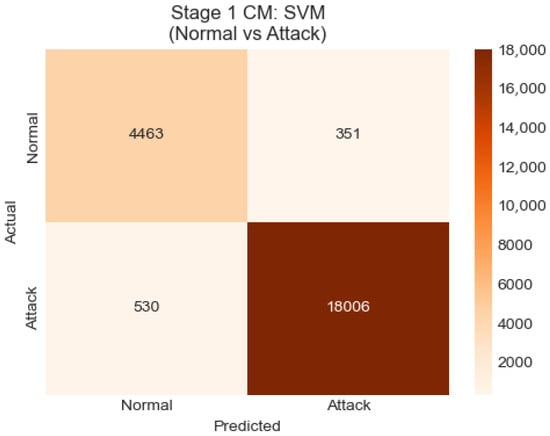
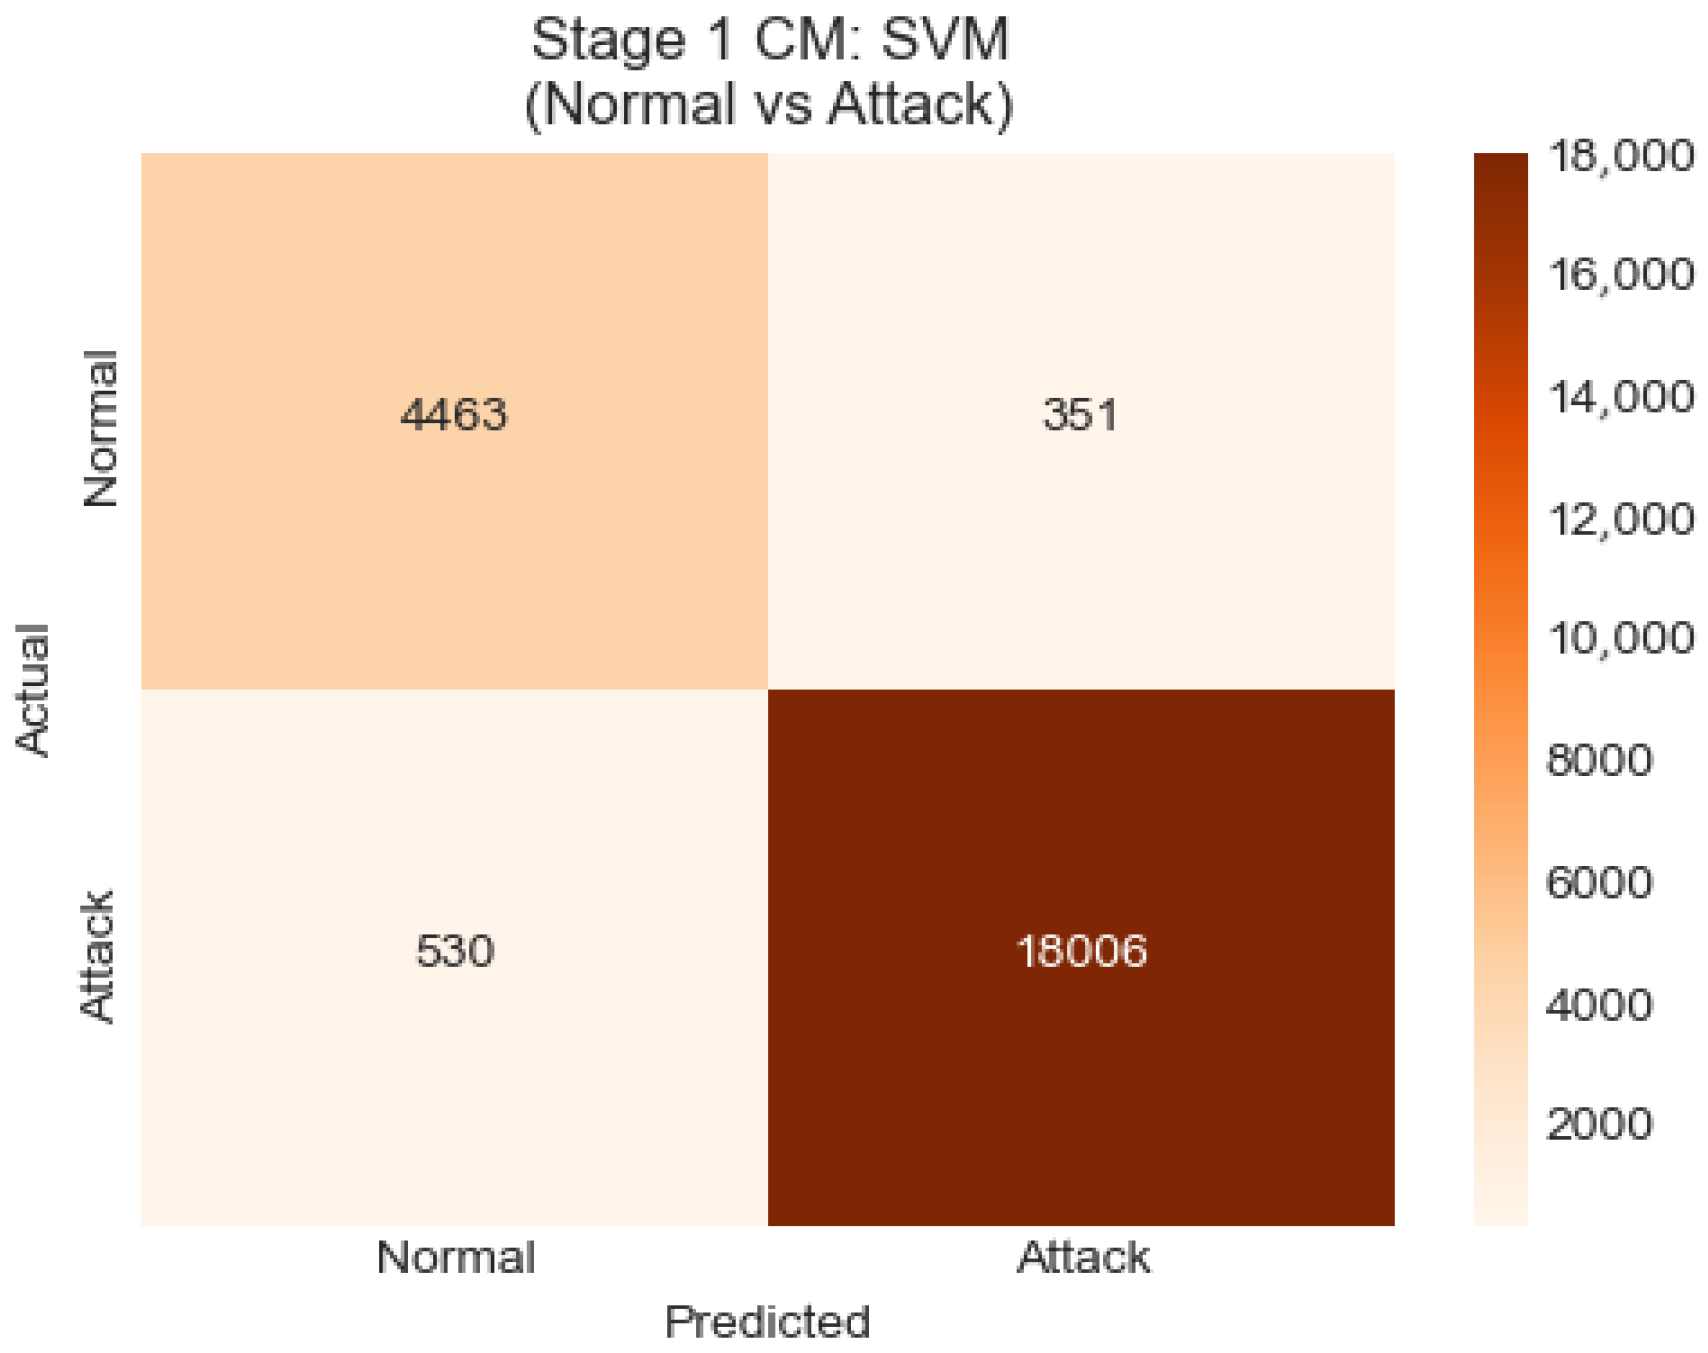
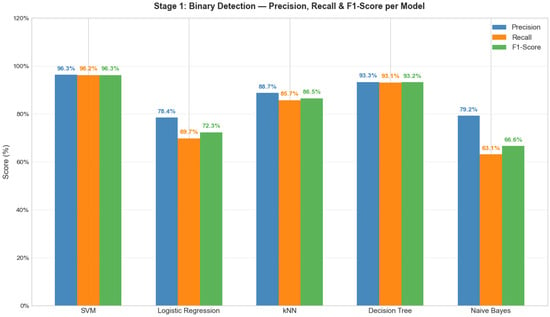
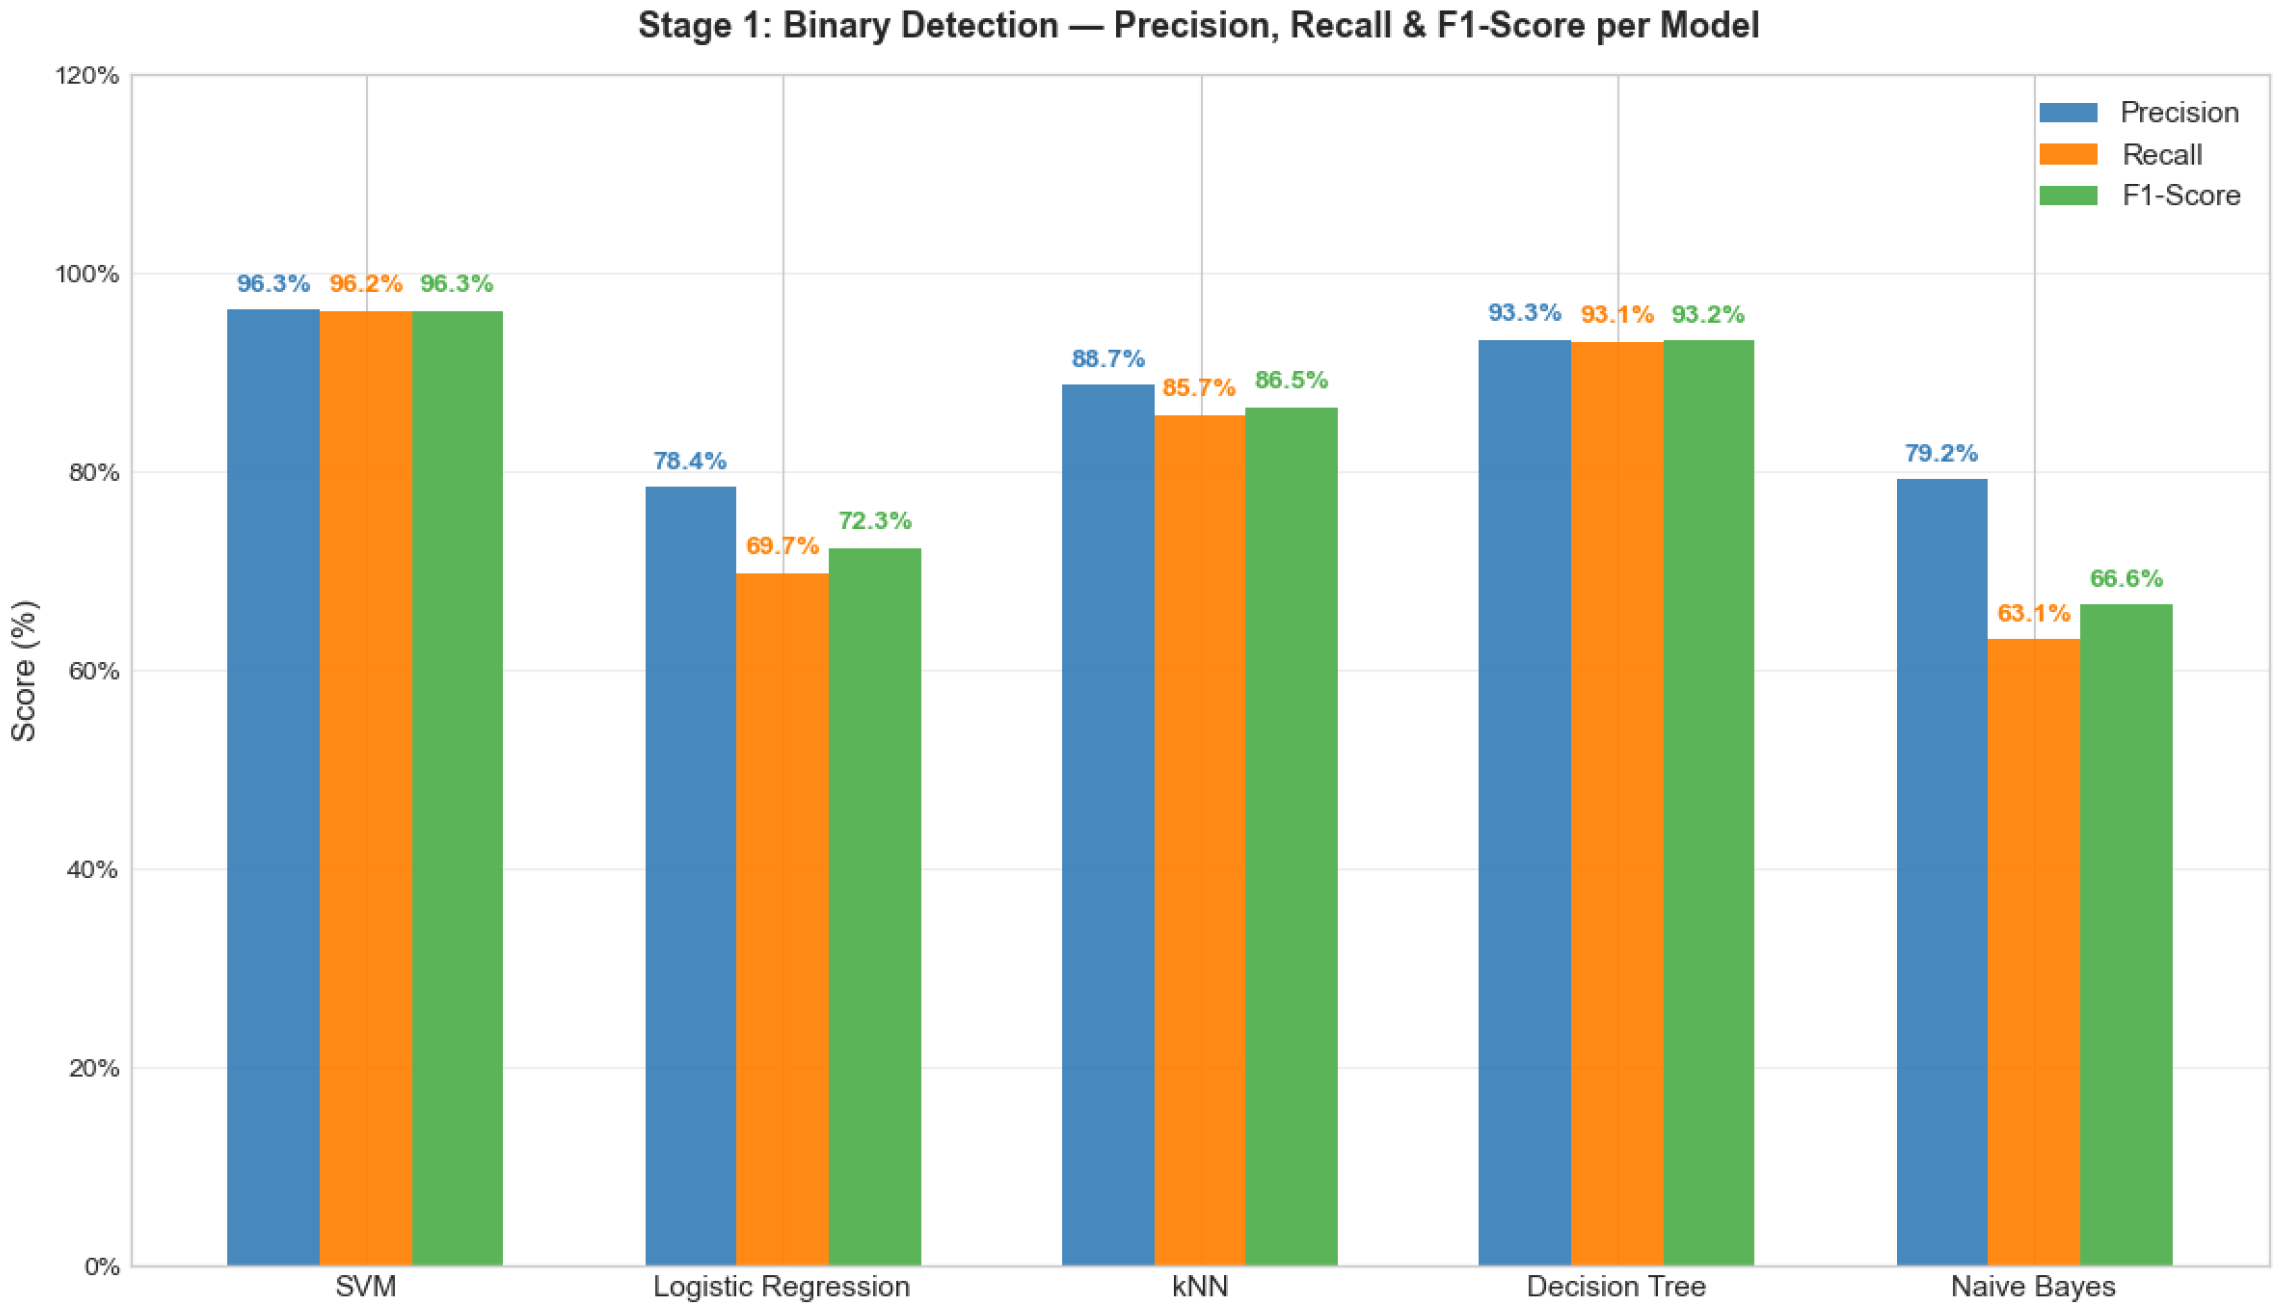
In order to validate the effectiveness of the anomaly detection capability of Stage-1, tested as a binary classifier for distinguishing normal traffic from any kind of eavesdropping attack, before proceeding to the multi-class identification of Stage-2. As illustrated in Figure 5, the binary confusion matrix of PCA-SVM as a binary classifier has 18,006 true positives and 4463 true negatives with just 530 false negatives and 351 false positives, demonstrating excellent detection ability even when operating alone at this stage. The relative binary classification ability of all classifiers. The proposed PCA-SVM achieves the highest values in terms of precision, recall, and F1-score with 96.3%, 96.2%, and 96.3%, respectively, followed by Decision Tree with 93.3%, 93.1%, and 93.2%, respectively.
Figure 5.
Stage-1 CM:SVM (Normal vs. Attack).
The k-NN classifier achieves a moderate F1-score of 86.5%, while Logistic Regression and Naïve Bayes achieve much lower values of 72.3% and 66.6% as shown in Figure 6, respectively, because of their incapability to handle non-linear boundaries in the high-dimensional OTDR feature space. These results validate that Stage-1 indeed acts as a reliable anomaly detection gate that can be independently verified, thereby effectively addressing the issue of verifiability that is always associated with hierarchical two-stage classifiers.
Figure 6.
Stage-1 comparative performance analysis.
5.2. Overall Comparative Performance Analysis
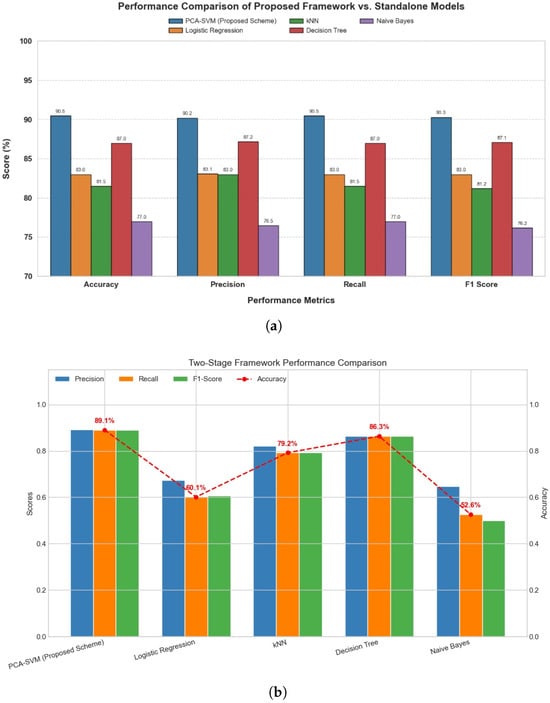
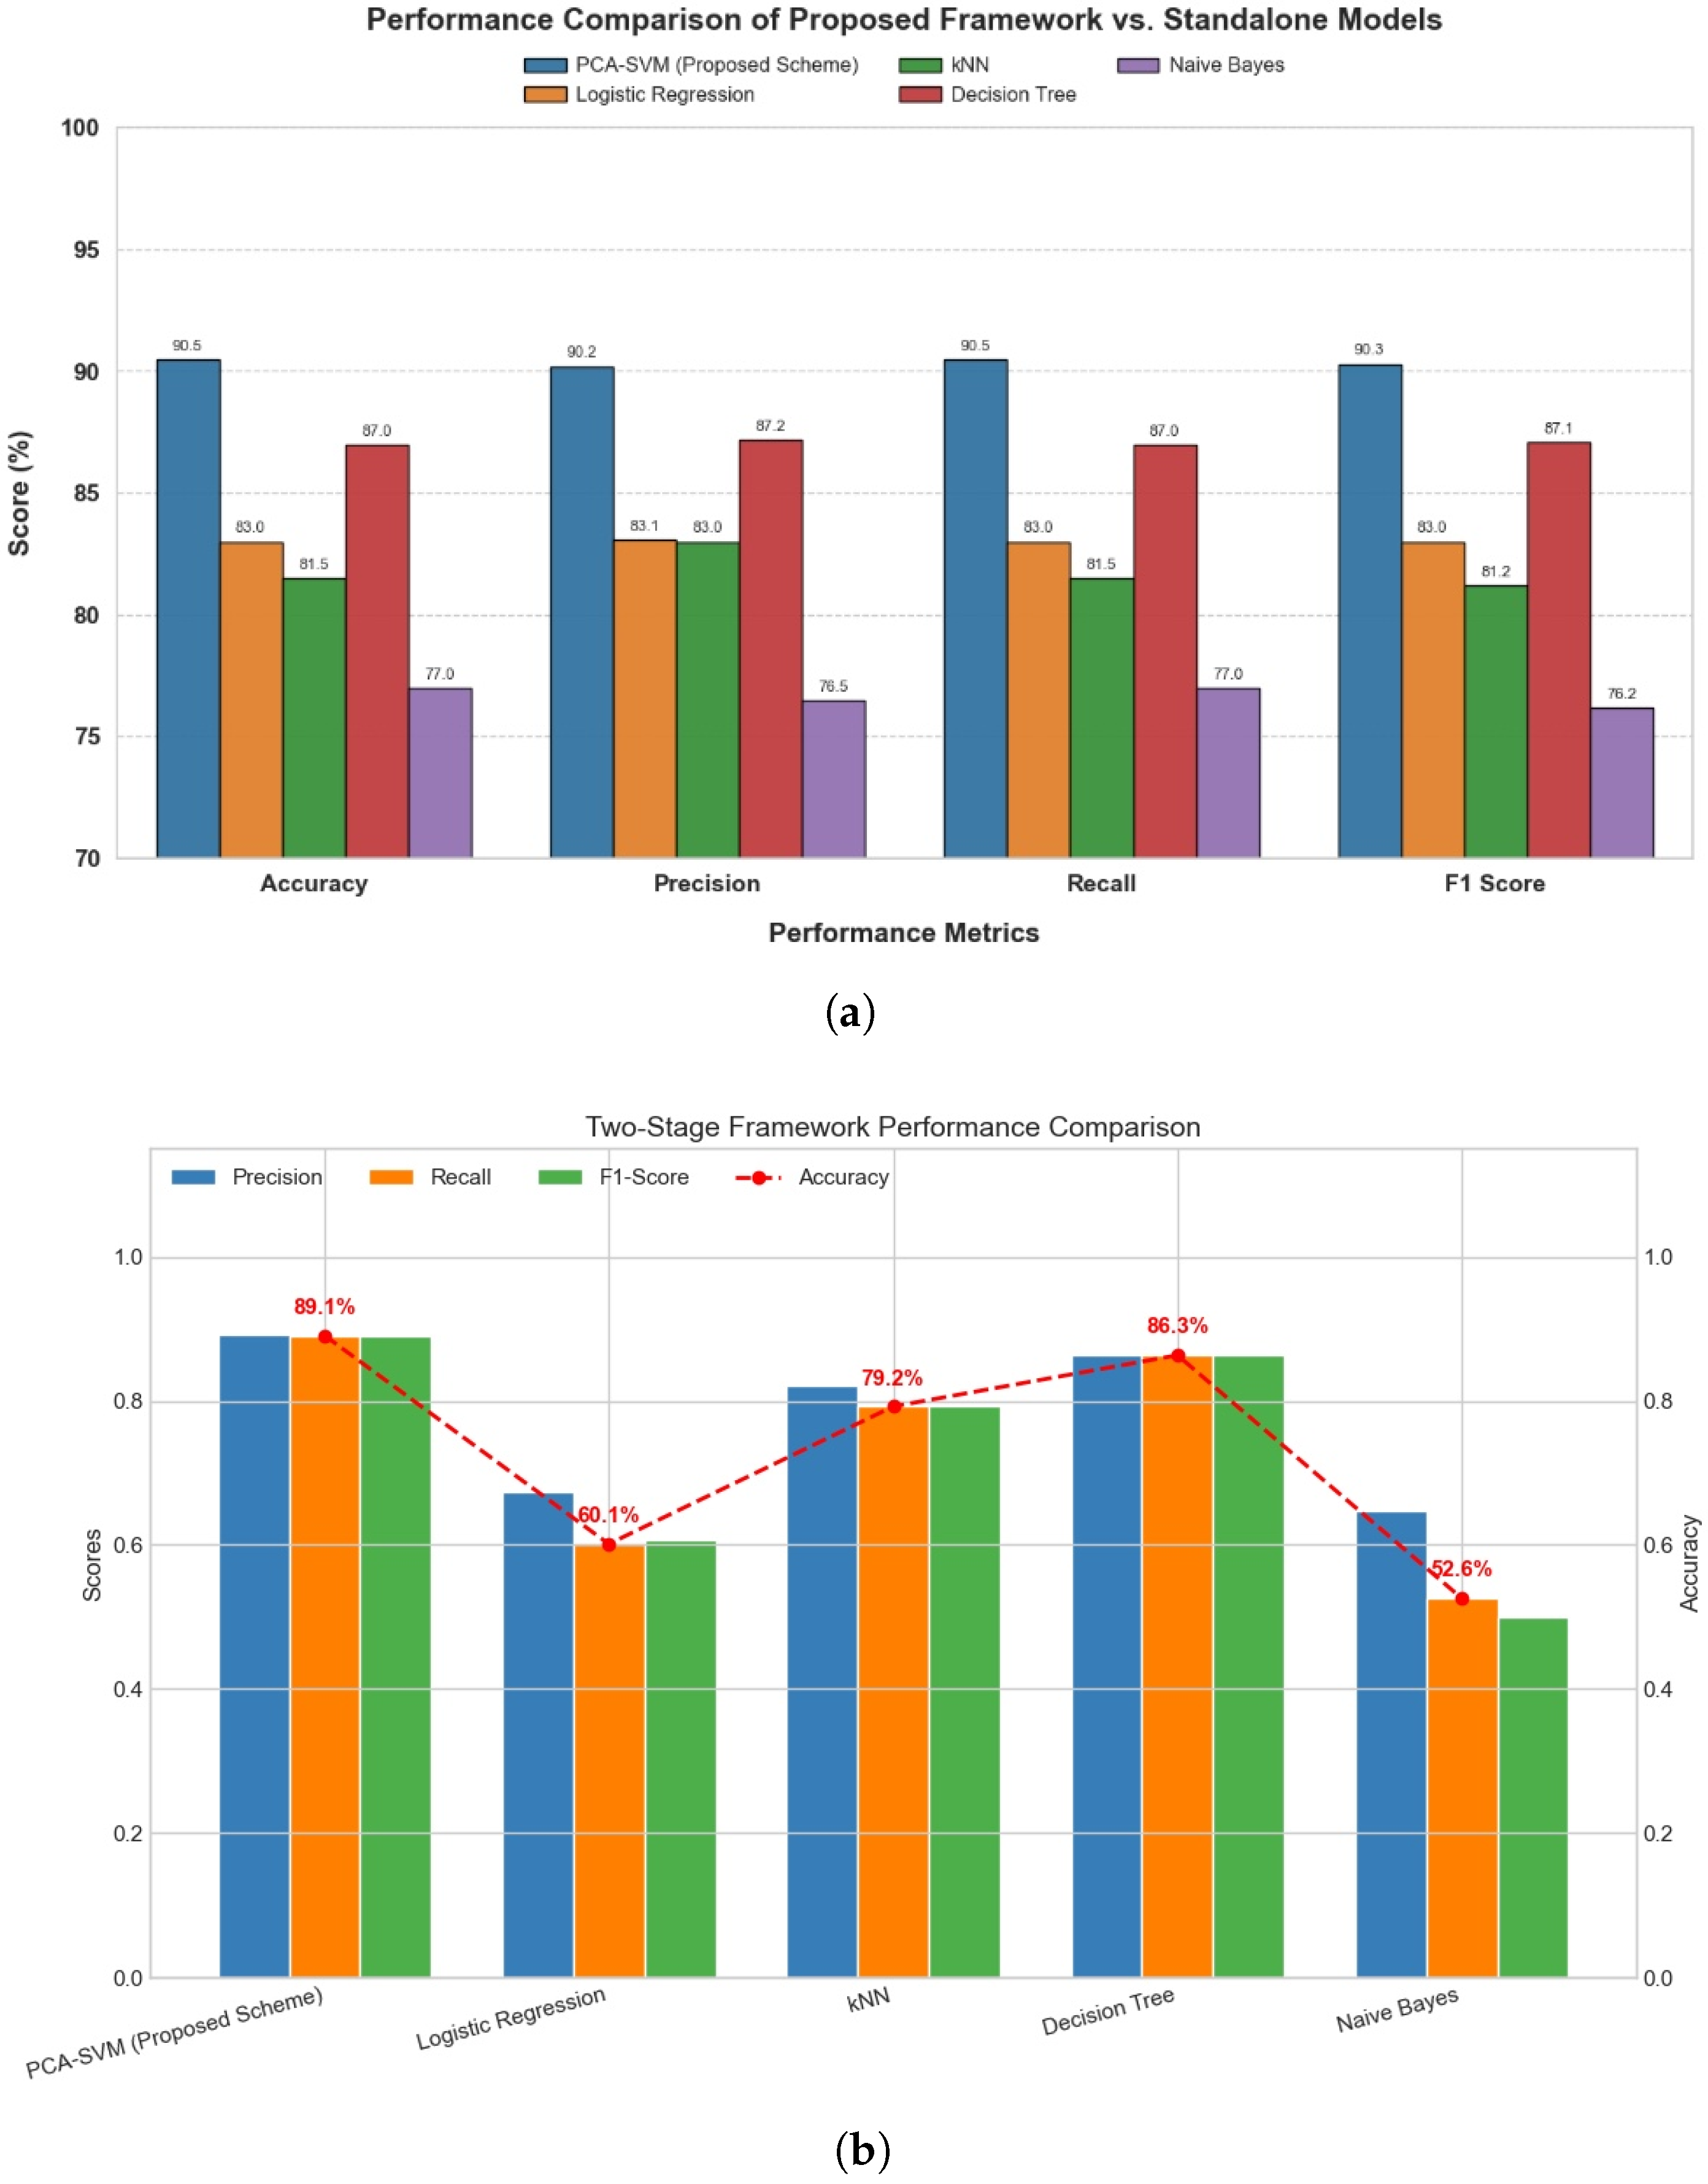
In order to assess the efficacy of the proposed approach, a detailed benchmarking analysis was conducted by comparing the efficacy of the proposed model of two stage PCA-assisted SVM with that of four popular conventional classification models: Decision Tree, k-nearest neighbors (k-NN), logistic regression, and naïve Bayes. The comparative performance evaluation results are presented in Figure 7. As shown in the figure, the proposed model outperforms all the conventional models in terms of classification accuracy, yielding a maximum accuracy of 89.07%. The second-best model is the decision tree model, which yields an accuracy of 86.33%. Although the decision tree model is comparable to the proposed model in terms of classification accuracy, it is less robust compared to the proposed model. The performance of the linear models, namely, logistic regression and naïve Bayes, is significantly low, yielding less than 65% accuracy, as these models are less capable of handling the complex non-linear relationships between the OTDR signature data. Additionally, the proposed model yields the best F1 score, thus ensuring the effectiveness of the proposed model in terms of false alarm rates as well as missed intrusion vents.
Figure 7.
Overall comparative performance analysis. (a) Precision, Recall, and F1-Score Comparison. (b) AUC-ROC Performance Comparison.
5.3. Detailed Class-Wise Performance
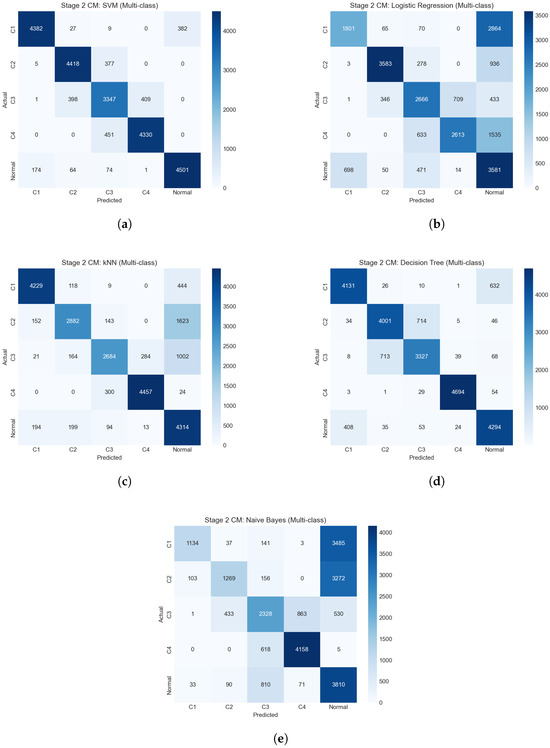
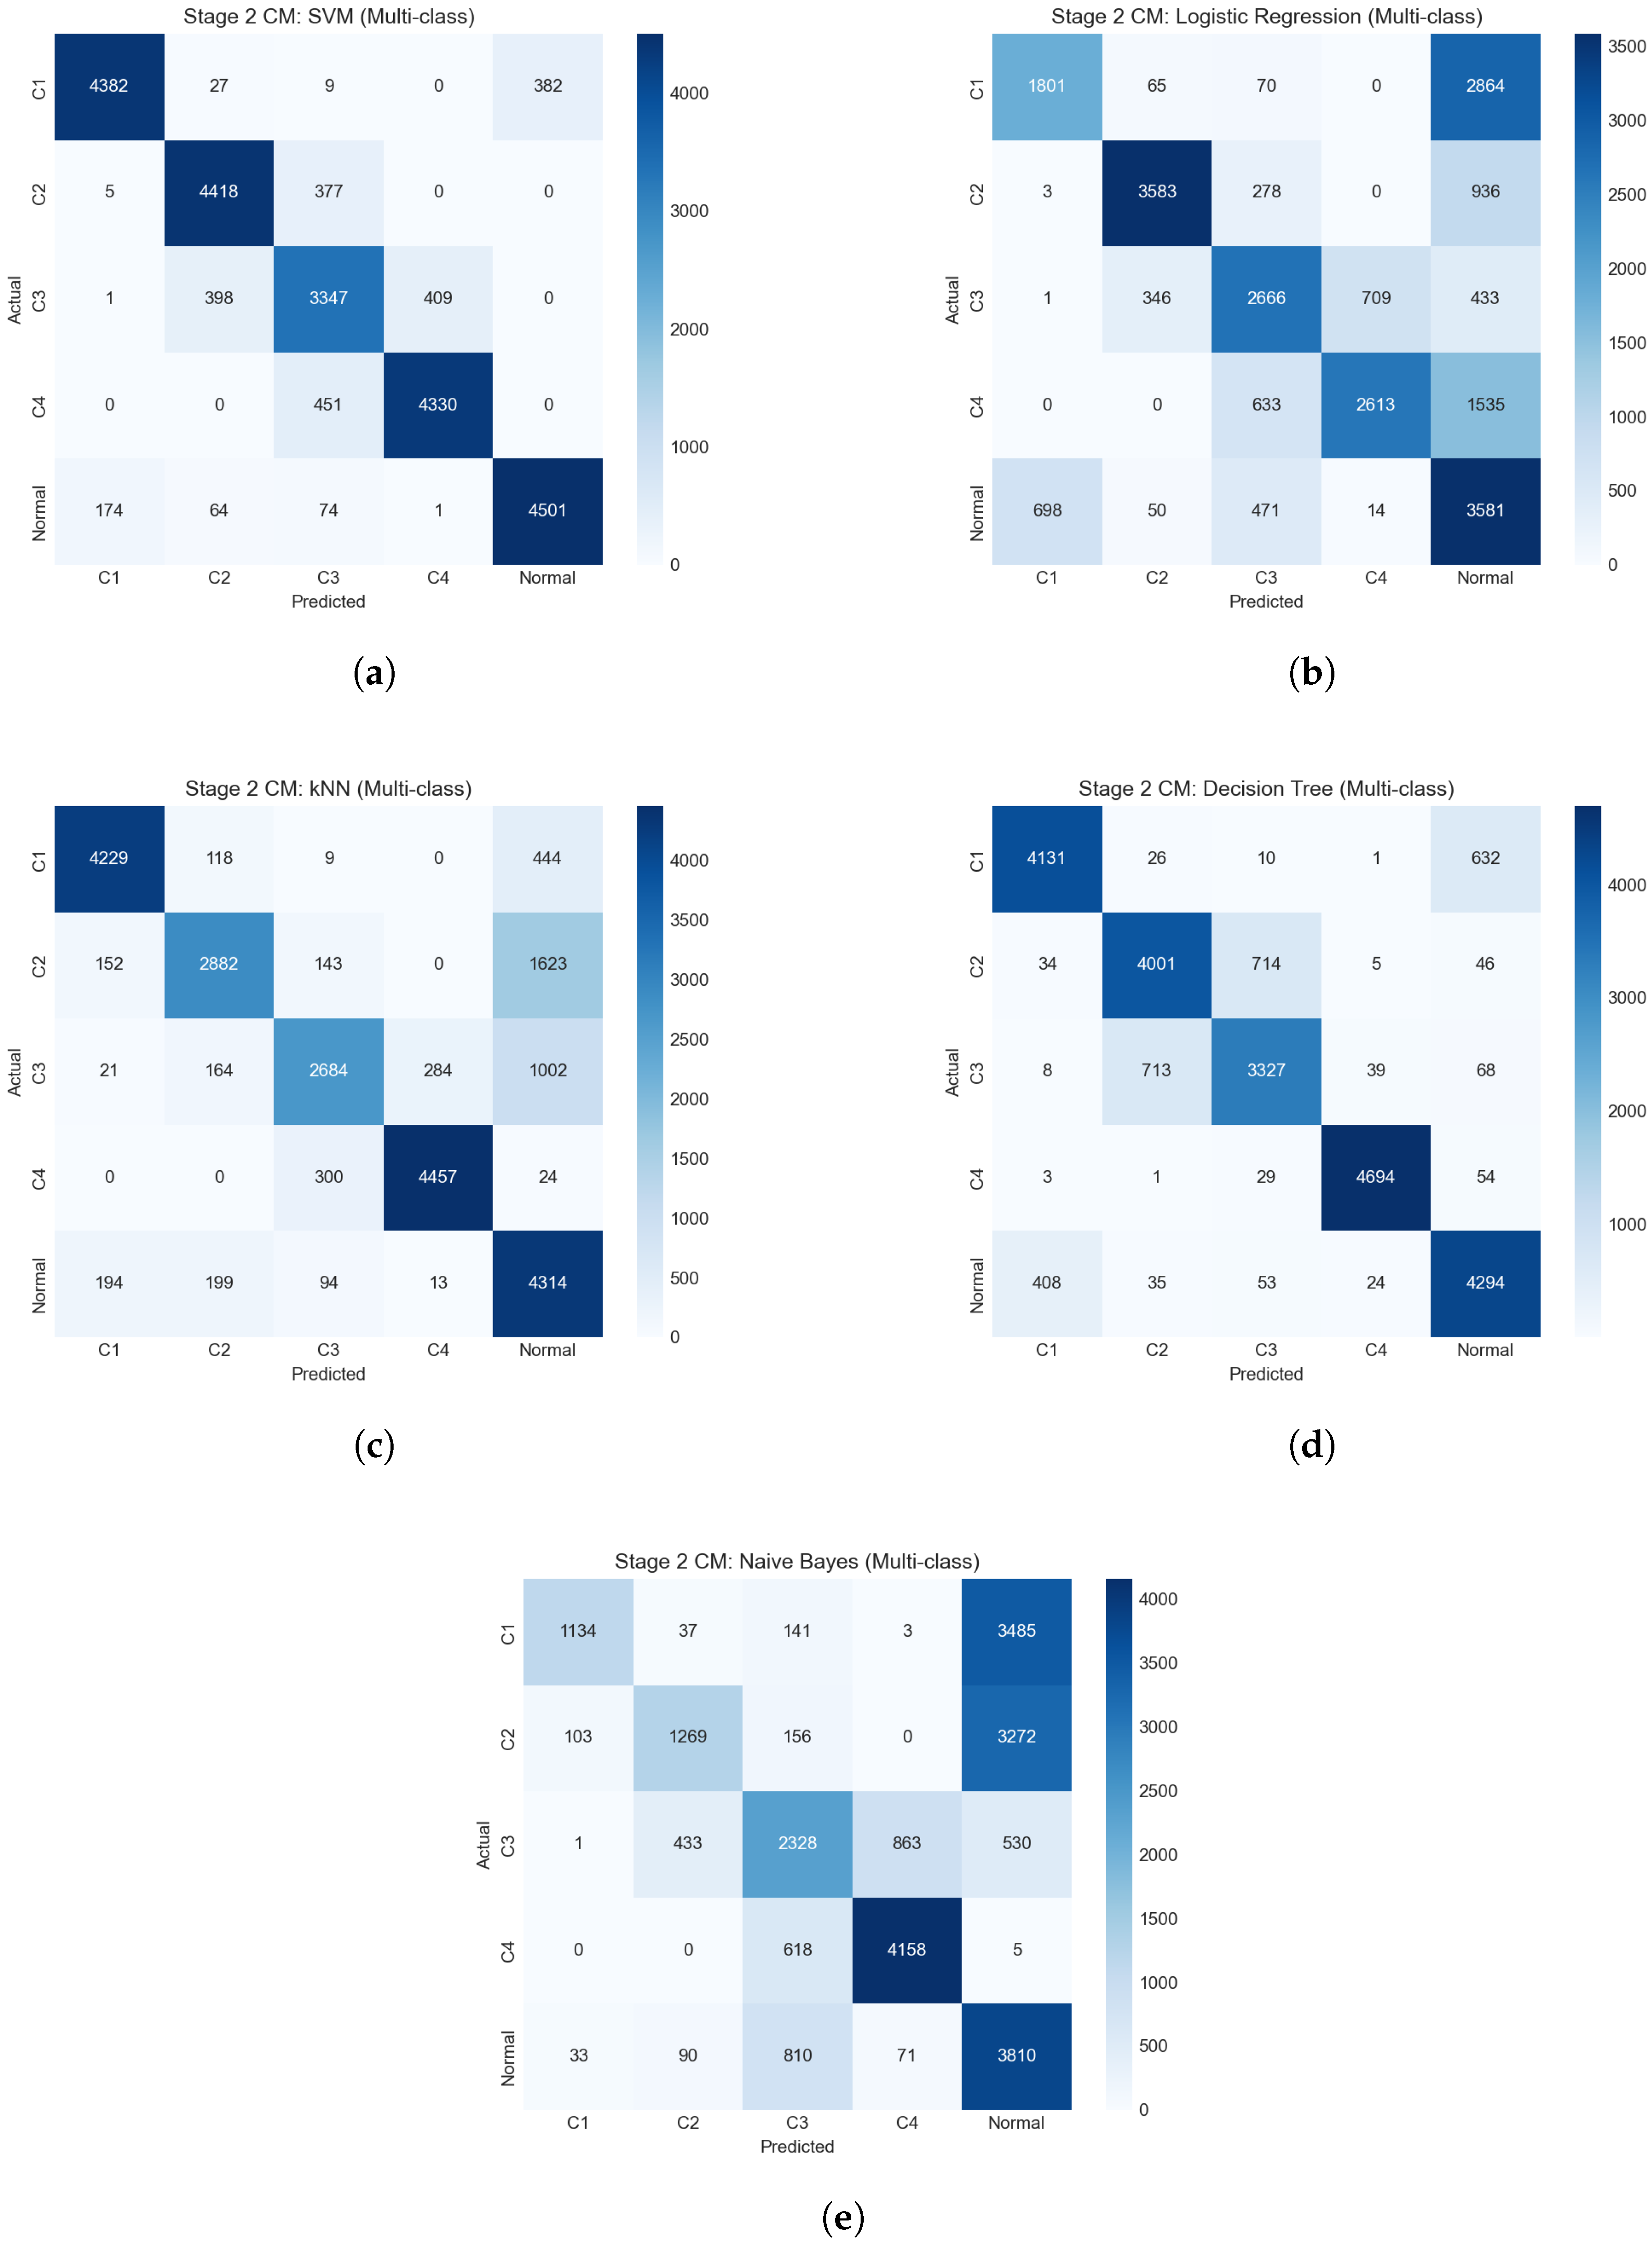
Figure 8 illustrates the confusion matrices that have been achieved for all classifiers tested using the proposed two-stage framework. From the confusion matrices, a class-wise view of the prediction results for all five classes, i.e., C1, C2, C3, C4, and Normal, is provided by comparing the ground-truth labels with the corresponding prediction results. Strong diagonal elements of the confusion matrices indicate correct classification results, while non-diagonal elements indicate misclassification results.
Figure 8.
Confusion matrices for all classifiers evaluated within the proposed two-stage framework. (a) Classifier 1. (b) Classifier 2. (c) Classifier 3. (d) Classifier 4. (e) Classifier 5.
Among all these models, the SVM classifier showed the best consistency and accuracy, as confirmed by diagonal dominance for all classes. A high classification accuracy is obtained for classes C1, C2, and C4, although some minor misclassifications exist between classes C2 and C3, and classes C3 and C4. The relatively higher misclassification between C2 and C3, and between C3 and C4, is primarily due to the overlapping OTDR signatures of fiber bending, fiber cut, and reflective events, especially when they occur at similar distances in a high-density PON with a 1:128 split ratio. Additionally, the smaller sample size of Class C3 (13,849 vs. 16,000 for other classes) contributes to this challenge. Nevertheless, the sparse distribution off the diagonal axis proves the success of the SVM classifier in learning nonlinear decision boundaries in the hierarchical feature space.
Likewise, the Decision Tree classifier exhibited robust classification performance, particularly in class C4, where accurate classification results prevailed. Nevertheless, the increased bidirectional misclassification between C2 and C3 shows that splitting criteria based on the Decision Tree approach are less capable of distinguishing fine differences between the classes. In addition, the misclassification between C1 and Normal shows the sensitivity of the threshold-based splitting criteria. Nevertheless, the overall diagonal pattern is evident, placing Decision Trees as a competitive but less robust option compared to the SVM approach.
On the other hand, k-nearest neighbors’ classifier (k-NN) showed a higher level of misclassifications, particularly where C2 and C3 samples were often classified as normal. This is because k-NN classifier depends on local distance measures in a high-dimensional space. This makes it more susceptible to the impacts of overlapping features and noise. Although k-NN classifier showed a reasonable level of accuracy in classifying C4 samples, the nature of the classifier to include anomalous samples in normal class reduces the recall rate of attack detection.
Logistic Regression exhibited a considerable drop in performance, where many anomaly samples, particularly those from C1 and C4, were classified as normal. This also demonstrates the weakness of using linear decision boundaries to model the nonlinear relationships that are evident in the data, based on the OTDR features. In addition, the Naïve Bayes classifier performed the worst, and there was a considerable bias towards the normal class. The reason for the considerable number of misclassified C1 and C2 samples is the violation of the assumption of conditional independence owing to the correlation and temporal dependencies.
Overall, the analysis of the confusion matrix also confirmed the effectiveness of the classifiers that can handle non-linear relationships between the features, most notably the SVM classifier and to a certain extent the Decision Trees classifier. On the other hand, the distance-based and probabilistic models suffer from the problem of overlapping features. These qualitative results are consistent with the quantitative evaluation metrics and confirm the effectiveness of the proposed framework for the complex eavesdropping detection problem.
5.4. Diagnostic Robustness & ROC Curve
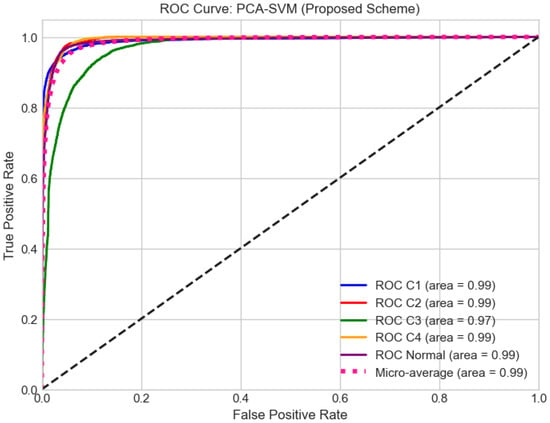
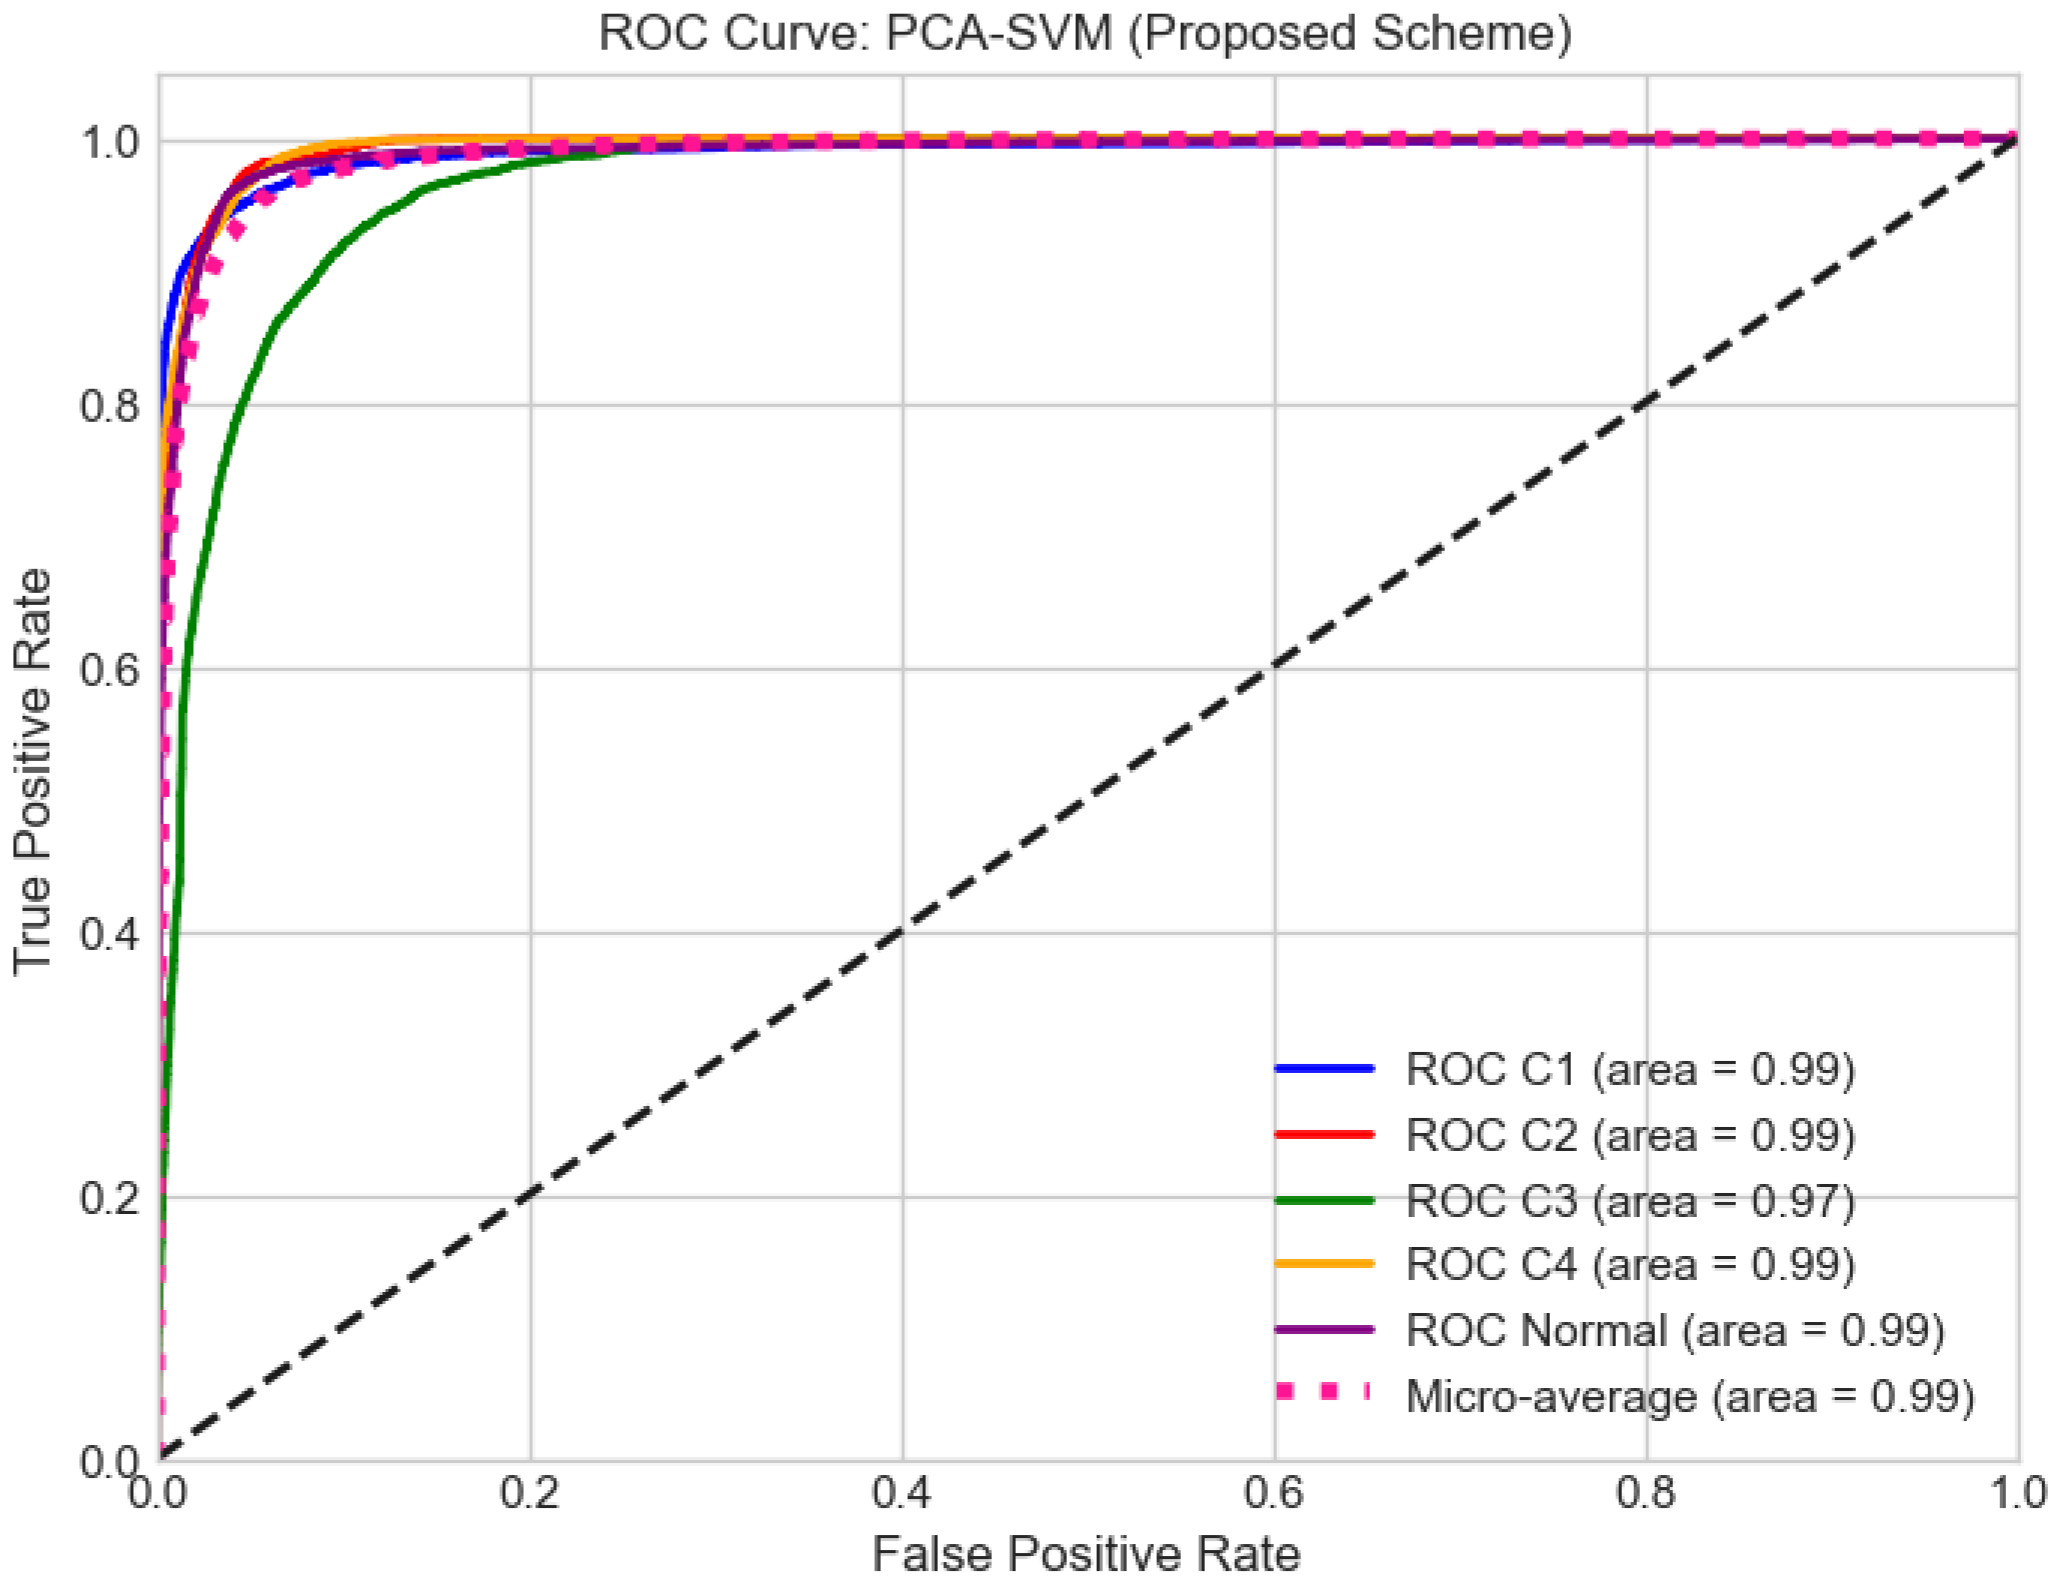
To further assess the robustness and diagnostic consistency of the evaluated classifiers, Receiver Operating Characteristic (ROC) analysis was conducted. Figure 9 presents the class-wise ROC curves for the proposed SVM model, where the Area Under the Curve (AUC) values approach 0.99 for most classes. Such high AUC values indicate that the classifier sustains a strong True Positive Rate (TPR) while maintaining a low False Positive Rate across varying decision thresholds.
Figure 9.
Class wise ROC curves.
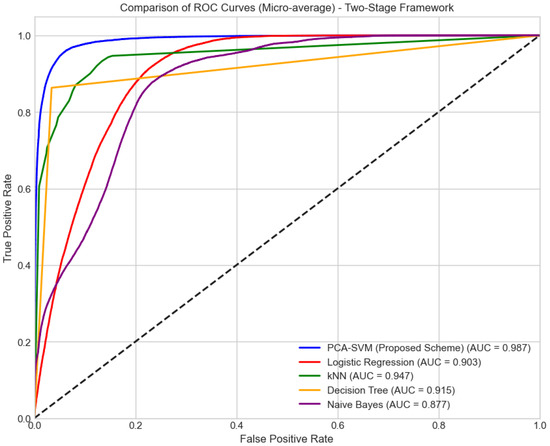
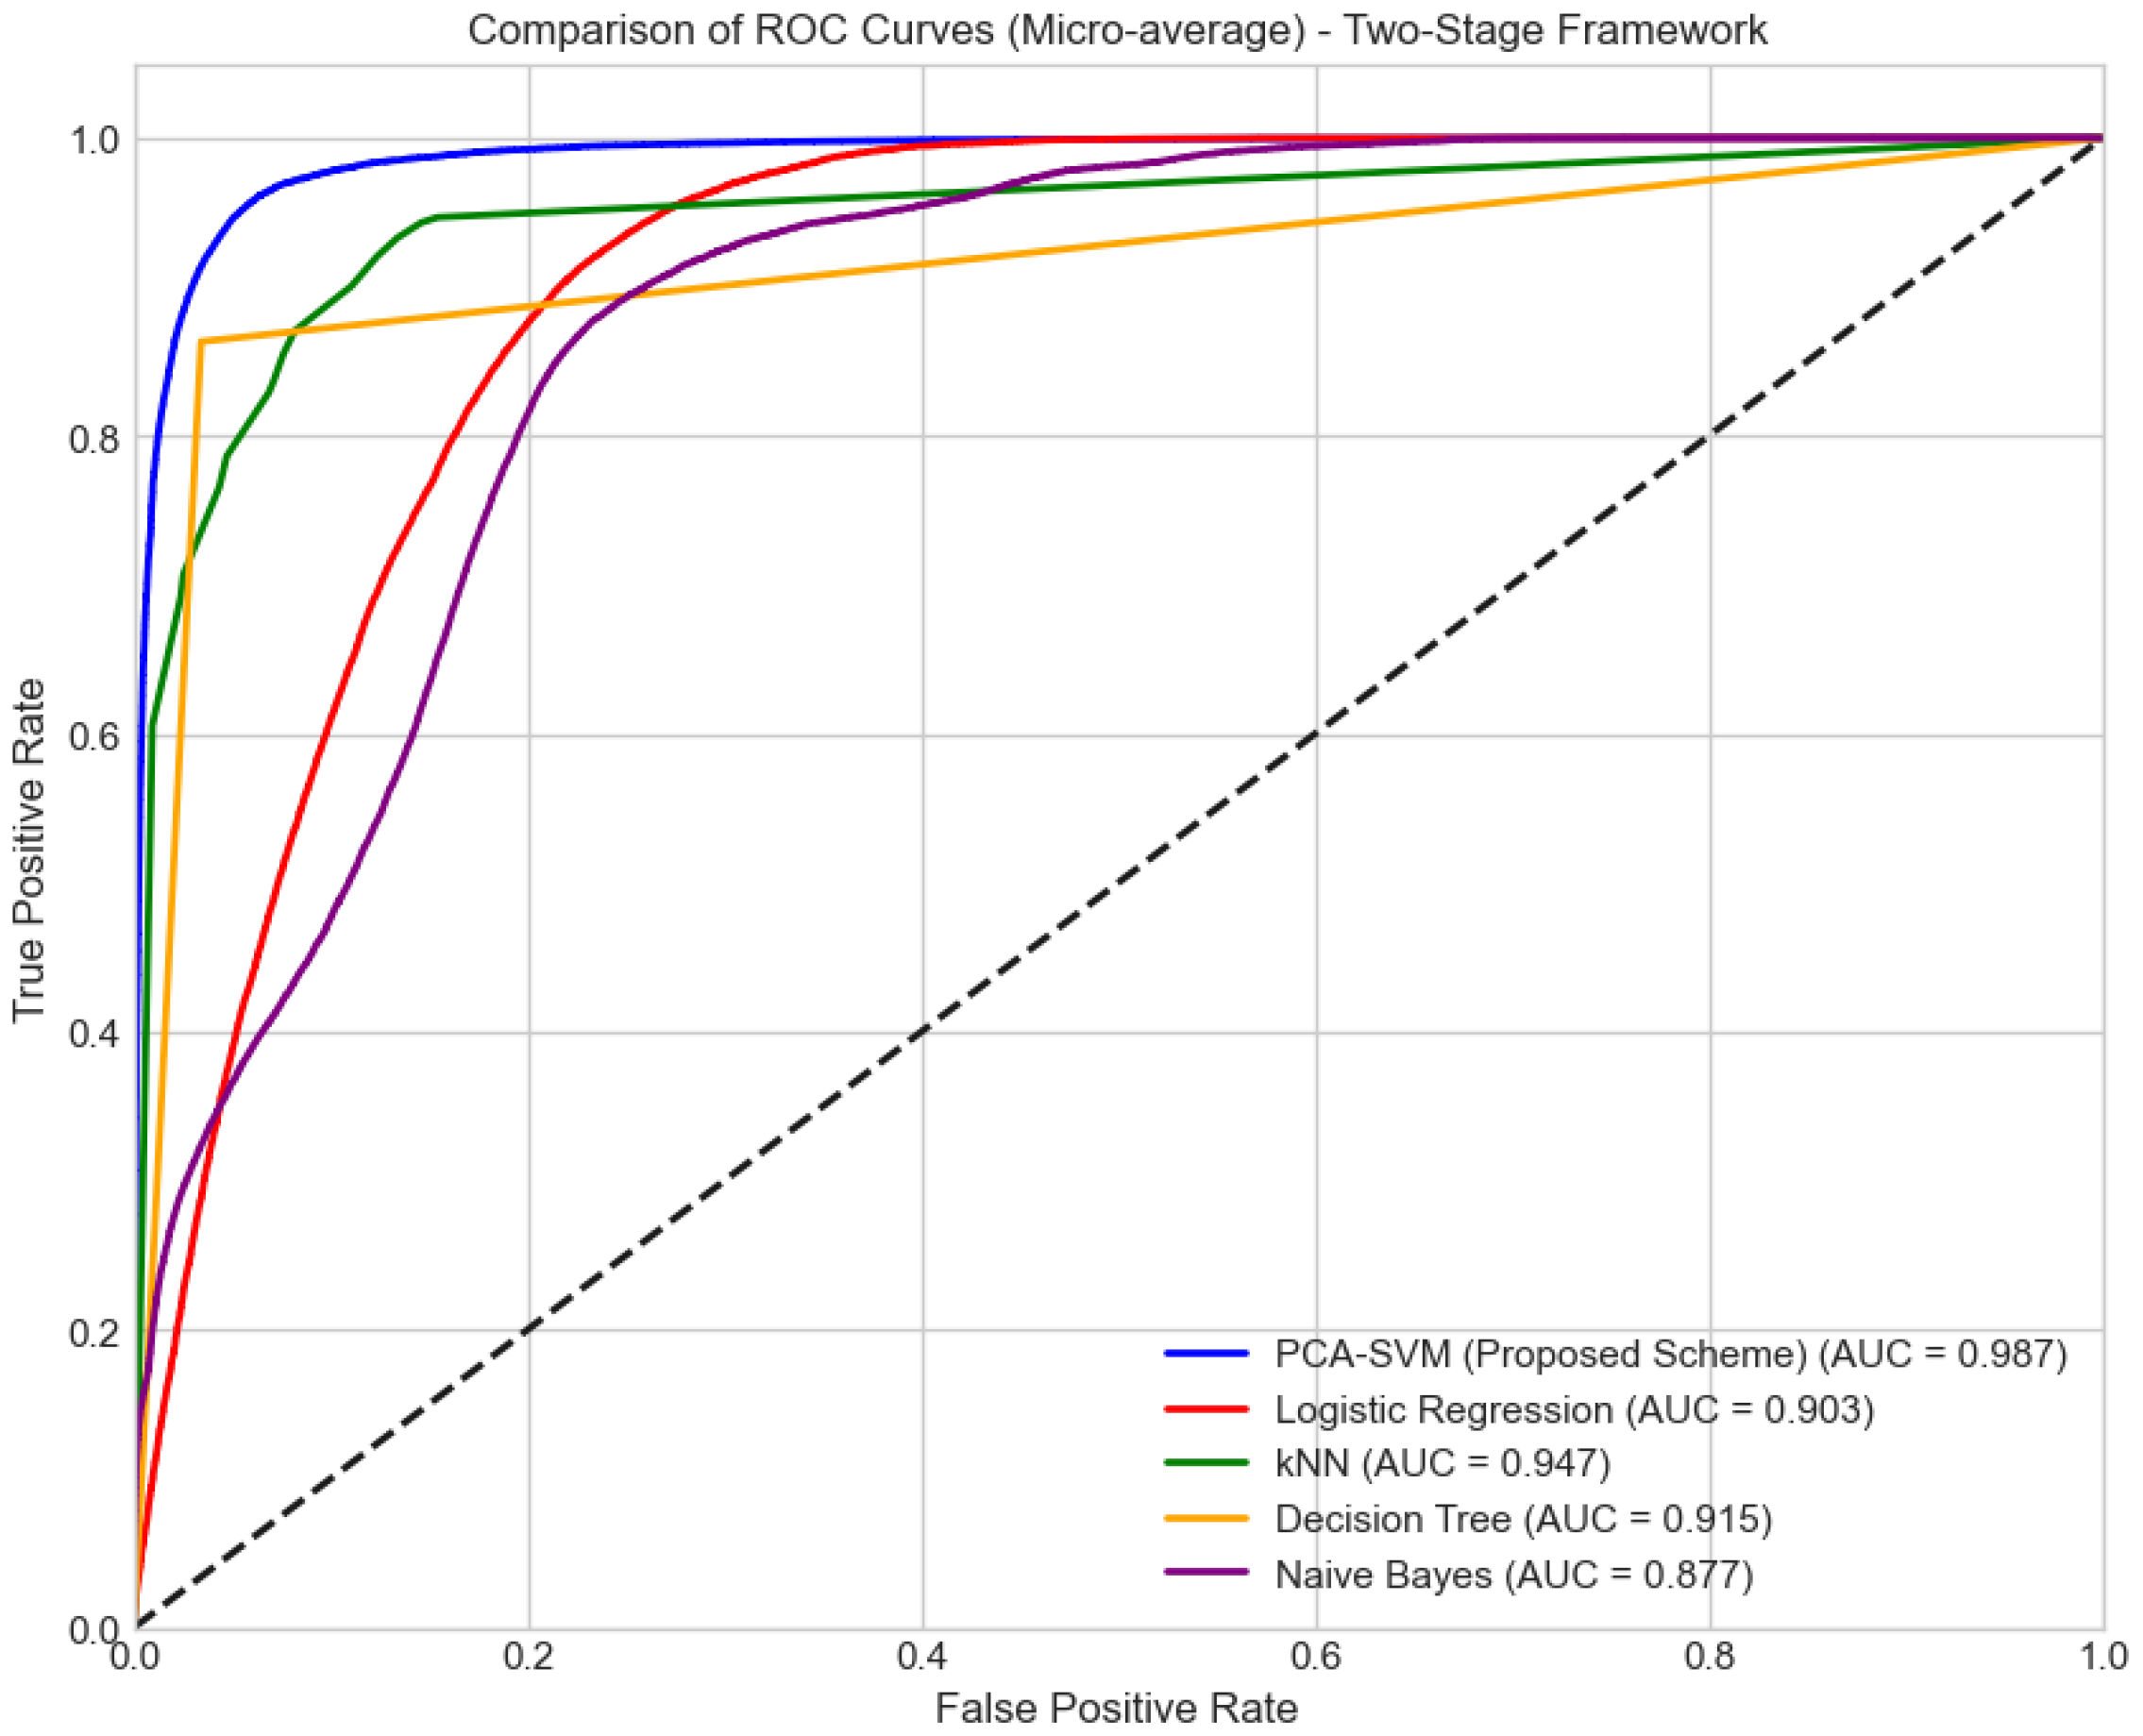
In addition, Figure 10 displays the micro-averaged ROC comparison of all the considered models. The proposed Two-Stage framework, as indicated by the blue line, covers the largest area with AUC equal to 0.987. A per-class analysis reveals that Class C3 (Fiber Cut) achieves an AUC of 0.97, lower than 0.99 for all other classes. This is consistent with the confusion matrix (Figure 8), where C3 shows higher misclassification with C2 (Fiber Bending) and C4 (Reflector). The lower AUC is attributed to the smaller sample size of C3 (13,849 vs. 16,000) and overlapping OTDR signatures under high-split-ratio PON conditions. This fact indicates the performance superiority of the proposed framework over the Decision Tree classifier with AUC equal to 0.915 and the Naïve Bayes classifier with AUC equal to 0.877. This fact substantiates the performance and reliability superiority of the proposed hierarchical framework.
Figure 10.
All models micro-averaged ROC comparison.
6. Conclusions
Passive Optical Networks reinforce the broadband access infrastructure. However, their shared broadcast nature makes PONs vulnerable to physical layer attacks, especially eavesdropping. In this research study, we have focused on the issue of detecting of unauthorized tapping in the OTDR traces, which is difficult due to the high dimensionality and class imbalance. To address this, we propose a hierarchical two-stage probabilistic model that separates the process of anomaly detection from attack classification. The distinctive feature of this approach is the incorporation of conditional PCA for the SVM classifier in the second stage, along with the probabilistic combination strategy based on the product rule. This improves the decision boundaries and minimizes the probability of normal attack classification in noisy conditions. The overall comparative performance analysis reveals that this cascaded structure demonstrates competitive and enhanced identification performance compared to traditional standalone classifiers such as SVM, k-NN, and Naïve Bayes, especially for localizing specific attack classes such as C1–C4. Future directions of this study involve exploring the potential of deep learning approaches such as CNNs or LSTMs for direct optical signal processing, along with feasibility verification of the proposed framework for real-time edge devices.
Author Contributions
H.S.S.B.: conceptualization, software development, framework design, writing—original draft, implementation, evaluation. J.Z. and Y.L.: supervision, critical analysis, review and editing, methodology guidance, project oversight, validation, writing—review and editing. A.A.W.: data curation, implementation support, review, testing and editing. W.W. and S.M.: visualization, validation, review, suggestions, and arranging of resources. All authors have read and agreed to the published version of the manuscript.
Funding
This work is supported by the National Natural Science Foundation of China (62471063, 62425105) and Fundamental Research Funds for the Central Universities (ZDYY202102).
Institutional Review Board Statement
Not applicable.
Informed Consent Statement
Not applicable.
Data Availability Statement
The dataset used in this study is publicly available as “Dataset for Optical fiber faults” at IEEE Dataport, available at https://ieee-dataport.org/documents/dataset-optical-fiber-faults (accessed on 7 April 2026). The code developed for this study is available from the corresponding author upon reasonable request.
Conflicts of Interest
The authors declare no conflicts of interest.
References
- Hu, L.; Lin, Z.; Wang, J.; Wang, W.; Zhao, Y.; Zhang, J.; Yang, G. Crosstalk-aware dynamic bandwidth allocation algorithm for confidential lightpath protection in next-generation passive optical networks. Opt. Express 2025, 33, 41699–41717. [Google Scholar] [CrossRef] [Scilit] [PubMed]
- Abdelli, K.; Tropschug, C.; Griesser, H.; Pachnicke, S. Faulty branch identification in passive optical networks using machine learning. J. Opt. Commun. Netw. 2023, 15, 187–196. [Google Scholar] [CrossRef] [Scilit]
- Ye, X.; Lv, T.; Zheng, Y.; Wang, S.; Fan, H.; Ge, Z.; Xu, Z.; Sun, X. A Security Detection Scheme Based on TTD for NG-PON2 Fiber Links. J. Light. Technol. 2022, 40, 3633–3639. [Google Scholar] [CrossRef] [Scilit]
- Song, H.; Lin, R.; Wosinska, L.; Monti, P.; Zhang, M.; Liang, Y.; Li, Y.; Zhang, J. Cluster-based unsupervised method for eavesdropping detection and localization in WDM systems. J. Opt. Commun. Netw. 2024, 16, F52–F61. [Google Scholar] [CrossRef] [Scilit]
- Healy, M.; Baum, A.; Musumeci, F. Addressing data scarcity in ML-based failure-cause identification in optical networks through generative models. Opt. Fiber Technol. 2025, 90, 104137. [Google Scholar] [CrossRef] [Scilit]
- Abdelli, K.; Tropschug, C.; Grießer, H.; Jansen, S.; Pachnicke, S. Branch Identification in Passive Optical Networks using Machine Learning. In Proceedings of the Optical Fiber Communication Conference (OFC) 2023, San Diego, CA, USA, 5–9 March 2023. [Google Scholar]
- Abdelli, K.; Tropschug, C.; Griesser, H.; Pachnicke, S. Fault Monitoring in Passive Optical Networks using Machine Learning Techniques. In Proceedings of the 23rd International Conference on Transparent Optical Networks (ICTON) 2023, Bucharest, Romania, 2–6 July 2023; pp. 1–5. [Google Scholar]
- Yang, X.; Qiu, J.; Gong, X.; Ye, J.; Yao, F.; Chen, J.; Luo, X.; Qin, D. Anomaly Diagnosis Using Machine Learning Method in Fiber Fault Diagnosis. Comput. Mater. Contin. 2025, 85, 1515–1539. [Google Scholar] [CrossRef] [Scilit]
- Musumeci, F.; Rottondi, C.; Corani, G.; Shahkarami, S.; Cugini, F.; Tornatore, M. A Tutorial on Machine Learning for Failure Management in Optical Networks. J. Light. Technol. 2019, 37, 4125–4139. [Google Scholar] [CrossRef] [Scilit]
- Saif, W.S.; Esmail, M.A.; Ragheb, A.M.; Alshawi, T.A.; Alshebeili, S.A. Machine Learning Techniques for Optical Performance Monitoring and Modulation Format Identification: A Survey. IEEE Commun. Surv. Tutor. 2020, 22, 2839–2882. [Google Scholar] [CrossRef] [Scilit]
- Wang, D.; Zhang, C.; Chen, W.; Yang, H.; Zhang, M.; Lau, A.P.T. A Review of Machine Learning-based Failure Management in Optical Networks. arXiv 2022, arXiv:2208.10677. [Google Scholar] [CrossRef] [Scilit]
- Song, H.; Li, Y.; Song, H.; Wang, W.; Zhao, Y.; Zhang, J.; Liu, Y. Multi-intensity Bending Eavesdropping Detection and Identification Scheme Based on the State of Polarization. In Proceedings of the Opto-Electronics and Communications Conference (OECC) 2023, Shanghai, China, 2–6 July 2023; pp. 1–4. [Google Scholar]
- Liu, S.; Wang, D.; Zhang, C.; Wang, L.; Zhang, M. Semi-supervised Anomaly Detection with Imbalanced Data for Failure Detection in Optical Networks. In Proceedings of the Optical Fiber Communication Conference (OFC) 2021, San Francisco, CA, USA, 6–11 June 2021. [Google Scholar]
- Spurny, V.; Munster, P.; Tomasov, T.; Horvath, T.; Skaljo, E. Physical Layer Components Security Risks in Optical Fiber Infrastructures. Sensors 2022, 22, 588. [Google Scholar] [CrossRef] [Scilit] [PubMed]
- Furdek, M.; Skorin-Kapov, N.; Zsigmond, S.; Wosinska, L. Physical-layer security in evolving optical networks. IEEE Commun. Mag. 2016, 54, 110–117. [Google Scholar] [CrossRef] [Scilit]
- Maslo, A.; Sarajlić, N.; Hodžić, M.; Mujčić, A. Optical Network Security Attacks by Tapping and Encrypting Optical Signals. Adv. Technol. Syst. Appl. V 2021, 142, 321–332. [Google Scholar]
- Atan, F.M.; Zulkifli, N.; Idrus, S.M.; Ismail, N.A.; Zin, A.M.; Ramli, A.; Yusoff, N.M. Security enhanced dynamic bandwidth allocation algorithm against degradation attacks in next generation passive optical networks. J. Opt. Commun. Netw. 2021, 13, 301–311. [Google Scholar] [CrossRef] [Scilit]
- Qin, W.; Gong, X.; Hou, W.; Zhang, T.; Zhang, X.; Guo, L. Convolutional neural network for detecting fiber-bending eavesdropping attacks in optical communication systems. Opt. Express 2025, 33, 20894–20906. [Google Scholar] [CrossRef] [Scilit] [PubMed]
- Butt, R.A.; Faheem, M.; Ashraf, M.W.; Khawaja, A.; Raza, B. Attack-Aware Dynamic Upstream Bandwidth Assignment Scheme for Passive Optical Network. J. Opt. Commun. 2023, 44, 485–493. [Google Scholar] [CrossRef] [Scilit]
- Bonk, R.; Geng, D.; Khotimsky, D.; Liu, D.; Liu, X.; Luo, Y.; Nesset, D.; Oksman, V.; Strobel, R.; Van Hoof, W.; et al. 50G-PON: The First ITU-T Higher-Speed PON System. IEEE Commun. Mag. 2022, 60, 48–54. [Google Scholar] [CrossRef] [Scilit]
- Abdallah, K.F.; Aly, M.H.; Maher, M.A. Gigabit Passive Optical Networks: Undetected Signal Tapping. J. Opt. Commun. 2026, 142, 1–16. [Google Scholar]
- Moiz Ali, Y.; Prilepsky, J.E.; Sambo, N.; Pedro, J.; Hosseini, M.M.; Napoli, A.; Turitsyn, S.K.; Freire, P. From data to decision: A multi-stage framework for class imbalance mitigation in optical network failure analysis. J. Opt. Commun. Netw. 2026, 18, 42–58. [Google Scholar] [CrossRef] [Scilit]
- Abdelli, K.; Layec, P. AI-Driven Fault Management in Optical Networks: Anomaly Detection, Event Classification, and Beyond. In Proceedings of the Optica Advanced Photonics Congress 2025, Marseille, France, 13–17 July 2025. [Google Scholar]
- Thaseen, I.S.; Kumar, C.A. Intrusion detection model using fusion of PCA and optimized SVM. In Proceedings of the International Conference on Contemporary Computing and Informatics (IC3I) 2014, Mysore, India, 27–29 November 2014; pp. 879–884. [Google Scholar]
- Zhang, Z. Introduction to machine learning: K-nearest neighbors. Ann. Transl. Med. 2016, 4, 218. [Google Scholar] [CrossRef] [Scilit] [PubMed]
- Quinlan, J.R. Learning decision tree classifiers. ACM Comput. Surv. 1996, 28, 71–72. [Google Scholar] [CrossRef] [Scilit]
- Abdelli, K. Dataset for Optical Fiber Faults. IEEE Dataport. 2022. Available online: https://ieee-dataport.org/documents/dataset-optical-fiber-faults (accessed on 7 April 2026).

Disclaimer/Publisher’s Note: The statements, opinions and data contained in all publications are solely those of the individual author(s) and contributor(s) and not of MDPI and/or the editor(s). MDPI and/or the editor(s) disclaim responsibility for any injury to people or property resulting from any ideas, methods, instructions or products referred to in the content. |
© 2026 by the authors. Licensee MDPI, Basel, Switzerland. This article is an open access article distributed under the terms and conditions of the Creative Commons Attribution (CC BY) license.