


Abstract
To address the technical bottlenecks of strong background radiation interference and weak target signals in mid-wave infrared (MWIR) hyperspectral mineral detection over complex terrain, this paper proposes a “full-link background radiation suppression” methodological framework. A coupled illumination-terrain-atmosphere-sensor radiative transfer model is constructed to systematically quantify how multidimensional parameters—such as observation geometry, surface temperature, elevation, aerosol optical depth, and water vapor content—influence the target background radiation contrast. The findings reveal that daytime observation, lower surface temperature, higher altitude, dry atmosphere, and moderate solar and observation zenith angles are key factors for maximizing the signal-to-noise ratio. Comprehensive optimization analysis demonstrates that observations during midday in autumn and winter achieve optimal performance, with the target background relative contrast potentially enhanced by up to 6.29 times compared to unfavorable conditions such as summer nights. This work elucidates the physical mechanisms governing MWIR hyperspectral detection efficacy in complex scenarios, provides direct parameter-optimization strategies for intelligent mission planning of spaceborne imaging systems, and holds significant value for advancing mineral remote sensing from “passive acquisition” to “cognitive detection”.
1. Introduction
Remote sensing exploration of mineral resources in complex terrain presents a significant challenge for both modern geology and Earth observation technology. The complexity of the geological environment, the discrete spatial distribution of ore bodies, and surface heterogeneities such as topographic relief and vegetation cover collectively create substantial bottlenecks to lithological identification and mineral prospecting using remote sensing imagery. These bottlenecks are specifically manifested as: (1) limited bedrock outcrops, causing indicator lithologies to often appear as small, weak-signal targets in imagery; and (2) terrain occlusion effects (e.g., shadows) in high-altitude areas, which can easily conceal potential mineralization zones and ore body outcrops [1]. This situation imposes urgent demands for high radiation sensitivity, high spatial resolution, and high spectral resolution on hyperspectral remote sensing technology used for mineral exploration [2,3]. In this context, promoting the digital and intelligent transformation of remote sensing monitoring technology, constructing an intelligent perception system covering the entire “design-observation-processing” chain, and achieving a leap from “passive acquisition” to “autonomous decision-making” have become important development directions [4].
The mid-wave infrared (MWIR, 2.5–5 μm) spectral region, serving as a transitional band connecting the visible–near-infrared (VNIR) and thermal infrared (TIR), has attracted considerable attention due to its unique optical properties. This band combines both reflective and emissive mechanisms: This band combines both reflective and emissive mechanisms: it can penetrate atmospheric aerosols and haze relatively well while also leveraging the thermal contrast of surface features for enhanced identification capability [5]. Compared to VNIR, MWIR is more sensitive to the fundamental vibrational modes (bond stretching and bending) of molecular bonds in minerals such as silicates and carbonates, enabling accurate discrimination of major mineral classes, including oxides, hydroxides, silicates, and carbonates [6,7,8]. Compared to TIR, it is less affected by atmospheric water vapor interference and exhibits lower sensitivity to emissivity errors, thereby improved temperature inversion accuracy [9,10]. However, the application potential of MWIR satellite data has not been fully realized. The main technical bottleneck is that the at-sensor radiance signal in this band is a complex mixture of solar reflection and terrestrial thermal emission, making separation models more complex and spectral interpretation more difficult [11]. This challenge is further exacerbated in complex terrain scenarios.
Complex terrain causes significant surface elevation variations, violating the homogeneous flat-plane parallel assumption underlying traditional quantitative remote sensing. Terrain effects severely interfere with radiation transfer along the imaging path by altering local illumination geometry and atmospheric transmission paths [12,13]. Consequently, terrain correction methods have evolved from empirical-statistical to physical models [14,15,16,17], significantly improving the accuracy of surface parameter retrieval in mountainous areas [18,19,20,21]. However, most existing studies focus on parameter extraction after terrain correction, with few systematically analyzing the impact of complex terrain on mineral detection efficacy across different spectral bands, particularly the MWIR.
Traditionally, efforts to enhance detection capability have focused primarily on internal payload aspects such as optical design and cooling suppression [22,23], while relatively neglecting the decisive influence of the full-link process on the final signal-to-noise ratio [24]. This process—from the “observation scene” to the “sensor entrance pupil”—is significantly modulated by terrain and atmosphere. Although valuable work has been conducted in the field of target detectability optimization, such as: developing hyperspectral simulators to optimize instrument parameters and mission planning [25]; using end-to-end simulation tools to optimize sensor band configuration [26]; proposing flight direction optimization methods considering terrain and target anisotropy [27]; and systematically analyzing the impact of different backgrounds, observation geometries, and meteorological conditions on target contrast [24,28,29,30], these studies exhibit two main limitations. First, their research focus has primarily been on the visible and long-wave infrared spectral regions, lacking targeted investigation of the MWIR band. Second, their detection scenarios are often configured for flat terrain or aerial targets (e.g., aircraft), failing to adequately account for the influence of complex topography. Therefore, systematically analyzing the synergistic mechanisms underlying the aforementioned multidimensional environmental parameters’ influence on MWIR hyperspectral mineral-detection efficacy from a “illumination-terrain-atmosphere-sensor” full-link perspective remains a key challenge.
To address this, this paper proposes a “full-link background radiation suppression” methodological framework to systematically analyze the mineral-detection efficacy of MWIR hyperspectral remote sensing in complex terrain. The research involves constructing a multi-variable, coupled radiation-transfer model to quantify the radiation contrast between mineral targets and the background under different detection conditions. Based on this, it systematically evaluates the synergistic impact of multi-dimensional parameters—including sun-target-sensor geometry, atmospheric conditions, and surface properties—on detection performance. Consequently, it reveals the optimal observation modes for “suppressing” background and “enhancing” target signals. The findings of this study can provide key theoretical foundations for the intelligent design of spaceborne MWIR hyperspectral imaging systems (e.g., optimizing observation timing, spectral bands, and geometric parameters) and for the precise application of this technology in complex scenarios such as mineral resource exploration.
2. Materials and Methods
2.1. Impact of Complex Terrain on Radiation Transfer and Associated Modeling Challenges
In hyperspectral remote sensing, the detection of mineral composition on complex mountainous terrain is subject to strong, coupled interference from multiple factors, including topography, the atmosphere, and surrounding surface features. These interferences are primarily manifested in the following three aspects:
(1) Topography-Atmosphere Coupling Effect: Terrain undulations alter atmospheric vertical profiles, thereby causing variations in atmospheric absorption, transmittance, and path radiance between target pixels at different locations in mountainous areas and the sensor.
(2) Redistribution of Solar Radiation: Rugged terrain leads to multiple reflections and mutual shadowing of direct solar and diffuse sky radiation among slopes, changing the composition of irradiance reaching the target pixel.
(3) Complexification of Thermal Radiation Paths: Terrain simultaneously attenuates atmospheric downwelling thermal radiation and increases the contribution of thermal radiation from surrounding terrain. Collectively, these effects cause dynamic differences in the radiation signals of targets and backgrounds across spatial, temporal, and spectral dimensions [14].
Consequently, accurately simulating at-sensor radiance necessitates constructing a physical model capable of coupling surface, atmospheric, and topographic geometric properties.
2.2. Surface Mixed Pixel Spectral Model
Natural surface minerals are often mixed with other materials, such as soil and vegetation. The reflectance spectrum of a mixed pixel is a linear combination of its constituent components. According to the linear mixing model, the spectrum of a mixed pixel is the linear sum of the spectra of its constituent endmembers. the mixed pixel reflectance for mid-wave infrared remote sensing can be expressed as:
In the formula, is the proportion of the i-th endmember area within the pixel, and is the reflectance of different endmembers. The proportions of the endmembers are subject to the constraint shown in the following formula:
where represents the areal proportion of the i-th endmember within the pixel, and is the reflectance of different endmembers. The proportions of the endmembers are subject to the following constraints:
2.3. Mid-Wave Infrared Radiative Transfer Model for Complex Terrain
To quantify how complex terrain modulates Mid-Wave Infrared (MWIR) hyperspectral remote sensing signals, this chapter establishes a radiance model at the sensor entrance pupil applicable to mountainous scenarios. Based on mountain radiative transfer theory and incorporating Digital Elevation Model (DEM) data, the model is developed under the Lambertian surface assumption. Under the Lambertian surface assumption, a radiance model applicable to mountainous scenarios at the sensor entrance pupil is established. This model systematically decouples six key radiation components under the influence of topographic relief (Figure 1), providing a physical foundation for subsequent analysis of the impact of terrain parameters on mineral detection [14,18].
Figure 1.
Schematic diagram of radiation components at the MWIR sensor entrance pupil over complex terrain: (a) Direct solar radiation; (b) Atmospheric diffuse skylight radiation; (c) Radiation emitted by the target; (d) Radiation reflected from the downward atmospheric thermal radiation by the target; (e) Reflected radiation from adjacent terrain; (f) Atmospheric path radiance.
2.3.1. General Model Framework
In complex terrain, the radiant energy received by the sensor is a complex coupling result of solar radiation, surface thermal emission, atmospheric radiation, and multiple reflections between terrain features. As shown in Figure 2, for daytime observations, the total radiance at the MWIR sensor entrance pupil can be modeled as the sum of the following six components:
where the six terms on the right-hand side of Equation (3) correspond to the aforementioned six radiation components in order: the direct solar radiation reflected by the surface , the diffuse skylight radiation reflected by the surface , the thermal radiation emitted by the surface , the downward atmospheric thermal radiation reflected by the surface , the radiation reflected from adjacent terrain , and the atmospheric path radiation .
Figure 2.
Comprehensive model diagram of MWIR sensor entrance pupil radiance composition.
2.3.2. Modeling of Individual Radiation Components
(1) Radiance of Reflected Direct Solar Radiation
The radiance of the direct solar radiation reflected by the surface and reaching the sensor can be expressed as:
where is the atmospheric downward transmittance from the sun to the target; and represent the solar zenith and azimuth angles, respectively; represents the reflectance of a horizontal surface; is the shadow factor, indicating whether the area is in shadow [31]; is the solar irradiance at the top of the atmosphere; and represent the satellite viewing zenith and azimuth angles, respectively; is the atmospheric upward transmittance from the target to the sensor.
The local solar incidence zenith angle is determined jointly by the terrain slope , aspect , and solar geometry (i.e., solar zenith angle and azimuth angle ) (Figure 3):
Figure 3.
Illumination geometry of a slope surface.
The slope and aspect can be directly calculated from DEM data:
(2) Radiance of Reflected Diffuse Skylight Radiation
The diffuse skylight radiance can be decomposed into an isotropic sky component and an anisotropic circumsolar component. The proportion of isotropic and anisotropic components can be derived using the “anisotropy index” (k) proposed by Hay [32]. This index represents the weight of circumsolar anisotropic scattering in the diffuse sky irradiance, calculated as the ratio of the direct solar irradiance received on a surface normal to the sun’s direction to the solar irradiance at the top of the atmosphere. The radiance of the reflected diffuse skylight radiation can be expressed as:
where is the downward diffuse solar irradiance on a horizontal surface; is the sky view factor, describing the proportion of diffuse skylight received by the target pixel. The calculation model for the sky view factor is shown in Figure 4 [33].
Figure 4.
Schematic diagram of the sky view factor calculation model under complex terrain: (a) Elevation angle of sky line-of-sight for the target pixel; (b) Sky line-of-sight for the target pixel under complex terrain.
The sky view factor is calculated as follows:
where is the vertical elevation angle of the i-th sky line-of-sight for the target pixel, n is the number of search directions. ranges from 0 to 1, representing the ratio of the sky area viewed from the slope pixel to that viewed from a horizontal plane. In this study, the number of search directions n is set to 36, and the search radius R is 3 km.
(3) Radiance of Self-emitted Thermal Radiation
According to Planck’s law and the Lambertian assumption, the thermal radiation emitted by the surface and reaching the sensor is:
where is the surface emissivity, is the blackbody spectral radiant exitance corresponding to the surface temperature , and is the upward atmospheric transmittance. For a Lambertian surface, the ratio of radiant exitance to radiance is .
(4) Radiance of Reflected Downward Atmospheric Thermal Radiation
The radiance of the reflected downward atmospheric thermal radiation is:
where is the downward atmospheric thermal irradiance.
(5) Radiance of Reflected Radiation from Adjacent Terrain
The radiation reflected from adjacent terrain depends on four factors: the total radiation reaching the adjacent slope, the visible range of adjacent terrain, the surface reflectance of adjacent terrain, and the distance between the target pixel and the adjacent slope. Its radiance can be expressed as [18,34]:
where is the terrain view factor (the ratio of the adjacent terrain area viewed from the slope pixel to that viewed from an unobstructed horizontal plane); is the total irradiance received on a flat ground, expressed as:
includes the reflected direct solar radiation, reflected diffuse skylight, self-emitted thermal radiation, and reflected downward thermal radiation from the ground; is the average reflectance of the adjacent surface.
(6) Path Radiance
The path radiation refers to the radiation contribution of the atmospheric path itself, including the atmospheric upward thermal emission and the upward scattered solar radiation [17], obtained from MODTRAN simulation data.
2.3.3. Observation Model Under Non-Illuminated (Nighttime) Conditions
Under non-illuminated (nighttime) observation scenarios, the contribution of solar radiation is zero. Therefore, the total radiance model described by Equation (3) does not include terms for solar radiation. Correspondingly, the first two terms in Equation (13) for are also zero, and the path radiation in Equation (14) retains only the atmospheric upward thermal emission part .
Consequently, the radiant energy incident on the sensor entrance pupil is completely dominated by infrared thermal radiation. It mainly includes the target’s self-emitted thermal radiation, the target-reflected downward atmospheric thermal radiation, the target-reflected radiation from adjacent terrain (including the self-emitted thermal radiation of adjacent objects and their reflected downward atmospheric thermal radiation), and atmospheric path radiation (which contains only upward thermal emission).
At this time, the total radiance at the sensor entrance pupil is expressed as follows:
where is the total irradiance received on flat ground under non-illuminated (nighttime) conditions, expressed as:
2.4. Data Analysis Method
To systematically evaluate the impact of different detection conditions on the detectability of mineral targets, this study employs a control variable method for simulation analysis. The analysis is based on the radiative transfer model established in Section 2.3. By individually varying specific environmental or geometric parameters, the impact of these parameters on the target and background radiation signals at the sensor entrance pupil is quantified. When analyzing the influence of a single detection parameter, each simulation calculation changes only that parameter’s value, while the others are set to predefined fixed input values. This set of fixed input parameters represents the typical surface and atmospheric conditions of the simulation area.
The analysis steps are as follows:
(1) For each varying parameter value, calculate the total MWIR band radiance at the top of the atmosphere (TOA) for the target pixel and the background pixel, respectively. Here, the background radiance is taken as the arithmetic mean of the radiances of the eight neighboring pixels surrounding the target pixel, to represent the average level of the local environment.
(2) To quantitatively characterize the radiation difference between the target and the background, and ultimately evaluate detection performance, this study defines the relative contrast as the core evaluation metric. Its calculation formula is:
where is the radiance of the target pixel. To more clearly and quantitatively describe the impact of detection parameter changes on relative contrast, the relative contrast difference is calculated as the difference in relative contrast relative to a given reference level. The complete calculation flowchart is shown in Figure 5.
Figure 5.
Calculation flowchart.
3. Results
This study selected the Qaidam Basin in China as the simulation area. Encircled by mountains, the basin features significant internal relief (up to 3854 m) and pronounced vertical zonation, providing a representative complex-terrain scenario for investigating topographic effects on radiative transfer. Furthermore, the basin is mineral-rich, and the spectral characteristics of its typical minerals (e.g., evaporites) are well documented, providing a solid empirical basis for simulation [35]. As most mining districts in the Qaidam Basin are situated in complex mountainous terrain, a representative valley area (91.544° E, 37.403° N) was selected for detailed analysis. A 30 m resolution Digital Elevation Model (DEM) [36] was used to derive key topographic factors, including slope and aspect. As shown in Figure 6, a black triangular symbol denotes the location of this study site on the corresponding DEM, slope, and aspect maps.
Figure 6.
Topographic factors of the simulation area: (a) DEM; (b) Slope; (c) Aspect. The black triangular symbol in each subplot indicates the spatial location of the specific study site (91.544° E, 37.403° N).
Atmospheric data were generated via simulation using the MODTRAN radiative transfer model [17], including atmospheric transmittance, path thermal radiation, and solar scattered radiation. Atmospheric transmittance includes total atmospheric transmittance, atmospheric upward transmittance, and atmospheric downward transmittance. Path thermal radiation includes upward and downward fluxes, namely atmospheric upward thermal radiation and atmospheric downward thermal radiation, respectively. Solar scattered radiation comprises upward and downward fluxes, namely upward and downward atmospheric scattered solar radiation, respectively.
To simulate realistic mineral-detection scenarios, it is necessary to specify the surface endmember composition, spectral properties, and target background configuration. First, the endmember composition and abundance were referenced from regional geological data. The mixed mineral composition was set to 40% calcite, 35% halite, and 25% illite [37], while the background surface was defined as a typical mixture of soil and vegetation [38]. Second, the target background configuration was defined as follows: the target pixel consists of “40% mixed minerals + 30% soil + 30% vegetation,” and the background pixel consists of “50% soil + 50% vegetation.” Finally, spectral data for all endmembers were sourced from the ASTER and USGS spectral libraries [39,40]. The reflectance spectra of the target and background pixels are shown in Figure 7. Based on the aforementioned data and parameter settings, systematic simulation experiments were conducted using the control-variable method and the contrast-calculation process described in Section 2.4. Specific results and analysis will be detailed in Section 4.
Figure 7.
Reflectance of the target and background pixels.
3.1. The Influence of Illumination and Geometric Parameters on Relative Contrast
3.1.1. Analysis of Relative Contrast Under Illuminated and Non-Illuminated Conditions
The radiance and relative contrast () for the simulated mineral target and background pixels were calculated under illuminated (daytime) and non-illuminated (nighttime) conditions. The specific parameter settings are listed in Table 1. Unless otherwise specified, subsequent analyses use the default parameter values listed in Table 1. Figure 8 shows that near 2.83–4.2 μm, the under illuminated conditions is significantly higher than that under non-illuminated conditions, reaching a maximum of 5.97. This indicates that for the target background combination in this study, daytime observation is significantly superior to nighttime observation.
Table 1.
Parameter settings for radiative transfer calculations.
Figure 8.
Relative contrast () between the target and background under illuminated (daytime) and non-illuminated (nighttime) conditions.
As shown in Figure 9, the radiance difference between the target and background under non-illuminated conditions is only about 0.13 W·m−2·sr−1·μm−1 at most. In contrast, under illuminated conditions, this difference surges to 1.42 W·m−2·sr−1·μm−1, an increase of over an order of magnitude. The physical origin of this significant difference lies in the fact that the introduction of illumination fundamentally alters the composition mechanism of the radiance signal at the entrance pupil. Under non-illuminated conditions, the signal consists solely of surface self-emitted thermal radiation and atmospheric path radiance. According to Kirchhoff’s law, the background (soil, vegetation) has a higher emissivity than the mineral target, allowing its thermal emission component to dominate (Figure 10). This results in the target appearing as a “cold target” with an extremely low signal-to-noise ratio in the thermal radiation dimension. However, under illuminated conditions, the solar reflection component becomes dominant. Since the mixed minerals within the target pixel have higher reflectance, the direct solar radiation reflected from them is significantly enhanced. This not only completely offsets their thermal-emission disadvantage but also transforms them into “bright targets” with radiance notably higher than the background in reflection-sensitive spectral bands. This is the direct cause of the order-of-magnitude increase in .
Figure 9.
Radiance comparison under different illumination conditions: (a) Radiance of the target and background pixels under illuminated conditions; (b) Radiance of the target and background pixels under non-illuminated conditions; (c) Comparison of the radiance difference between illuminated and non-illuminated conditions (target pixel value minus background pixel value).
Figure 10.
Composition of radiation components for the target and background pixels under non-illuminated conditions: (a) Target pixel; (b) Background pixel. The figure shows the main components present under this condition: R3 (surface self-emitted thermal radiation), R4 (surface-reflected downward atmospheric thermal radiation), R5 (surface-reflected radiation from adjacent terrain), and R6 (atmospheric path radiance). Components R1 (reflected direct solar radiation) and R2 (reflected diffuse skylight radiation) are zero and therefore not shown (the definitions of each component are consistent throughout the text).
3.1.2. Analysis of Relative Contrast Under Different Solar Zenith Angles
To investigate the influence of the solar zenith angle () on the performance of MWIR hyperspectral mineral detection, this study conducted simulation experiments with ranging from 0° to 75° at intervals of 15°, and calculated the corresponding relative contrast (). The results are shown in Figure 11.
Figure 11.
(a) Relative contrast () and (b) difference (relative to the baseline at ) under different solar zenith angles ().
From Figure 11 shows that changes little when increases from 0° to 45°. However, when varies from 45° to 75°, begins to decrease significantly, with intensified fluctuations particularly within the 2.82–4.2 μm spectral range. To quantify this change, we calculated the difference relative to the baseline at . As shown in Figure 11b, the difference exhibits a typical “oscillatory” feature in the 2.8–3.5 μm spectral range. Its value increases monotonically with increasing , reaching a peak of approximately 3.55 at 2.97 μm (corresponding to the curve). This indicates that smaller angles are favorable for enhancing the radiation difference between the target and the background, thereby improving detection sensitivity.
The physical mechanism underlying the decrease in with increasing primarily stems from the enhancement of atmospheric path effects. An increase in leads to a longer atmospheric path length traversed by solar radiation, which, in turn, intensifies atmospheric absorption and scattering, resulting in decreased atmospheric transmittance. Quantitative analysis (Figure 12) shows that when increases from 0° to 45°, the radiance of the target pixel decreases by no more than 0.10 W·m−2·sr−1·μm−1 within the 2.82–4.2 μm spectral range. However, when increases to 75°, the maximum reduction in the radiance of the target pixel can reach up to 0.52 W·m−2·sr−1·μm−1 (Figure 12b). Further deconstruction of the radiation components (Figure 13 and Figure 14) reveals that as increases, the reflected direct solar component, which is crucial for contributing to , attenuates significantly. Its proportion in the total radiance also decreases markedly, which is the main reason for the degradation of .
Figure 12.
Reduction in radiance of the target and background pixels under different solar zenith angles () (relative to the baseline at ): (a) Reduction at (0° value minus 45° value); (b) Reduction at (0° value minus 75° value).
Figure 13.
Radiance of different components for the target pixel under different solar zenith angles (): (a) ; (b) .
Figure 14.
Percentage of total radiance contributed by different components for the target pixel under different solar zenith angles (): (a) ; (b) .
3.1.3. Analysis of Relative Contrast Under Different Viewing Zenith Angles
To systematically evaluate the impact of viewing geometry on detection performance, this study further analyzed the influence of the viewing zenith angle (). Simulations were conducted with ranging from 0° to 75° at 15° intervals, and the corresponding relative contrast () was calculated. The results are shown in Figure 15.
Figure 15.
Relative contrast () and its difference under different viewing zenith angles () (relative to the baseline at ): (a) Relative contrast (); (b) Relative contrast difference.
Figure 15a shows that changes gently when is within the 0–45° range; however, once exceeds 45°, decreases significantly, with particularly noticeable fluctuations in the 2.82–4.2 μm spectral range. To quantify this change, the difference relative to the baseline at was calculated, as shown in Figure 15b. The difference curve exhibits a significant “oscillatory” feature in the 2.8–3.35 μm spectral range, and its value increases monotonically with increasing , reaching a peak of approximately 3.55 at 2.97 μm (corresponding to the curve). This indicates that a smaller can effectively enhance the radiation contrast between the target and the background, consistent with the observed influence pattern as a function of the solar zenith angle ().
Figure 16 shows the radiance of the target and background pixels under different . Quantitative analysis of the radiance of the target pixel (Figure 17) reveals that when increases from 0° to 45°, the maximum reduction in the radiance of the target pixel within the 2.82–4.2 μm spectral range is merely 0.10 W·m−2·sr−1·μm−1 (Figure 17a); however, when increases to 75°, the maximum reduction rises sharply to 0.58 W·m−2·sr−1·μm−1 (Figure 17b).
Figure 16.
Radiance of the target and background under different viewing zenith angles (): (a) ; (b) ; (c) .
Figure 17.
Reduction in radiance of the target and background pixels under different viewing zenith angles () (relative to the baseline at ): (a) Reduction at (0° value minus 45° value); (b) Reduction at (0° value minus 75° value).
The physical mechanism underlying the decrease in with increasing similarly originates from the enhancement of atmospheric path effects. Deconstruction analysis of the radiation components (Figure 18 and Figure 19) further reveals that as increases, both the reflected direct solar component and the surface self-emitted thermal radiation component—which are most critical for contributing to —are significantly attenuated. Their proportion in the total radiance decreases markedly, while the contribution proportion of atmospheric path radiance increases significantly.
Figure 18.
Radiation components for the target pixel under different viewing zenith angles (): (a) ; (b) .
Figure 19.
Proportion of total radiance contributed by different components for the target pixel under different viewing zenith angles (): (a) ; (b) .
3.2. Influence of Surface and Atmospheric Parameters on Relative Contrast
3.2.1. Analysis of Relative Contrast Under Different Surface Temperatures
Based on the surface temperature range of the Qaidam Basin [41], this study set the temperature () simulation interval from 280 K to 320 K, evenly divided into five groups, to analyze its impact on the target background relative contrast (). The results are shown in Figure 20.
Figure 20.
Relative contrast and its difference under different surface temperatures (): (a) Relative contrast (); (b) difference (relative to the baseline at ).
Figure 20a shows that decreases monotonically with increasing , with significant fluctuations within the 2.83–4.17 μm spectral range. To quantify this change, the difference relative to the baseline at was calculated. As shown in Figure 20b, the difference exhibits an “arched” feature in the 2.83–4.17 μm spectral range. A lower results in a larger difference, reaching a peak (approximately 2.5) at 3.04 μm. This indicates that a lower surface temperature is conducive to achieving higher target background contrast.
As shown in Figure 21, within the 2.5–4.17 μm spectral range, the condition always holds; therefore, can be simplified as:
Figure 21.
Radiance and its difference under different surface temperatures (): (a) ; (b) ; (c) Radiance difference between the target and background pixels at and 320 K (320 K value minus 280 K value).
Deconstruction analysis of the radiance components (Figure 22 and Figure 23) reveals the intrinsic mechanism by which influences : as increases, both the absolute value and the proportion of the surface self-emitted thermal radiation component (R3) increase substantially, while the proportion of the reflected direct solar component (R1) decreases correspondingly. Since the background pixels (soil, vegetation) have higher emissivity than the mineral target, both the proportion and sensitivity to of their R3 component are stronger. Consequently, when decreases, attenuates faster than , leading to an increase in the ratio , and thereby enhancing . Therefore, although a higher provides a stronger absolute radiation signal, background radiation increases with temperature, leading to a decrease in . Conversely, under a lower , although the absolute signal received is weaker, the higher facilitates target identification based on radiative characteristics.
Figure 22.
Composition of radiation components for the target and background pixels under different surface temperatures (): (a) , target pixel; (b) , target pixel; (c) , background pixel; (d) , background pixel.
Figure 23.
Proportion of total radiance contributed by different components for the target and background pixels under different surface temperatures (): (a) , target pixel; (b) , target pixel; (c) , background pixel; (d) , background pixel.
3.2.2. Analysis of Relative Contrast Under Different Aerosol Optical Depths
To assess the influence of aerosols on detection performance, this study referenced the typical range of Aerosol Optical Depth (AOD) in the Qaidam Basin [42]. Simulations were conducted with AOD values ranging from 0.1 to 0.6 at intervals of 0.1, and the corresponding relative contrast () was calculated. The results are shown in Figure 24.
Figure 24.
and its difference under different Aerosol Optical Depths (AOD): (a) ; (b) difference (relative to the baseline at AOD = 0.6).
Figure 24a indicates that slightly decreases as AOD increases, with certain fluctuations observed within the 2.83–4.17 μm spectral range. Overall, however, the absolute impact of AOD on is relatively limited. To quantify the trend, the difference relative to the baseline at AOD = 0.6 was calculated. As shown in Figure 24b, the difference curve exhibits an “arched” feature. A lower AOD results in a larger difference, reaching a peak (approximately 0.25) at 2.98 μm. This suggests that a lower AOD is beneficial for obtaining slightly higher target background contrast.
The direct impact of AOD variation on the radiance at the sensor entrance pupil is also minor. As shown in Figure 25, when AOD increases from 0.1 to 0.6, the maximum decrease in the radiance of the target pixel () is only 0.14 W·m−2·sr−1·μm−1, while the maximum decrease for the background pixel () is 0.058 W·m−2·sr−1·μm−1. However, changes in AOD significantly reconfigure the contribution pattern of individual components within the radiative transfer path. Deconstruction analysis of the radiation components (Figure 26 and Figure 27) reveals that an increase in AOD exerts opposing effects on different radiation components [43]: (1) Weakening the direct-path signal: An increased AOD leads to reduced atmospheric transmittance. The absorption and scattering by aerosols significantly attenuate both the direct solar radiation reaching the surface (component R1) and the upward thermal radiation emitted by the surface (component R3). (2) Enhancing the scattering-path contribution: Simultaneously, an increased AOD enhances atmospheric scattering of solar radiation (particularly Mie forward scattering), leading to increased diffuse sky irradiance reaching the surface. Consequently, the proportion of the surface-reflected diffuse skylight component (R2) in the total reflected radiation increases significantly (Figure 27).
Figure 25.
Radiance and its difference under different Aerosol Optical Depths (AOD): (a) AOD = 0.1; (b) AOD = 0.6; (c) Radiance difference between the conditions at AOD = 0.1 and AOD = 0.6 (AOD = 0.1 value minus AOD = 0.6 value).
Figure 26.
Composition of radiation components for the target pixel under different Aerosol Optical Depths (AOD): (a) AOD = 0.1; (b) AOD = 0.6.
Figure 27.
Proportion of total radiance contributed by different components for the target pixel under different Aerosol Optical Depths (AOD): (a) AOD = 0.1; (b) AOD = 0.6.
3.2.3. Analysis of Relative Contrast Under Different Elevations
To investigate the influence of topographic elevation on detection performance, this study, based on the terrain of the simulation area, set the elevation (denoted as ) to vary from 3.7 km to 5.2 km at intervals of 0.5 km for simulations and calculated the corresponding relative contrast (). The results are shown in Figure 28.
Figure 28.
Relative contrast and its difference under different elevations (): (a) Relative contrast (); (b) difference (relative to the baseline at ).
Figure 28a indicates that increases monotonically with increasing elevation h, with noticeable fluctuations within the 2.82–4.2 μm spectral range. To quantify this change, the difference relative to the baseline at was calculated. As shown in Figure 28b, the difference curve exhibits an “oscillatory” feature in the 2.82–3.35 μm band. A higher results in a larger difference, reaching a peak (approximately 1.37) at 2.85 μm. This suggests that for the target background combination in this study, mineral targets located at higher altitudes possess better detectability.
The overall impact of increasing on the radiance at the sensor entrance pupil is minor but exhibits complex trends. As shown in Figure 29, when increases from 3.7 km to 5.2 km, the maximum increase in the radiance of the target pixel () is 0.35 W·m−2·sr−1·μm−1, while the maximum increase for the background pixel () is 0.16 W·m−2·sr−1·μm−1. However, within the 4.7–5 μm band, the radiance of the target and background pixels, in contrast, shows a decreasing trend (Figure 29c). This phenomenon stems from the dual effects of elevation change on atmospheric processes (Figure 30 and Figure 31): an increase in leads to a reduction in atmospheric column density. On one hand, this increases atmospheric transmittance, favoring the transmission of surface-reflected and emitted signals. On the other hand, it significantly weakens both the thermal emission from the atmospheric path itself (path radiance, R6) and the downward atmospheric thermal radiation (R4).
Figure 29.
Radiance and its difference under different elevations (): (a) Radiance of the target and background pixels at ; (b) Radiance of the target and background pixels at ; (c) Radiance difference between the conditions at and (5.2 km value minus 3.7 km value).
Figure 30.
Composition of radiation components for the target pixel under different elevations (): (a) ; (b) .
Figure 31.
Proportion of total radiance contributed by different components for the target pixel under different elevations (): (a) ; (b) .
3.2.4. Analysis of Relative Contrast Under Different Water Vapor Contents
To investigate the influence of atmospheric water vapor content on detection performance, this study referenced the typical range of Water Vapor Content (WVC) in the Qaidam Basin [44]. Simulations were conducted with WVC values ranging from 0.3 g·cm−2 to 1.5 g·cm−2 at intervals of 0.3 g·cm−2, and the corresponding relative contrast () was calculated. The results are shown in Figure 32.
Figure 32.
Relative contrast () and its difference under different Water Vapor Contents (WVC): (a) ; (b) difference (relative to the baseline at WVC = 0.3 g·cm−2).
Figure 32a indicates that decreases significantly as WVC increases, with considerable fluctuations observed within the 2.83–4.2 μm spectral range. To quantify this change, the difference relative to the baseline at WVC = 0.3 g·cm−2 was calculated. As shown in Figure 32b, the difference curve exhibits a distinct “oscillatory” feature in the 2.8–3.3 μm spectral range. A lower WVC results in a larger difference, reaching a peak (approximately 4.47) at 2.97 μm. This suggests that lower water vapor content can significantly enhance target background contrast, which is beneficial for mineral detection.
Increasing WVC has a pronounced attenuating effect on the radiance at the sensor entrance pupil. As shown in Figure 33, when WVC increases from 0.3 g·cm−2 to 1.5 g·cm−2, the radiance of the target pixel () decreases by a maximum of 0.87 W·m−2·sr−1·μm−1 within the 2.83–4.2 μm spectral range, while the radiance of the background pixel () decreases by a maximum of 0.33 W·m−2·sr−1·μm−1. This phenomenon arises because increased WVC reduces atmospheric transmittance. Deconstruction analysis of the radiation components (Figure 34 and Figure 35) further reveals the underlying mechanism: as WVC increases, (1) in the 2.8–3.3 μm band, water vapor absorption causes marked attenuation of the surface-reflected direct solar component (R1), with its proportion in the total radiance decreasing significantly; (2) in the 4.6–5 μm band, the surface self-emitted component (R3) is also significantly attenuated by water vapor absorption, with its proportion likewise decreasing. Meanwhile, the relative contribution of the atmospheric path radiance component (R6) increases.
Figure 33.
Radiance and its difference under different Water Vapor Contents (WVC): (a) Radiance of the target and background pixels at WVC = 0.3 g·cm−2; (b) Radiance of the target and background pixels at WVC = 1.5 g·cm−2; (c) Variation in radiance of the target and background pixels with water vapor content (WVC = 0.3 g·cm−2 value minus WVC = 1.5 g·cm−2 value).
Figure 34.
Composition of radiation components for the target pixel under different Water Vapor Contents (WVC): (a) WVC = 0.3 g·cm−2; (b) WVC = 1.5 g·cm−2.
Figure 35.
Proportion of total radiance contributed by different components for the target pixel under different Water Vapor Contents (WVC): (a) WVC = 0.3 g·cm−2; (b) WVC = 1.5 g·cm−2.
3.3. Comprehensive Analysis of Optimal Observation Mode Based on Radiation Contrast Efficacy
To evaluate the synergistic optimization efficacy of multiple parameters, this study conducted simulation comparisons for two representative observation scenarios in the Qaidam Basin: a midday scenario in autumn/winter integrating multiple favorable conditions, and a nighttime scenario in summer combining multiple unfavorable conditions. The specific parameter settings are detailed in Table 2.
Table 2.
Parameter settings for radiative transfer calculations under different observation times.
Figure 36 shows that the C_R value for the midday autumn/winter scenario is increased by up to 6.29 compared to the summer nighttime scenario. Figure 37 further reveals substantial differences at the radiance level: the maximum radiance difference between the target and background reaches 2.06 W·m−2·sr−1·μm−1 during midday autumn/winter, whereas it is only 0.17 W·m−2·sr−1·μm−1 at most during summer nights.
Figure 36.
Relative contrast () for midday autumn/winter and summer nighttime scenarios.
Figure 37.
Radiance comparison under different observation times: (a) Radiance of the target and background pixels during midday in autumn/winter; (b) Radiance of the target and background pixels during summer nighttime; (c) Comparison of the radiance differences between the target and background (midday in autumn/winter vs. summer nighttime).
Decomposition of the radiance components at the sensor entrance pupil (Figure 38, Figure 39, Figure 40 and Figure 41) clearly illustrates the fundamental differences in signal composition between the two scenarios. During midday autumn/winter, the reflected direct solar component (R1) is the primary contributor to the total radiance of the target pixel. In contrast, during summer nights, the signal is dominated by surface self-emitted thermal radiation (R3).
Figure 38.
Composition of radiation components for the target and background pixels during midday autumn/winter: (a) Target pixel; (b) Background pixel.
Figure 39.
Proportion of total radiance contributed by different components for the target and background pixels during midday autumn/winter: (a) Target pixel; (b) Background pixel.
Figure 40.
Composition of radiation components for the target and background pixels during summer nighttime: (a) Target pixel; (b) Background pixel.
Figure 41.
Proportion of total radiance contributed by different components for the target and background pixels during summer nighttime: (a) Target pixel; (b) Background pixel.
4. Discussion
4.1. Methodological Limitations
The coupled terrain–atmosphere–target radiative transfer model constructed in this study (Section 2.3) encompasses the six main radiation components of sensor-reaching radiance over complex terrain. However, the model contains several key assumptions whose applicability and potential errors require explicit discussion to enhance the transparency and reliability of the results.
First, regarding the applicability of the Lambertian surface assumption. This model assumes an ideal Lambertian surface, meaning that reflected radiation is uniformly distributed in all directions. This assumption is commonly adopted for rough surfaces and moderate observation scales, but caution is needed in MWIR mineral detection scenarios. Crystalline minerals (e.g., calcite, halite) and smooth rock surfaces may exhibit significant anisotropic reflectance characteristics, particularly in specular reflection directions. Existing studies have shown that adopting the Lambertian assumption while ignoring anisotropic reflectance/emission in complex terrain can introduce non-negligible errors in radiative transfer and brightness temperature retrieval [45,46,47,48]. Based on a synthesis of these studies, it can be concluded that under typical observation geometries and moderate viewing zenith angles, the Lambertian approximation generally yields radiance estimates of the same order of magnitude as anisotropic models. However, when viewing zenith angles are large, terrain is rugged, or surface reflection anisotropy is significant, errors are expected to amplify considerably, warranting correction using a Bidirectional Reflectance Distribution Function (BRDF) model [45,46,47,48]. This assessment is consistent with the general understanding of topographic effects and anisotropic treatment in mountain remote sensing [48]. Therefore, the conclusions of this study have good applicability for various common lithologies within the range of moderate viewing zenith angles. However, when subsequently utilizing large-angle observation data or targeting highly anisotropic minerals (e.g., smooth rock surfaces, crystalline salts), it is necessary to introduce BRDF models to correct the Lambertian assumption.
Second, regarding the potential impact of the linear spectral mixing model. This study employs a linear mixing model (Equation (2)) to construct the reflectance of target and background pixels. Within the reflection-dominated 2.5–3.5 μm sub-band on the shorter-wavelength side of the MWIR, this model generally serves as a reasonable first-order approximation. However, when extending the analysis to the entire 3–5 μm range, particularly in the emission-dominated 4.5–5 μm interval where reflection and thermal emission mechanisms coexist and interact, the linear mixing assumption faces two main challenges: (1) in the emission-dominated 4.5–5 μm band, multiple scattering effects can lead to nonlinear mixing; (2) when significant temperature heterogeneity exists within a pixel, the superposition of emitted radiation no longer satisfies a simple linear relationship due to the strong nonlinearity of the Planck function. Regarding mixed pixel modeling itself, existing research has delved into the applicability of the linear assumption. Gillespie et al., in their study on thermal infrared multispectral temperature/emissivity separation, pointed out that nonlinear effects caused by intra-pixel temperature variations can lead to appreciable radiation deviations, with magnitudes reaching several percentage points or more in typical scenarios [49]. Hapke’s theoretical analysis of radiative transfer models indicates that under conditions of significant multiple scattering (e.g., rough surfaces or high-reflectance components), the linear mixing assumption systematically underestimates reflectance/emissivity [50]. Qiu et al., in their study on visible-to-thermal infrared radiative transfer over complex terrain, considered multiple factors including topography, adjacency effects, linear mixing, and atmospheric parameterization, reporting TOA radiance RMSEs of 3–17% (summer) and 6–38% (winter). This error range reflects the combined influence of multiple simplifying assumptions; although their work did not isolate individual contributions, nonlinear mixing and multiple scattering processes are likely significant error sources in complex, non-isothermal terrain scenarios [17]. The error magnitudes reported in these studies provide an important reference for understanding the potential impact of the linear mixing assumption in complex scenes. In summary, the linear spectral mixing model provides a reasonable first-order approximation for target background contrast analysis in complex terrain MWIR scenarios while ensuring computational efficiency. It is within this framework that the present study systematically evaluates the influence of various observational and environmental parameters on mineral detection efficacy. Building on this foundation, for specific inversion applications requiring higher quantitative accuracy (e.g., mineral abundance estimation or sub-pixel temperature/emissivity retrieval), a more prudent approach is to incorporate nonlinear mixing models (such as the Hapke model or 3D radiative transfer models) for cross-validation alongside the traditional linear mixing framework, thereby quantitatively assessing the specific impact of the linear assumption on inversion results.
Third, regarding the uncertainty associated with the simplified treatment of adjacent terrain radiation. This model simplifies adjacent terrain radiation using an expression based on the average albedo and the terrain view factor (Equations (12) and (13)), without explicitly considering the geometric details and spectral heterogeneity of neighboring slopes. Numerous studies indicate that such simplification can introduce significant errors in the complex radiation field of mountainous areas [45,46,48]. For example, Qiu et al., while simulating visible-to-thermal infrared BOA/TOA radiation in complex terrain using a terrain view factor convolution kernel and incorporating terrain “trapping effects” and atmospheric adjacency terms, still obtained TOA radiance RMSEs of 3–17% (summer) and 6–38% (winter) in desert-mountain scenarios [17]. Shi and Xiao’s composite slope analysis showed that using planar or single-slope approximations, neglecting contributions from adjacent slopes, introduces significant biases in surface reflectance and directional brightness temperature [45]. Robledano et al.’s study on the energy budget of snow-covered mountain surfaces further indicated that failing to explicitly consider longwave radiation from surrounding terrain can systematically underestimate local surface temperature by approximately 1.2 K [46]. On the other hand, research on mountainous land surface temperature (LST) retrieval also confirms the importance of topographic radiation correction: series studies by He et al. [51,52,53] and Xue et al. [48] demonstrate that introducing sky view factor (SVF), self-heating parameter (SSP), and mountain thermal infrared transmission models can significantly reduce LST bias in mountainous areas—for instance, using FY-3D MERSI-II data, the bias between topographically corrected LST and ground stations is approximately −0.70 K, with an RMSE of about 1.49 K [48]. Regarding the accurate simulation of surface downward longwave radiation, the topographic correction parameterization scheme proposed by Yang et al., validated using the DART model, showed a bias of −12.8 W/m2 and an RMSE of 28.2 W/m2 compared to a fine radiative transfer model. The difference before and after topographic correction reached up to 67 W/m2 during the day and 54 W/m2 at night. Further validation at ground stations indicated that introducing topographic correction reduced the mean bias by 7.4 W/m2 and the RMSE by 4.1 W/m2 [54]. These studies collectively demonstrate that in topographically complex regions, simplified treatment of adjacent radiation can lead to temperature errors on the order of several K or radiance biases on the order of tens of W/m2. Under the moderate topographic relief conditions of the Qaidam Basin that are the focus of this study, the aforementioned simplification is sufficient to support qualitative analysis of target background contrast trends. However, when extending to extremely complex terrain such as steep canyons, a more prudent approach is to employ explicit multiple scattering calculations based on ray tracing, 3D radiative transfer models (e.g., DART), or discrete ordinates methods to obtain more accurate quantitative results [53,54].
The above discussion clarifies the boundary conditions and main error sources of this study, providing a basis for the subsequent reasonable interpretation of results and the evaluation of the full-link collaborative optimization effectiveness.
4.2. Validation of Comprehensive Effectiveness and Mechanism Analysis
To validate the comprehensive efficacy of the synergistic optimization across the entire radiative pathway, this study designed comparative scenarios for midday in autumn/winter and nighttime in summer based on seasonal environmental variations in the Qaidam Basin. The region exhibits higher Aerosol Optical Depth (AOD) in spring and summer, with lower and more stable AOD in autumn and winter [42]; absolute humidity peaks in summer and reaches its minimum in winter [44]. The autumn/winter midday scenario integrates all key favorable conditions identified in the preceding analyses—low temperature, low AOD, low water vapor content, and a moderate solar zenith angle—while the summer nighttime scenario incorporates nearly all unfavorable factors.
Under the optimal conditions (autumn/winter midday), the target background relative contrast () can be up to 6.29 times higher than that in the summer nighttime scenario. This finding validates the effectiveness of the “full-link background radiation suppression” framework, demonstrating that synergistic optimization of multi-dimensional parameters can effectively suppress background radiation while significantly enhancing the target signal. Compared to previous studies that often focused on flat terrain or single parameters, this research introduces a “full-link” systemic perspective into complex terrain scenarios, coupling the multi-dimensional interactions of terrain, atmosphere, and surface properties. This provides a more holistic optimization strategy for detection task planning in complex environments.
The advantage of daytime detection efficacy fundamentally lies in the introduction of solar illumination, which radically alters the competitive landscape of signals. During autumn/winter midday, the direct solar reflection component (R1) from the highly reflective mineral target becomes the dominant signal, transforming it from a “cold target” with lower emissivity in the thermal infrared dimension into a “bright target” with significant radiance in the mid-wave infrared reflection dimension. In contrast, during summer nights, detection relies solely on the weak differential of self-emitted thermal radiation (R3), and the background (soil, vegetation) typically exhibits higher emissivity, resulting in an extremely low signal-to-noise ratio. Furthermore, the low surface temperature () effectively suppresses the intensity of background thermal radiation; low Aerosol Optical Depth (AOD) and low Water Vapor Content (WVC) reduce atmospheric absorption and scattering losses, thereby improving signal transmittance; and moderate solar and viewing zenith angles (, ) ensure sufficient illumination while avoiding excessive attenuation from overly long atmospheric paths. These factors do not act in isolation but are coupled through the “full-link” to collectively suppress background radiation and path interference, thereby maximizing the target signal beneficial for detection.
The optimization strategy derived from this study—“prioritizing observation during midday in autumn/winter”—provides direct and actionable guidance for the planning of spaceborne/airborne MWIR hyperspectral mineral detection missions. This strategy is a concrete application of the “full-link radiation suppression” concept, representing a shift from the traditional “post-data-acquisition processing” model towards an “active observation design based on environmental awareness” paradigm.
4.3. Future Research Directions
Based on the above discussion, future research can be pursued in the following four aspects.
First, develop a finely coupled radiative transfer model integrating BRDF and topographic multiple scattering, and introduce a dynamic atmospheric constraint mechanism. Addressing the two main sources of error identified in this paper—the Lambertian assumption and the simplification of adjacent terrain—subsequent research will build upon the six-component surface-atmosphere radiative transfer model constructed in this study (Equation (3)) and further introduce a dynamic atmospheric constraint mechanism. Specifically, key atmospheric parameters such as aerosol optical depth and water vapor content, retrieved from spaceborne atmospheric detection products (e.g., MODIS atmospheric products) and reanalysis data (e.g., ERA5), will be comprehensively utilized to apply quasi-real-time dynamic constraints to the atmospheric state at the observation time, replacing traditional static atmospheric profile inputs. Simultaneously, higher-resolution DEM data will be employed to accurately calculate topographic parameters such as slope, aspect, and sky view factor, providing a more detailed geometric basis for topographic radiation correction. By introducing laboratory BRDF measurement data for typical minerals and combining it with multi-angle remote sensing observations to retrieve surface BRDF characteristics, physical modeling and cross-validation of anisotropic reflectance can be achieved, thereby overcoming the limitations of the Lambertian assumption. Furthermore, explicit multiple scattering calculations based on ray tracing or 3D radiative transfer models (e.g., DART) will be introduced to quantitatively assess and correct the impact of simplifications like the adjacent terrain assumption on target background radiance contrast, making radiative transfer simulations more consistent with actual observation conditions.
Second, extend this optimization framework to broader geological and environmental scenarios, and conduct intelligent mission planning research. The conclusions of this study are based on specific mineral assemblages (calcite, halite, illite) and climatic conditions in the Qaidam Basin, and their generalizability requires further validation. Future research plans to conduct comparative analyses in multiple typical mineral exploration areas globally (e.g., arid zones, high-altitude mountainous areas, tropical rainforests) to test the applicability and robustness of the “full-link background radiation suppression” framework under different mineral types, atmospheric conditions, and levels of topographic complexity. Simultaneously, based on the observation condition optimization strategy proposed in this study (see Section 3.3), intelligent observation time window selection methods will be developed, prioritizing periods that simultaneously satisfy low temperature, low AOD, low water vapor content, and moderate solar elevation angle. For example, in the Qaidam Basin that is the focus of this study, midday in autumn and winter serves as a natural integration window for these favorable conditions. In terms of sensor configuration, sensors with adjustable viewing angles can be configured to control the viewing zenith angle within the 0–45° range, suppressing signal attenuation and path effects caused by large observation angles. Based on the spectral characteristics of target minerals, band optimization will be carried out, prioritizing spectral intervals with weak water vapor absorption and dominated by solar reflection (e.g., 3.3–4.2 μm) as primary detection channels to enhance detection efficiency under complex atmospheric conditions.
Third, conduct empirical validation and develop intelligent algorithms using measured MWIR hyperspectral data. Current research conclusions are primarily derived from simulation analyses. Subsequent work will integrate spaceborne/airborne MWIR hyperspectral imagery to empirically test the observation strategy and analysis results proposed in this paper. Building on this, component separation and topographic correction methods tailored for MWIR mineral identification will be developed: a reflection–emission radiance component separation algorithm will be constructed based on this study’s six-component radiative transfer model to extract relatively pure reflected spectral components from the total radiance signal received by the sensor, thereby improving the identifiability of mineral spectral features; high-resolution DEM will be utilized to achieve pixel-level adaptive topographic radiation correction, compensating for the influence of factors such as slope, aspect, and shadows on the reflectance spectrum; and based on large-scale training sample libraries generated by radiative transfer simulations, deep learning architectures such as Convolutional Neural Networks (CNNs) and Transformers will be introduced to achieve automatic identification and robust discrimination of mineral targets under complex backgrounds.
Finally, explore the construction of an integrated “cognitive detection” intelligent system framework. By systematically integrating the modeling, planning, and processing technologies mentioned above, further exploration can be conducted to build an intelligent detection system comprising modules for environmental perception, radiative transfer simulation, mission optimization, and real-time correction. Among them, the environmental perception module is responsible for real-time acquisition of terrain, atmospheric (including AOD, water vapor content, etc.), and illumination parameters; the radiative transfer simulator pre-simulates detection effectiveness under different observation conditions based on the model from this study; the mission optimizer autonomously optimizes observation time, angle, and band configuration; and the real-time corrector dynamically corrects atmospheric and topographic influences during imaging and data processing, forming a closed-loop optimization. This framework aims to advance remote sensing detection from the traditional “passive acquisition” mode towards a “cognition-based active observation” mode, transforming the theoretical outcomes of this study into an operationally viable intelligent detection system, thereby achieving the optimization and intelligentization of MWIR mineral detection in complex scenes.
5. Conclusions
To address the challenges of MWIR hyperspectral remote sensing detection in complex terrain, this study proposed the “full-link background radiation suppression” framework to maximize background radiation suppression while enhancing the mineral target signal. By constructing a multivariable coupled radiative transfer model, it systematically analyzed the influence of multi-dimensional parameters—including illumination condition, surface temperature (), elevation (), Aerosol Optical Depth (AOD), Water Vapor Content (WVC), solar zenith angle (), and viewing zenith angle ()—on the target background relative contrast (). This analysis revealed the coupling mechanisms between radiative transfer and detection efficacy in complex scenes. The main conclusions are as follows:
1. Illumination condition and surface temperature are key factors influencing detection performance. The under illuminated (daytime) conditions is far higher than that under non-illuminated (nighttime) conditions. The underlying reason is that the introduced solar reflection component transforms highly reflective mineral targets into “bright targets.” increases as decreases because the thermal emission component constitutes a higher proportion and is more sensitive to temperature changes in the background (soil, vegetation). Therefore, selecting illuminated conditions and prioritizing observations during low-temperature periods form the basis for enhancing detection efficacy.
2. increases monotonically with elevation (). Higher altitude leads to a reduction in atmospheric column density. This increases atmospheric transmittance while simultaneously and significantly weakening the contribution of background noise, such as atmospheric path radiance (R6). Consequently, it relatively increases the proportion of effective signals, such as surface reflection and emission, making targets in high-altitude regions easier to detect.
3. Among atmospheric parameters, both aerosol and water vapor content affect detection performance, but the influence of water vapor is more pronounced. An increase in Aerosol Optical Depth (AOD) attenuates both direct solar and surface thermal emission signals while enhancing diffuse skylight and path radiance, leading to a decrease in . However, its overall impact is relatively limited. In contrast, an increase in Water Vapor Content (WVC) strongly absorbs key surface radiation in the 2.8–3.3 μm and 4.6–5 μm bands, resulting in a significant decline in . Therefore, a dry atmospheric environment with low AOD and low WVC is most favorable for target detection.
4. Regarding geometric observation parameters, variations in both solar and viewing zenith angles affect detection performance. When and are within the 0–45° range, changes gently. Exceeding 45° leads to a significant attenuation of key components such as reflected direct solar radiation (R1) and self-emitted thermal radiation (R3) due to the lengthened atmospheric path, causing to drop sharply. Thus, for practical observations, it is recommended to keep both and within 0–45°.
5. Synergistic optimization of multiple parameters can maximize the efficacy of full-link background radiation suppression. Taking the Qaidam Basin as an example, observation conditions during midday in autumn/winter combine multiple favorable factors: low temperature, low AOD, low WVC, and a moderate . Under these conditions, can be up to 6.29 times higher than during summer nights. This case demonstrates that systematic optimization of observation time, environmental conditions, and geometric parameters can effectively suppress background radiation, thereby significantly enhancing spaceborne MWIR hyperspectral detection capability for mineral targets in complex terrain.
The findings of this research clarify the key driving factors and optimization pathways for improving the efficacy of MWIR hyperspectral mineral detection in complex scenes. They provide a theoretical reference and technical support for the intelligent mission planning (optimization of observation time, spectral bands, and geometric parameters) of subsequent spaceborne sensors, as well as for their precise application in fields such as mineral resource exploration.
Author Contributions
Conceptualization, Y.W.; Methodology, Y.W. and H.H.; Investigation, Y.W.; Formal Analysis, Y.W. and H.H.; Data Curation, Y.W.; Writing—Original Draft, Y.W.; Writing—Review and Editing, Y.W. and Y.L.; Visualization, H.K.; Resources, B.Q.; Investigation, Resources, and Data Curation, M.C.; Supervision, X.L. and Y.L. All authors have read and agreed to the published version of the manuscript.
Funding
This research was funded by the Major Program of the National Natural Science Foundation of China (Grant No. 42192582), the National Key Research and Development Program of China (Grant No. 2022YFB3902000), the Strategic Priority Research Program of the Chinese Academy of Sciences (Grant No. XDB0580000), the Youth Innovation Promotion Association of the Chinese Academy of Sciences (Grant No. 2023246), and the Shanghai Institute of Technical Physics (SITP) Innovation Project (Grant No. CX-477).
Data Availability Statement
The original contributions presented in this study are included in the article. Further inquiries can be directed to the corresponding author.
Conflicts of Interest
The authors declare no conflicts of interest.
Abbreviations
The following abbreviations are used in this manuscript:
| MWIR | Mid-Wave Infrared |
| DEM | Digital Elevation Model |
| AOD | Aerosol Optical Depth |
| WVC | Water Vapor Content |
| TOA | Top of Atmosphere |
| BRDF | Bidirectional Reflectance Distribution Function |
| VNIR | Visible and Near-Infrared |
| TIR | Thermal Infrared |
| Relative Contrast | |
| MODTRAN | Moderate Resolution Atmospheric Transmission |
| ASTER | Advanced Spaceborne Thermal Emission and Reflection Radiometer |
| USGS | United States Geological Survey |
References
- Li, Z.; Chen, S.; Liu, D.; Liu, K.; Liu, L.; Wang, M.; Li, Z.; Fu, L.; Zhou, Z. Progress of Remote Sensing Geological Prospecting Domestic and Abroad in Recent Years. Northwest. Geol. 2025, 58, 183–195. [Google Scholar] [CrossRef]
- Peyghambari, S.; Zhang, Y. Hyperspectral remote sensing in lithological mapping, mineral exploration, and environmental geology: An updated review. J. Appl. Remote Sens. 2021, 15, 031501. [Google Scholar] [CrossRef] [Scilit]
- Li, C.-L.; Liu, C.-Y.; Jin, J.; Xu, R.; Xie, J.-N.; Lv, G.; Yuan, L.-Y.; Liu, X.; Xu, H.-G.; Wang, J.-Y. Spectral measurement of minerals and gases based on airborne thermal-infrared hyperspectral imaging system. J. Infrared Millim. Waves 2020, 39, 767–777. [Google Scholar]
- Liu, Y.N.; Sun, D.X.; Hu, X.N.; Liu, S.F.; Cao, K.Q.; Chai, M.Y.; Liao, Q.J.; Zuo, Z.Q.; Hao, Z.Y.; Duan, W.B.; et al. Development of visible and short-wave infrared hyperspectral imager onboard GF-5 satellite. J. Remote Sens. 2021, 25, 439–459. [Google Scholar] [CrossRef] [Scilit]
- Yan, L.; Li, Q.; Wang, Y.R. Classification Performance of Airborne Mid-wave Infrared Imagery. Remote Sens. Inf. 2019, 34, 7–14. [Google Scholar] [CrossRef]
- Liu, D.C.; Qi, J.; Yan, B.K.; Tian, F. Application of Thermal Inferred Hyperspectral Remote Sensing in Ore Exploration. Geol. Rev. 2018, 64, 1190–1200. [Google Scholar] [CrossRef]
- Dai, J.J.; Zhang, L.; Jiang, Q.; Wang, H.Y.; Liu, T.Y. Review of thermal-infrared spectroscopy applied in geological ore exploration. Acta Geol. Sin. 2020, 94, 2520–2533. [Google Scholar] [CrossRef]
- Feng, T. Identification and Quantitative Retrieval of Minerals Information Integrating VIS-NIR-MIR-TIR (0.35~25 µm) Hyperspectral Data. Ph.D. Thesis, China University of Geosciences Wuhan, Wuhan, China, 2010. [Google Scholar]
- Qian, Y.G.; Zhao, E.Y.; Gao, C.; Wang, N.; Ma, L. Land Surface Temperature Retrieval Using Nighttime Mid-Infrared Channels Data from Airborne Hyperspectral Scanner. IEEE J. Sel. Top. Appl. Earth Obs. Remote Sens. 2015, 8, 1208–1216. [Google Scholar] [CrossRef] [Scilit]
- Ye, X.; Zhu, J.; Zhu, J.; Duan, Y.; Wang, P. Comparison of Nighttime Land Surface Temperature Retrieval Using Mid-Infrared and Thermal Infrared Remote Sensing Data under Different Atmospheric Water Vapor Conditions. IEEE Trans. Geosci. Remote Sens. 2024, 62, 5003909. [Google Scholar] [CrossRef] [Scilit]
- Yao, Q.; Xu, H.; Fan, C.; Li, L.; Wang, S.; Zheng, Y.; Xu, W.; Hou, W.; Xu, J.; Zhuang, Q.; et al. A simplified parameterization scheme of mid-infrared radiative transfer for satellite remote sensing. J. Infrared Millim. Waves 2024, 43, 377–392. [Google Scholar] [CrossRef]
- Wen, J. Study on Retrieval of Land Surface BRDF/Albedo and Its Scale Effects in Complex Terrain. Ph.D. Thesis, Institute of Remote Sensing Applications, Chinese Academy of Sciences, Beijing, China, 2008. [Google Scholar]
- Li, Z. Quantitative Remote Sensing Modeling and Inversion over Complex Terrains; Science Press: Beijing, China, 2019. [Google Scholar]
- Lin, X.W.; Wang, J.G.; Wu, S.B.; Hao, D.L.; Xiao, Q.; Liu, Q.H. Advances in topographic correction methods for optical remote sensing imageries. J. Remote Sens. 2020, 24, 958–974. [Google Scholar] [CrossRef] [Scilit]
- Proy, C.; Tanré, D.; Deschamps, P.Y. Evaluation of topographic effects in remotely sensed data. Remote Sens. Environ. 1989, 30, 21–32. [Google Scholar] [CrossRef] [Scilit]
- Shi, H.; Xiao, Z.; Wen, J.; Wu, S. An Optical-Thermal Surface-Atmosphere Radiative Transfer Model Coupling Framework with Topographic Effects. IEEE Trans. Geosci. Remote Sens. 2022, 60, 4400312. [Google Scholar] [CrossRef] [Scilit]
- Qiu, X.; Zhao, H.; Jia, G.; Li, J. Atmosphere and Terrain Coupling Simulation Framework for High-Resolution Visible-Thermal Spectral Imaging over Heterogeneous Land Surface. Remote Sens. 2022, 14, 2043. [Google Scholar] [CrossRef] [Scilit]
- Zhu, X.; Duan, S.B.; Li, Z.L.; Zhao, W.; Wu, H.; Leng, P.; Gao, M.; Zhou, X. Retrieval of Land Surface Temperature with Topographic Effect Correction from Landsat 8 Thermal Infrared Data in Mountainous Areas. IEEE Trans. Geosci. Remote Sens. 2021, 59, 6674–6687. [Google Scholar] [CrossRef] [Scilit]
- Zheng, Y.; Xiao, Z.; Shi, H.; Song, J. Exploring the Effects of Topography on Leaf Area Index Retrieved from Remote Sensing Data at Various Spatial Scales over Rugged Terrains. Remote Sens. 2024, 16, 1404. [Google Scholar] [CrossRef] [Scilit]
- Santini, F.; Palombo, A. Physically based approach for combined atmospheric and topographic corrections. Remote Sens. 2019, 11, 1218. [Google Scholar] [CrossRef] [Scilit]
- Shi, H.; Xiao, Z.; Wang, Q.; Wu, D. Multiparameter Estimation from Landsat Observations with Topographic Consideration. IEEE Trans. Geosci. Remote Sens. 2021, 59, 7353–7369. [Google Scholar] [CrossRef] [Scilit]
- Li, C.L.; Liu, C.Y.; Jin, J.; Xu, R.; Lv, G.; Xie, J.N.; Yuan, L.Y.; Liu, S.J.; Wang, J.Y. Development of infrared hyperspectral remote sensing imaging and application of gas detection (invited). Infrared Laser Eng. 2022, 51, 33–45. [Google Scholar] [CrossRef] [Scilit]
- Wang, J.Y.; Li, C.; Wang, Y.M.; Lv, G.; Yuan, L.Y.; Jin, J.; Chen, X.W.; Xie, F. Sensitivity model and system design for thermal infrared hyperspectral imager. Infrared Laser Eng. 2017, 46, 9–15. [Google Scholar] [CrossRef] [Scilit]
- Yuan, H.; Wang, X.; Yuan, Y.; Zhang, W.G.; Guo, B.T. Modeling and analysis of aircraft full-chain imaging characteristics in the sea surface and clouds from a space-based platform. Infrared Laser Eng. 2020, 49, 0204004. [Google Scholar] [CrossRef] [Scilit]
- Atarita, F.; Braun, A. Synthetic Hyperspectral Imaging Simulator: A Tool for Optimising Applications in Mineral Exploration. In Proceedings of the SPIE Future Sensing Technologies Conference, Online, 15–19 November 2021; SPIE: Bellingham, WA, USA, 2021. [Google Scholar]
- Segl, K.; Richter, R.; Kuester, T.; Kaufmann, H. End-to-end sensor simulation for spectral band selection and optimization with application to the Sentinel-2 mission. Appl. Opt. 2012, 51, 439–449. [Google Scholar] [CrossRef] [Scilit]
- Zhao, H.; Cui, B.; Jia, G. A Flight Direction Design Method for Airborne Spectral Imaging Considering the Anisotropy Reflectance of the Target in Rugged Terrain. Sensors 2019, 19, 2715. [Google Scholar] [CrossRef] [Scilit]
- Cai, M.; Tian, C.; Yang, B.; Fan, Q.; Wang, B.; Wang, W.; Qu, S. Effect of the Detective Zenith Angle and the Solar Zenith Angle on Satellite-borne Infrared Detection. Infrared Technol. 2014, 36, 221–224. [Google Scholar]
- Zou, Q.J.; Chen, Q.; Hao, Y.W.; Yang, M.M.; Liu, L.W.; Yao, M. Comparative Analysis of Visible Contrast between High and Low Altitude. Infrared Technol. 2016, 38, 935–937. [Google Scholar]
- Huang, F.; Shen, X.; Li, G.; Wang, G.; Zhao, Z. Influence of background radiation on space target detection in the long wave infrared range. Opt. Eng. 2012, 51, 086402. [Google Scholar] [CrossRef] [Scilit]
- Song, L.Y.; Zhang, H.; Lin, F. Impact and Analysis of Shadow Area Extracting to the Terrain Radiation Correction for High Resolution Image. Bull. Surv. Mapp. 2017, 7, 29–33. [Google Scholar] [CrossRef]
- Hay, J.E. Calculating solar radiation for inclined surfaces: Practical approaches. Renew. Energy 1993, 3, 373–380. [Google Scholar] [CrossRef] [Scilit]
- Zakšek, K.; Oštir, K.; Kokalj, Ž. Sky-view factor as a relief visualization technique. Remote Sens. 2011, 3, 398–415. [Google Scholar] [CrossRef] [Scilit]
- Sandmeier, S.; Itten, K.I. A physically-based model to correct atmospheric and illumination effects in optical satellite data of rugged terrain. IEEE Trans. Geosci. Remote Sens. 1997, 35, 708–717. [Google Scholar] [CrossRef] [Scilit]
- Xie, J.; Yang, J.; Zhang, J. Environmental Geology Survey and Assessment in the Qaidam Basin. Northwest. Geol. 2001, 34, 29–34. [Google Scholar]
- Geospatial Data Cloud Site, Computer Network Information Center, Chinese Academy of Sciences. Available online: http://www.gscloud.cn (accessed on 8 April 2025).
- Hu, P.; Tan, Q.J.; Yan, B.K. The Application of Hyperspectral Remote Sensing to the Identification of Hydrocarbon Alteration Minerals in Qaidam Basin. Remote Sens. Land Resour. 2009, 81, 54–61. [Google Scholar]
- Fu, Y.; Chen, H.; Zhang, S.Q.; Yang, Y.; Zhao, Y.J. Phenological characteristics of alpine arid region based on biome type and its responses to climate factors: A case study of Qaidam Basin from 2000 to 2019. Geogr. Res. 2021, 40, 52–66. [Google Scholar] [CrossRef]
- Baldridge, A.M.; Hook, S.J.; Grove, C.I.; Rivera, G. The ASTER spectral library version 2.0. Remote Sens. Environ. 2009, 113, 711–715. [Google Scholar] [CrossRef] [Scilit]
- Clark, R.N.; Swayze, G.A.; Wise, R.A.; Livo, K.E.; Hoefen, T.M.; Kokaly, R.F.; Sutley, S.J. USGS Digital Spectral Library Splib06a; U.S. Geological Survey: Reston, VA, USA, 2007; Volume 231. [Google Scholar]
- Shen, J.; Zhang, C.; Xu, X.H.; Xin, P.P.; Ma, Y. Variation Characteristics of Surface Temperature in Qaidam Basin 1980-2015. Chin. Agric. Sci. Bull. 2016, 32, 58–64. [Google Scholar] [CrossRef]
- Xiao, H.D.; Han, Q.; Yuan, S.J.; Li, J.L.; Yin, L.L. Spatial and Temporal Distribution Characteristics of AOD and Influence of Meteorological Factors in Qaidam Basin. Plateau Meteorol. 2024, 43, 762–774. [Google Scholar] [CrossRef]
- Hu, X.L.; Guo, X.F.; Yu, T.; Zhang, Z.W.; Li, J.; Luan, H.J. Effects of Aerosol Optical Thickness on the Optical Remote Sensing Imaging Quality. Spectrosc. Spect. Anal. 2014, 34, 735–740. [Google Scholar] [CrossRef]
- Chao, H.Z.; Zhang, J.; Yuan, Z.Q.; Qi, D.L. Spatial and temporal variation characteristics of absolute humidity in Qinghai province from 1971 to 2017. Shamo Yu Lvzhou Qixiang (Desert Oasis Meteorol.) 2020, 14, 95–102. [Google Scholar] [CrossRef]
- Shi, H.; Xiao, Z. Exploring Topographic Effects on Surface Parameters Over Rugged Terrains at Various Spatial Scales. IEEE Trans. Geosci. Remote Sensing 2022, 60, 4404616. [Google Scholar] [CrossRef] [Scilit]
- Alvaro, R.; Picard, G.; Arnaud, L.; Larue, F.; Inès, O. Modelling surface temperature and radiation budget of snow-covered complex terrain. Cryosphere 2022, 16, 559–579. [Google Scholar] [CrossRef] [Scilit]
- Shi, H.; Xiao, Z. The 4SAILT Model: An Improved 4SAIL Canopy Radiative Transfer Model for Sloping Terrain. IEEE Trans. Geosci. Remote Sens. 2021, 59, 5515–5525. [Google Scholar] [CrossRef] [Scilit]
- Xue, Y.; Zhu, X.; Wu, Z.; Duan, S.B. Retrieval of Land Surface Temperature over Mountainous Areas Using Fengyun-3D MERSI-II Data. Remote Sens. 2023, 15, 5465. [Google Scholar] [CrossRef] [Scilit]
- Gillespie, A.; Rokugawa, S.; Matsunaga, T.; Cothern, J.S.; Hook, S.; Kahle, A. A temperature and emissivity separation algorithm for Advanced Spaceborne Thermal Emission and Reflection Radiometer (ASTER) images. IEEE Trans. Geosci. Remote Sens. 1998, 36, 1113–1126. [Google Scholar] [CrossRef] [Scilit]
- Hapke, B. Theory of Reflectance and Emittance Spectroscopy, 2nd ed.; Cambridge University Press: Cambridge, UK, 2012. [Google Scholar]
- He, Z.-W.; Tang, B.-H. Retrieval of Rugged Mountainous Areas Land Surface Temperature From High-Spatial-Resolution Thermal Infrared Remote Sensing Data. IEEE Trans. Geosci. Remote Sens. 2023, 61, 4508216. [Google Scholar] [CrossRef] [Scilit]
- He, Z.; Tang, B.; Li, Z. Retrieval of high spatial resolution mountainous land surface temperature considering topographic and adjacency effects. Sci. China Earth Sci. 2024, 67, 3610–3625. [Google Scholar] [CrossRef] [Scilit]
- He, Z.-W.; Tang, B.-H.; Fu, Z.; Huang, L.; Zhu, X. Retrieval of Land Surface Temperature over Rugged Mountainous Areas from Landsat-9 Thermal Infrared Remote Sensing Data. In IGARSS 2024—2024 IEEE International Geoscience and Remote Sensing Symposium, Athens, Greece, 7–12 July 2024; IEEE: Piscataway, NJ, USA, 2024; pp. 10533–10536. [Google Scholar] [CrossRef] [Scilit]
- Yang, F.; Zeng, Z.; Cheng, J. A Parameterization Scheme for Correcting All-Sky Surface Longwave Downward Radiation Over Rugged Terrain. J. Geophys. Res. Atmos. 2024, 129, e2023JD038862. [Google Scholar] [CrossRef] [Scilit]
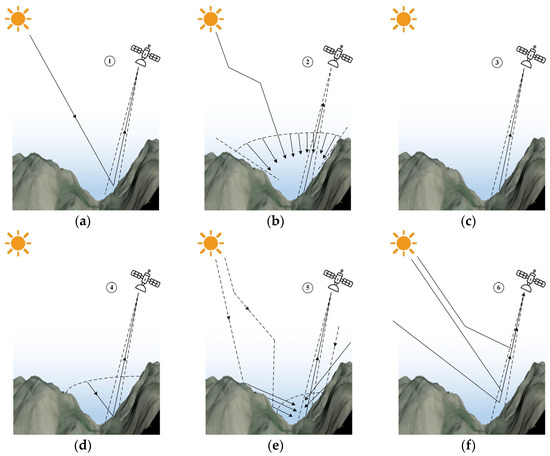
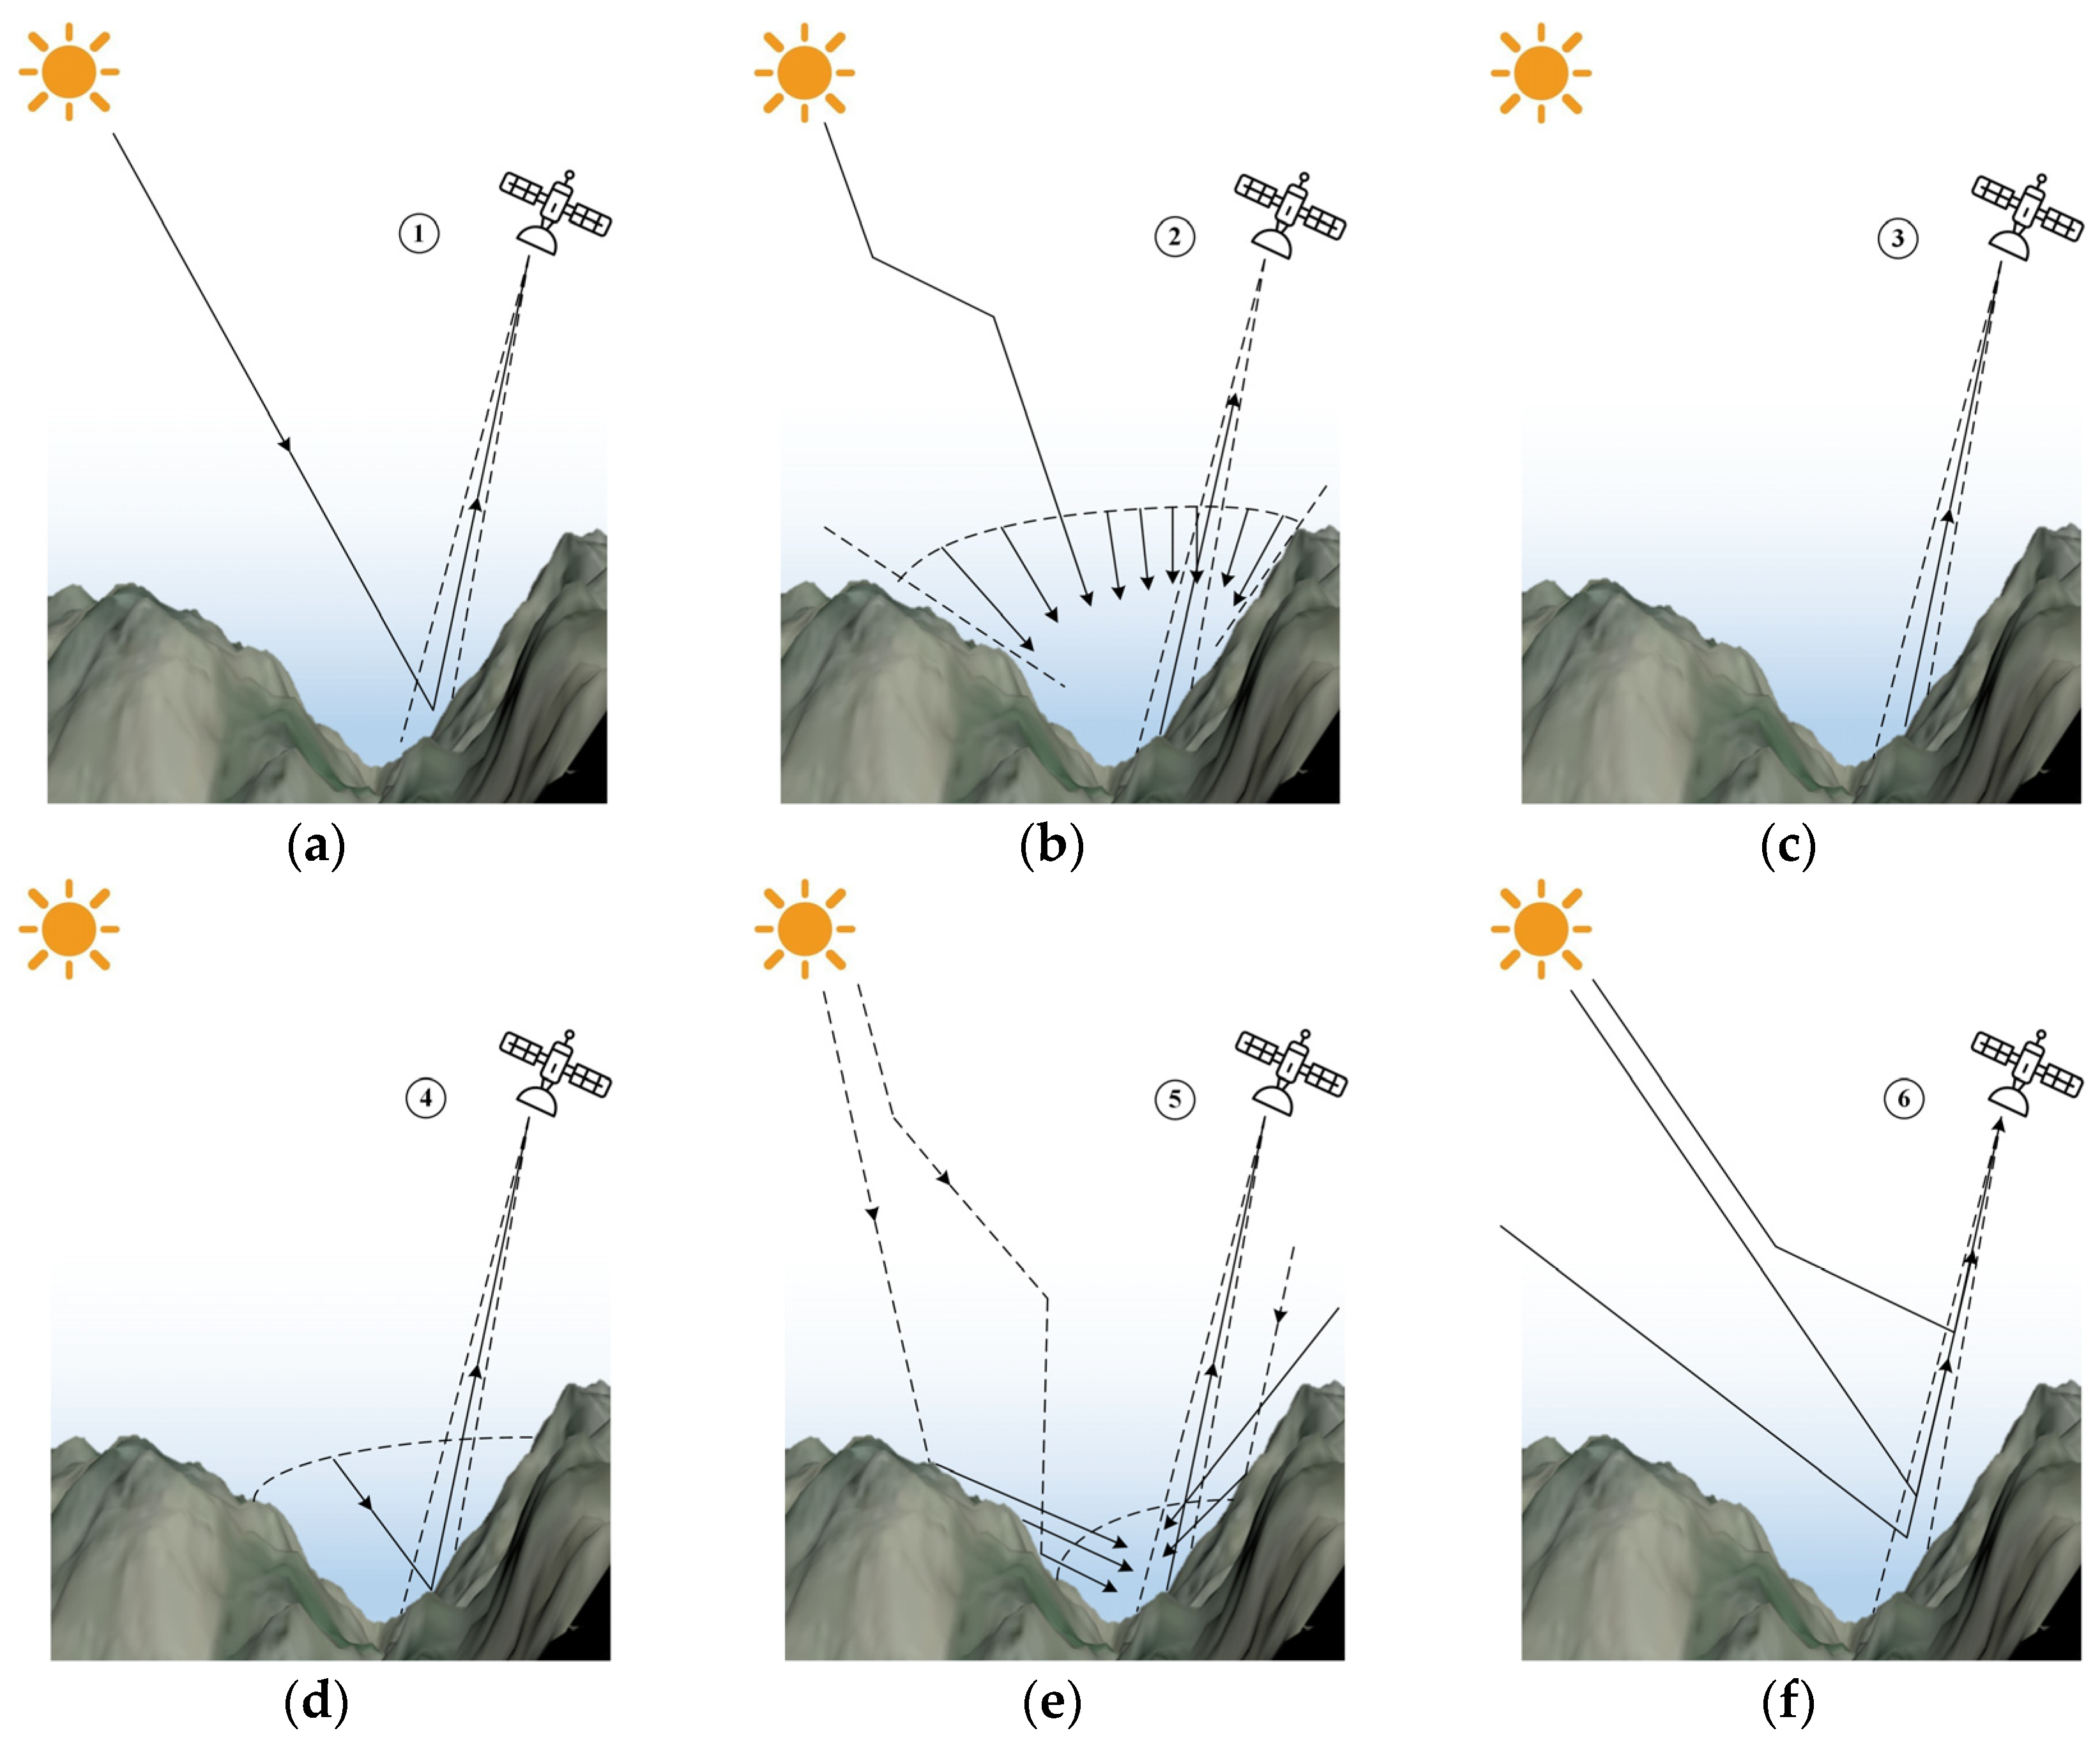
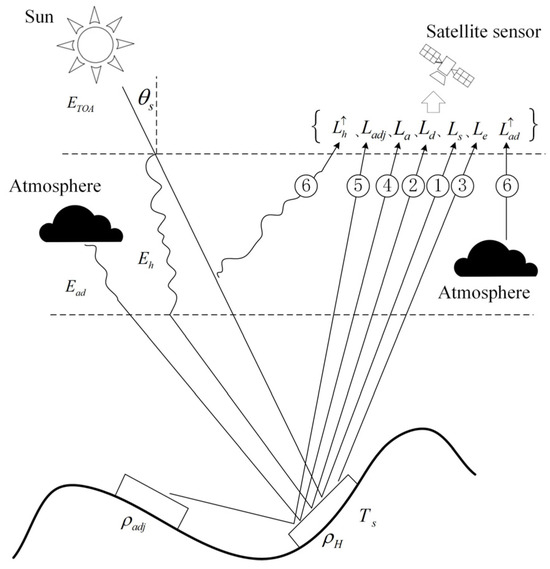
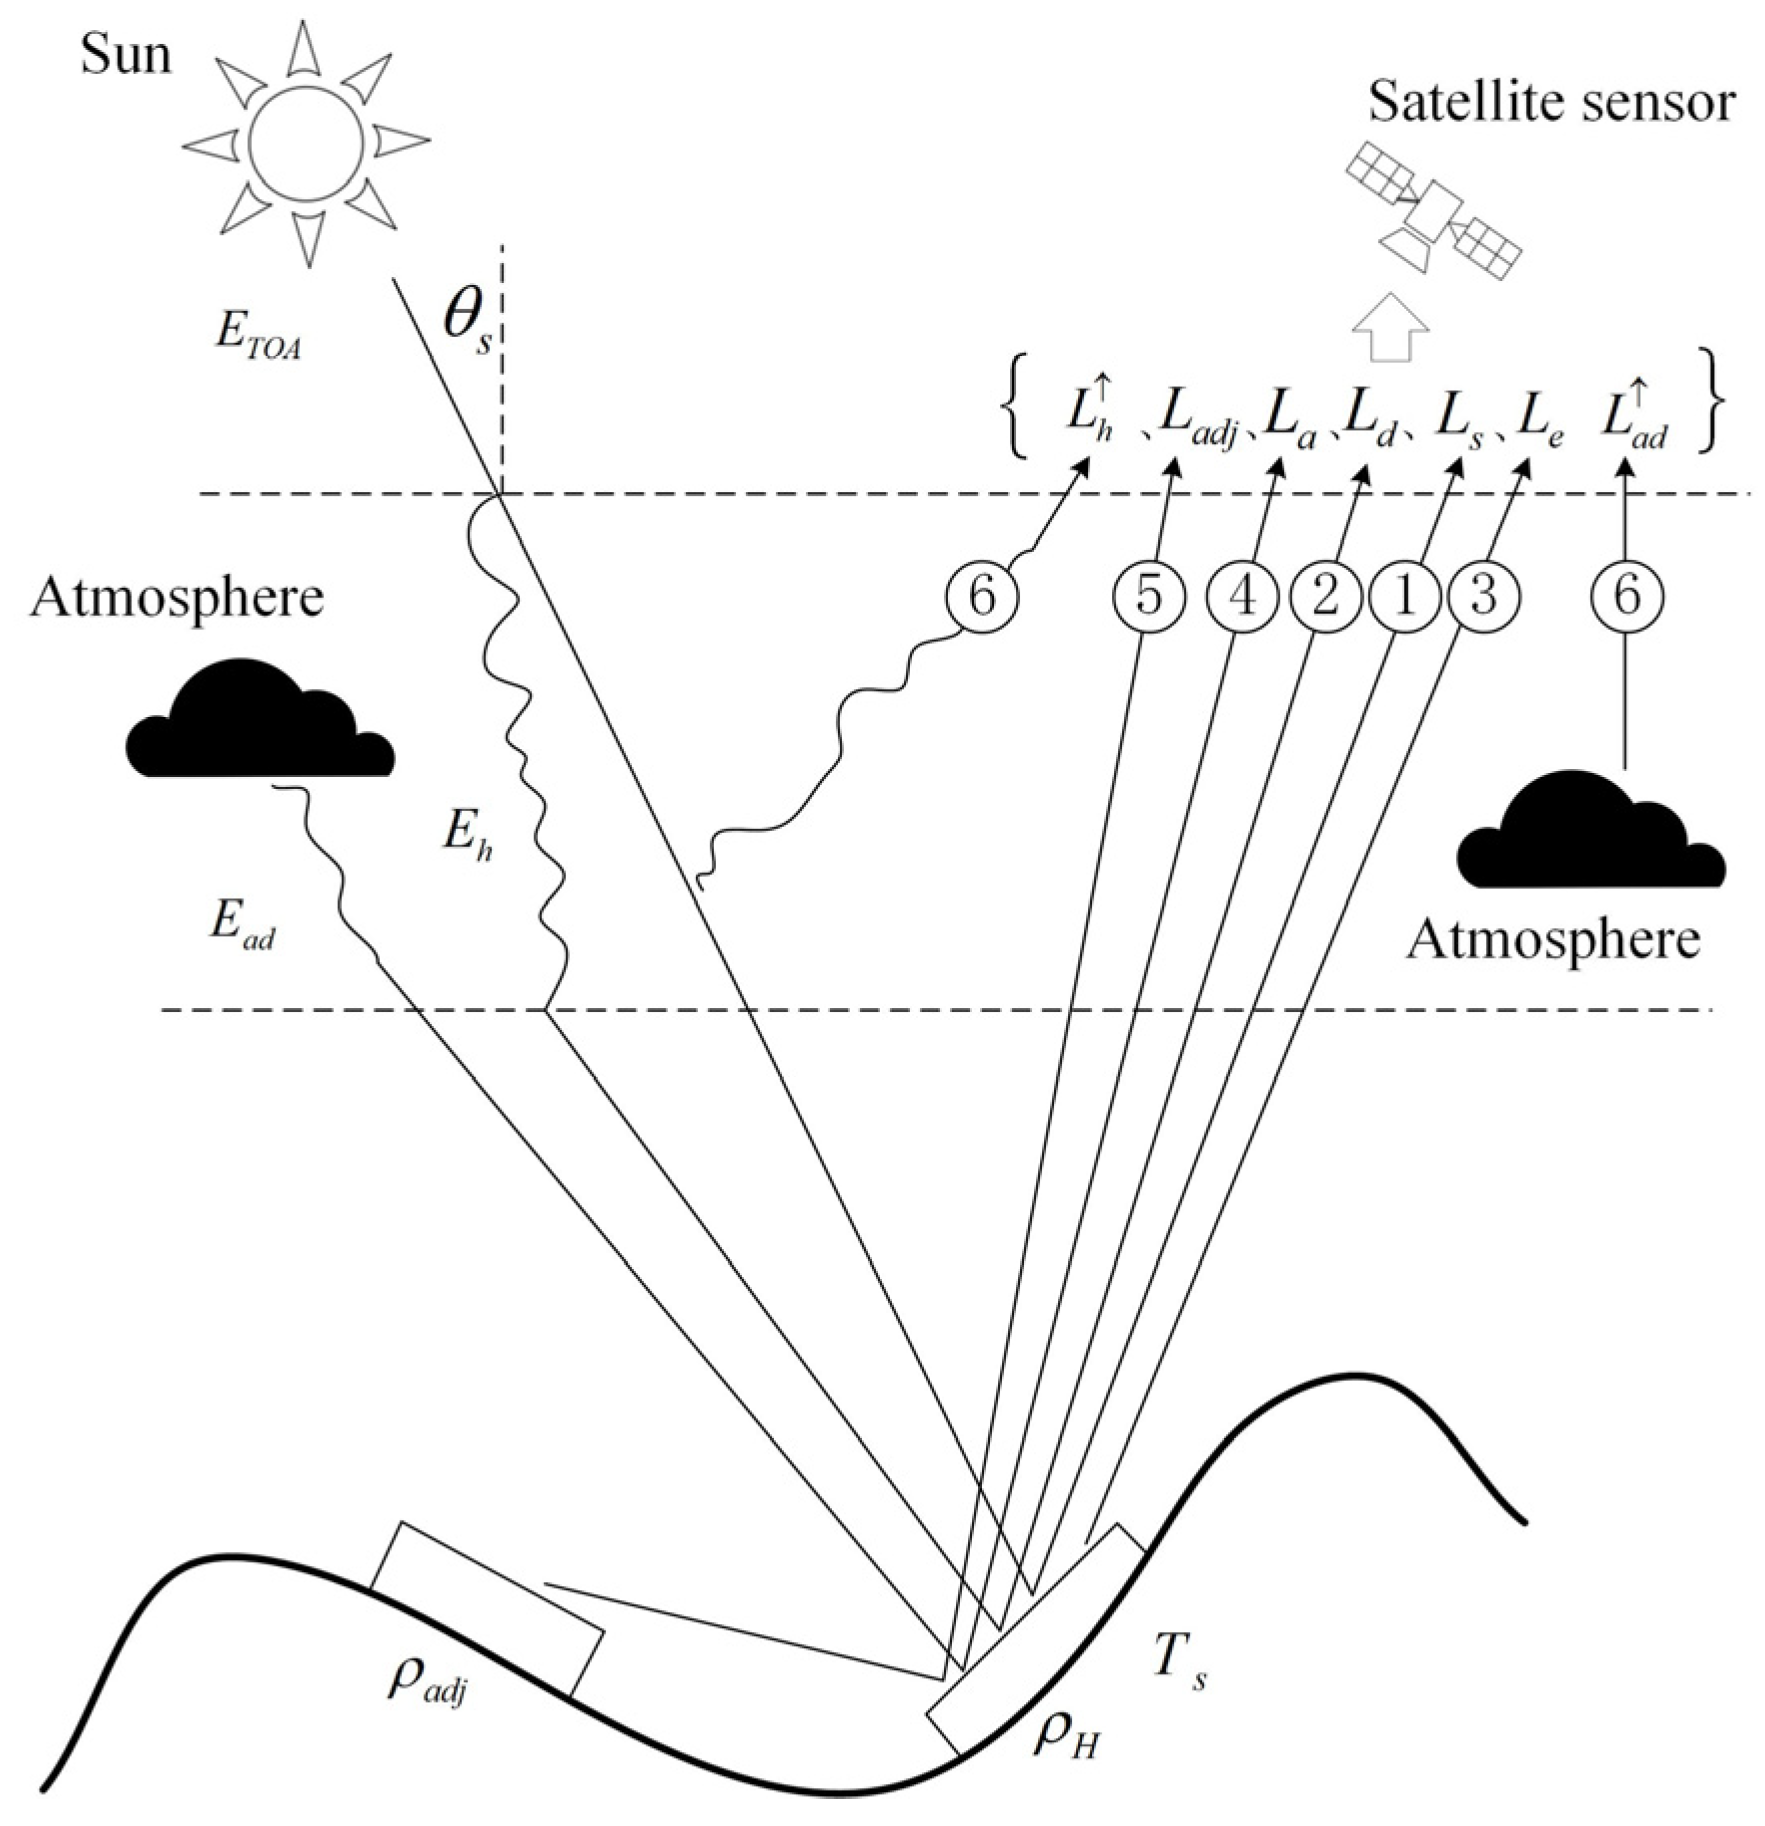
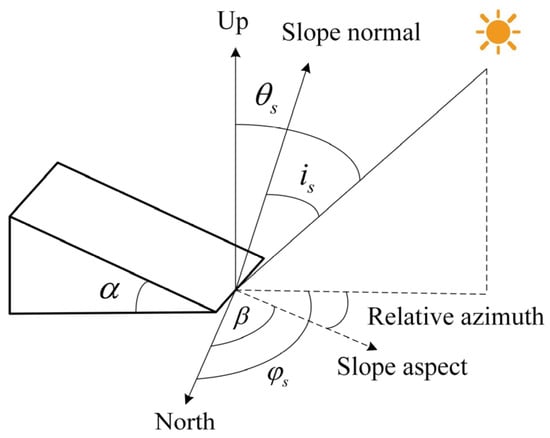
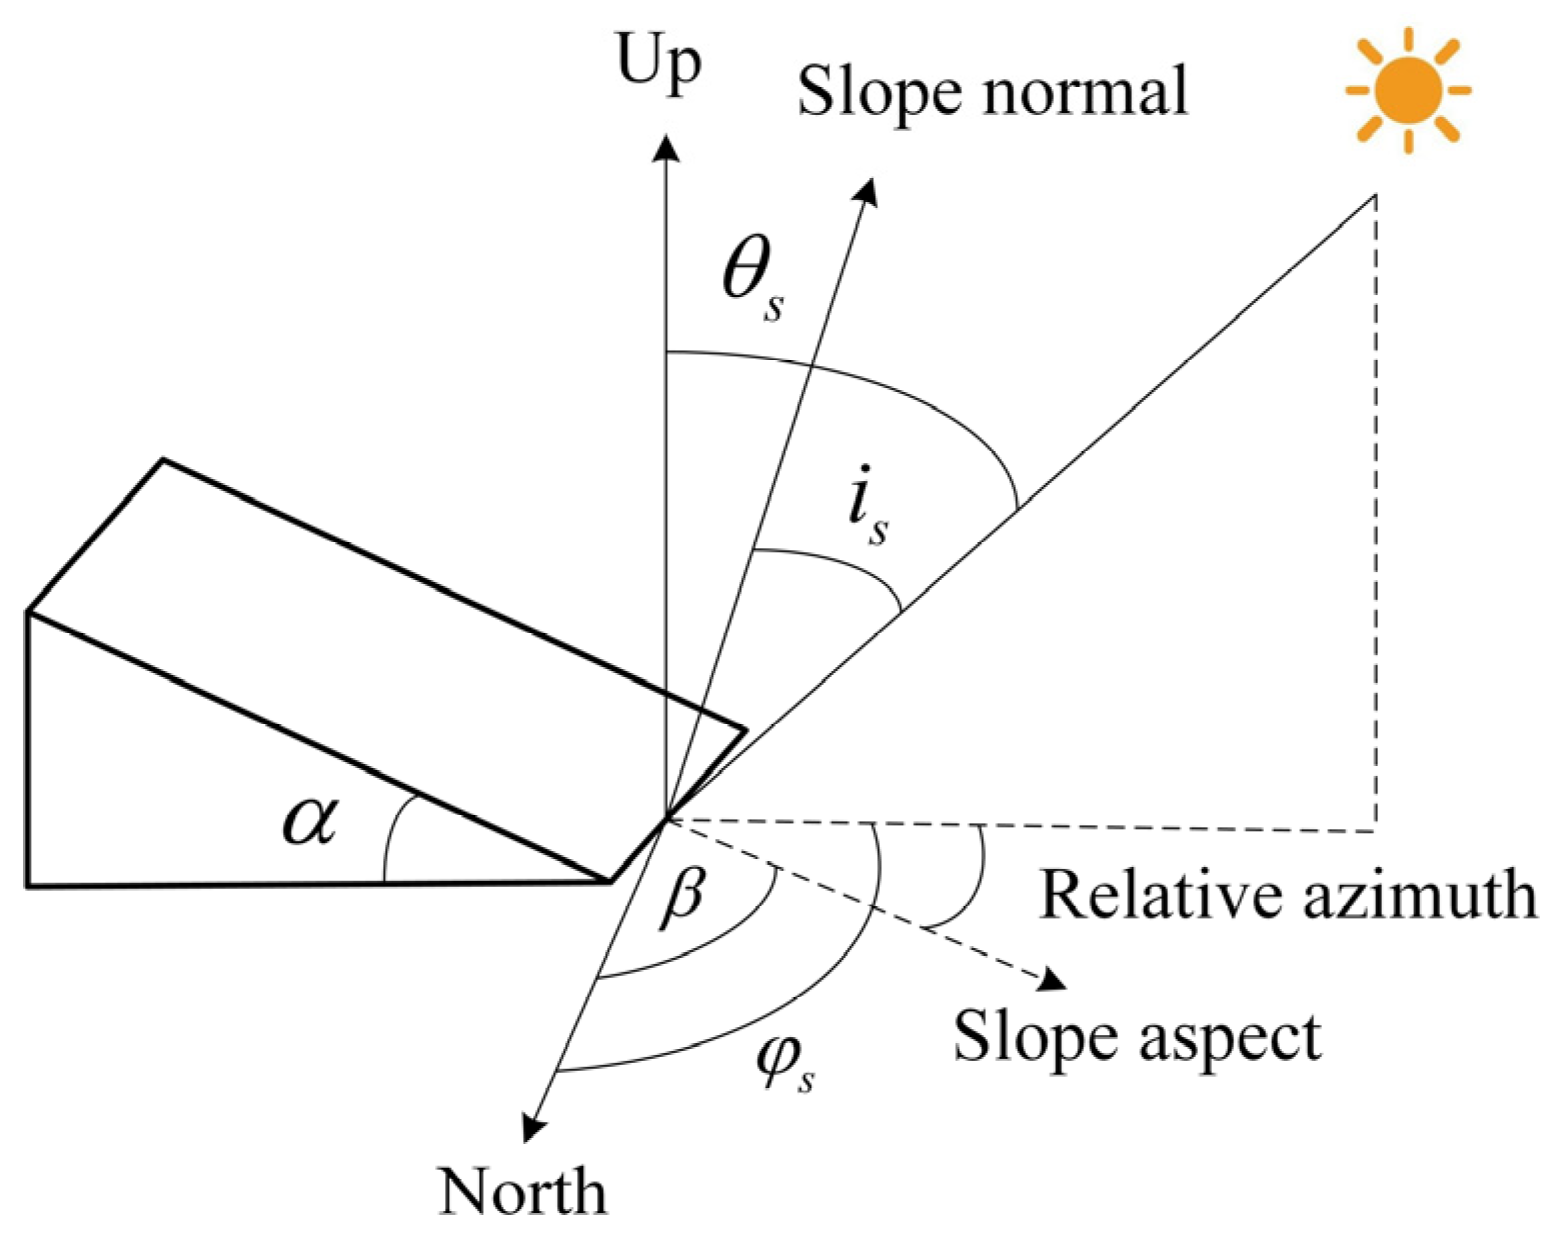
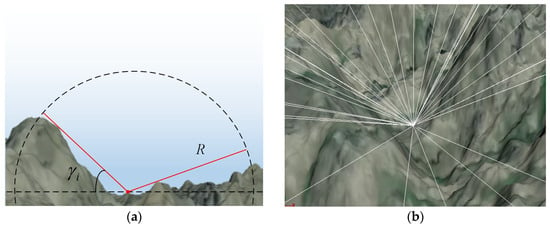
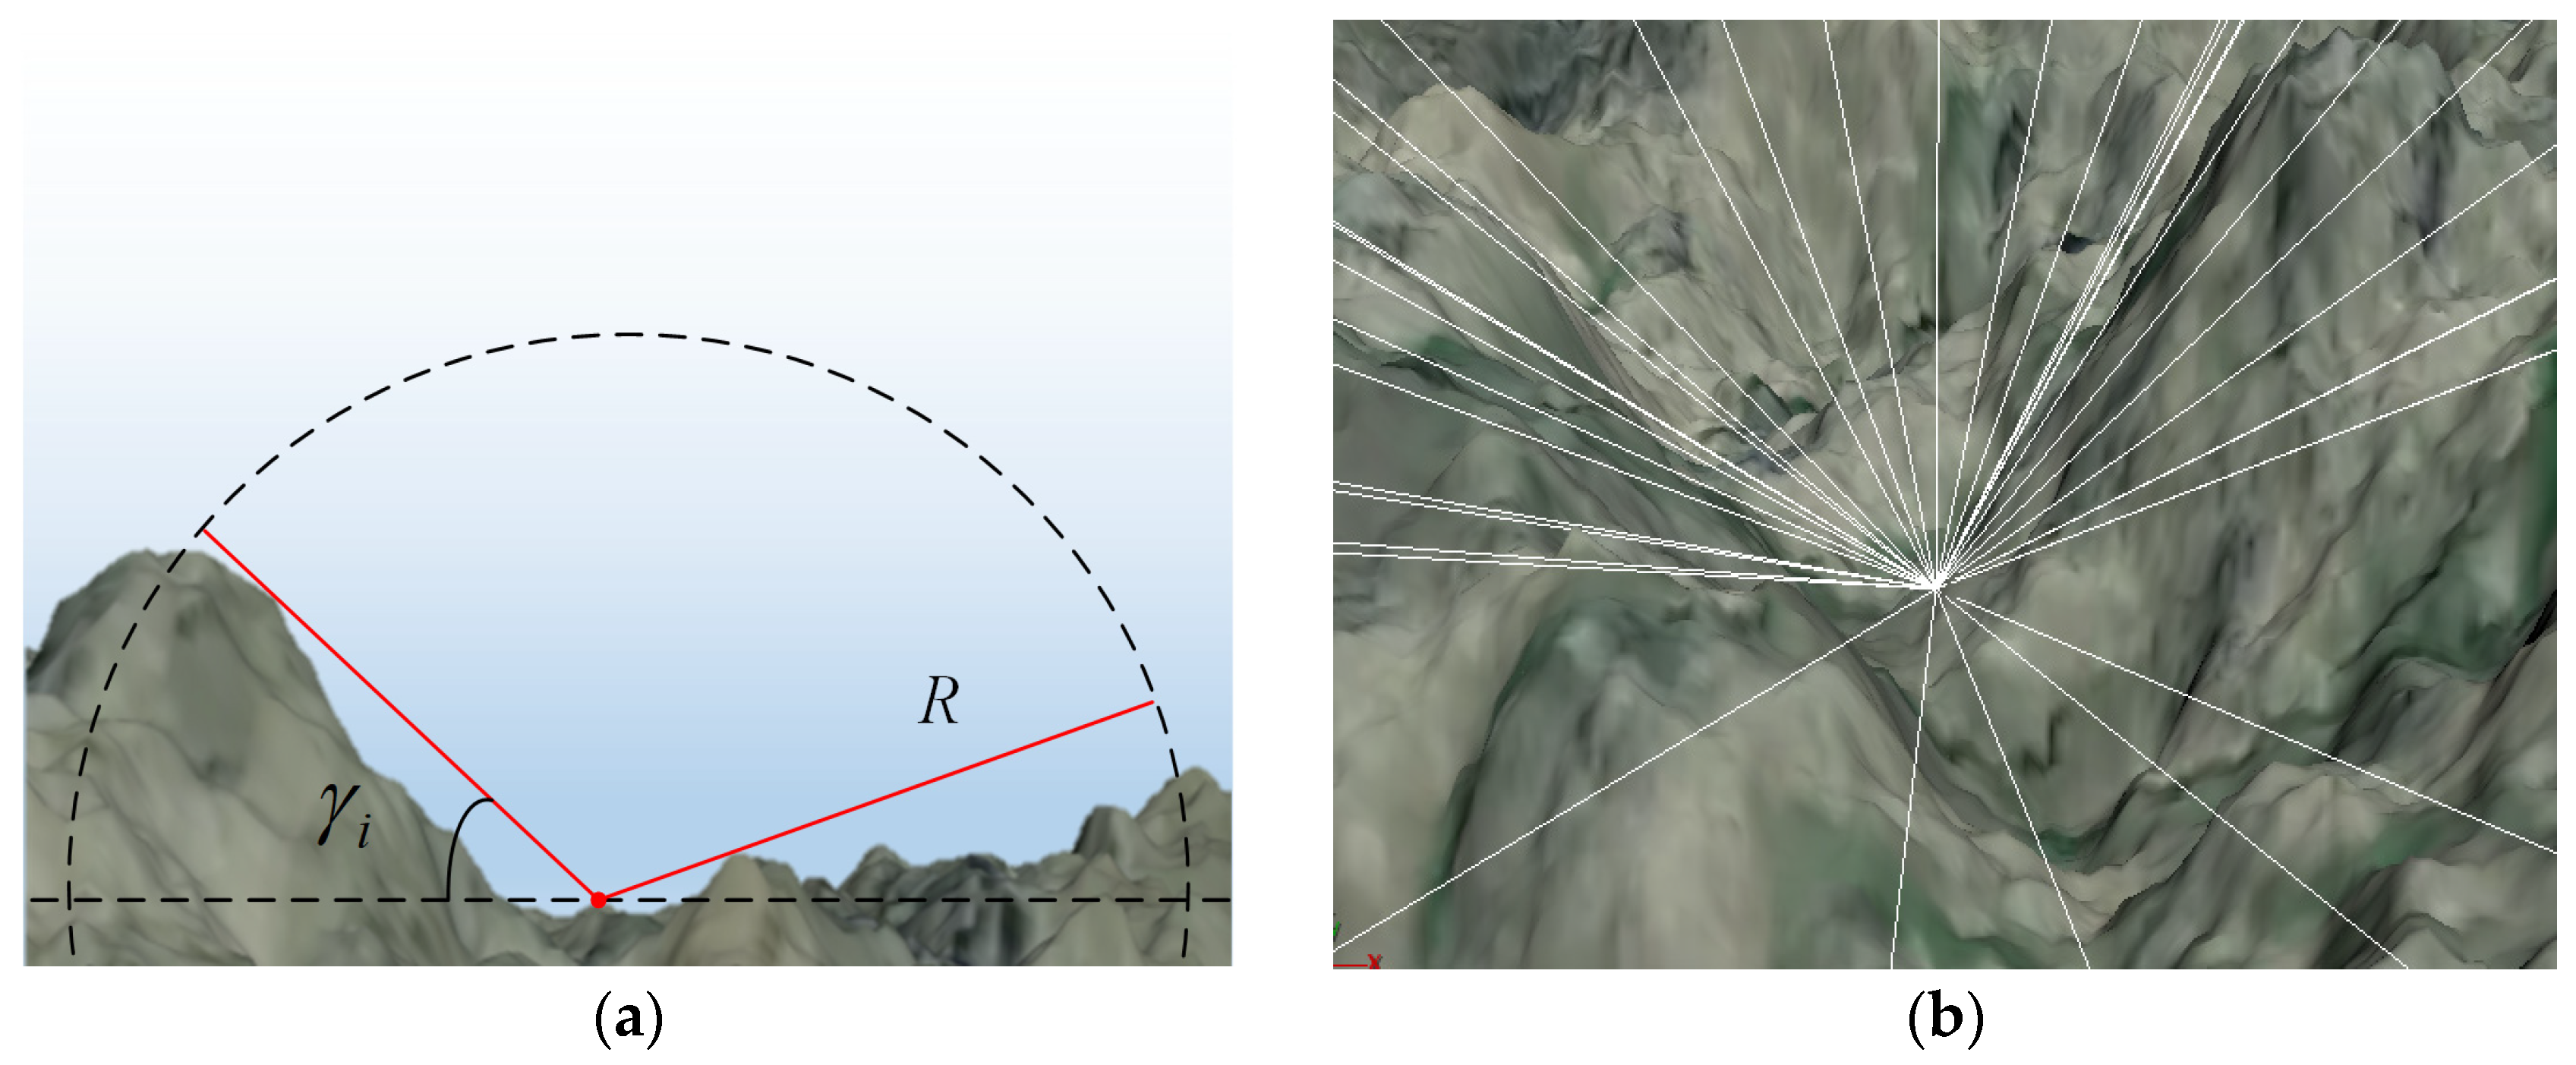
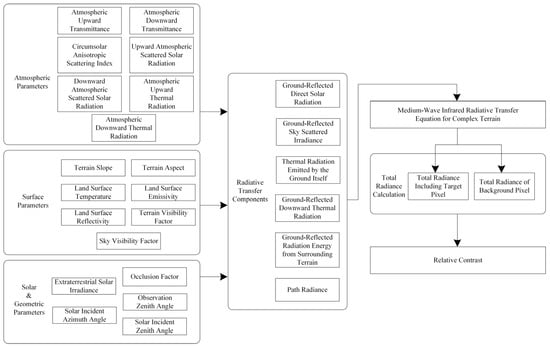
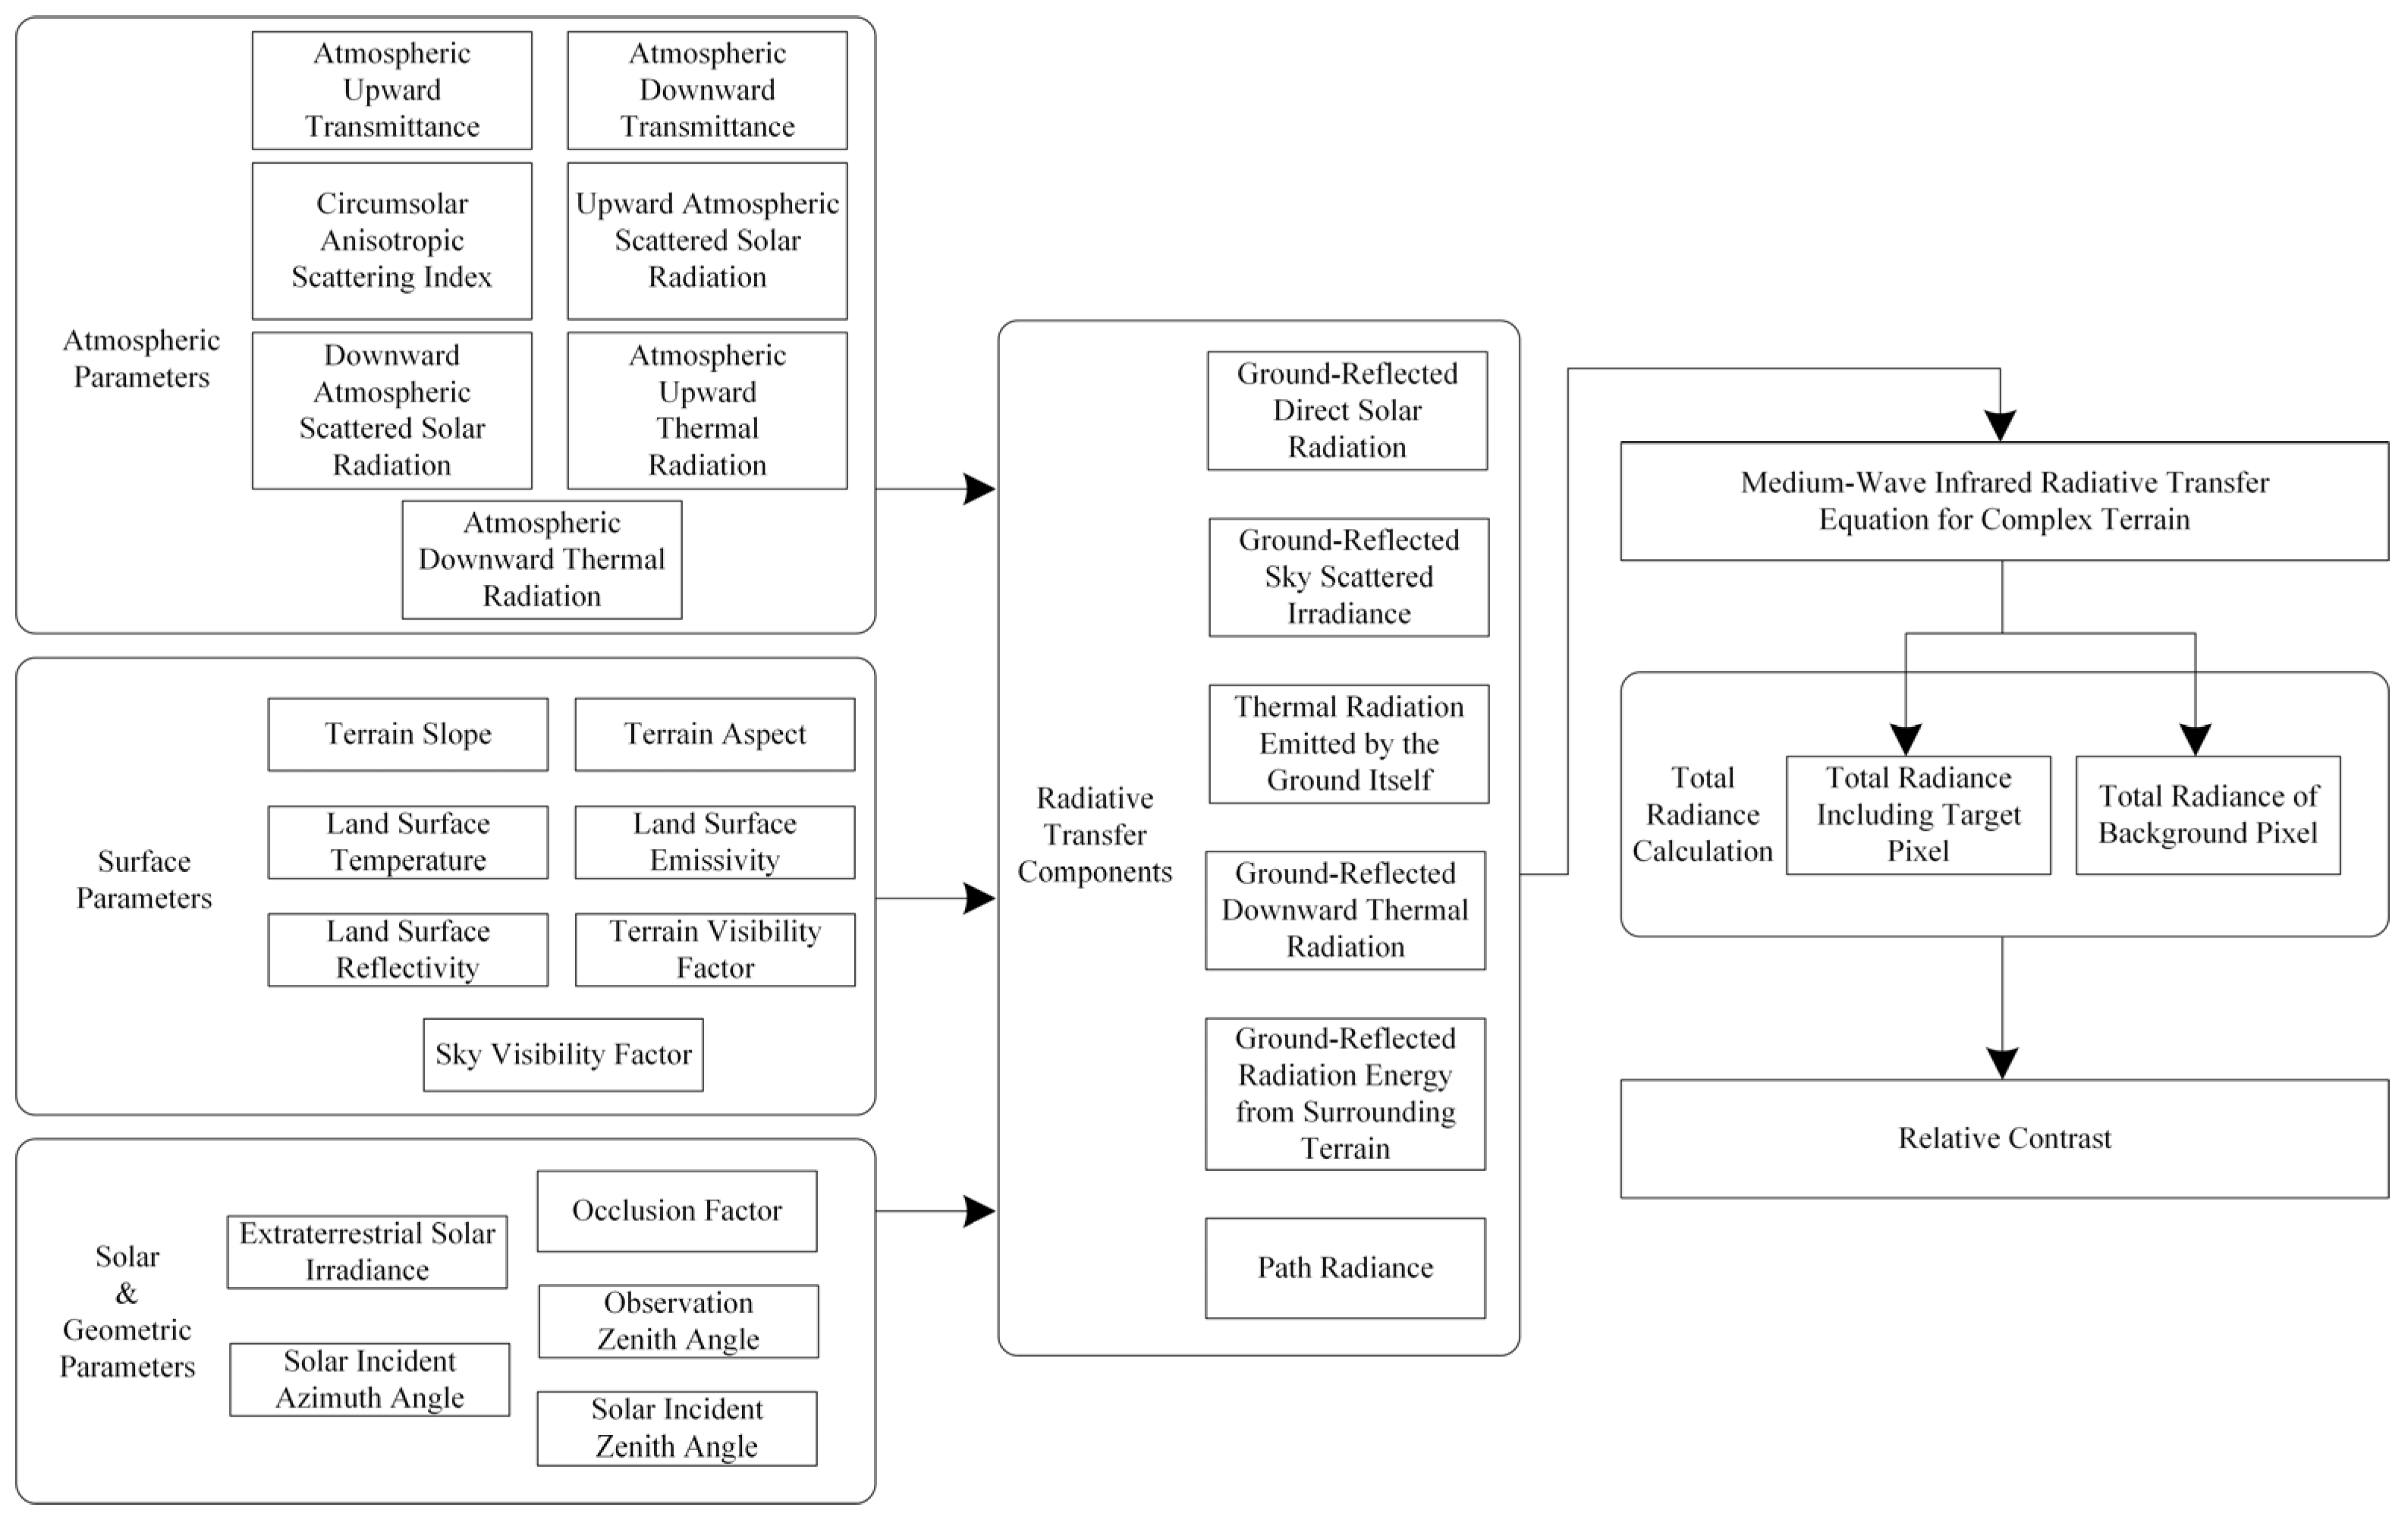
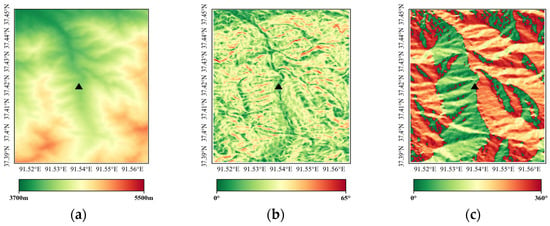
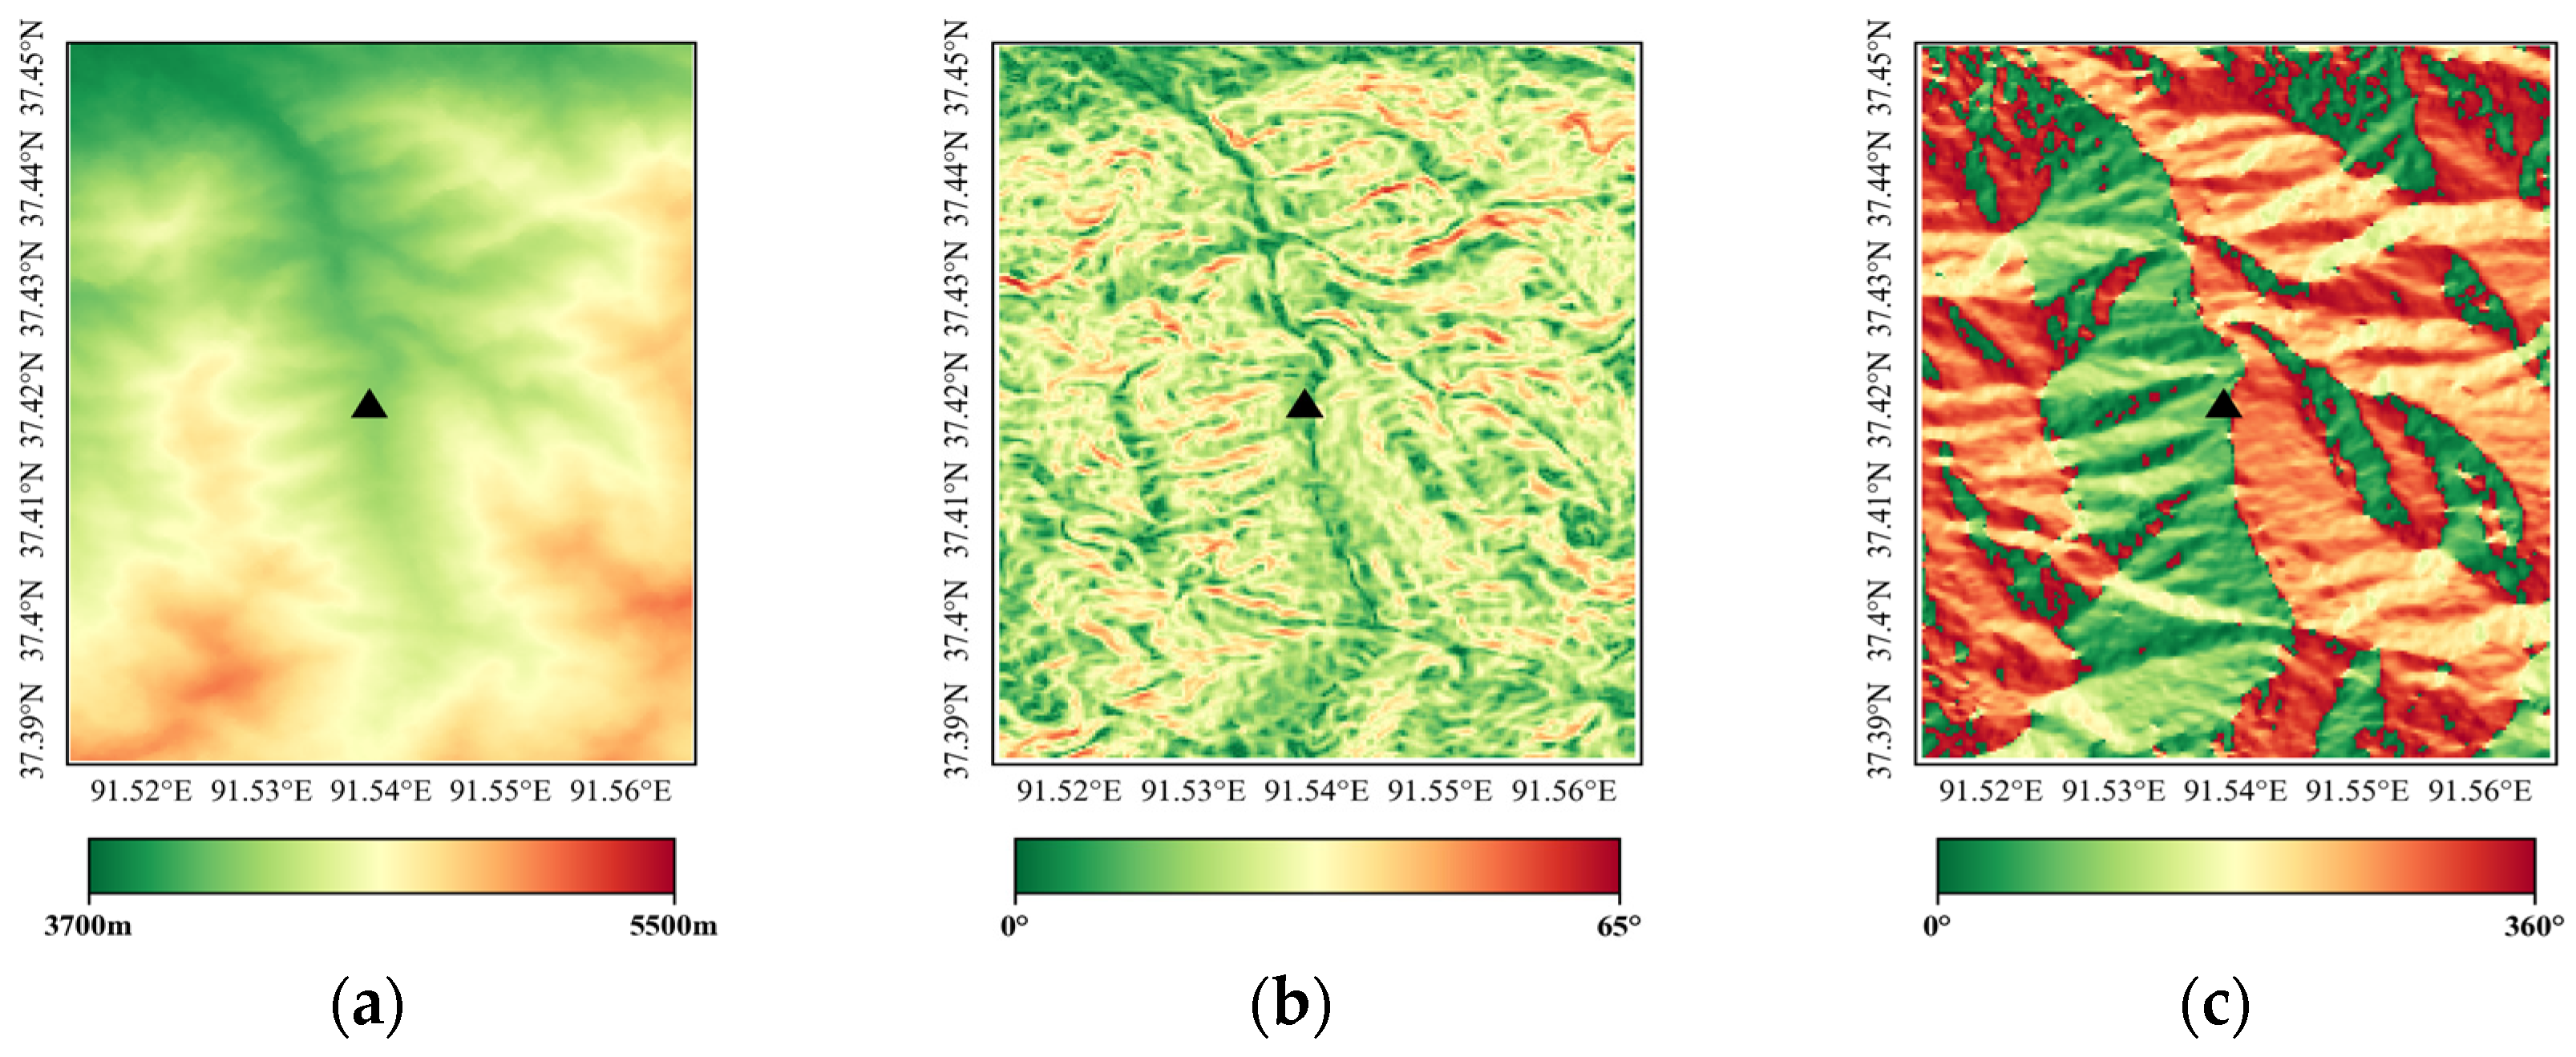
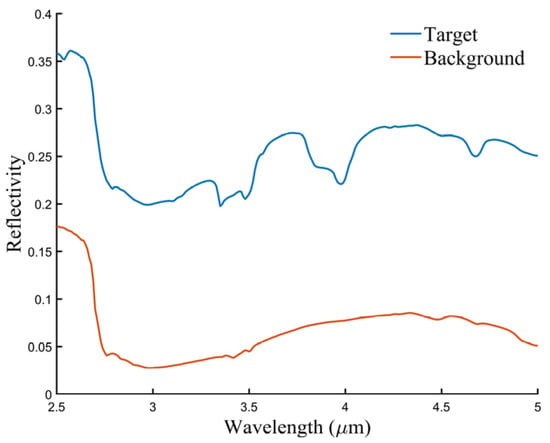
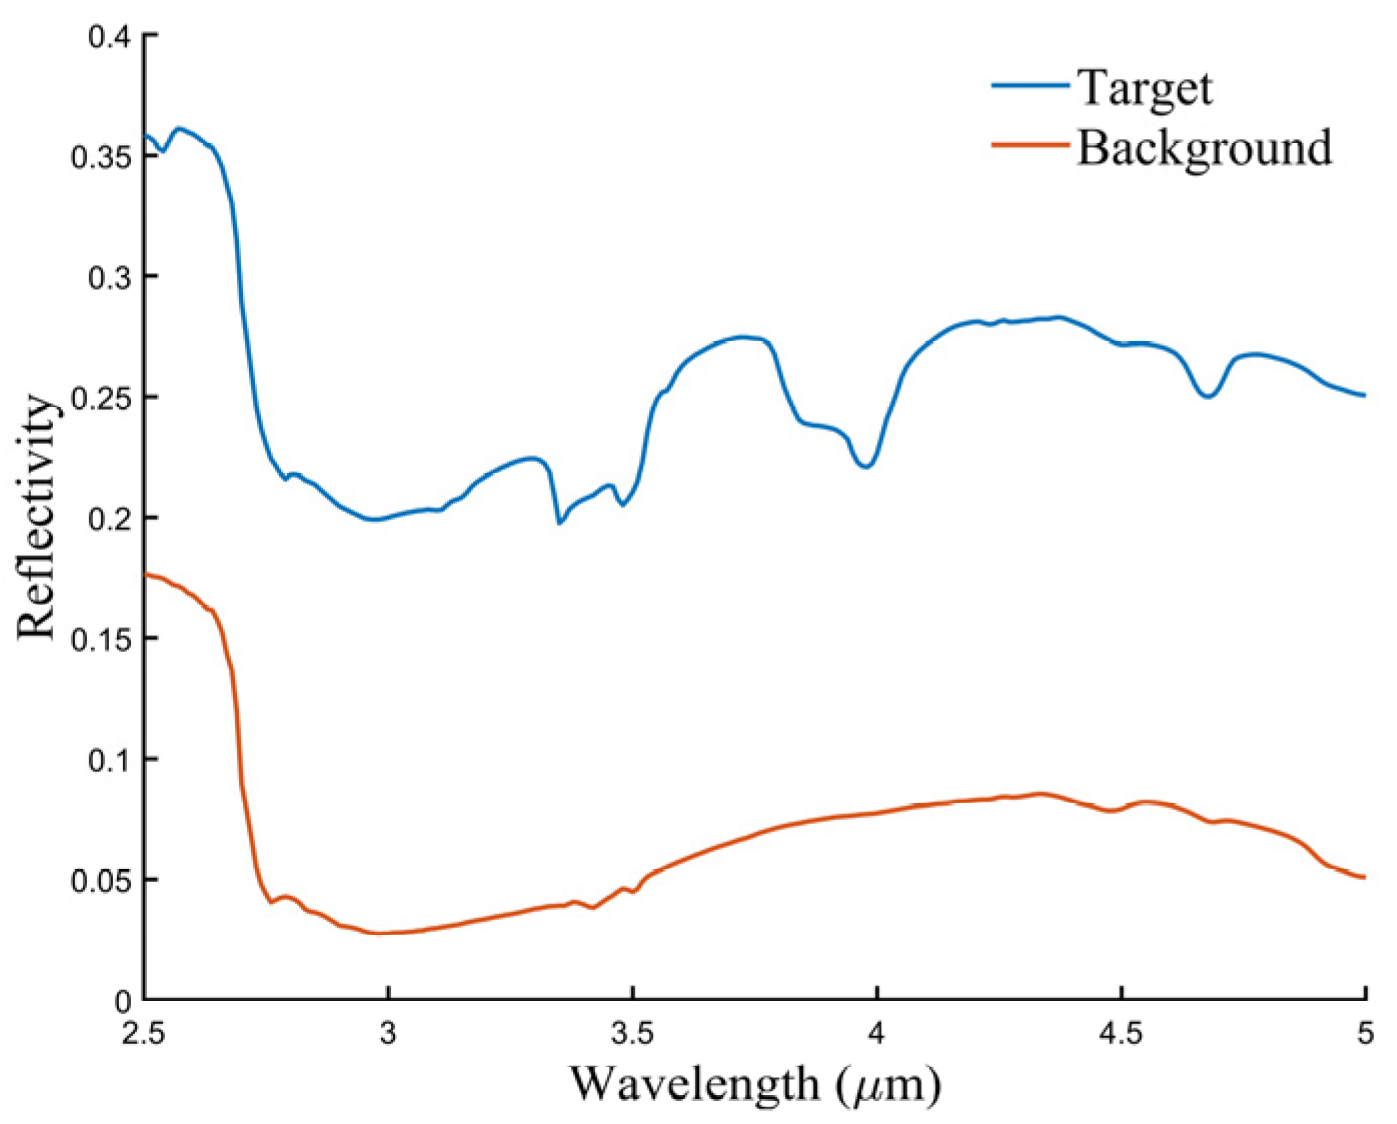
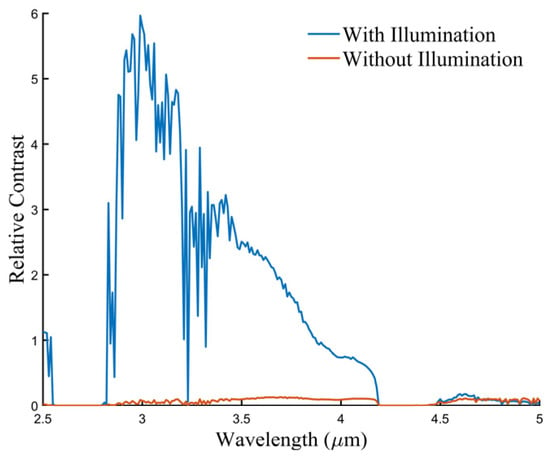
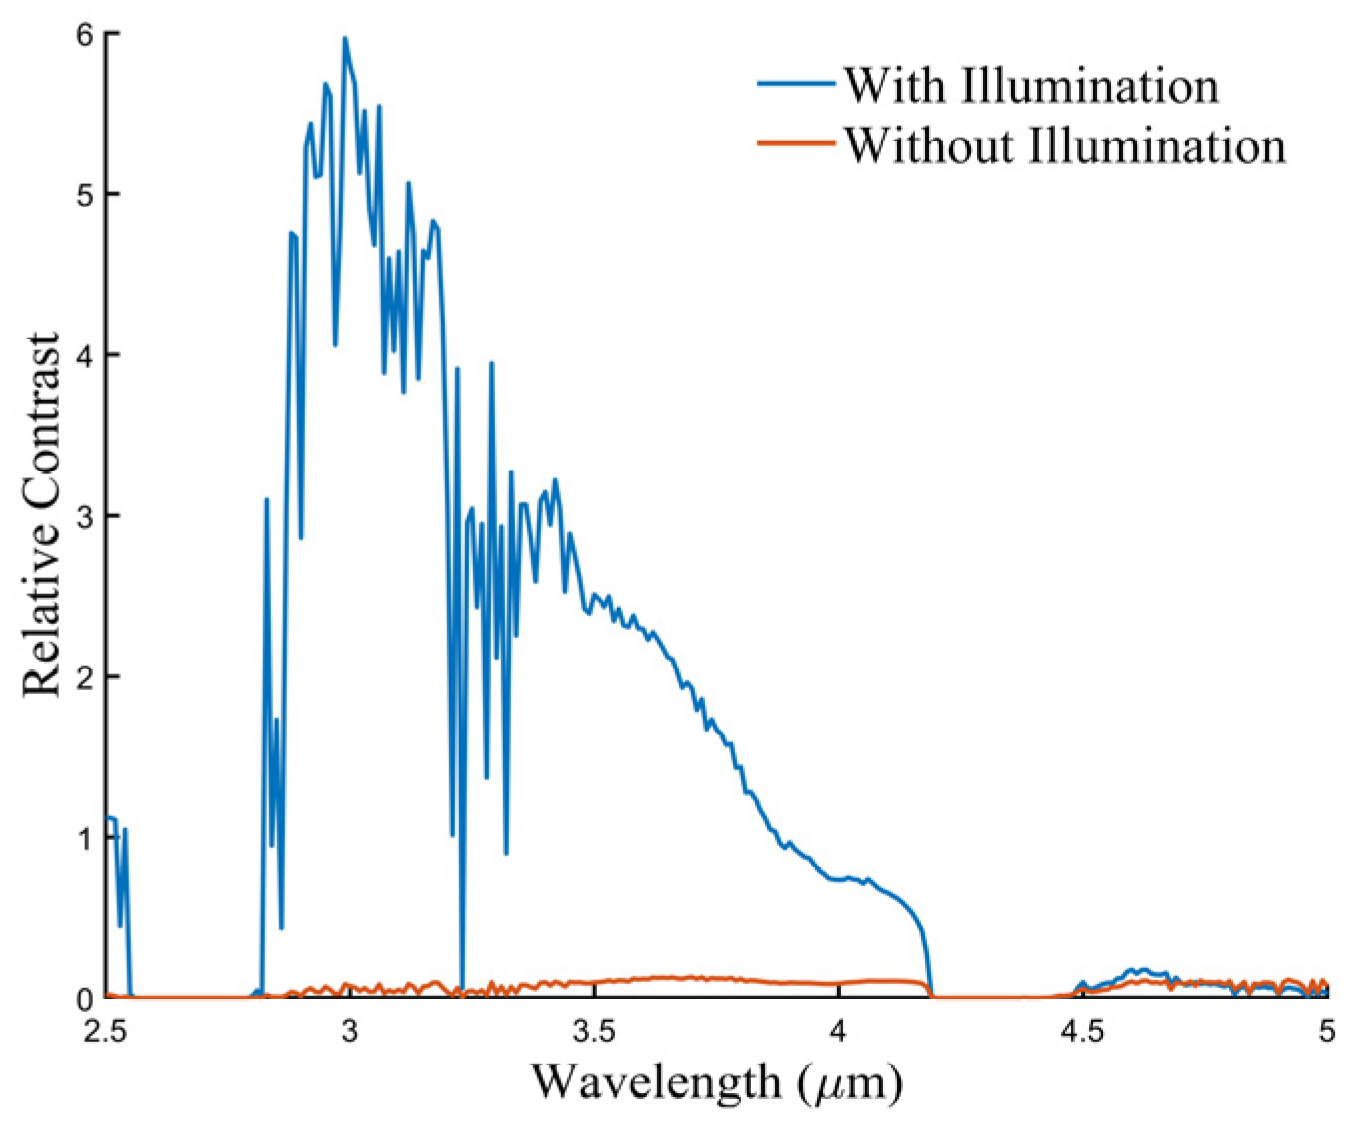
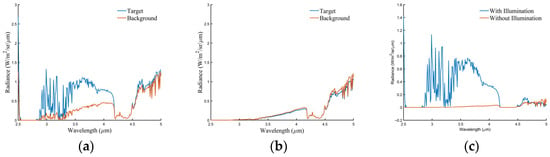
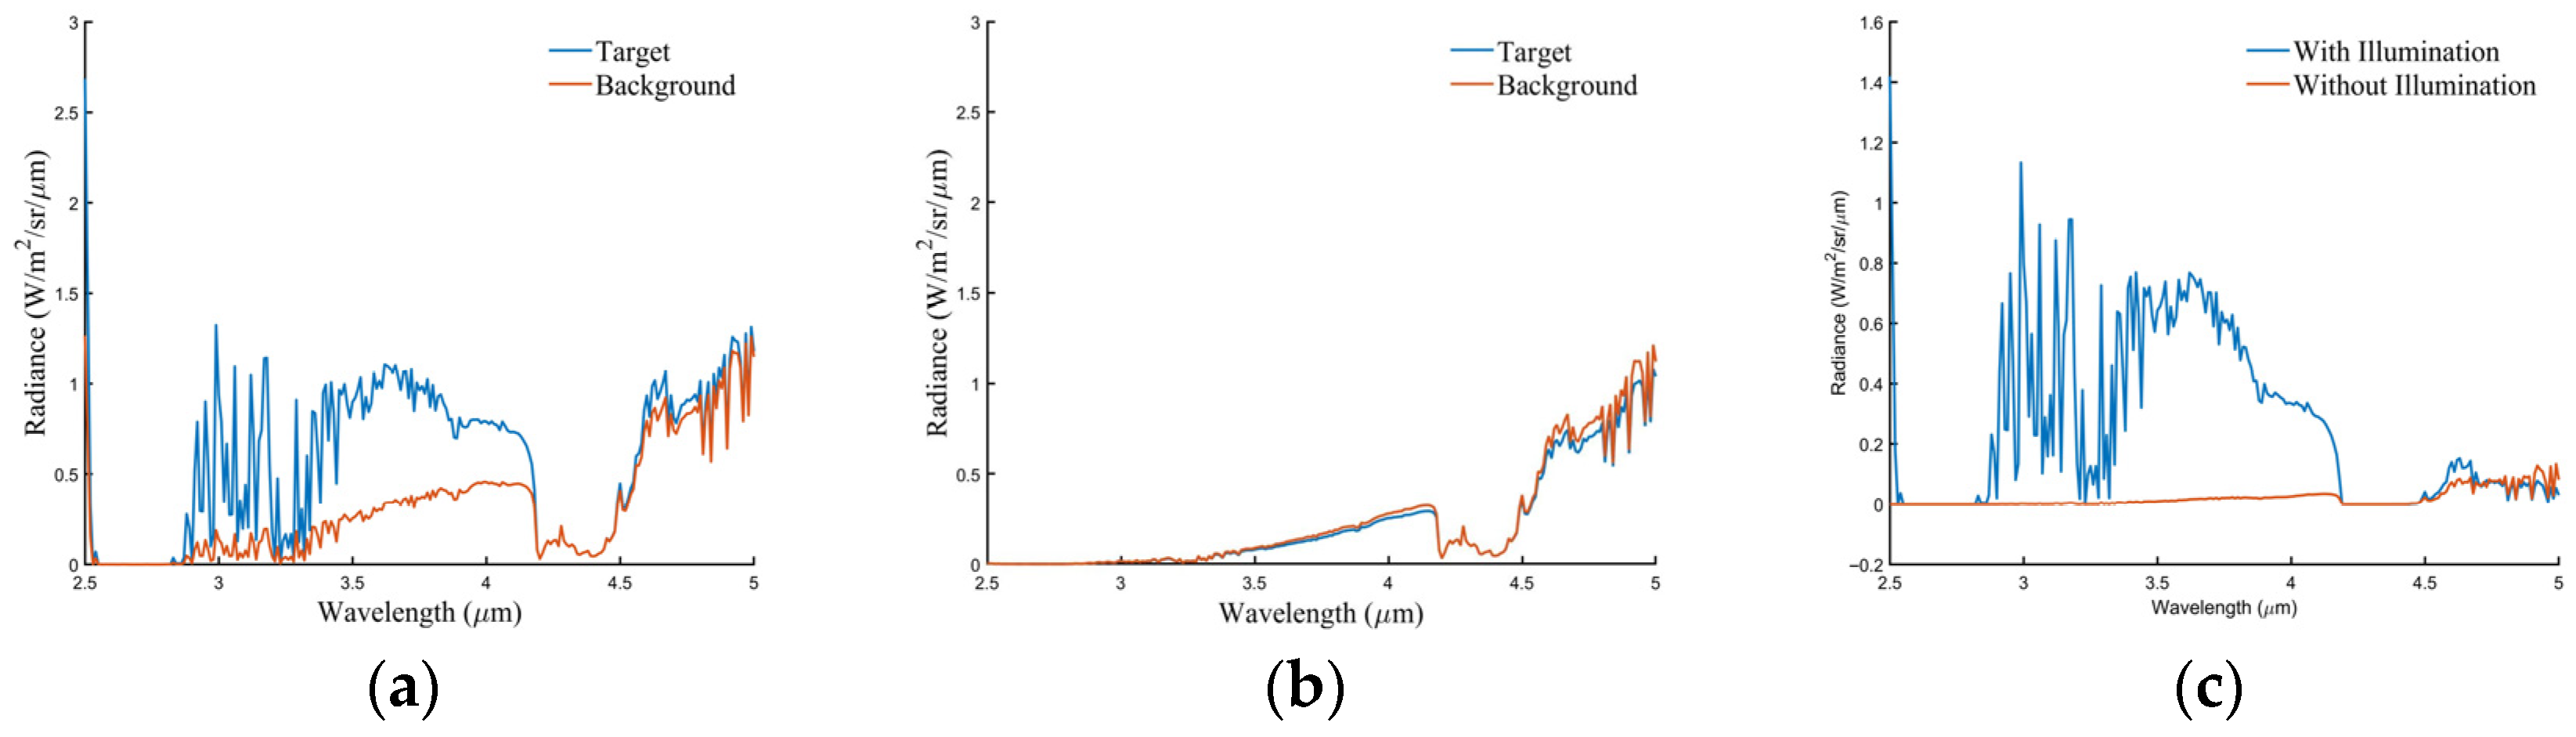
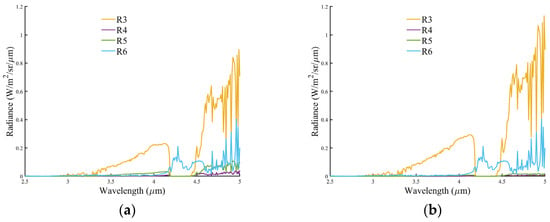
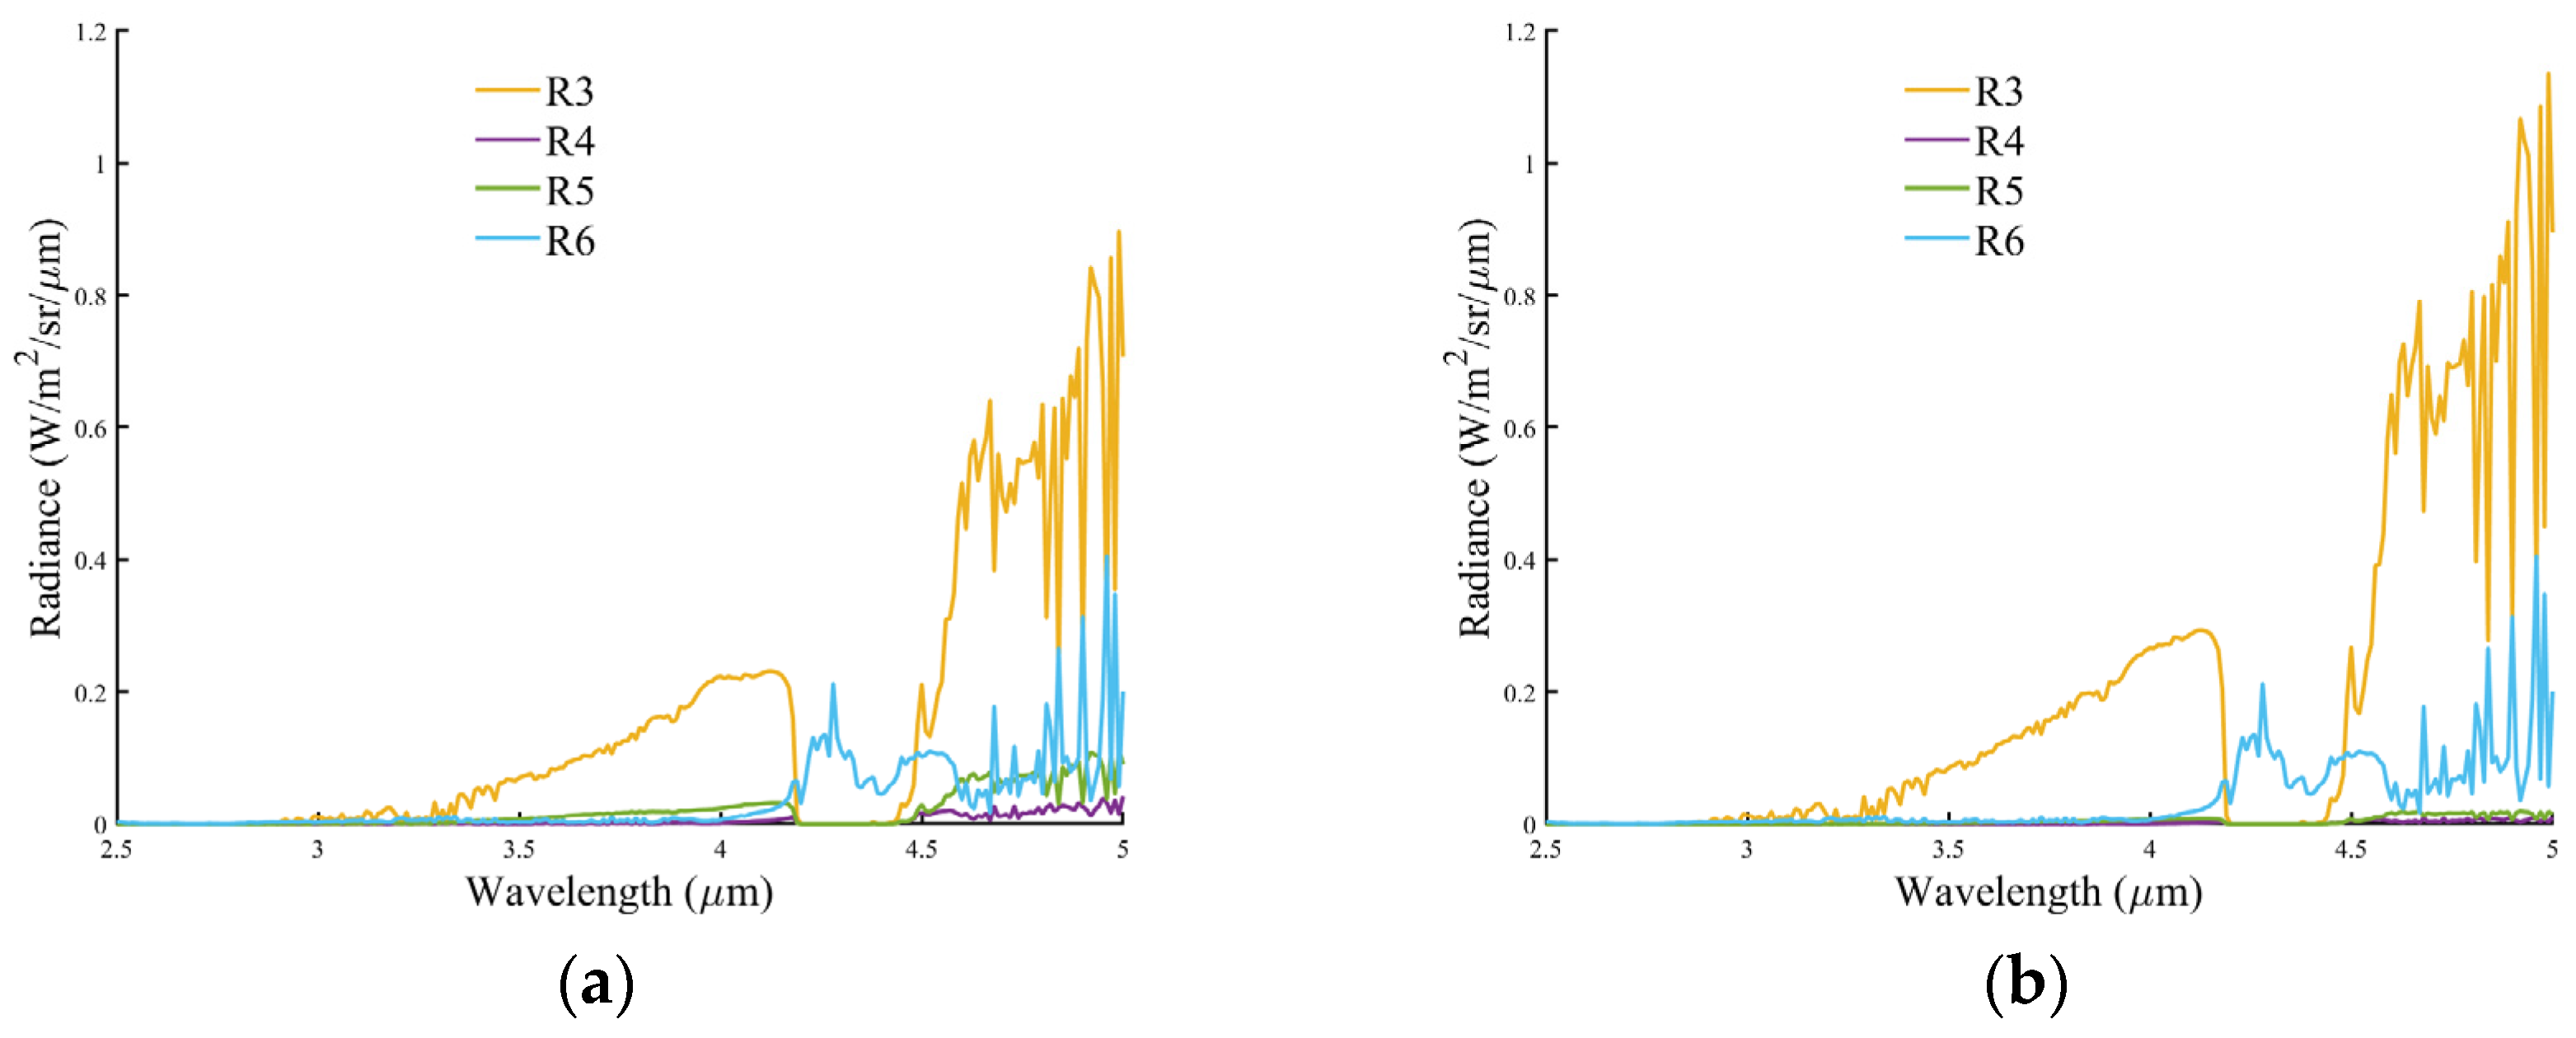
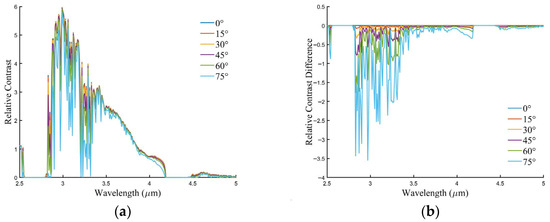
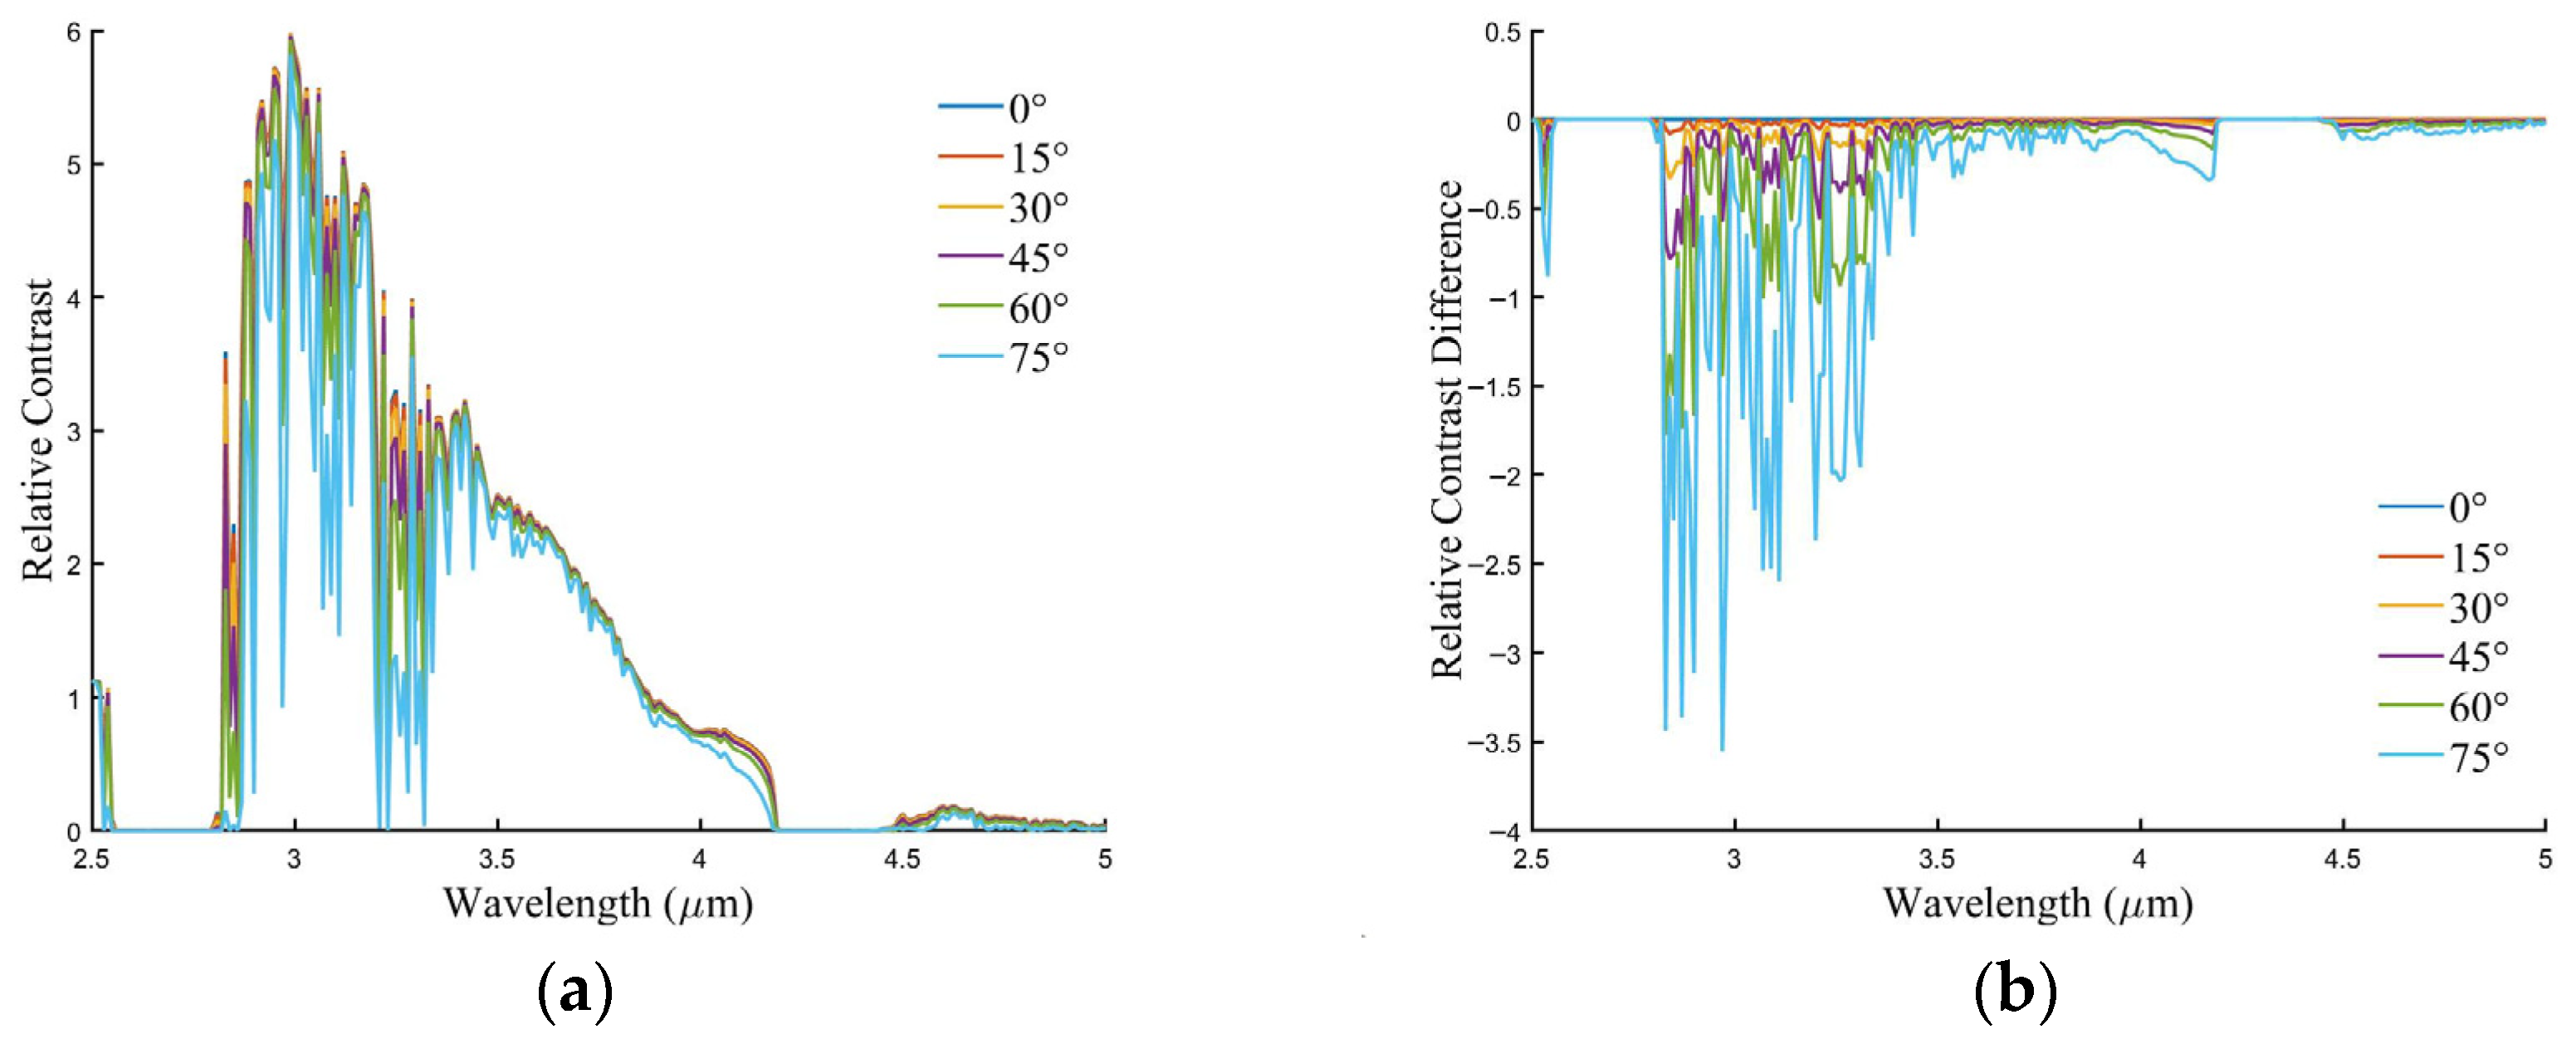
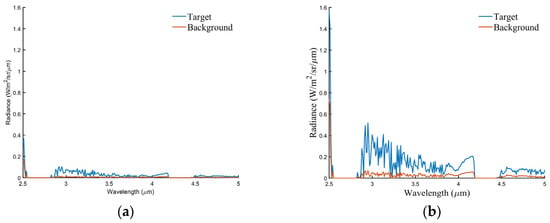
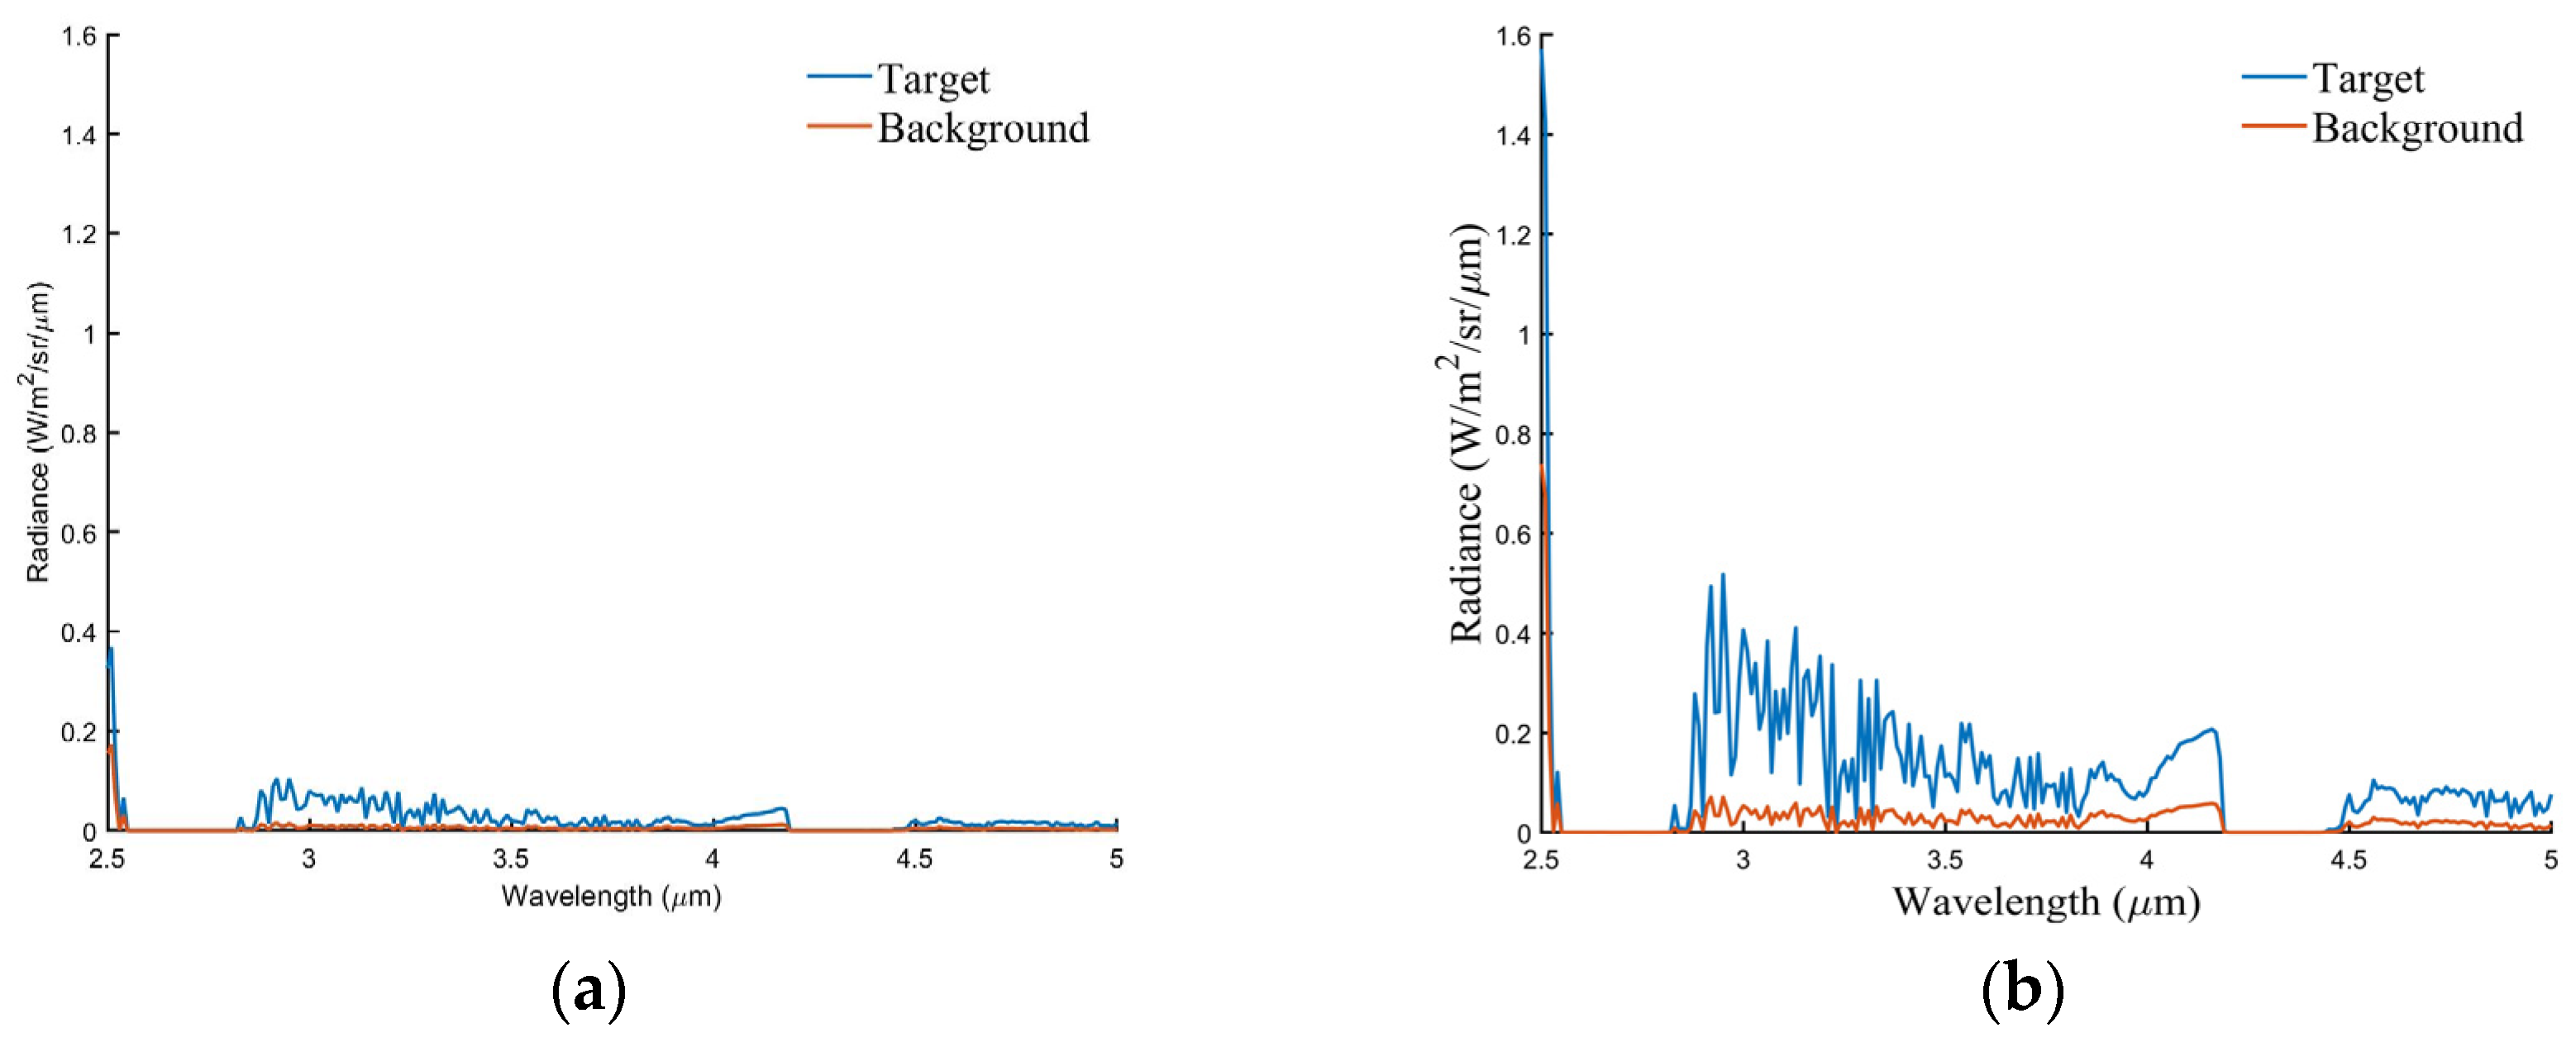
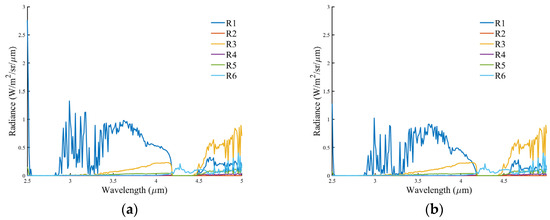
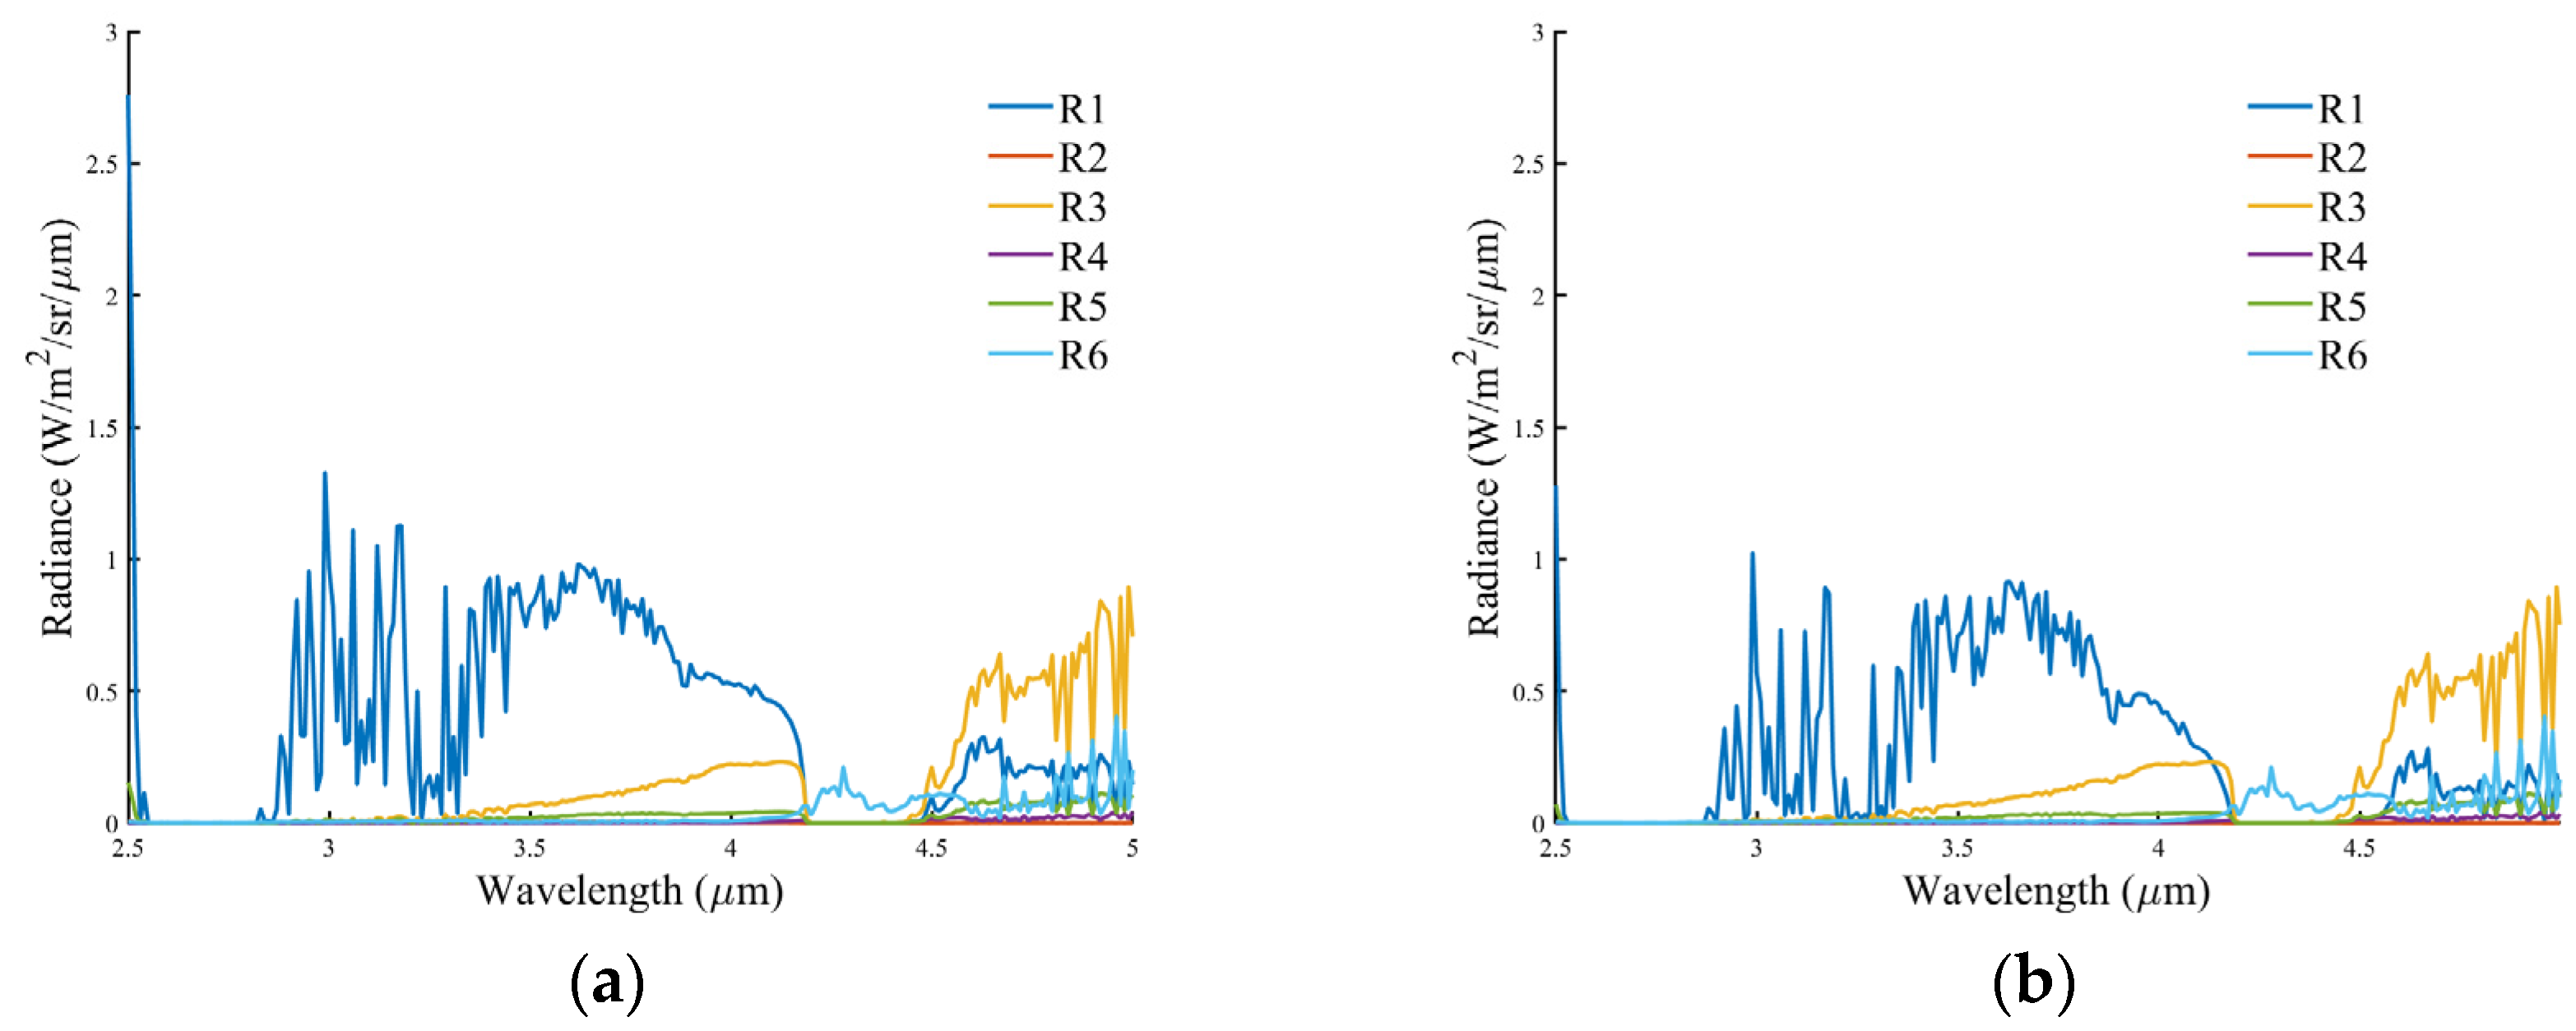
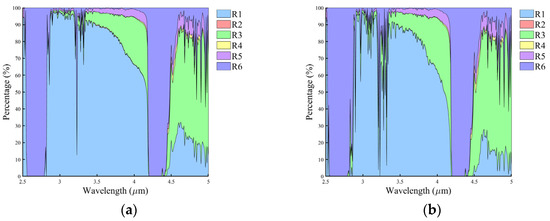
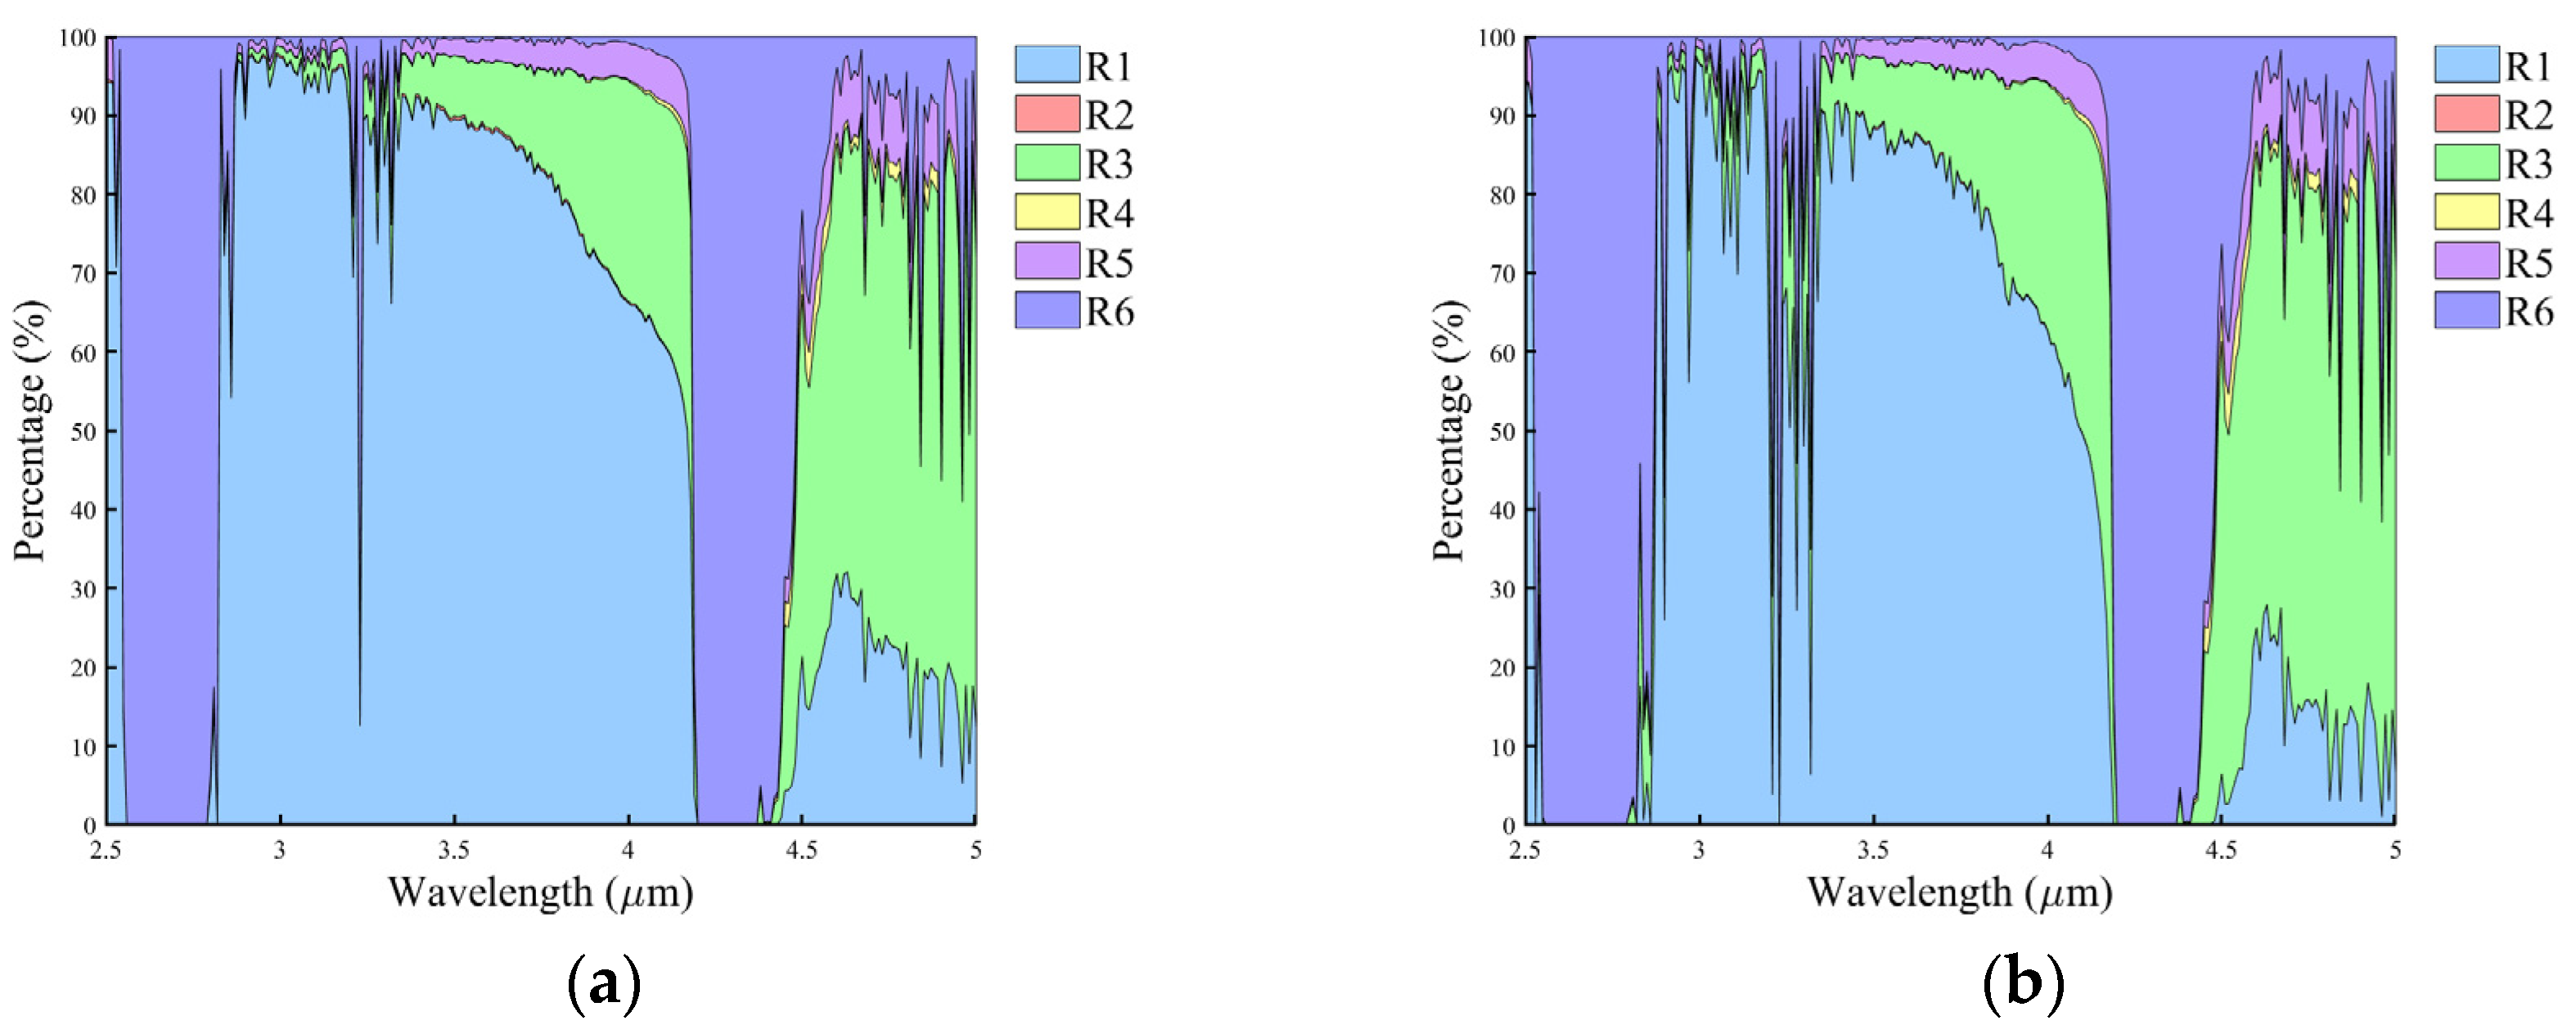
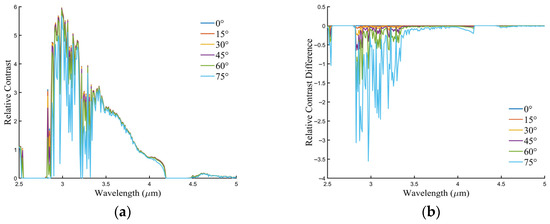
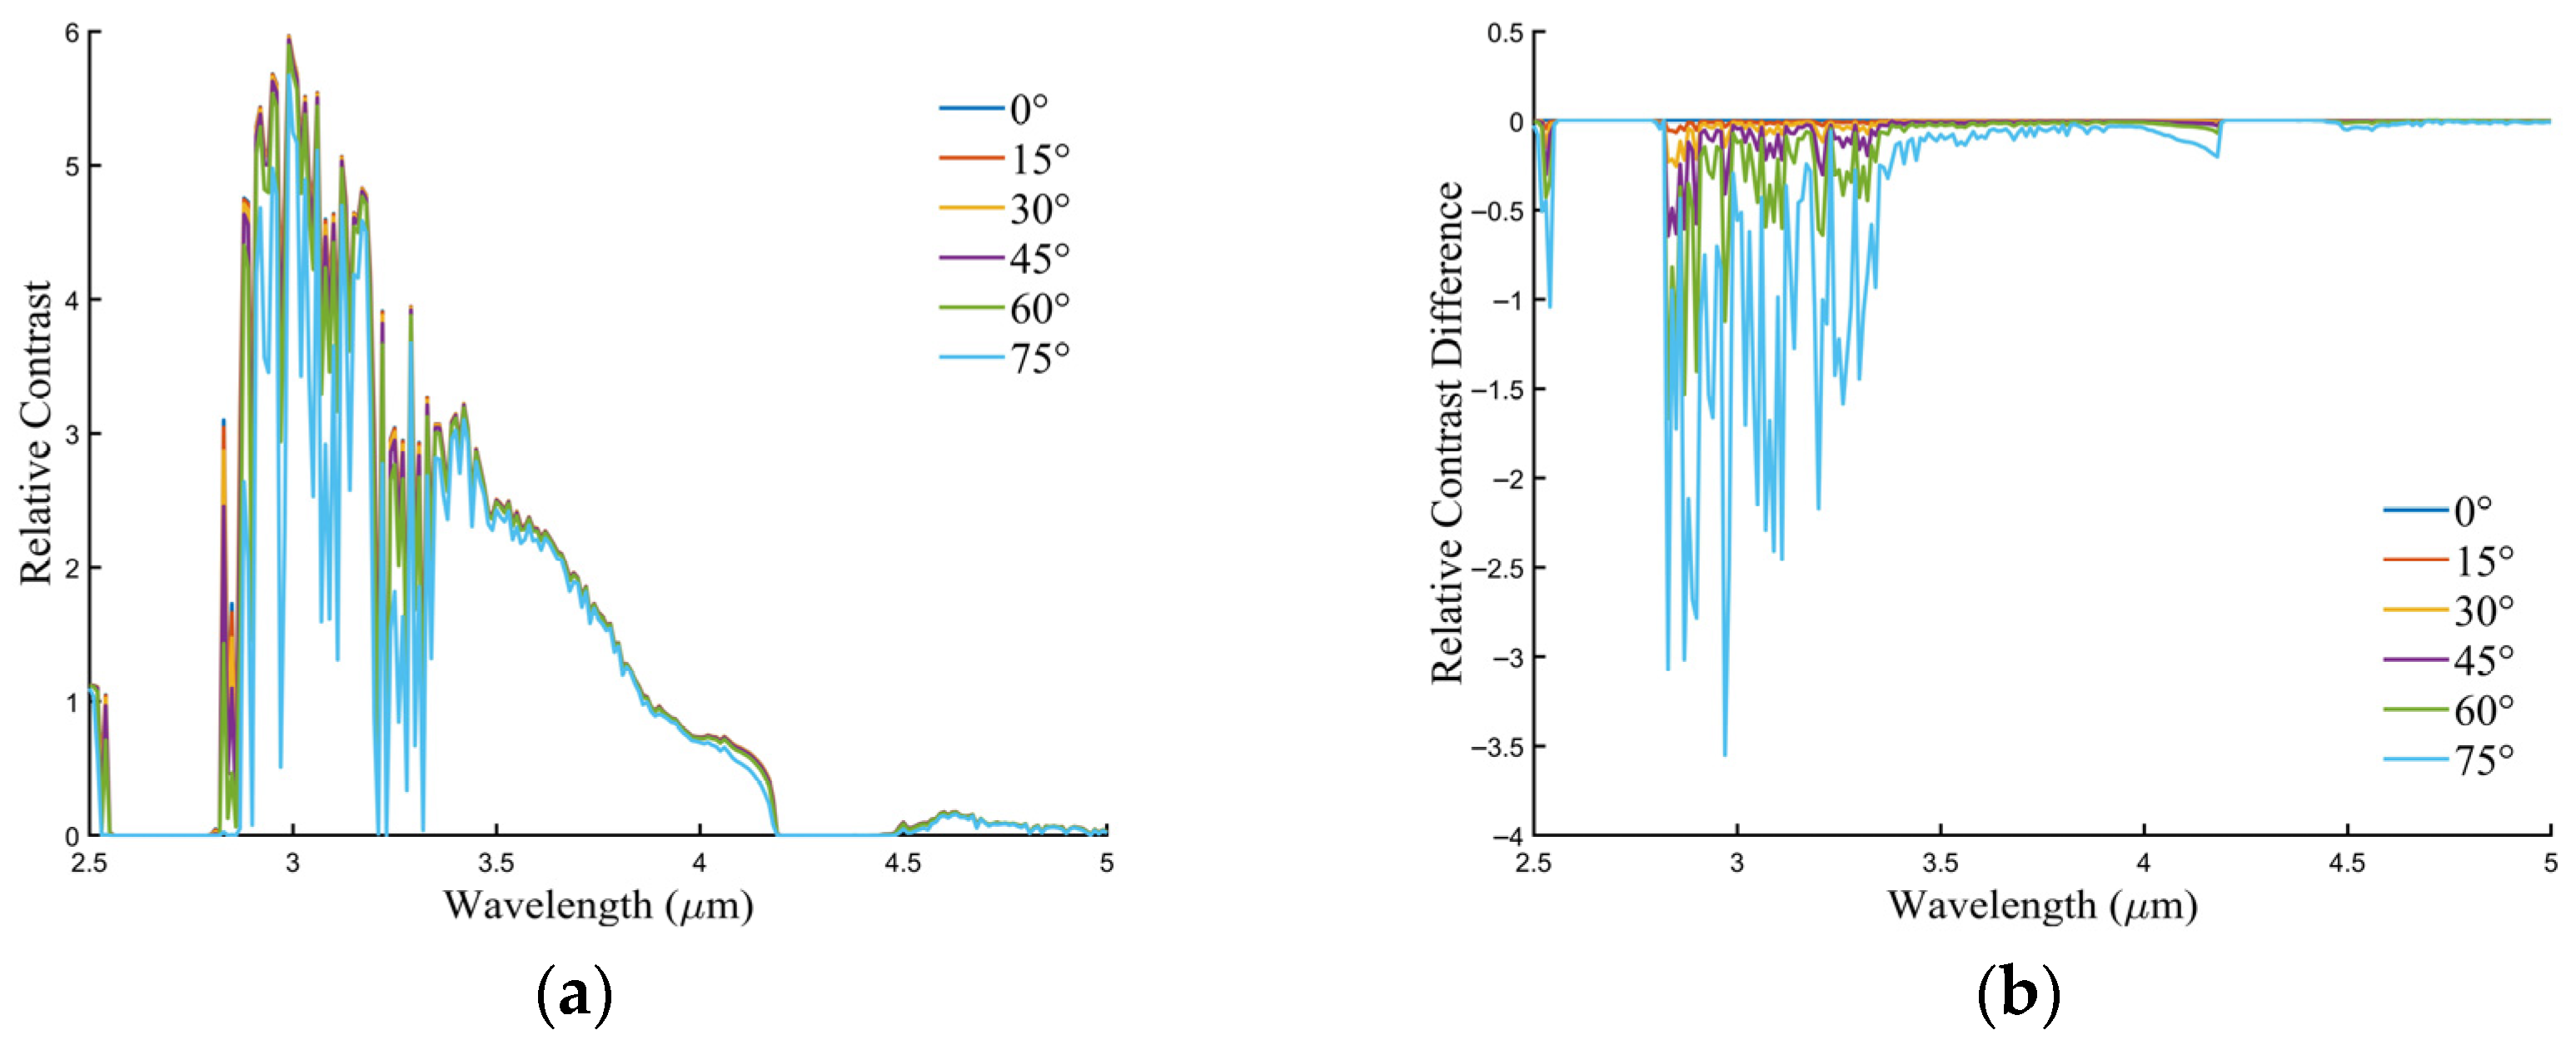
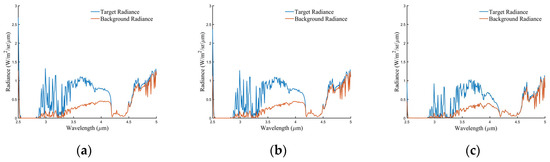
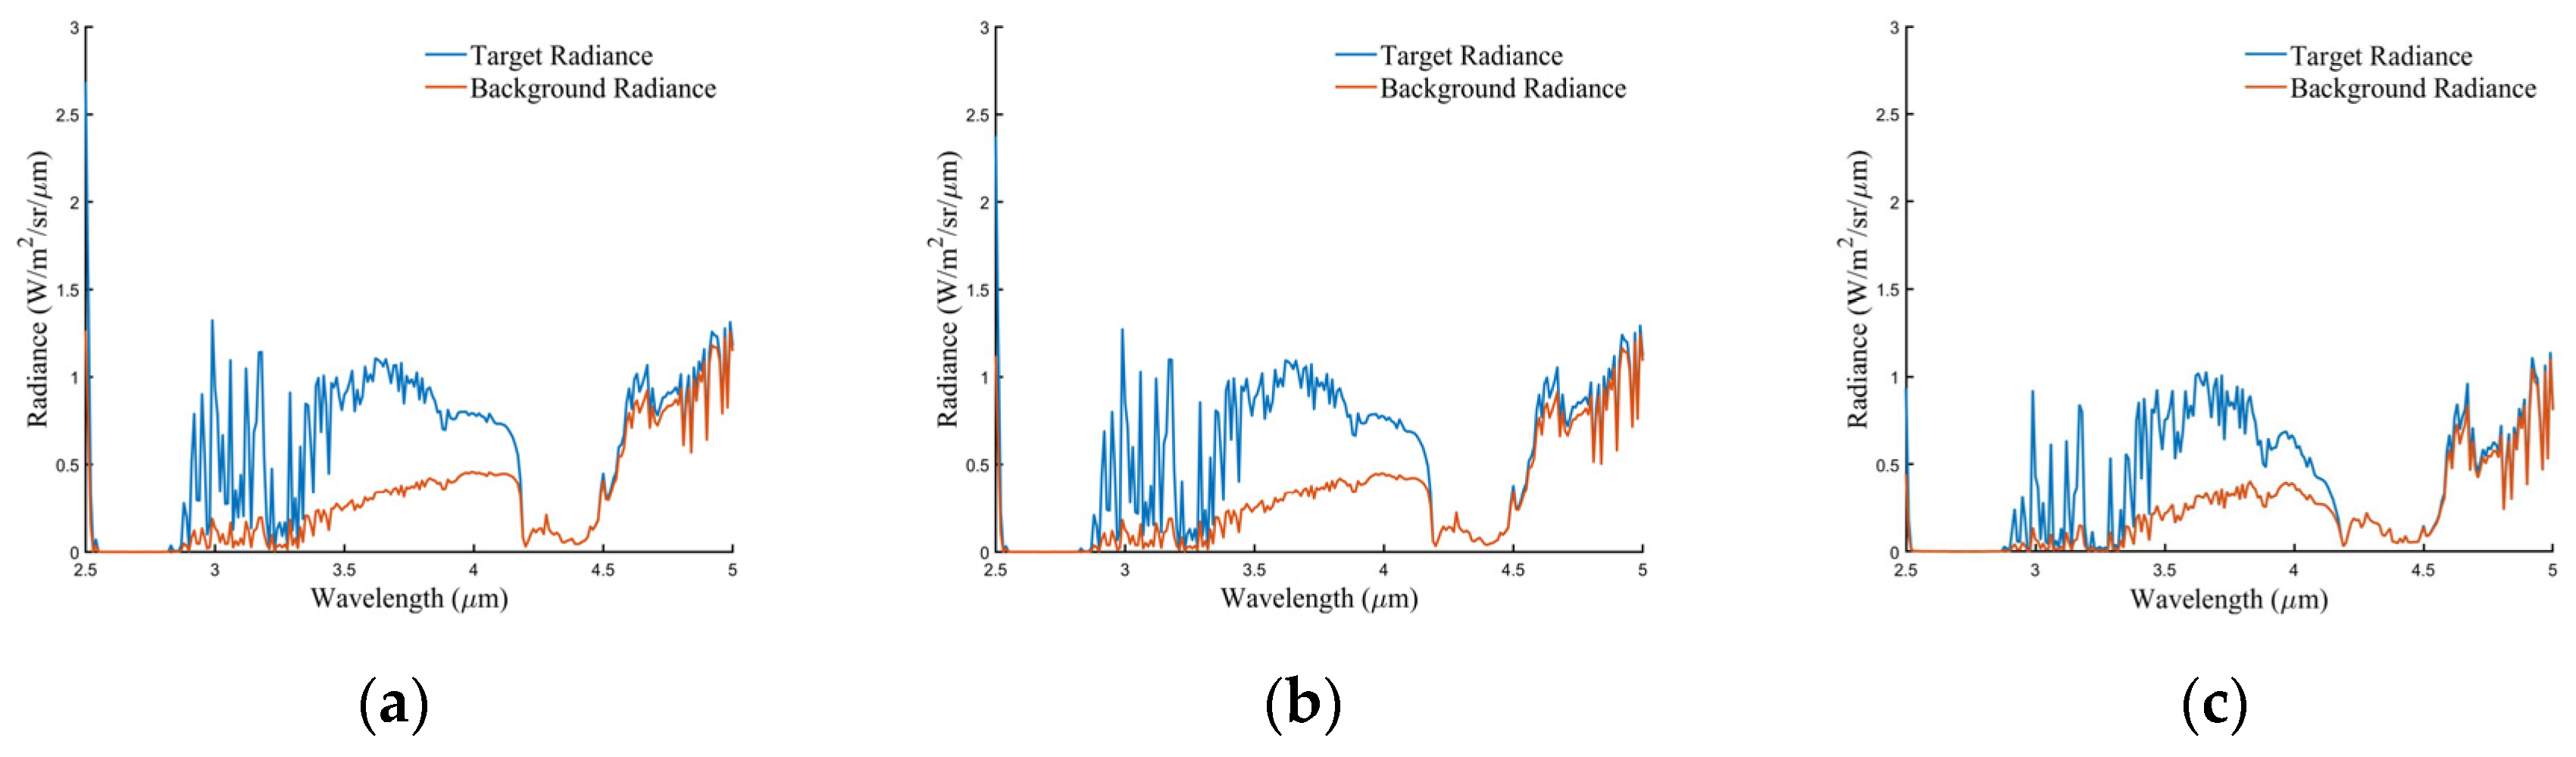
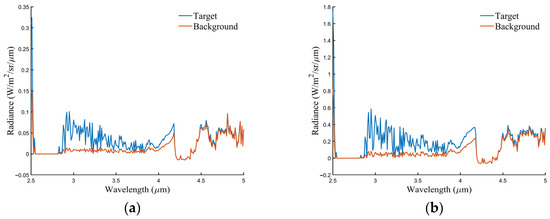
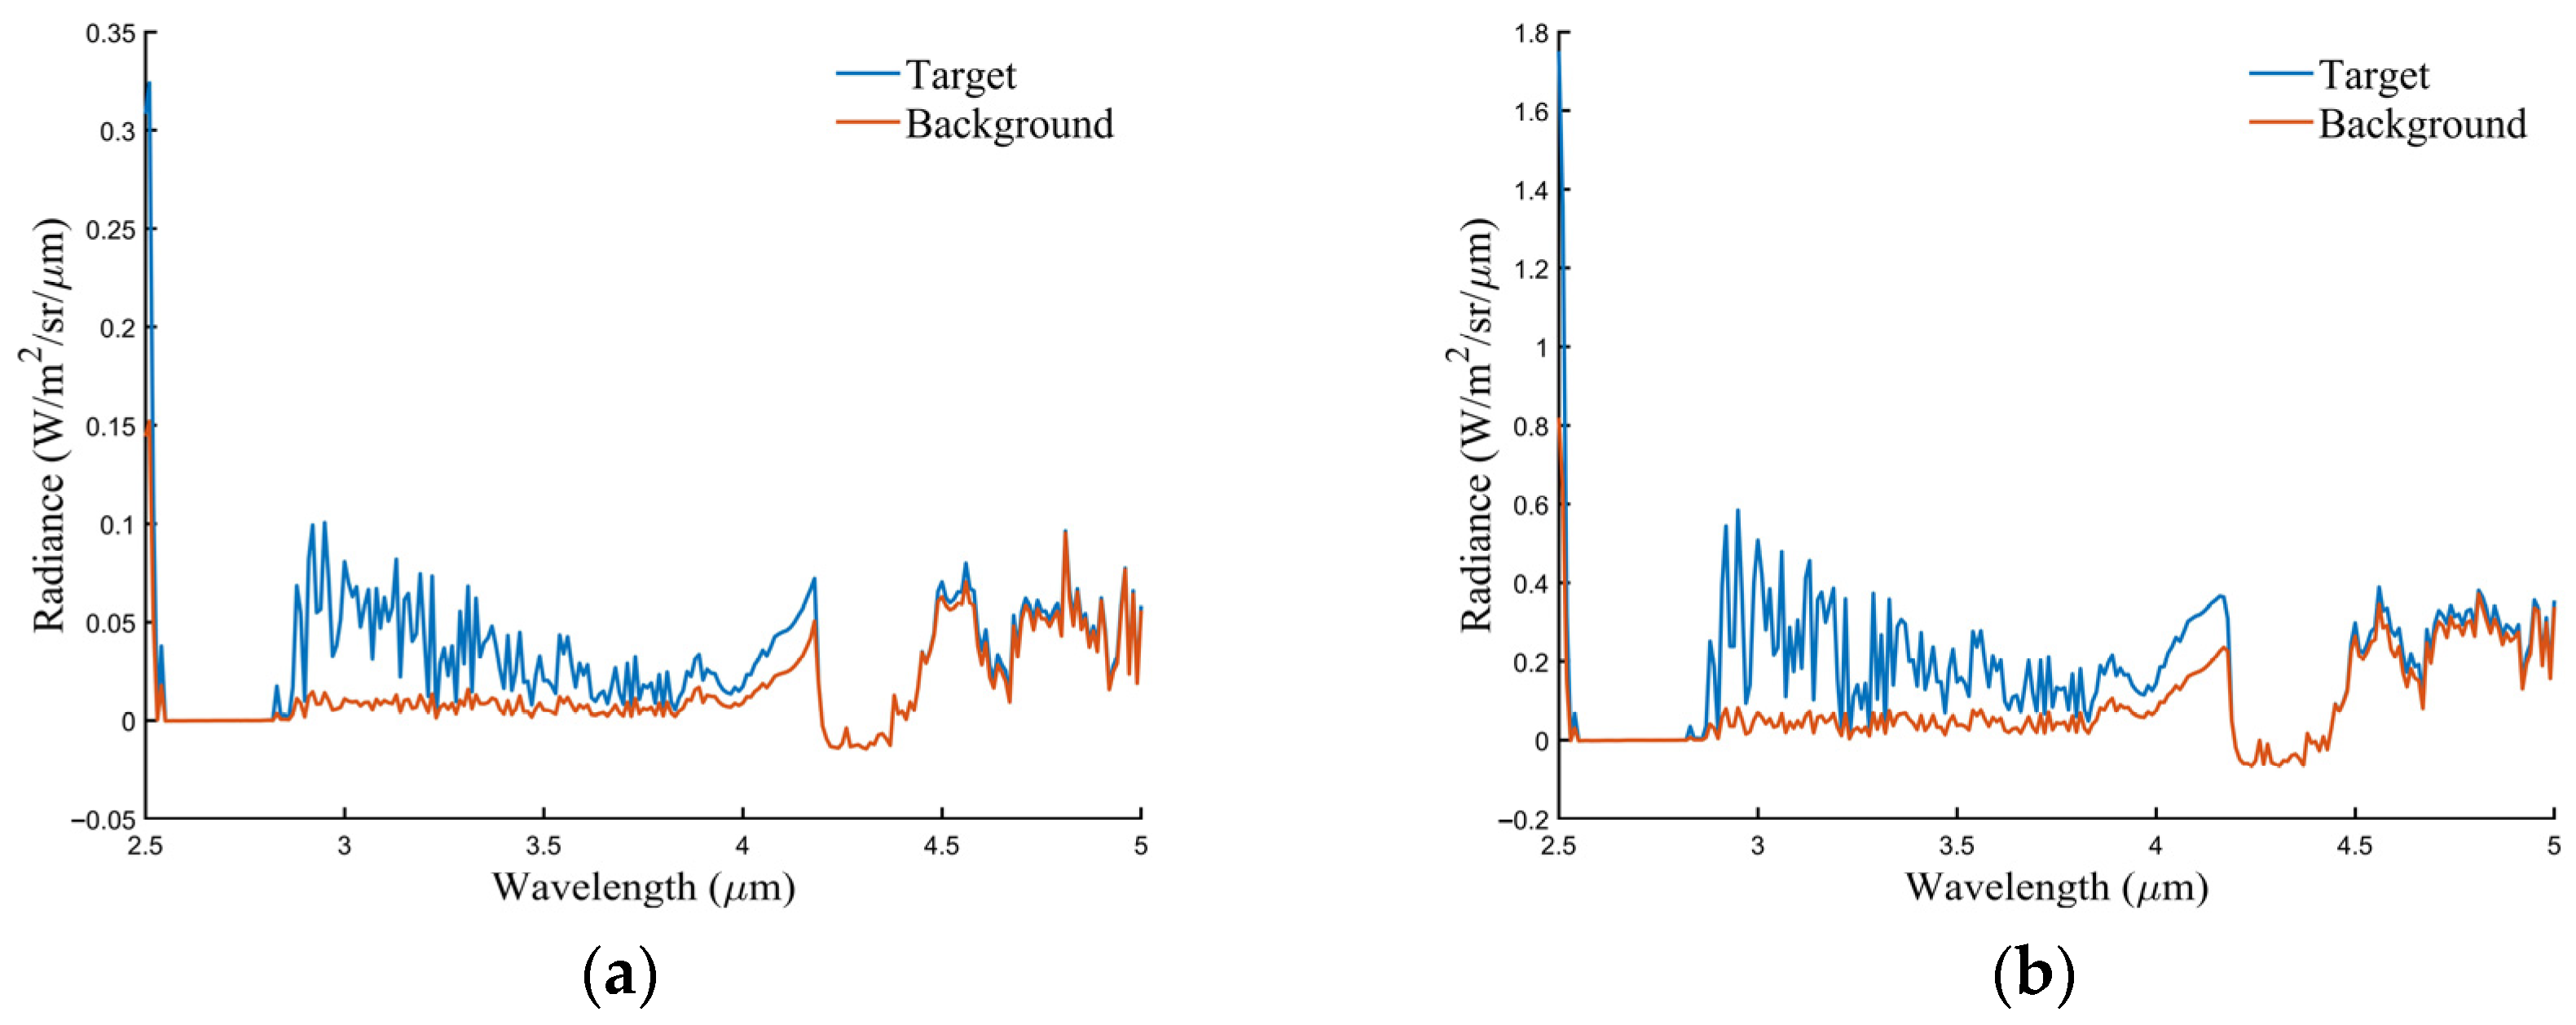
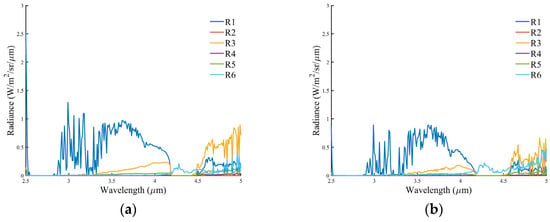
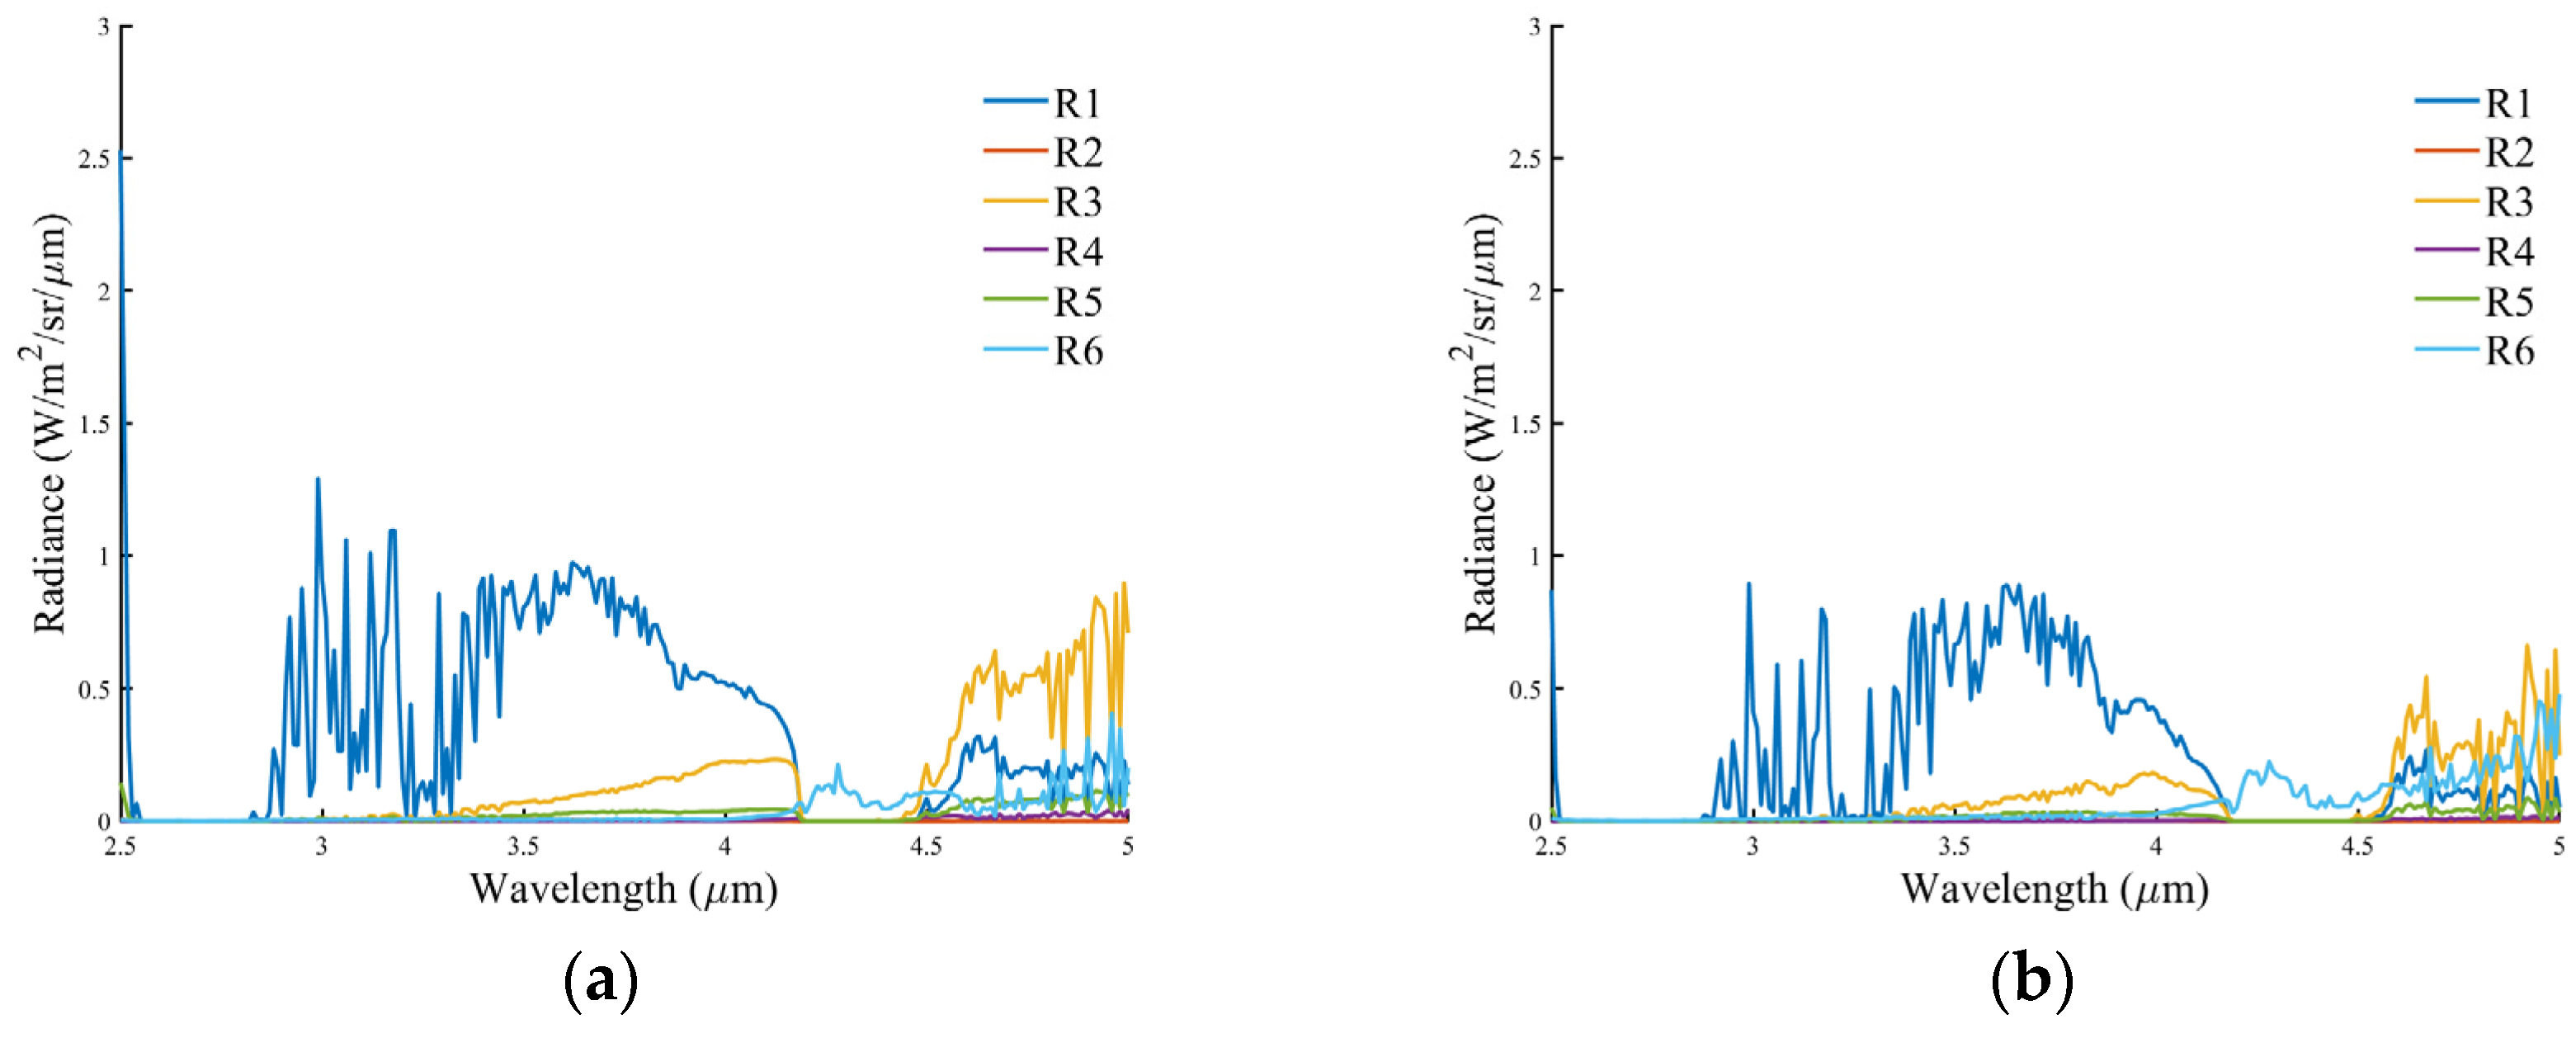
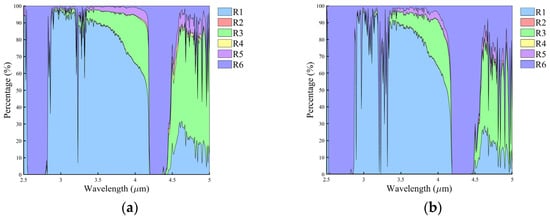
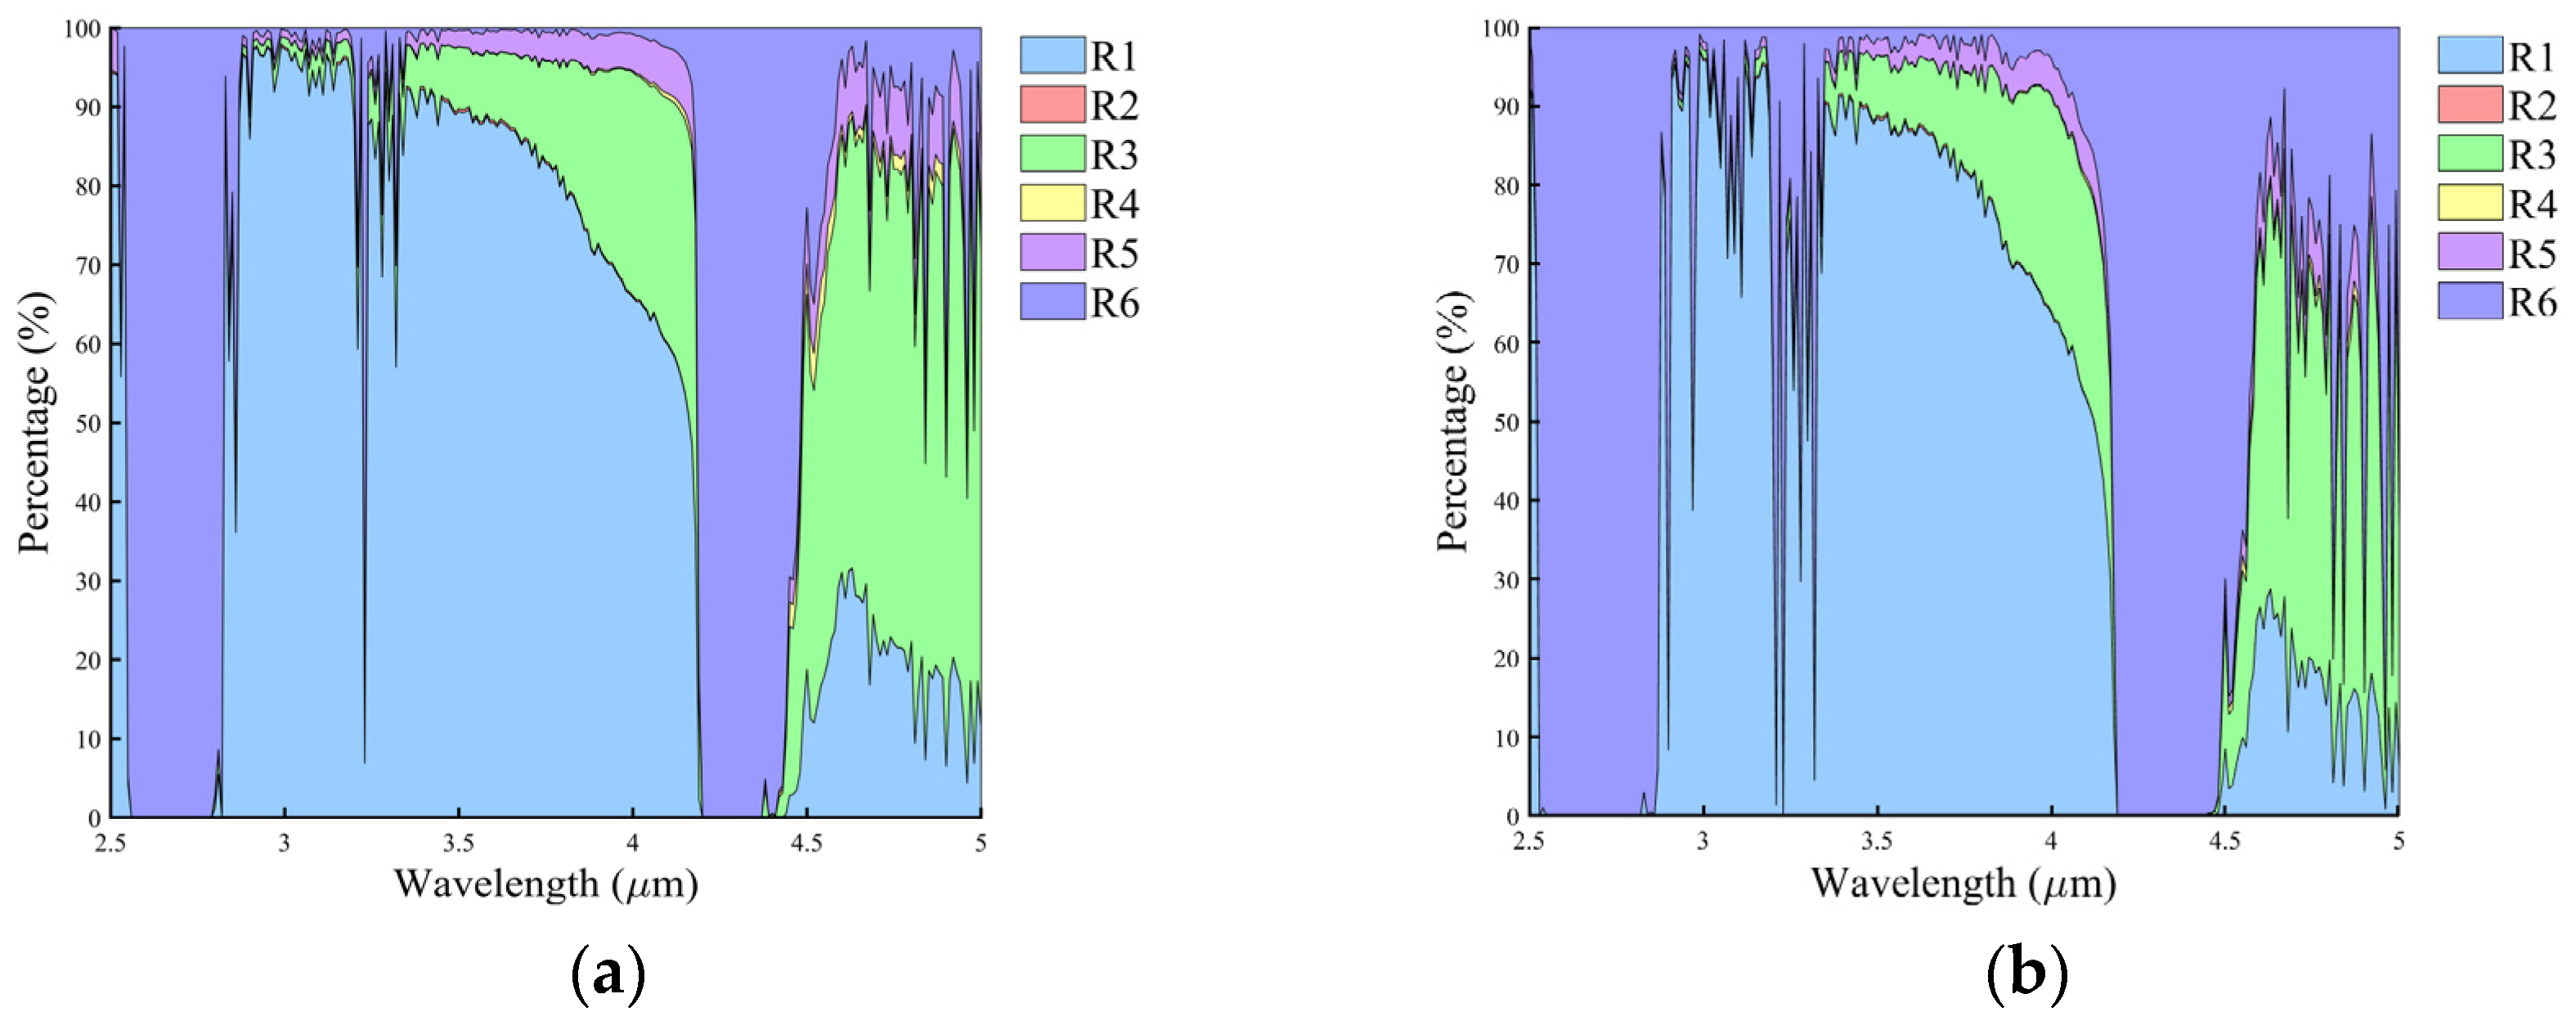
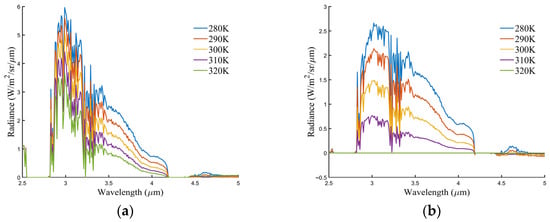
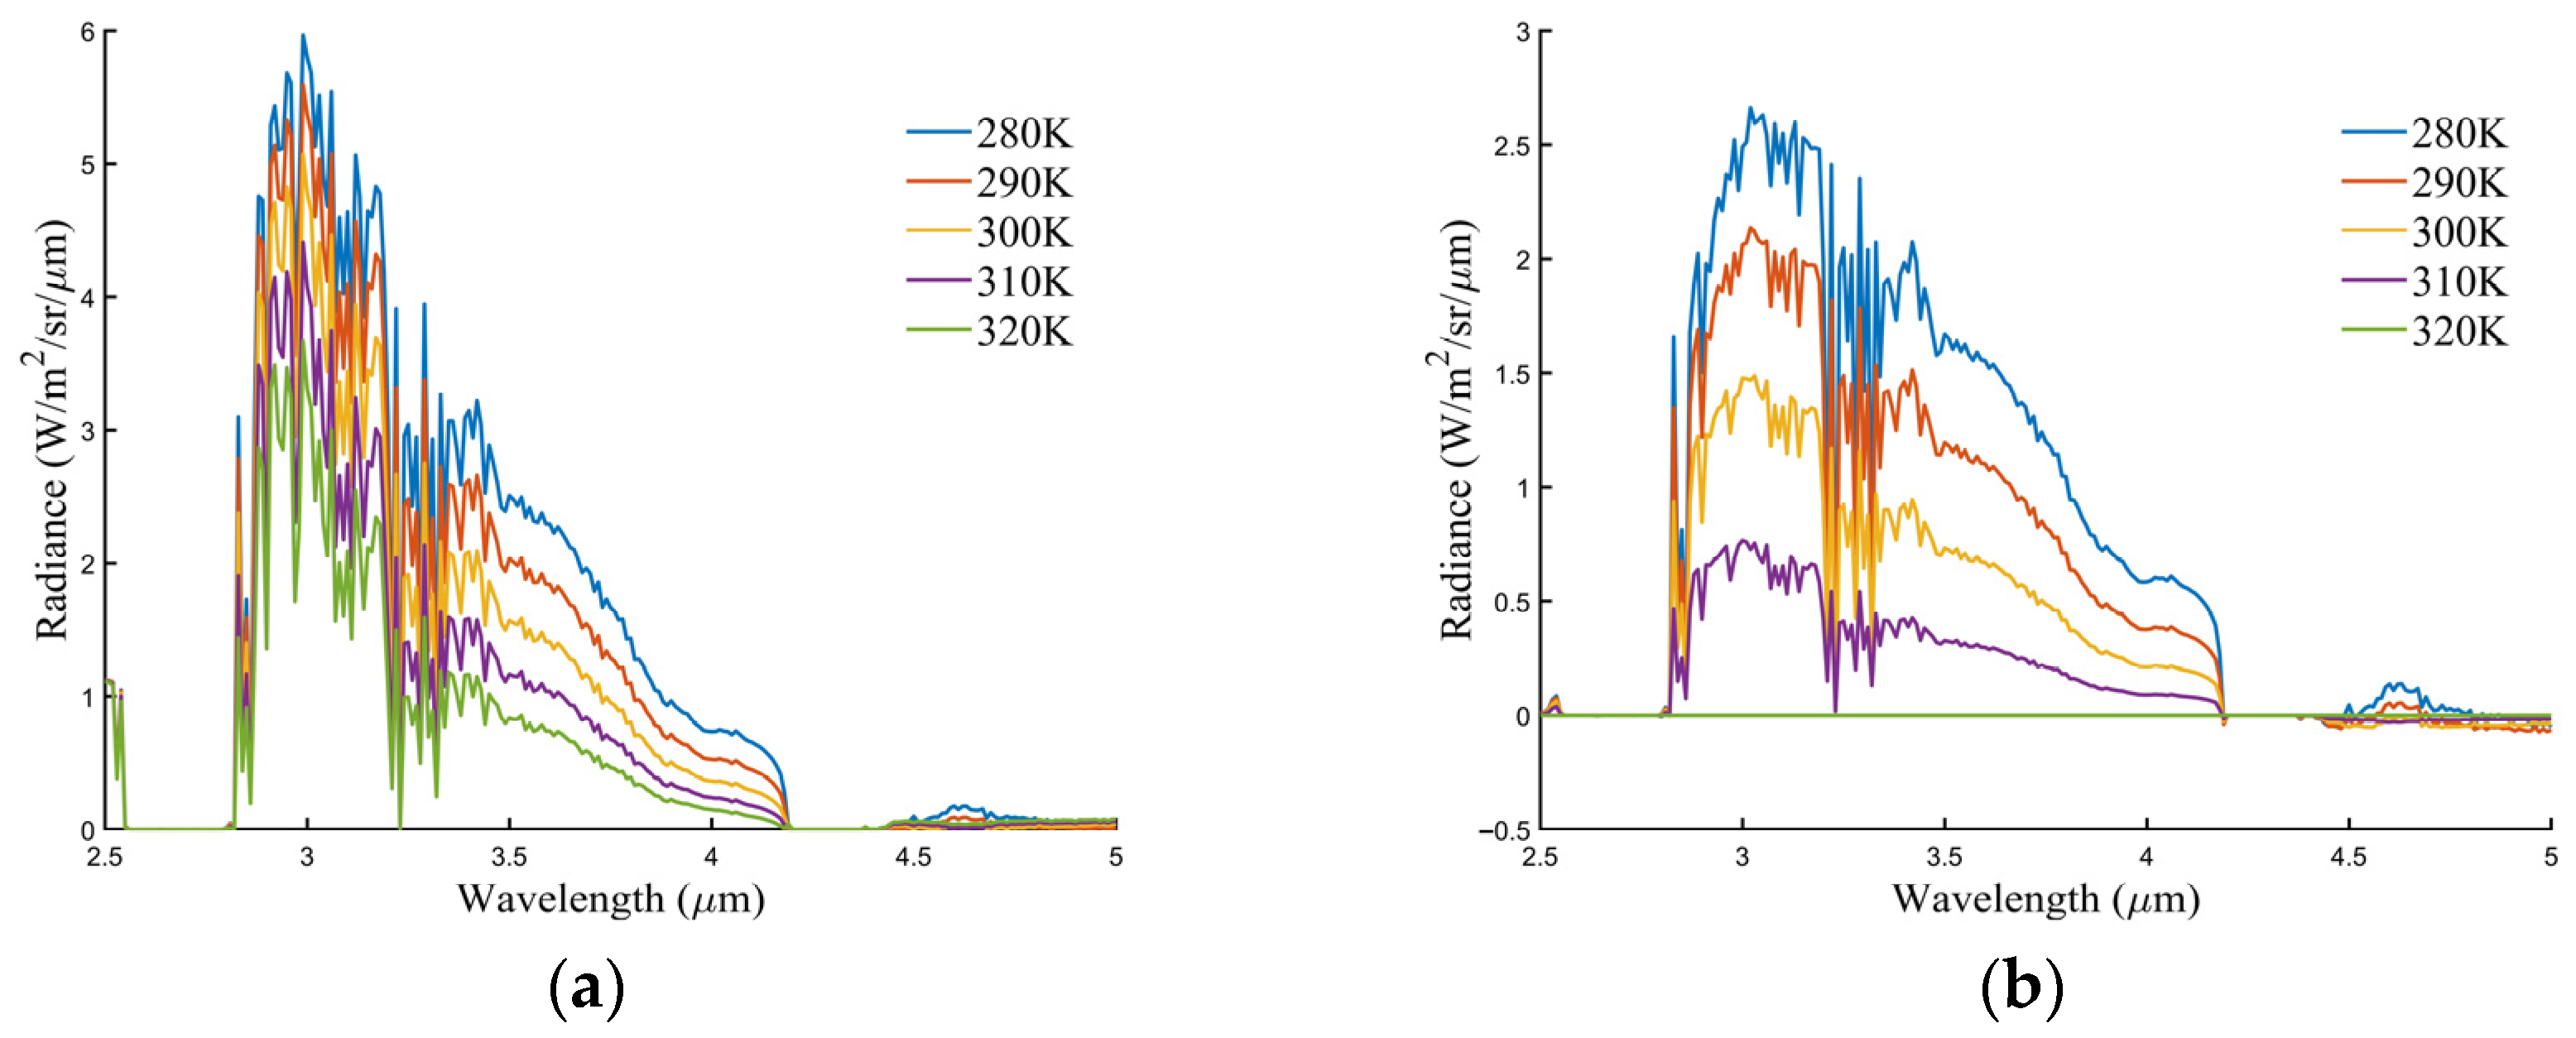
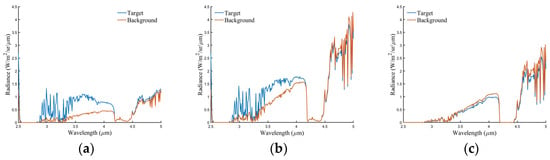
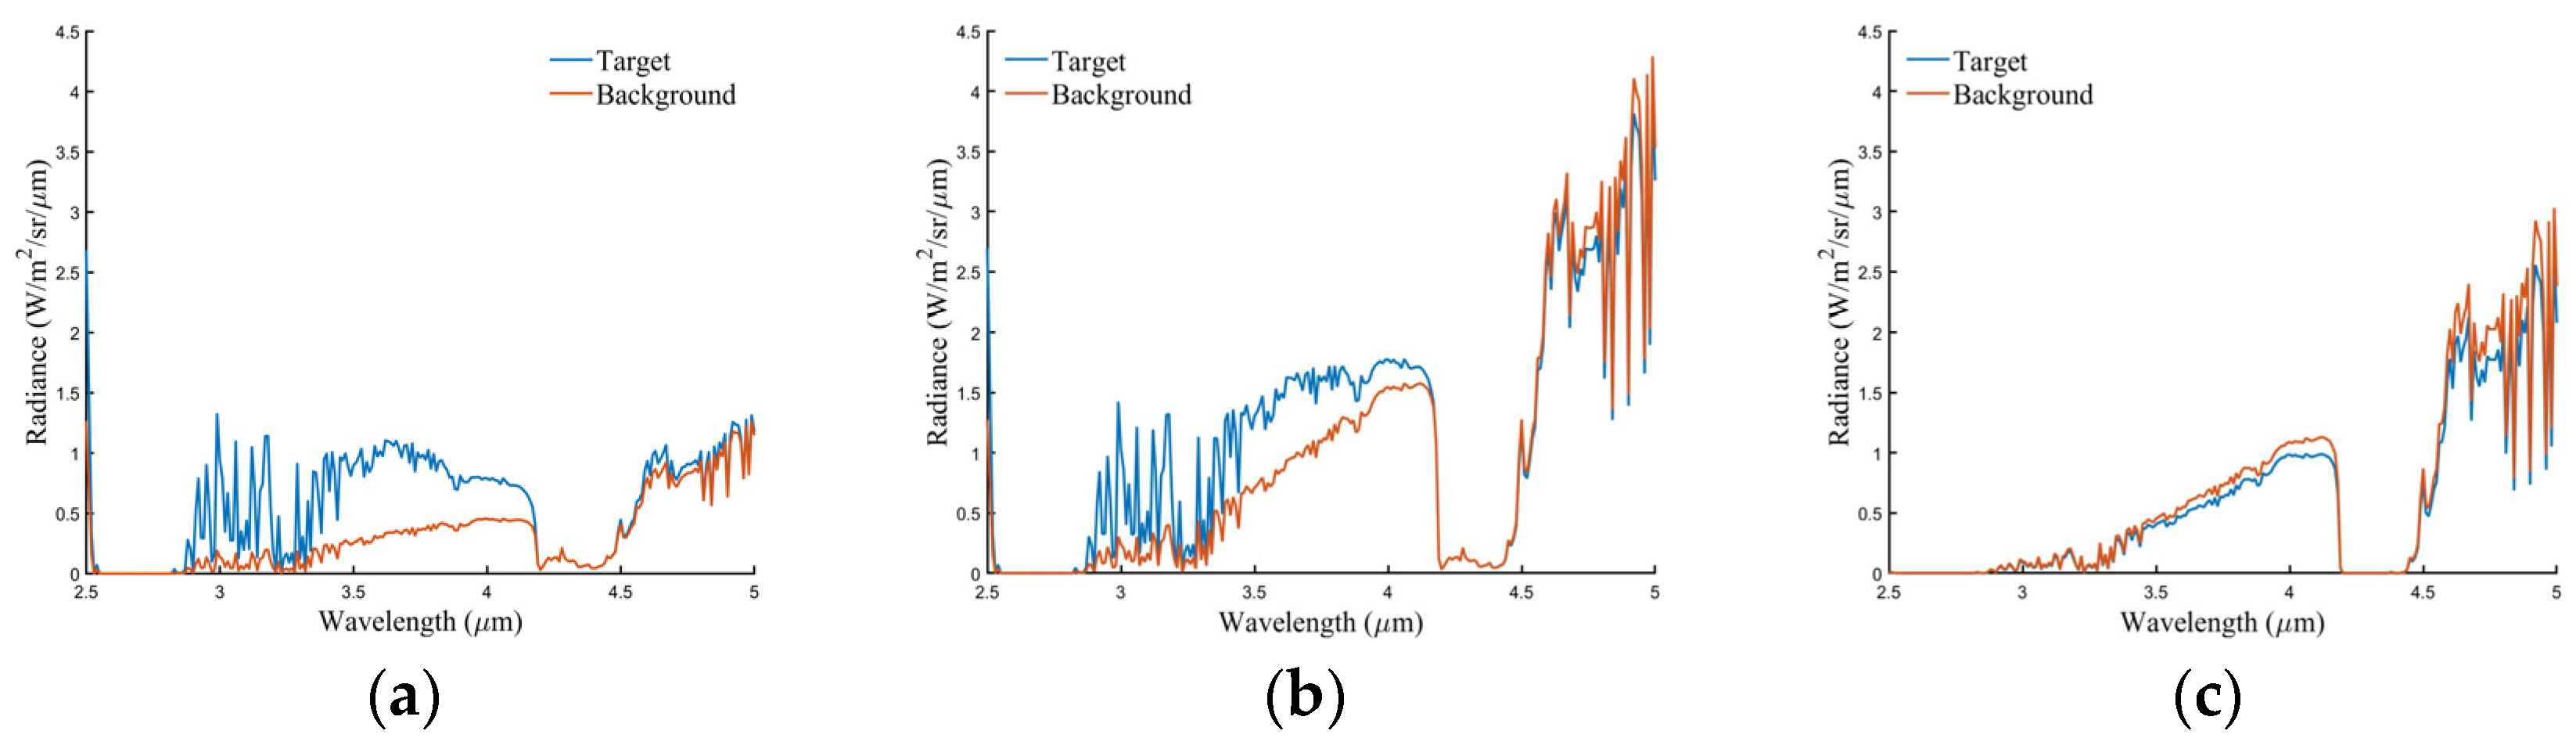
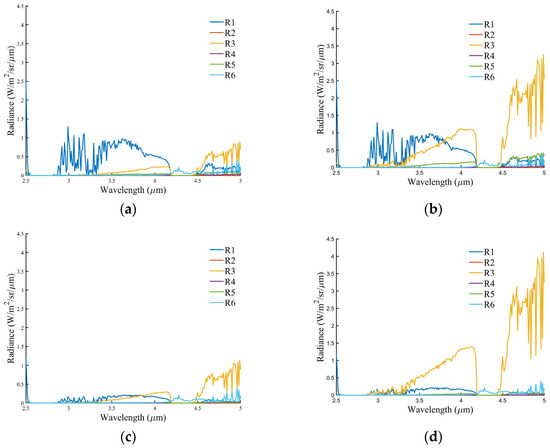
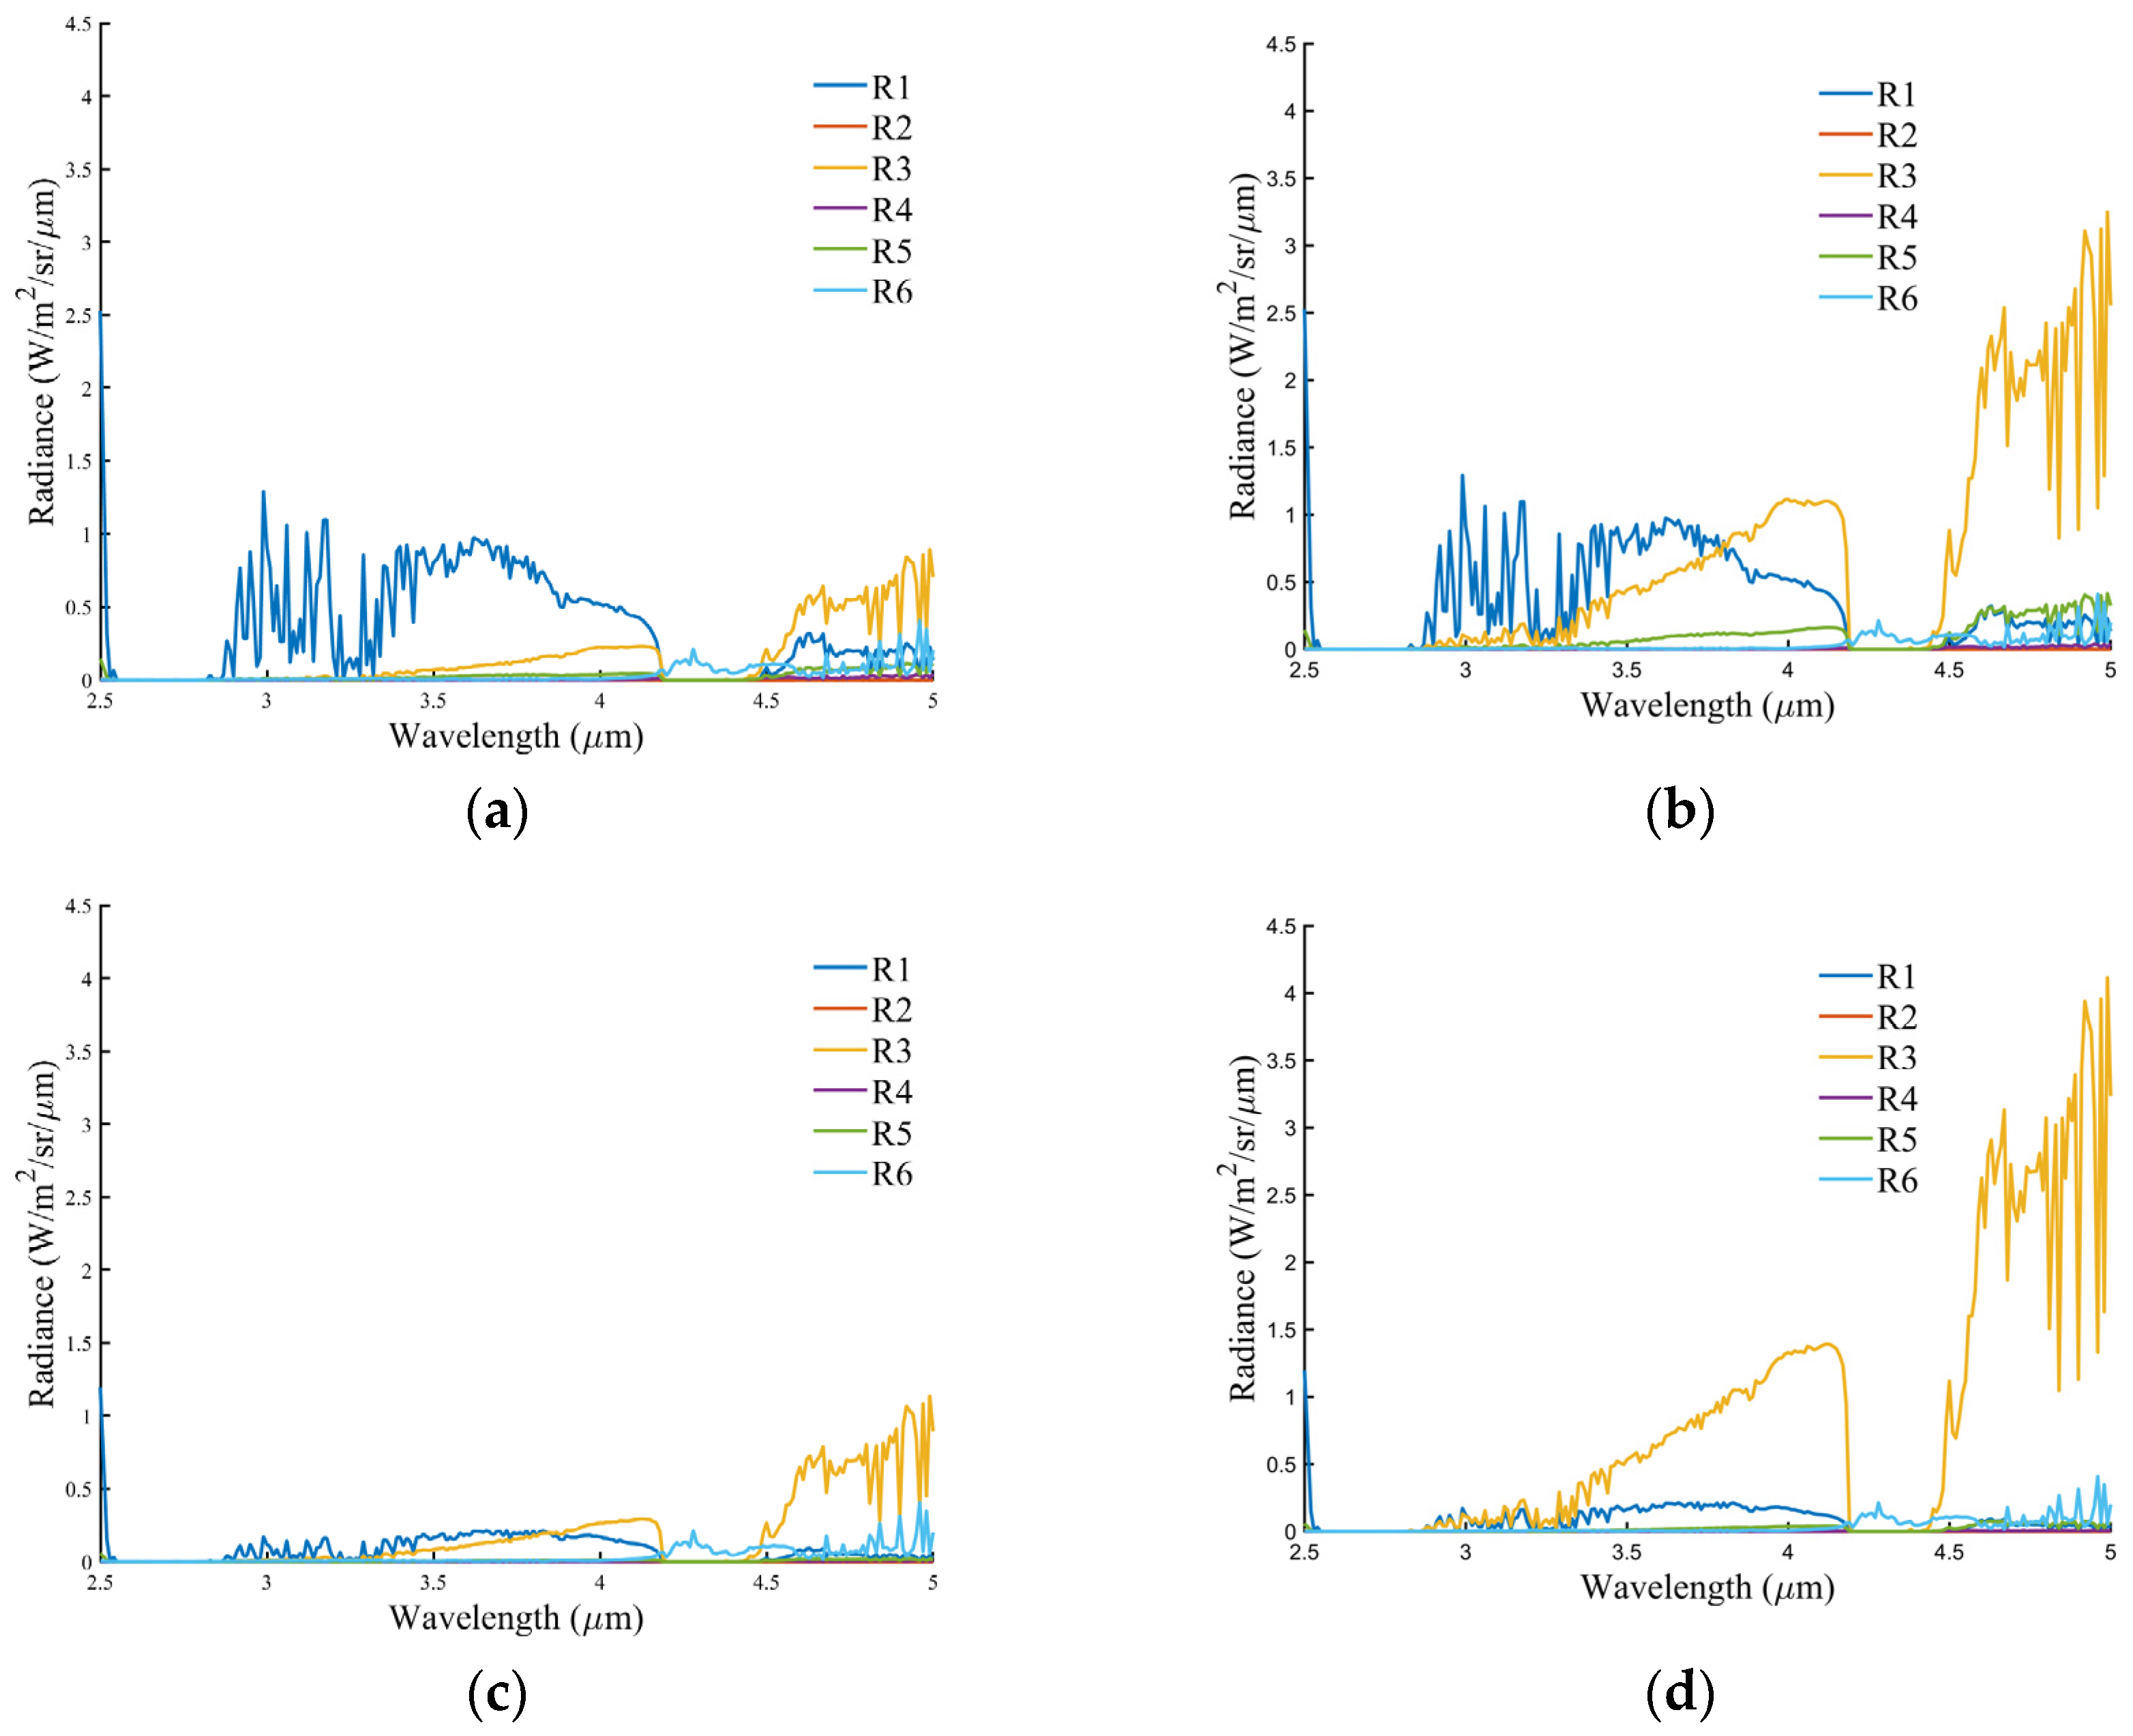
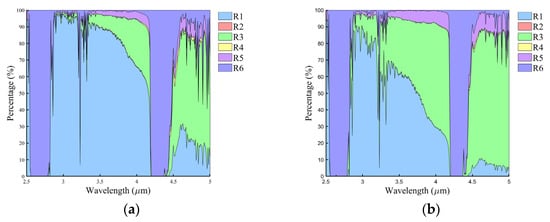
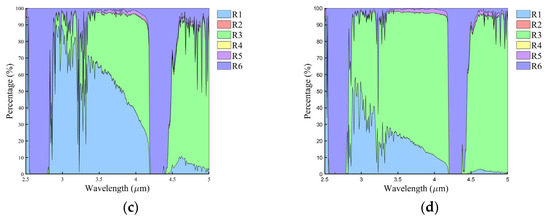
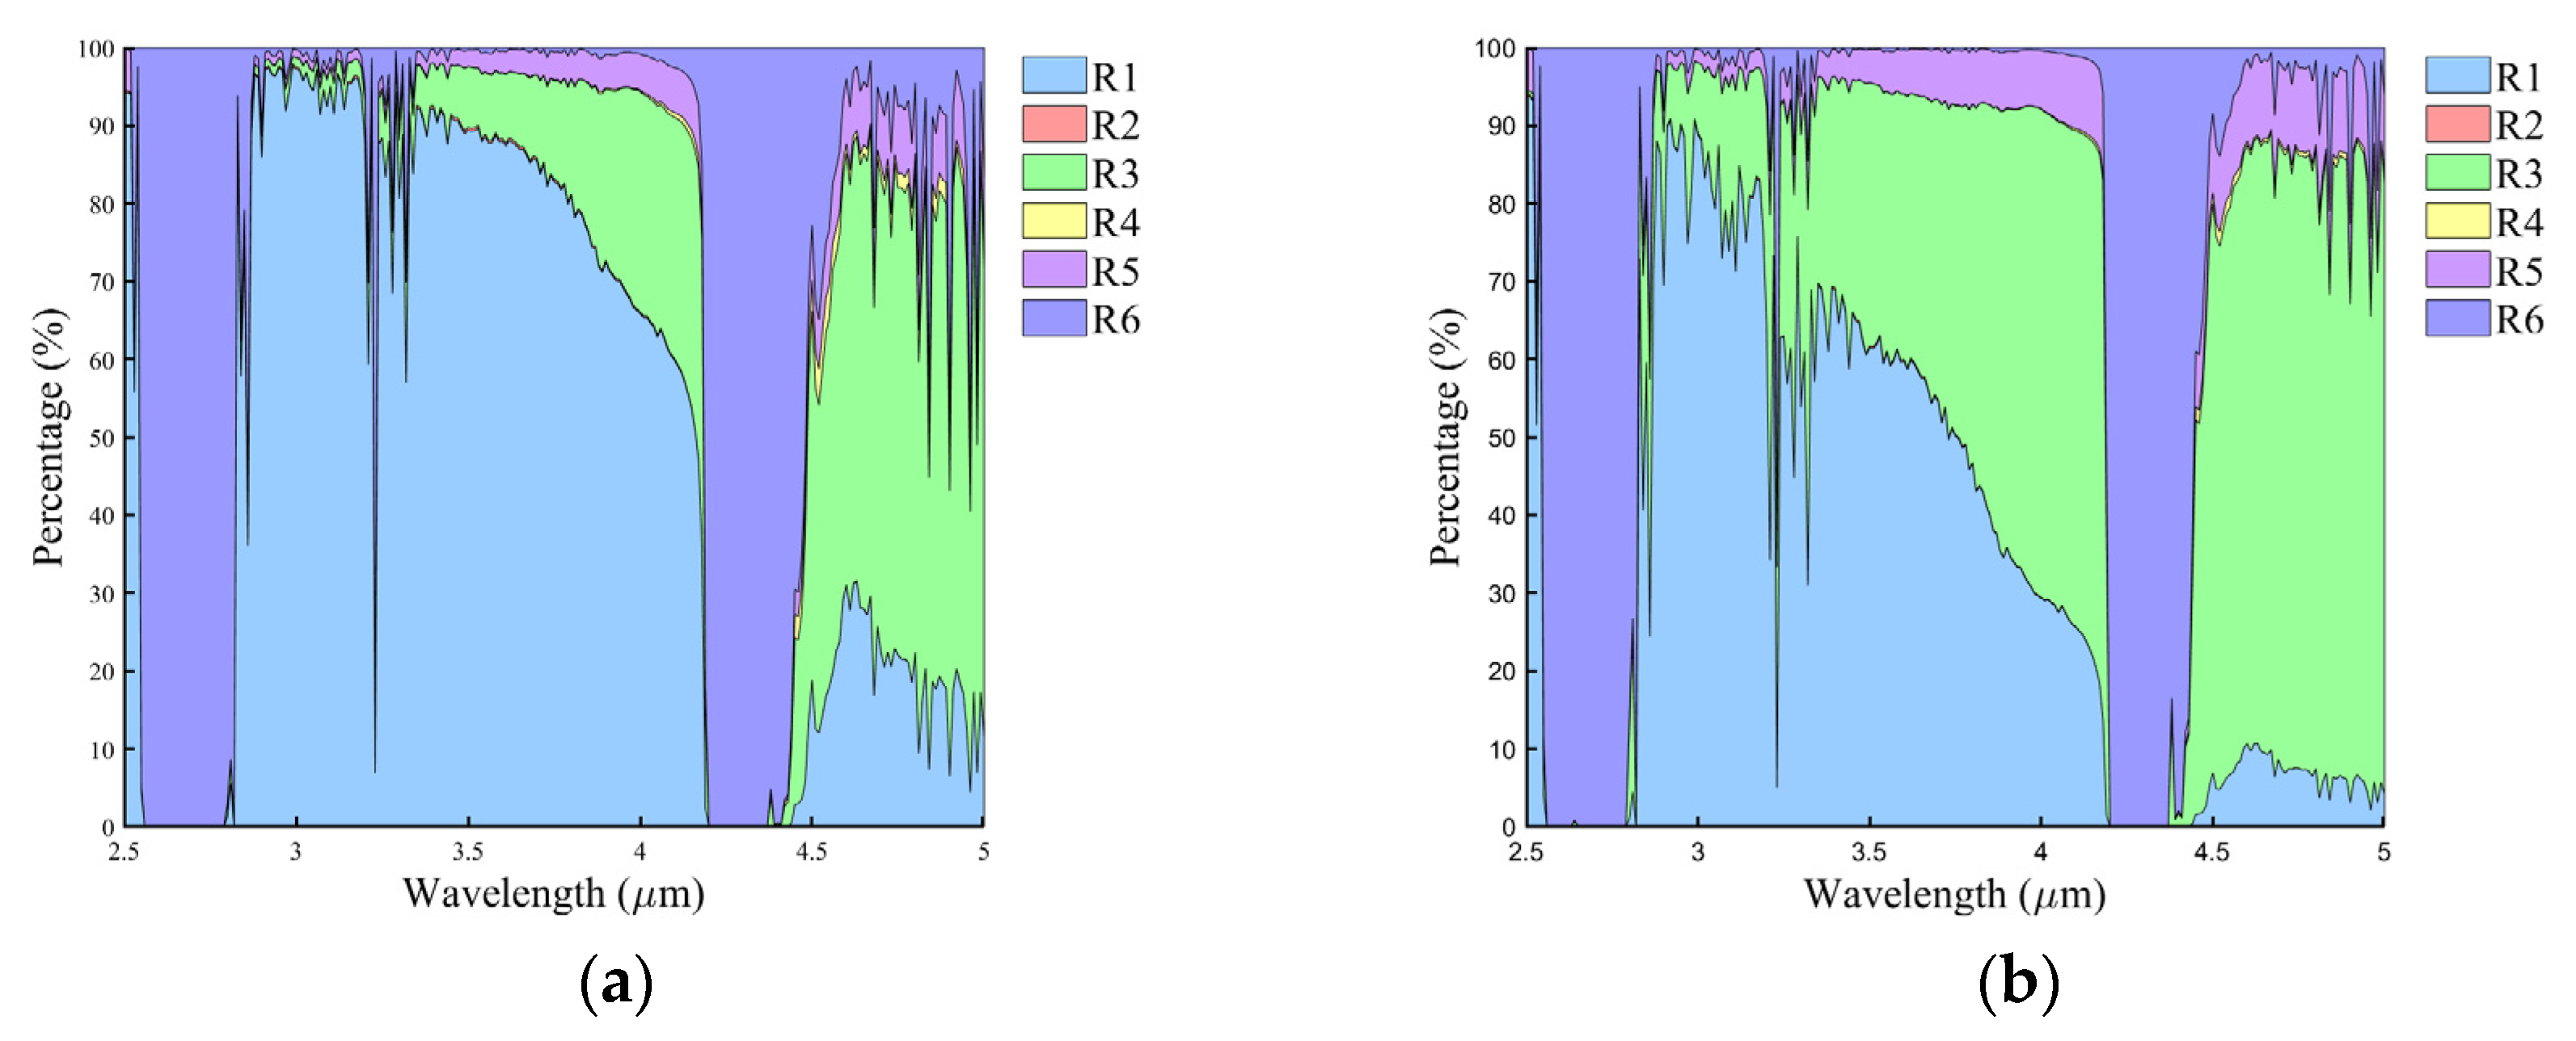
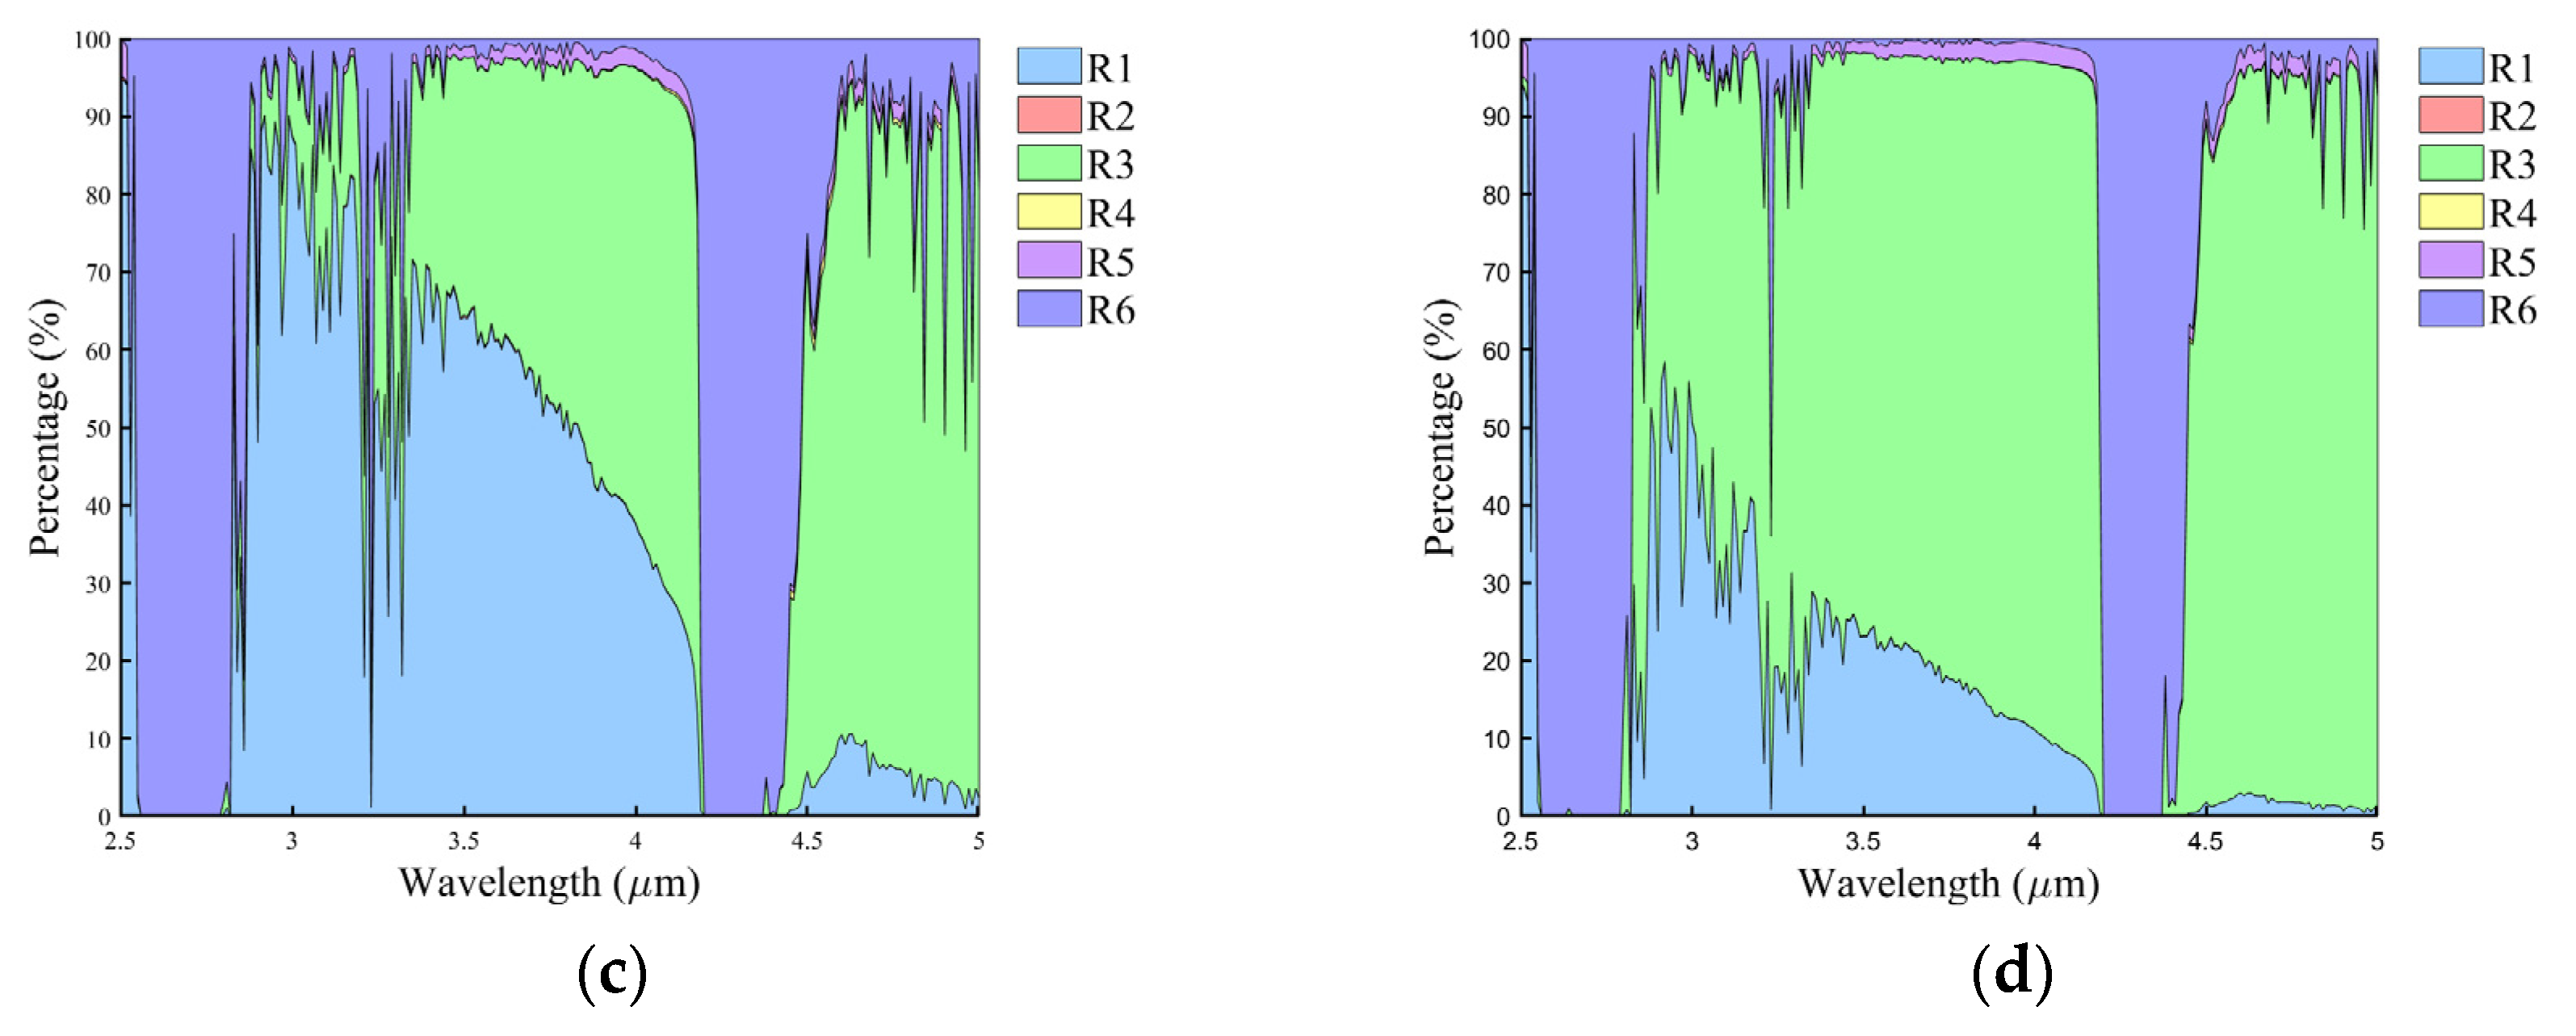
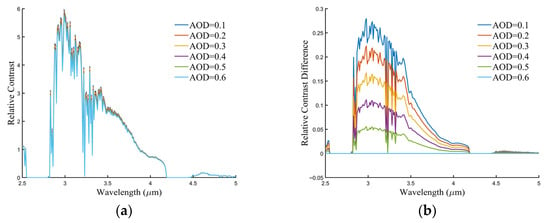
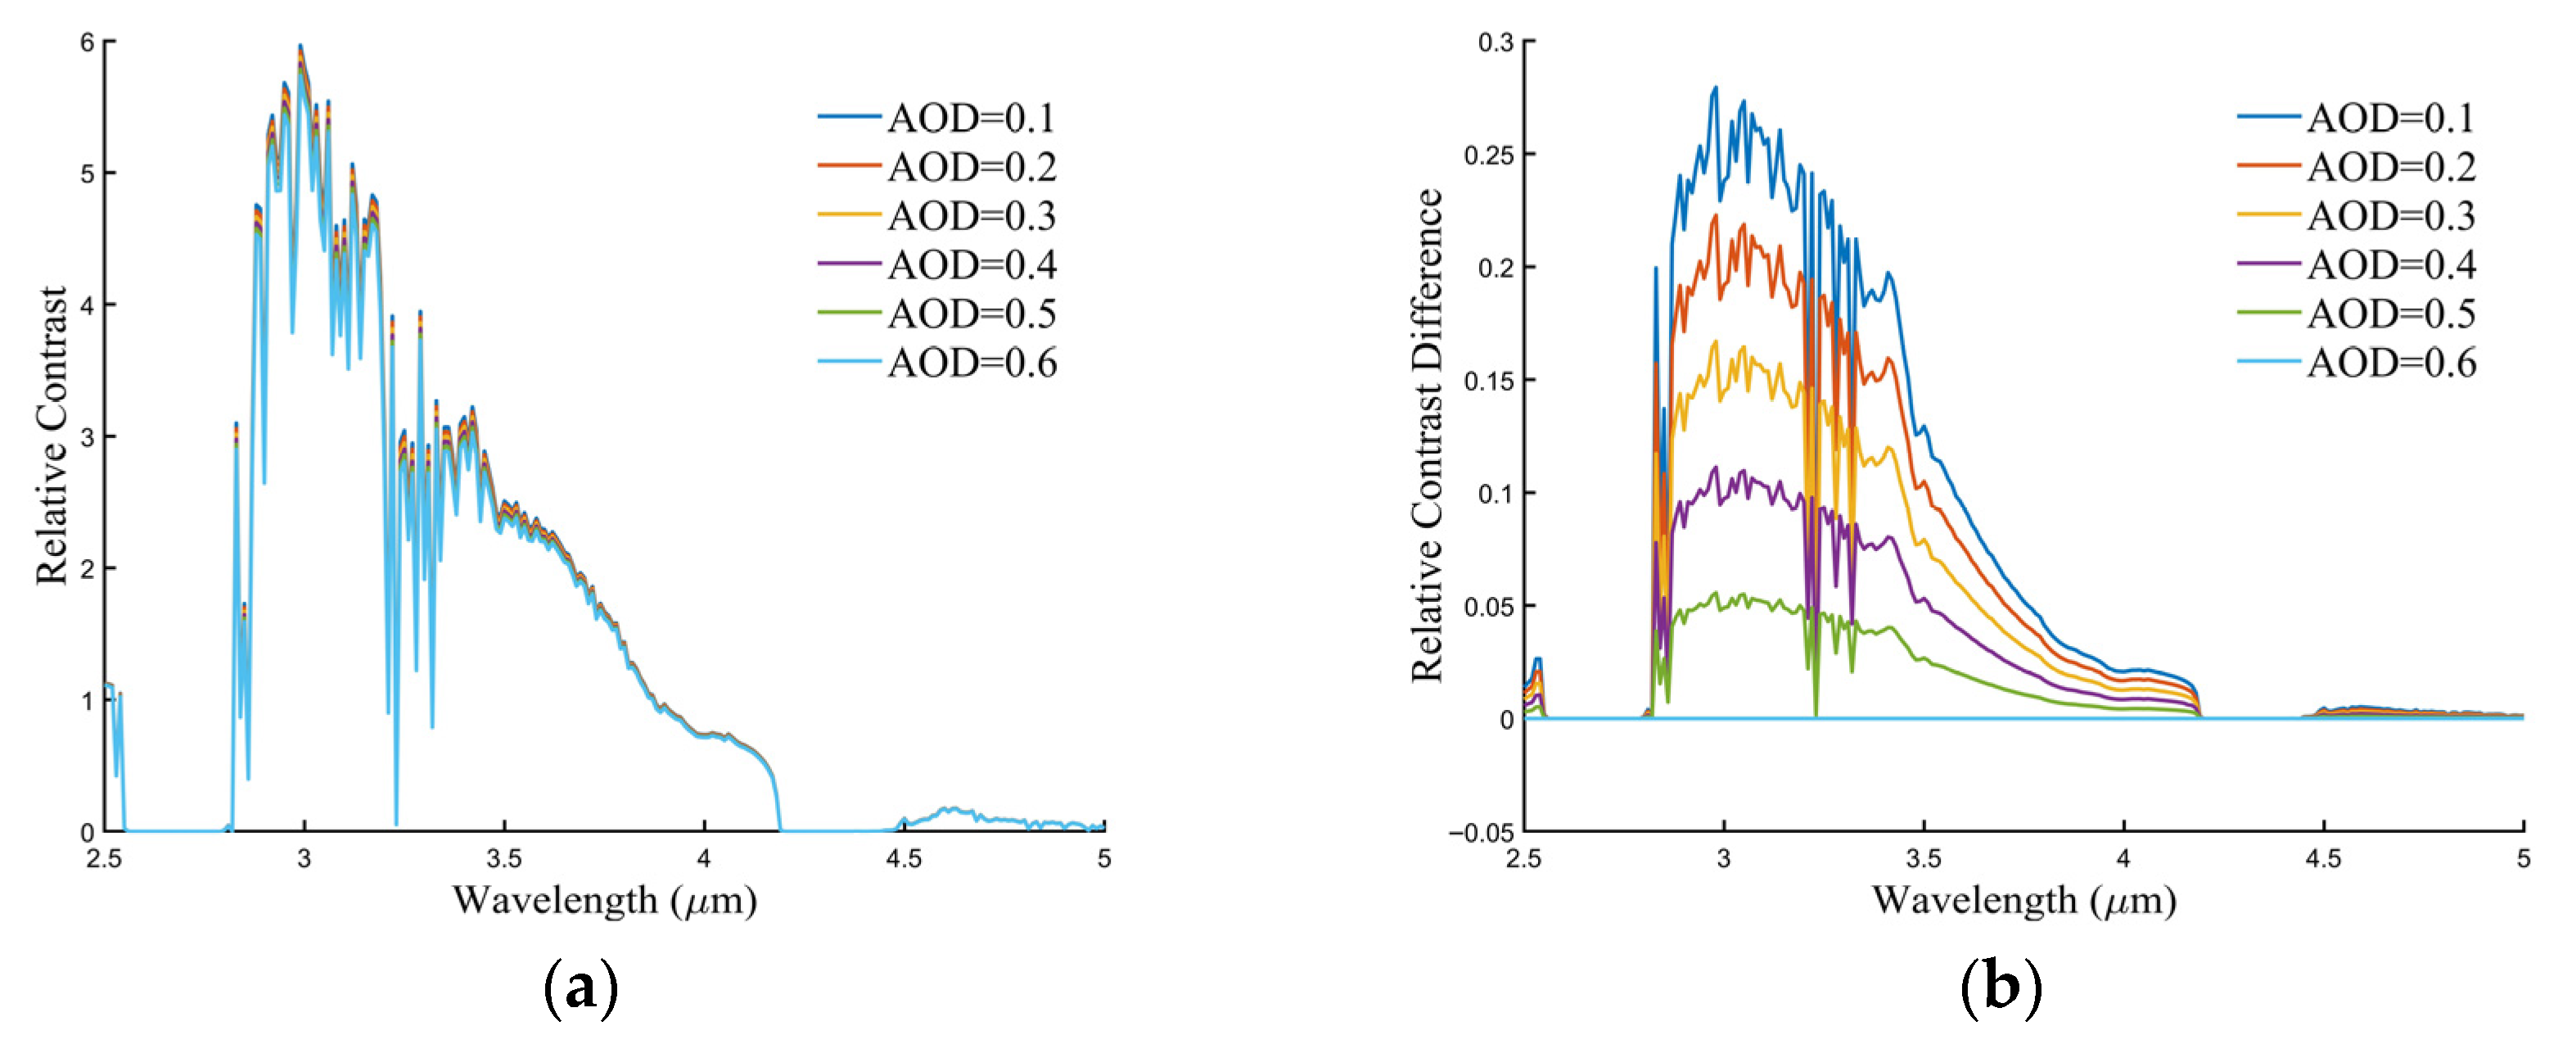
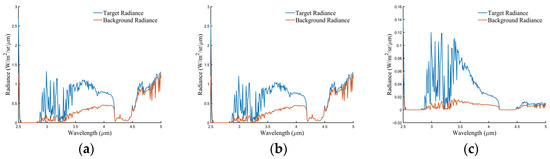
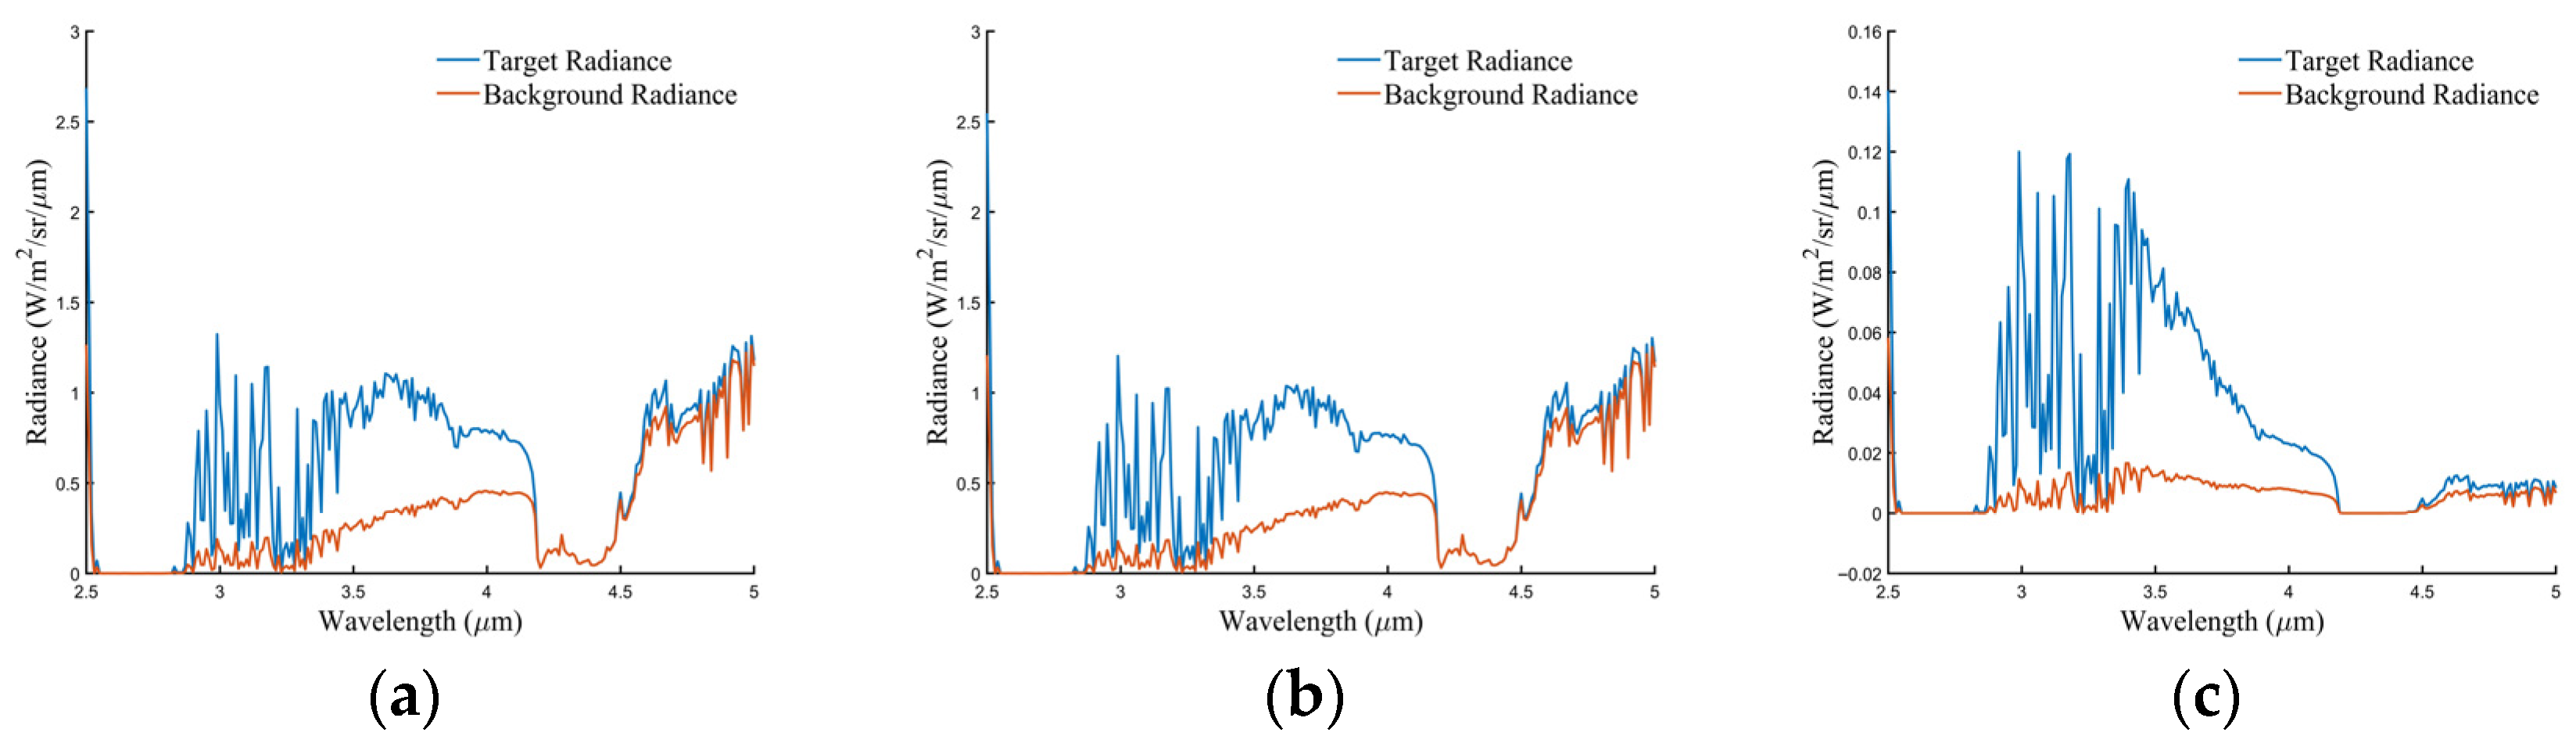
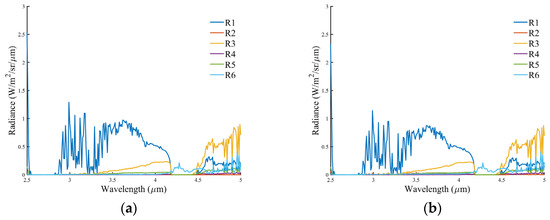
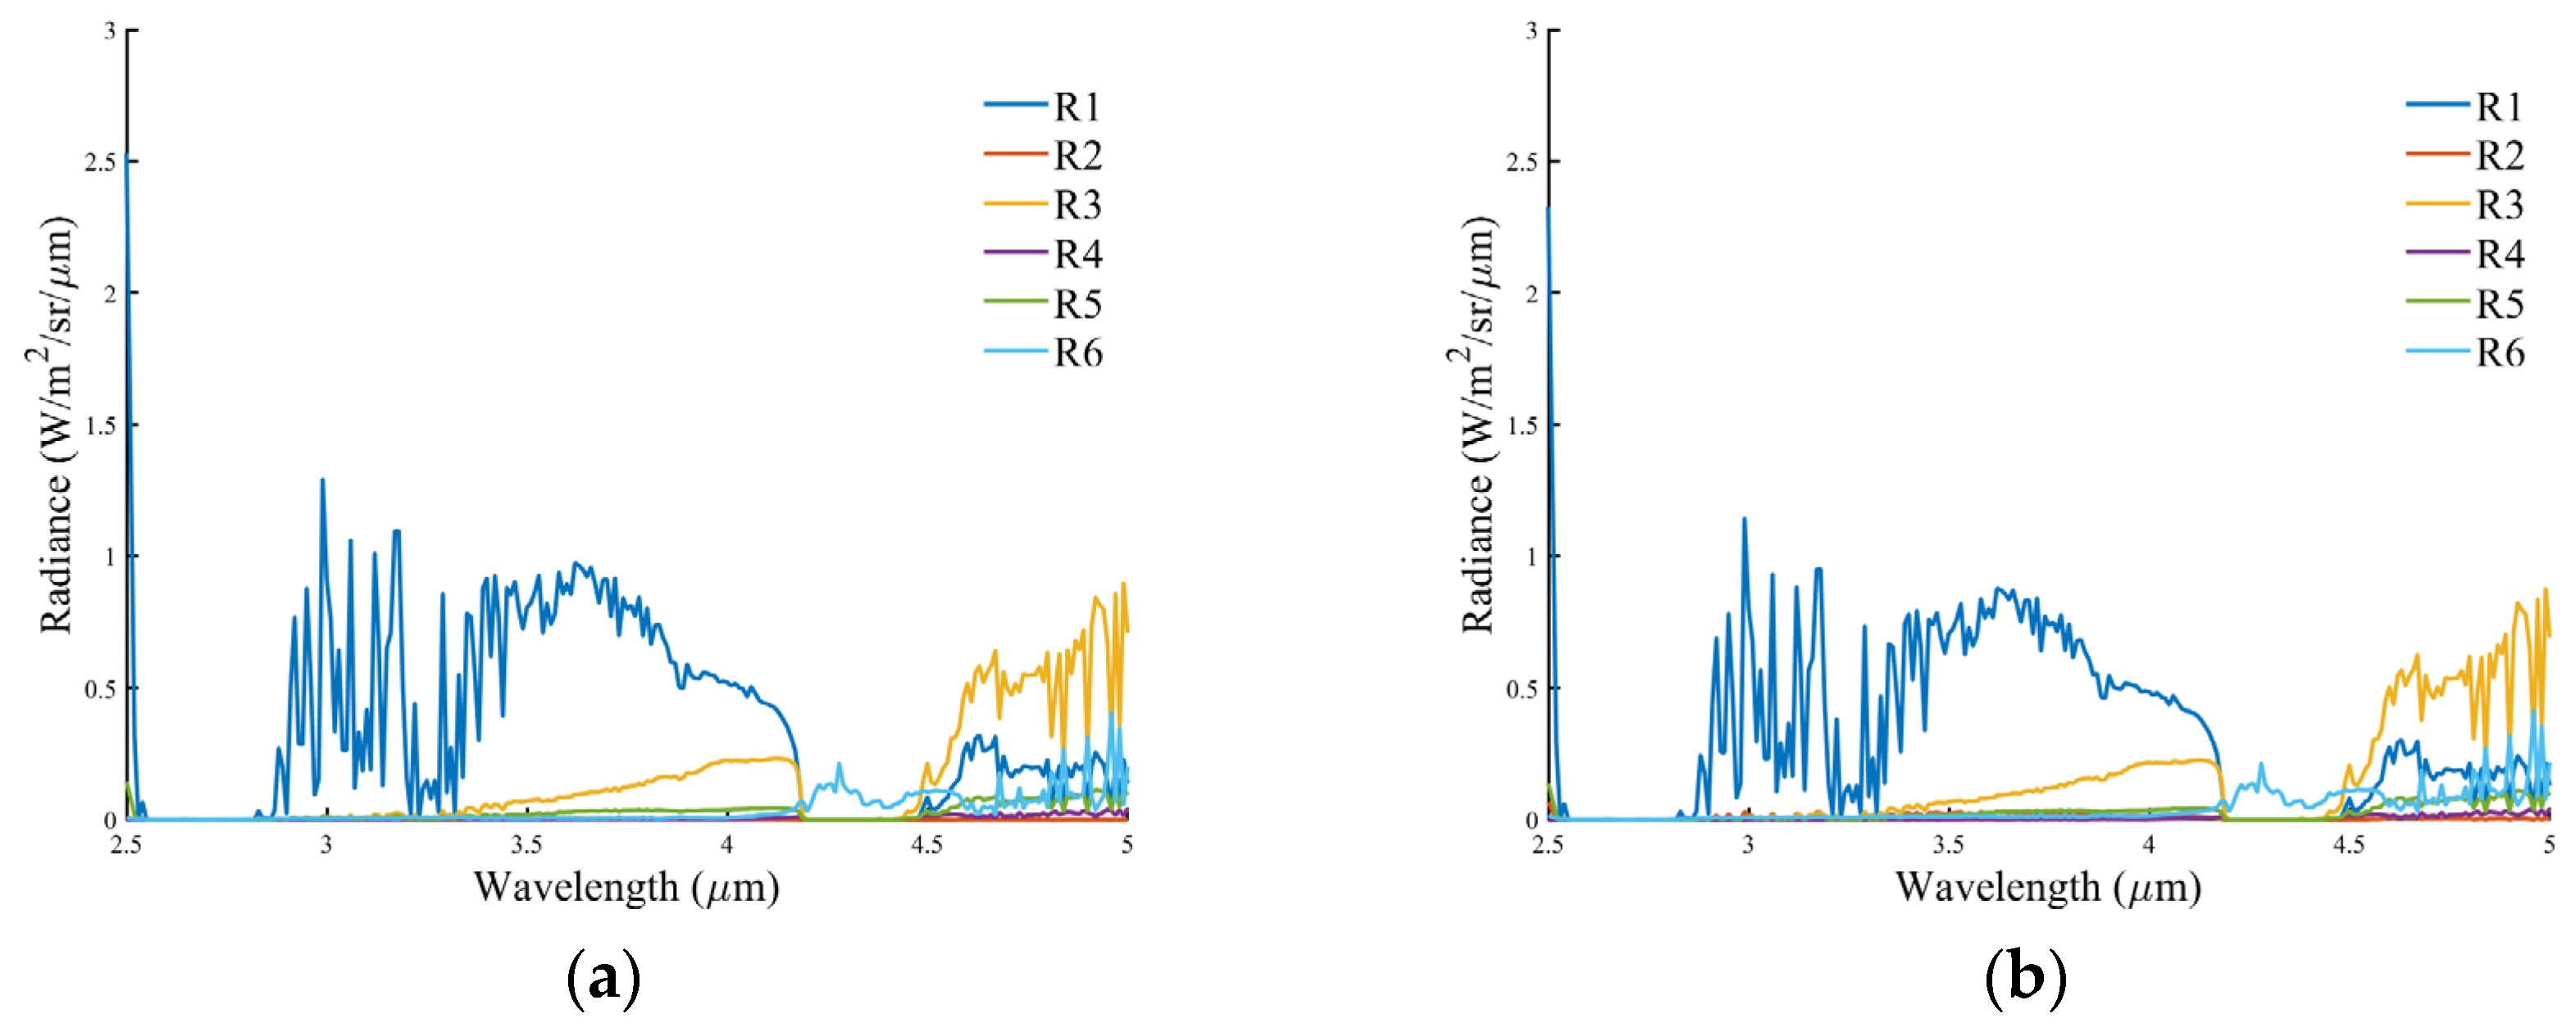
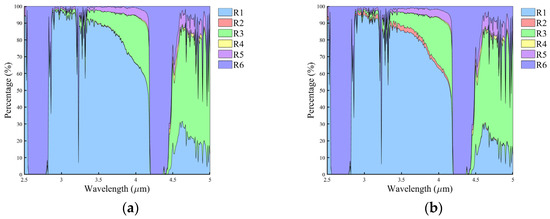
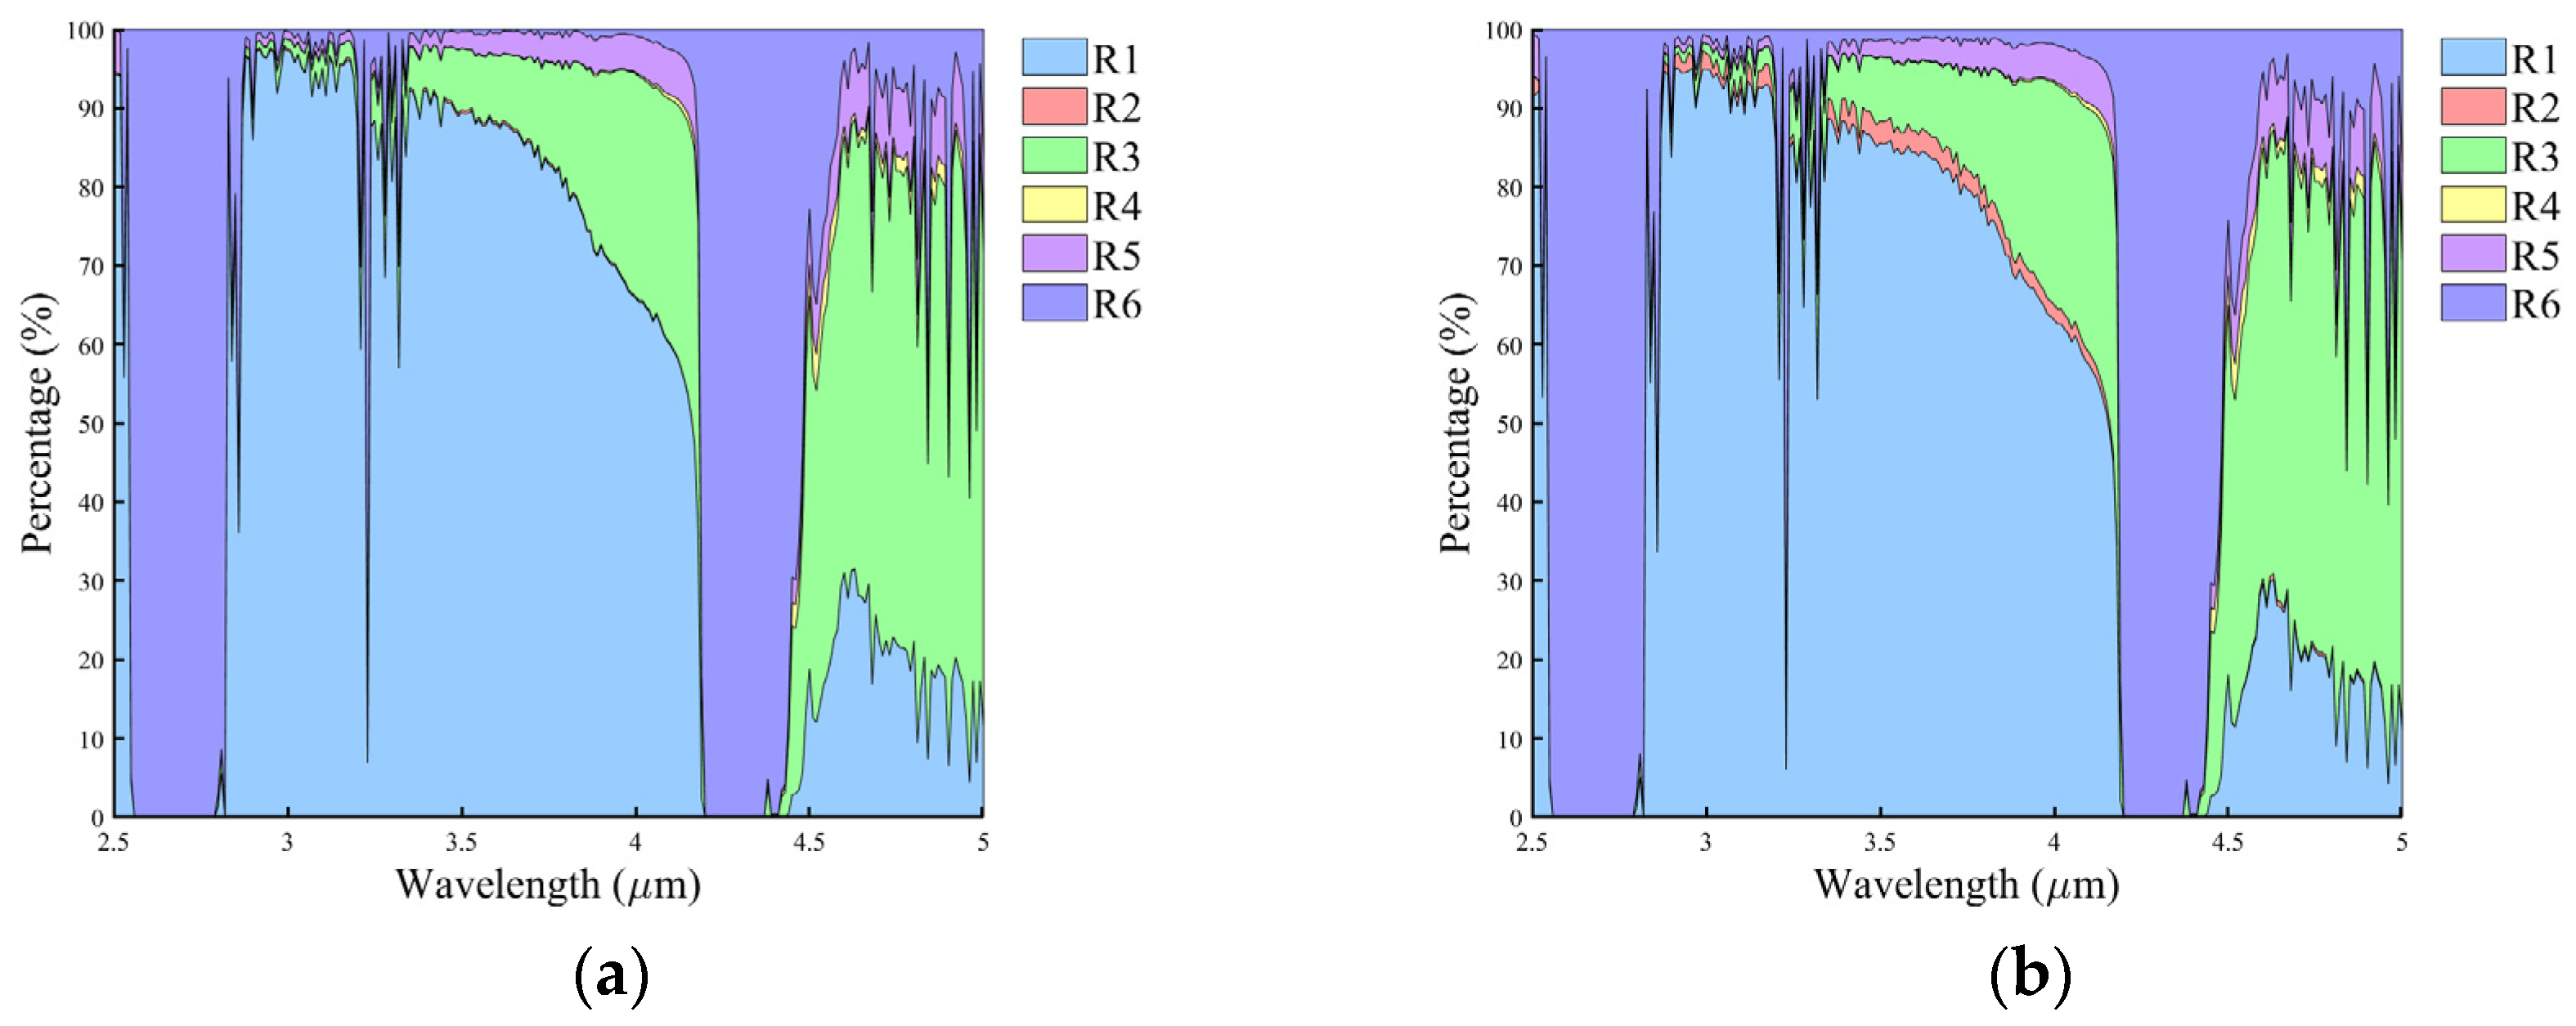
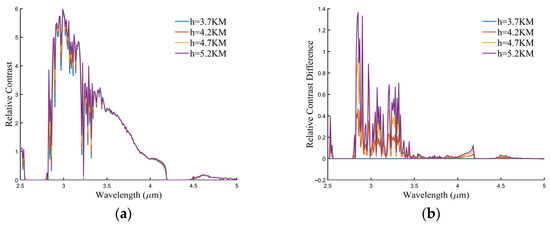
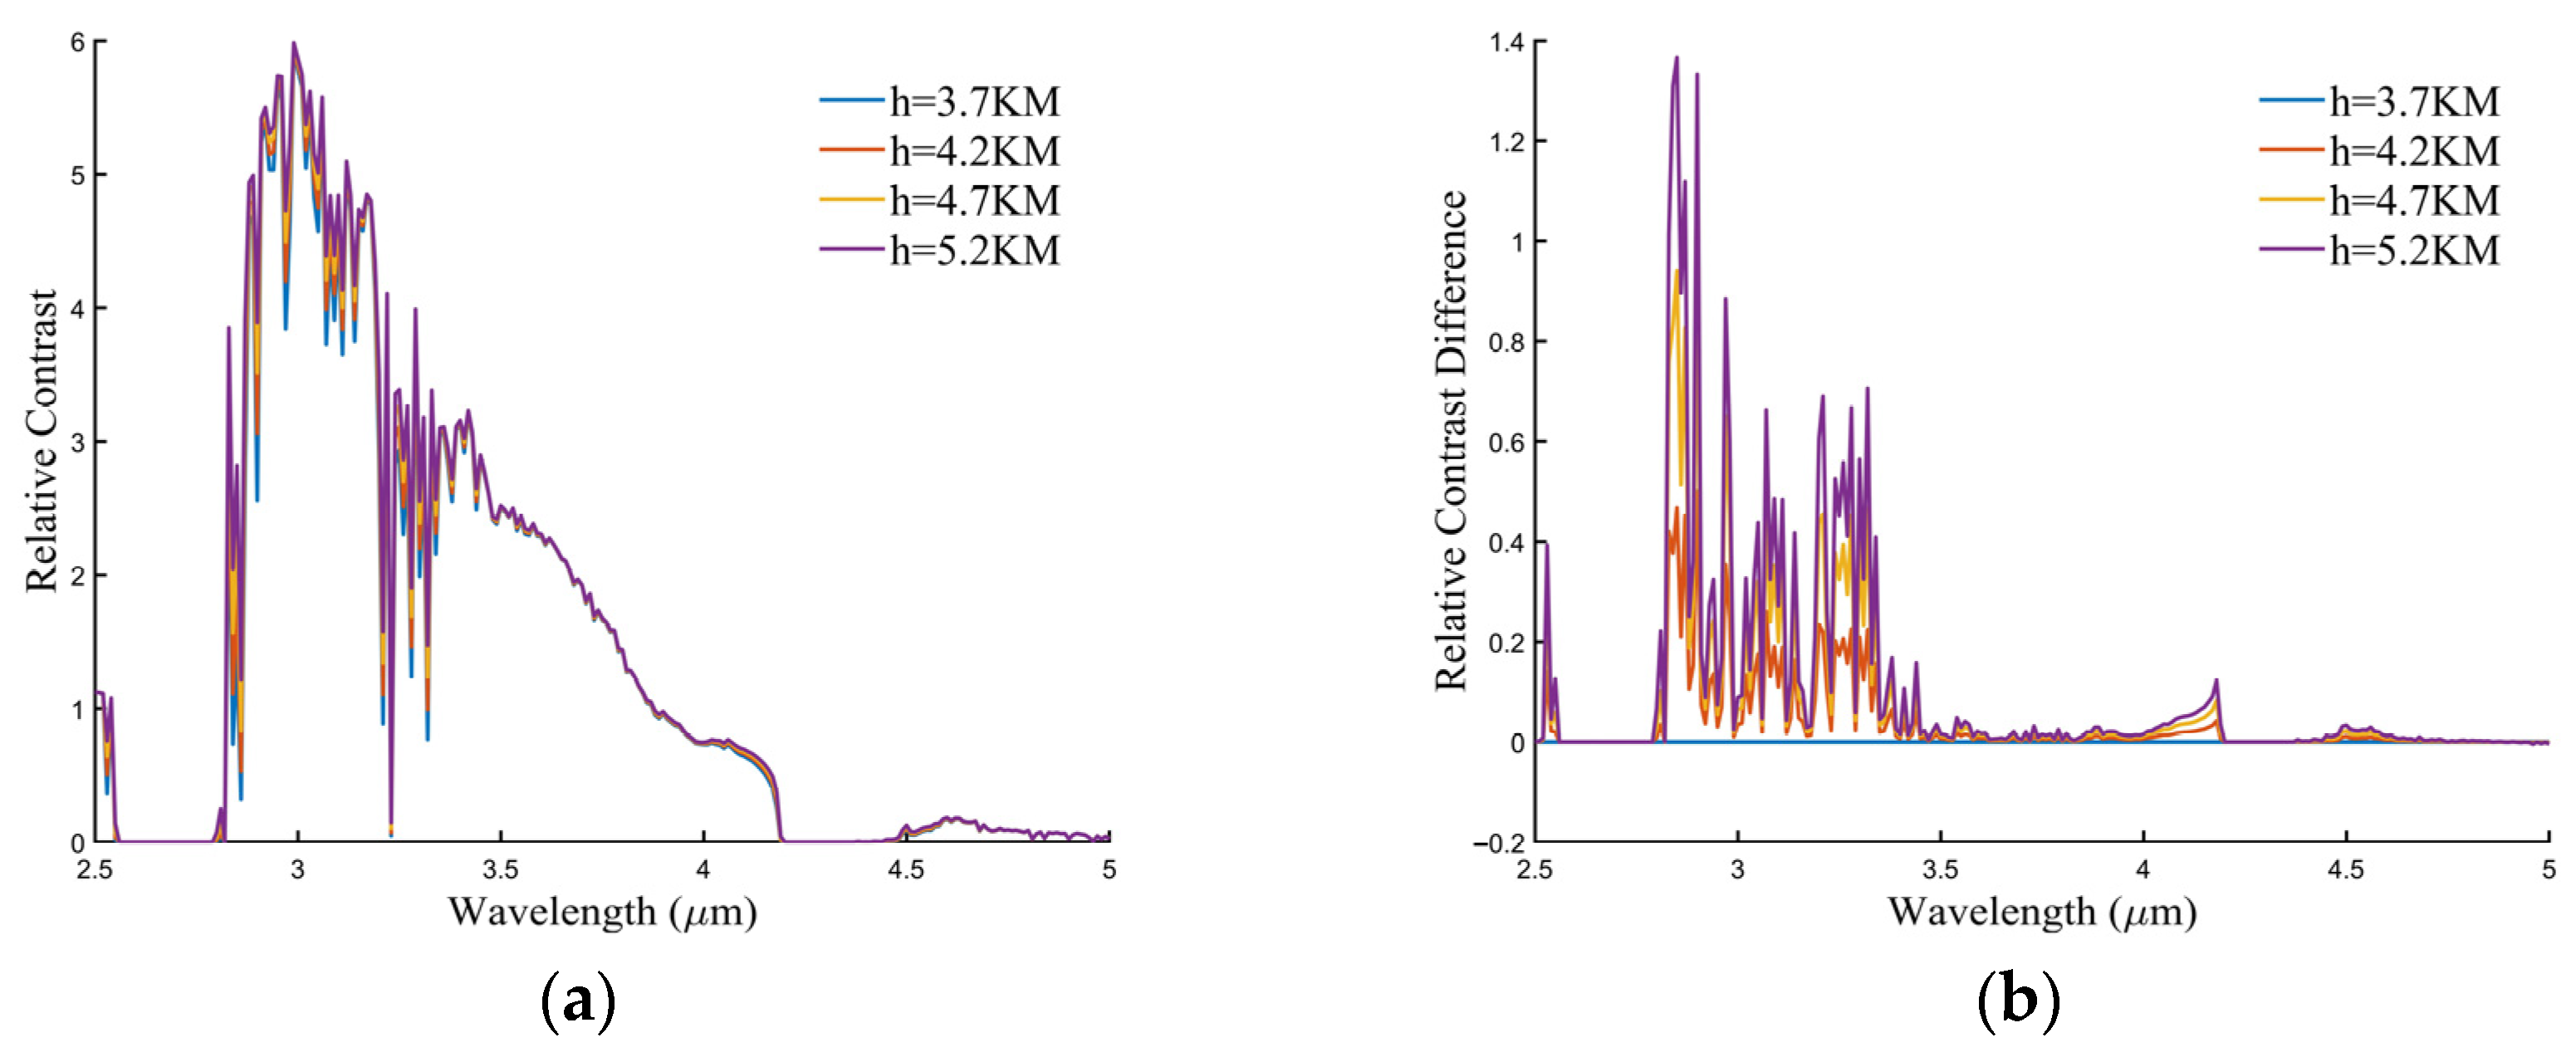
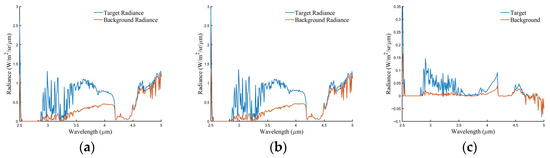
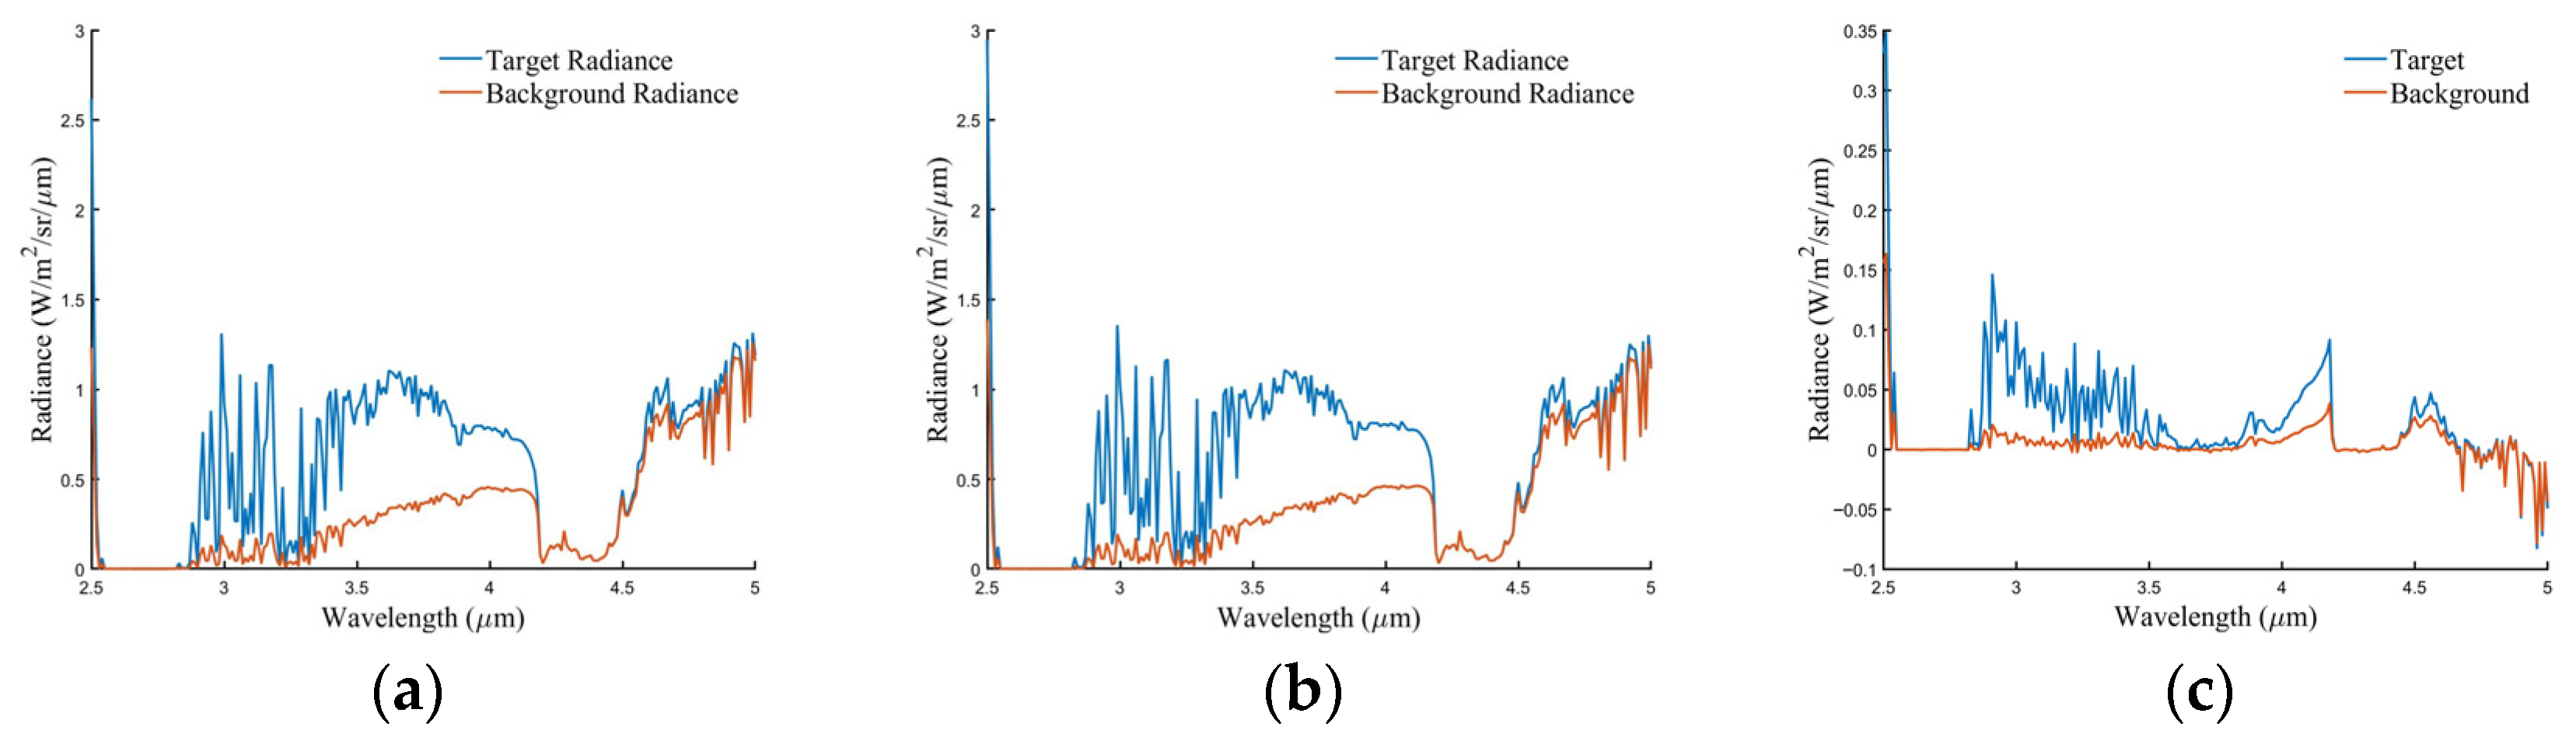
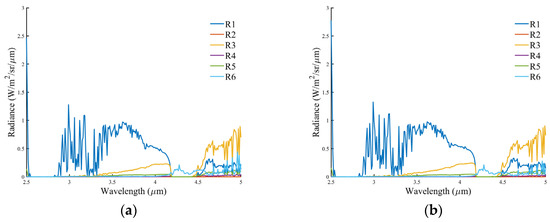
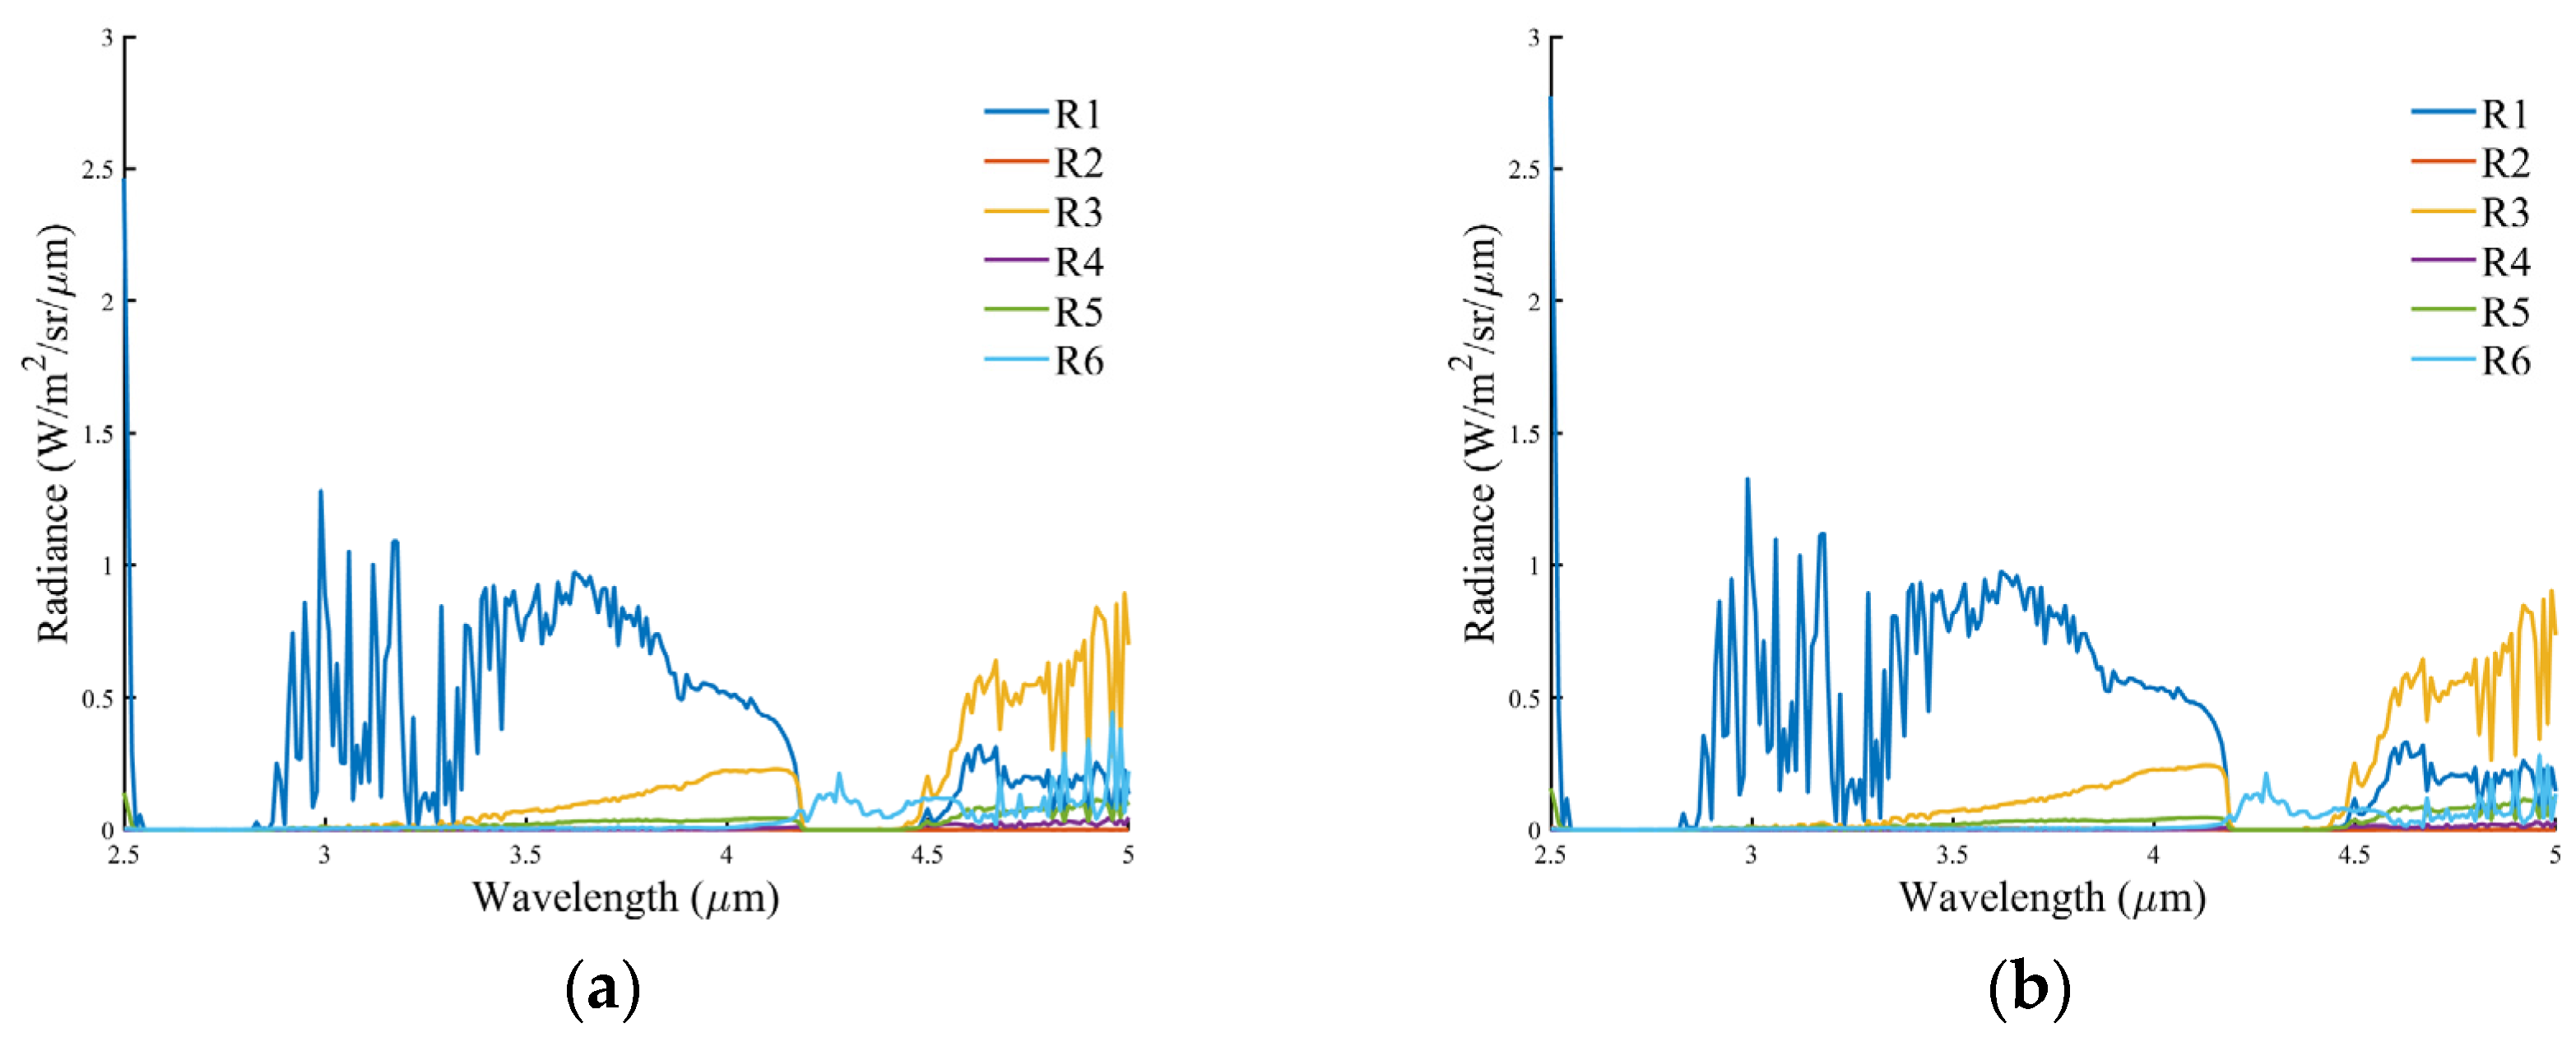
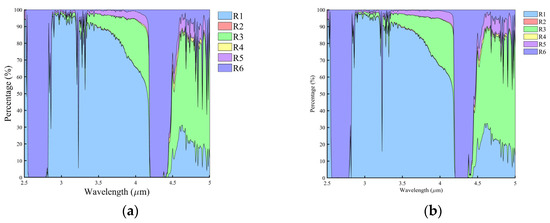
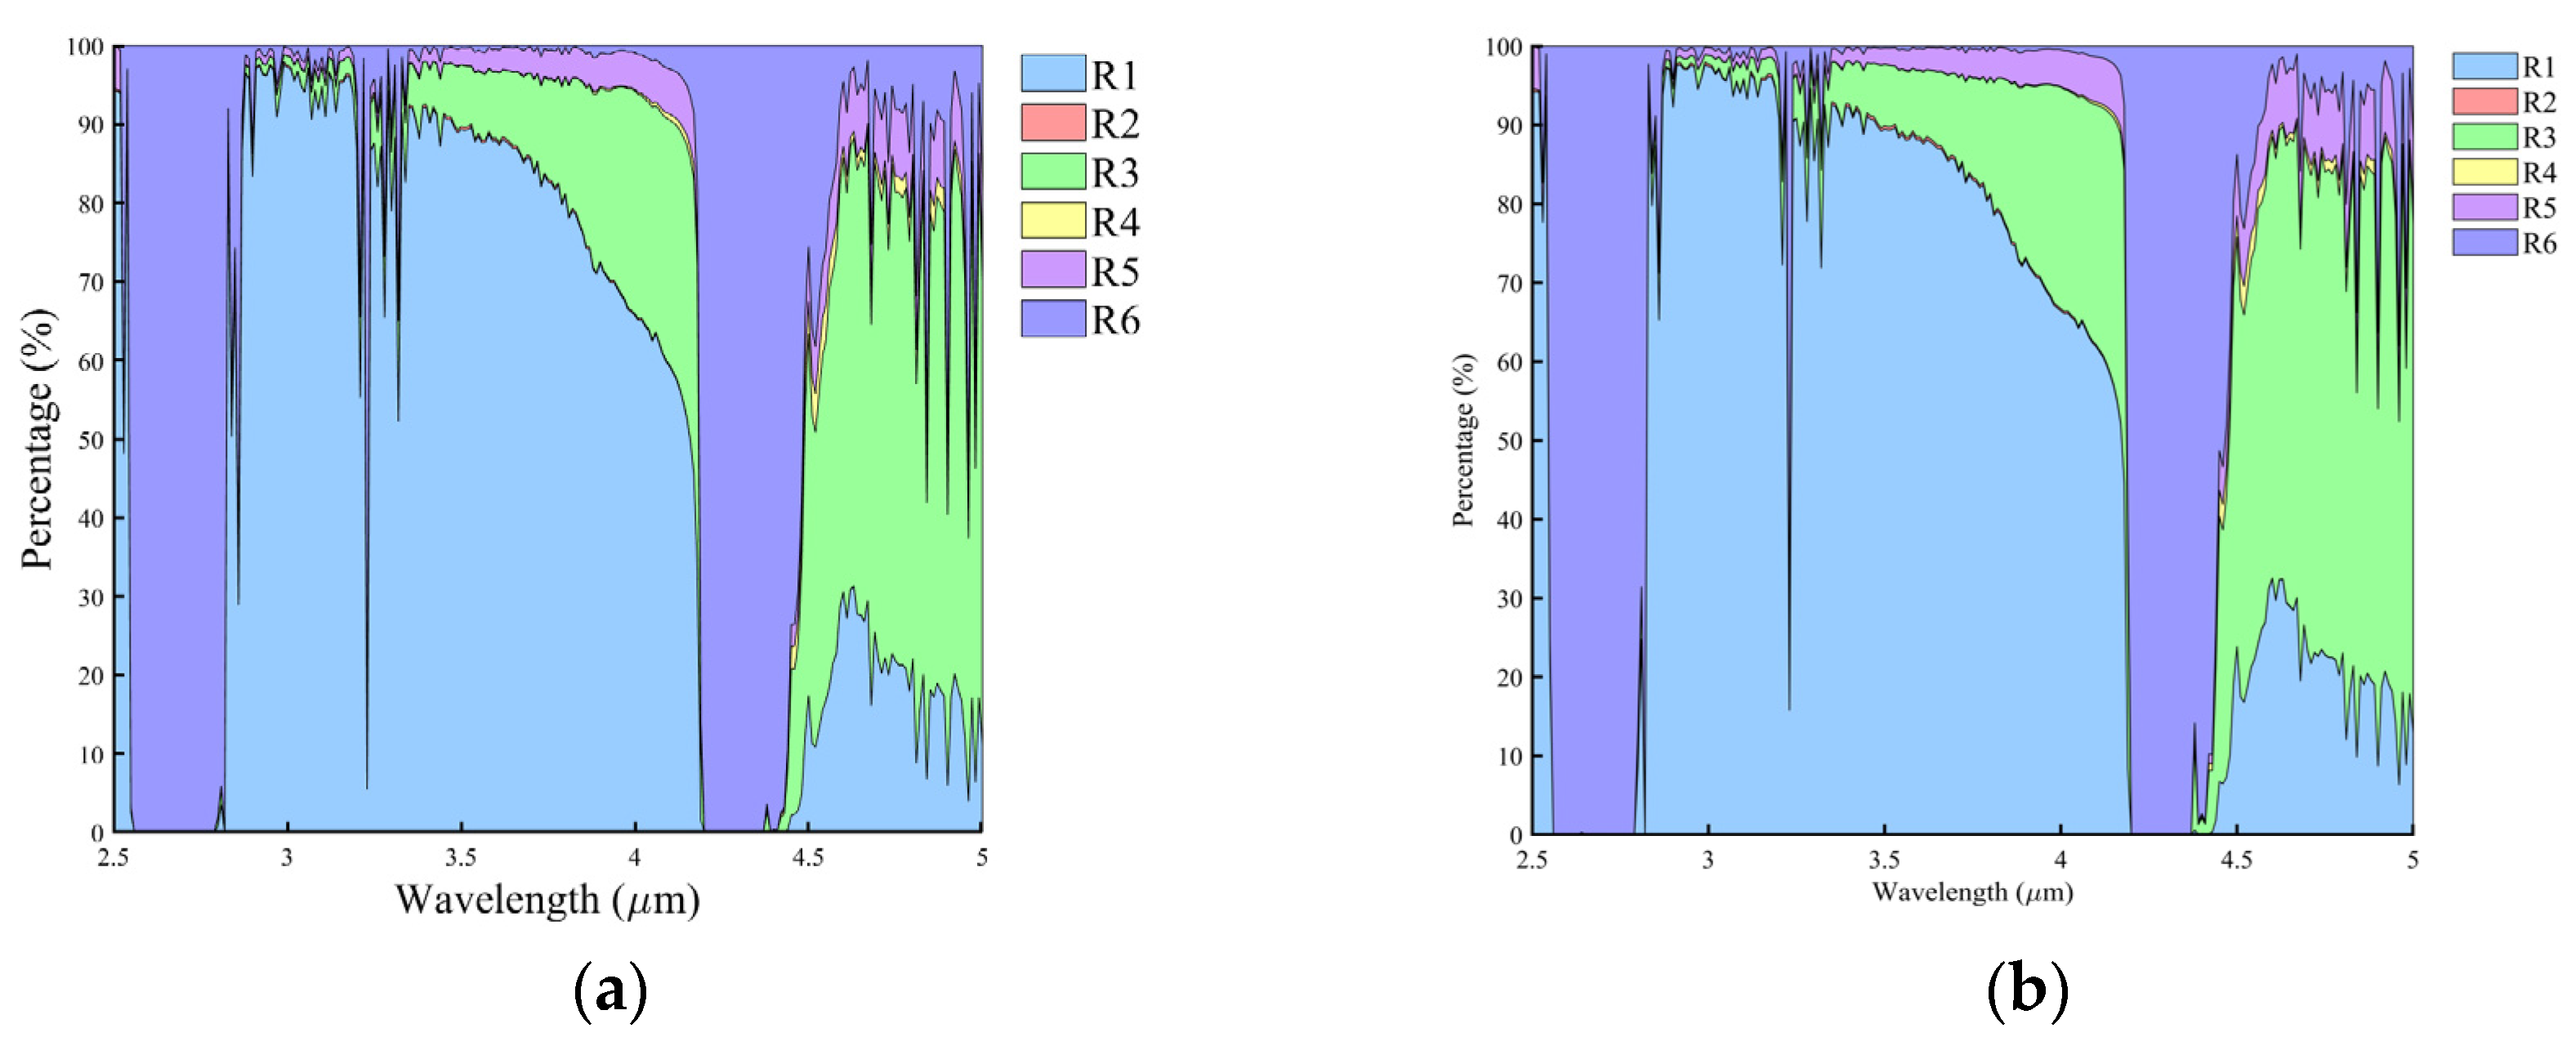
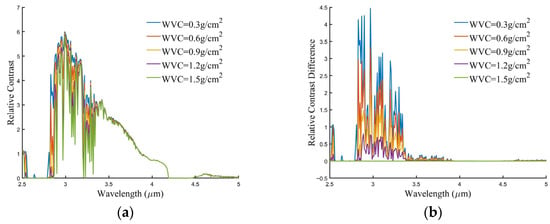
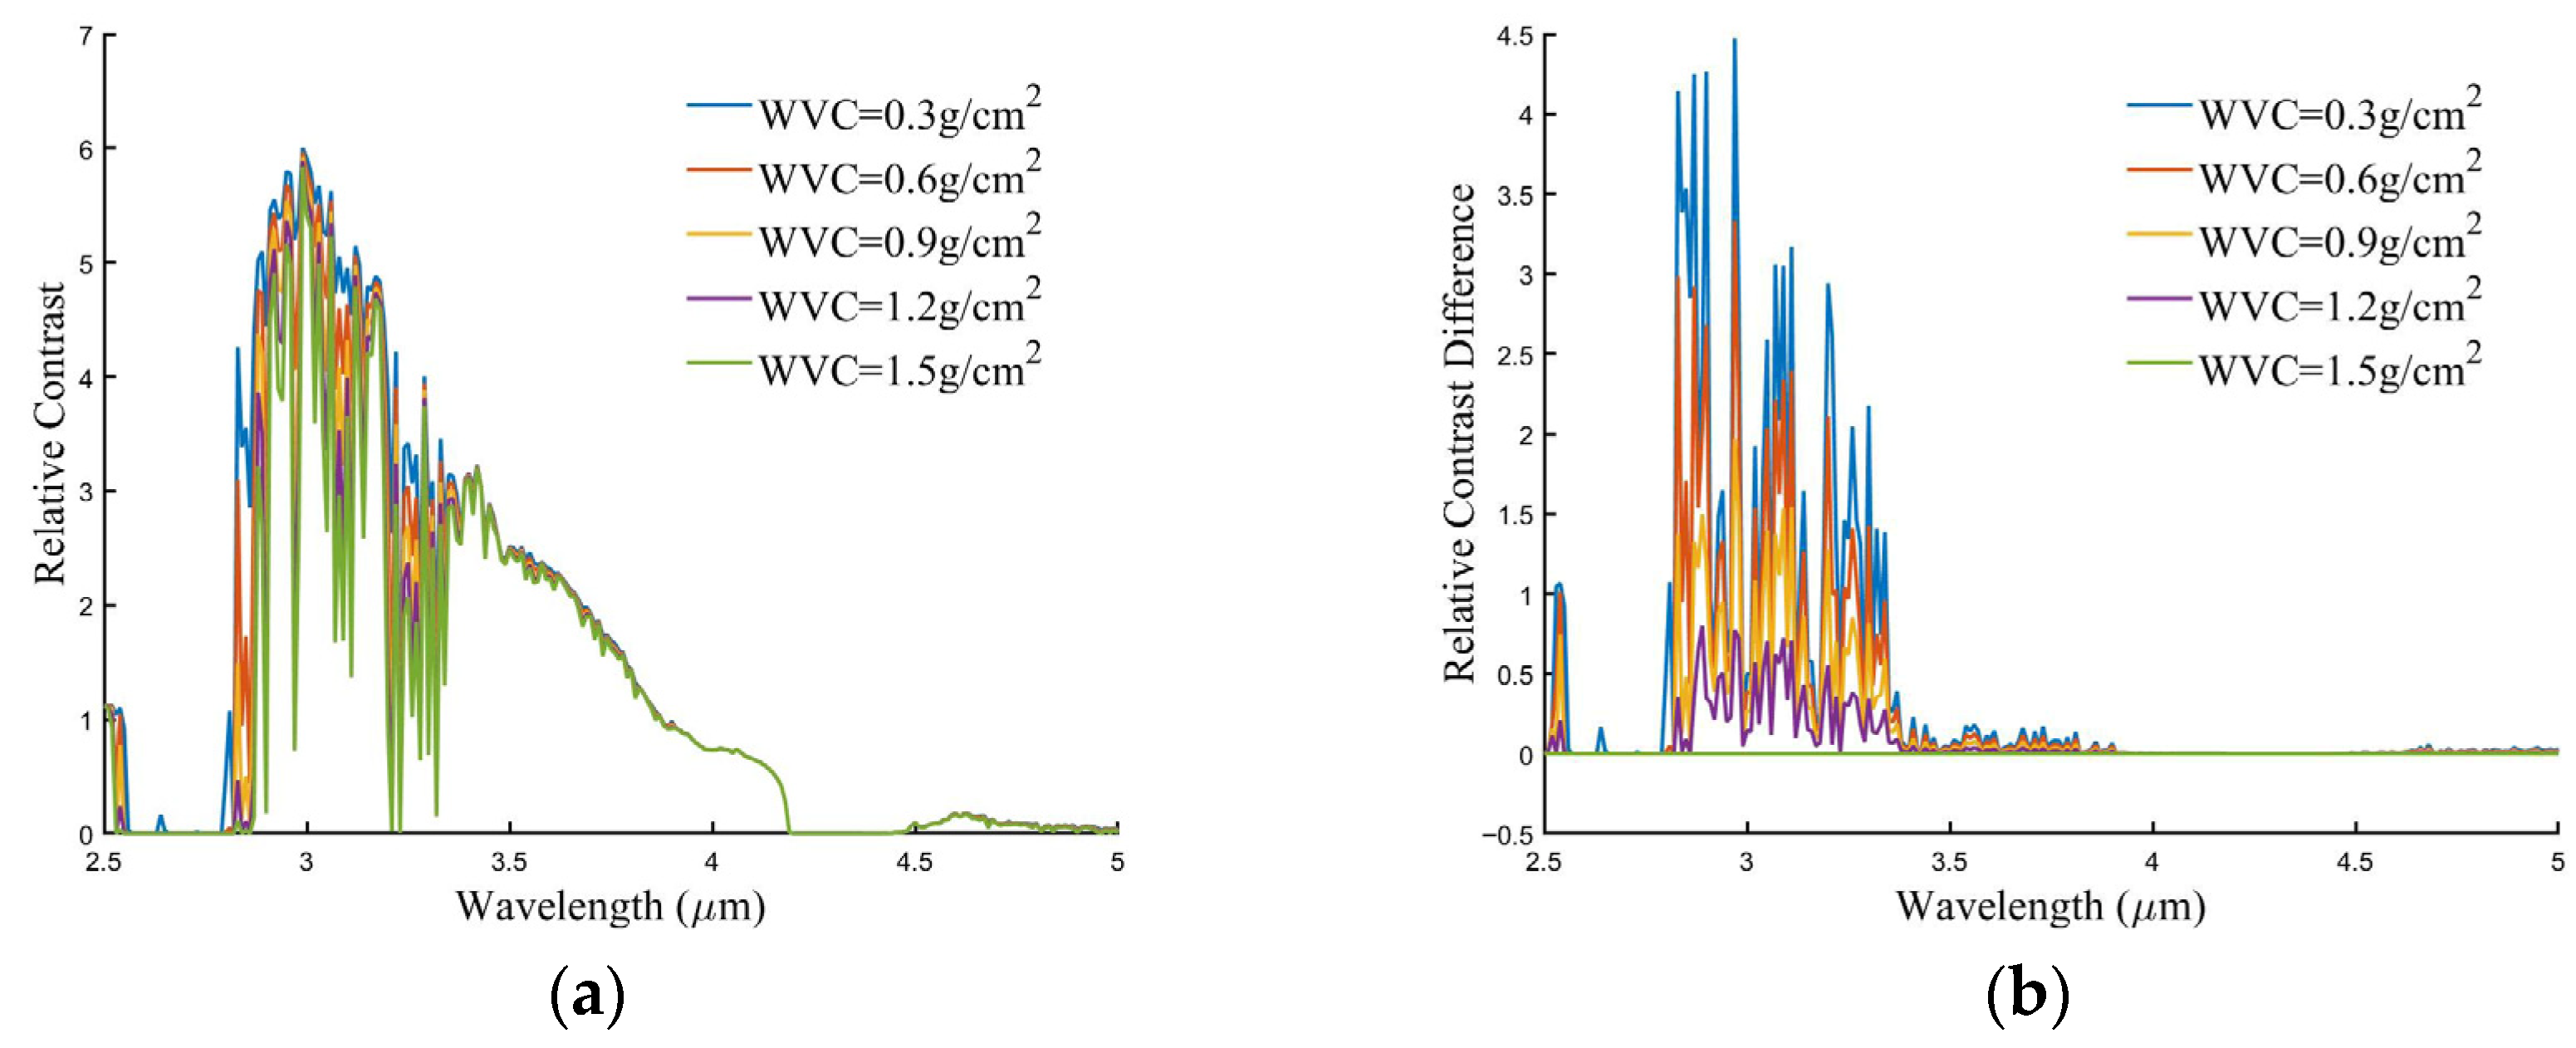
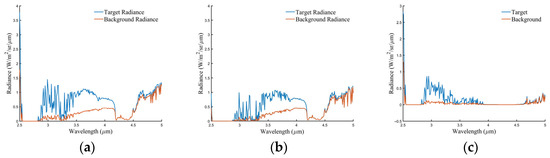
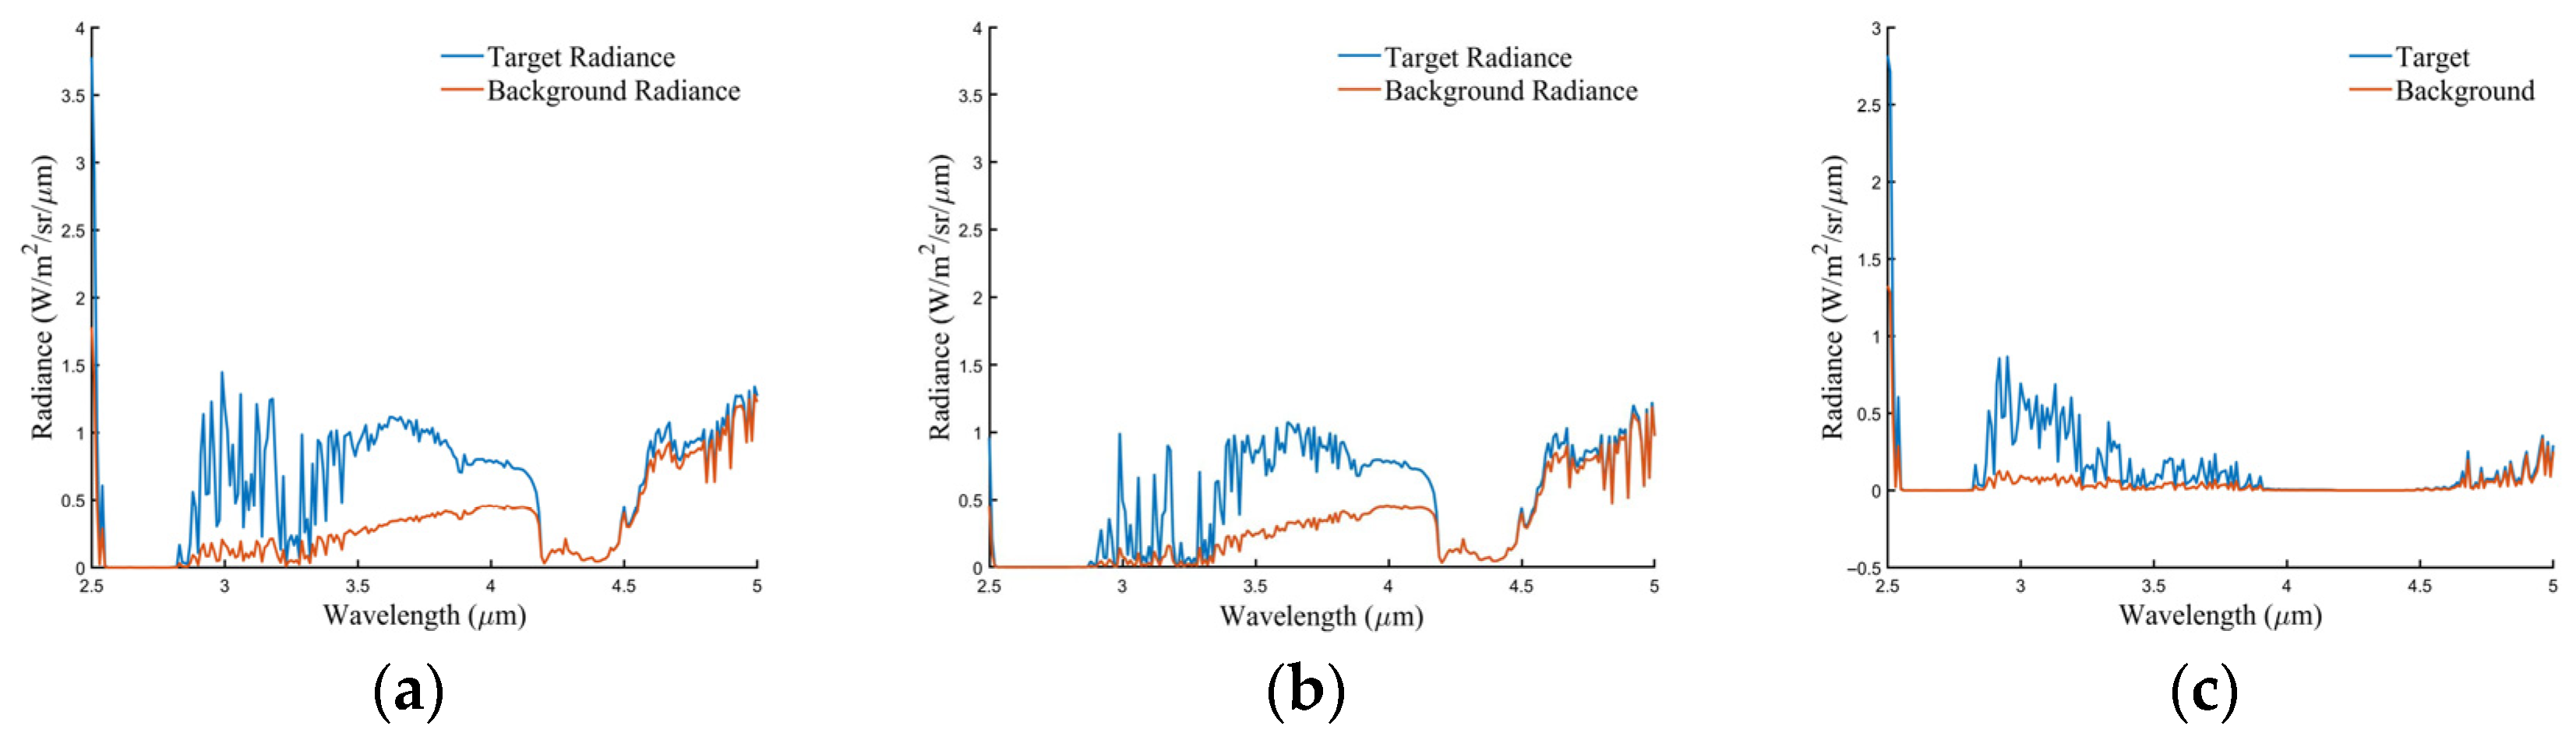
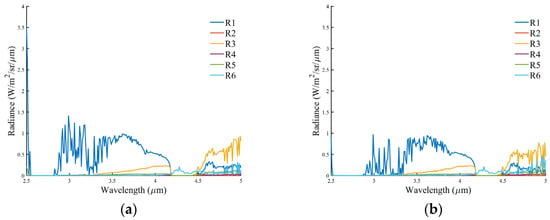
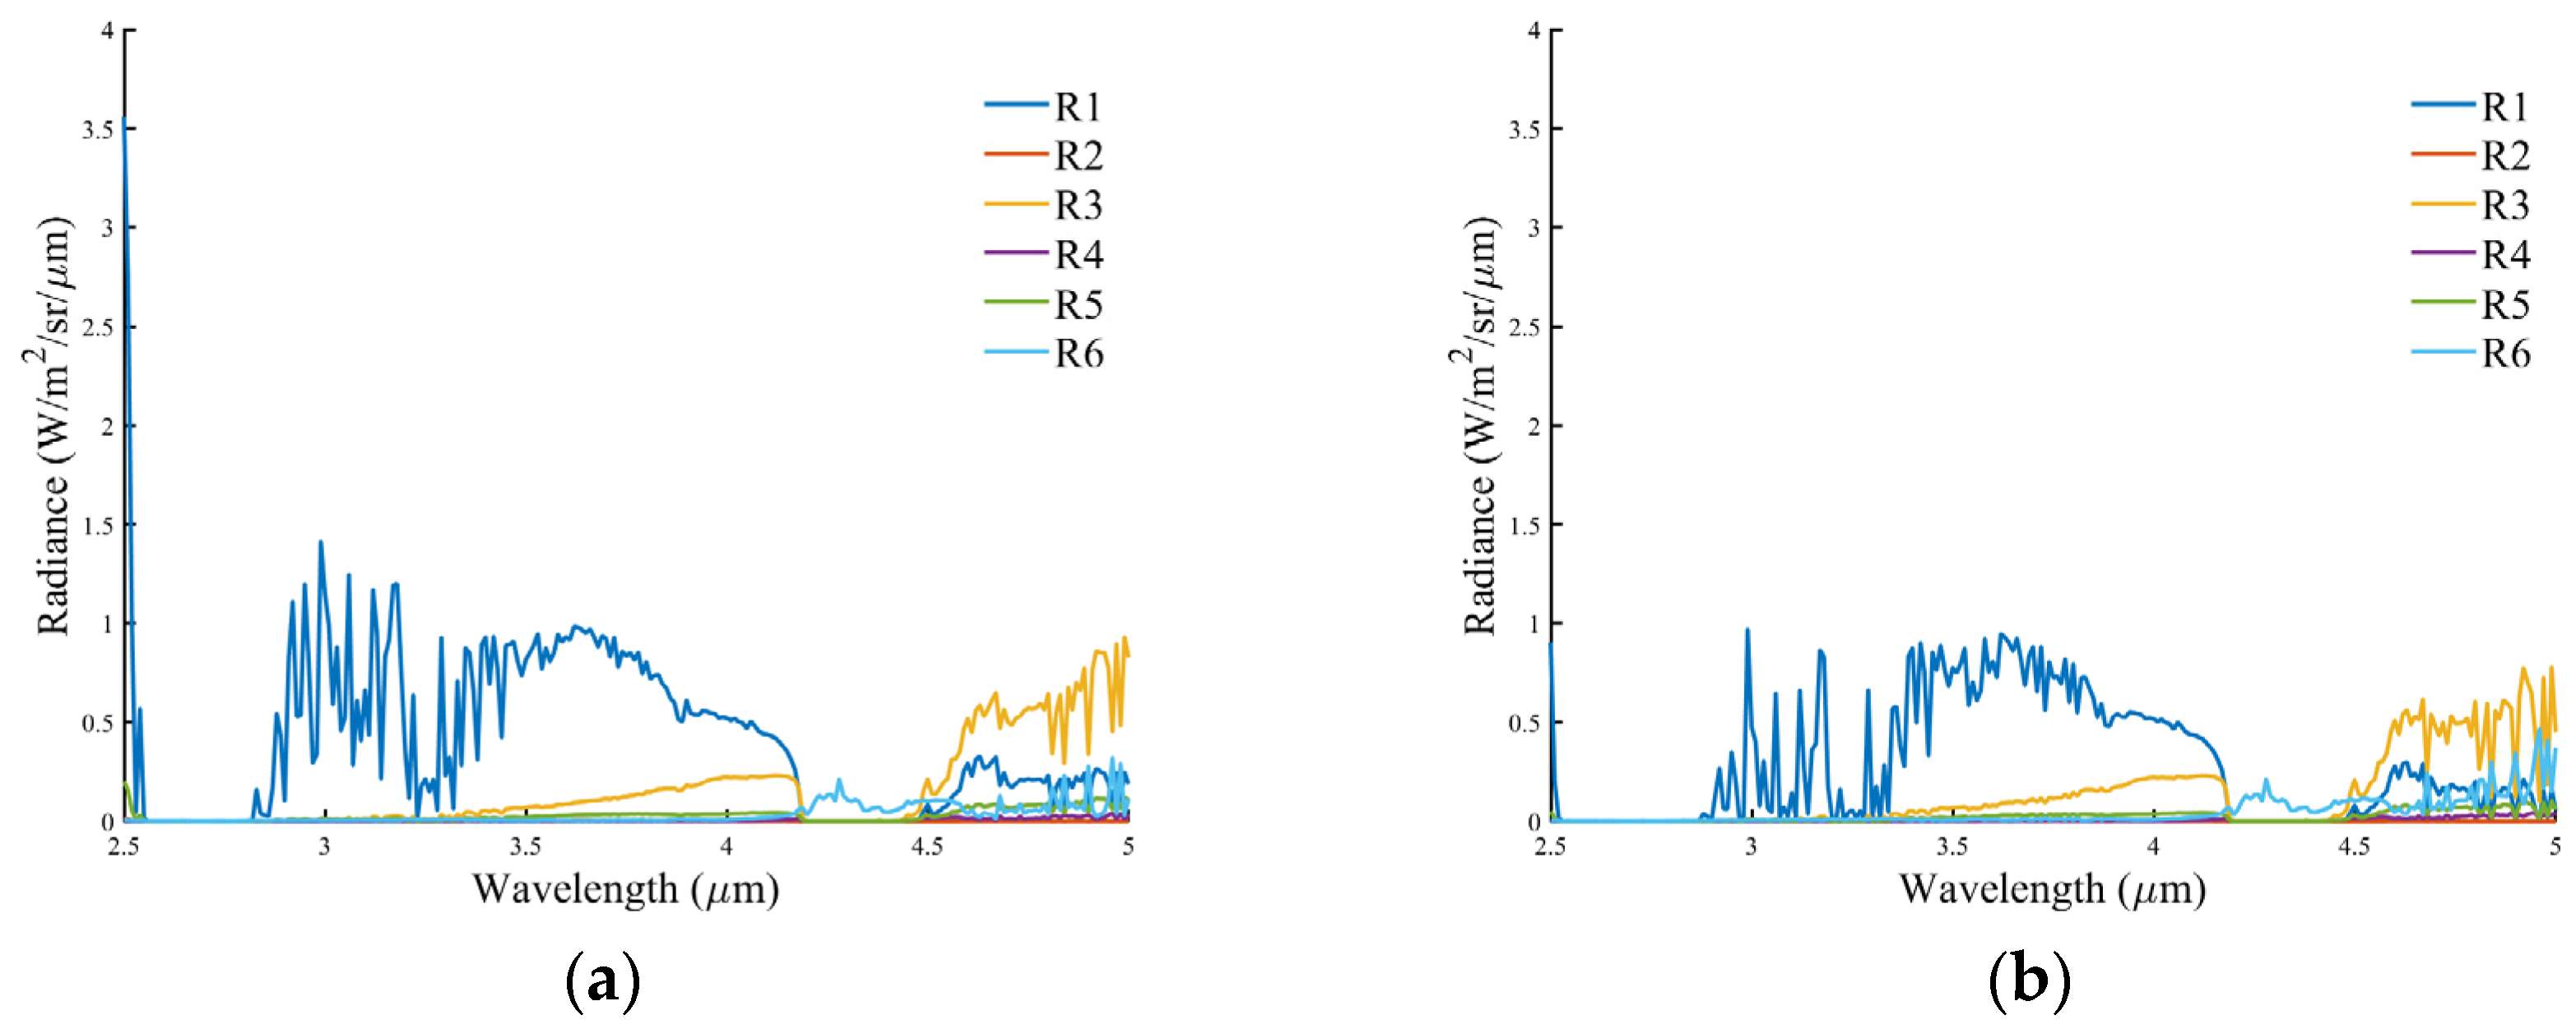
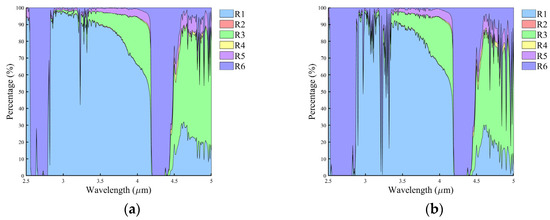
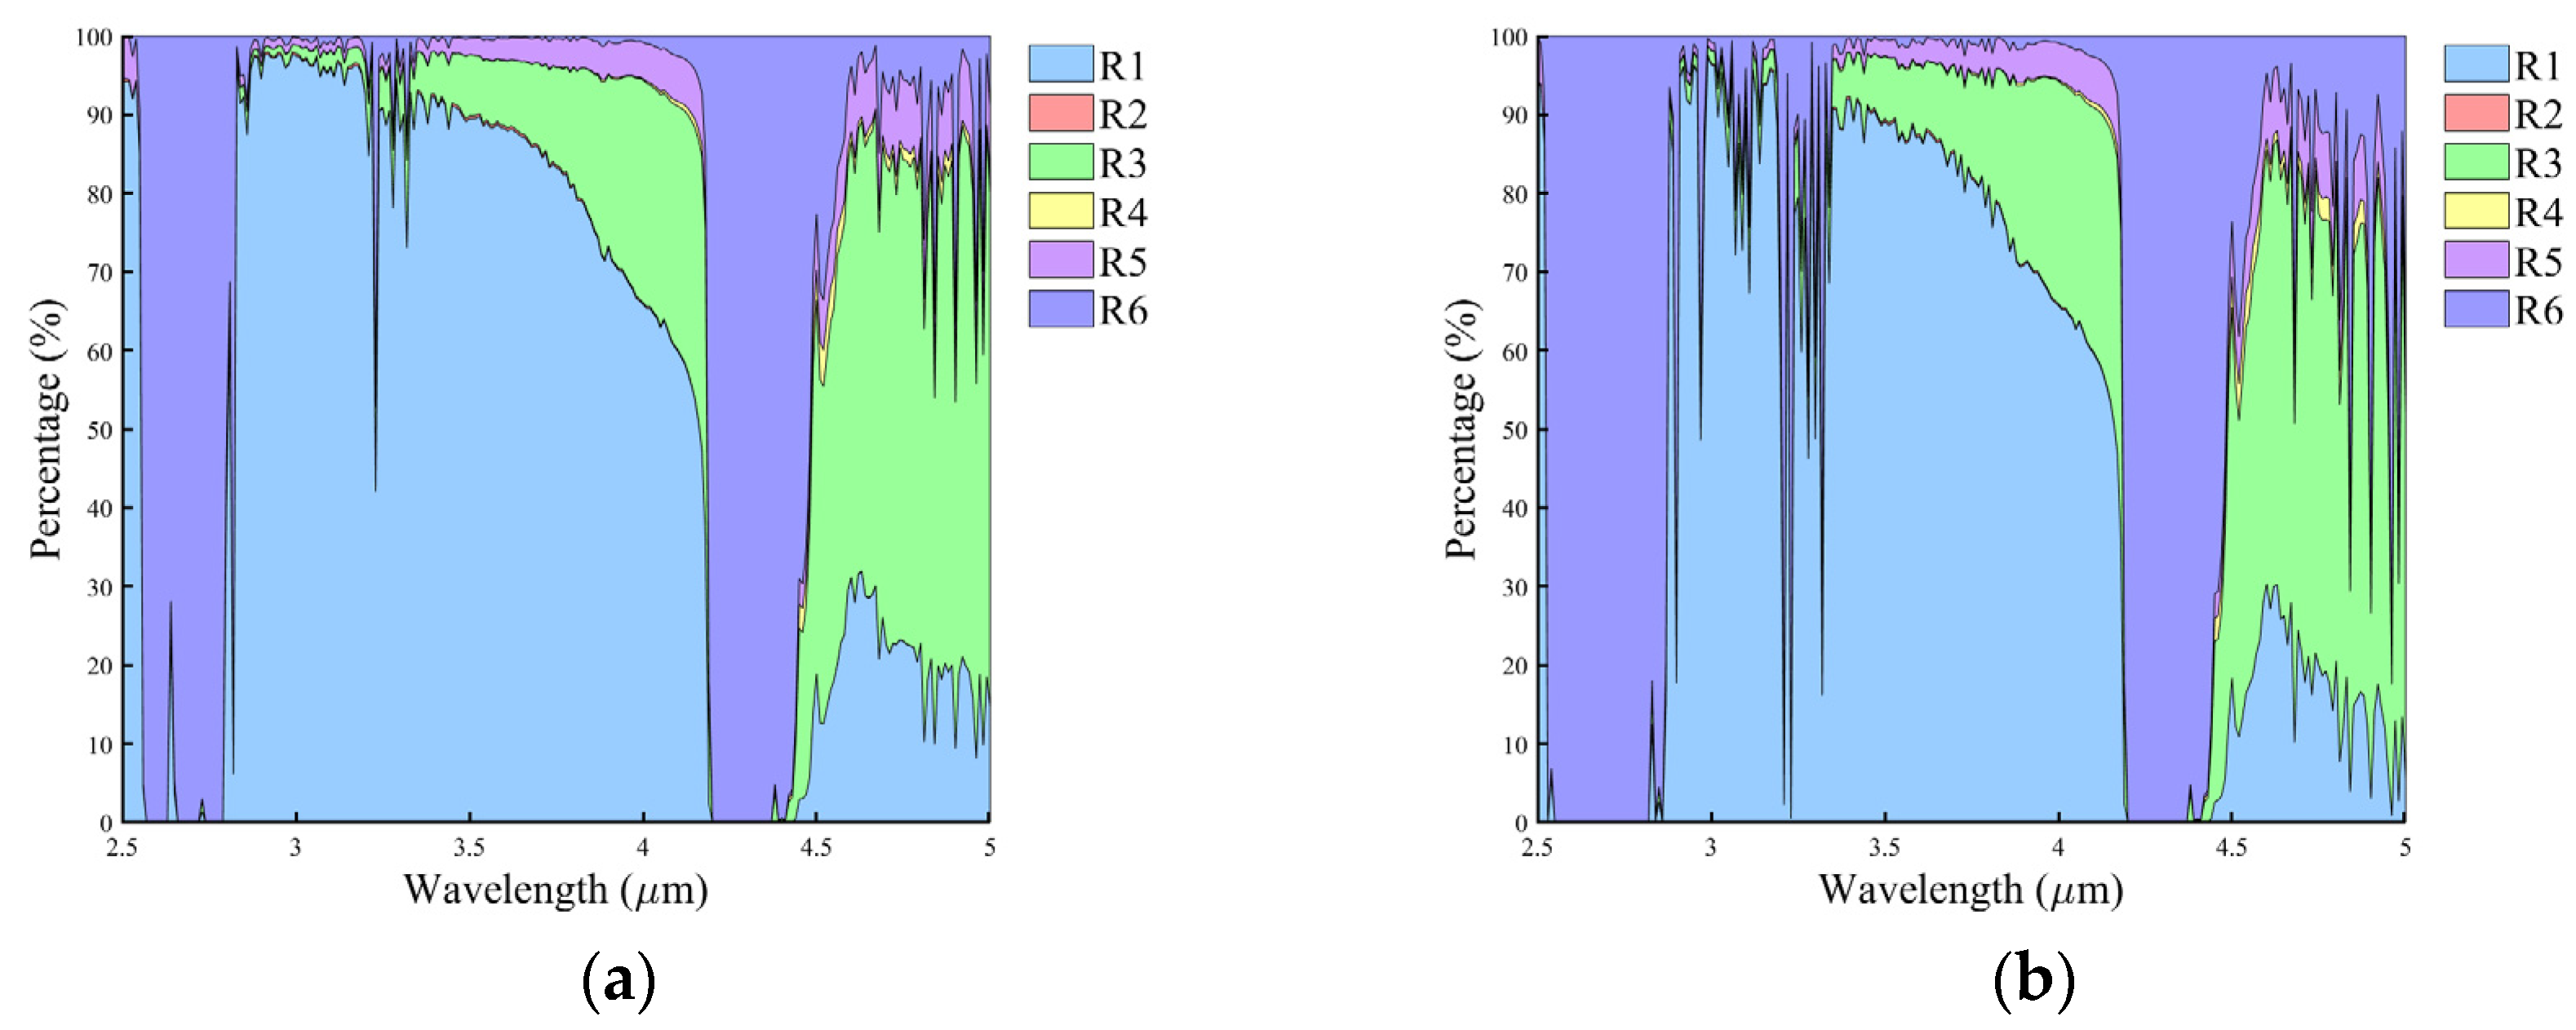
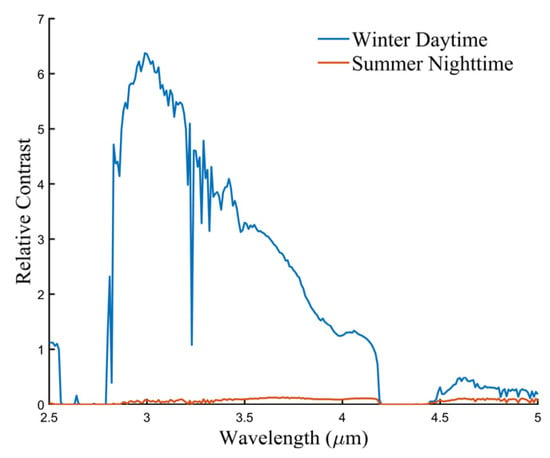
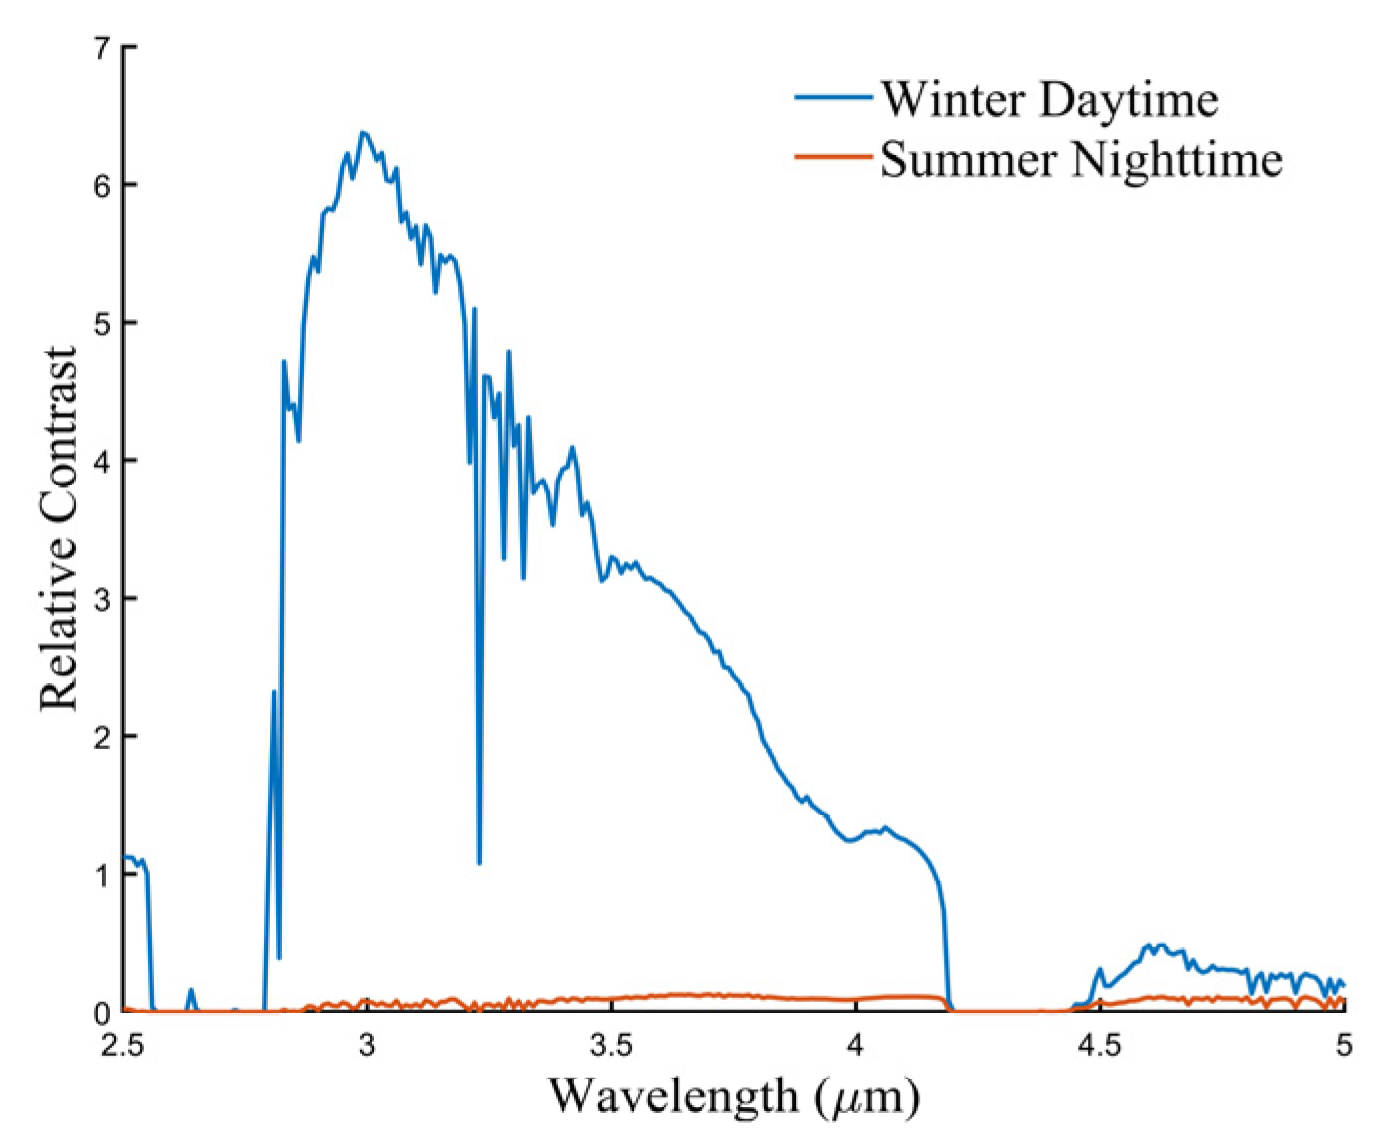
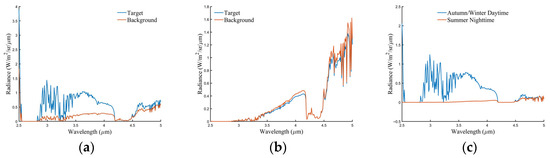
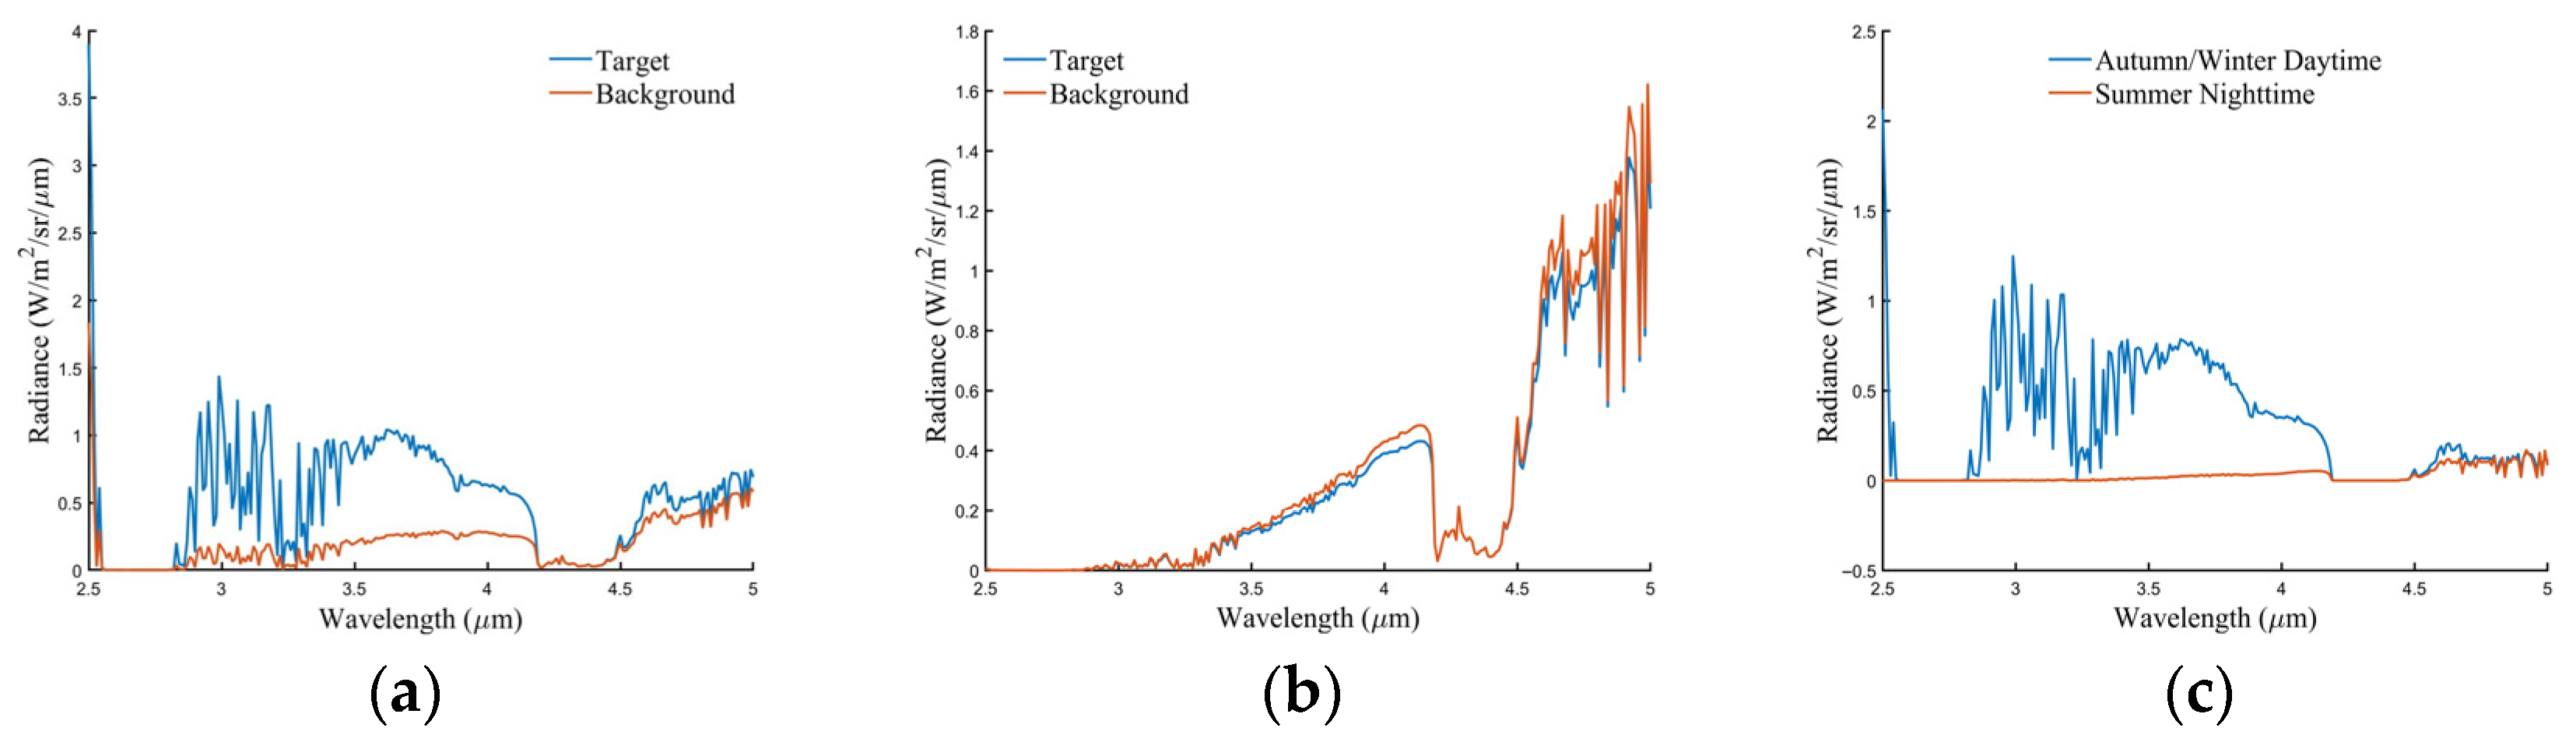
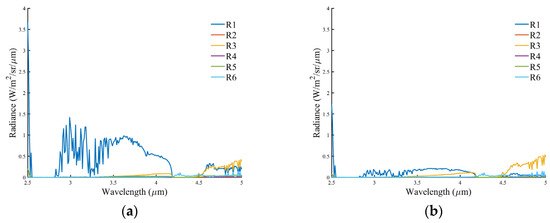
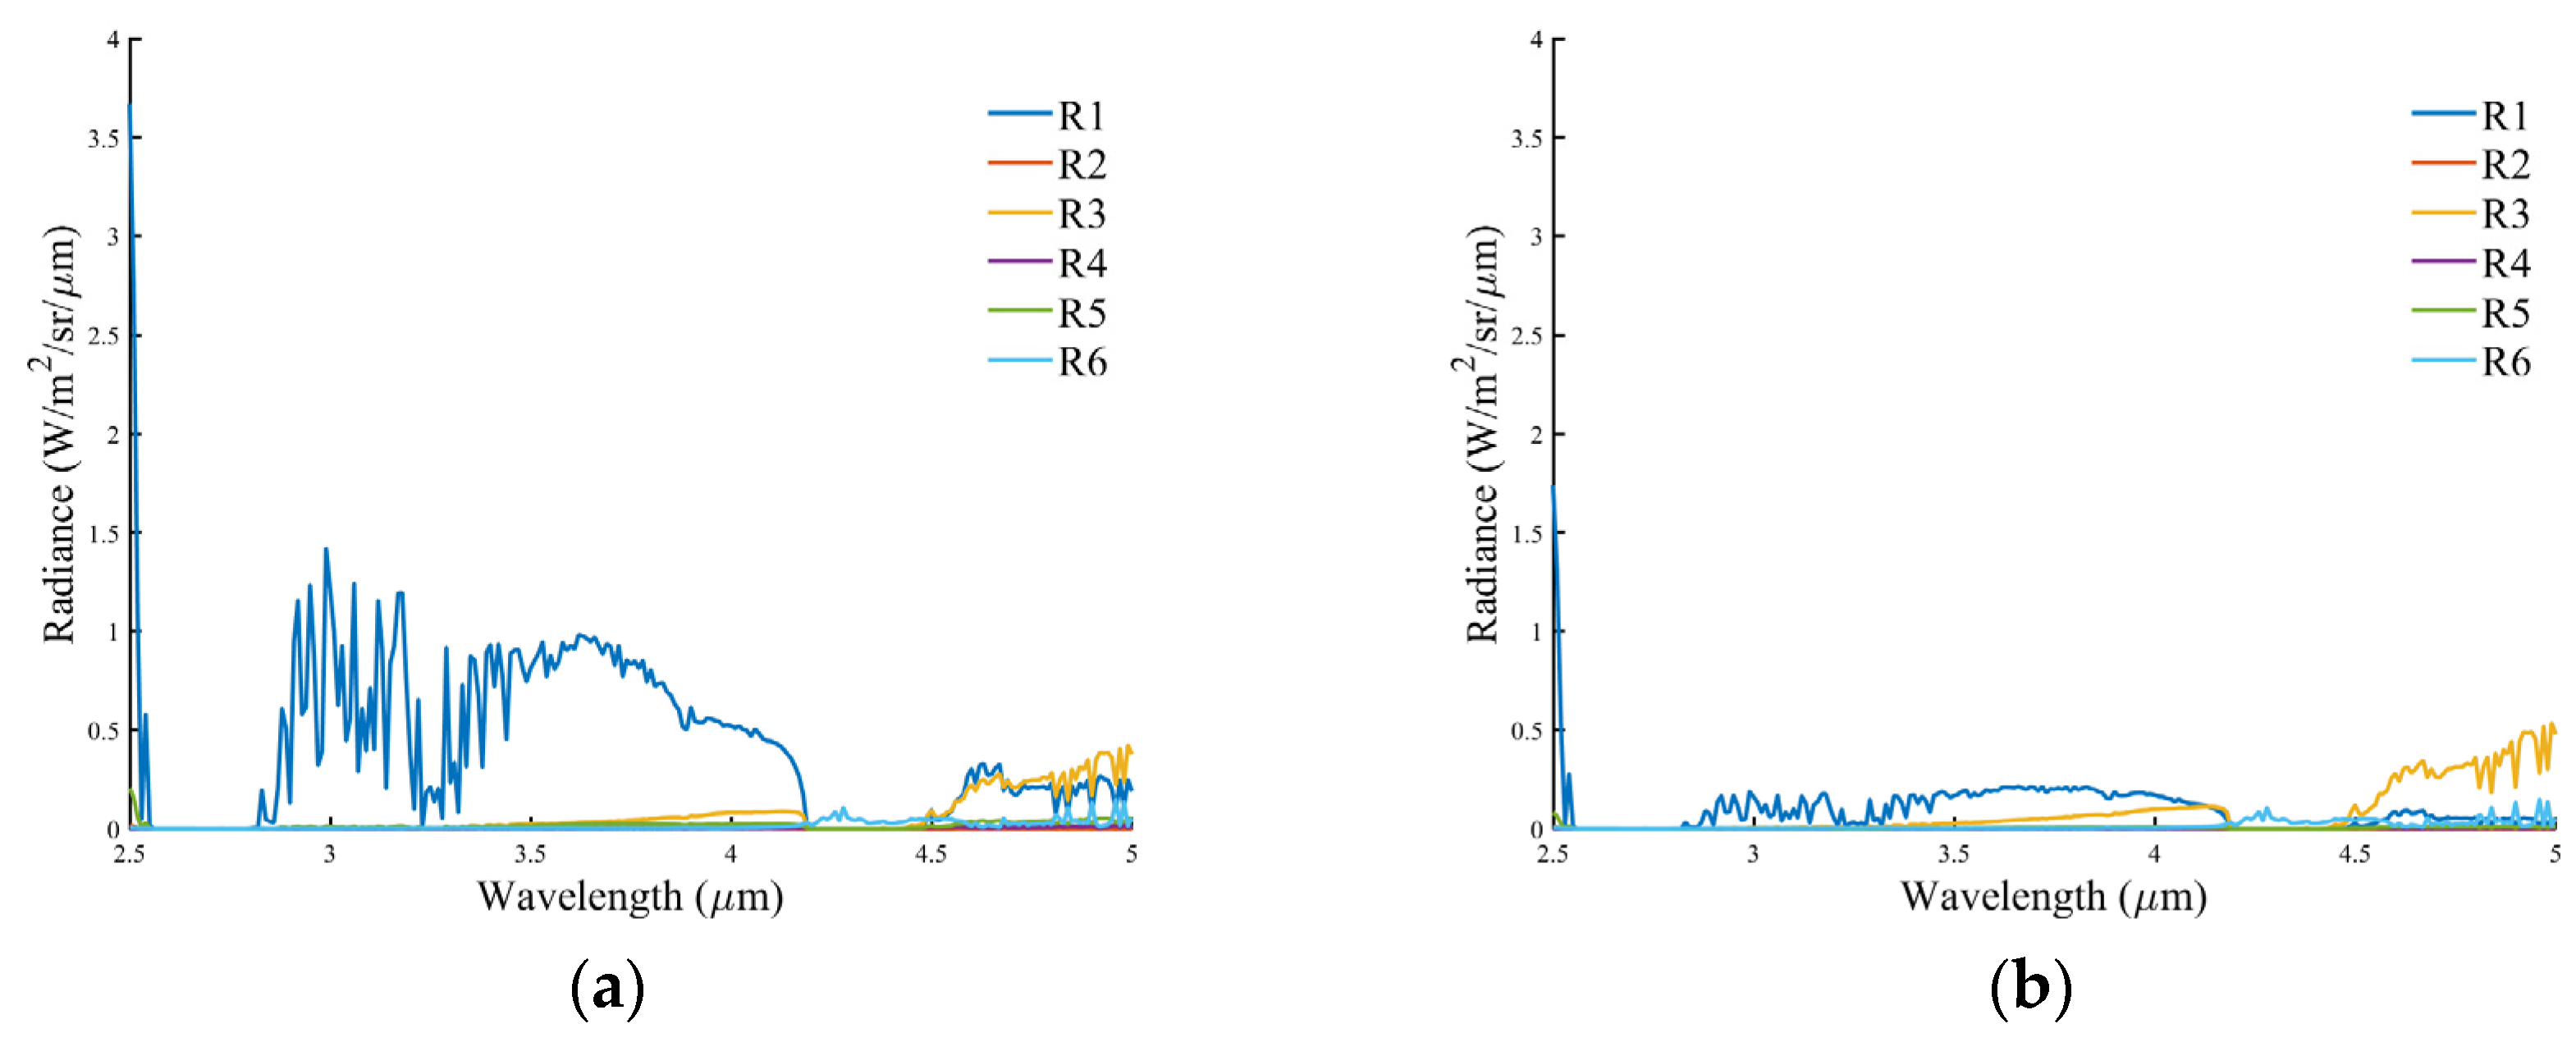
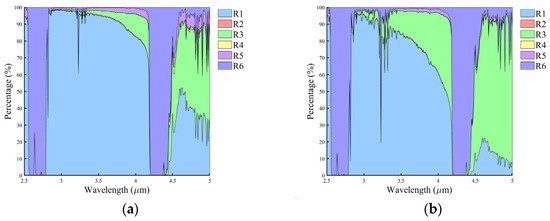
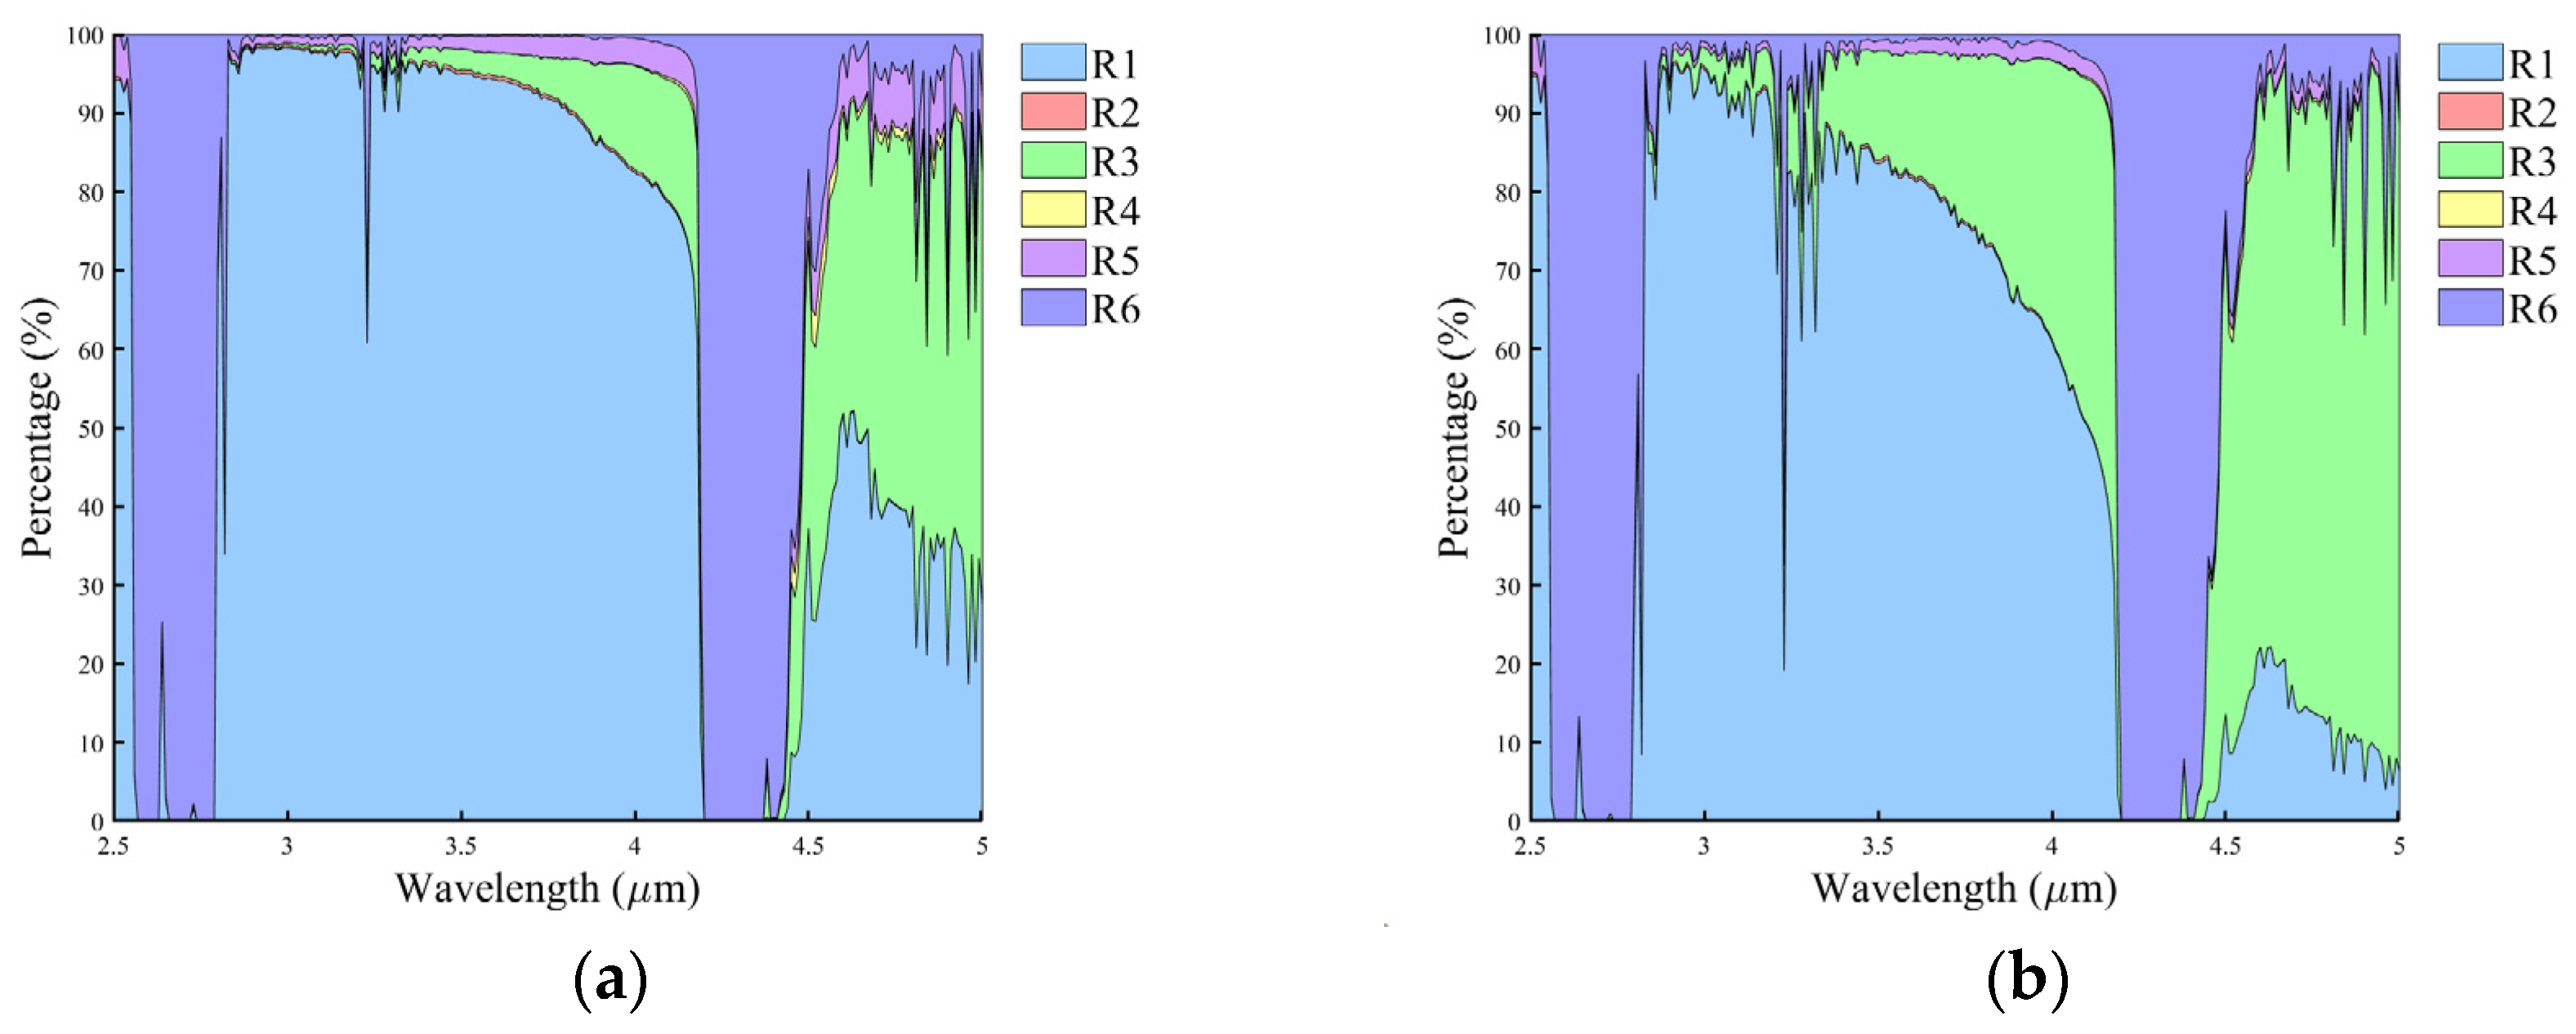
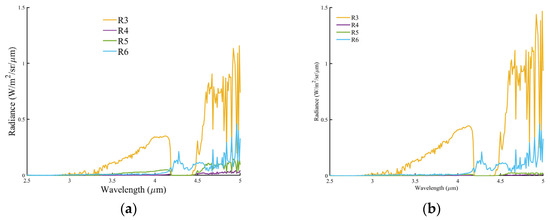
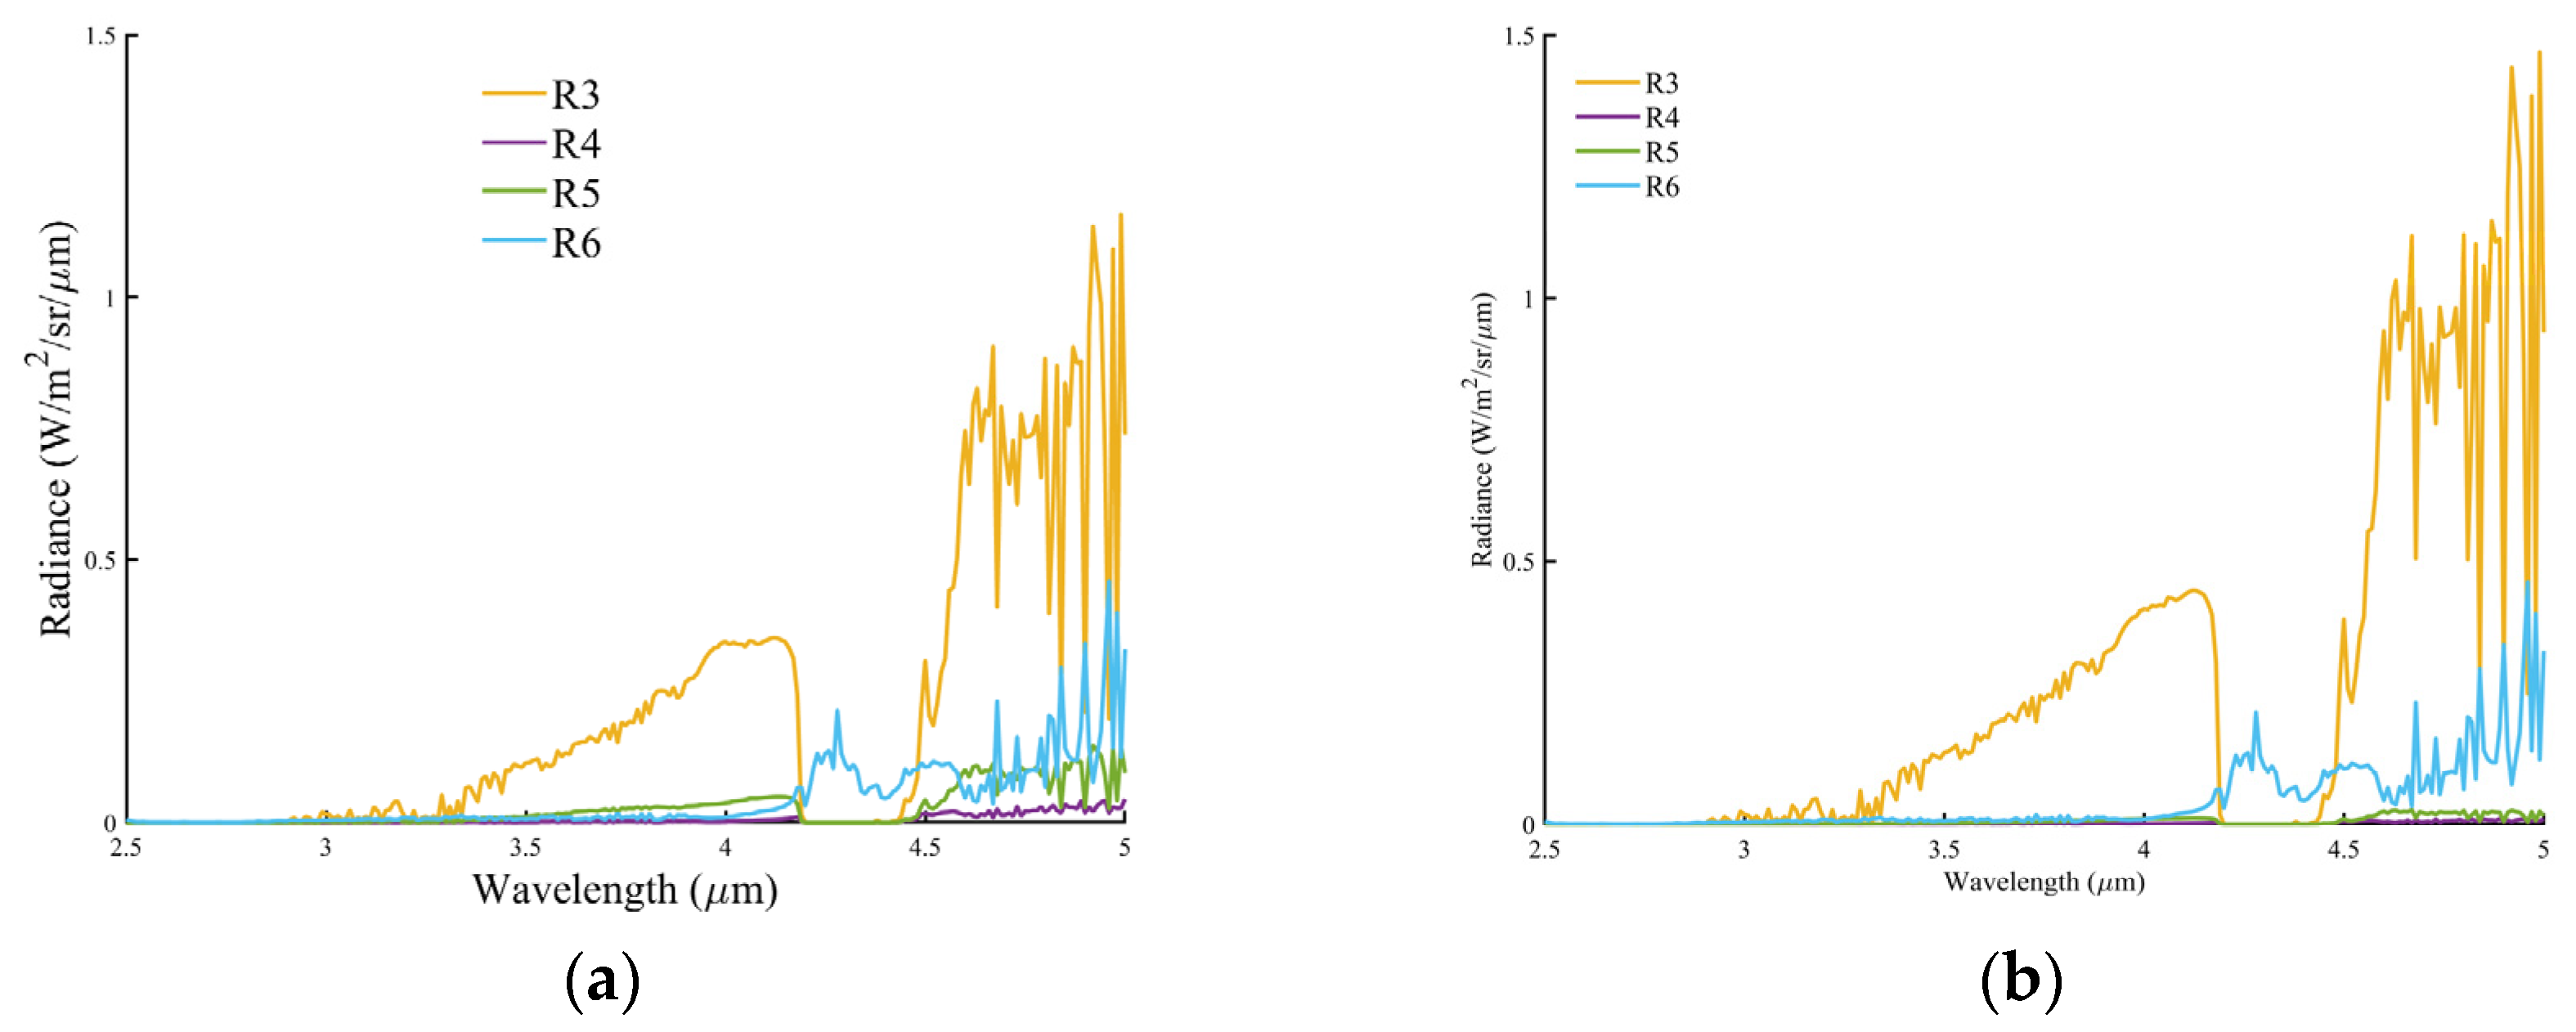
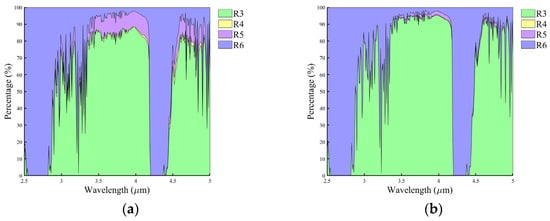
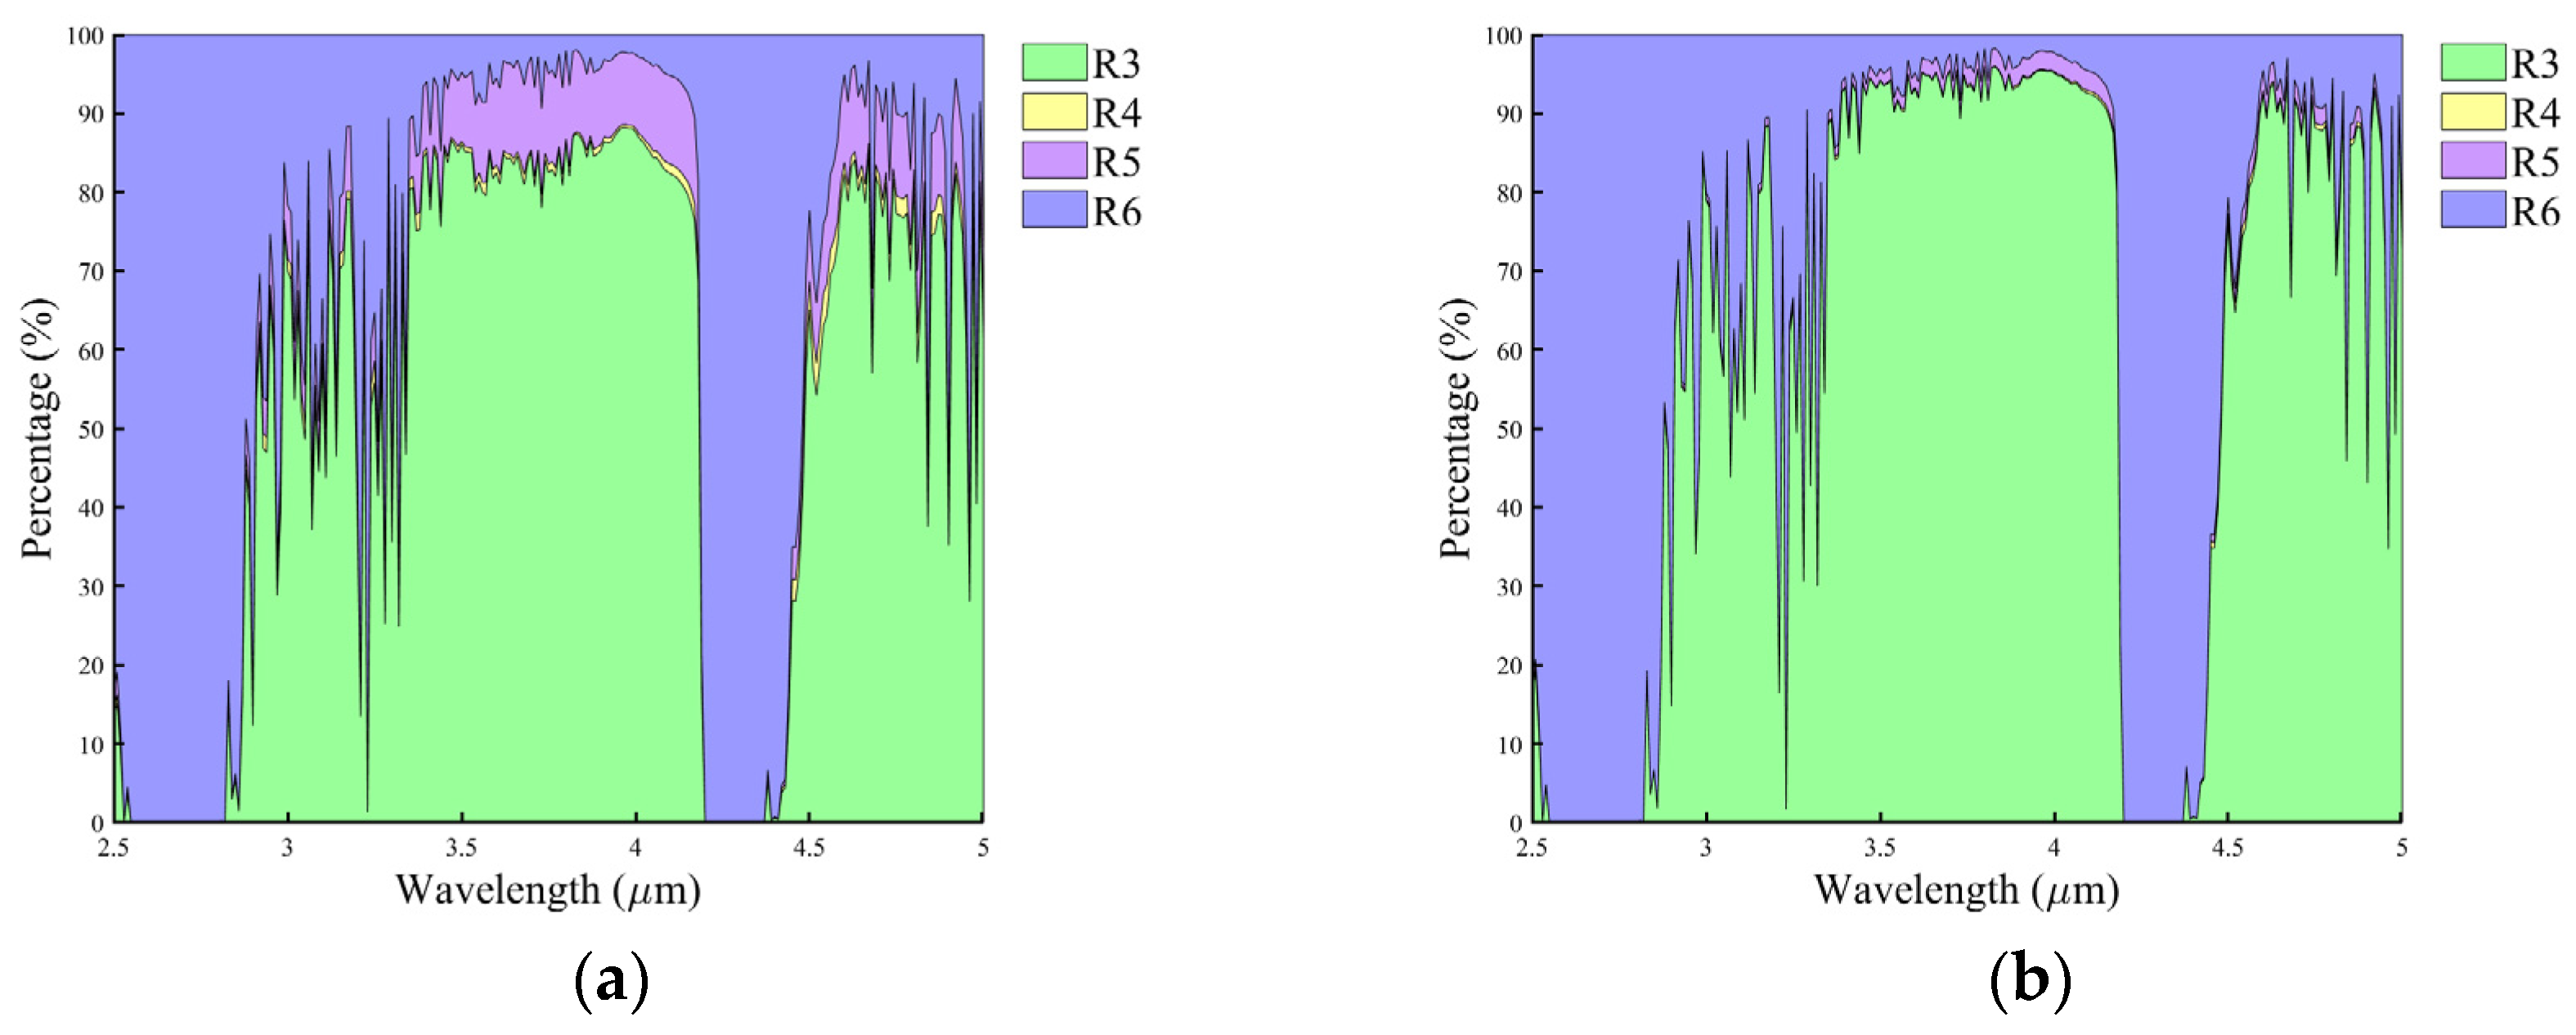

Disclaimer/Publisher’s Note: The statements, opinions and data contained in all publications are solely those of the individual author(s) and contributor(s) and not of MDPI and/or the editor(s). MDPI and/or the editor(s) disclaim responsibility for any injury to people or property resulting from any ideas, methods, instructions or products referred to in the content. |
© 2026 by the authors. Licensee MDPI, Basel, Switzerland. This article is an open access article distributed under the terms and conditions of the Creative Commons Attribution (CC BY) license.