


Abstract
Optical frequency domain reflectometry (OFDR) generally employs a sliding-window analysis for distributed sensing, and the window parameters directly determine the spatial resolution and sensing performance of the system. In this work, the effects of zero-padding and window overlap on OFDR sensing performance were investigated. Experimental results demonstrate strain measurements from 0 μɛ to 2000 μɛ with a spatial resolution of 13.64 mm, achieving a sensitivity of 0.15 GHz/μɛ. The standard deviation of the measured strain in the nominally unstrained region was 1.20 με. Furthermore, temperature measurements from 25 °C to 75 °C achieved a sensitivity of 1.42 GHz/°C, and the standard deviation of the measured temperature in the unheated region was 0.15 °C. With the proposed method, sensing performance can be improved while maintaining the same spatial resolution. The proposed method provides a simple and hardware-independent approach for improving OFDR sensing performance.
1. Introduction
Distributed sensing methods with high sensitivity and spatial resolution play an important role in industrial production and scientific research. Sensing range and spatial resolution should be configured differently for various applications. Specifically, large-scale structural monitoring focuses primarily on a long sensing range, and local deformation monitoring demands high spatial resolution as well as good sensitivity. For example, in the monitoring of chemical reaction processes, this technology can detect the glycerol diffusion process in water by using a temperature-compensated distributed refractive index (RI) sensor through an etched multi-core fiber [1]. In the field of 3D shape sensing, the deformation characteristics of complex surfaces can be reconstructed using distributed optical fiber networks, and this technology has been successfully applied to advanced engineering such as aircraft skin deformation monitoring and structural health monitoring [2,3]. For these applications, millimeter-level localization and micro-strain resolution are often required simultaneously. It is therefore essential to select suitable sensing techniques by taking into account the measurement range and spatial resolution required for these applications.
To date, distributed sensing methods that utilize scattering effects in optical fibers have been widely developed, mainly including Raman [4], Brillouin [5,6], and Rayleigh [7,8,9]. However, Raman scattering relies on temperature-sensitive spontaneous emission characteristics, which make it suitable for wide-temperature-range measurements, but its spatial resolution is limited by pulse width. Brillouin scattering measures strain and temperature through Brillouin frequency shifts and offers sensing ranges of several kilometers. In contrast, Rayleigh-scattering-based OFDR employs coherent detection and can achieve millimeter-level spatial resolution, making it particularly attractive for high-precision distributed sensing applications [10]. However, the performance of OFDR systems is determined not only by laser frequency sweep quality but also by the signal-processing algorithms employed in Rayleigh spectrum demodulation. To address this critical issue, several methods have been proposed to correct the frequency sweep nonlinearity. For example, the improved reference frequency method monitors frequency drift in real time using an auxiliary interferometer [11]; the phase-domain interpolation resampling method reconstructs the ideal linear frequency modulation curve using phase information [12]; the deskew filter compensates for nonlinear errors in the frequency domain [13]; and the hardware adaptive algorithm optimizes laser driving parameters through feedback control [14]. Although these methods effectively improve sweep linearity, the accuracy of OFDR measurements is also strongly influenced by the sliding-window processing used for Rayleigh spectrum extraction and cross-correlation demodulation.
In sliding-window-based OFDR systems, the window length determines the balance between spatial resolution and sensing accuracy. A shorter window improves spatial resolution but reduces correlation stability, resulting in lower sensing accuracy. In addition to window length, zero-padding and window overlap also influence OFDR performance. Recent studies have investigated OFDR performance improvement through signal-processing optimization, including FPGA-based processing incorporating zero-padding and window overlap [15], fast demodulation algorithms using wavelength selection matching and local cross-correlation [16]. Spectrum interpolation methods have been used to improve the accuracy of cross-correlation peak position estimation [17]. A demodulation optimization algorithm based on discrete-time analytic signals was proposed for Rayleigh backscattered signal reconstruction [18]. In addition, local similarities in Rayleigh scattering spectra have been utilized to extend the measurable strain range and suppress false and multiple correlation peaks [19]. However, the respective effects of zero-padding length and window overlap ratio, and their trade-offs with computational cost, have not been sufficiently quantified within a common fixed spatial resolution. As a result, these parameters are still selected empirically in practical OFDR systems.
In this work, the effects of zero-padding and window overlap on OFDR performance are quantitatively analyzed. The influence of zero-padding length on cross-correlation shift estimation and the effect of window overlap ratio on spatial sampling and localization capability are analyzed and experimentally verified. Strain and temperature measurements were performed using a standard single-mode fiber with a spatial resolution of 13.64 mm. The standard deviations of the measured strain and temperature in the nominally unstrained and unheated regions were 1.20 με and 0.15 °C, respectively. The results provide practical guidelines for parameter optimization in OFDR systems.
2. Principle
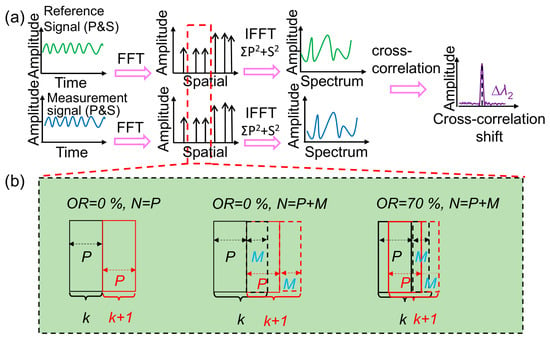
According to Froggatt et al., distributed sensing is achieved by analyzing the spectrum shift between the Rayleigh scattering spectra of the same fiber section before and after the application of strain or temperature. The measured cross-correlation shift is proportional to the applied strain or temperature [20,21]. Figure 1 illustrates the OFDR demodulation process and the optimization mechanisms of zero-padding and window overlap.
Figure 1.
(a) Schematic diagram of OFDR demodulation and (b) the optimization mechanisms of zero-padding and window overlap.
As shown in Figure 1a, the OFDR demodulation process consists of the following steps. First, two laser scans are performed to acquire the Rayleigh scattering signals before and after the applied strain or temperature. The p- and s-polarization components of the reference (Ref.) and measurement (Mea.) signals are transformed into the distance domain using a fast Fourier transform (FFT). The theoretical spatial resolution of the OFDR system, determined by the laser frequency sweep range, can be expressed as follows [18]:
In Equation (1), c is the speed of light in vacuum, n is the group effective refractive index of the fiber under test, and ∆f is the scanning range of the laser. This equation describes the theoretical spatial resolution determined by the laser sweep range. In practical distributed sensing, the sliding-window length also determines the sensing spatial resolution. Assuming that the number of effective data points in each window is P, the sensing spatial resolution of the OFDR system can be expressed as follows:
Thus, the sensing spatial resolution is determined by the window length, while the overlap ratio controls the spatial sampling interval between adjacent sensing points. Subsequently, the Ref. and Mea. signals within the same distance-domain window are transformed back into the frequency domain using the inverse fast Fourier transform (IFFT). Then, their Rayleigh scattering spectra are cross-correlated. Finally, the Rayleigh cross-correlation shift is determined from the cross-correlation spectrum, which is proportional to the applied strain or temperature variation. The window length determines the trade-off between sensing accuracy and spatial resolution. Therefore, the strain or temperature equivalent sampling interval, Δsmin, can be expressed as follows:
In Equation (3), RES denotes the sensitivity coefficient relating the Rayleigh cross-correlation shift to the applied strain or temperature. In Equation (4), Δfmin represents the spectral sampling interval in the cross-correlation spectrum and is given as follows [19]:
In Figure 1b, P is the number of original data points within a window and M is the number of zero-padding points (P + M = N). Here, N denotes the total number of points after zero-padding. According to Equation (4), zero-padding reduces the spectral sampling interval, thereby improving the accuracy of cross-correlation shift estimation. Therefore, based on Equations (1)–(4), ∆smin can be expressed by:
Equation (5) shows that the sensing equivalent sampling depends on both the sensing window length and the zero-padding length, where i denotes the window index in the distance domain. Increasing the zero-padding length improves the accuracy of cross-correlation shift estimation without changing the spatial resolution. Increasing the overlap ratio improves spatial sampling density by reducing the spacing between adjacent sensing points.
If a window contains both strained and unstrained regions, a transition may appear near the boundary. Localized changes smaller than the spatial resolution may be difficult to resolve, which is mainly determined by the window length rather than the overlap ratio. Therefore, zero-padding and window overlap play complementary roles in OFDR. They improve cross-correlation shift estimation and spatial sampling density while maintaining the same spatial resolution.
3. Experimental Setup
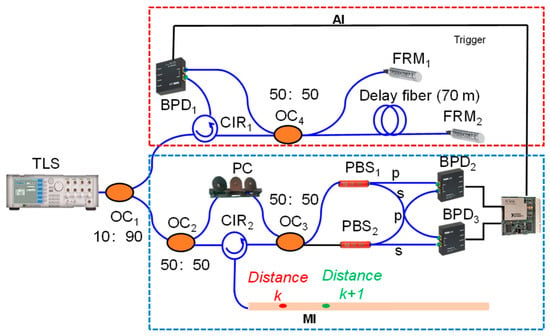
The OFDR system is based on coherent detection technology. As shown in Figure 2, the red dashed box represents an auxiliary interferometer (AI) based on a Michelson interferometer. The AI provides an external clock for the data acquisition card (DAQ), enabling uniform frequency sampling and compensation for the laser frequency sweep nonlinearity during signal sampling. The remaining part constitutes the main interferometer (MI), which is based on a Mach–Zehnder interferometer. The tunable laser source (TLS) was operated from 1545 nm to 1555 nm, corresponding to a sweep range of 10 nm. The output light was divided by the optical coupler (OC2) into a reference arm and a measurement arm. The polarization state in the reference arm was adjusted by a polarization controller (PC), while the measurement arm was connected to the fiber under test. The backscattered light from the measurement arm and the light from the reference arm were recombined by the optical coupler (OC3) to generate a beat signal. Subsequently, the beat signal was separated into p- and s-polarization components by polarization beam splitters (PBS1 and PBS2) and detected by balanced photodetectors (BPD2 and BPD3), respectively. The combination of polarization-diversity detection and balanced detection suppresses common-mode noise, including DC background noise and laser intensity fluctuations, thereby improving the quality of the beat signal. Finally, the detected signals were acquired by the DAQ and processed according to the demodulation procedure shown in Figure 1.
Figure 2.
The setup of the OFDR system. TLS, tunable laser source; OC, optical coupler; CIR, circulator; PBS, polarization beam splitter; FRM, Faraday rotating mirror; PC, polarization controller; BPD, balanced photodetector; DAQ, data acquisition card.
4. Experimental Investigation and Discussion
4.1. Parameter Analysis
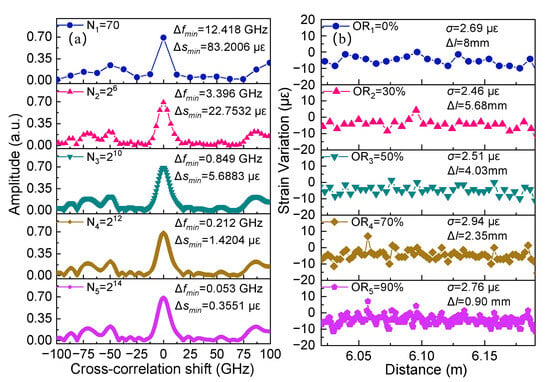
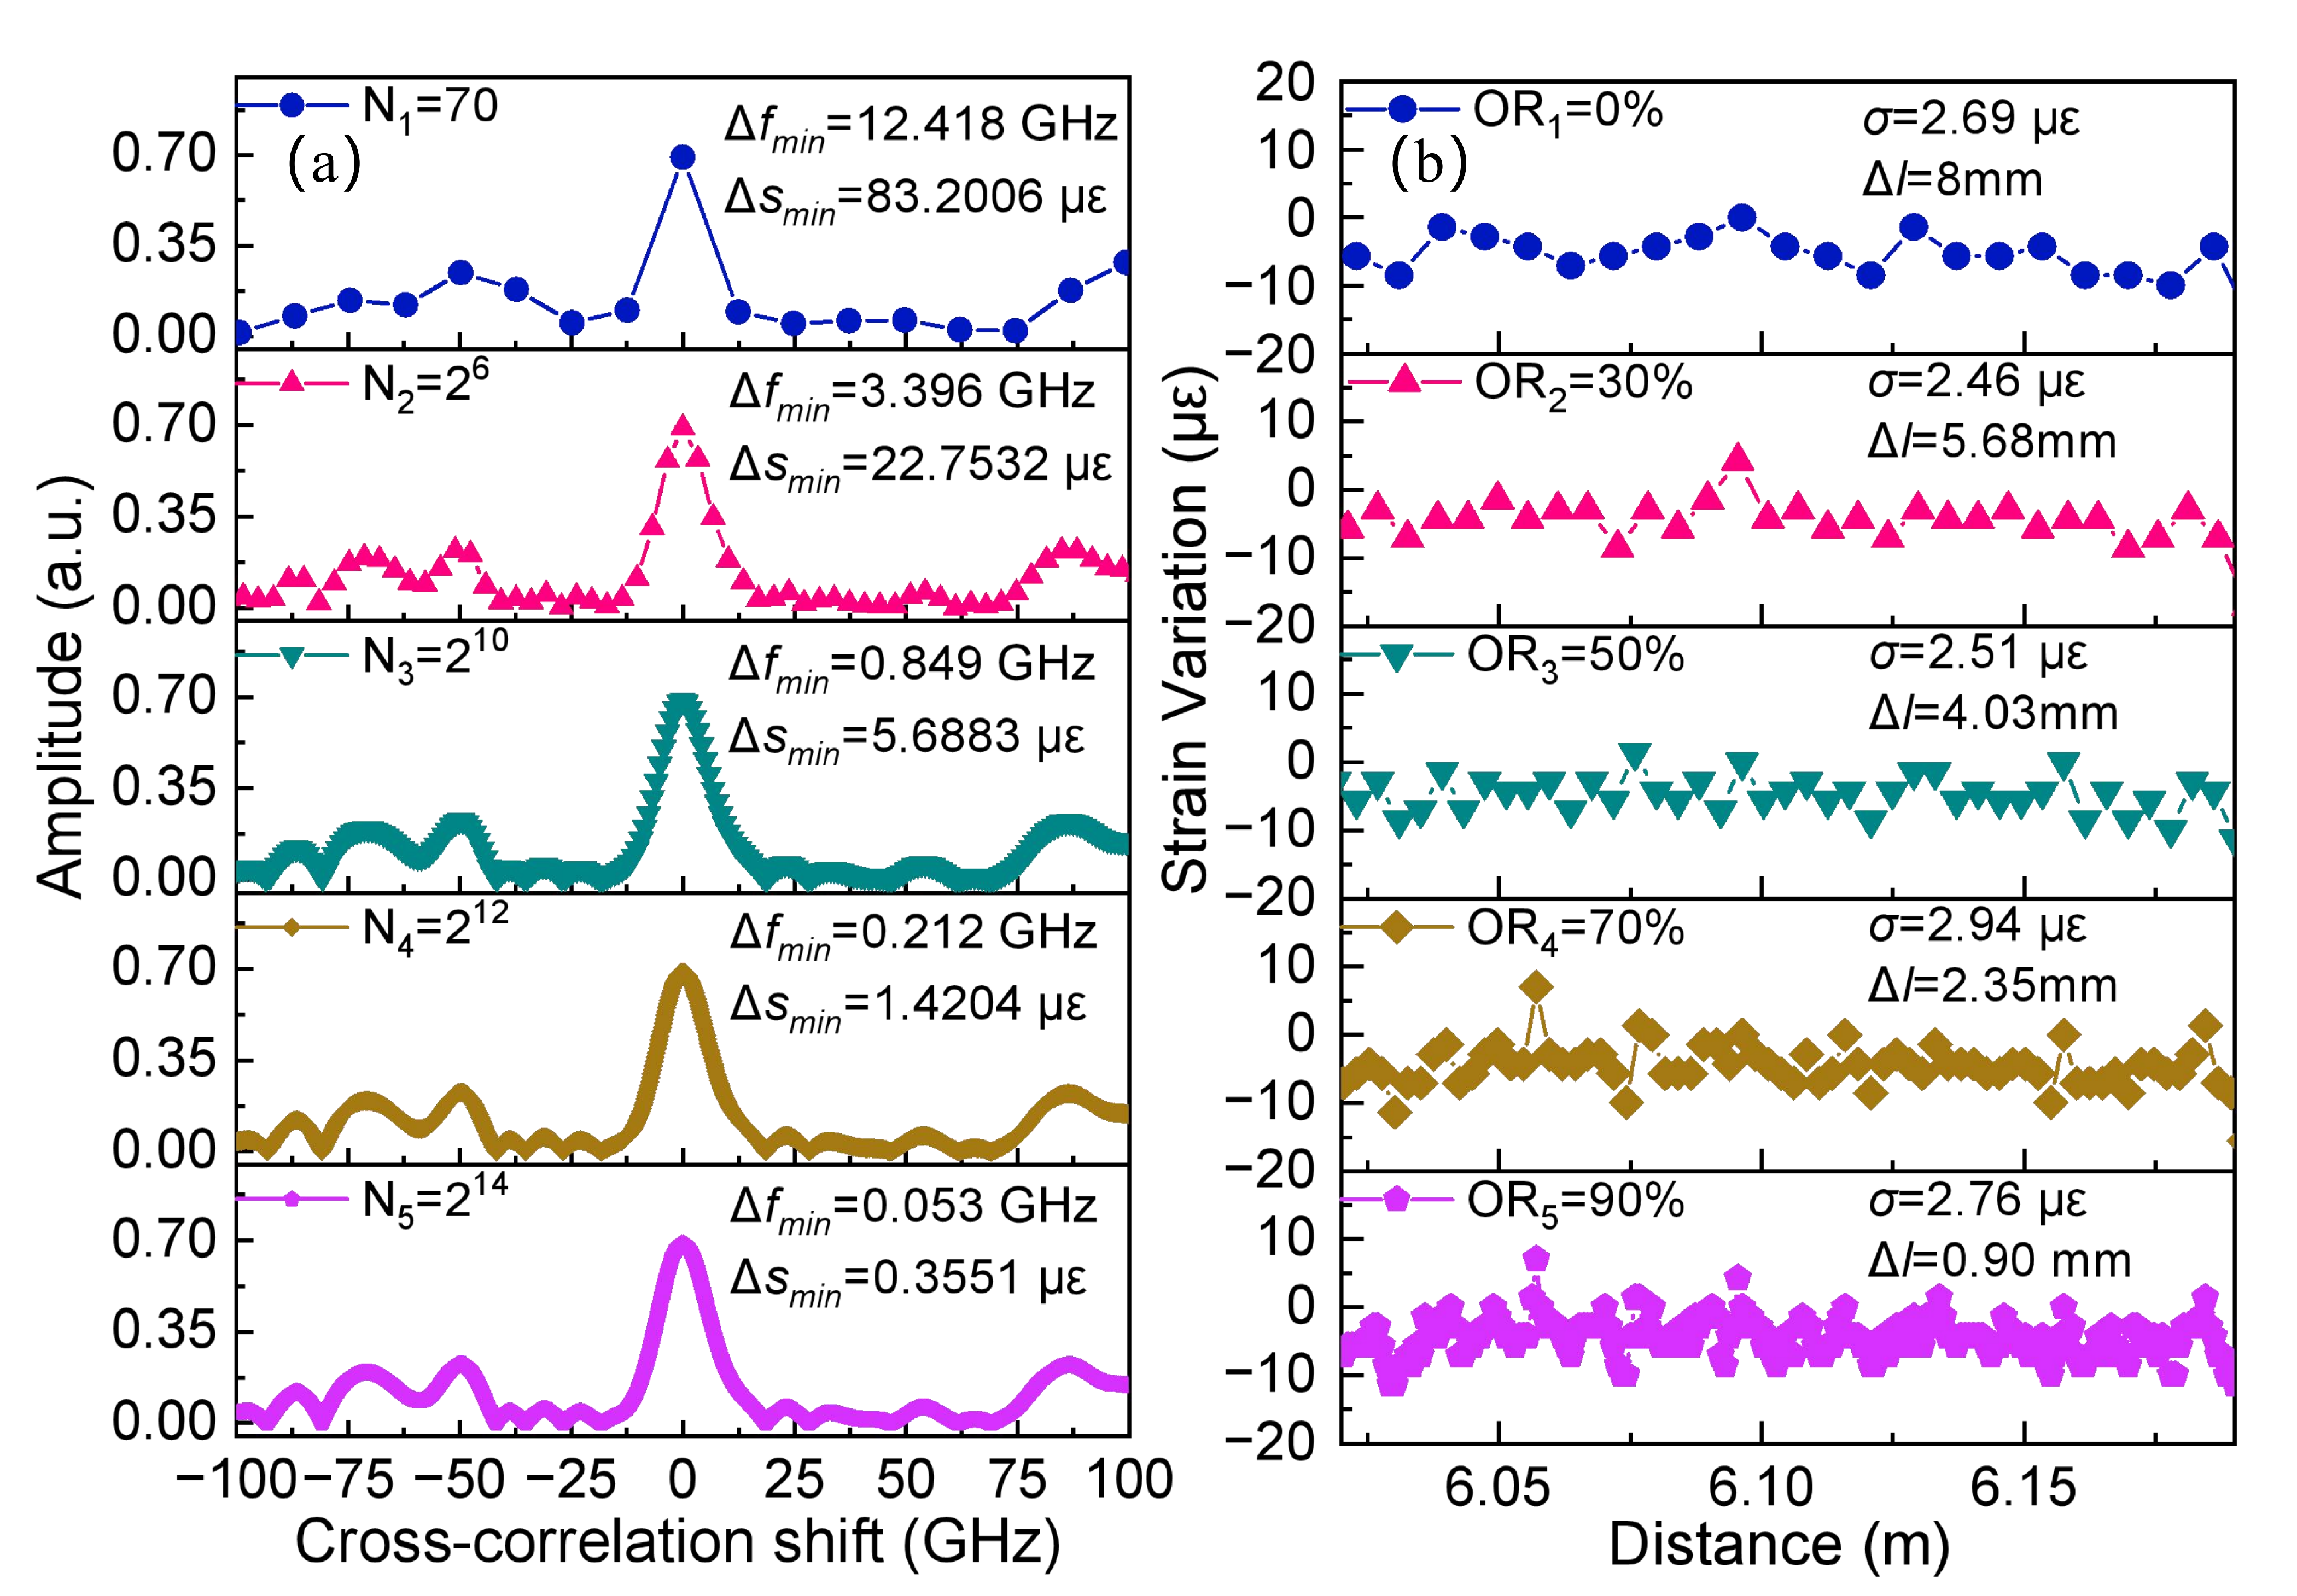
To verify the effectiveness of the proposed method, axial strain was applied to the test fiber, while unstrained regions were used to evaluate the OFDR performance. To quantitatively investigate the effects of zero-padding and window overlap, the window length was fixed at P = 70 points in this parameter analysis. The corresponding frequency interval of the cross-correlation shift was 12.42 GHz. Based on Equation (5), the strain equivalent sampling interval was 83.20 με. Zero-padding increases the number of spectral sampling points, thereby reducing the sampling interval of the cross-correlation spectrum and improving the accuracy of cross-correlation shift estimation. The effect of zero-padding was then investigated experimentally. The FFT lengths after zero-padding were set to 70, 28, 210, 212, and 214 points, denoted as N1–N5, respectively.
As shown in Figure 3a, when the FFT length was increased from N = 70 to N = 214 through zero-padding, the spectral sampling interval of the cross-correlation spectrum decreased from 12.42 GHz to 0.05 GHz. Accordingly, the theoretical strain equivalent sampling interval was reduced from 83.20 μɛ to 0.36 μɛ, corresponding to an approximately 231-fold refinement in the discrete strain-equivalent sampling interval. This improvement is attributed to the increased sampling density of the cross-correlation spectrum, which enables finer estimation of the cross-correlation peak position without adding new physical information. In addition, the influence of the overlap ratio between adjacent windows was investigated.
Figure 3.
Effects of sliding window parameters on OFDR performance: (a) influence of zero-padding length on the spectral sampling interval and strain-equivalent sampling interval; (b) influence of window overlap ratio on spatial sampling and strain fluctuation.
As shown in Figure 3b, the FFT length was fixed at N = 212, and only the overlap ratio (OR) was varied from 0% to 90%. With increasing overlap ratio, the spatial sampling interval Δl decreased from 8.00 mm to 0.90 mm. Thus, Δl characterizes the spatial sampling interval between adjacent sensing points. A smaller Δl provides denser spatial sampling and enables finer spatial localization of the demodulated results without changing the intrinsic spatial resolution. The standard deviation of strain ranged from 2.46 to 2.94 μɛ, suggesting that the overlap ratio slightly influences strain sensing accuracy. However, the incremental benefit becomes smaller at high overlap ratios, while the computational cost increases. This shows a general trend over a wide range of overlap ratios rather than indicating a unique optimum. OR = 10% was selected as a practical low-overlap setting for the subsequent experiments. Compared with OR = 0%, it provides denser spatial sampling while limiting the additional computational cost. Zero-padding increases the sampling density of the cross-correlation spectrum without changing its intrinsic spectral resolution or adding new physical information. The computation time increased from 7.23 s for the original FFT length to 24.55 s and 80.59 s for N = 212 and N = 214, respectively, indicating a rapid increase in computational cost with FFT length. Considering the improvement in peak estimation and the increasing computational cost, N = 212 was selected as a practical setting for the subsequent experiments. The proposed method has potential for near-real-time monitoring, although the processing speed depends on N, OR, and the computing platform. GPU or FPGA acceleration could further improve the processing speed. In practice, the window length should first be selected according to the required spatial resolution, followed by N and OR based on measurement stability, spatial sampling, and processing time. Therefore, N = 212 and OR = 10% are practical settings under the present experimental conditions rather than universal optimal values. Inappropriate parameter settings may affect measurement accuracy, cause insufficient spatial sampling, or increase computational cost.
Based on the optimized parameters, distributed strain sensing experiments were performed to evaluate the sensing performance of the OFDR system.
4.2. Strain Experimental and Results
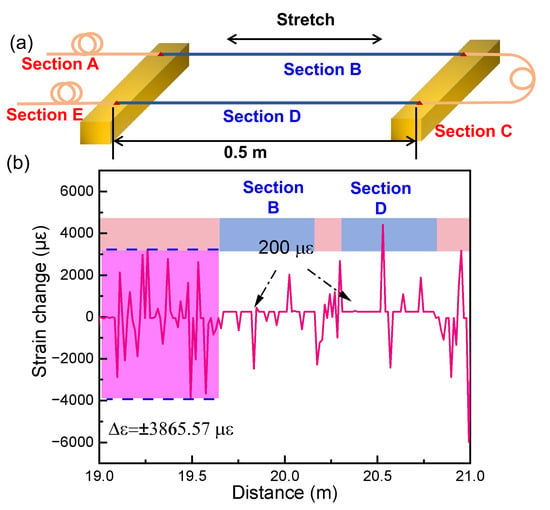
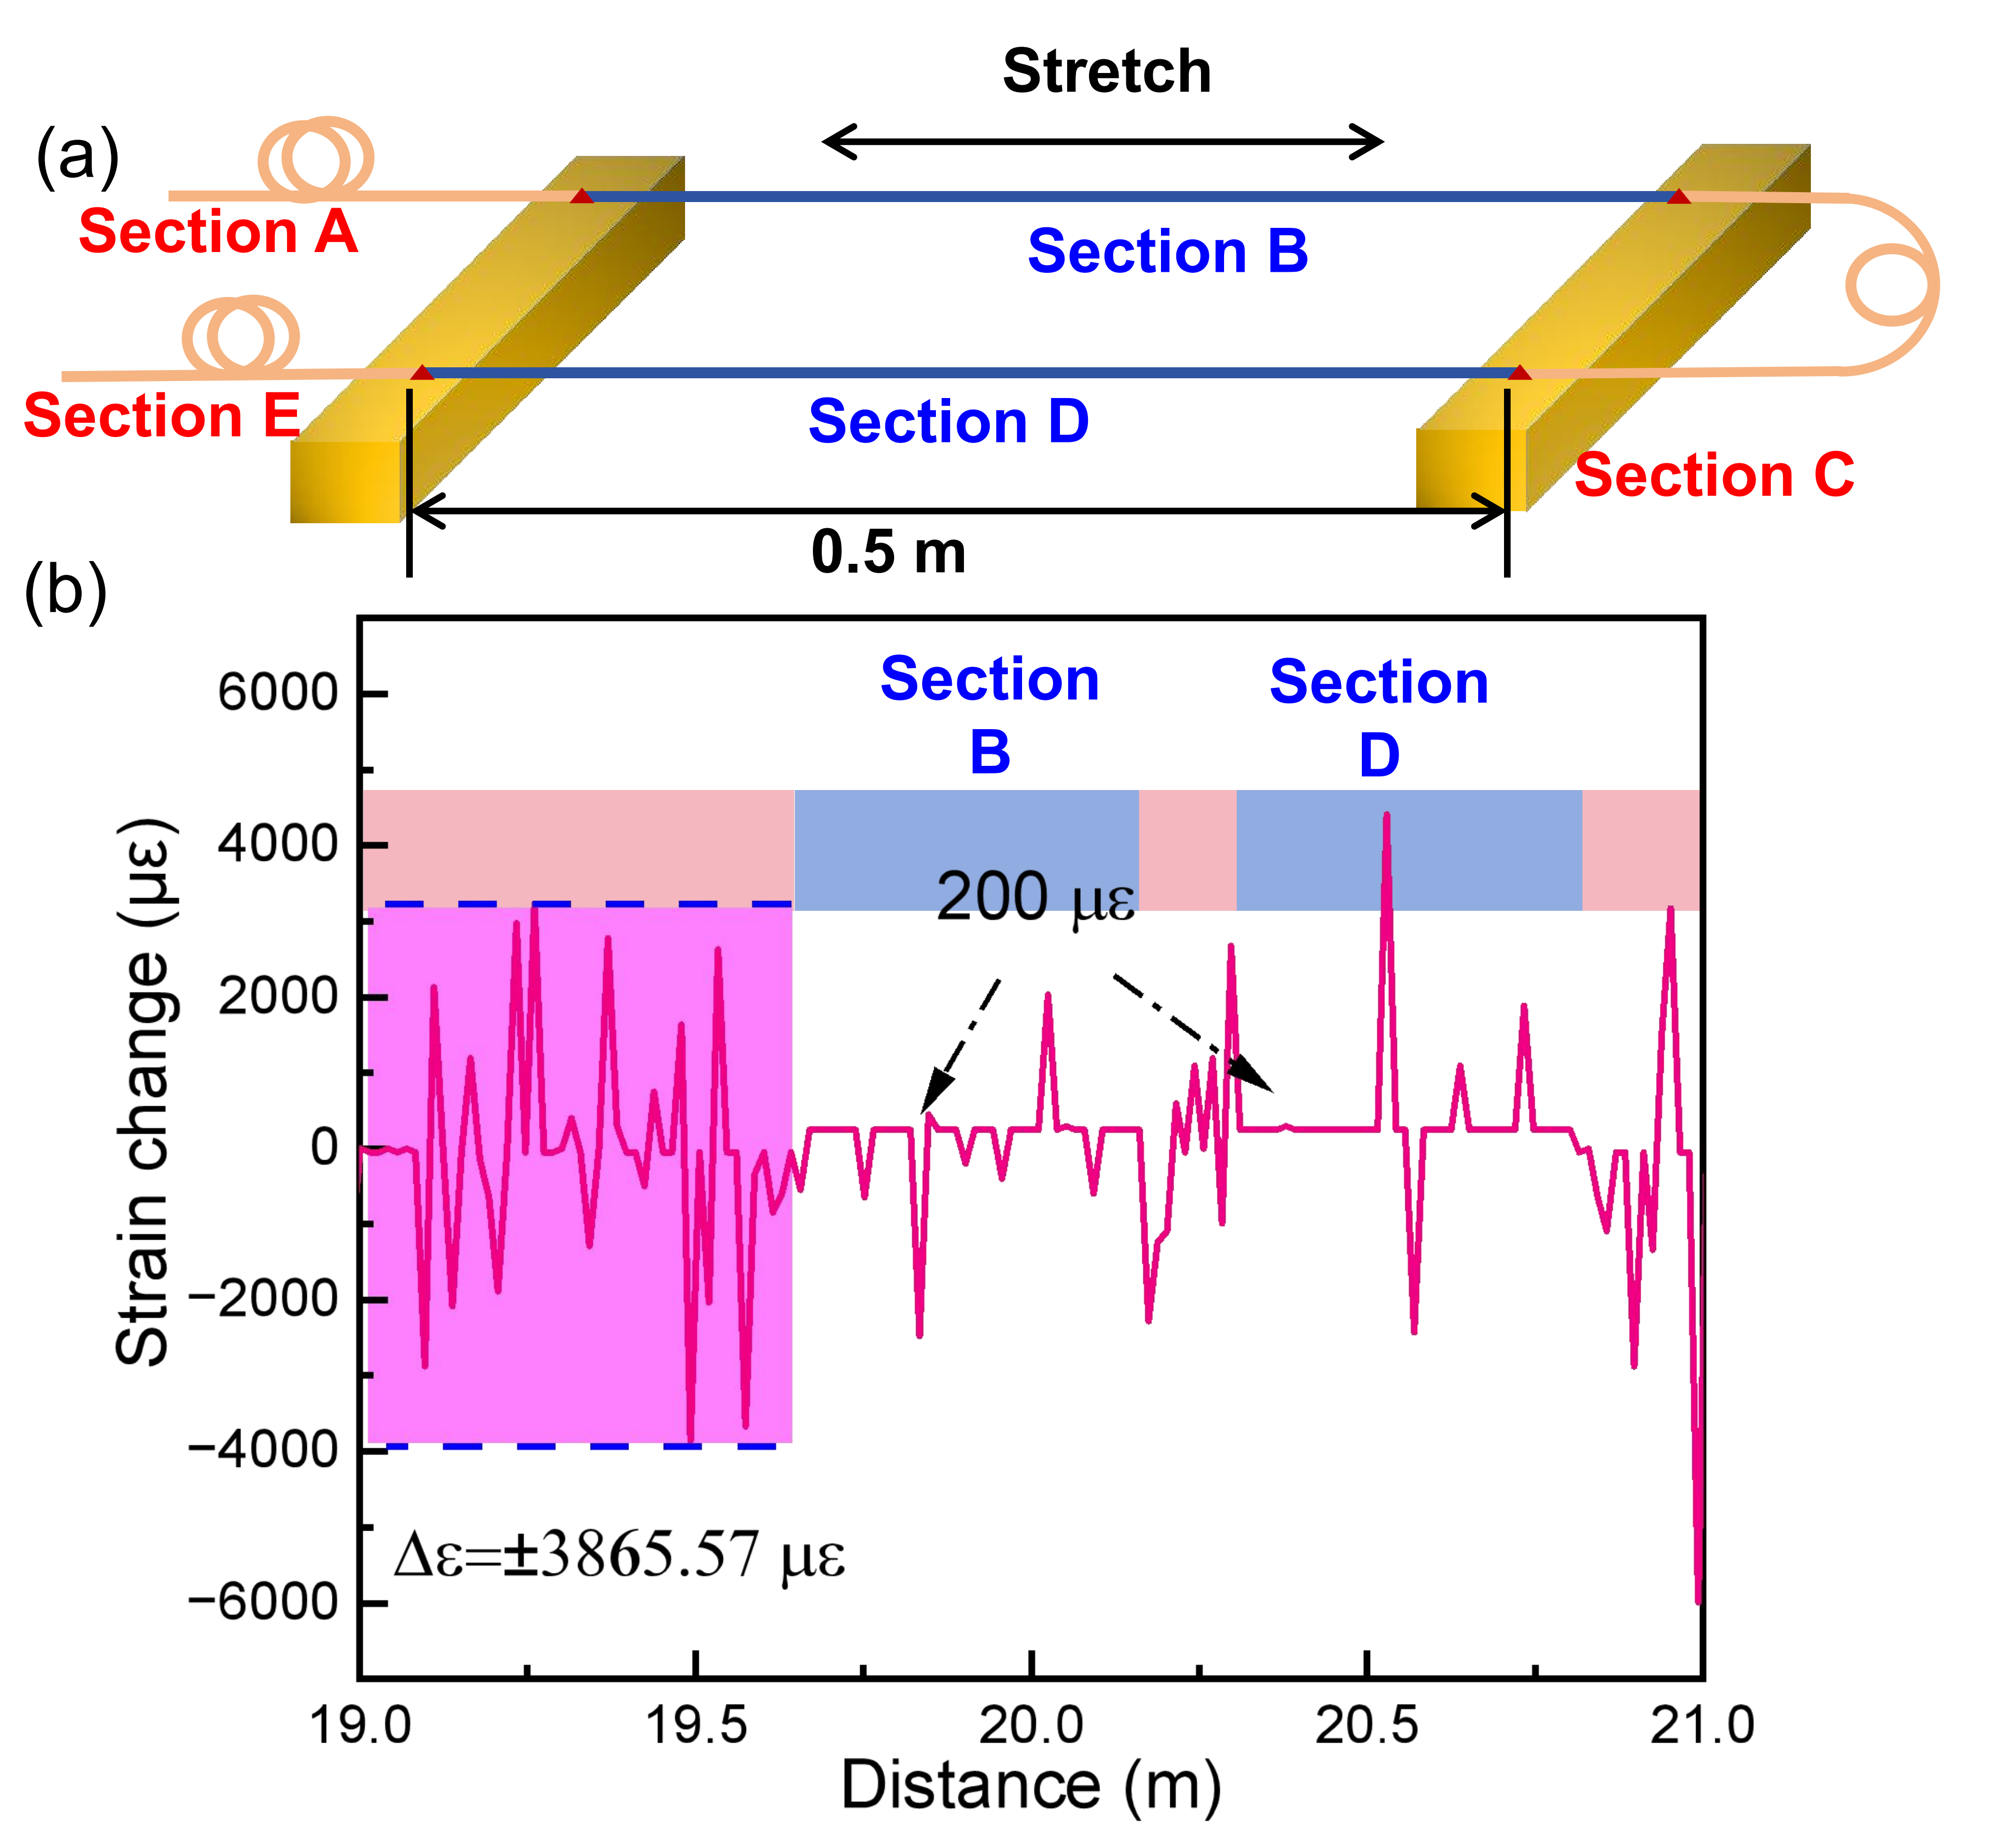
In the experiment, an Agilent 81940A tunable laser source was employed with a sweep rate of 40 nm/s and a wavelength sweep range of 1545–1555 nm. The fiber was fixed onto the translation stage using DP460 epoxy adhesive for strain application under laboratory conditions. In practical applications, strain transfer may vary with fixation methods, such as surface bonding and soil embedding, due to differences in interfacial conditions. This may affect the effective calibration coefficient and measurement results. Therefore, calibration under the corresponding installation conditions is necessary. As illustrated in Figure 4a, no strain was applied to sections A, C and E. The fixed fiber length in sections B and D was 50 cm, and a displacement step of 100 μm was applied, corresponding to a strain step of 200 μɛ. For the subsequent strain sensing experiments, the window length was set to P = 170 points, corresponding to a spatial resolution of 13.64 mm, as calculated from Equations (1) and (2). A shorter window contains fewer Rayleigh backscattering data points, which may reduce cross-correlation stability, whereas a longer window provides more scattering information but compromises spatial resolution and increases computational cost. This value was selected to balance spatial resolution, cross-correlation stability, and computational efficiency. Figure 4b shows the demodulated strain distribution under an applied strain of 200 μɛ. The strain distribution was demodulated using the conventional method without zero-padding or window overlap. As shown in Figure 4b, the demodulated strain in section A, where no strain was applied, exhibited fluctuations of ±3865.57 μɛ. Since the fluctuation amplitude was much larger than the applied strain of 200 μɛ, the strain changes in sections B and D could not be accurately reflected in the demodulated strain distribution. These large fluctuations are mainly caused by the limited Rayleigh scattering information within the short sensing window (P = 170), which reduces spectral correlation quality and stability, resulting in unreliable cross-correlation results. Consequently, sampling of the cross-correlation spectrum may cause errors in correlation peak position estimation, leading to large apparent strain fluctuations.
Figure 4.
Distributed strain sensing experiment: (a) schematic diagram of the strain loading setup; (b) strain distribution without zero-padding and window overlap.
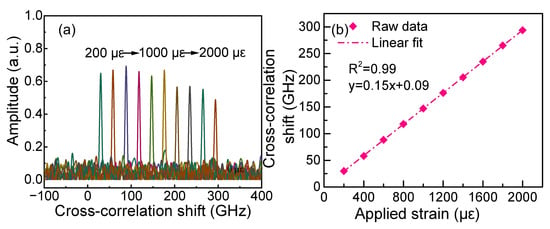
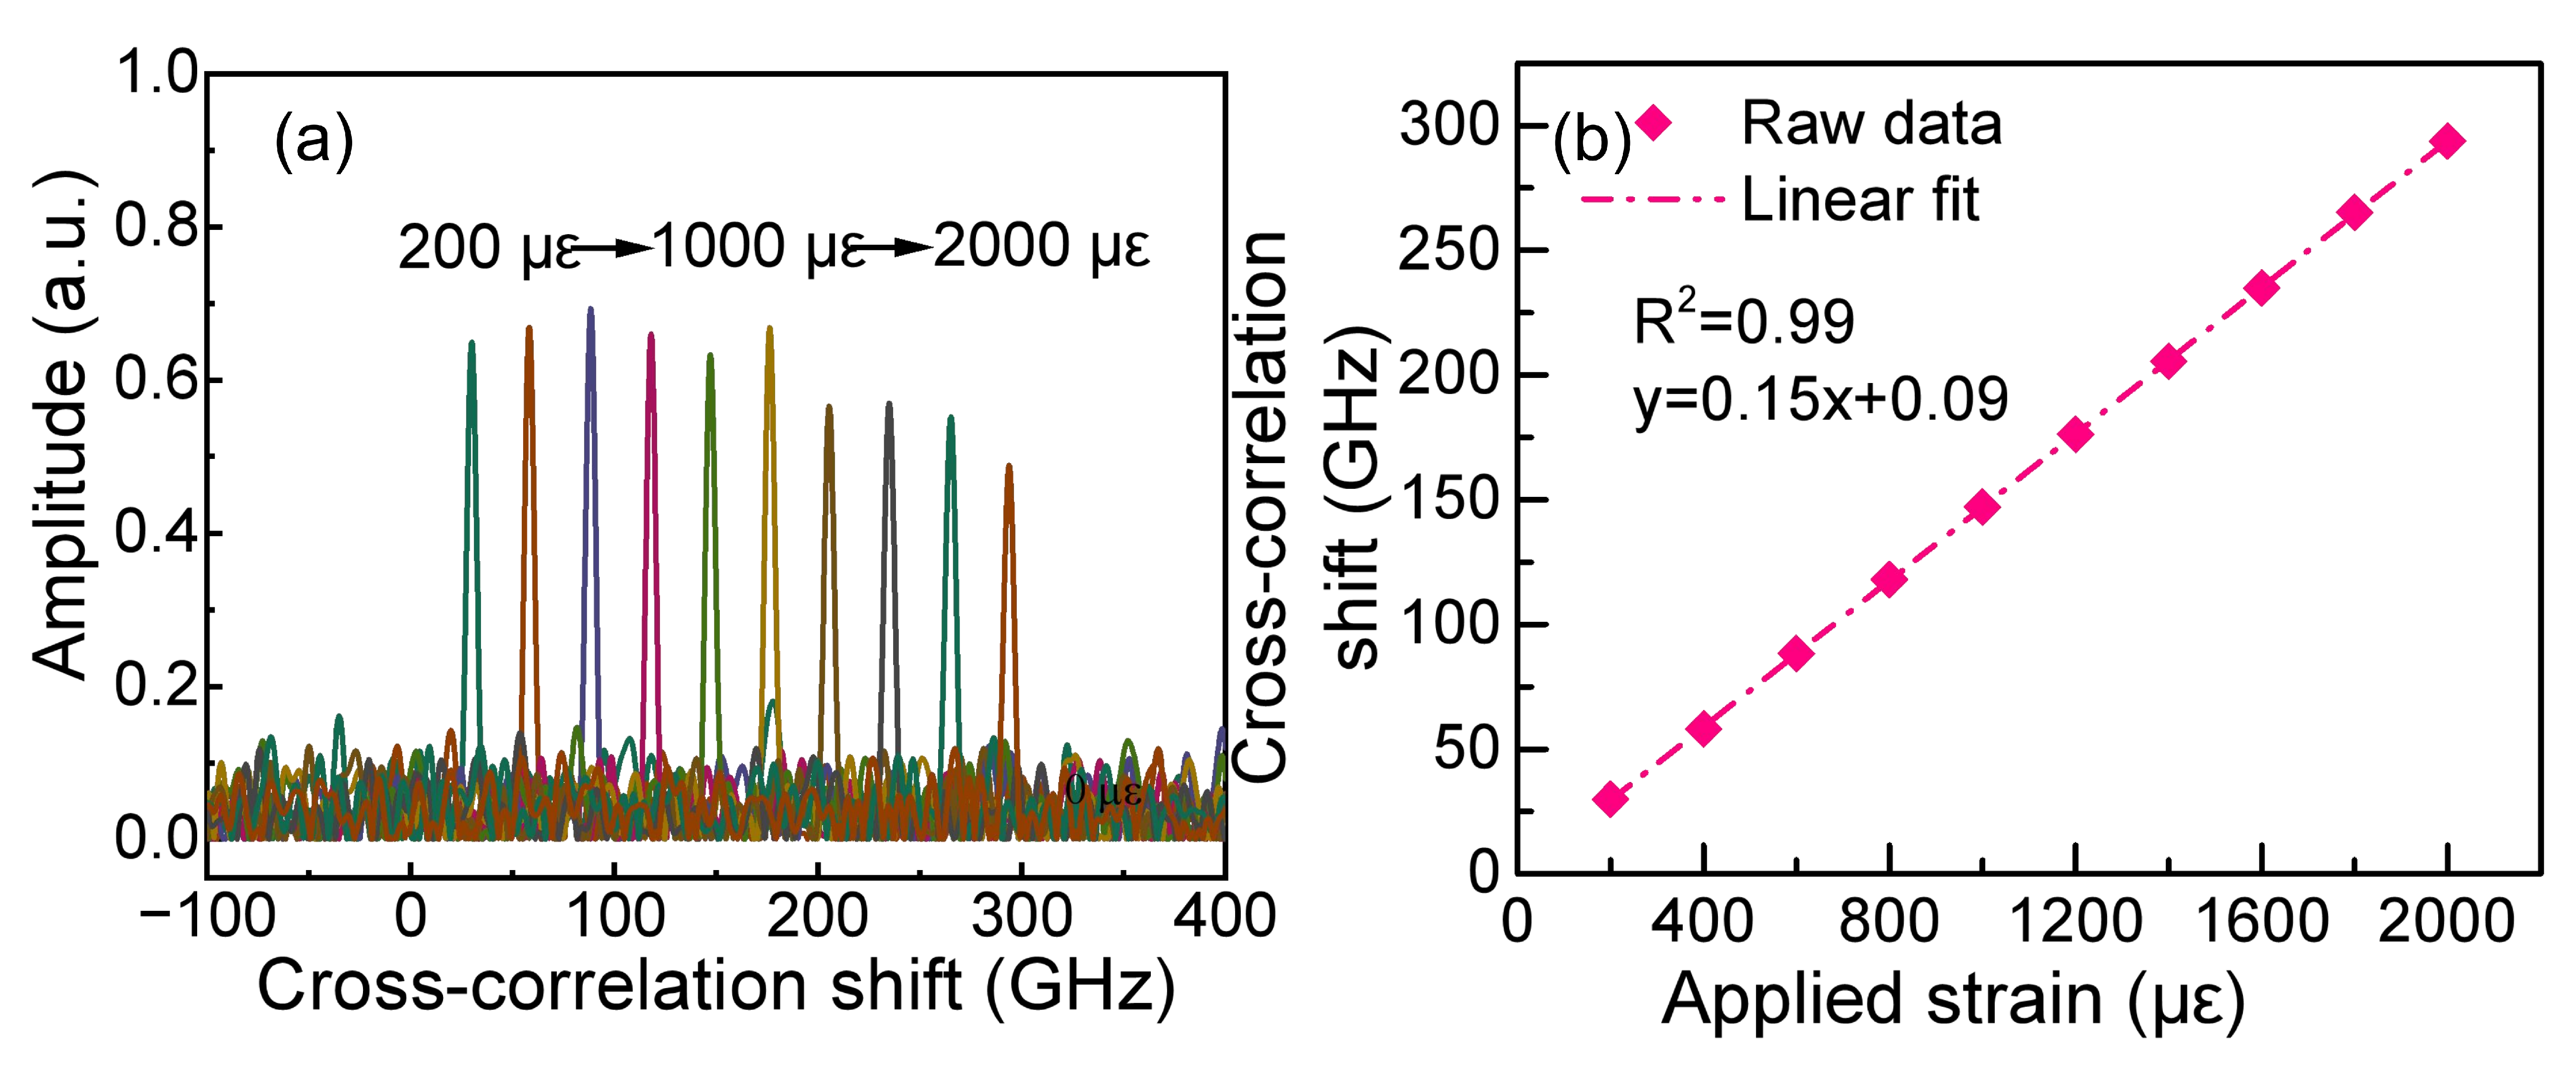
The strain distribution was then demodulated using the proposed zero-padding and window overlap method. Based on the parameter analysis in Figure 3, the FFT length was fixed at N = 212, and the overlap ratio was set to OR = 10%. After applying zero-padding and window overlap processing, the large fluctuations observed in Figure 4b were significantly reduced. Figure 5a shows the cross-correlation shift at 20 m along the fiber. The strain was increased in steps of 200 μɛ. The blue, green, and brown curves correspond to applied strains of 200 μɛ, 1000 μɛ, and 2000 μɛ, respectively. As shown in Figure 5b, the cross-correlation shift exhibits a linear relationship with the applied strain (R2 = 0.99). The slight non-zero intercept arises from residual measurement offsets rather than an intrinsic dead zone. The strain sensitivity coefficient obtained from the linear fitting was 0.15 GHz/μɛ (1.2 pm/μɛ), and is in good agreement with the theoretical value.
Figure 5.
(a) Cross-correlation shift at 20 m along the fiber under different applied strains (The blue, green, and brown curves correspond to applied strains of 200 μɛ, 1000 μɛ, and 2000 μɛ, respectively); (b) linear relationship between cross-correlation shift and applied strain.
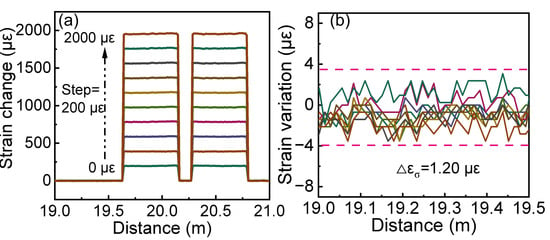
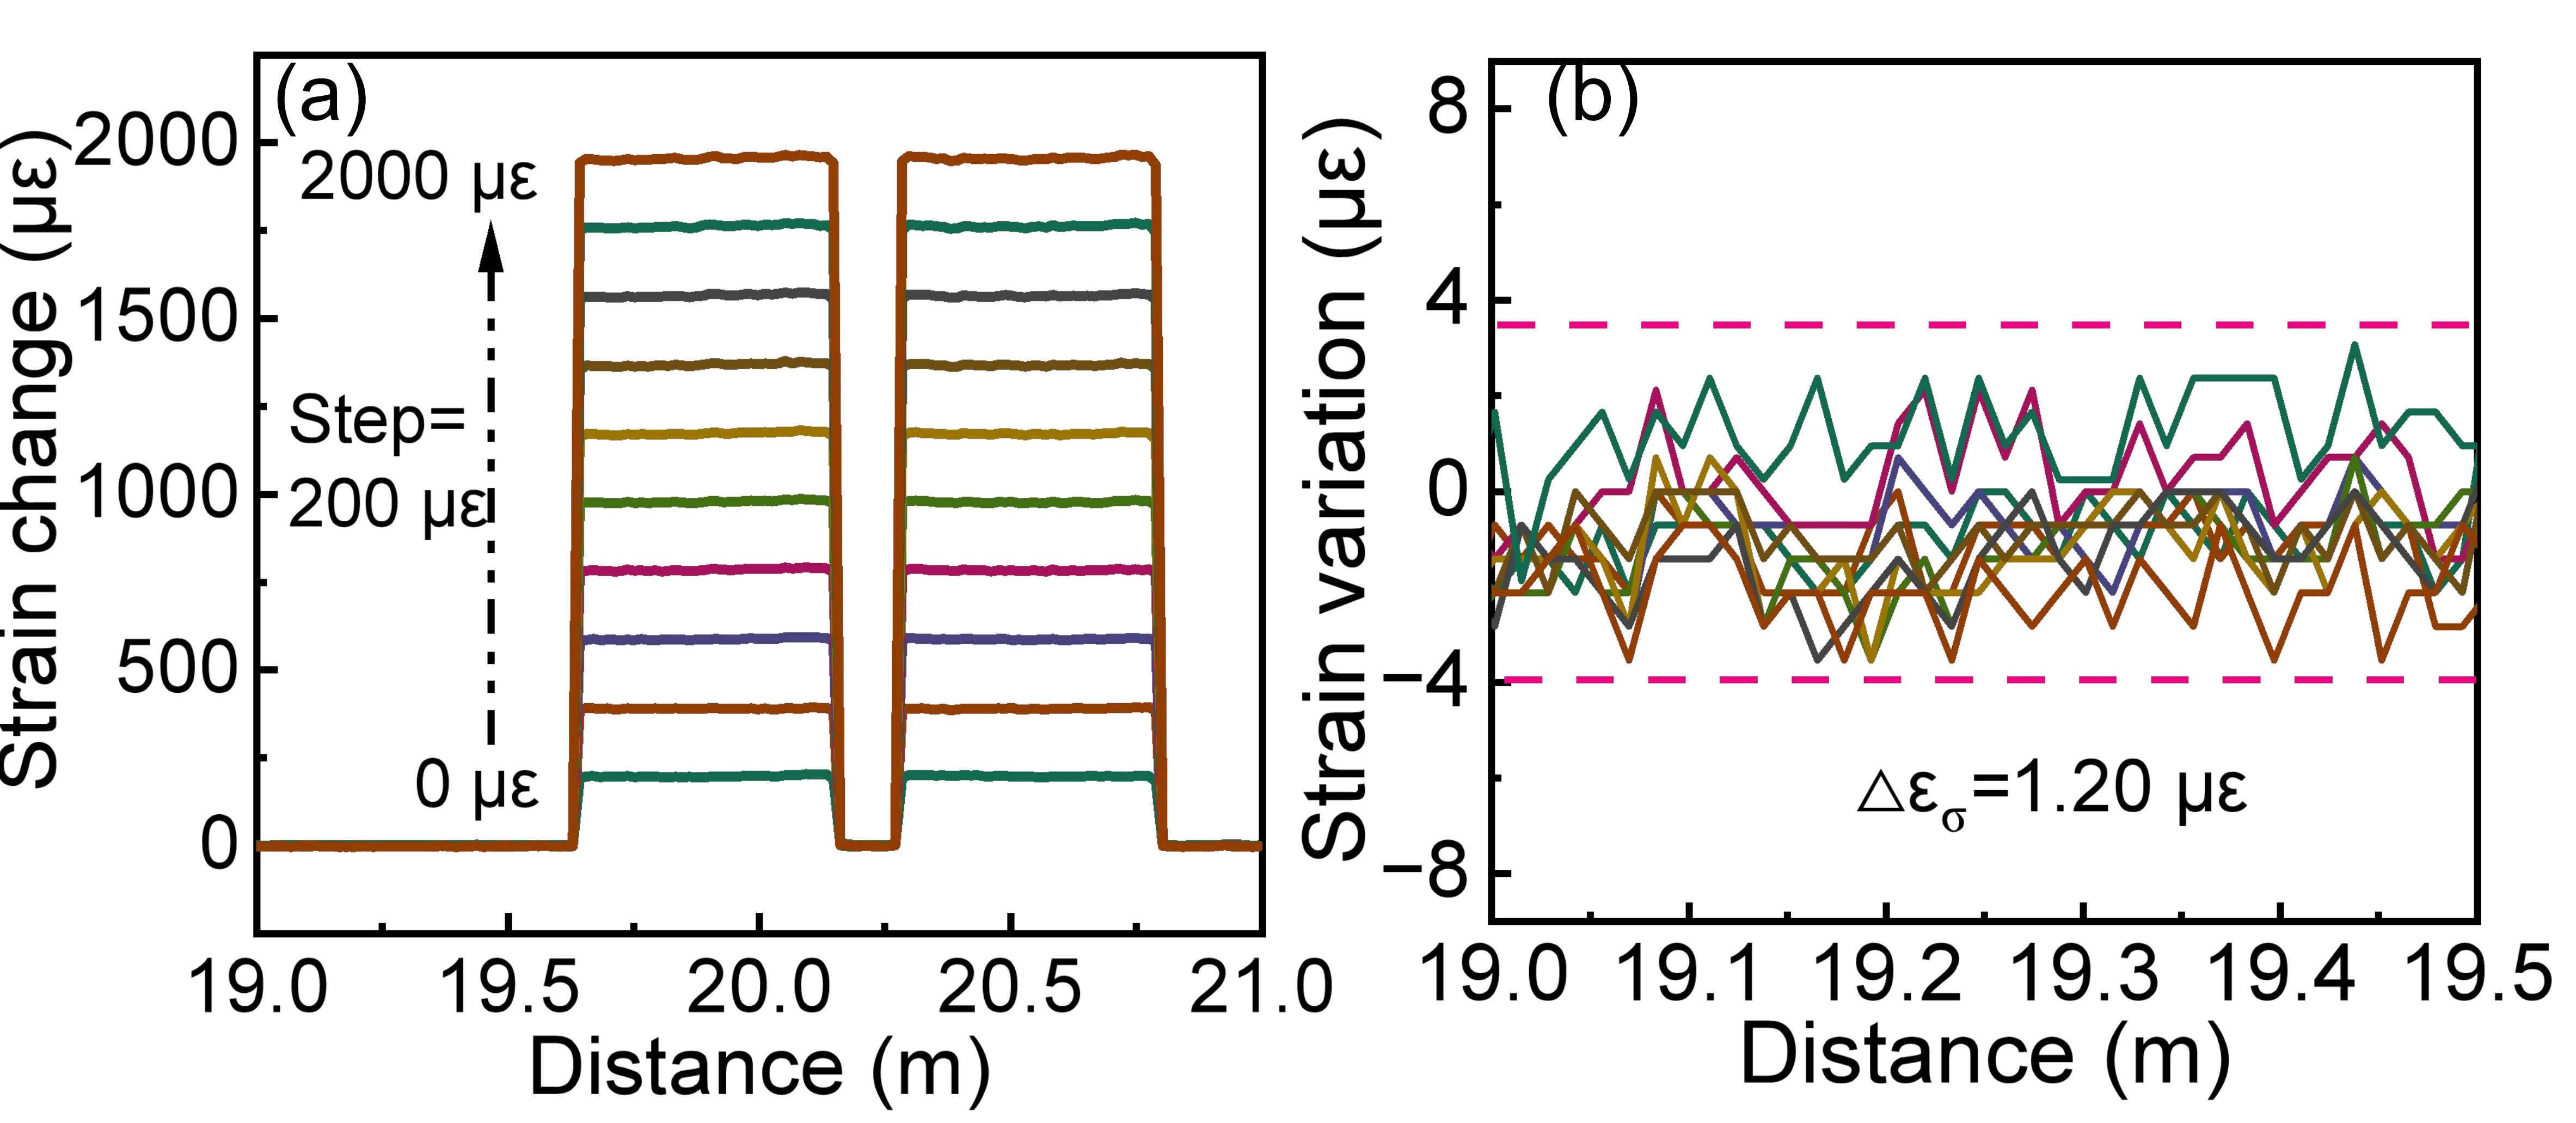
As shown in Figure 6a, zero-padding increases the spectral sampling density of the cross-correlation spectrum, while window overlap processing improves the spatial continuity of the demodulated results. As a result, the cross-correlation shift estimation errors caused by limited Rayleigh backscattering information in the short sensing window are effectively suppressed. The strain distributions in Regions A–E are accurately demodulated under different applied strains. To further evaluate the measurement stability, the measured strain values in the nominally unstrained region were analyzed under the different applied strain conditions. As shown in Figure 6b, the resulting standard deviation was 1.20 με. This result characterizes the strain measurement stability in the nominally unstrained region under the tested loading conditions. This is particularly important for high-spatial-resolution OFDR, where a short sensing window provides only limited Rayleigh backscattering information and may lead to unstable spectral correlation. Therefore, the proposed optimization provides an effective approach for high-spatial-resolution OFDR sensing.
Figure 6.
(a) Demodulated strain distributions under different applied strains (with a step of 200 μɛ); (b) detailed strain distribution in the region without applied strain (N = 212, OR = 10%).
4.3. Temperature Experimental and Results
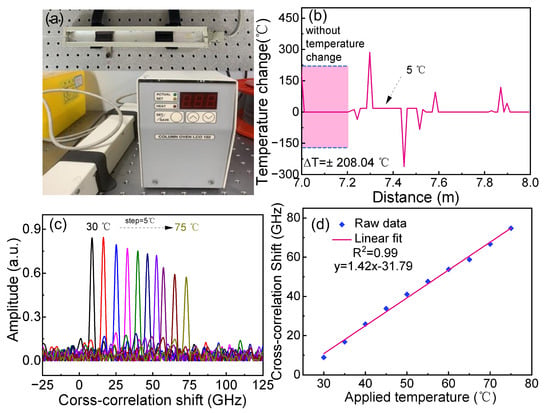
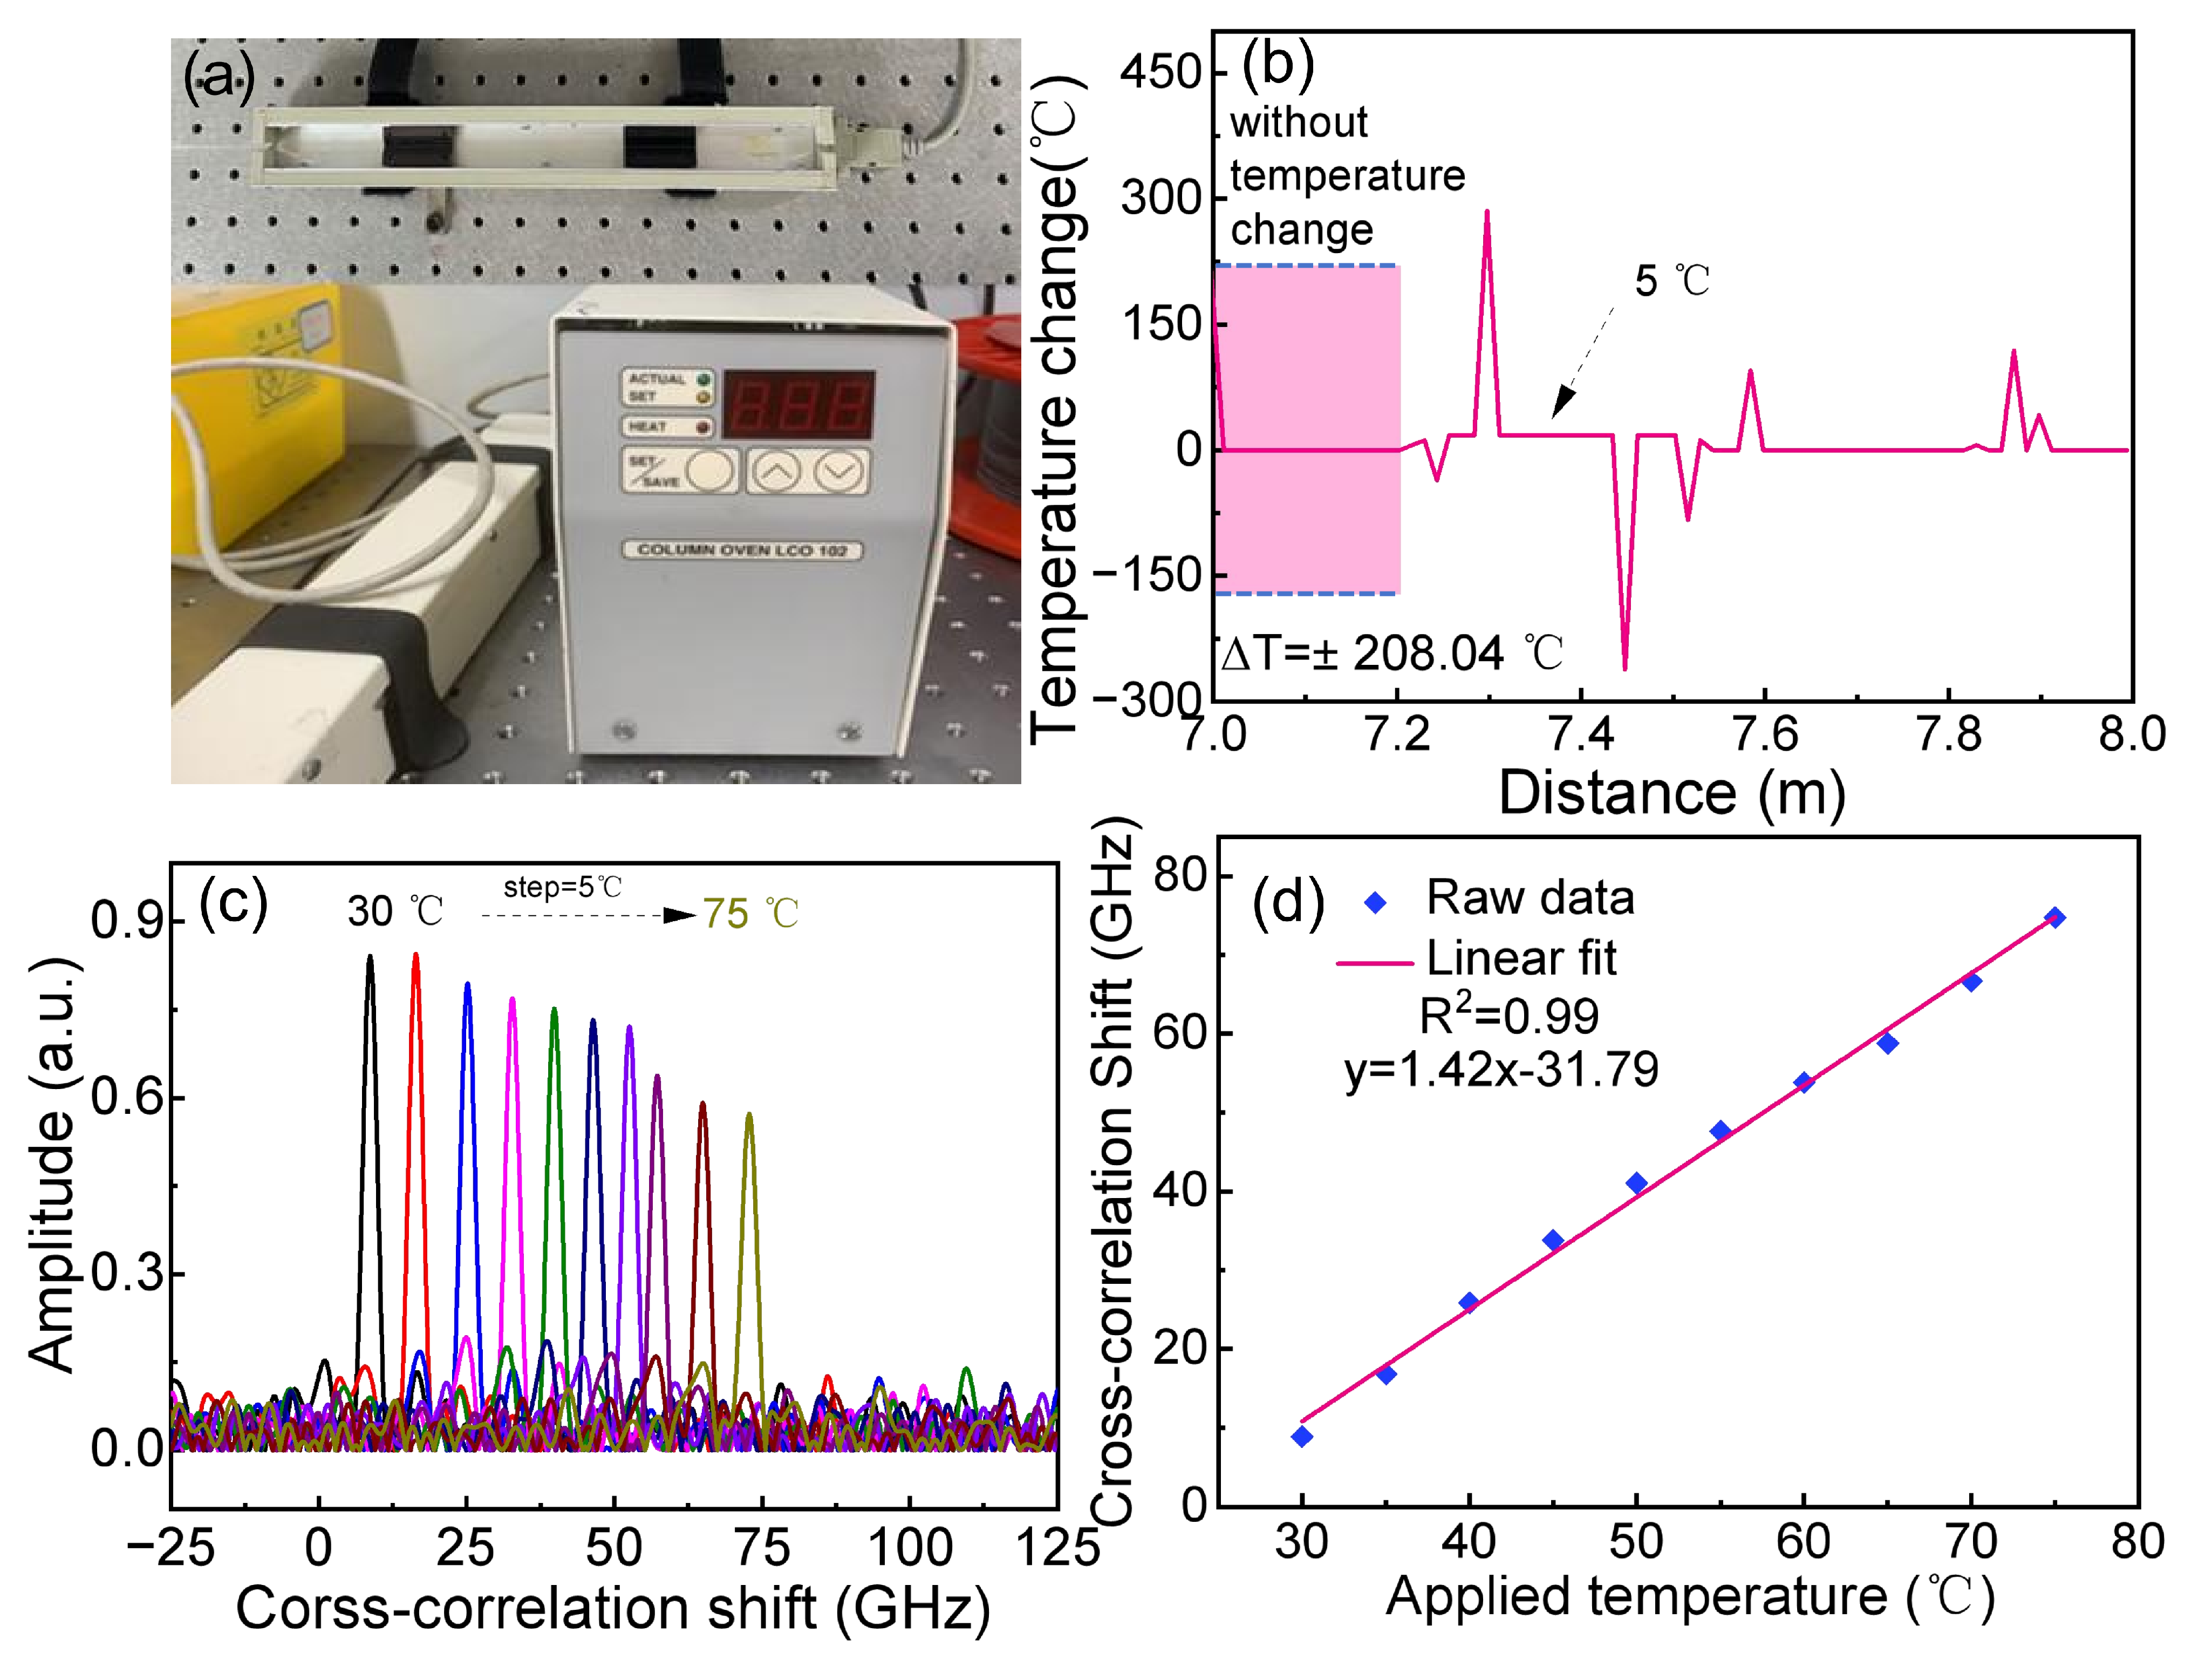
As shown in Figure 7a, a temperature chamber (ECOM LCO 102) was used in the distributed fiber temperature sensing experiment. The chamber allowed the temperature to be controlled from room temperature to 99 °C with a stability of ±0.1 °C. Due to the non-uniform heating inside the chamber, the temperature distribution along the fiber was not uniform. Therefore, a fixed fiber position (7.42 m) was selected for quantitative analysis of the temperature response. In the temperature experiment, the reference temperature was 25 °C. The measurement temperature was then increased in steps of 5 °C, i.e., 30 °C, 35 °C, 40 °C, 45 °C, 50 °C, 55 °C, 60 °C, 65 °C, 70 °C, and 75 °C. Figure 7b shows the demodulated temperature distribution at 30 °C. To provide a baseline comparison, the temperature distribution was first demodulated without zero-padding or window overlap. At a spatial resolution of 13.64 mm, the 5 °C temperature increase could not be reliably distinguished from the background fluctuations. The apparent temperature fluctuation in the unheated regions reached ±208.04 °C because of cross-correlation shift estimation errors. This large fluctuation was caused by limited Rayleigh backscattering information within the short sensing window rather than by actual temperature variations. Since a 5 °C temperature increase produces only a small cross-correlation shift, the correlation spectrum becomes more susceptible to estimation errors.
Figure 7.
(a) Schematic diagram of the temperature sensing experiment; (b) temperature distribution calculated without zero-padding and window overlap (The black, green, and brown curves correspond to 30 °C, 50 °C, and 75 °C, respectively); (c) cross-correlation shifts at the fiber position of 7.42 m using zero-padding and window overlap; (d) linear relationship between the cross-correlation shifts and temperature change.
Subsequently, the proposed zero-padding and window overlap were used to demodulate the temperature distribution. Figure 7c shows the cross-correlation shift at 7.42 m for different temperatures. The black, green, and brown curves correspond to 30 °C, 50 °C, and 75 °C, respectively. As shown in Figure 7d, the cross-correlation shift exhibits a linear relationship with temperature change. Because the reference spectrum was recorded at 25 °C, zero cross-correlation shift corresponds to the reference temperature rather than 0 °C. Therefore, the non-zero intercept does not indicate an intrinsic dead zone. Moreover, the slope represents the temperature sensitivity coefficient of the fiber and agrees well with the theoretical value of 1.42 GHz/°C (11.4 pm/°C). Based on the measured strain and temperature sensitivities, the equivalent strain error caused by temperature without compensation was estimated to be 9.47 με/°C. Within the tested temperature range of 25–75 °C, the corresponding error ranges from 0 to approximately 473.5 με, relative to the reference temperature of 25 °C.
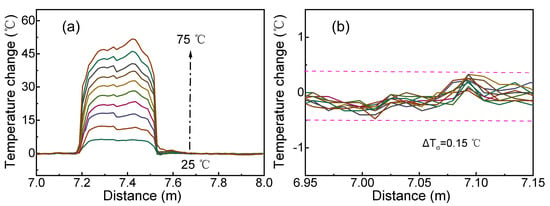
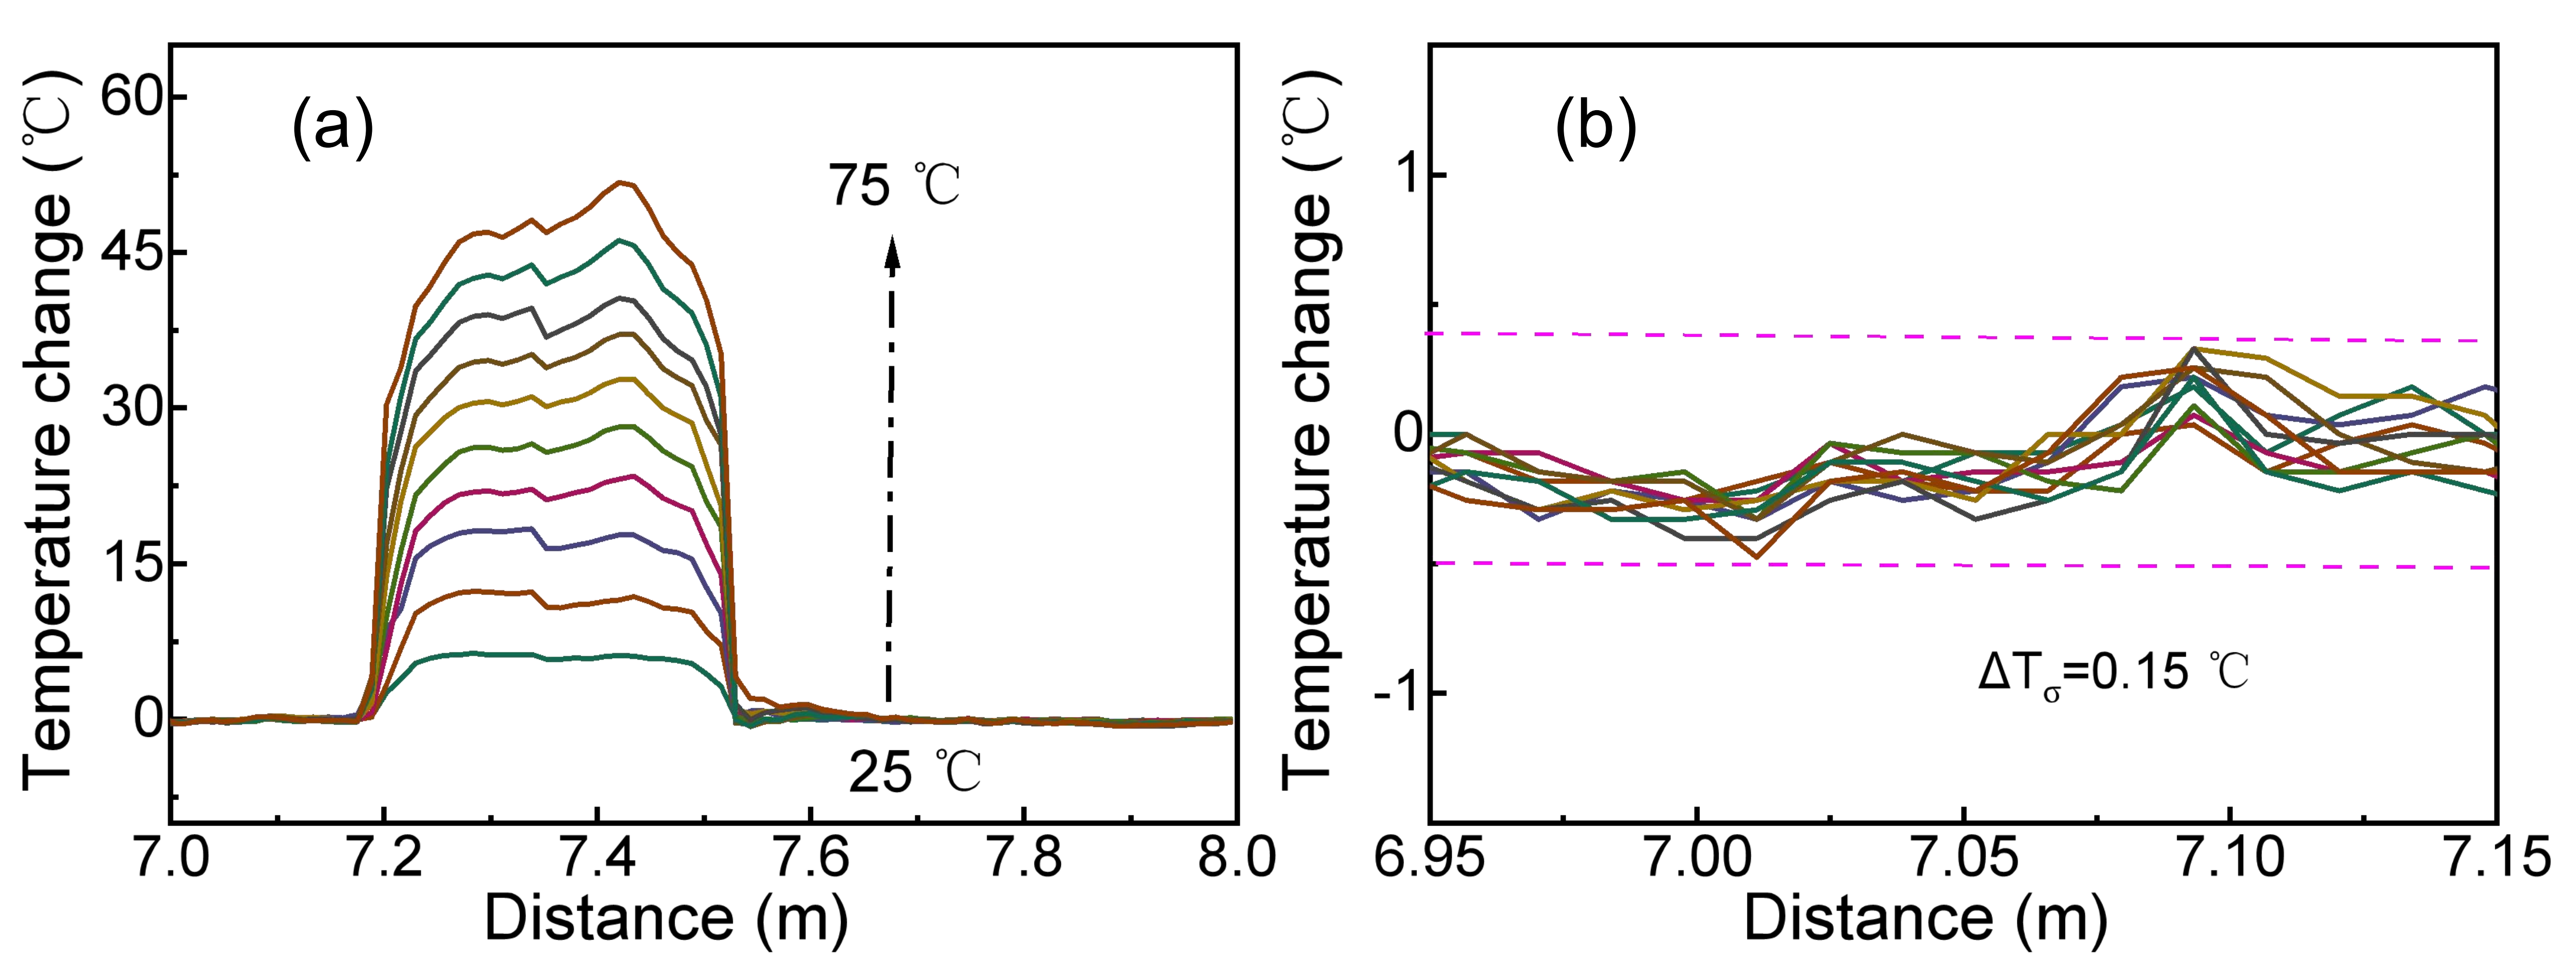
As shown in Figure 8a, the temperature distribution along the fiber is successfully demodulated. Compared with Figure 7b, the temperature change from 30 °C to 75 °C can be clearly identified. We also selected the unheated region from 6.95 m to 7.15 m to evaluate the system reliability. The measured temperature values in this region were analyzed under different temperature conditions to assess measurement stability. As shown in Figure 8b, the resulting standard deviation was 0.15 °C. These results indicate that the proposed method improves the reliability of cross-correlation shift estimation and is effective for high-spatial-resolution OFDR temperature sensing.
Figure 8.
(a) Demodulated temperature distributions under different heating conditions (with a step of 5 °C); (b) temperature distribution in the region without temperature change, the solid lines denote the measured temperature, and the dashed lines represent the fluctuation boundaries. (N = 212, OR = 10%).
To further evaluate the effects of different signal processing methods on sensing performance, the relevant parameters are summarized in Table 1.
Table 1.
Comparison of representative OFDR sensing systems employing different signal processing methods.
As summarized in Table 1, previous studies mainly focused on improving correlation algorithms, extending the measurable strain range, or enhancing spectral shift estimation. In contrast, this work quantitatively analyzes the zero-padding length and window overlap ratio at a constant spatial resolution. The experiments were performed over a strain range of 0–2000 με and a temperature range of 25–75 °C. Laser noise, polarization fading, and environmental disturbances may still affect the measurement under more complex conditions. The results provide practical guidelines for parameter selection to improve measurement stability and spatial sampling. The proposed method does not directly increase the physical dynamic range or sensing range of OFDR. For long-range sensing, signal attenuation, reduced SNR, and polarization fading may still limit the measurement performance. The present experiments were conducted in laboratory. For buried applications, soil moisture content, fiber packaging, and fiber–soil interface coupling may affect strain transfer efficiency. The applicability of the proposed method to buried structures therefore requires further validation under different soil conditions.
5. Conclusions
An optimization method based on zero-padding and window overlap for sliding window-based OFDR was proposed and experimentally demonstrated. The experimental results indicate that the combined optimization of zero-padding and window overlap can improve the robustness of cross-correlation shift estimation and the spatial localization capability under high-spatial-resolution conditions. With the proposed method, the OFDR system successfully measured distributed strains from 0 με to 2000 με and temperatures from 25 °C to 75 °C at a spatial resolution of 13.64 mm. The standard deviations of the measured strain and temperature in the nominally unstrained and unheated regions were 1.20 με and 0.15 °C, respectively, under the tested experimental conditions. This work provides a hardware-independent method for improving cross-correlation shift estimation in high-spatial-resolution OFDR systems under the tested conditions. Further validation is required to assess the applicability of the proposed method in complex field environments and long-distance buried monitoring.
Author Contributions
Conceptualization, P.L.; methodology, H.S. and J.X.; software, P.L., P.W. and H.S.; validation, P.L. and J.X.; writing—original draft preparation, P.L.; writing—review and editing, P.L., Z.X., P.W. and H.Y.; visualization, H.Y.; supervision, P.L. and H.Y.; project administration, P.L. and H.Y.; funding acquisition, P.L. All authors have read and agreed to the published version of the manuscript.
Funding
The work was supported by the Certificate of Scientific Research Project of Nanjing XiaoZhuang University (2022NXY22) and the Natural Science Research of Jiangsu Higher Education Institution of China (23KJD510006).
Data Availability Statement
Data are contained within the article.
Conflicts of Interest
The authors declare no conflicts of interest.
References
- Zhu, Z.; Ba, D.; Liu, L.; Qiu, L.; Dong, Y. Temperature-compensated distributed refractive index sensor based on an etched multi-core fiber in optical frequency domain reflectometry. Opt. Lett. 2021, 46, 4308–4311. [Google Scholar] [CrossRef] [Scilit] [PubMed]
- Zhai, H.; Wang, Q.; Zhou, B.; Fan, Y.; Wang, F.; Yao, Q.; Xia, J. Advances in fiber-optic-based 3D shape sensing technology. Opt. Laser Technol. 2025, 190, 113190. [Google Scholar] [CrossRef] [Scilit]
- Wu, R.; Biondi, A.; Cao, L.; Gandhi, H.; Abedin, S.; Cui, G.; Yu, T.; Wang, X. Composite Bridge Girders Structure Health Monitoring Based on the Distributed Fiber Sensing Textile. Sensors 2023, 23, 4856. [Google Scholar] [CrossRef] [Scilit] [PubMed]
- Muanenda, Y.S.; Taki, M.; Nannipieri, T.; Signorini, A.; Oton, C.J.; Zaidi, F.; Toccafondo, I.; Di Pasquale, F. Advanced Coding Techniques for Long-Range Raman/BOTDA Distributed Strain and Temperature Measurements. J. Light. Technol. 2016, 34, 342–350. [Google Scholar] [CrossRef] [Scilit]
- Soto, M.A.; Ramírez, J.A.; Thévenaz, L. Optimizing Image Denoising for Long-Range Brillouin Distributed Fiber Sensing. J. Light. Technol. 2018, 36, 1168–1177. [Google Scholar] [CrossRef] [Scilit]
- Chow, D.M.; Yang, Z.; Soto, M.A.; Thévenaz, L. Distributed forward Brillouin sensor based on local light phase recovery. Nat. Commun. 2018, 9, 2990. [Google Scholar] [CrossRef] [Scilit] [PubMed]
- Chen, X.; Zou, N.; Liang, L.; He, R.; Liu, J.; Zheng, Y.; Wang, F.; Zhang, X.; Zhang, Y. Submarine cable monitoring system based on enhanced COTDR with simultaneous loss measurement and vibration monitoring ability. Opt. Express 2021, 29, 13115–13128. [Google Scholar] [CrossRef] [Scilit] [PubMed]
- Xu, X.; Luo, M.; Liu, J.; Gao, Q.; Li, C.; Guo, H.; Liu, Y.-G.; Ge, C. Observation and characterization of the high order modes in a six-mode fiber using an OFDR method. Opt. Express 2022, 30, 26341–26347. [Google Scholar] [CrossRef] [Scilit] [PubMed]
- Yin, G.; Jiang, R.; Zhu, T. In-Fiber Auxiliary Interferometer to Compensate Laser Nonlinear Tuning in Simplified OFDR. J. Light. Technol. 2022, 40, 837–843. [Google Scholar] [CrossRef] [Scilit]
- Meng, Y.; Fu, C.; Du, C.; Chen, L.; Zhong, H.; Li, P.; Xu, B.; Du, B.; He, J.; Wang, Y. Shape sensing using two outer cores of multicore fiber and optical frequency domain reflectometer. J. Light. Technol. 2021, 39, 6624–6630. [Google Scholar] [CrossRef] [Scilit]
- Wang, F.; Sun, Y.; Chen, Q.; Xing, J.; Xia, Y.; Zhang, Y.; Zhang, X. Enhancing the Effect of Nonlinear Frequency Sweep. Correction in OFDR With Improved Reference Frequency. J. Light. Technol. 2022, 40, 269–276. [Google Scholar] [CrossRef] [Scilit]
- Fang, Z.; Liang, C.; Xu, S.; Bai, Q.; Wang, Y.; Zhang, H.; Jin, B. Spatial Resolution Enhancement of OFDR Sensing System Using Phase-Domain-Interpolation Resampling Method. IEEE Sens. J. 2022, 22, 3202–3210. [Google Scholar] [CrossRef] [Scilit]
- Ding, Z.; Yao, X.S.; Liu, T.; Du, Y.; Liu, K.; Jiang, J.; Meng, Z.; Chen, H. Compensation of laser frequency tuning nonlinearity of a long range OFDR using deskew filter. Opt. Express 2013, 21, 3826–3834. [Google Scholar] [CrossRef] [Scilit] [PubMed]
- Zhang, Z.; Fan, X.; Wu, M.; He, Z. Phase-Noise-Compensated OFDR Realized Using Hardware-Adaptive Algorithm for Real-Time Processing. J. Light. Technol. 2019, 37, 2634–2640. [Google Scholar] [CrossRef]
- Liang, W.; Fu, C.; Meng, Y.; Zhong, H.; Peng, Z.; Shan, R.; Xiao, S.; Kong, Y.; Zhang, Z.; Liao, C.; et al. Real-time distributed strain sensing using FPGA-based optical frequency domain reflectometry. IEEE Trans. Instrum. Meas. 2025, 74, 7000608. [Google Scholar] [CrossRef] [Scilit]
- Wang, Y.; Gu, X.; Wang, H.; Liu, Y.; Zhou, R.; Zhang, W.; Peng, X.; Zhang, Z. Fast demodulation algorithm implementation in OFDR with wavelength selection matching and local cross-correlation. Opt. Express 2024, 32, 45884–45903. [Google Scholar] [CrossRef] [Scilit]
- Cui, J.; Zhao, S.; Yang, D.; Ding, Z. Investigation of the interpolation method to improve the distributed strain measurement accuracy in optical frequency domain reflectometry systems. Appl. Opt. 2018, 57, 1424–1431. [Google Scholar] [CrossRef] [Scilit] [PubMed]
- Wang, S.; Wang, H.; Zhang, Z.; Wang, Y.; Huang, H. OFDR distributed demodulation optimization algorithm using discrete-time analytic signal backscattered Rayleigh spectrum. Sensors 2025, 25, 7044. [Google Scholar] [CrossRef] [Scilit] [PubMed]
- Feng, K.; Cui, J.; Jiang, D.; Dang, H.; Jin, Y.; Sun, X.; Niu, Y.; Tan, J. Improvement of the strain measurable range of an OFDR based on local similar characteristics of a Rayleigh scattering spectrum. Opt. Lett. 2018, 43, 3293–3296. [Google Scholar] [CrossRef] [Scilit] [PubMed]
- Froggatt, M.; Moore, J. High-spatial-resolution distributed strain measurement in optical fiber with Rayleigh scatter. Appl. Opt. 1998, 37, 1735–1740. [Google Scholar] [CrossRef] [Scilit] [PubMed]
- Froggatt, M.; Gifford, D.; Kreger, S.; Wolfe, M.; Soller, B.J. Characterization of Polarization-Maintaining Fiber Using High-Sensitivity Optical-Frequency-Domain Reflectometry. J. Light. Technol. 2006, 24, 4149–4154. [Google Scholar] [CrossRef] [Scilit]

Disclaimer/Publisher’s Note: The statements, opinions and data contained in all publications are solely those of the individual author(s) and contributor(s) and not of MDPI and/or the editor(s). MDPI and/or the editor(s) disclaim responsibility for any injury to people or property resulting from any ideas, methods, instructions or products referred to in the content. |
© 2026 by the authors. Licensee MDPI, Basel, Switzerland. This article is an open access article distributed under the terms and conditions of the Creative Commons Attribution (CC BY) license.