


Abstract
Reliable classification of ultra-thin austenitic stainless steel foils (e.g., 301, 304, and 316L) is critical for high-end manufacturing in electronics, aerospace, and new energy. Currently, the grading technologies for stainless steel are not only time-consuming but also fail to meet the requirements of in situ industrial processes. Laser-induced breakdown spectroscopy (LIBS) is an on-line detection method and possesses broad industrial applications. However, the inherent similarity in elemental compositions and the instability of laser-induced plasmas in thin-gauge materials pose significant challenges for conventional LIBS classification. This study presents a robust classification based on LIBS coupled with optimized feature extraction and generalized spectral integration. We evaluated twelve hybrid models by combining three feature selection methods: Analysis of variance (ANOVA), ReliefF, and linear discriminant analysis (LDA) with four machine learning algorithms (ANN, KNN, XGBoost, and Logistic Regression). The results indicate that the LDA-LR configuration achieves the highest classification efficiency, reaching an accuracy of 95.7% with 58 optimized features. Furthermore, the classification accuracy was further improved to 96.2% by incorporating plasma temperature (Texc) as a generalized physical feature and filtering invalid data. This work demonstrates that integrating plasma’s physical parameters with data-driven models significantly improves the discriminative power of LIBS for complex industrial ultra-thin alloys.
1. Introduction
The trend toward miniaturization and high-precision engineering is driving a significant demand for high-performance metallic materials [1,2]. Ultra-thin precision austenitic stainless steel foils (sub-50 μm thickness), with excellent corrosion resistance and robust mechanical properties, have emerged as cornerstone metallic materials for the fabrication of electronics, micro-medical devices, sensors, and aerospace [3,4,5,6]. Although their industrial significance is escalating, the rapid and non-destructive identification of these foils remains a challenge, primarily due to the subtle elemental variations between different grades and the unique physical constraints of thin-gauge geometries.
Traditional material grading techniques primarily rely on manual inspection or destructive chemical analysis. Manual identification is inherently susceptible to human error and low throughput [7]. Although computer-vision-based deep learning models have improved macro-scale sorting, they typically struggle with fine-grade classification (e.g., distinguishing 304 from 316L stainless steel) where surface visual characteristics are nearly identical [8,9,10]. High-precision elemental analysis, such as inductively coupled plasma mass spectrometry (ICP-MS) and X-ray fluorescence (XRF), provides the requisite sensitivity but is hindered by complex sample preparation, high operational costs, and an inability to perform on-line detection [11,12,13].
Laser-induced breakdown spectroscopy (LIBS) has emerged as a compelling alternative, offering rapid, multi-elemental analysis with minimal sample preparation requirements [14]. Recent research has focused on synergizing machine learning (ML) and feature engineering with LIBS to enhance classification fidelity. For instance, studies have successfully utilized analysis of variance (ANOVA) to classify the grades of T91 and 12Cr1MoV steels and deep belief networks (DBNs) to differentiate complex alloys [15,16]. Previous LIBS classification studies show that machine-learning and feature-selection methods can extract informative variables from high-dimensional emission spectra and improve material discrimination. However, these methods cannot directly address the classification challenges of ultra-thin metallic foils. This work targets the thickness range of 10–30 μm. Foils thinner than 50 μm exhibit confined geometry and low thermal mass. They greatly modify laser-ablation dynamics and plasma expansion kinetics. Compared with bulk materials, these foils aggravate matrix effects and trigger plasma instability. Limited sample thickness, combined with high sensitivity of laser ablation to local interaction conditions, produces extra shot-to-shot spectral fluctuations. Therefore, LIBS classification methods established for bulk stainless steels cannot be directly applied to ultra-thin stainless steel foils. Under these circumstances, one problem remains unresolved. Do wavelength variables selected by conventional feature selection still carry sufficient information to distinguish ultra-thin austenitic stainless-steel grades with similar compositions? In addition, most existing data-driven classification schemes rely mainly on spectral-intensity variables. They have not explored whether plasma-excitation physical parameters (e.g., temperature) derived from emission spectra can offer supplementary information apart from raw spectral channels. Therefore, for LIBS classification of ultra-thin austenitic stainless steels, systematic evaluations are necessary. The evaluations include the relative effectiveness of different feature-ranking criteria, their compatibility with classifiers of different decision mechanisms, and the gain provided by physical plasma-state parameters.
In this study, we propose a robust classification architecture specifically tailored for the analysis of ultra-thin austenitic stainless steel foils. We systematically evaluate the integration of three feature selection protocols, ANOVA, ReliefF, and linear discriminant analysis (LDA), with four ML classifiers to identify the optimal feature-model configuration. Furthermore, we introduce the concept of generalized spectra by incorporating plasma temperatures (Texc), derived from the Boltzmann plots of Fe, Cr, and Ni emission lines, into the feature space. By hybridizing data-driven algorithms with physical parameters, this work aims to mitigate spectral fluctuations inherent in foil analysis and establish a potential high-precision method for on-line industrial material detection.
2. Materials and Methods
2.1. Experimental Setup
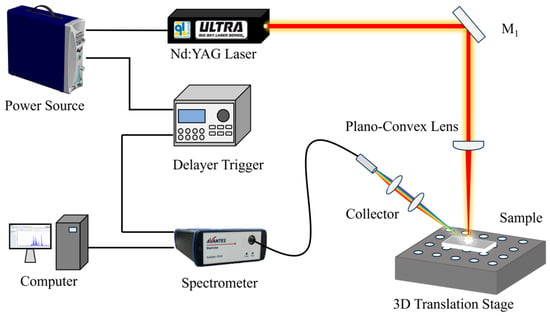
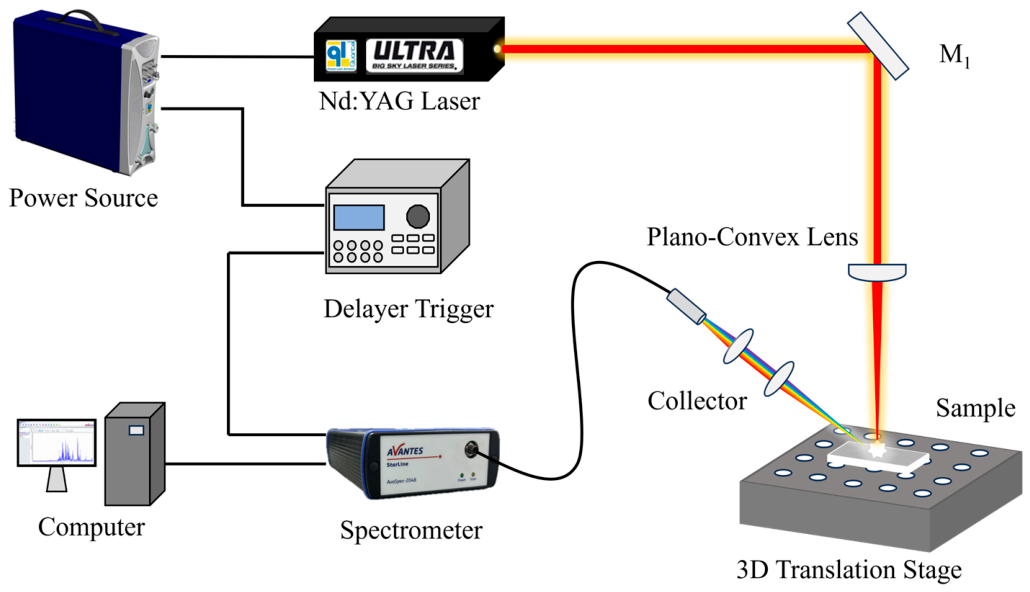
The LIBS experimental setup for ultra-thin austenitic stainless steel classification is shown in Figure 1. A Q-switched Nd:YAG laser (λ = 1064 nm, 1 Hz repetition rate) served as the excitation source. To prevent laser-induced excessive thermal damage to the ultra-thin specimens (10–30 μm), the pulse energy was set to 44.7 mJ. The beam was directed via a high-reflectivity mirror and focused onto the sample surface using a plano-convex lens (f = 50 mm), yielding a localized plasma plume. The diameter of the focused laser spot was approximately 2 mm. The single-pulse fluence was approximately 1.42 J/cm2. With a pulse duration of approximately 8 ns, the corresponding pulse-averaged laser power density was approximately 1.78 × 10⁸ W/cm2. Optical emissions were captured by a cage-type collection system comprising dual quartz lenses and a fiber coupler, then transmitted to an Avantes spectrometer (Apeldoorn, The Netherlands, spectral resolution: 0.2–0.3 nm; range: 230–500 nm). Synchronization between the laser and the spectrometer was maintained via a digital delay generator, with an optimized acquisition delay of 1 μs and an integration window of 1.05 ms to maximize the signal-to-noise ratio (SNR).
Figure 1.
Schematic illustration of the LIBS measurement platform for ultra-thin stainless steel grade identification.
2.2. Sample Preparation and Data Acquisition
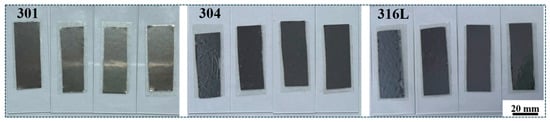
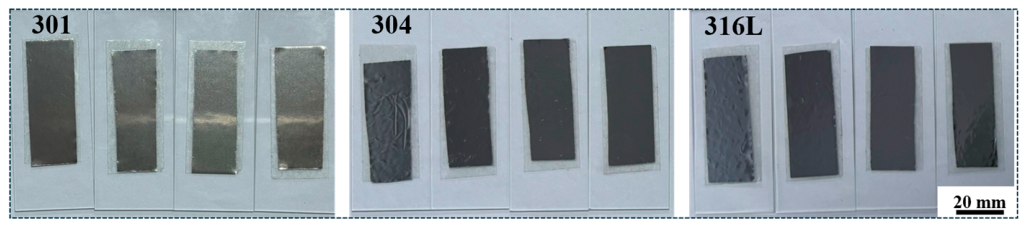
Three commercial-grade foils 301 (30 μm), 304 (10 μm), and 316L (10 μm) were investigated as illustrated in Figure 2. The experimental materials were produced with reference to the compositional ranges of AISI 301, AISI 304, and AISI 316L. Specimens were put on glass substrates and cleaned with anhydrous ethanol to eliminate surface contaminants. The prepared samples were placed on a 3D translation stage. To suppress the influence of oxide layers and surface-adsorbed species, a pre-ablation approach (3–4 cleaning pulses per site) was strictly implemented. For each grade, four distinct samples were prepared (three for training, one for independent testing). A total of 700–860 spectra per sample were archived for subsequent analysis, ensuring statistical robustness.
Figure 2.
Photographs of ultra-thin 301, 304, and 316L austenitic stainless steel foil samples placed on glass slides.
2.3. Spectral Data Preprocessing and Feature Selection
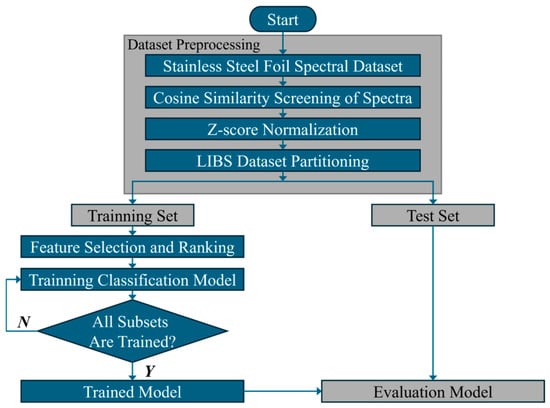
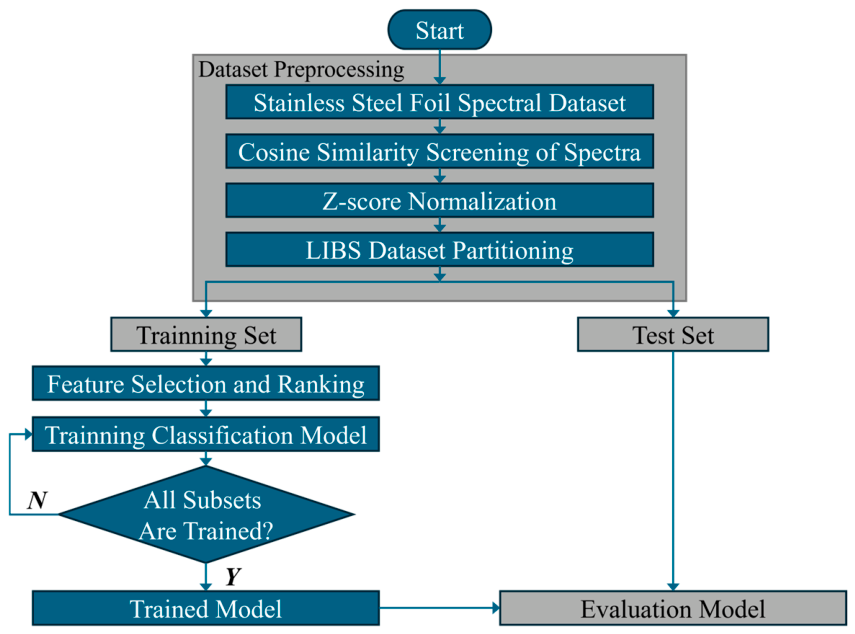
Spectral analysis serves as a powerful tool for rapid material characterization. However, its practical efficacy is frequently challenged by intrinsic signal fluctuations, matrix effects, and external system noise, which compromise the fidelity of the acquired spectral profiles [17]. To alleviate these experimental variances, spectral preprocessing is indispensable [18]. The overall data processing pipeline is schematically illustrated in Figure 3. Initially, raw spectral data were filtered using a cosine similarity thresholding algorithm to systematically discard anomalous acquisitions, such as low SNR or saturated lines. The remaining high-quality spectra (top-ranked spectra after cosine-similarity sorting) were normalized using the Z-score algorithm to scale the line intensities and eliminate pulse-to-pulse energy drift. Subsequently, the normalized dataset was partitioned into a training set (N = 3600) and an independent test set (N = 900). Based on the high-resolution spectral acquisition, each digitized LIBS spectrum yielded a high-dimensional feature vector consisting of 2048 discrete wavelength-intensity coordinate points. To suppress irrelevant spectroscopic noise, a feature selection protocol was implemented on the training partition (N = 3600) to rank these variables according to their discriminative contribution. Diverse ML classification models were then systematically trained on subsets of these ranked features using an incremental selection scheme. Ultimately, the classification accuracy and generalization capacity of each model configuration were rigorously evaluated against the completely unseen, independent test dataset (N = 900).
Figure 3.
Flowchart of spectral data preprocessing, feature optimization, and machine learning classification for LIBS identification of ultra-thin austenitic stainless steel foils.
ANOVA, ReliefF, and LDA were applied for feature ranking. As a parametric univariate filter, ANOVA evaluates the statistical significance of individual wavelength features by calculating the F-statistic (the ratio of between-class variance to within-class variance) alongside its corresponding p-value. Wavelengths exhibiting higher F-statistics and lower p-values are prioritized, indicating pronounced mean-intensity differences across alloy grades relative to intra-class dispersion. ReliefF estimates feature weights by assessing local neighborhood structures in high-dimensional space. For a randomly selected query sample, ReliefF identifies its nearest neighbors within the same class (nearest hits) and from different classes (nearest misses). Wavelength features that exhibit minimal variance among same-class neighbors, but maximal variance among different-class neighbors are assigned higher weights, reflecting superior local class separability. Although LDA is conventionally used as a supervised projection method, in this study it was used to derive a coefficient-based ranking of the original wavelength variables rather than to generate the projected discriminant coordinates. This is achieved by learning a transformation that maximizes the ratio of the between-class scatter matrix (Sb) to the within-class scatter matrix (Sw), thereby optimizing global class separability along the discriminant projection vectors. Following importance ranking by ANOVA, ReliefF, and LDA, the feature variables were incrementally introduced into the downstream classifiers in order of descending importance. This allowed us to systematically map classification accuracy as a function of the feature subset size (from 1 to the full 2048 features) and isolate the optimal, lowest-dimensional feature subspace for each model configuration.
3. Results
3.1. Spectra Characterization and PCA Analysis
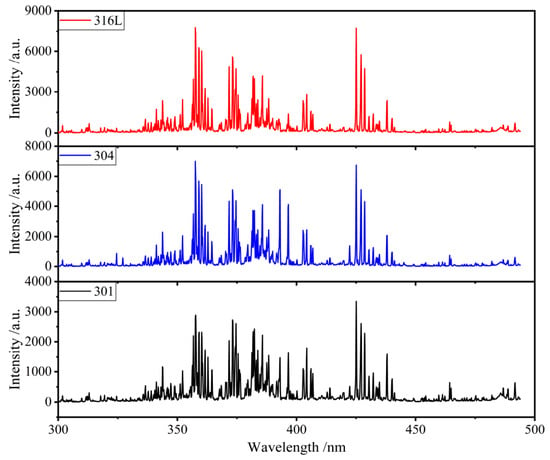
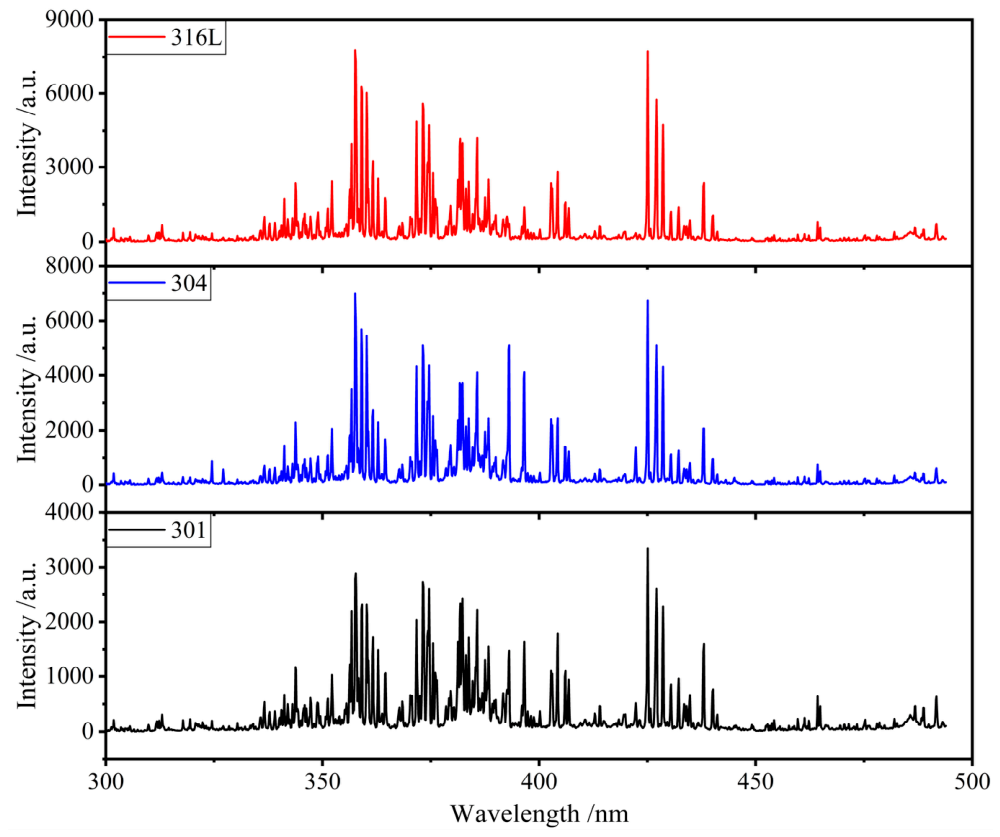
The average LIBS emission spectra of the three ultra-thin austenitic stainless steel foils are compared in Figure 4, focusing on the high-intensity spectral range of 300–500 nm. Because these three grades (301, 304, and 316L) belong to the same 300-series austenitic family, they share a nearly identical elemental matrix dominated by Fe, Cr, and Ni. Consequently, their spectral profiles exhibit extremely similar configurations, with differences manifesting primarily as subtle variations in emission line intensities at specific wavelengths rather than distinct spectral peaks.
Figure 4.
Comparison of LIBS spectra of ultra-thin austenitic stainless steel foils with different grades.
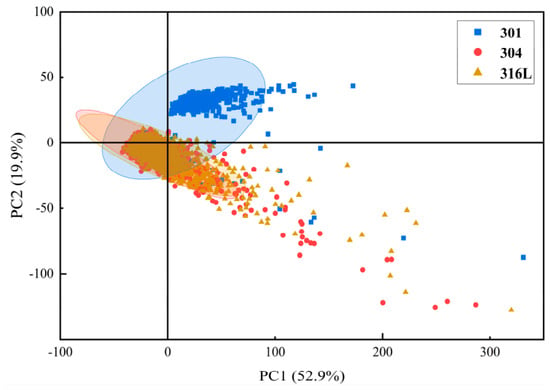
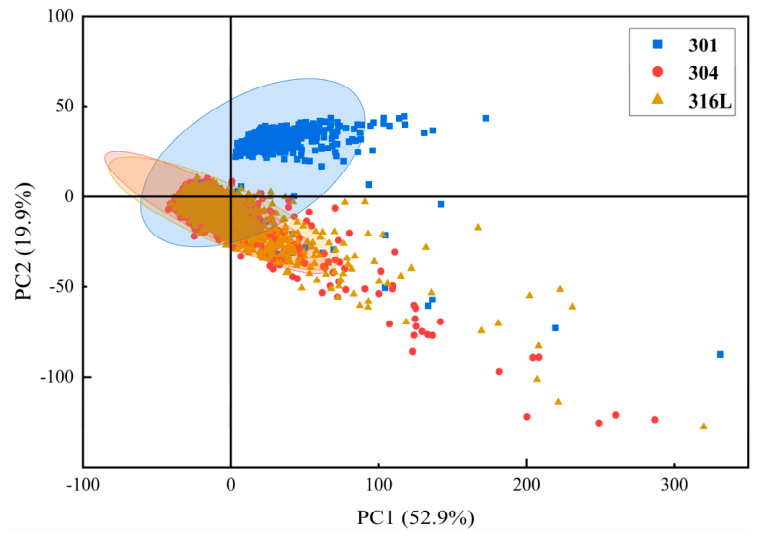
To evaluate whether simple linear projections could resolve these differences, principal component analysis (PCA) was performed on the similarity-filtered training dataset [19,20]. As shown in Figure 5, the first principal component (PC1) and the second principal component (PC2) explained 52.9% and 19.9% of the total variance, respectively. Although their cumulative explained variance reached 72.8%, substantial overlapping regions among the three alloy grades were observed in the PCA score space. The remaining 27.2% of the variance contains critical non-linear structures and trace spectral variations necessary for fine classification. This result clearly indicates that unsupervised linear projection is insufficient for high-fidelity classification of highly similar foils, reinforcing the necessity of supervised feature selection.
Figure 5.
Two-dimensional PCA score scatter plot (PC1 = 52.9%, PC2 = 19.9%) of LIBS data from 301, 304, and 316L ultra-thin stainless steel foils.
3.2. Quantitative Feature Ranking and Key Discriminative Bands
The top-ranked spectral features identified by ANOVA, ReliefF, and LDA are summarized in Table 1. The analytical lines within these wavelength bands were correlated with transitions using the NIST atomic spectra database [21]. All three feature selection protocols consistently identified the 357–360 nm spectral range as a region of maximum discriminative importance. According to the NIST database, this narrow band hosts many intense Fe and Cr transitions characterized by high transition probabilities, alongside several trace lines of Mn and Ni. In LIBS spectra, low-concentration elements may be masked by the strong Fe background because of instrumental and Stark broadening. Therefore, the discriminative information in this spectral region reflects a composite physical fingerprint arising from the combined effects of the major alloying elements (Fe, Cr, Ni, and Mn), matrix effects, and the local plasma excitation state.
Table 1.
Ranking results of the top five LIBS spectral features selected via ANOVA, ReliefF, and LDA and their corresponding analytical spectral lines.
3.3. Comparative Performance of ML Classifiers
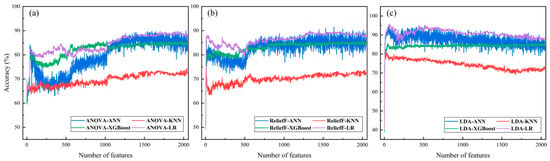
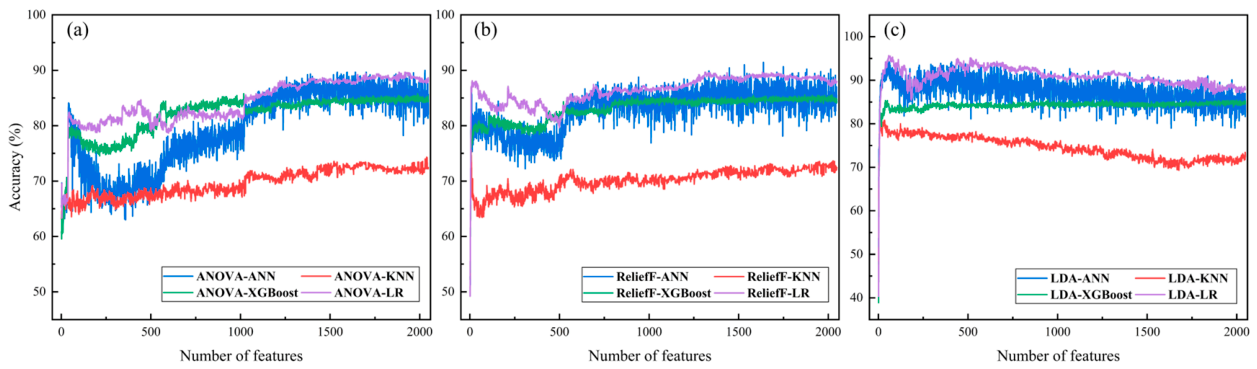
The classification accuracy curves as a function of the number of incorporated features are presented in Figure 6 for the three feature selections. Under the ANOVA (Figure 6a), the accuracy of the classifiers generally increased with the feature dimension. Both the ANOVA-LR (Logistic Regression) and ANOVA-ANN (Artificial Neural Network) approached an accuracy of nearly 90% once the feature count exceeded 1000, with LR displaying superior stability compared to the ANN.
Figure 6.
Variation in classification accuracy versus the number of sequentially added LIBS features for combined feature-selection and classification algorithms: (a) ANOVA-based hybrid models, (b) ReliefF-based hybrid models, and (c) LDA-based hybrid models.
For the ReliefF (Figure 6b), the ReliefF-LR model exhibited a slight downward trend before stabilizing at approximately 85% beyond 500 features. The ReliefF-ANN model fluctuated within the range of 80–90%, while the ReliefF-KNN model remained stable but low around 70%. The LDA-driven feature space (Figure 6c) yielded the most outstanding classification performance. All four classification models trained on the LDA-ranked feature subsets achieved higher peak accuracies at significantly lower feature dimensions. Furthermore, unlike the other two methods, the accuracy of the LDA-based models displayed a distinct downward trend as excessive lower-ranked features were introduced. This pattern indicates that LDA successfully concentrated the most vital, linearly separable discriminant information in the top-ranked features, whereas the subsequent features introduced redundant spectroscopic noise that degraded model performance.
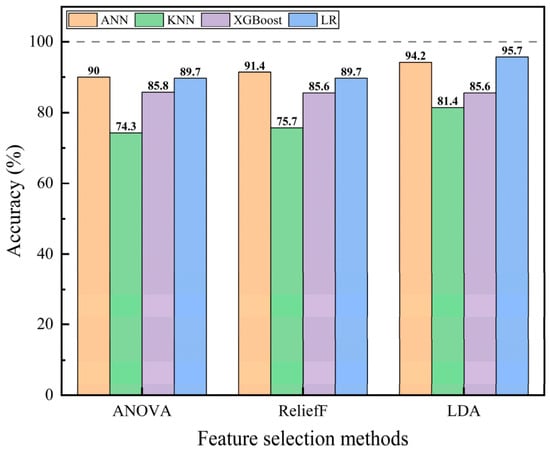
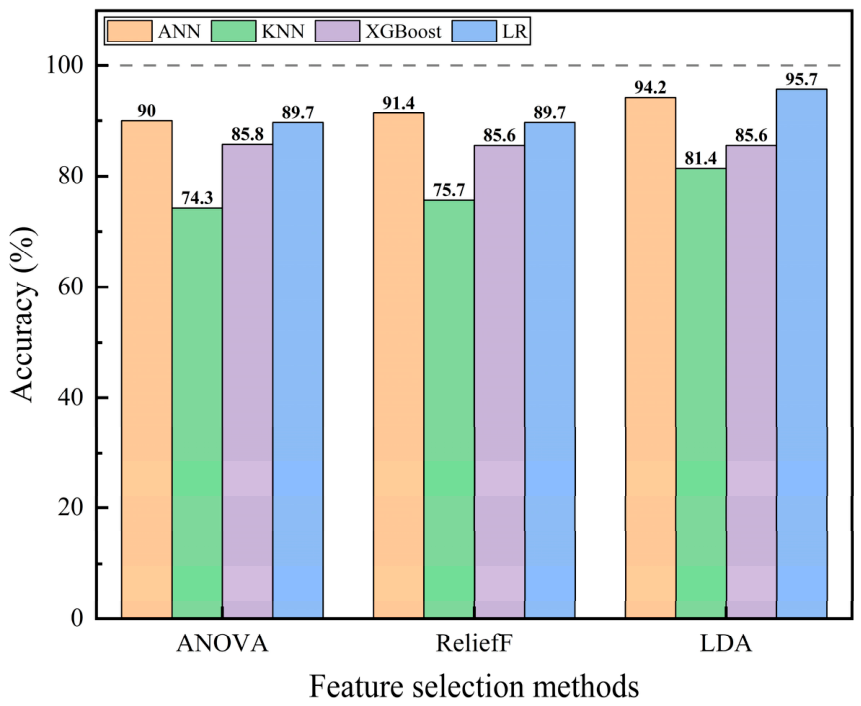
To comprehensively evaluate the predictive capabilities of the proposed frameworks, the maximum classification accuracies achieved by coupling distinct feature selection protocols with the respective classifiers were systematically analyzed, as illustrated in Figure 7. The experimental results reveal that the peak classification accuracy is highly sensitive to the synergistic compatibility between the feature extraction algorithm and the classifier architecture. Within the ANOVA-filtered feature space, the ANN, LR, and XGBoost models achieved maximum accuracies of 90.0%, 89.7%, and 85.8%, respectively. Under the ReliefF neighborhood evaluation framework, the models demonstrated peak performance metrics of 91.4% (ANN), 89.7% (LR), and 85.6% (XGBoost). In contrast, the supervised LDA feature ranking drove the peak classification accuracies to significantly higher thresholds, with LR accomplishing the absolute highest accuracy of 95.7%, followed closely by the ANN at 94.2% and XGBoost at 85.6%. A deep mechanism-based inspection demonstrates that the ANOVA protocol, functioning as a univariate parametric filter, preferentially selects wavelength variables that exhibit pronounced marginal variance across classes in isolation. This univariate ranking bias tends to yield feature subsets characterized by simple linear decision boundaries. Consequently, the linear LR model achieves a classification accuracy (89.7%) that is nearly identical to that of the non-linear ANN (90.0%), since the highly linear nature of the ANOVA feature space offers minimal non-linear structures for the neural network’s hidden layers to exploit. Meanwhile, XGBoost, which excels at resolving complex non-linear combinations through hierarchical decision tree splits, performs sub-optimally (85.8%) in this context. This performance bottleneck occurs because univariate spectral intensities do not readily form the structured, multi-variable interactive pathways that decision trees rely upon. Furthermore, the remaining noise and redundant features in ANOVA’s top rankings can induce unstable splits in small-sample scenarios, thereby degrading XGBoost’s generalization capability. Thus, as a univariate filter, ANOVA exhibits the strongest compatibility with linear classifiers or models that do not rely on complex feature interactions.
Figure 7.
Bar charts of the highest classification accuracies for different feature selection methods and models.
In contrast to the univariate approach of ANOVA, the ReliefF algorithm estimates feature importance within localized neighborhood spaces by evaluating distances to intra-class neighbors (nearest hits) and inter-class neighbors (nearest misses), thereby showing higher adaptability to potential non-linear discriminant patterns and feature interactions. This neighborhood-aware feature space is highly compatible with non-linear mapping architectures, as evidenced by the ANN, which successfully integrates localized, weakly discriminative variables through multi-layer mapping to achieve a superior classification accuracy of 91.4%. Conversely, the linear framework of LR cannot resolve these localized, high-order combinations, plateauing its maximum accuracy at 89.7%. This indicates that while ReliefF preserves the linear boundary components, its specialized interactive information cannot be effectively utilized by strictly linear decision hyperplanes, resulting in a relatively limited improvement for linear classifiers. This paradigm shifts dramatically under the LDA feature selection protocol, which constructs an optimized discriminant subspace by finding a projection vector that maximizes the ratio of the between-class scatter matrix (Sb) to the within-class scatter matrix (Sw), thereby directly optimizing global linear class separability. Since the decision boundary of LR is inherently constructed as a linear combination of its input dimensions, LR’s classifier criteria align perfectly with LDA’s projection objective in both mathematical form and optimization purpose. This profound architectural synergy enables the LDA-LR configuration to achieve the absolute best classification accuracy of 95.7% among all evaluated models. The peak performance of the ANN under LDA (94.2%) remains slightly lower than that of LR, indicating that non-linear kernel transformations offer no additional benefit and instead introduce a risk of slight overfitting within this highly optimized, linearly separated subspace.
As listed in Table 2, an investigation into the optimal feature subsets derived via incremental feature selection further corroborates the architectural interdependencies between characterization strategies and classification methods. Under the ANOVA univariable filtering scheme, the dimensionality required to achieve peak classification fidelity varies substantially across the respective models, expanding to 2029 features for the ANN, 1885 features for the LR, and contracting to 1018 features for XGBoost. This high-dimensional plateau is required by the parametric models (ANN and LR), which approach the full 2048-dimensional spectral boundary. It demonstrates that individual spectroscopic wavelengths carry highly diluted marginal discriminative weights. Consequently, high-fidelity class boundaries can only be constructed via the systematic, global superposition of these subtle variance vectors, utilizing either weighted linear aggregation in LR or non-linear mapping within the hidden layer nodes of the ANN. Conversely, the tree-based ensemble architecture of XGBoost establishes its peak accuracy at a truncated dimensionality of 1018 features. This structural behavior arises because the optimization path of gradient-boosted decision trees inherently relies on a localized subset of prominent features that maximize information gain or form robust threshold splits. The introduction of lower-ranked spectral variables yields a marginal information utility. Instead, it injects severe collinear background fluctuations and instrumental noise that destabilize the hierarchical tree-split structures under small-sample constraints. Therefore, it triggers overfitting and a subsequent performance decay. This trait of distributing discriminative weights across expanded manifolds is illustrated similarly under the ReliefF ranking, where the optimal dimensions for the ANN and LR remain high at 1638 and 1312 features, respectively. Nevertheless, ReliefF performs local neighborhood-aware feature assessment. This algorithm provides stronger mathematical support for the non-linear ANN. It preserves continuous and correlated characteristics across adjacent spectral channels. Accordingly, the peak classification accuracy of the ANN is improved to 91.4%.
Table 2.
Optimal feature quantity and corresponding test classification accuracy of hybrid models combining three feature selection algorithms and four classifiers based on LIBS spectral data.
This high-dimensional dependency shifts dramatically under the supervised LDA projection framework. The optimal feature spaces required for the LR and ANN compress precipitously to a minimal manifest of only 58 and 60 features, respectively. This structural convergence verifies the effectiveness of LDA global projection. LDA compresses dominant intra-class and inter-class variance trends into a compact low-dimensional submanifold. This transformation extracts the key atomic emission features of Fe, Cr, Ni, and Mn. Meanwhile, it suppresses continuum radiation and white noise. Within this optimized feature space, the minor variance in the ideal feature count between the LR and ANN reflects their subtle discrepancies in filtering residual multi-variable collinearity. In contrast to these parametric models, the KNN classifier exhibits a consistently depressed performance topology across all feature selection strategies. Because KNN fundamentally utilizes Euclidean distance matrices to map local proximity, it is severely vulnerable to the curse of dimensionality. In a high-dimensional hyperspace, the distance metrics between disparate sample vectors tend to concentrate and become uniform, which collapses the geometric contrast required to discern meaningful cluster centers and destabilizes the neighbor assignments under baseline fluctuations. Furthermore, as inferred from the unsupervised PCA confidence topology, the severe spatial co-localization and overlap between the 304 and 316L alloy grades drastically reduce the class purity within localized multi-dimensional neighborhoods. The LR and ANN bypass this localized topological impurity by optimizing continuous weight distributions, thereby demonstrating a vastly superior classification robustness for highly isomorphic metallic foils.
3.4. Classification Performance of the Physics-Informed Generalized Spectral Model
A physics-informed generalized spectral model was developed by integrating thermodynamic state variables directly into the ML. The local thermodynamic equilibrium (LTE) excitation temperatures (Te) of Fe, Cr, and Ni were computed for both the training and test sets using the multi-element Boltzmann plot method. Initially, a 2051-dimensional hybridized feature manifold was constructed by appending three continuous variables (Texc-Fe, Texc-Cr, Texc-Ni).
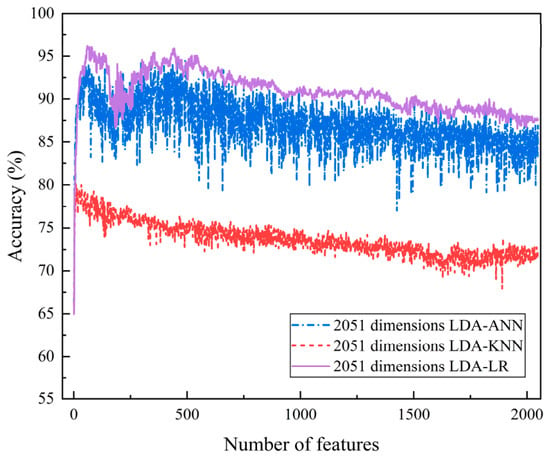
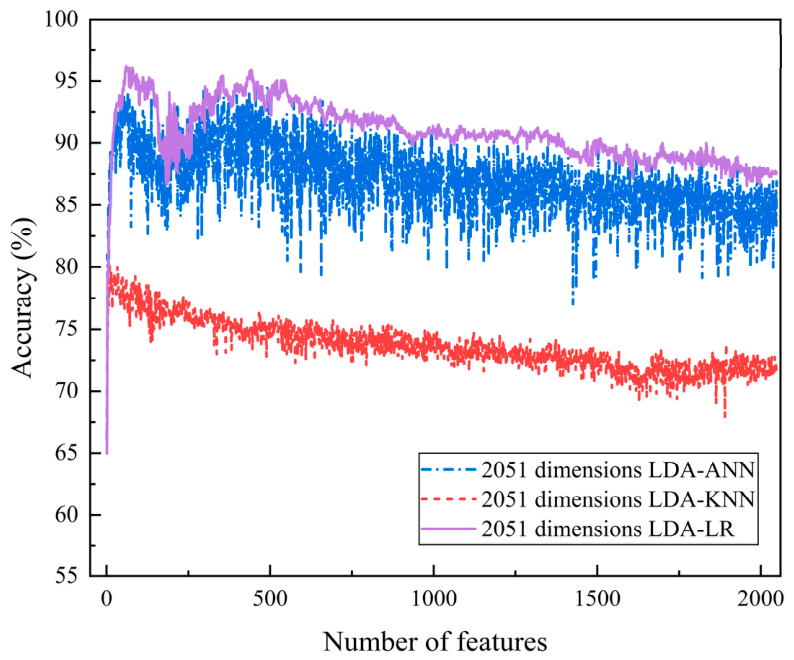
As illustrated in Figure 8, the classification accuracy curves across the three models exhibit heightened transient fluctuations compared to the baseline 2048-dimensional spectral models (Table 2). The notable stochastic volatility stems from the dynamic thermodynamics of laser-induced plasma plumes. These plume thermodynamic states change rapidly over a short timescale. Plasma characteristics are inherently susceptible to multiple microscopic surface parameters of the specimen. Relevant factors cover surface roughness, target reflectivity, and inter-pulse fluctuations in laser energy coupling. Despite these physical fluctuations, the parametric networks demonstrated robust noise tolerance. Under the LDA-ranked feature scheme, the integration of these three fixed generalized features allowed the ANN model to achieve its peak classification accuracy of 94.6%. Similarly, the peak accuracy of the LDA-LR model was elevated to 96.2%, although it required a slightly expanded spectral feature subset to balance the added physical dimensions. In contrast, the distance-based KNN model experienced a significant performance decay, requiring broader spectral profiles yielding depressed classification accuracy.
Figure 8.
Classification accuracy variation with incrementally increasing feature number for LDA-ANN, LDA-KNN and LDA-LR models based on 2051-dimensional LIBS spectra data.
Spectral samples where the Boltzmann regression failed for any Fe, Cr, or Ni in either the training or test partitions were systematically discarded. In this high-purity dataset, only the Texc-Fe, Texc-Cr, and Texc-Ni were appended as generalized spectral features, yielding a 2051-dimensional hybrid manifold. As depicted in the accuracy trajectories in Figure 8, the trend and maximum accuracies across the three classifiers showed no significant divergence compared to Figure 8.
Table 3 systematically compares temperature-integrated models with baseline spectral models of Table 2. Introducing generalized spectral dimensions steadily improves the maximum prediction accuracy of the ANN and LR. In contrast, the same dimensional modification reduces the overall predictive performance of the KNN model. Classifiers exhibit obviously different prediction trends in the above comparison. This discrepancy reflects an essential mathematical rule for spectroscopic feature fusion. Thermodynamic information from generalized spectra fits gradient-learning algorithms (LR, ANN) well yet impairs distance-dependent isotropic metrics (KNN). For the LR and ANN, the newly incorporated plasma temperatures provide complementary, non-radiometric physical constraints that successfully compensate for the non-linear spectral fluctuations caused by laser-target coupling variance. For the KNN classifier, however, the introduction of these cross-dimensional, heterogeneous physical variables distorts the metric structure of the high-dimensional Euclidean space. This scale-discrepant metric distortion scrambles the localized neighbor relationships established by the raw spectral lines, thereby degrading its neighborhood purity and collapsing its predictive classification fidelity.
Table 3.
Optimal feature numbers and test classification accuracies of ANN, KNN, and LR models based on 2051-dimensional LIBS spectra screened by LDA.
4. Conclusions
In this study, high-fidelity classification of ultra-thin austenitic stainless steel foils was achieved by LIBS with a physics-informed, feature-optimized ML. Multi-method spectroscopic evaluations identified the 357–360 nm spectral range as a universally robust discriminative band, consistently prioritized across ANOVA, ReliefF, and LDA feature selection protocols. This spectral region forms a composite physicochemical fingerprint. The spectral lines are affected by instrumental broadening, Stark broadening, fluctuations in the local plasma state, and matrix effects. Under ultra-thin geometric constraints, these combined features provide a stable basis for alloy identification.
Systematic classification benchmarks demonstrated that the supervised LDA feature ranking achieves unparalleled compatibility with the linear LR model due to the conjugate mathematical form of their optimization objectives. By projecting the high-dimensional spectroscopic manifold onto a highly compressed subspace, the LDA-LR configuration attained an exceptional classification accuracy of 95.7% utilizing only 58 optimized features. Ultimately, the introduction of the generalized spectra method, which incorporates Boltzmann-derived plasma excitation temperatures as physical correction factors and utilizes a quality-control gate to filter thermodynamically inconsistent spectra. It successfully elevated the peak accuracy of the LDA-LR model to 96.2%. Physical information is fused into data-based linear projection. This hybrid strategy alleviates unstable non-linear spectral noise from the interaction between pulsed laser and ultra-thin foil coupling. The resulting model potentially supports robust real-time monitoring of metallurgical quality control.
Supplementary Materials
The following supporting information can be downloaded at: https://www.mdpi.com/article/10.3390/photonics13111058/s1, Figure S1: Boltzmann plot fitting results of training set data for 316L stainless steel; Figure S2: Confusion matrices of the best‑performing models under each feature‑selection algorithm; Figure S3: Magnified view of the ablation crater on the 316L sample; Table S1: Spectral parameters of the selected atomic characteristic lines of Fe I, Cr I and Ni I; Table S2: Boltzmann plot fitting parameters (slope, temperature and coefficient of determination R2 of Fe, Cr and Ni in ultra-thin austenitic stainless steel foils of different grades (301, 304, 316L).
Author Contributions
Conceptualization, S.H. and X.X.; methodology, S.H.; software, S.H.; validation, S.H. and X.X.; formal analysis, S.H.; investigation, S.H., X.W., Y.G. and L.F.; resources, X.X. and C.L.; data curation, S.H.; writing—original draft preparation, S.H.; writing—review and editing, C.L. and X.X.; visualization, S.H.; supervision, C.L.; project administration, C.L. and X.Q.; funding acquisition, C.L., X.Q., X.X. and X.W. All authors have read and agreed to the published version of the manuscript.
Funding
This research was funded by the National Natural Science Foundation of China (12504482); Key Research and Development Program of Shanxi Province of China (202402150301012, 202302150101006); the Central Guidance on Local Science and Technology Development Fund of Shanxi Province (YDZJSX2025C026); Science Research Startup Fund of Shanxi Province (No. 20262093); Taiyuan University of Science and Technology Scientific Research Initial Funding (20252097, 20262030).
Institutional Review Board Statement
Not applicable.
Informed Consent Statement
Not applicable.
Data Availability Statement
The original contributions presented in this study are included in the article. Further inquiries can be directed to the corresponding author.
Acknowledgments
The authors acknowledge support from relevant institutions and research projects upon which this study relies.
Conflicts of Interest
The authors declare no conflicts of interest.
References
- Jia, F.; Zhao, J.; Luo, L.; Xie, H.; Jiang, Z. Experimental and numerical study on micro deep drawing with aluminium-copper composite material. Procedia Eng. 2017, 207, 1051–1056. [Google Scholar] [CrossRef] [Scilit]
- Pan, D.; Zhang, G.; Wu, H.; Jia, F.; Li, L.; Zhang, T.; Yang, M.; Jiang, Z. Tribological behaviour of ultra-thin stainless steel in micro deep drawing with graphene nanosheets. Wear 2023, 524–525, 204878. [Google Scholar] [CrossRef] [Scilit]
- He, Q.; Pan, F.; Wang, D.; Liu, H.; Guo, F.; Wang, Z.; Ma, Y. Microstructure and properties of 316L stainless steel foils for pressure sensor of pressurized water reactor. Nucl. Eng. Technol. 2021, 53, 172–177. [Google Scholar] [CrossRef] [Scilit]
- Pakmanesh, M.R.; Shamanian, M. Optimization of pulsed laser welding process parameters in order to attain minimum underfill and undercut defects in thin 316L stainless steel foils. Opt. Laser Technol. 2018, 99, 30–38. [Google Scholar] [CrossRef] [Scilit]
- Xue, H.; Zhang, F.; Yu, S.; Wei, W.; Yuan, Y.; Tian, X.; Yu, H. Data-driven prediction of thickness uniformity for high-precision rolling of 316L stainless steel foil in 20-high mill. Mater. Today Commun. 2025, 46, 112562. [Google Scholar] [CrossRef] [Scilit]
- Gau, J.-T.; Chen, P.-H.; Gu, H.; Lee, R.-S. The coupling influence of size effects and strain rates on the formability of austenitic stainless steel 304 foil. J. Mater. Process. Technol. 2013, 213, 376–382. [Google Scholar] [CrossRef] [Scilit]
- Xu, W.; Xiao, P.; Zhu, L.; Zhang, Y.; Chang, J.; Zhu, R.; Xu, Y. Classification and rating of steel scrap using deep learning. Eng. Appl. Artif. Intell. 2023, 123, 106241. [Google Scholar] [CrossRef] [Scilit]
- Penumuru, D.P.; Muthuswamy, S.; Karumbu, P. Identification and classification of materials using machine vision and machine learning in the context of industry 4.0. J. Intell. Manuf. 2020, 31, 1229–1241. [Google Scholar] [CrossRef] [Scilit]
- Koyanaka, S.; Kobayashi, K. Automatic sorting of lightweight metal scrap by sensing apparent density and three-dimensional shape. Resour. Conserv. Recycl. 2010, 54, 571–578. [Google Scholar] [CrossRef] [Scilit]
- Gao, Z.; Sridhar, S.; Spiller, D.E.; Taylor, P.R. Applying Improved Optical Recognition with Machine Learning on Sorting Cu Impurities in Steel Scrap. J. Sustain. Metall. 2020, 6, 785–795. [Google Scholar] [CrossRef] [Scilit]
- Belozerova, A.A.; Mayorova, A.V.; Bardina, M.N. Precipitation of Iron, Tungsten, Molybdenum, and Chromium for Determination of Selenium and Tellurium in Alloy Steel by Inductively Coupled Plasma Atomic Emission Spectrometry. Inorg. Mater. 2024, 60, 328–333. [Google Scholar] [CrossRef] [Scilit]
- Finkeldei, S.; Staats, G. ICP-MS—A powerful analytical technique for the analysis of traces of Sb, Bi, Pb, Sn and P in steel. Fresenius J. Anal. Chem. 1997, 359, 357–360. [Google Scholar] [CrossRef] [Scilit]
- Al-Eshaikh, M.A.; Kadachi, A. Elemental analysis of steel products using X-ray fluorescence (XRF) technique. J. King Saud Univ. Eng. Sci. 2011, 23, 75–79. [Google Scholar] [CrossRef] [Scilit]
- Jeon, G.; Keum, H.; Lee, H.; Oh, K.; Choi, J. Effects of feature engineering on the robustness of laser-induced breakdown spectroscopy for industrial steel classification. Spectrochim. Acta Part B At. Spectrosc. 2024, 212, 106857. [Google Scholar] [CrossRef] [Scilit]
- Lu, S.; Shen, S.; Huang, J.; Dong, M.; Lu, J.; Li, W. Feature selection of laser-induced breakdown spectroscopy data for steel aging estimation. Spectrochim. Acta Part B At. Spectrosc. 2018, 150, 49–58. [Google Scholar] [CrossRef] [Scilit]
- Chen, G.; Zeng, Q.; Li, W.; Chen, X.; Yuan, M.; Liu, L.; Ma, H.; Wang, B.; Liu, Y.; Guo, L.; et al. Classification of steel using laser-induced breakdown spectroscopy combined with deep belief network. Opt. Express 2022, 30, 9428–9440. [Google Scholar] [CrossRef] [Scilit] [PubMed]
- Yan, C. A review on spectral data preprocessing techniques for machine learning and quantitative analysis. iScience 2025, 28, 112759. [Google Scholar] [CrossRef] [Scilit] [PubMed]
- Huang, H.; Fang, Z.; Xu, Y.; Lu, G.; Feng, C.; Zeng, M.; Tian, J.; Ping, Y.; Han, Z.; Zhao, Z. Stacking and ridge regression-based spectral ensemble preprocessing method and its application in near-infrared spectral analysis. Talanta 2024, 276, 126242. [Google Scholar] [CrossRef] [Scilit] [PubMed]
- Katongtung, T.; Khuenkaeo, N.; Mona, Y.; Suttakul, P.; Moran, J.C.; Tippayawong, K.Y.; Tippayawong, N. Data Driven Prediction of Hydrochar Yields from Biomass Hydrothermal Carbonization Using Extreme Gradient Boosting Algorithm with Principal Component Analysis. Digit. Chem. Eng. 2025, 18, 100283. [Google Scholar] [CrossRef] [Scilit]
- Schifano, F.; Magnaghi, L.R.; Monzani, E.; Casella, L.; Biesuz, R. Exploiting Principal Component Analysis (PCA) to reveal temperature, buffer and metal ions’ role in neuromelanin (NM) synthesis by dopamine (DA) oxidative polymerization. J. Inorg. Biochem. 2024, 256, 112548. [Google Scholar] [CrossRef] [Scilit] [PubMed]
- Kramida, A.; Ralchenko, Y.; Reader, J.; NIST ASD Team. NIST Atomic Spectra Database, version 5.12; National Institute of Standards and Technology: Gaithersburg, MD, USA, 2024. [Google Scholar] [CrossRef] [Scilit]

Disclaimer/Publisher’s Note: The statements, opinions and data contained in all publications are solely those of the individual author(s) and contributor(s) and not of MDPI and/or the editor(s). MDPI and/or the editor(s) disclaim responsibility for any injury to people or property resulting from any ideas, methods, instructions or products referred to in the content. |
© 2026 by the authors. Licensee MDPI, Basel, Switzerland. This article is an open access article distributed under the terms and conditions of the Creative Commons Attribution (CC BY) license.