


Abstract
Visible light communication (VLC) is inherently a broadcast medium, since any receiver inside the illuminated volume can capture the transmitted signal. Physical layer security exploits the asymmetry between the legitimate and eavesdropping channels, yet lighting design pursues a uniform illumination that suppresses exactly this asymmetry. This paper quantifies the resulting trade-off for three luminaire layouts, namely four symmetric clusters, a single central cluster and a distributed grid, in a 5 m × 5 m × 3 m room, under an amplitude-constrained Gaussian wiretap model and a lower bound on the secrecy capacity. Unlike most prior studies, the channel model includes diffuse multipath reflections, obtained from an interreflection matrix truncated at the third order. Three schemes are compared, namely common SISO broadcasting, spatially confined data transmission (SCDT) and SCDT with artificial noise (SCDT-AN). Uniform illumination yields the lowest secrecy under SISO, whereas SCDT and SCDT-AN create the required asymmetry through the transmission itself. At the best receiver location with a 20° half-power semi-angle and reflections included, the average secrecy rate of the four-cluster layout rises from 2.10 to 5.36 and 5.68 bit per channel use. It is found that although reflections reduce the SISO rate at every position, SCDT can overcome the residual reflected lights with a nearly unchanged rate, and SCDT-AN further improves it.
1. Introduction
Visible light communication (VLC) delivers data through the same light-emitting diodes that provide room illumination [1,2] and is a key enabler of the LiFi attocell concept for beyond-5G indoor networks [3]. Recent work has reached multi-GB rates on visible-band optical wireless links using directly modulated sources and OFDM formats [4,5]. Those studies address the throughput and the robustness of the transmission itself, whereas the present work takes the modulation format as given and asks how much of the delivered information can be kept confidential from an eavesdropper inside the illuminated volume. The same property that confines light to a room makes the link a broadcast channel inside it, since any photodiode in the illuminated volume can capture the signal intended for a legitimate user, so eavesdropping by an unauthorized occupant is a realistic threat [6,7].
Cryptography at the upper layers offers security that is conditional on the computational power of the adversary, whereas physical-layer security (PLS) is information-theoretic [8,9]. Its principle is to exploit the difference between the channels of the legitimate receiver (Bob) and the eavesdropper (Eve), and a positive secrecy rate is achievable only when Bob enjoys the better channel.
VLC shapes this asymmetry in two ways. The transmitted signal is a non-negative intensity with a peak constraint set by the LED dynamic range, so the capacity-achieving input is discrete and closed-form secrecy capacities are unavailable [10,11,12,13]. The channel gain is deterministic and governed almost entirely by geometry [14], while lighting design pursues a uniform illuminance over the working plane, which implies that Bob and Eve receive similar optical powers wherever they are. Good lighting and good secrecy are therefore conflicting objectives.
Mostafa and Lampe investigated secure beamforming under amplitude constraints using fixed luminaire configurations [6,15]. Subsequent studies derived closed-form secrecy-capacity bounds [12], analyzed multiuser VLC networks using stochastic and grid-based AP distributions [16], and proposed artificial noise (AN)-based beamforming [17] and location-based spatial jamming [18]. These transmission studies mainly relied on LOS-based channels. In contrast, multipath propagation was investigated in [19,20,21], including third-order, higher-order, and infinite-order reflection models, although these studies focused on channel characterization rather than secrecy performance.
More recent VLC security studies have incorporated reflections. Yang et al. [22] investigated reflection-induced ISI in a single-transmitter system, Albayrak et al. [23] considered a four-fixture configuration with second-order reflections, and Chen and Shu [24] examined spatial secrecy capacity using a single transmitter and first-order reflections. However, the combined effects of different luminaire arrangements, illumination uniformity, and diffuse multipath reflections on spatial secrecy performance remain insufficiently investigated. This work addresses this gap by comparing three distinct luminaire layouts under LOS-only and third-order diffuse reflection models, evaluating SISO, SCDT, and SCDT-AN within each layout.
This paper addresses these gaps with four contributions. We evaluate secrecy as a spatial distribution over an explicitly defined set of receiver positions, using the signal-to-noise ratio (SNR) difference distribution and the location-averaged secrecy-rate lower bound as metrics. We compare three layouts of different spatial distributions and illumination uniformity in terms of both illumination quality and secrecy. We include diffuse reflections through a matrix formulation of the interreflection problem with sub-patch integration, evaluated up to the third order. Finally, we evaluate two MISO schemes and determine the optimal number of data-carrying luminaire positions for each.
2. System Model
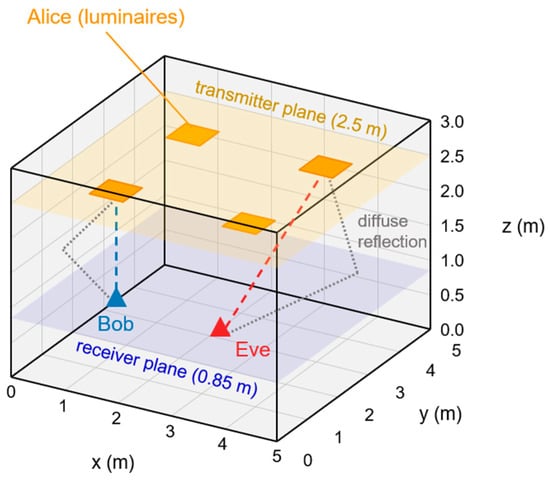
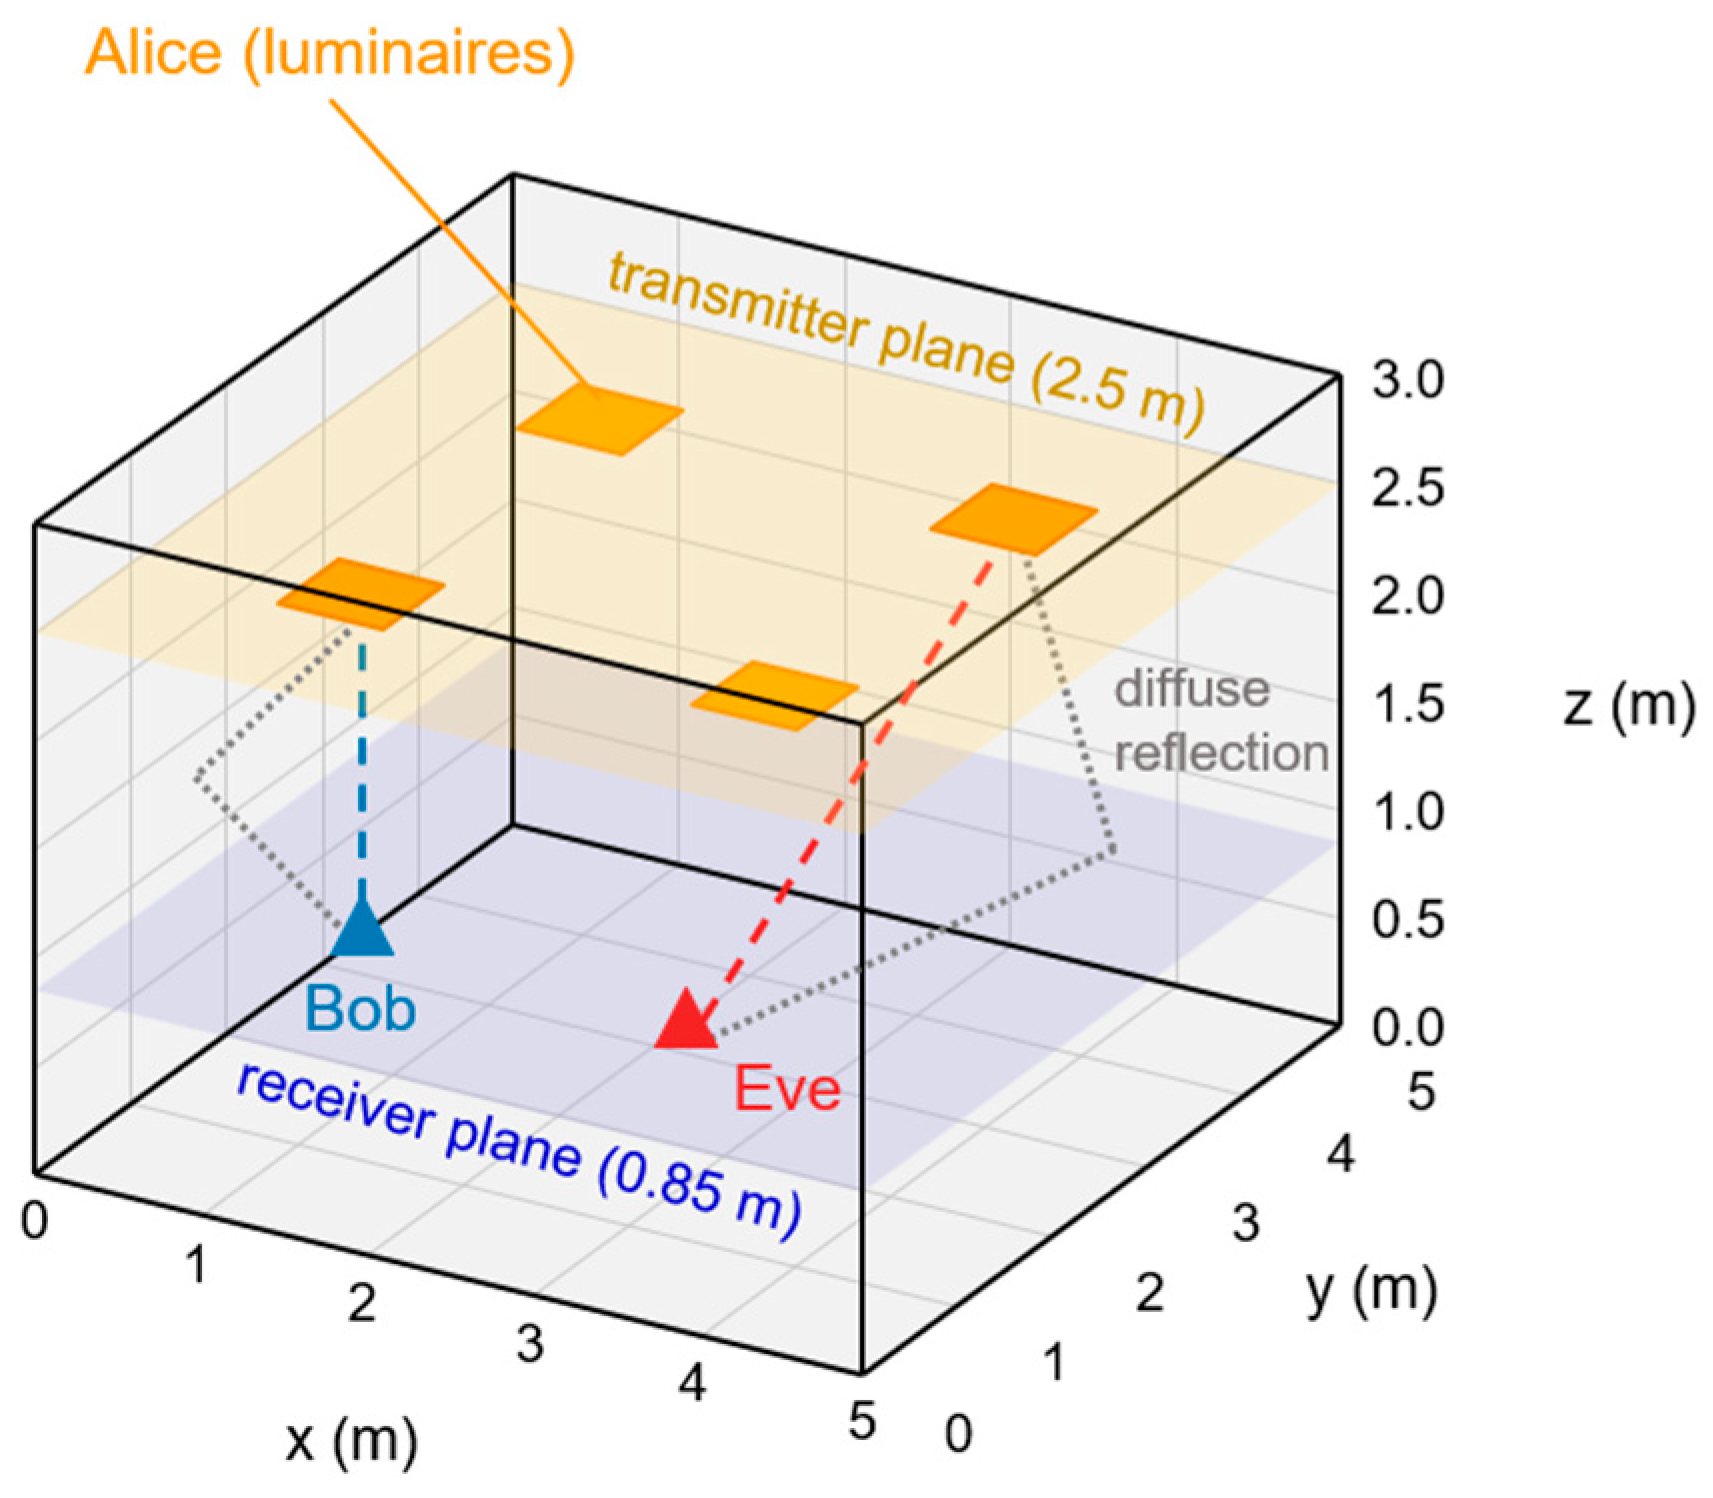
We consider an empty room of 5 m × 5 m × 3 m (Figure 1). The transmitter (Alice) consists of ceiling luminaires at 2.5 m facing downwards, sampled on a square grid of 0.05 m pitch. Each occupied grid position carries five LEDs of 20 mW optical power treated as a single point source of 0.1 W, and all positions share the same Lambertian pattern set by the half-power semi-angle (HPSA). The numbers of occupied positions are 676, 625 and 1524 for Layouts A, B and C, so the total optical power is 67.6, 62.5 and 152.4 W. The layouts are compared at equal power per LED and not at equal total power.
Figure 1.
Indoor VLC wiretap scenario with Layout A. Alice lies on the transmitter plane at 2.5 m and both receivers on the receiver plane at 0.85 m. Bob is shown at the best location, while a passive Eve may be anywhere on the receiver plane. Both receive line-of-sight and diffusely reflected light.
Bob (the legitimate receiver) and Eve (the eavesdropper) are identical photodiodes facing upwards on the working plane at 0.85 m, each with a 60 field of view and an ideal concentrator of gain 1.33, sampled on the same 0.05 m grid. Positions lying exactly on a wall plane are excluded, since such a position sees that wall at 90 of incidence and loses its reflection entirely, which leaves 99 × 99 = 9801 valid positions from 0.05 m to 4.95 m. This set is symmetric about the room center and includes it, and every spatial average is taken over it.
Alice knows Bob’s location but not the CSI of Eve, who is passive and may occupy any valid position in . Eve is a single photodiode identical to Bob’s and is assumed to have no prior knowledge of the luminaire configuration, the AN assignment or the AN statistics. The evaluation uses the modeled channel gains and the received AN power to compute her SINR, which corresponds to ideal knowledge of her own channel and of the received AN power. Her channel estimation, parameter learning and AN cancelation are not simulated.
The four walls, the ceiling and the floor are ideal diffuse reflectors with the reflectance representing painted plaster walls and a darker floor. Specular reflection is not modeled, which is the usual assumption for painted indoor surfaces. Windows or mirrors would create directional paths that a diffuse model does not capture, and such a path could carry the data signal to a distant Eve. The room is otherwise empty, so no path is blocked, and the reflected light reaches both receivers through the multipath model introduced later in this section.
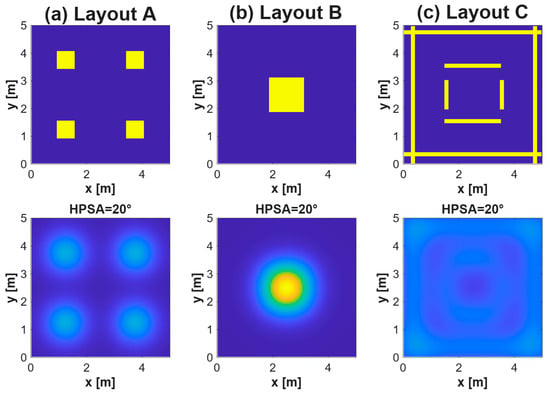
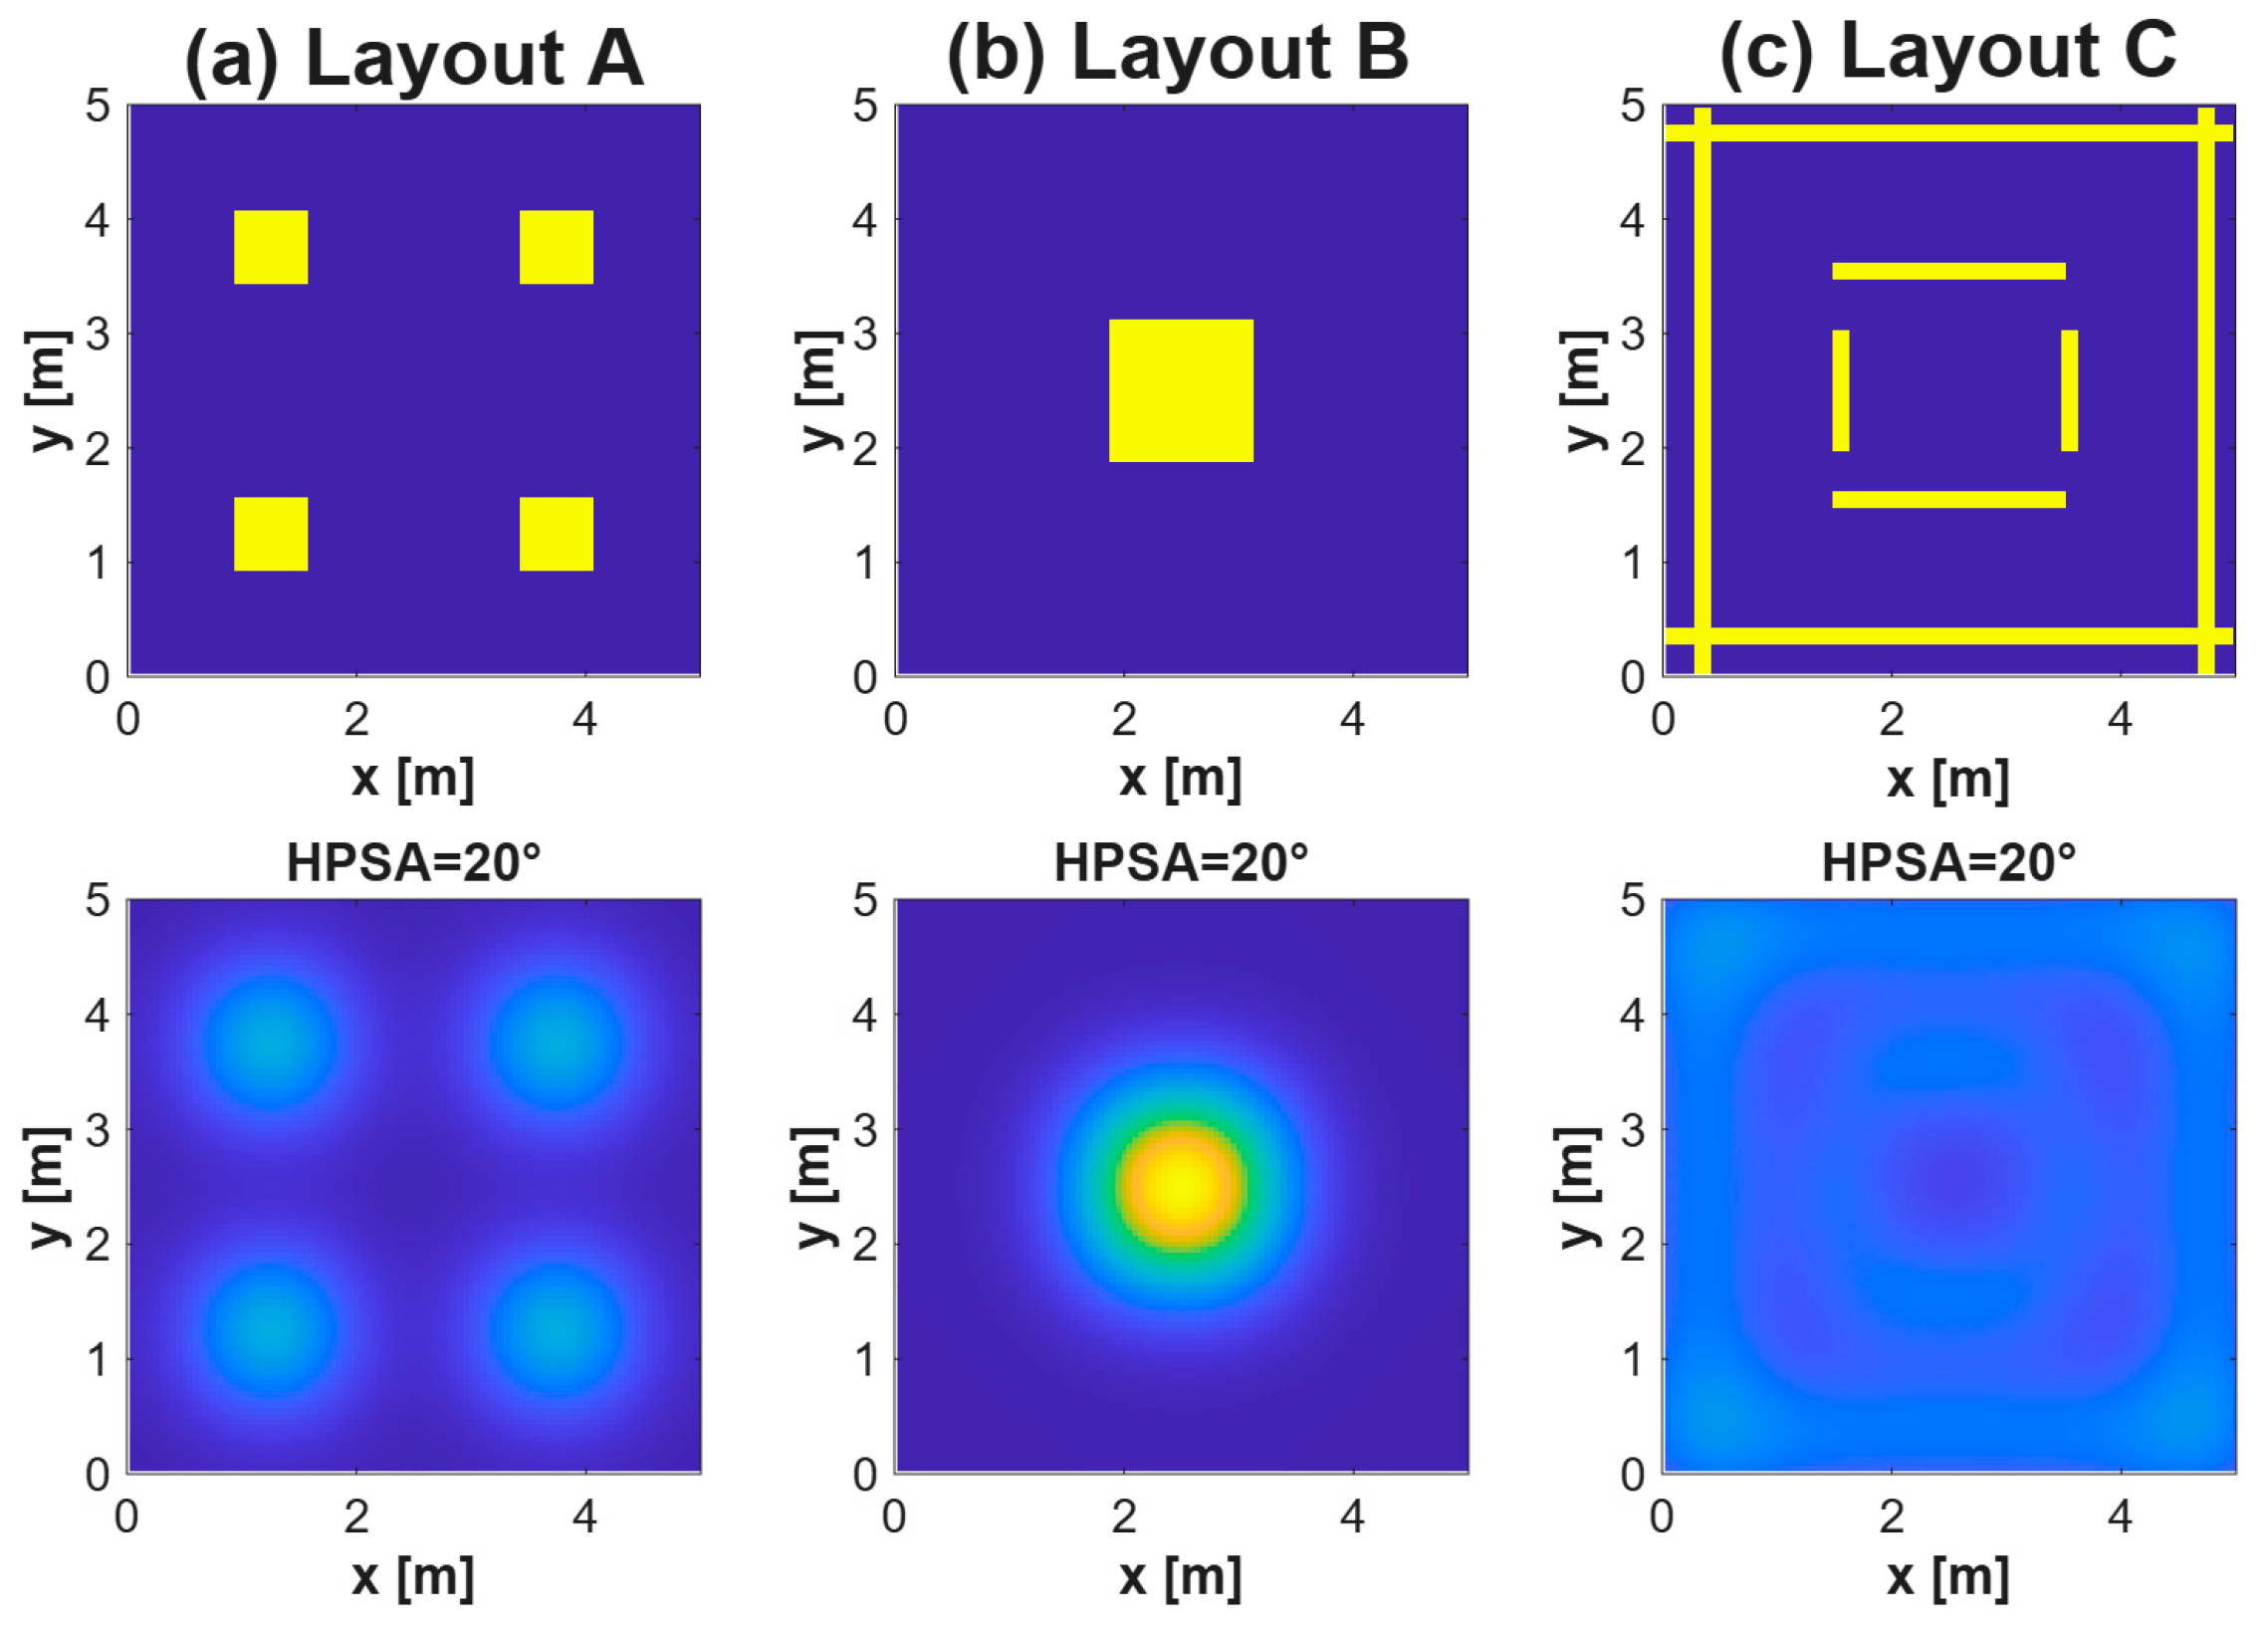
Three layouts with the same room and LED type but different spatial distributions of the luminaires are studied (Figure 2). Layout A places four identical square clusters symmetrically about the room center, Layout B concentrates a similar number of LEDs in one central cluster, and Layout C distributes them along an outer grid and an inner rectangular frame. Table 1 lists the coordinate range of every component of the three layouts.
Figure 2.
Top view of the three luminaire layouts, (a) Layout A with four symmetric clusters (676 occupied positions, 67.6 W in total), (b) Layout B with one central cluster (625 positions, 62.5 W) and (c) Layout C with a distributed grid and inner ring (1524 positions, 152.4 W). Each occupied position emits 0.1 W.
Table 1.
Occupied grid positions of the three luminaire layouts.
Each luminaire grid position is driven by a DC bias that sets the illumination level and, for the positions assigned to carry data, by a zero-mean information-bearing signal superimposed on it. For an active grid position , the transmitted signal component is , where is the DC optical power of one grid position, 0.1 W for the five LEDs of 20 mW used here, is the common data symbol sent from all active positions and α ∈ (0, 1] is the modulation index. Inactive positions have . The optical power emitted by position j is
so that the amplitude constraint is satisfied with equality at . The resulting optical-power range of 0.09–0.11 W is assumed to remain within the linear operating range of the LEDs while maintaining the same average illumination level. Let denote the vector of signal components of the N grid positions occupied by the layout. Since the DC term carries no information and is removed before detection, the received signals of Bob and Eve are
where is the channel gain vector from the occupied grid positions to receiver and is zero-mean Gaussian noise. Substituting for the active positions into (2), the peak electrical SNR at receiver is
where R is the PD responsivity, is the PD area, is the irradiance produced at receiver by the data-carrying positions when they emit their DC power , is the thermal noise power, is the shot noise power and is the artificial-noise power, which is zero unless jamming is applied. The signal-to-noise ratio in (3) is defined at the peak of the data symbol, that is at |d| = 1. The second moment of the uniform symbol enters later through the coefficients of (9).
The shot noise is computed from the total photocurrent collected at the receiver, since the illumination is maintained whether or not a position carries data,
where is the electron charge, the bandwidth and the irradiance at receiver k produced by all occupied grid positions, including those that carry no data and including the reflected component. The shot noise is small compared with the thermal noise, so the total noise is set almost entirely by the thermal term.
Each luminaire grid position is modeled as a single generalized Lambertian point source at that position, with the optical power of its five LEDs lumped together. This is justified because the 0.05 m grid pitch is small compared with the 1.65 m separation between the luminaire and receiver planes. The LOS gain between grid position and a PD at distance is [14]
where and are the irradiance and incidence angles, is the PD field of view (FOV) and
are the Lambertian order, determined by the half-power semi-angle (HPSA) , and the gain of a non-imaging concentrator with refractive index . The refractive index is set to unity here, so that = 1.33 for the 60 field of view and the concentrator is effectively absent. A small HPSA concentrates the emitted power below the luminaire (m ≈ 11.14 for 20°), whereas a large HPSA spreads it (m = 1 for 60°). Unlike the usual definition of the LOS channel gain, (5) does not contain . It gives the irradiance produced at the receiver per watt of transmitted optical power, in units of one over square meter, and the detector area enters only in (3).
Walls, ceiling and floor are modeled as ideal diffuse Lambertian reflectors with the reflectance values in Table 2 and divided into square patches of side , each surface tiled independently over its own extent so that the patches cover it without gaps or overlap. This gives patches in total. Following the recursive method of Barry et al. [19] and its matrix form [21], the source-to-patch, patch-to-patch and patch-to-receiver gains are computed with (5), taking m = 1 for a patch that re-emits, a hemispherical field of view when the receiving element is a patch, and the 60° field of view of the PD when it is the photodiode. Only the 1725 patches located above the receiver plane can deliver light directly to a receiver, which excludes the floor entirely.
Collecting the gains into matrices gives the source-to-patch matrix , the patch-to-patch matrix and the patch-to-receiver matrix , whose columns cover only those 1725 patches. With , where and are the reflectance and the area of patch , the light that has undergone k bounces is , and summing over all orders gives
where the series converges because the spectral radius of the interreflection matrix is 0.68 for the reflectance and dimensions used here, so the inverse exists and the Neumann series converges, and the same value sets the rate at which successive orders decay. The series is truncated at order K, which gives the conventional K-bounce model, and all results in this paper use K = 3. Accordingly, the reported NLOS channel contains the first-, second-, and third-order diffuse-reflection components, with the 1725 receiver-visible patches selected before the final multiplication by . Every term reuses the same two matrices, the patch-to-patch and the patch-to-receiver gains, and these depend only on the room, so they are built once and reused for every layout and semi-angle. The first order alone does not represent the reflected field here. The luminaires face downwards from 2.5 m, so the ceiling receives no direct light and can re-emit only after a bounce elsewhere. The floor does receive direct light, but it lies below the upward-facing receivers and so falls outside their field of view, and its light reaches a receiver only after a further bounce. The two largest surfaces of the room therefore contribute from the second bounce onward.
The overall channel matrix is . The same matrices carry the data signal and the artificial noise of Section 4. A receiver sees a transmitting position only within its 60 field of view, which at a plane separation of 1.65 m reaches 2.86 m horizontally, so many pairs have no line-of-sight term at all in a 5 m room. Reflected light still reaches those receivers, and this is what limits the spatial confinement of the schemes in Section 4.
Equation (5) applies to point sources, but a patch is a plate of side 0.2 m and its center alone is inaccurate at short range. Each patch is therefore represented by 4 × 4 points, one every 0.05 m, and the gain is their average. A receiver within 0.6 m of a patch triggers a finer division until the spacing falls below a quarter of the separation. Patch pairs closer than 1.0 m are averaged over all 16 × 16 combinations of their sub-points, while more distant pairs are computed from the patch center alone, which is accurate enough at that range. The distance is never allowed below the radius of a disc of equal area, a numerical guard that was never active in this room.
3. Performance Metrics
For the scalar degraded Gaussian wiretap channel [8,9], which for any fixed pair of receiver positions is degraded in one direction or the other since both links are scalar Gaussian, the secrecy capacity with the peak constraint is
and the positive part covers the positions at which the eavesdropper holds the stronger channel. The capacity-achieving input under a peak constraint is discrete, taking a finite number of amplitude levels whose count, positions and probabilities all vary with the SNR [10,11], so (8) has no closed form and would require a separate numerical optimization at every receiver position. We therefore use the lower bound of [6], obtained by choosing uniformly distributed on [–1, 1]. For this input the entropy-power inequality lower-bounds Bob’s mutual information and the Gaussian maximum-entropy property upper-bounds Eve’s, with the variance of the uniform input equal to 1/3 and its entropy power equal to , which gives
in bit per channel use. Equation (9) is an achievable secrecy rate rather than the secrecy capacity, since it uses a fixed uniform input rather than the optimal one, so and every result below is conservative.
In SCDT-AN, the artificial noise is added to the denominator of Eve’s SNR in (3), so that (9) is evaluated with Eve’s SINR, while the legitimate user remains free of it under the beam separation assumption of Section 4. The Gaussian maximum entropy step above requires the total noise at Eve to be Gaussian, which holds for SISO and for SCDT, where the only impairment is the receiver noise, but not once the artificial noise is present. Writing for the total noise at Eve, for the variance of the receiver noise at Eve and for the artificial noise power defined in (14), the total variance is and that step is exact only if attains its Gaussian value. Retaining the Gaussian form therefore understates the rate available to Eve by the entropy difference which vanishes if and only if is Gaussian. The artificial noise waveform is uniform, as specified in Section 4, so the entropy power of the artificial noise term equals times its variance, while that of the Gaussian receiver noise equals its variance. The entropy power inequality then gives , and substituting this bound into the definition of leaves . The factor 2/πe in the first term of (9) arises from the same entropy power, evaluated there for the uniform data symbol, so no tool beyond the one already used to obtain (9) is introduced here. The correction vanishes when , and it saturates at bit per channel use when the artificial noise dominates the receiver noise. Equivalently, a uniform jamming waveform of power contributes the entropy power of a Gaussian waveform of power , which amounts to a loss of at most 1.53 dB. Since is an upper bound on the entropy difference rather than its exact value, subtracting it in (9) keeps a lower bound. The same bound, with the ratio of to in place of the distortion to noise ratio, is Equation (54) of [25], where it is likewise subtracted from a Gaussian form rate expression in order to obtain a lower bound on an achievable rate (55).
Since Eve may be anywhere in the room, the secrecy performance is a spatial field rather than a single number. Eve is assumed to be equally likely to occupy any grid position of , the set of the 99 × 99 = 9801 valid receiver positions defined in Section 2. For a given Bob location , the SNR difference at a candidate Eve location is
a direct measure of the channel asymmetry between Bob and Eve. Under SCDT-AN, is the SINR of (3) with , whereas is evaluated with , in line with the assumption of Section 4. The floor or −200 dB prevents an infinite difference where Eve receives no data power.
Its complementary distribution over Ω is
which gives the fraction of in which Bob’s advantage exceeds γ dB, and PCT(0) is the fraction of locations from which Eve is worse off than Bob. The average secrecy rate is
where the guard radius m excludes an eavesdropper standing next to Bob, which is outside the scope of physical layer security. Those positions see essentially Bob’s own channel and give zero secrecy rate under every scheme, and they make up about 3% of , so excluding them shifts the average by a similar amount without changing any comparison. The two metrics thus use different sets, for the PCT and for the average secrecy rate. The Eve SNR used in the average SNR difference of Section 6 is averaged in the linear domain and then converted to decibels.
Three Bob locations are considered, namely the room center, the location of highest direct-light illuminance and that of lowest. The center is exactly (2.50, 2.50) m. The best and worst locations are read from the direct-light irradiance with all luminaires on, so they depend on the layout and the semi-angle but not on the channel model. Determining them from the direct light alone means that the same three locations serve both models, so the comparison between the two isolates the effect of the reflections. Ties among symmetric positions are resolved arbitrarily. For Layout B the best and center locations coincide, and for Layout A the best location is a cluster center. Layout C is the exception, its best location lying where two perimeter strips cross and its worst location at 20 being the room center rather than a corner.
Illumination quality is evaluated with PCT400, the percentage of the working plane reaching the 400 lx required for office work, and with the standard deviation (STD) of the illuminance, both computed over the same valid set used for the security metrics. The illuminance is the value at the working plane and does not include the receiver concentrator, which is a property of the photodiode rather than of the light field.
4. Transmission Schemes
In the baseline SISO scheme, every luminaire grid position is modulated with the same symbol, . The MISO channel reduces to a scalar channel whose gain is the sum of the channel gains of all luminaire grid positions, and Bob’s advantage is determined solely by the contrast between the irradiance at Bob’s location and the irradiance at Eve’s location. The scheme requires no knowledge at the transmitter, but it offers no means of shaping the asymmetry.
If Bob’s location is known, which is realistic for a registered user of an indoor network, the transmitter can restrict the information-bearing signal to the luminaire grid positions surrounding him while the remaining positions continue to emit only the DC illumination. The data-carrying set is the square window
where (, ) and (, ) are the grid indices of luminaire grid position and of Bob, so the window is square in the Chebyshev sense. We refer to this scheme as spatially confined data transmission (SCDT).
The scheme selects which luminaire grid positions carry data and which do not, and nothing else. Every data-carrying position radiates the same waveform with no timing relationship imposed between positions, so their optical powers simply add at the receiver. A coherent null-steering scheme would instead adjust the relative phase of each luminaire so that the arriving waves cancel at Eve, which demands nanosecond-level synchronization across the ceiling and knowledge of Eve’s channel. SCDT gives up that finer instrument and keeps only the binary selection of positions, with the windows chosen from the position of the legitimate receiver alone, so it needs neither the channel state information of the eavesdropper nor any per-luminaire weight calibration. We use the descriptive name SCDT to emphasize its spatial mechanism.
Positions inside the window keep the same optical power as in the SISO scheme, so the data power grows with while the illumination is identical in all schemes. Window positions that carry no luminaire carry no data either, so the number of data-carrying positions cannot exceed and depends on Bob’s location. When Bob is far from every luminaire cluster the window can contain no luminaire at all for small , in which case no data is transmitted and the window is skipped. Results are therefore reported against rather than .
The window half-width is searched over the integer range 1–75, with a resolution of one grid interval (0.05 m). For each candidate, the data-carrying positions are selected within the square window centered on Bob, and the average secrecy rate in Equation (12) is calculated over the valid Eve positions outside the 0.5 m guard region. The optimal window is selected by exhaustive search as . The optimization is performed separately for each layout, semi-angle, Bob position, and LOS-only or LOS+NLOS condition. When several candidates give the same maximum, the smallest is selected. The data window is optimized separately for each layout, semi-angle, Bob location and scheme.
In SCDT-AN, every luminaire position outside modulates its output with an artificial-noise signal rather than keeping it constant. Dividing the luminaires into data and jamming positions according to the user location follows the spatial jamming idea of [18]. All jamming positions carry one common waveform , which is zero-mean, bounded by and uniform on that interval as the data symbol is, so that position j emits and the transmitted component obeys the same constraint as the data signal, with mean square . The resulting noise power at location is
where the sum runs over the luminaire grid positions outside the window, and this term enters Eve’s SNR in (3). Since is common to every jamming position it factors out of the sum, so the irradiance contributions are added before squaring and only the second moment of the waveform enters the signal-to-noise ratio. This correlated choice therefore maximizes the jamming power received at any position, and it is also the simpler one to implement, since a single noise generator drives every jamming position. Because this noise is not Gaussian, the eavesdropper term of the secrecy rate carries the correction introduced in Section 3. The gains are those of the full channel matrix of Section 2, so the reflected component of the noise is carried on the same footing as the reflected data signal.
The term is omitted from the signal-to-noise ratio of the legitimate receiver under the beam separation assumption. Under otherwise identical conditions the resulting metric is larger than the one evaluated with nonzero artificial noise interference at the legitimate receiver, so it is an optimistic benchmark with respect to that leakage. Since the noise is one common waveform, an eavesdropper with several photodiodes could in principle cancel it, and the reported rates refer to a single-photodiode eavesdropper. Both are assumptions about the model rather than about the bound, so (9) remains a lower bound on the achievable secrecy rate of the modeled channel while the model itself is favorable to the reported rates.
The data window of SCDT-AN is the same as in SCDT, and is selected with the same criterion, so the two schemes differ only in what the positions outside the window transmit. For SCDT-AN, the criterion is evaluated on the secrecy rate obtained with the artificial noise present, since the noise changes which window is optimal. The jamming positions radiate the same optical power as they would under DC illumination, so the illumination of the room is identical for all three schemes.
5. Simulation Setup
The simulation parameters are listed in Table 2. The room, the luminaire and receiver discretization and the patch discretization described in Section 2 are used without change. Every metric reported below is computed twice over the same geometry, once with the LOS component only and once with the full LOS with non-line-of-sight (NLOS) channel, so that any difference between the two is attributable to the reflections alone.
Table 2.
Simulation parameters.
The simulation uses a spatial channel model without generating time-domain data or AN samples. Each occupied luminaire position is assigned a fixed reference optical power of 0.1 W, and a modulation index of 0.1 is applied to both data and AN contributions. In SCDT-AN, the positions outside the selected data window are assigned to AN transmission. The received AN contributions are calculated using the LOS and reflected channel gains, and the resulting interference power is evaluated using Equation (14). This interference term is included in Eve’s SINR, while AN interference at Bob is neglected.
6. Results and Discussion
6.1. Illumination Performance and the Effect of Reflections
Table 3 summarizes the illumination metrics. Under the LOS model, a larger semi-angle spreads the light and improves PCT400 for the two clustered layouts, and it lowers the STD for all three. Layout C reaches full coverage at every semi-angle and has the lowest STD, which confirms that it is the most uniform arrangement, whereas Layout B is the least uniform since a single central cluster leaves most of the room below 400 lx at 20. The layouts have different total optical powers (67.6, 62.5 and 152.4 W) and therefore different illuminance levels, with mean illuminances of 980, 931 and 1837 lx at 20°. A lower STD indicates a more uniform illuminance, and Layout C has the lowest STD even though its mean illuminance is the highest, so the layouts can be compared in terms of uniformity. Its full PCT400 coverage, in contrast, is partly due to its higher power.
Table 3.
Illumination metrics of the three luminaire layouts, evaluated over the entire receiver plane with the LOS-only and with the LOS + NLOS channel model (K = 3). The NLOS share is the fraction of the total received illumination that arrives after at least one reflection.
Reflections add a slowly varying component over the whole plane, so the share of the received illuminance that arrives after at least one reflection is smallest directly under the luminaires and largest where the direct light is weakest. Averaged over the valid positions this share is 17.4% for Layout A at 20 and reaches 72.5% at the darkest position, and for Layout B, whose direct light is confined to the center, it is 51.0% and reaches 99.9% where almost no direct light arrives. Because the dim regions are the ones that fail the 400 lx requirement, reflections raise PCT400 from 61.7% to 71.4% for Layout A at 20 and from 53.6 to 76.0% for Layout B at 60.
Therefore, Layout C remains the most uniform arrangement under both channel models, reaching full coverage at every semi-angle with the lowest STD, Layout A follows, and Layout B remains the least uniform. By the criteria of lighting design, Layout C is the best of the three, and Section 6.2 shows that this is precisely what makes it the worst for secrecy.
6.2. Common SISO Broadcasting
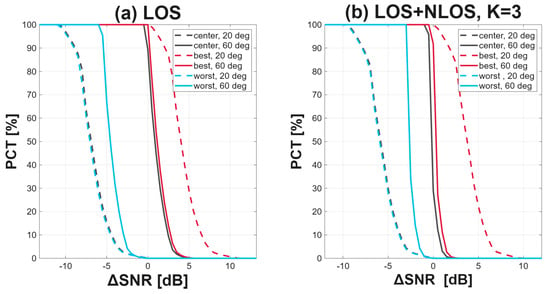
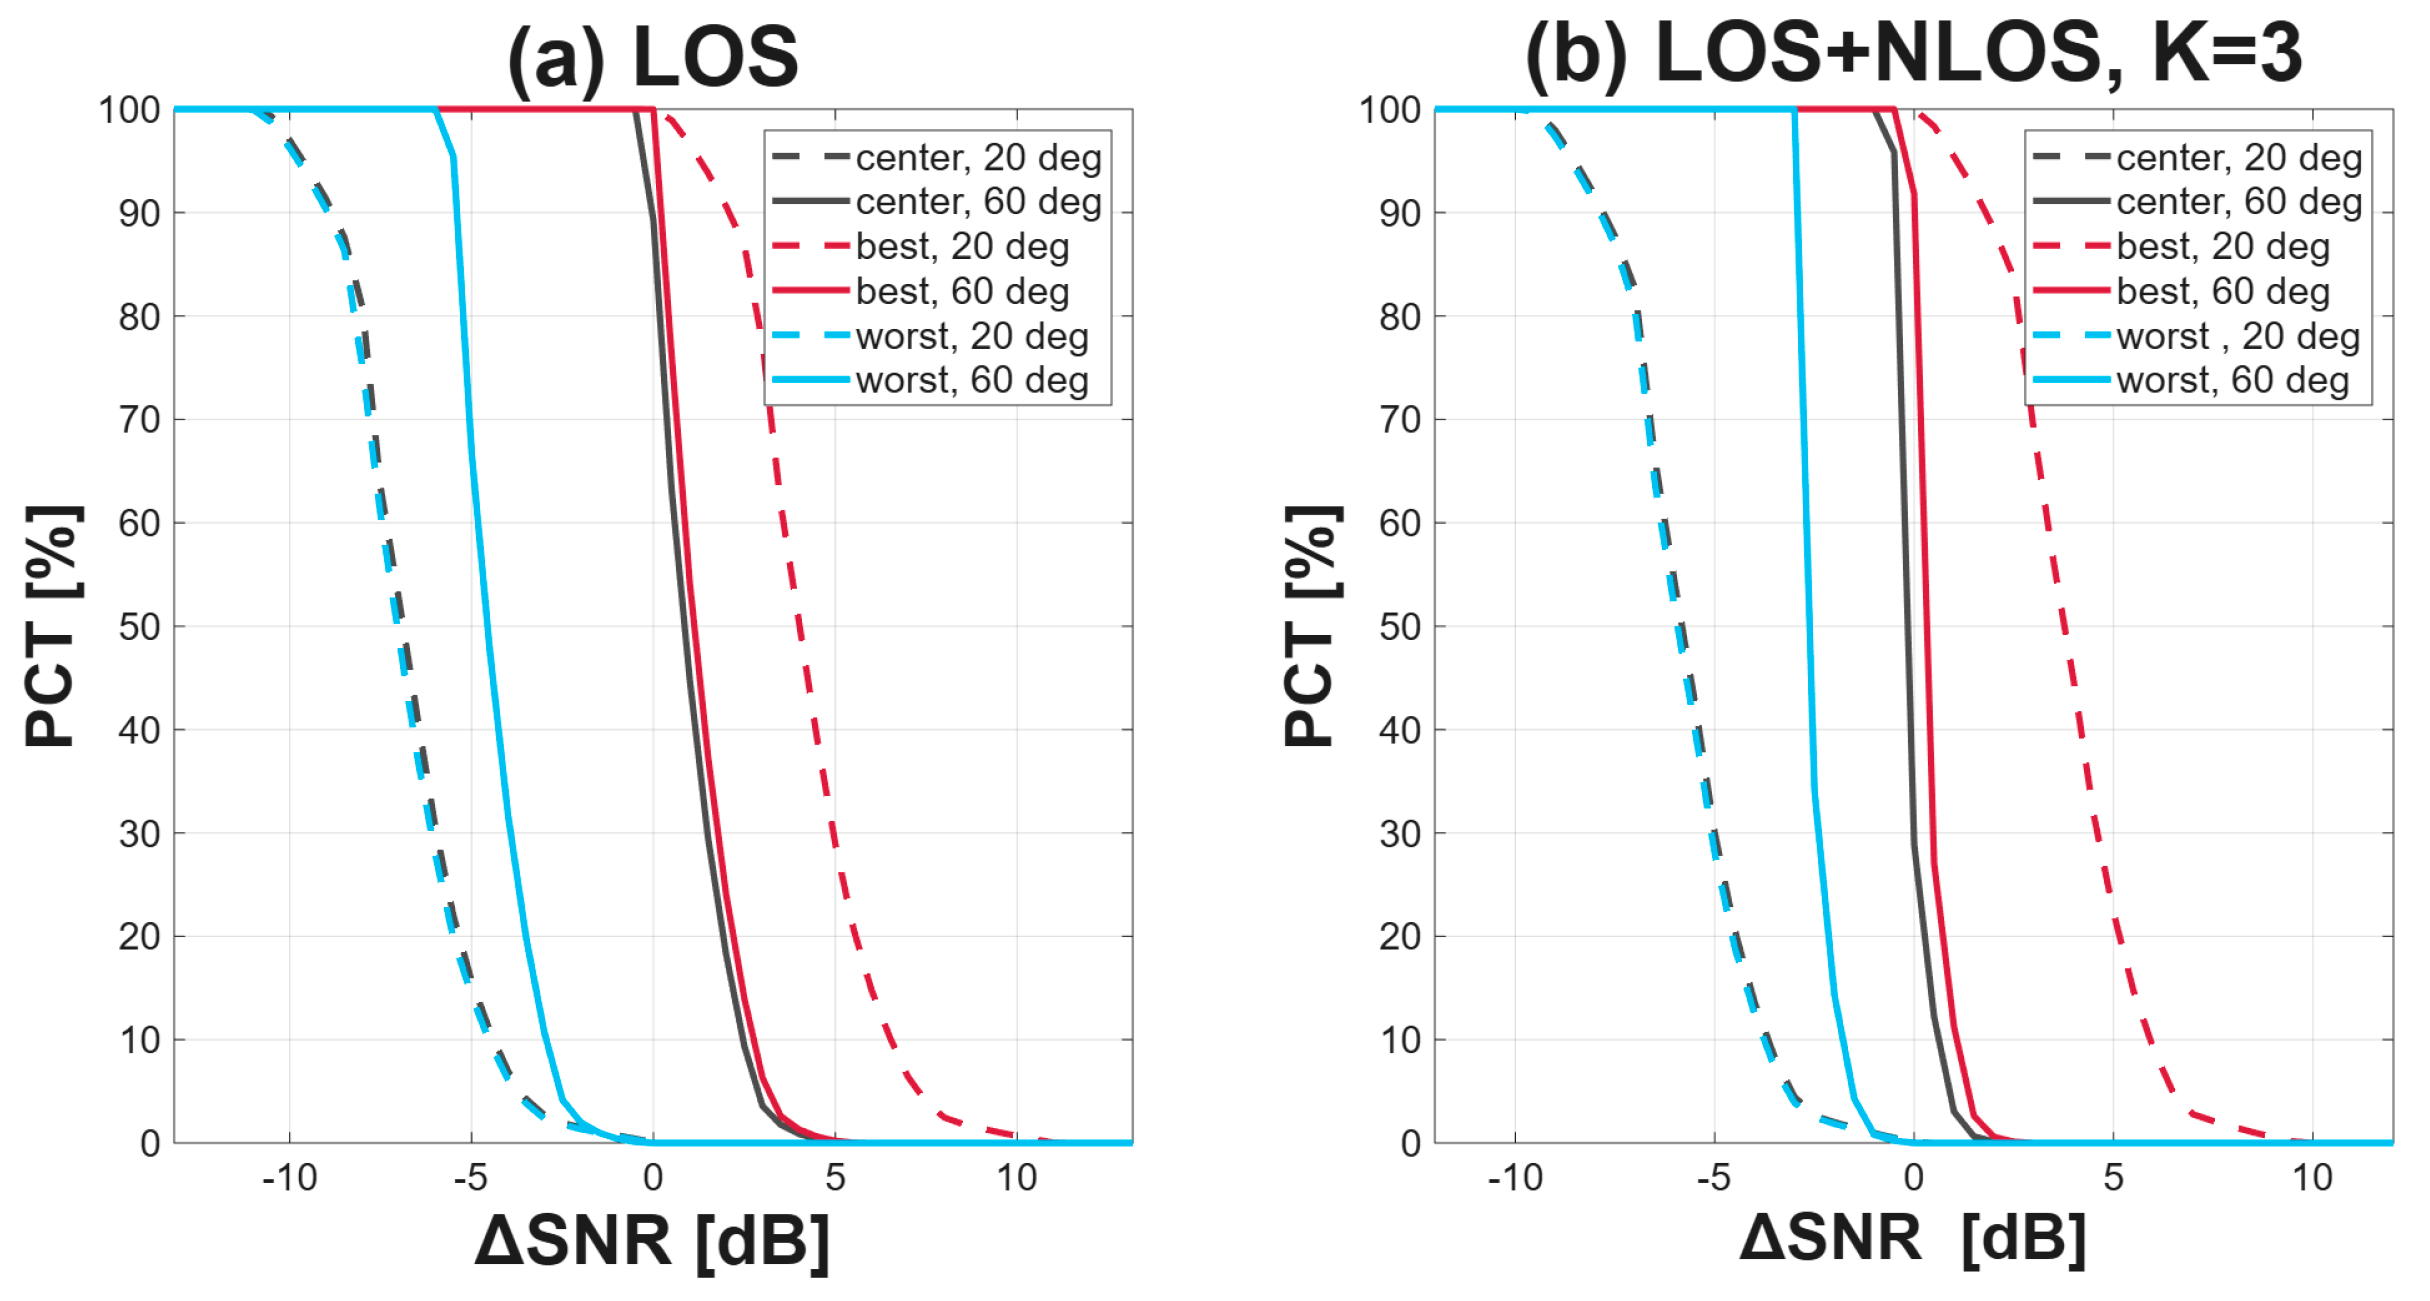
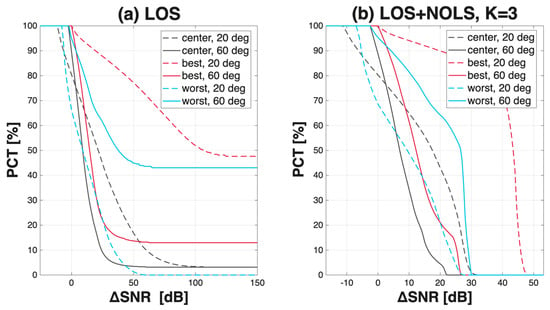
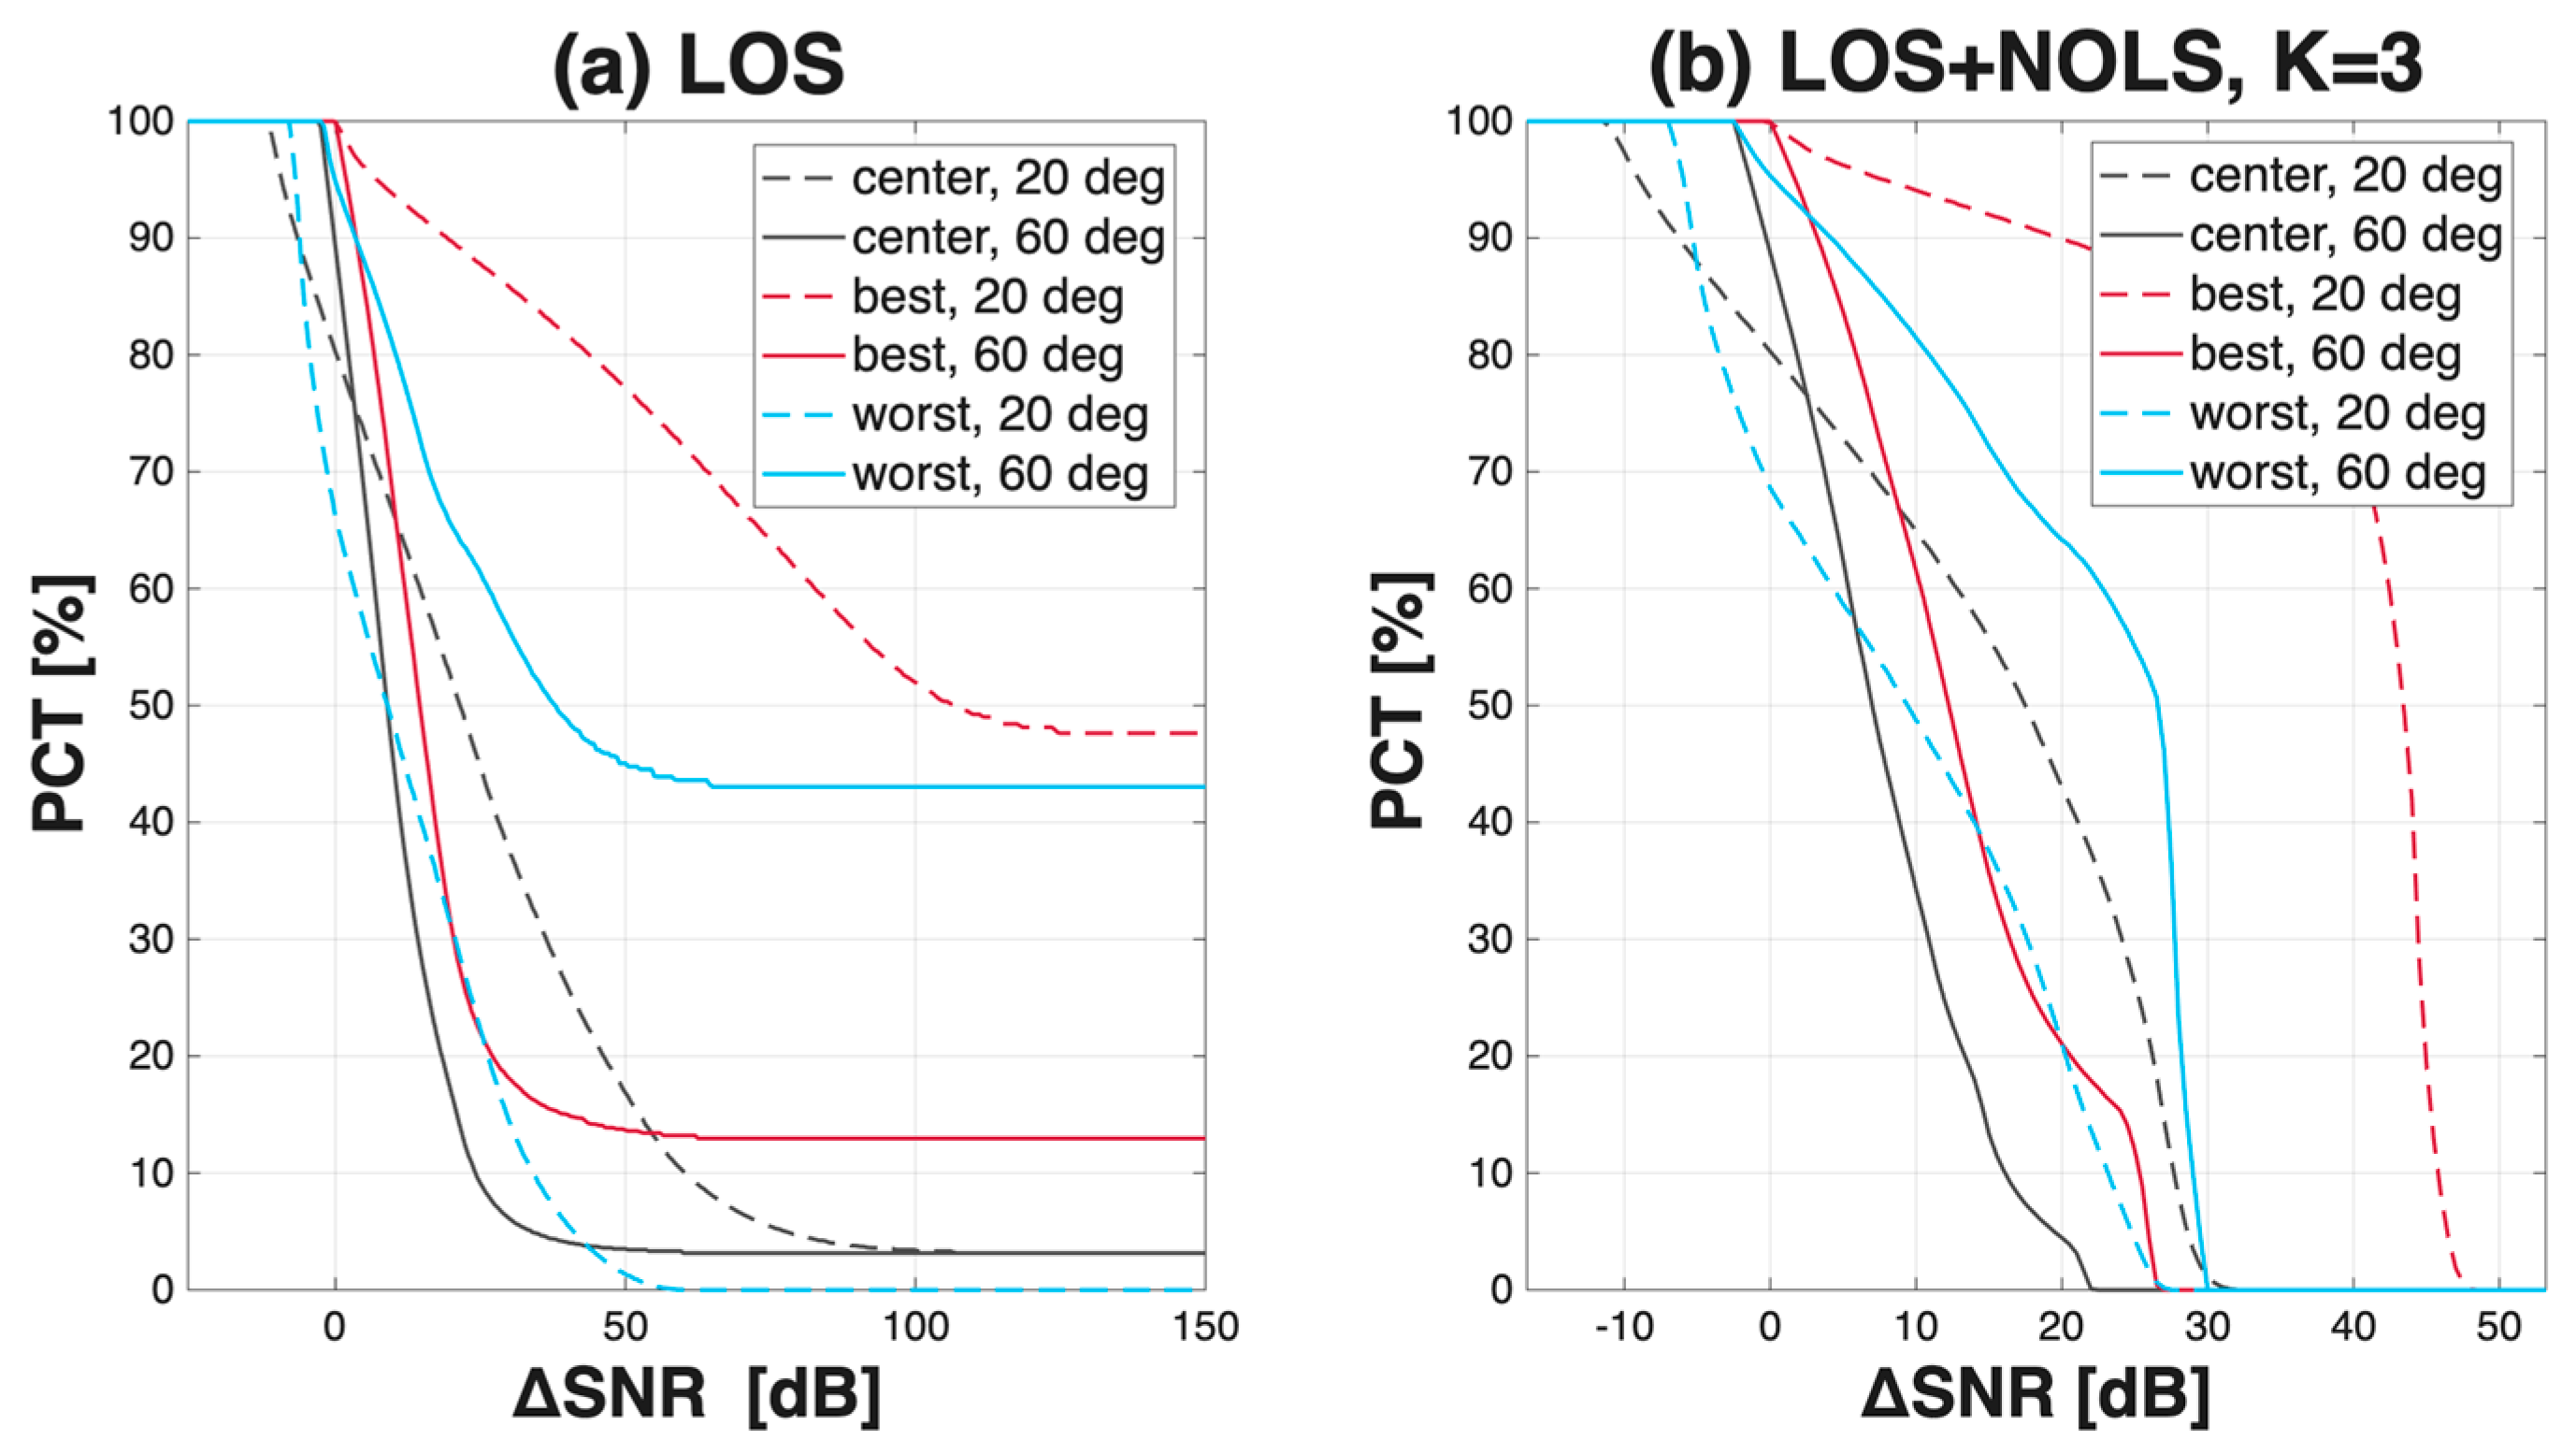
Figure 3 shows the complementary distribution of the SNR difference for Layout C, which is given alone as a representative example, and the values quoted below for the other two layouts come from the same computation rather than from the figure. Under the LOS model and with Bob at Bob’s best location, all three layout curves reach nearly 100% at 0 dB, and the layouts separate only at higher thresholds. At 20 the difference exceeds 10 dB over 88.4% of the valid set for Layout B and 69.4% for Layout A, against only 0.7% for Layout C.
Figure 3.
Complementary distribution PCT of the SNR difference over the valid receiver set under SISO for Layout C, at half-power semi-angles of 20 and 60 and the three Bob positions. (a) LOS only. (b) LOS + NLOS with K = 3.
The three Bob positions keep the same order in every layout, the best location always leading and the worst always trailing, but the advantage gained by moving from the worst location to the best differs by an order of magnitude. At 20 the average difference rises by 103.6 dB from the worst to the best location for Layout B and by 40.4 dB for Layout A, against only 11.1 dB for Layout C, which falls further to 5.7 dB at 60. This range measures how much the secrecy advantage depends on where the legitimate user stands. Under a concentrated layout that choice is decisive, whereas under a distributed grid one position is much like another, which is the spatial signature of the uniform illumination that Section 6.1 identified as the best for lighting.
Table 4 gives the average SNR difference by position and semi-angle. At 20 under the LOS-only model the best location reaches 8.81 dB for Layout A, 12.86 dB for Layout B and 3.85 dB for Layout C, and the difference decreases as the angle widens. For Layout B the best and center locations coincide at every angle.
Table 4.
SNR difference in dB at the three Bob positions under common SISO broadcasting with and without reflections.
Reflections do not reverse these differences. Adding the reflected component raises both SNRs, and in what follows the gain of a link means that increase, the value with reflections minus the value without, in dB. That gain varies enormously with position because the reflected field is nearly uniform while the direct field is not. Reflections deliver a comparable absolute amount of power everywhere, so where Bob already receives strong direct light the addition changes little, and where he receives almost none the reflected component becomes his entire signal. At Bob’s best location, Bob therefore gains only 0.21 dB for Layout A and 0.09 dB for Layout B, less than Eve gains, and the difference narrows by 0.24 and 0.16 dB. At Bob’s worst location he gains 11.2 and 59.4 dB, and the difference widens by 10.7 and 59.7 dB.
The spread of the difference across Bob’s positions therefore shrinks. At 20 the difference between his best and his worst location falls from 103.1 to 43.8 dB for Layout B and from 40.4 to 29.4 dB for Layout A. The two ends move for opposite reasons. Where the difference was negative Bob was receiving little direct light, so the reflected component raises his own SNR by far more than it raises Eve’s average, and the difference at that position rises. Where the difference was positive Bob was already well lit by direct light and gains little, so the same reflected component can be beneficial for Eve instead and the difference falls.
The narrowing does not alter the conclusions drawn from the LOS-only model. The worst location remains negative for every layout at every semi-angle, so reflections never turn an unusable position into a usable one, the worst location of Layout B moving only from −90.8 to −31.1 dB at 20. The ordering between the layouts also survives. With reflections included the best location gives 12.7 dB for Layout B, 8.6 dB for Layout A and 3.6 dB for Layout C at 20, so the more uniform the illumination the smaller the difference. Layout C is, in addition, the layout with the most positions at which the difference is negative, its center falling from 1.0 to −0.1 dB at 60, where Eve’s average SNR gain exceeds Bob’s SNR gain, while the center of Layout A stays positive at the same angle.
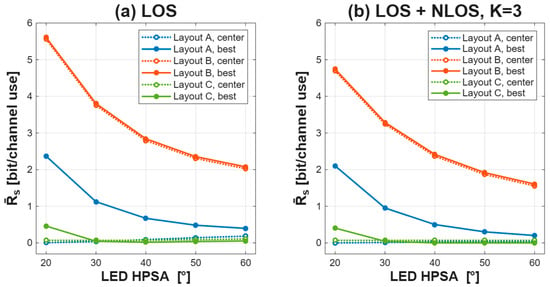
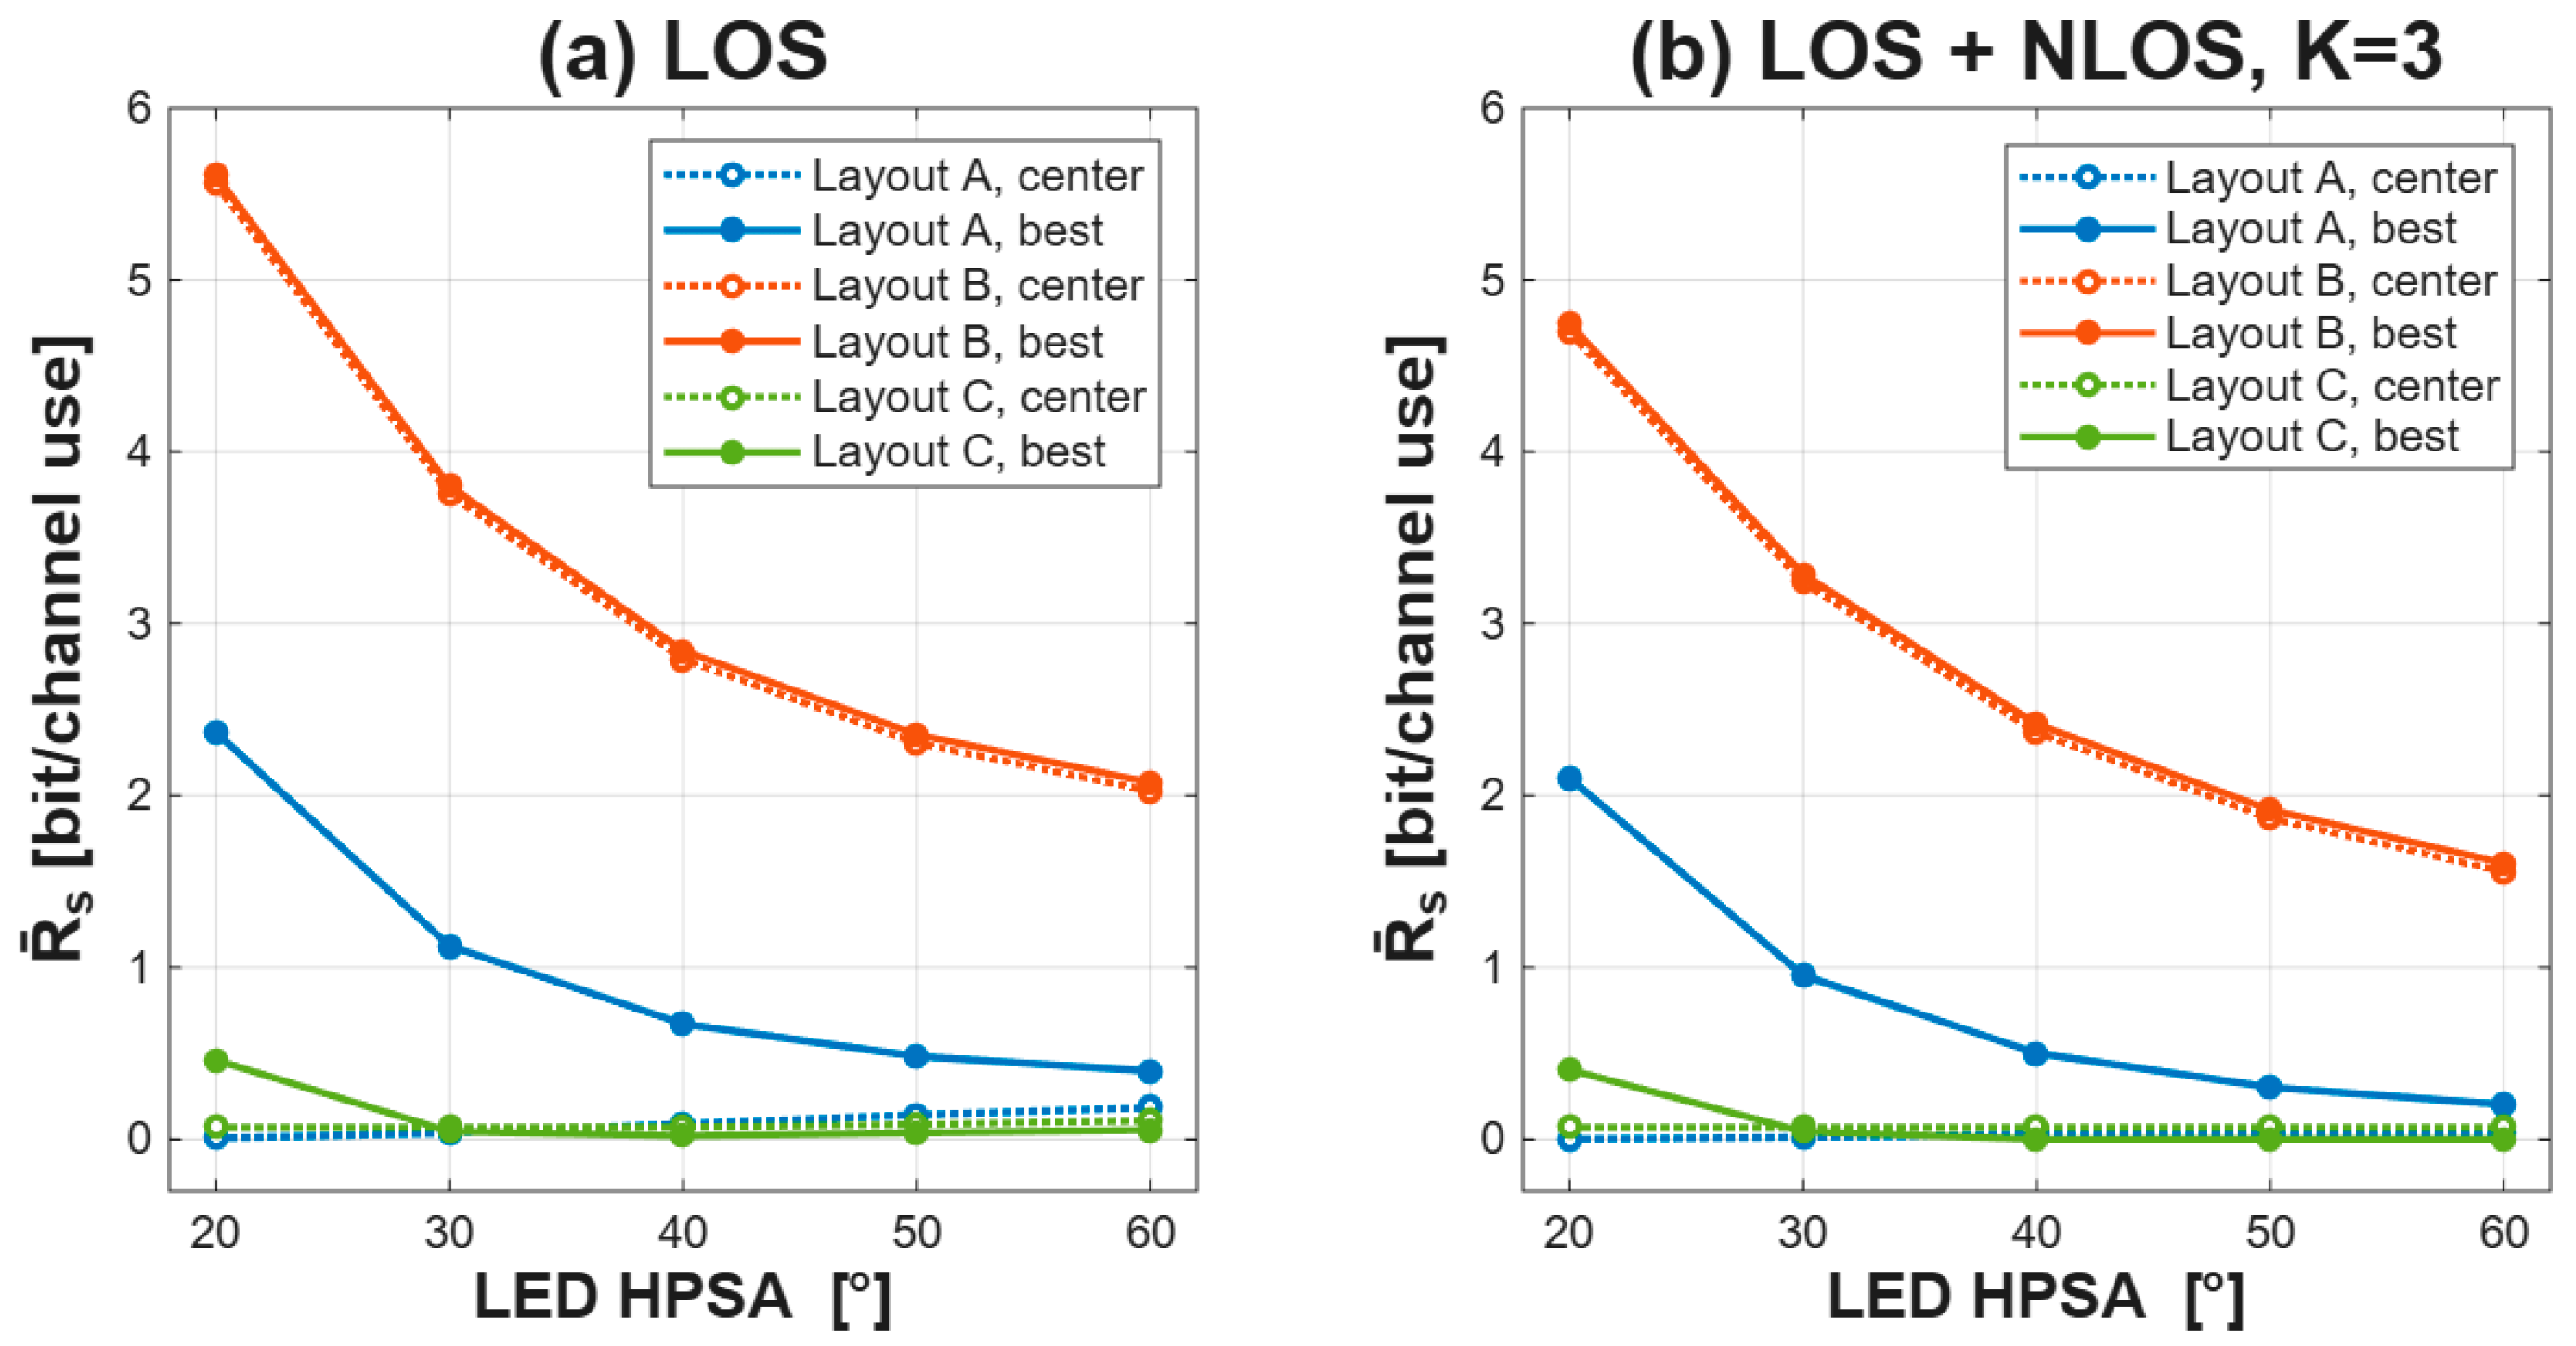
Figure 4 shows the average secrecy rate against the semi-angle. The worst location gives exactly zero for all three layouts at every angle in both models. Under the LOS-only model the rate at the best location falls monotonically with the semi-angle for Layouts A and B, because a wider beam reduces the illuminance contrast on which Bob’s advantage relies. It goes from 5.61 to 2.08 bit per channel use for Layout B and from 2.37 to 0.40 for Layout A. Layout B stays above 1 bit at every angle, whereas Layout A does so only at 20 and 30. The center location moves the other way, rising from 0.007 to 0.184 for Layout A, yet even at 60 it stays below the rate of 0.397 at the best location. Layout C never reaches a usable rate, giving 0.46 at 20 and below 0.045 from 30 onward.
Figure 4.
Average secrecy rate under SISO against the half-power semi-angle for the three layouts and the three Bob positions. (a) LOS only. (b) LOS + NLOS with K = 3. The best and the worst locations are determined separately at each semi-angle, so a single curve may follow different points as the angle changes. In Layout B the center and the best location are the same point, since the single central cluster places the illuminance maximum at the room center, so the two curves of that layout coincide.
With reflections included, the ordering of the layouts and the monotone decrease with the angle are preserved, but every curve lies below its LOS-only counterpart. The best location of Layout B falls from 4.74 at 20 to 1.60 at 60 and that of Layout A from 2.10 to 0.20, while Layout C falls from 0.40 bit per channel use at 20 to 0.0008 at 40 and stays below 0.0013 beyond that, and its center location is lower still, exactly zero at 20 and 30 and never above 0.0004 at the wider angles.
A positive SNR difference is necessary but not sufficient. The best location of Layout C has a positive difference at every angle yet a rate of only 0.46 bit per channel use at 20, and the center of Layout A has a positive difference only at 60, where the rate reaches 0.184. The two metrics answer different questions. The difference measures how far Bob’s channel stands above the average eavesdropping channel and is dominated by the brightest eavesdropping positions, whereas the average rate, clipped at zero by the positive part in (9), receives no contribution from the positions at which Eve is advantaged. The average secrecy rate is the rate that can be expected when Eve’s position is unknown, and it reflects both the extent of the region in which secure transmission is possible and the rate achievable there. The rate is the quantity a design must maximize, since it states in bits what can be transmitted secretly, while the difference only states how asymmetric the two channels are and does not translate that asymmetry into bits. A difference can stay comfortably positive where almost nothing can be sent in secret, as the best location of Layout C shows, whereas a secrecy rate cannot be positive without a real advantage behind it. The difference is therefore reported throughout as a diagnostic, and every design choice in this paper is made on the secrecy rate.
6.3. Spatially Confined Data Transmission (SCDT)
In SCDT, only the luminaire positions inside a window centered on Bob carry the data signal, and the half-width is swept from 1 to 75.
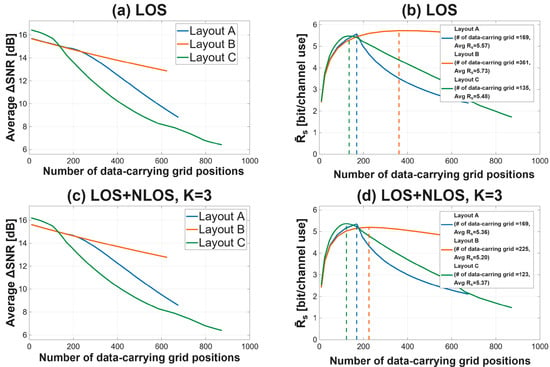
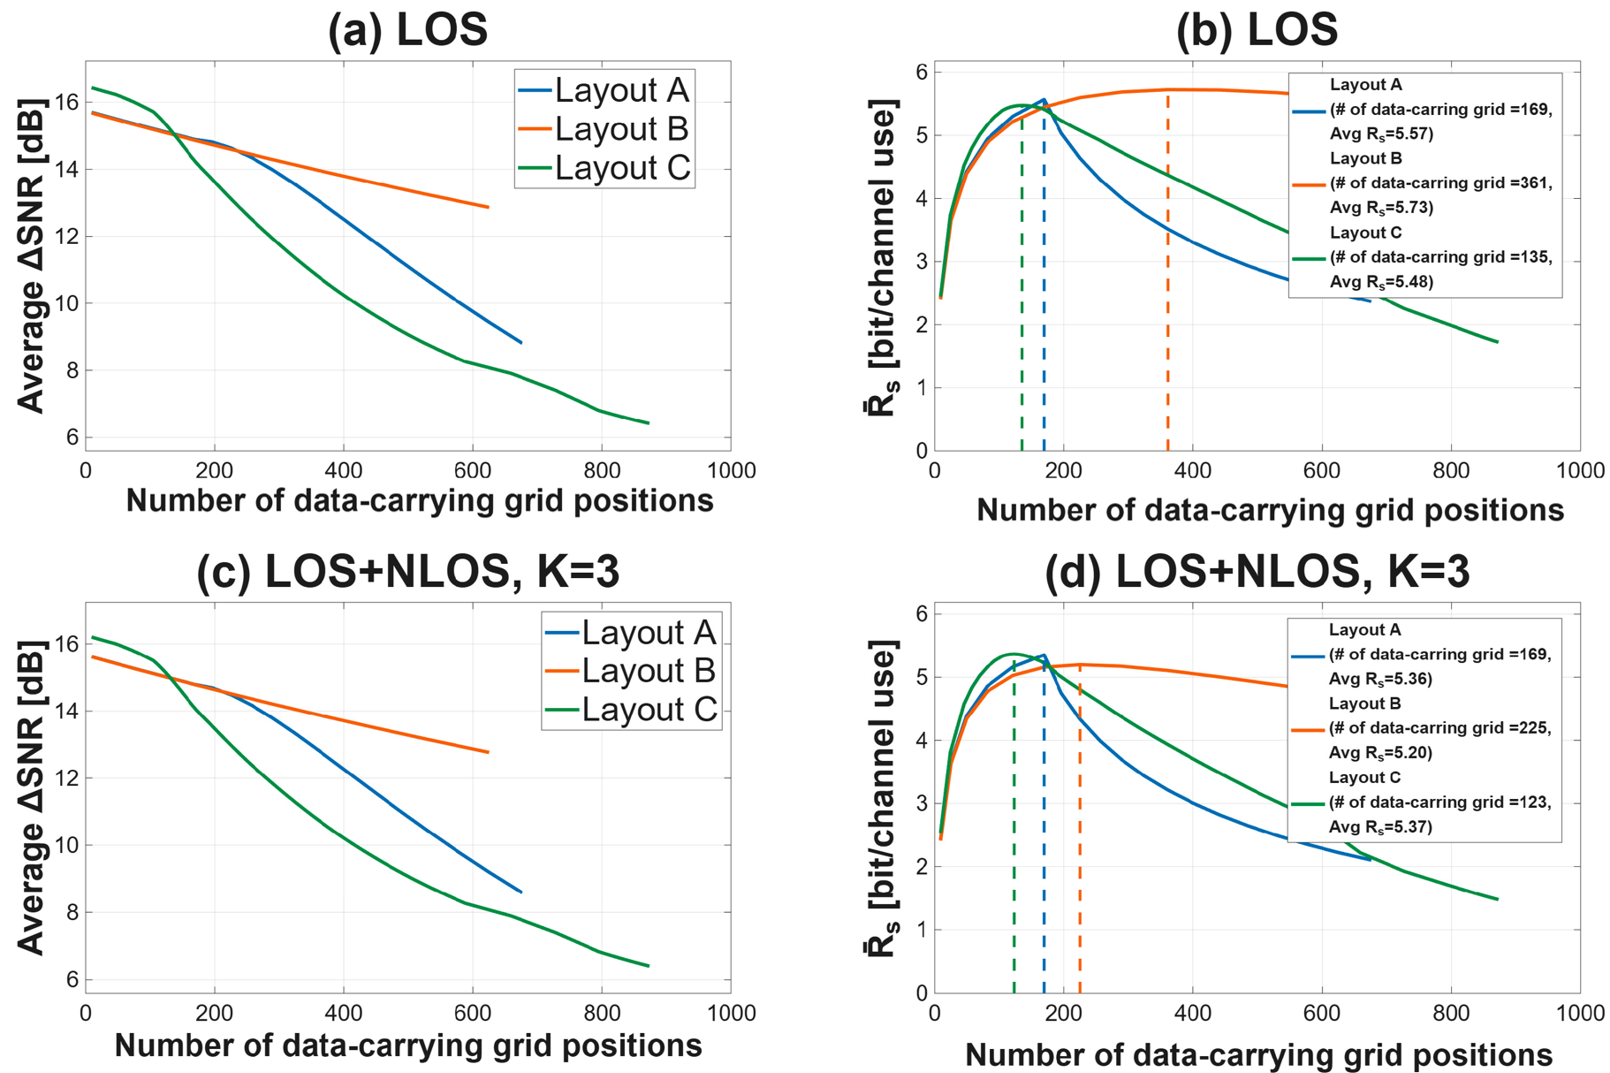
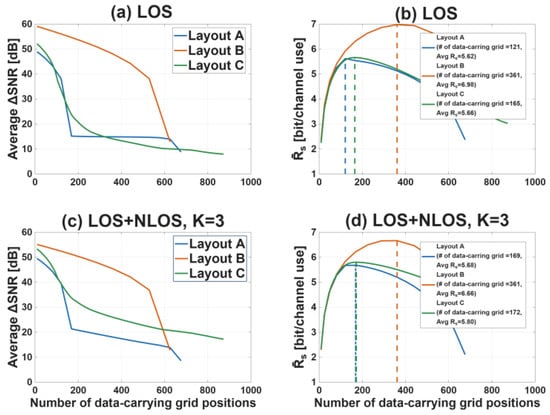
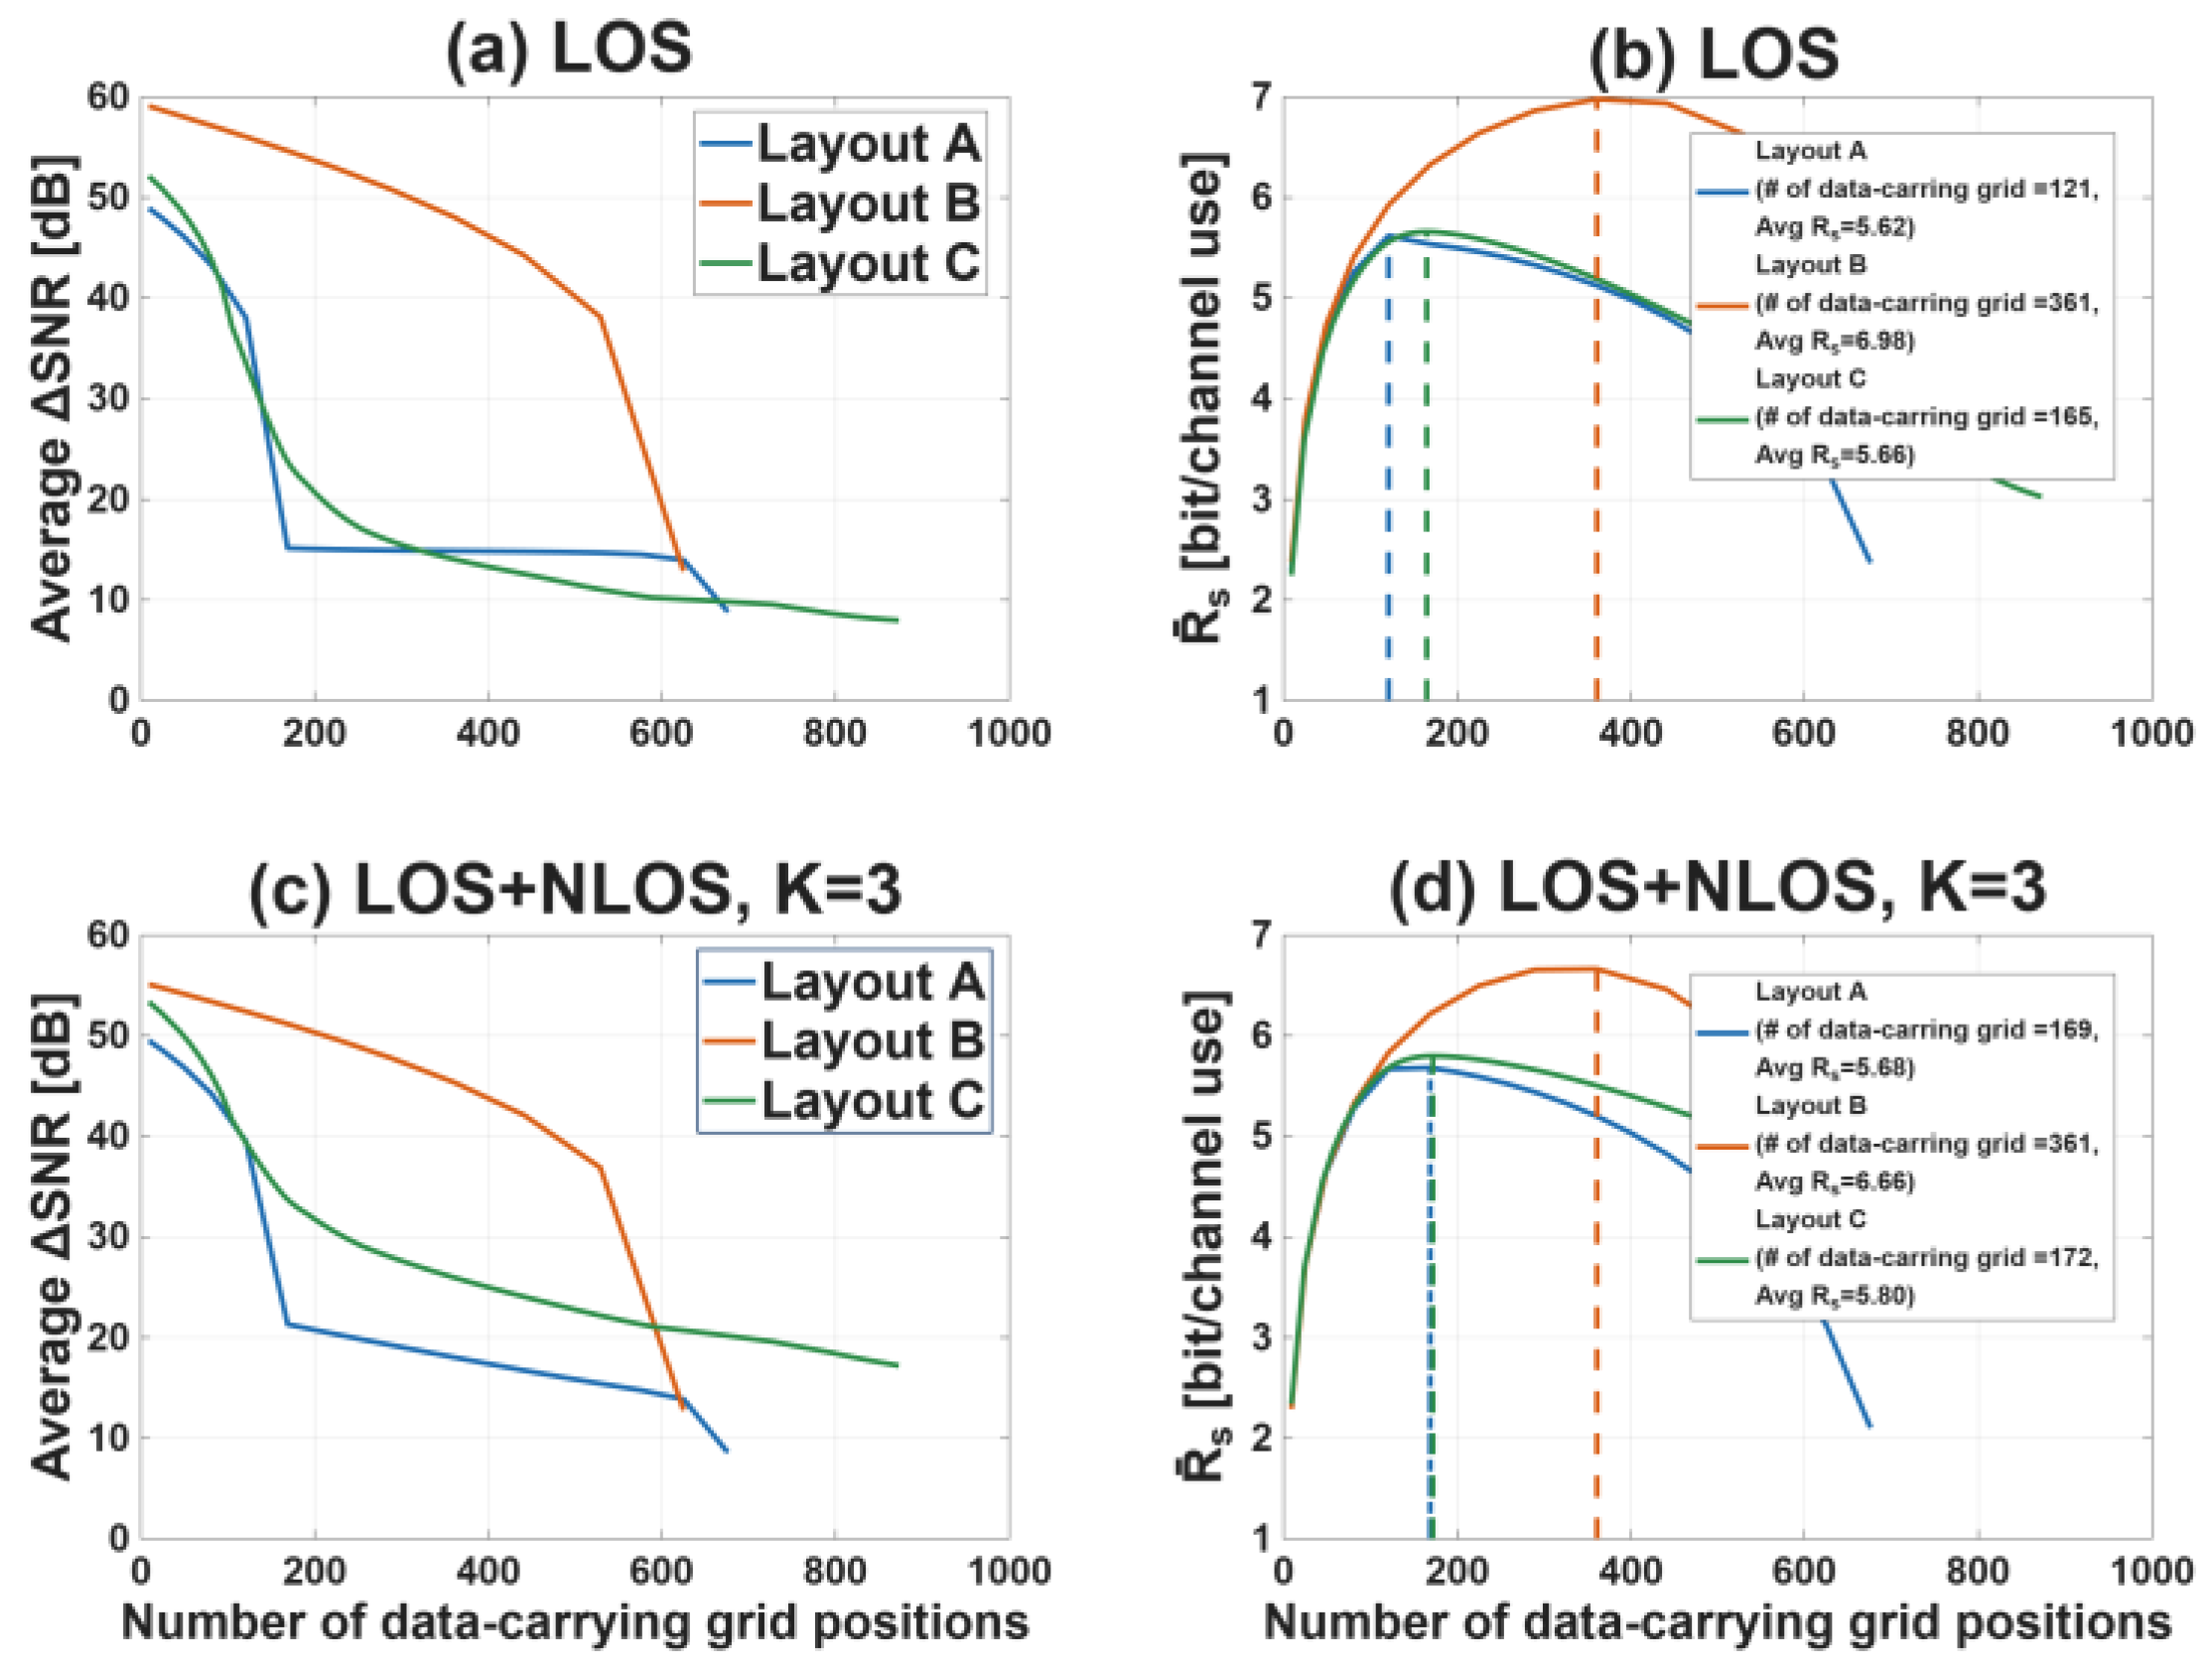
Figure 5 shows the sweep. The two criteria point in opposite directions from the start. For Layout A at the best location and 20, the difference is largest at the smallest window that carries data, 15.70 dB at nine luminaire positions, and falls monotonically to 8.81 dB when all 676 transmit. The average secrecy rate instead peaks at 169 positions with 5.57 bit per channel use, where the difference has already dropped to 14.9 dB. The difference therefore has its maximum at the edge of the sweep rather than inside it, and that end point is not a usable design, since nine positions leave Bob at 21.44 dB and give 2.41 bit per channel use, barely above the 2.37 obtained by transmitting from every position.
Figure 5.
Data window sweeps for SCDT with Bob at his best location and a half-power semi-angle of 20. (a) Average SNR difference, LOS only. (b) Average secrecy rate, LOS only. (c) Average SNR difference, LOS + NLOS with K = 3. (d) Average secrecy rate, LOS + NLOS with K = 3. The dash-dot vertical lines mark the optimal window of each layout, labeled with the number of data-carrying grid positions and the secrecy rate at that point.
The reason for the interior peak is visible in Bob’s own SNR. It rises from 21.44 dB at nine positions to 45.49 dB at 169, which is exactly the 13 × 13 cluster above him, and then stops changing, because at 20 the three remaining clusters 2.5 m away contribute nothing to him. Every position added beyond 169 therefore leaves his SNR untouched while carrying the data further into the room, so the rate falls to 2.37 bit per channel use with his SNR fixed. Layout B has no neighboring cluster and peaks at 361 positions with 5.73, and Layout C at 135 with 5.48. The optima for Layouts A, B and C occur at 169, 361 and 135 data-carrying positions, respectively.
Reflections lower the peak capacity and shift the optimal point toward smaller windows. For Layout B the optimum moves from 361 to 225 positions and for Layout C from 135 to 123, whereas for Layout A it stays at 169 because that window is exactly the cluster above Bob.
Under the LOS-only model the PCT curves at the optimal window end in a flat plateau instead of falling to zero, because an Eve outside the coverage of the window receives no data power at all and her SNR is fixed at the numerical floor. The height of the plateau is the fraction of the room the window does not reach, about 29% for Layout A at the best location and 20. Reflections remove these plateaus completely, since the reflected part of the confined signal reaches every point of the room.
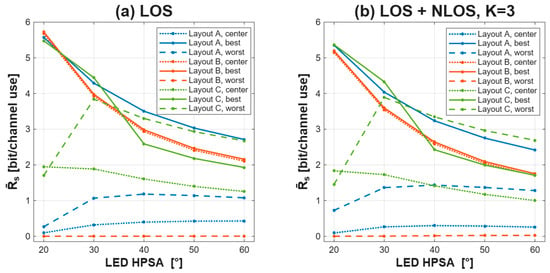
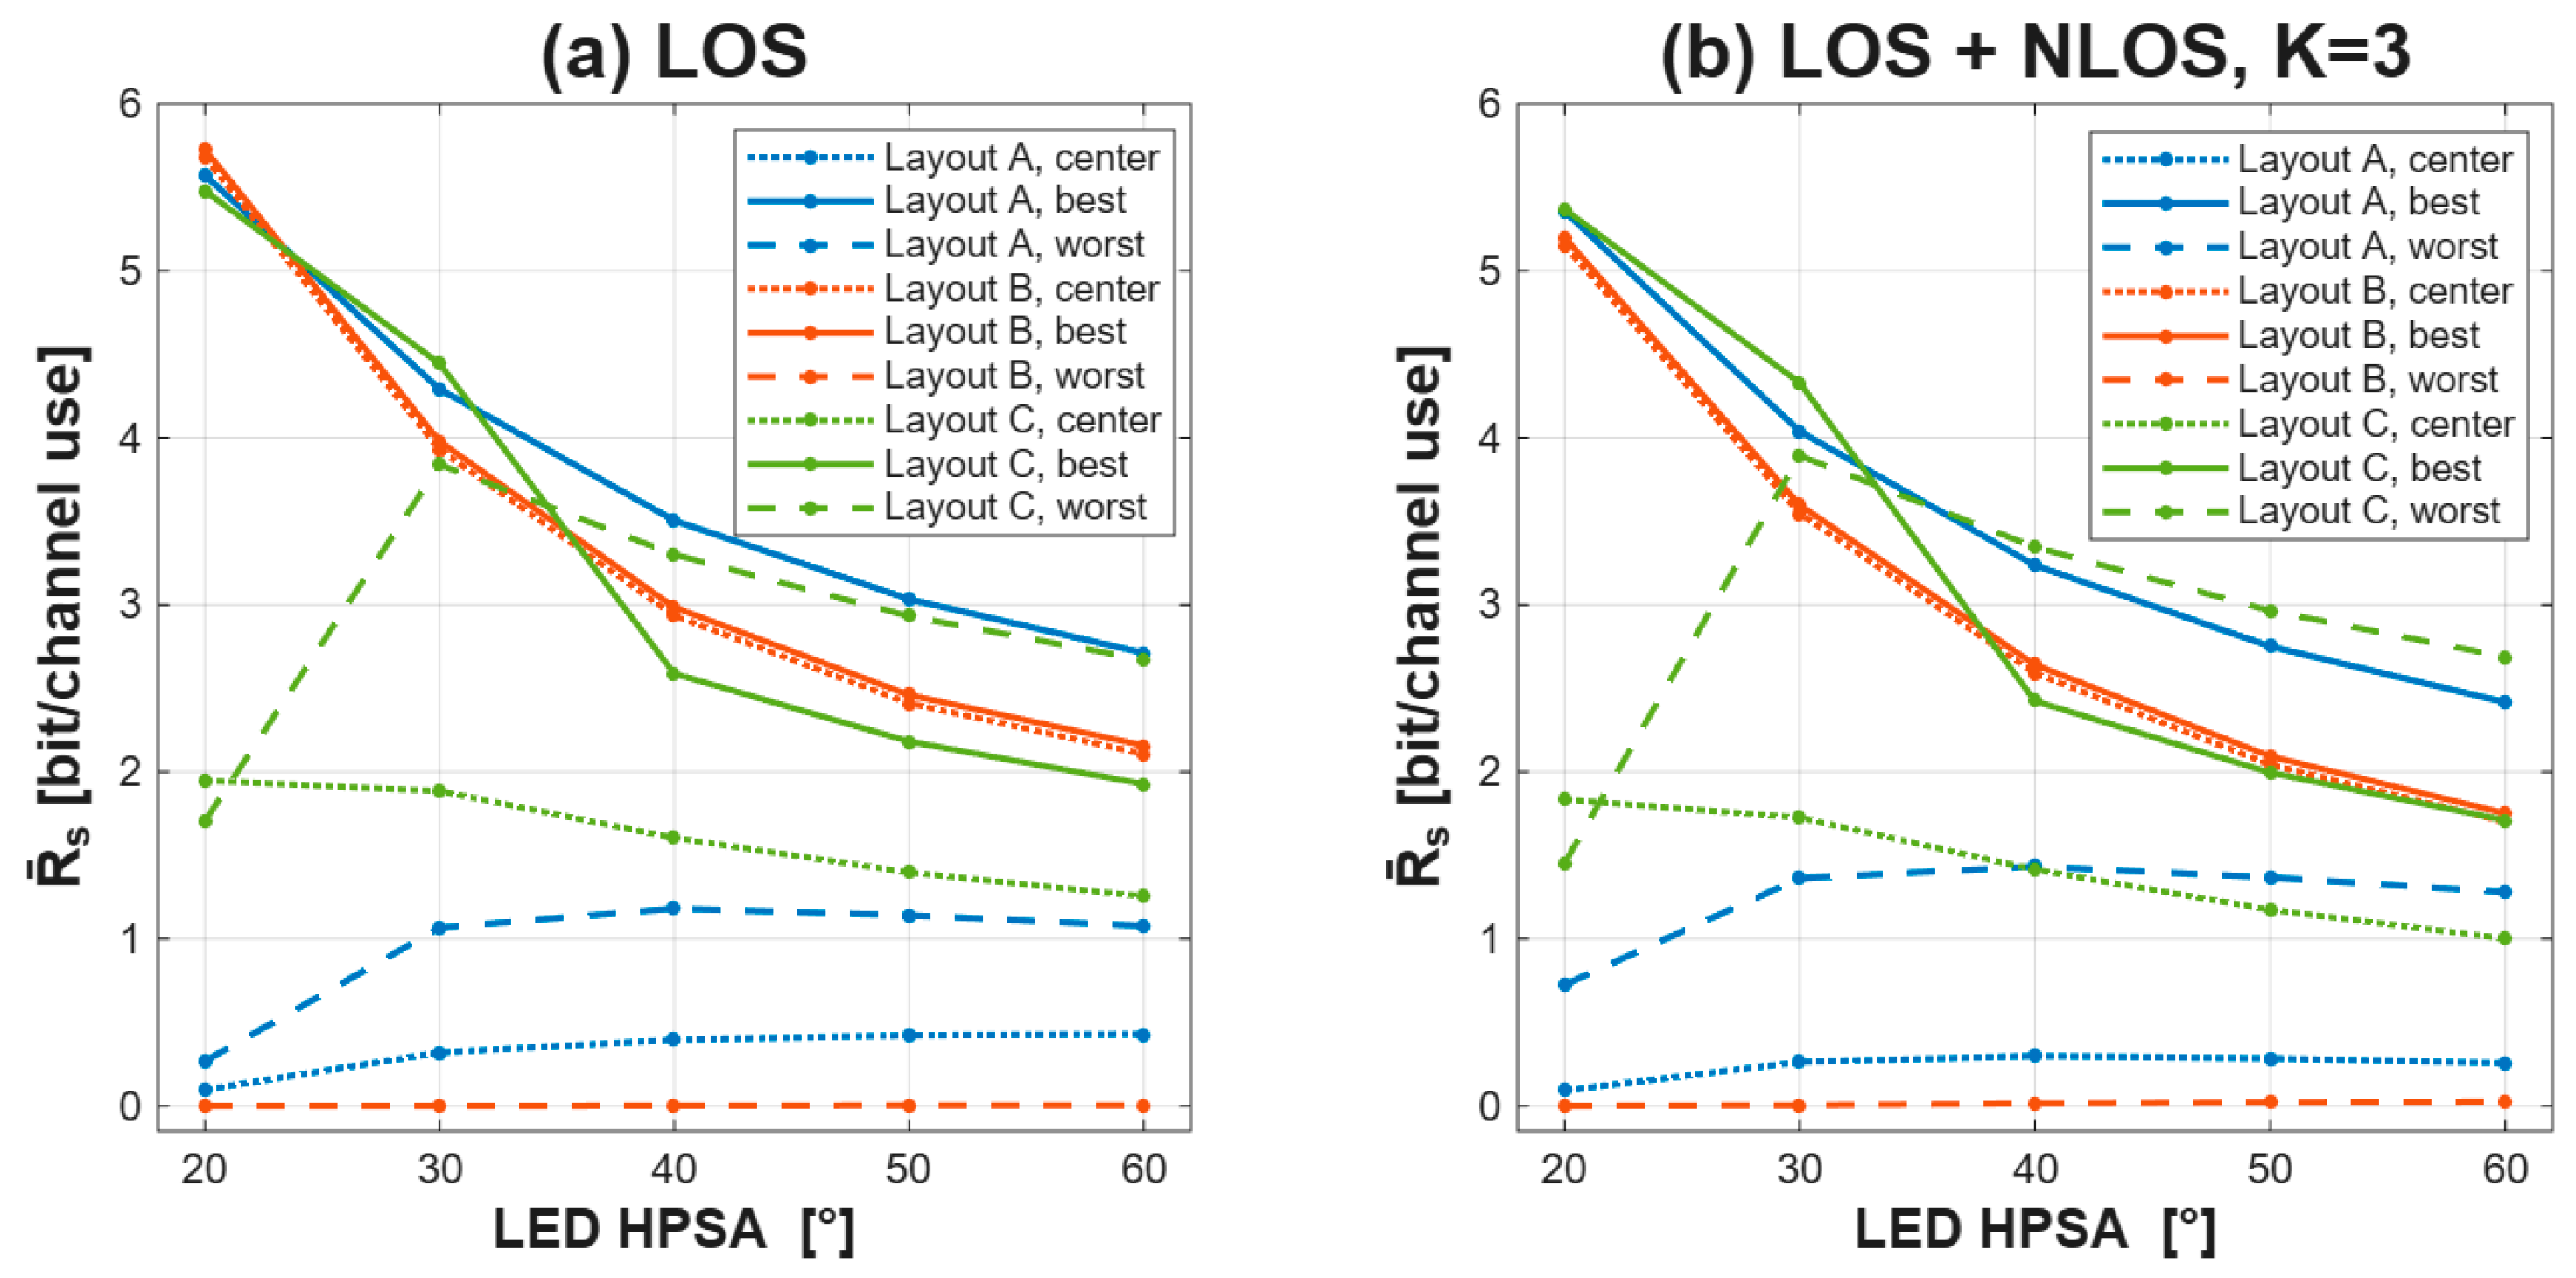
Figure 6 and Figure 7 show how the PCT and the rate vary with the semi-angle, respectively. At the best location the three layouts almost coincide and fall together, from 5.57, 5.72 and 5.47 bit per channel use at 20 to 2.71, 2.16 and 1.93 at 60. The separation that dominated SISO has gone, because each layout is given the window around Bob that is optimal for it. The number of data-carrying positions in those windows differs considerably, 169, 361 and 135 at 20, yet they deliver almost the same rate.
Figure 6.
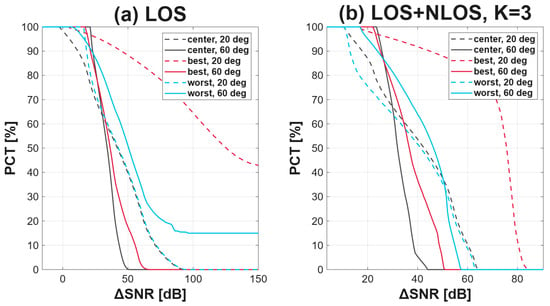
Complementary distribution PCT of the SNR difference under SCDT for Layout C, evaluated at the optimal window of each configuration, at half-power semi-angles of 20 and 60 and the three Bob positions. (a) LOS only. (b) LOS + NLOS with K = 3.
Figure 7.
Average secrecy rate under SCDT against the half-power semi-angle, for the three layouts and the three Bob positions at the optimal window of each configuration. (a) LOS only, (b) LOS + NLOS with K = 3. The best and worst locations are determined from the illuminance separately at each angle, so a single curve may follow different points.
The layouts are differ in performance at the worst location. Layout A rises from 0.27 bit per channel use at 20 to about 1.1 from 30 onward, and Layout C reaches 3.84 at 30. Layout B stays at essentially zero at every angle. Its luminaires are confined to the room center, so a window centered on a corner catches only 36 positions at the edge of the cluster and leaves Bob at −50.7 dB. Confinement can only switch luminaires off, so Bob’s SNR can never exceed the −50.3 dB he receives with all 625 positions on, and no choice of window helps.
The rise of Layout C between 20 and 30 reflects a move of the worst location itself. At 20 the darkest point of that layout is the room center, where a window around Bob still leaves data reaching most of the room, whereas from 30 it is the corner, where the same window confines the data to one corner and leaves the rest of the plane dark.
Reflections lower the best curves but leave the shape of the picture unchanged, and the loss is far smaller than under SISO. At 20 the best location gives up 3.9% of its LOS-only rate for Layout A, 9.2% for Layout B and 2.0% for Layout C, against 11.2, 15.4 and 12.2% under SISO. At the worst location reflections help instead, raising Layout A from 0.27 to 0.72 bit per channel use at 20. Spatial confinement therefore keeps its benefit once the multipath component is included, and at the worst location it even gains from it.
Spatial confinement therefore addresses both weaknesses identified for SISO. It creates the asymmetry that a uniform layout cannot provide and makes it robust to multipath. At the best location and 20 with reflections, the rate of Layout C rises from 0.4 bit per channel use under SISO to 5.37 under SCDT, bringing the weakest layout under common broadcasting to within 0.2 bit of the strongest.
6.4. SCDT with Artificial Noise
In SCDT-AN, every luminaire position outside the data window radiates an artificial-noise signal instead of the constant illumination current. The noise reaches the receiver plane through the same reflection model as the data signal, so Eve is characterized by a signal-to-interference-plus-noise ratio while Bob keeps the ordinary SNR.
Figure 8 shows the sweep. The average SNR difference, in the left column, is far larger under SCDT-AN over the whole useful range of window sizes, since every position outside the window lowers the eavesdropper signal-to-noise ratio without touching that of the legitimate receiver. At the optimal window with reflections, the average SNR difference reaches 21.3 dB for Layout A, 45.4 dB for Layout B and 33.5 dB for Layout C, against 14.8, 14.5 and 15.2 dB under SCDT.
Figure 8.
Data window sweeps for SCDT-AN with Bob at the best location and a half-power semi-angle of 20. (a) Average SNR difference, LOS only. (b) Average secrecy rate, LOS only. (c) Average SNR difference, LOS + NLOS with K = 3. (d) Average secrecy rate, LOS + NLOS with K = 3.
The secrecy rate, in the right column, does not follow that difference. Over the smallest windows the two schemes give almost the same rate although their SNR differences are more than 30 dB apart, because there the rate is limited by Bob’s own SNR and weakening Eve further cannot raise it. The curves separate as the window grows, and the optimum of SCDT-AN with reflections is both higher and wider, 5.68, 6.66 and 5.80 bit per channel use at 169, 361 and 172 data-carrying positions. Its width means the split between data and jamming positions need not be set precisely, and the optimum lies at a larger window than under SCDT for Layouts B and C, since the noise masks the leakage that widening the window would otherwise cause. For Layout A, whose window is the same under SCDT and SCDT-AN (169 positions), the AN raises the rate from 5.36 to 5.68 bit.
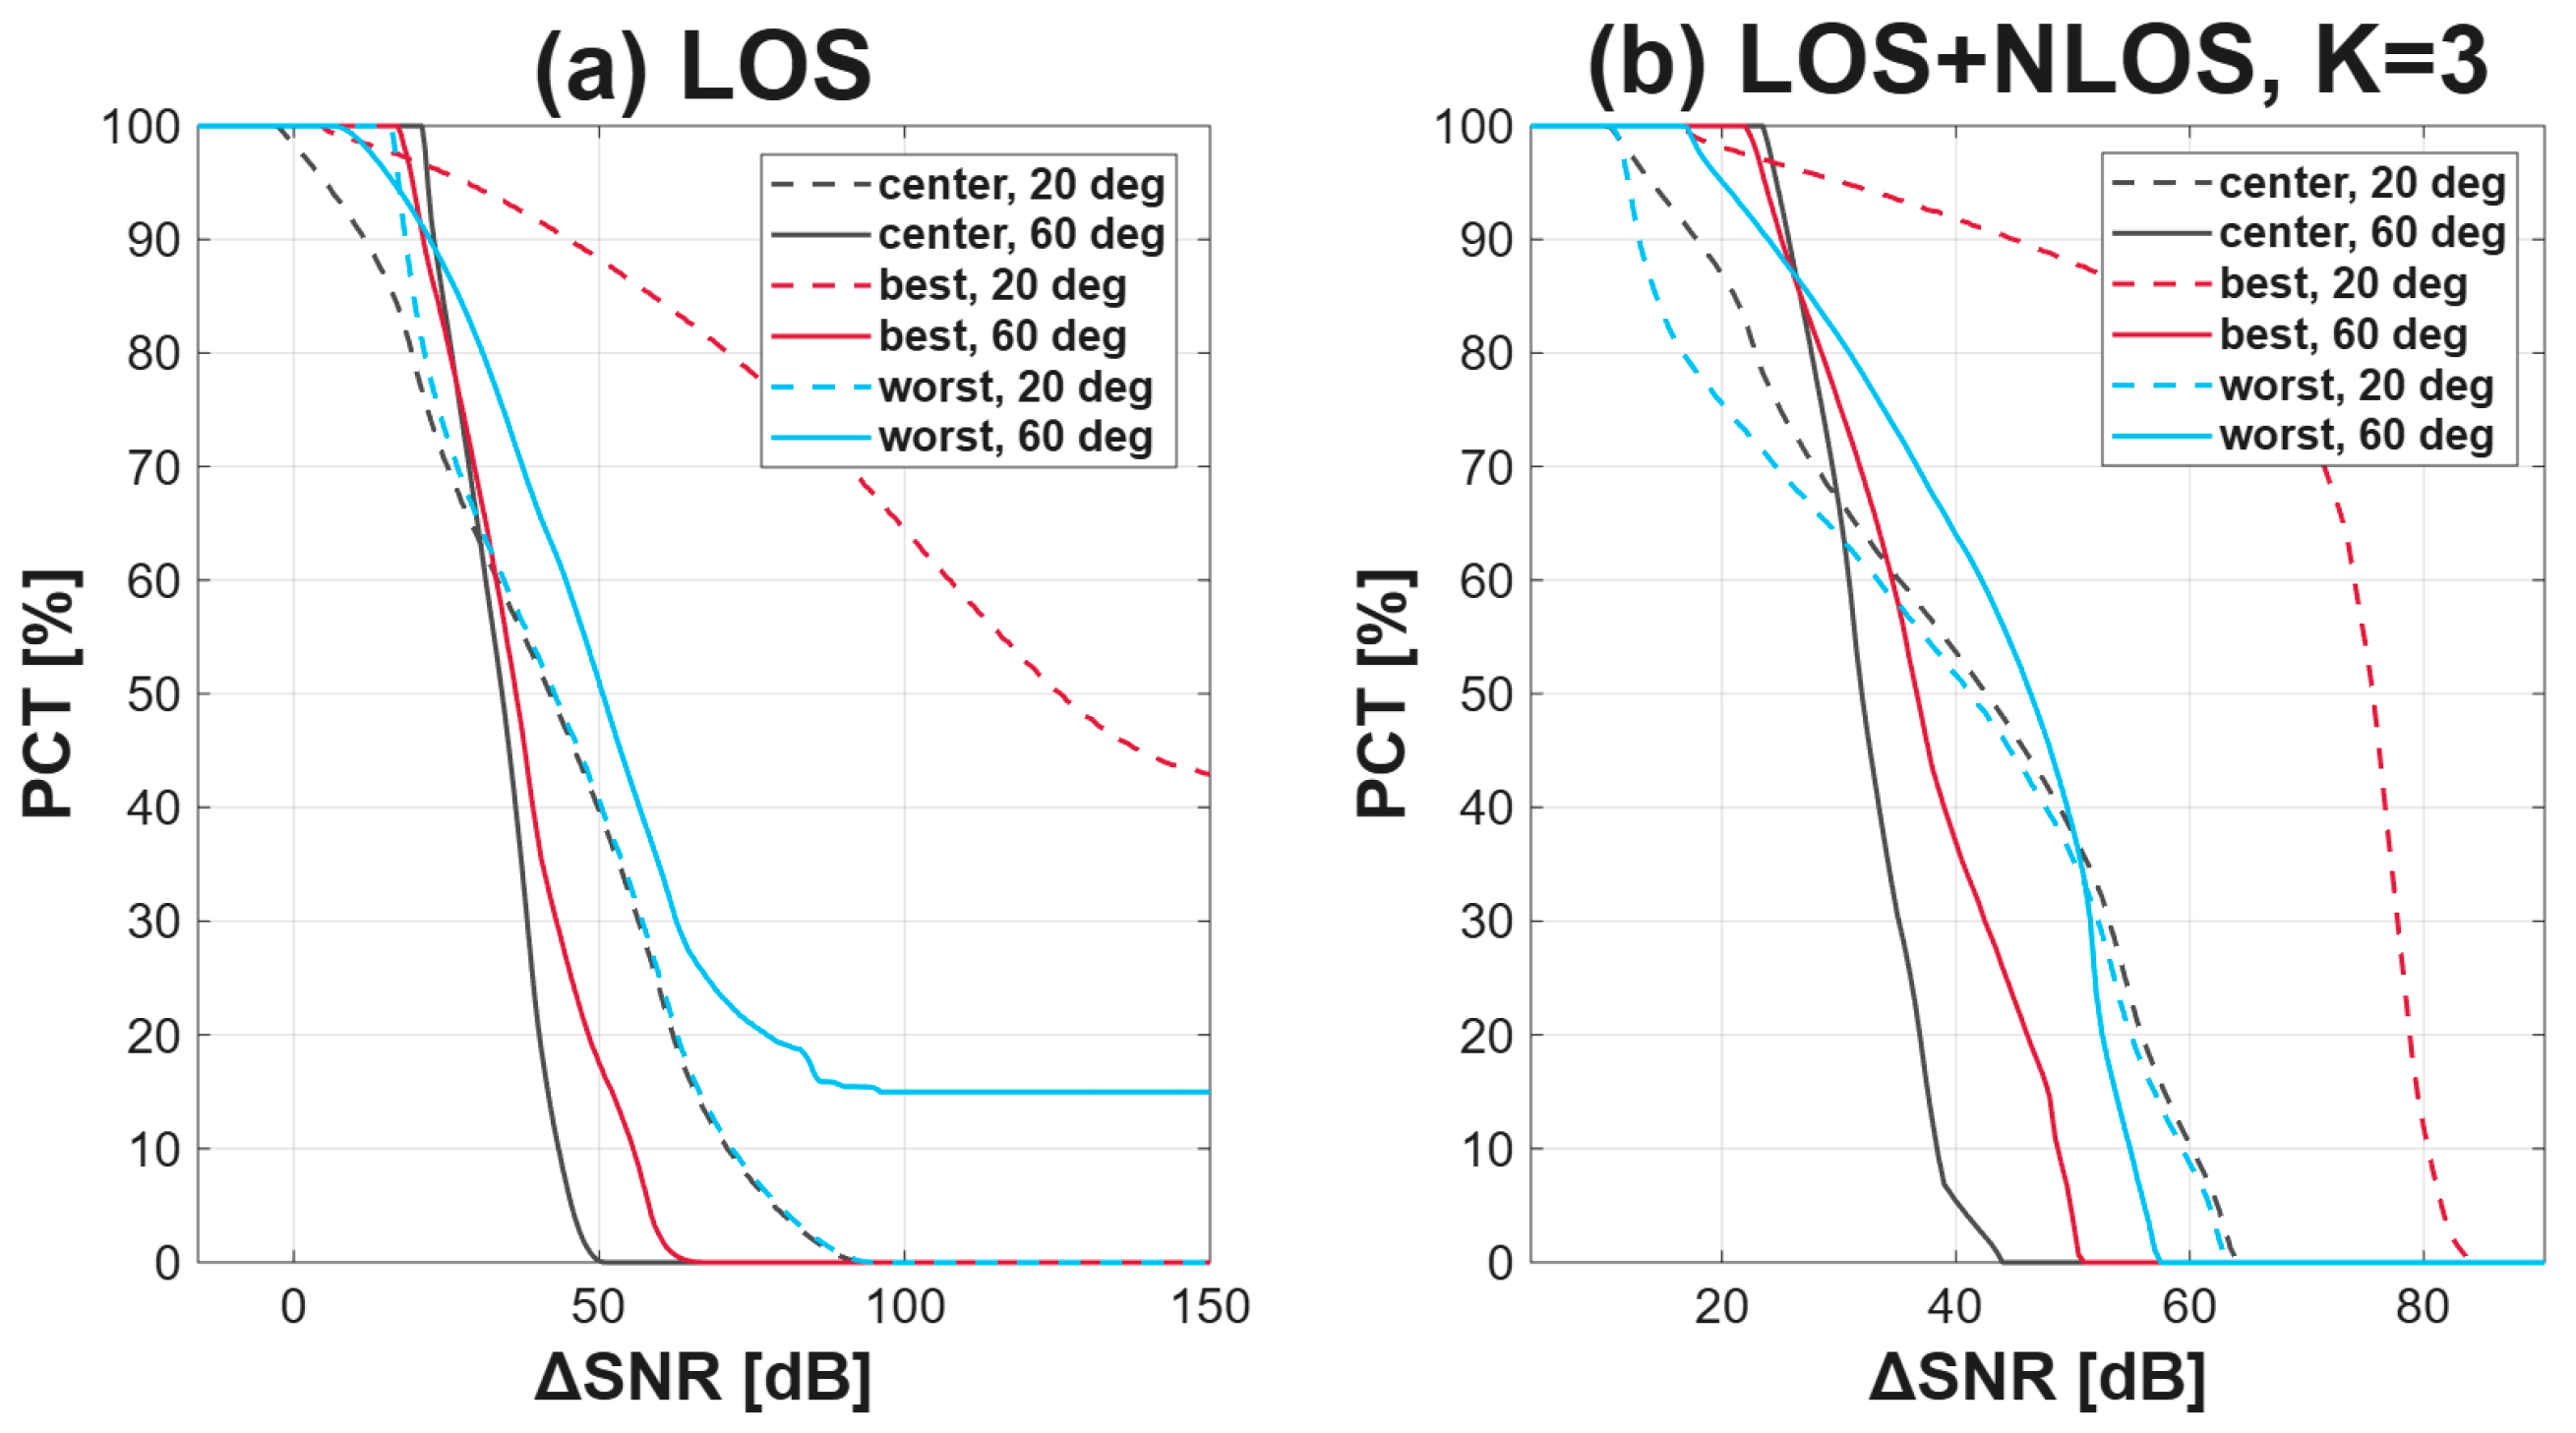
Figure 9 shows the distribution of the SNR difference under SCDT-AN for Layout C, to be compared with the SCDT distribution of Section 6.3. Jamming moves the whole distribution to much larger differences rather than lifting only its average. With reflections the curve for the best location falls to zero at about 51 dB at 60 and at about 84 dB at 20, whereas under SCDT the corresponding values were about 27 and 48 dB.
Figure 9.
Complementary distribution PCT of the SNR difference under SCDT-AN for Layout C, evaluated at the optimal window of each configuration, at half-power semi-angles of 20 and 60 and the three Bob positions. (a) LOS only. (b) LOS + NLOS with K = 3.
The flat tail height instead follows the size of the chosen window. The optimal window of SCDT-AN is the larger one for this layout, so fewer positions are left without any data signal and the tail of the worst location at 60 falls from 43.1 to about 15.0%. As in Section 6.3 the tails disappear once reflections are included, since every position then receives a weak but finite data signal.
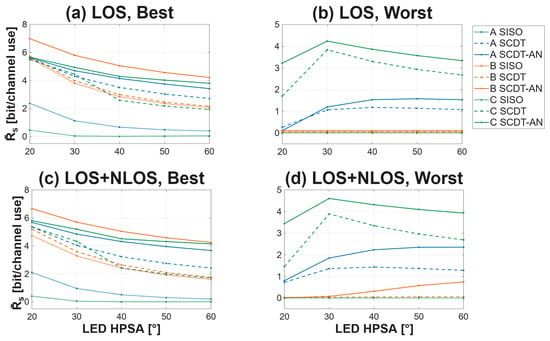
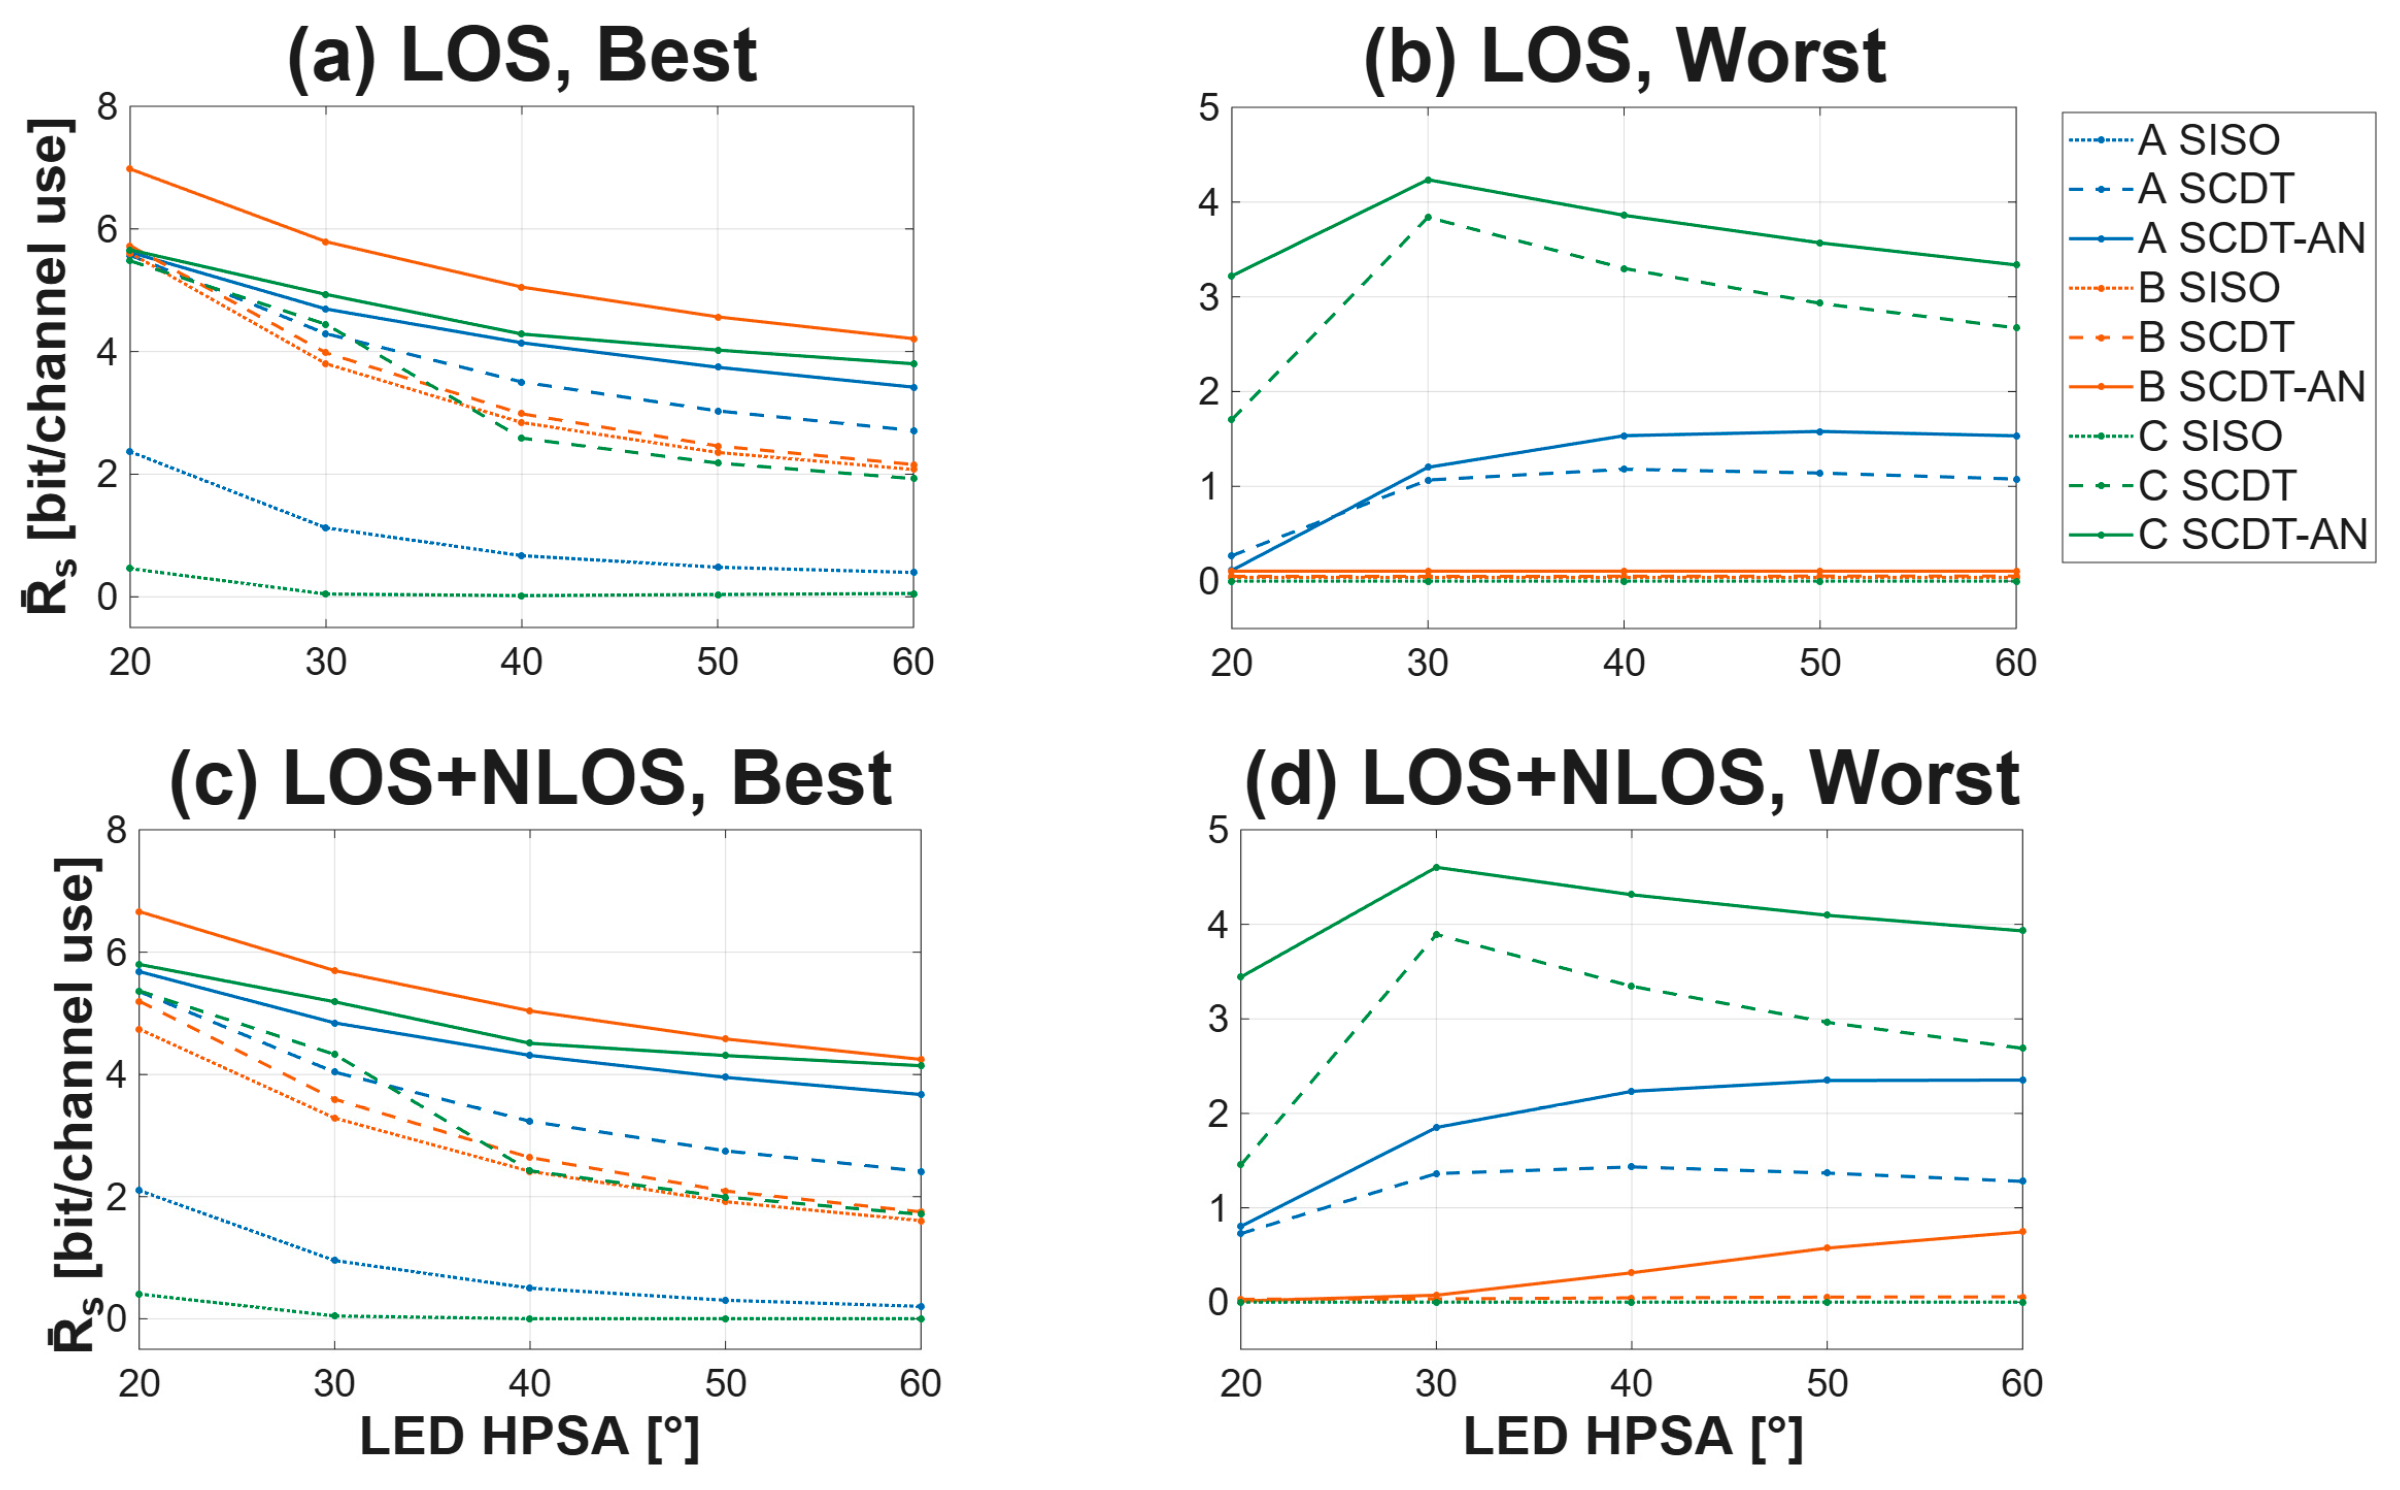
Figure 10 compares the three schemes across the full range of semi-angles. The ordering SISO, SCDT, SCDT-AN holds at every angle, for every layout and under both channel models. At the best location and 20 with reflections the rate of Layout A rises from 2.10 bit per channel use under SISO to 5.36 under SCDT and 5.68 under SCDT-AN, and Layout C, the weakest under common broadcasting at 0.40, reaches 5.36 and 5.80. Under SISO the layouts differ sharply, and the arrangement decides the outcome. Both schemes narrow that difference and raise the rate at the same time, so the choice of layout matters far less once the asymmetry is created by the transmission. The ordering between the layouts is not preserved either, each scheme rewriting it rather than keeping it. The difference between SCDT and SCDT-AN at the best location of Layout A widens with the semi-angle, from 0.33 bit per channel use at 20 to 1.26 at 60. Two effects act in the same direction. At a narrow semi-angle each luminaire concentrates its light beneath itself, so only light from the few jamming positions above Eve reaches her and their numerical majority is never brought to bear, whereas at a wide semi-angle every jamming position inside Eve’s field of view contributes, while the data still comes from the small set inside the window, so the jamming Eve receives grows faster than the data. At the same time the spatial confinement of SCDT itself weakens as the beams broaden, since every luminaire then illuminates the whole room, and the artificial noise takes over the role that the window can no longer play.
Figure 10.
Average secrecy rate of the three schemes against the half-power semi-angle. (a) Bob at his best location, LOS only. (b) Bob at his worst location, LOS only. (c) Bob at his best location, LOS + NLOS with K = 3. (d) Bob at his worst location, LOS + NLOS with K = 3. The best and worst locations are determined from the LOS illuminance of the full luminaire array as defined in Section 3, separately for each layout and semi-angle, so a single curve may follow different points as the angle changes. The same two positions are used for all three schemes, while each scheme is evaluated at its own optimal data window. The vertical ranges of the left and right columns differ.
The right column shows the worst location. At the worst location under SISO every layout gives exactly zero at every angle. SCDT recovers 0.73 and 1.45 bit/channel use for Layouts A and C at 20, and 1.28 and 2.68 at 60, both with reflections. For Layout B it stays below 0.0002 at 20 and reaches only 0.03 at 60. SCDT-AN raises all three at both angles, to 0.80, 0.01 and 3.44 at 20 and to 2.35, 0.74 and 3.93 at 60.
These results show that spatial confinement improves the secrecy rate over SISO, while adding artificial noise further reduces Eve’s SINR and increases the calculated secrecy rate. Both improvements are obtained without increasing the total mean optical power within each layout.
The layouts differ in the number of occupied positions (676, 625 and 1524) and therefore in total optical power (67.6, 62.5 and 152.4 W) and illuminance level, but the secrecy rate does not follow the number of positions. Under SISO, where all positions transmit, the rate falls from 4.74 to 2.10 and 0.40 bit/channel use as the number rises from 625 to 676 and then to 1524. Under SCDT, Layout C transmits data from fewer positions than Layout A (123 against 169) and reaches the same rate (5.37 and 5.36 bit/channel use). Under SCDT-AN, it has 2.67 times more jamming positions (1352 against 507), yet its rate is higher by only 0.12 bit/channel use (5.80 and 5.68). The rate is therefore determined by how the transmitting positions are arranged relative to Bob and Eve and not by their number.
The spatial average hides the weakest point of the room, so the minimum of the secrecy rate over the eavesdropper positions outside the guard radius is reported separately in Table 5. With Bob at the best location, SCDT-AN keeps that minimum strictly positive in every layout and at both semi-angles, between 1.24 and 6.04 bit per channel use, whereas SISO reaches zero in five of the six cases and SCDT in three. With Bob at the worst location, the minimum of SCDT-AN remains positive in four of the six cases but falls to zero for Layouts A and B at 20, so the scheme delivers a worst-case guarantee where Bob is reasonably placed and an average improvement elsewhere.
Table 5.
Worst-case secrecy rate over the eavesdropper positions outside a 0.5 m guard radius around Bob, in bit per channel use, with reflections, at the optimal window of each configuration.
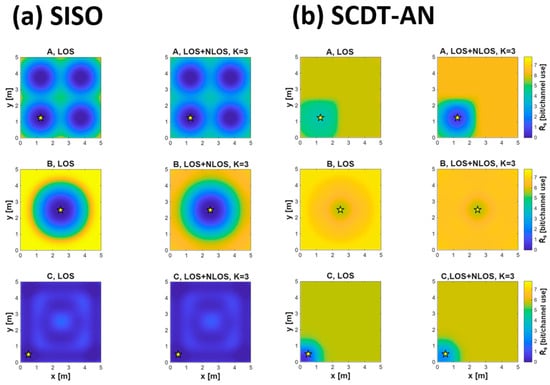
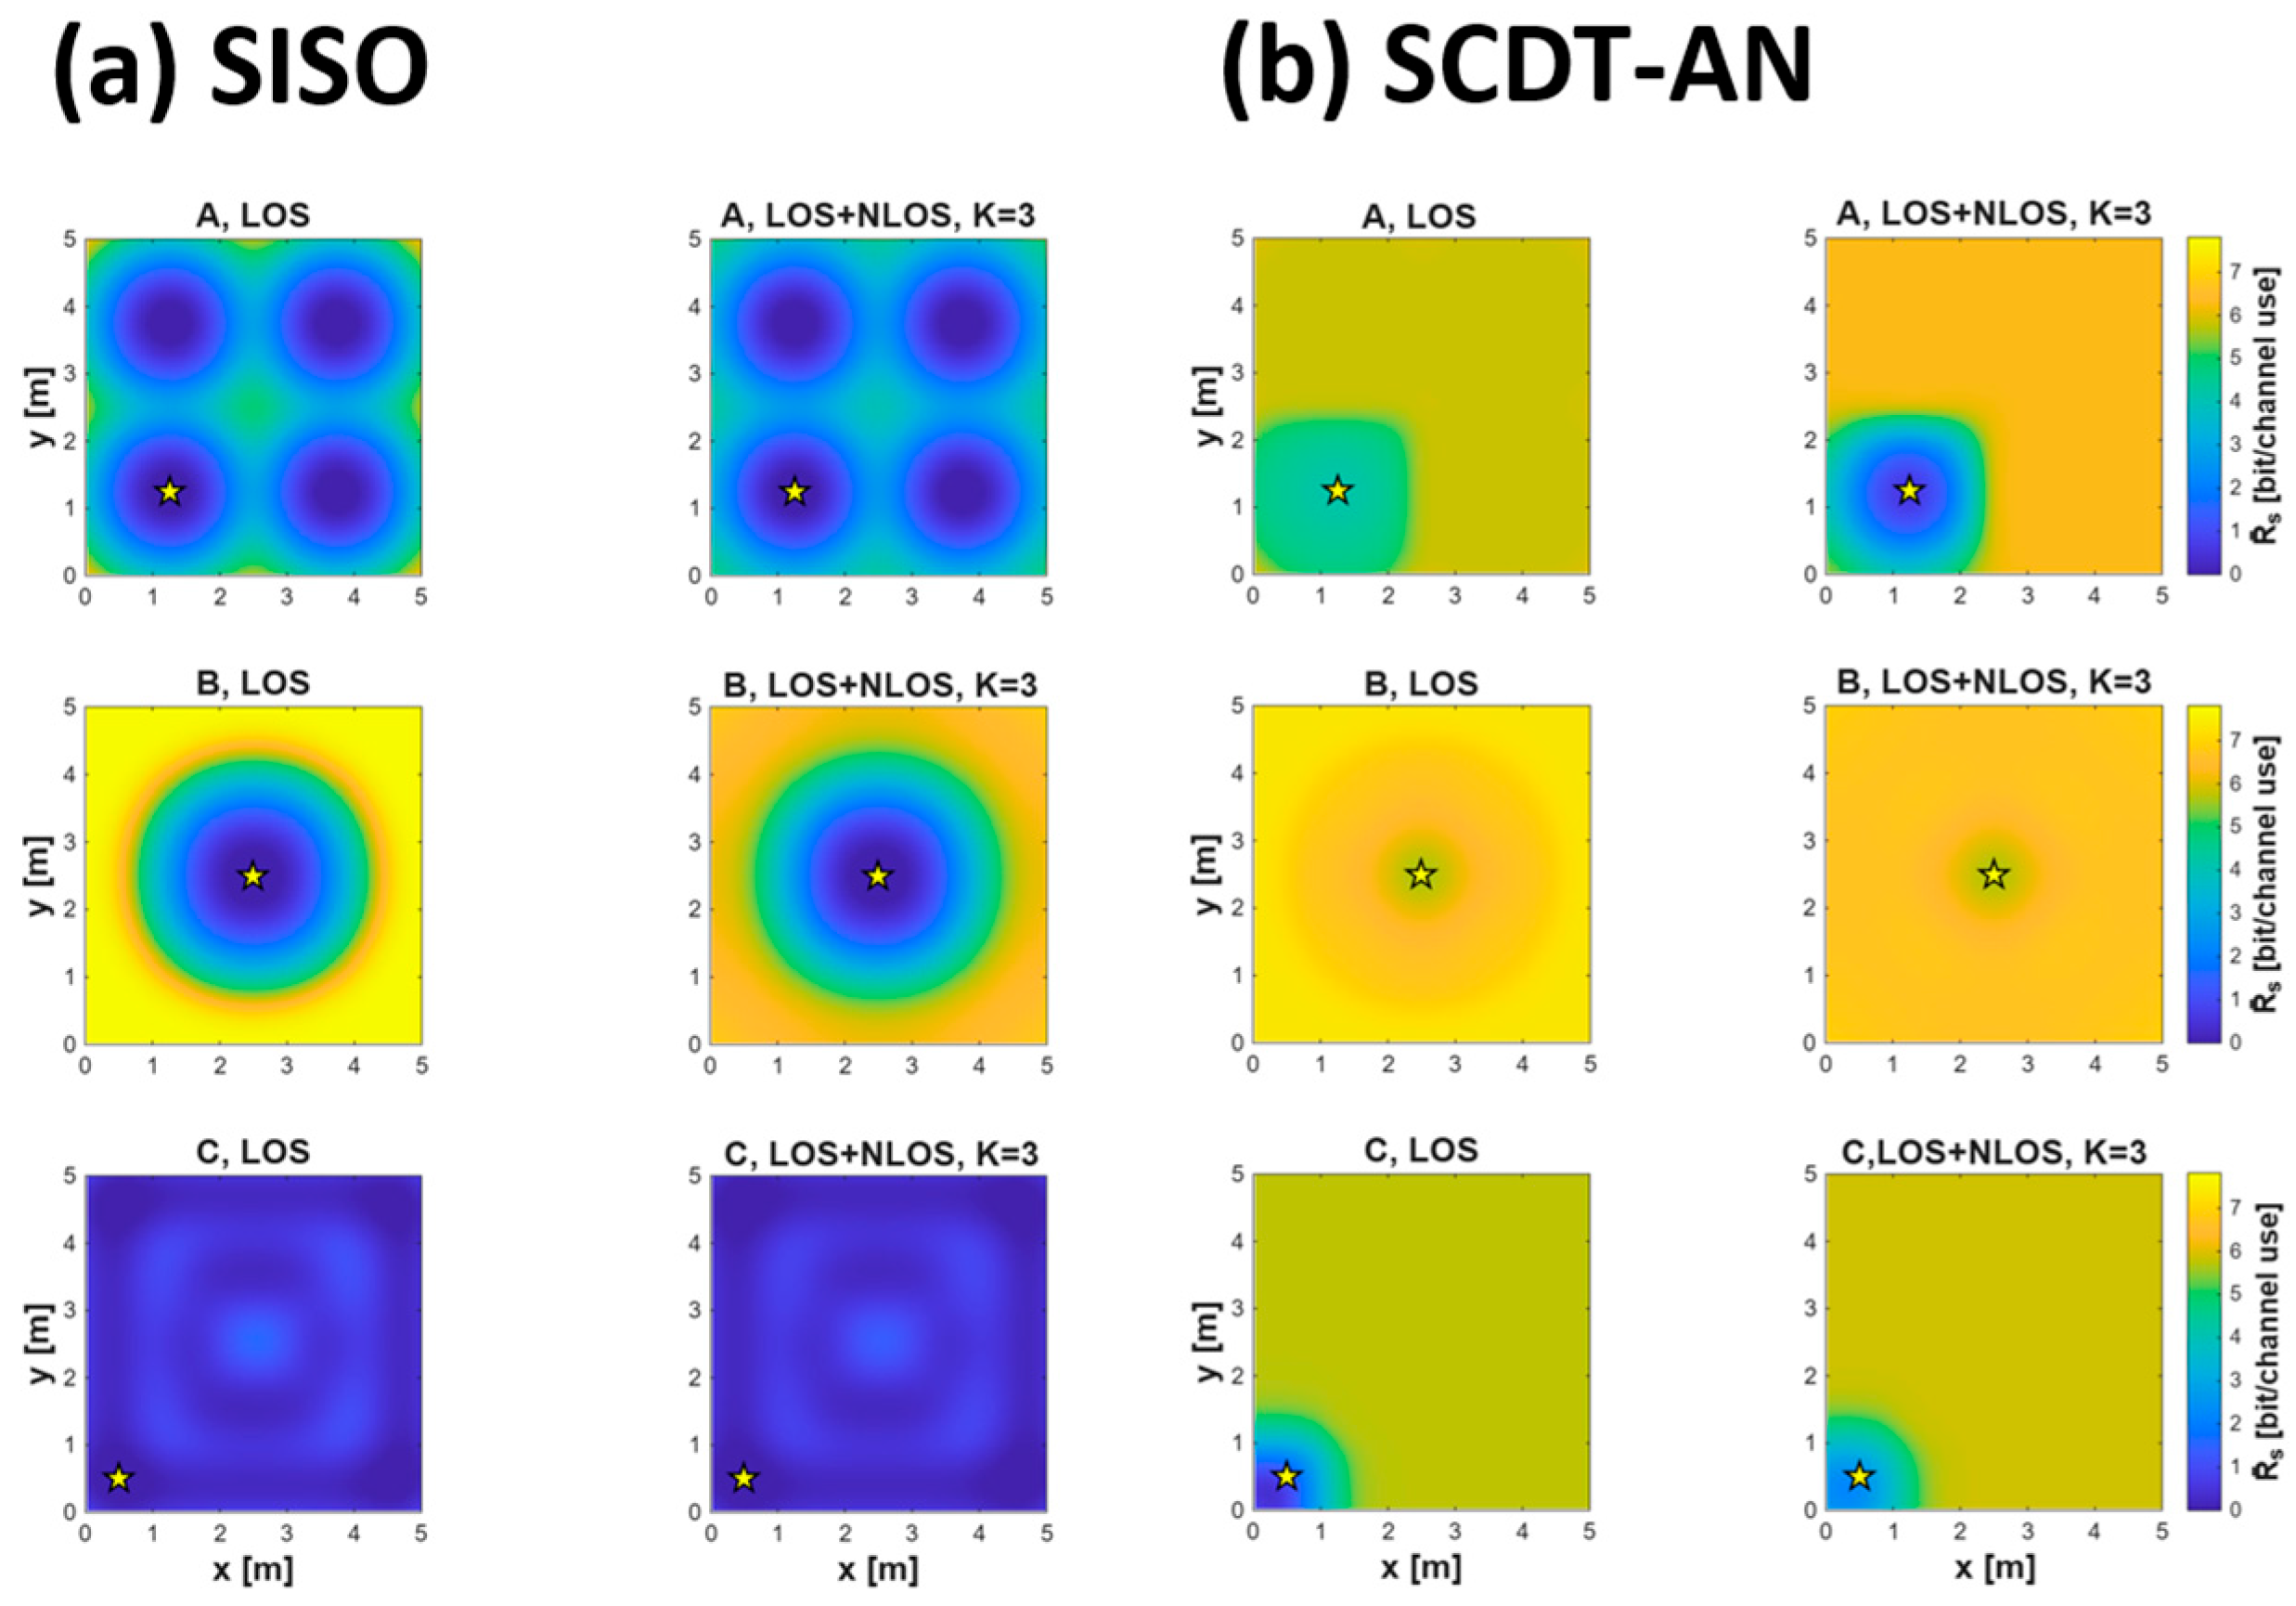
Figure 11 places the SISO and SCDT-AN maps on a single-color scale. Under SISO the surface runs from zero to its peak, with four deep valleys under the clusters of Layout A, one around Bob for Layout B, and a map that is dark almost everywhere for Layout C, whose uniform arrangement gives the eavesdropper nearly the same channel as Bob at every position. Under SCDT-AN, the same three rooms are bright almost everywhere and the only depression left is the immediate neighborhood of Bob, where the eavesdropper lies inside the data window. Layout C changes the most, from the darkest of the three maps to one as bright as the others.
Figure 11.
Secrecy rate maps with Bob at the best location (marked by a star) and a half-power semi-angle of 20, (a) under common SISO broadcasting and (b) under SCDT-AN at its optimal window.
SCDT-AN is therefore the strongest of the three schemes in two respects that matter for a real installation. It reaches the highest rate under every layout and keeps the three within about 1 bit/channel use of one another, where common broadcasting spread them over 4.3 bit/channel use, so the luminaire arrangement no longer decides the outcome. It is also the scheme least degraded by reflections, staying within 5% of its LOS-only rate at the best location, where SISO loses 11 to 15% and SCDT 2 to 9%. Since a real room always carries multipath and its lighting is designed for illumination rather than for secrecy, jamming is well motivated in illumination control.
7. Discussion and Conclusions
Under common SISO broadcasting, uniform illumination is the worst case for secrecy. The distributed grid of Layout C achieves full coverage of the 400 lx requirement with the lowest illuminance standard deviation, yet it delivers the lowest average secrecy rate of the three layouts, because the same uniformity removes the illuminance contrast on which Bob’s advantage depends. Illumination quality and secrecy are therefore in direct conflict whenever the channel asymmetry must come from the luminaire arrangement alone.
Confining the data signal to a window around Bob reverses this ordering, and adding artificial noise outside the window raises the secrecy rate further. Layout C, the weakest layout under common broadcasting, becomes comparable to the other two under both schemes. Uniform illumination is therefore not a liability once the asymmetry is created by the transmission rather than by the luminaire arrangement, which reconciles the two objectives that Section 1 presented as conflicting. This is the central finding of the paper.
Multipath affects the three schemes in three different directions, which is the result with the clearest practical consequence. Reflections reduce the secrecy rate of SISO in every configuration in which it was non-zero without them, because the diffuse field flattens the illuminance contrast that SISO depends on. They reduce the rate of SCDT in most configurations but raise it at the worst receiver locations, where the reflected light reaches a Bob who receives almost no direct light. They raise the rate of SCDT-AN in all but two configurations, because the same diffuse field also carries the artificial noise to the eavesdropper. These findings separate the contributions of the two schemes, since SCDT improves secrecy through spatial confinement whereas SCDT-AN adds a second mechanism that benefits from the multipath rather than suffering from it.
The rates reported here are information-theoretic lower bounds from a simulated channel model with a fixed uniform input, averaged over the eavesdropper positions rather than guaranteed at each of them, and they are not a measured security level of a deployed system. Several assumptions bound these conclusions. The artificial noise is treated as one common waveform driving every jamming position. Their fields then add in amplitude at the receiver, so the received jamming power is the square of the sum of the path gains. Independent generators at each position would add in power instead, giving the sum of the squares. This is smaller by up to the number of jamming positions and varies smoothly across the room, so it would both weaken the jamming and remove that structure, and the rates reported here are in that sense an upper bound.
The analysis assumes a single eavesdropper with one photodiode, with no prior knowledge of the configuration or the AN statistic, and the evaluation uses her modeled channel gains and the received AN power without simulating channel estimation, learning or AN cancelation. Eavesdroppers at several positions that combine what they receive would obtain a higher effective signal-to-noise ratio than any of them alone, so the rates reported here would no longer hold, and eavesdroppers at heights other than the receiver plane are not considered either. Bob is assumed to receive none of it; the reflection series is truncated at K = 3. Specular reflection is not modeled, the six surfaces being taken as ordinary diffuse walls, ceiling and floor with no mirrors or glazing, and blockage is not modeled either, every path being treated as unobstructed by furniture or by the users themselves. Bob’s location is assumed known exactly, so the optimum window of Section 6 carries no margin for localization error. Both receivers are modeled as ideal photodiodes with a fixed field of view and an ideal concentrator, with no front-end electronics, LED nonlinearity, synchronization or channel coding, and all results are obtained by simulation without experimental validation.
8. Conclusions
This paper evaluated physical-layer secrecy in indoor visible light communication as a spatial distribution over 9801 receiver positions. Three luminaire layouts of different spatial symmetry were compared at five half-power semi-angles and three receiver locations, under a line-of-sight model and under a diffuse multipath model. Three transmission schemes were evaluated under identical illumination. At the best receiver location and a 20° semi-angle with reflections, the average secrecy rate of Layout A rises from 2.10 bit per channel use under common broadcasting to 5.36 under spatially confined transmission and to 5.68 once artificial noise is added, while Layout C rises from 0.40 to 5.37 and 5.80. The spatial uniformity that lighting design pursues is therefore compatible with physical-layer secrecy, provided that the channel asymmetry is created by the transmission scheme rather than by the luminaire arrangement.
Future work should relax these assumptions. The sensitivity of the optimal window to localization error and the margin it requires need to be established, as does the effect of the residual artificial noise that reaches Bob through imperfect spatial isolation and multipath reflections. Independent noise per jamming position, colluding eavesdroppers, eavesdroppers at other heights, robustness against an adversary that learns the system parameters or suppresses the artificial noise with several photodiodes, blockage by furniture and by the users themselves, and a mobile Bob would each bring the model closer to a deployment. A systematic study of the numerical settings would also be of value, covering the convergence of the reflection series, the discretization of the reflecting surfaces and the robustness of the secrecy rates to the remaining simulation parameters.
Author Contributions
Conceptualization, H.C. and M.P.; methodology, M.P.; software, M.P.; validation, M.P. and H.C.; formal analysis, M.P.; investigation, M.P.; resources, M.P.; data curation, M.P.; writing—original draft preparation, M.P.; writing—review and editing, H.C.; visualization, M.P.; supervision, H.C.; project administration, H.C.; funding acquisition, H.C. All authors have read and agreed to the published version of the manuscript.
Funding
This work was supported by Incheon National University Research Grant in 2026.
Data Availability Statement
The data supporting the reported simulation results are included in the article.
Conflicts of Interest
The authors declare no conflicts of interest.
References
- Karunatilaka, D.; Zafar, F.; Kalavally, V.; Parthiban, R. LED based indoor visible light communications: State of the art. IEEE Commun. Surv. Tutor. 2015, 17, 1649–1678. [Google Scholar] [CrossRef] [Scilit]
- Chi, N.; Zhou, Y.; Wei, Y.; Hu, F. Visible light communication in 6G: Advances, challenges, and prospects. IEEE Veh. Technol. Mag. 2020, 15, 93–102. [Google Scholar] [CrossRef] [Scilit]
- Haas, H.; Yin, L.; Wang, Y.; Chen, C. What is LiFi? J. Light. Technol. 2016, 34, 1533–1544. [Google Scholar] [CrossRef] [Scilit]
- Alhalabi, M.; Sonmezocak, T.; El-Nahal, F. Design and performance analysis of a directly modulated direct current-biased optical orthogonal frequency-division multiplexing visible-light optical wireless link under atmospheric turbulence. Appl. Sci. 2026, 16, 6324. [Google Scholar] [CrossRef] [Scilit]
- Alhalabi, M. Performance analysis of a 16-QAM directly modulated OFDM visible optical wireless link without external modulators. J. Opt. Photonics Res. 2026; in press. [CrossRef] [Scilit]
- Mostafa, A.; Lampe, L. Physical-layer security for MISO visible light communication channels. IEEE J. Sel. Areas Commun. 2015, 33, 1806–1818. [Google Scholar] [CrossRef] [Scilit]
- Arfaoui, M.A.; Soltani, M.D.; Tavakkolnia, I.; Ghrayeb, A.; Safari, M.; Assi, C.M.; Haas, H. Physical layer security for visible light communication systems: A survey. IEEE Commun. Surv. Tutor. 2020, 22, 1887–1908. [Google Scholar] [CrossRef] [Scilit]
- Wyner, A.D. The wire-tap channel. Bell Syst. Tech. J. 1975, 54, 1355–1387. [Google Scholar] [CrossRef] [Scilit]
- Poor, H.V.; Schaefer, R.F. Wireless physical layer security. Proc. Natl. Acad. Sci. USA 2017, 114, 19–26. [Google Scholar] [CrossRef] [Scilit] [PubMed]
- Smith, J.G. The information capacity of amplitude- and variance-constrained scalar Gaussian channels. Inf. Control 1971, 18, 203–219. [Google Scholar] [CrossRef] [Scilit]
- Ozel, O.; Ekrem, E.; Ulukus, S. Gaussian wiretap channel with amplitude and variance constraints. IEEE Trans. Inf. Theory 2015, 61, 5553–5563. [Google Scholar] [CrossRef] [Scilit]
- Wang, J.-Y.; Liu, C.; Wang, J.-B.; Wu, Y.; Lin, M.; Cheng, J. Physical-layer security for indoor visible light communications: Secrecy capacity analysis. IEEE Trans. Commun. 2018, 66, 6423–6436. [Google Scholar] [CrossRef] [Scilit]
- Favano, A.; Barletta, L.; Dytso, A. Amplitude constrained vector Gaussian wiretap channel: Properties of the secrecy-capacity-achieving input distribution. Entropy 2023, 25, 741. [Google Scholar] [CrossRef] [Scilit] [PubMed]
- Kahn, J.M.; Barry, J.R. Wireless Infrared Communications. Proc. IEEE 1997, 85, 265–298. [Google Scholar] [CrossRef] [Scilit]
- Mostafa, A.; Lampe, L. Optimal and robust beamforming for secure transmission in MISO visible-light communication links. IEEE Trans. Signal Process. 2016, 64, 6501–6516. [Google Scholar] [CrossRef] [Scilit]
- Yin, L.; Haas, H. Physical-layer security in multiuser visible light communication networks. IEEE J. Sel. Areas Commun. 2018, 36, 162–174. [Google Scholar] [CrossRef] [Scilit]
- Arfaoui, M.A.; Zaid, H.; Rezki, Z.; Ghrayeb, A.; Chaaban, A.; Alouini, M.-S. Artificial noise-based beamforming for the MISO VLC wiretap channel. IEEE Trans. Commun. 2019, 67, 2866–2879. [Google Scholar] [CrossRef] [Scilit]
- Cho, S.; Chen, G.; Coon, J.P. Securing visible light communications with spatial jamming. In Proceedings of the 2019 IEEE International Conference on Communications (ICC), Shanghai, China, 20–24 May 2019; pp. 1–6. [Google Scholar] [CrossRef] [Scilit]
- Barry, J.R.; Kahn, J.M.; Krause, W.J.; Lee, E.A.; Messerschmitt, D.G. Simulation of multipath impulse response for indoor wireless optical channels. IEEE J. Sel. Areas Commun. 1993, 11, 367–379. [Google Scholar] [CrossRef] [Scilit]
- Miramirkhani, F.; Uysal, M. Channel modeling and characterization for visible light communications. IEEE Photonics J. 2015, 7, 7905616. [Google Scholar] [CrossRef] [Scilit]
- Schulze, H. Frequency-domain simulation of the indoor wireless optical communication channel. IEEE Trans. Commun. 2016, 64, 2551–2562. [Google Scholar] [CrossRef] [Scilit]
- Yang, F.; Wang, J.; Dong, Y. Physical-layer security for indoor VLC wiretap systems under multipath reflections. IEEE Trans. Wirel. Commun. 2022, 21, 11179–11192. [Google Scholar] [CrossRef] [Scilit]
- Albayrak, C.; Cetinkaya, S.; Turk, K.; Arslan, H. Physical layer security for visible light communication in reflected indoor environments with inter-symbol interference. IEEE Trans. Inf. Forensics Secur. 2023, 18, 2709–2722. [Google Scholar] [CrossRef] [Scilit]
- Chen, J.; Shu, T. Statistical modeling and analysis on the confidentiality of indoor VLC systems. IEEE Trans. Wirel. Commun. 2020, 19, 4744–4757. [Google Scholar] [CrossRef] [Scilit]
- Chen, B.; Wornell, G.W. Quantization index modulation: A class of provably good methods for digital watermarking and information embedding. IEEE Trans. Inf. Theory 2001, 47, 1423–1443. [Google Scholar] [CrossRef] [Scilit]

Disclaimer/Publisher’s Note: The statements, opinions and data contained in all publications are solely those of the individual author(s) and contributor(s) and not of MDPI and/or the editor(s). MDPI and/or the editor(s) disclaim responsibility for any injury to people or property resulting from any ideas, methods, instructions or products referred to in the content. |
© 2026 by the authors. Licensee MDPI, Basel, Switzerland. This article is an open access article distributed under the terms and conditions of the Creative Commons Attribution (CC BY) license.