


Abstract
We propose and numerically evaluate a fourfold hollow-core antiresonant fiber with integrated cladding units that combine a semicircular outer element, a circular antiresonant capillary, and nested elliptical and circular rings. This composite topology combines membrane-thickness and nested-boundary control to obtain low fundamental-mode leakage together with strong higher-order-mode attenuation. After geometric optimization, the calculated confinement losses at 1550 nm are and dB/km for the fundamental mode (FM) and the lowest-loss identified core-guided higher-order mode (HOM), respectively, corresponding to a confinement loss-based higher-order-mode extinction ratio (HOMER) of . The calculated wavelengths satisfying FM confinement loss dB/km and HOMER above form two sampled ranges, 1.250–1.575 and 1.650–1.675 . Within the investigated geometric perturbations, membrane-thickness errors and elliptical-ring circularization substantially affect modal-loss discrimination. The results provide a quantitative design basis for mode-selective composite cladding and identify the geometric features that must be controlled to retain its modal-loss discrimination.
1. Introduction
Hollow-core antiresonant fibers (HC-ARFs) confine most of the optical power in an air core through the antiresonant response of thin glass membranes and weak coupling between core modes and cladding states. Compared with hollow-core photonic-bandgap fibers, HC-ARFs provide a broad transmission window and considerable geometric design freedom. Nested nodeless structures, anisotropic antiresonant elements, elliptical capillaries, and conjoined-tube arrangements have therefore been studied to reduce leakage and control modal coupling [1,2,3,4,5].
Hollow-core antiresonant fibers are also being investigated for sensing, particularly gas detection, because analytes introduced into the hollow core can interact with the guided optical field. Recent studies have reviewed sensing applications of HC-ARFs and numerically examined dual-gas detection of CO2 and CH4 [6,7].
Minimum fundamental-mode (FM) confinement loss alone is insufficient to characterize an HC-ARF intended for effectively single-mode guidance. The attenuation of higher-order modes (HOMs), operating bandwidth, bend response, and sensitivity to geometric deviations must also be considered, because a change that reduces FM leakage need not increase HOM attenuation. Recent studies have consequently assessed confinement loss and modal discrimination together when using asymmetric or multi-element claddings to modify polarization- and mode-dependent coupling [8,9]. For example, experimental attenuations of 4.30 dB/km at 1080 nm, 2.00 dB/km at 1512 nm, and 4.80 dB/km at 1522 nm have been reported for a single-ring tubular HC-ARF, a conjoined-tube fiber, and a semi-tubular fiber, respectively [4,10,11]. A numerical fourfold semi-tubular structure yielded an FM confinement loss of dB/km and a HOMER of approximately at 1550 nm [12]. A fabricated fourfold truncated double-nested fiber showed attenuations of 0.10 and 0.13 dB/km near 1550 nm and reported HOM losses of 430 and 6500 dB/km [13]. These results illustrate the need to balance low FM leakage, strong HOM attenuation, and geometric realizability within a specified cladding topology. Here, modal discrimination is quantified by the confinement loss-based higher-order-mode extinction ratio (HOMER), defined as the loss of the lowest-loss identified core-guided HOM divided by the FM loss.
This work proposes a fourfold composite cladding that combines two glass membranes with circular, elliptical, and semicircular boundaries. The membranes set the principal antiresonant conditions, while the noncircular nested boundary changes the local curvature and air gaps adjacent to the core. The structure is assessed through staged parameter scans followed by multiparameter refinement. Its wavelength response, bend response, sensitivity to static geometric perturbations, and a possible stack-and-draw route are examined. Given the potential to control modal content and spectral response, the proposed composite cladding may also be of interest for future sensing designs that require tailored light–analyte interaction.
2. Fiber Geometry and Numerical Model
2.1. Composite Cladding
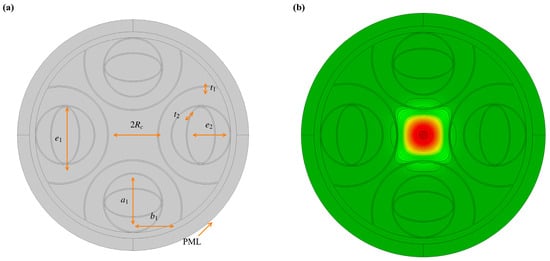
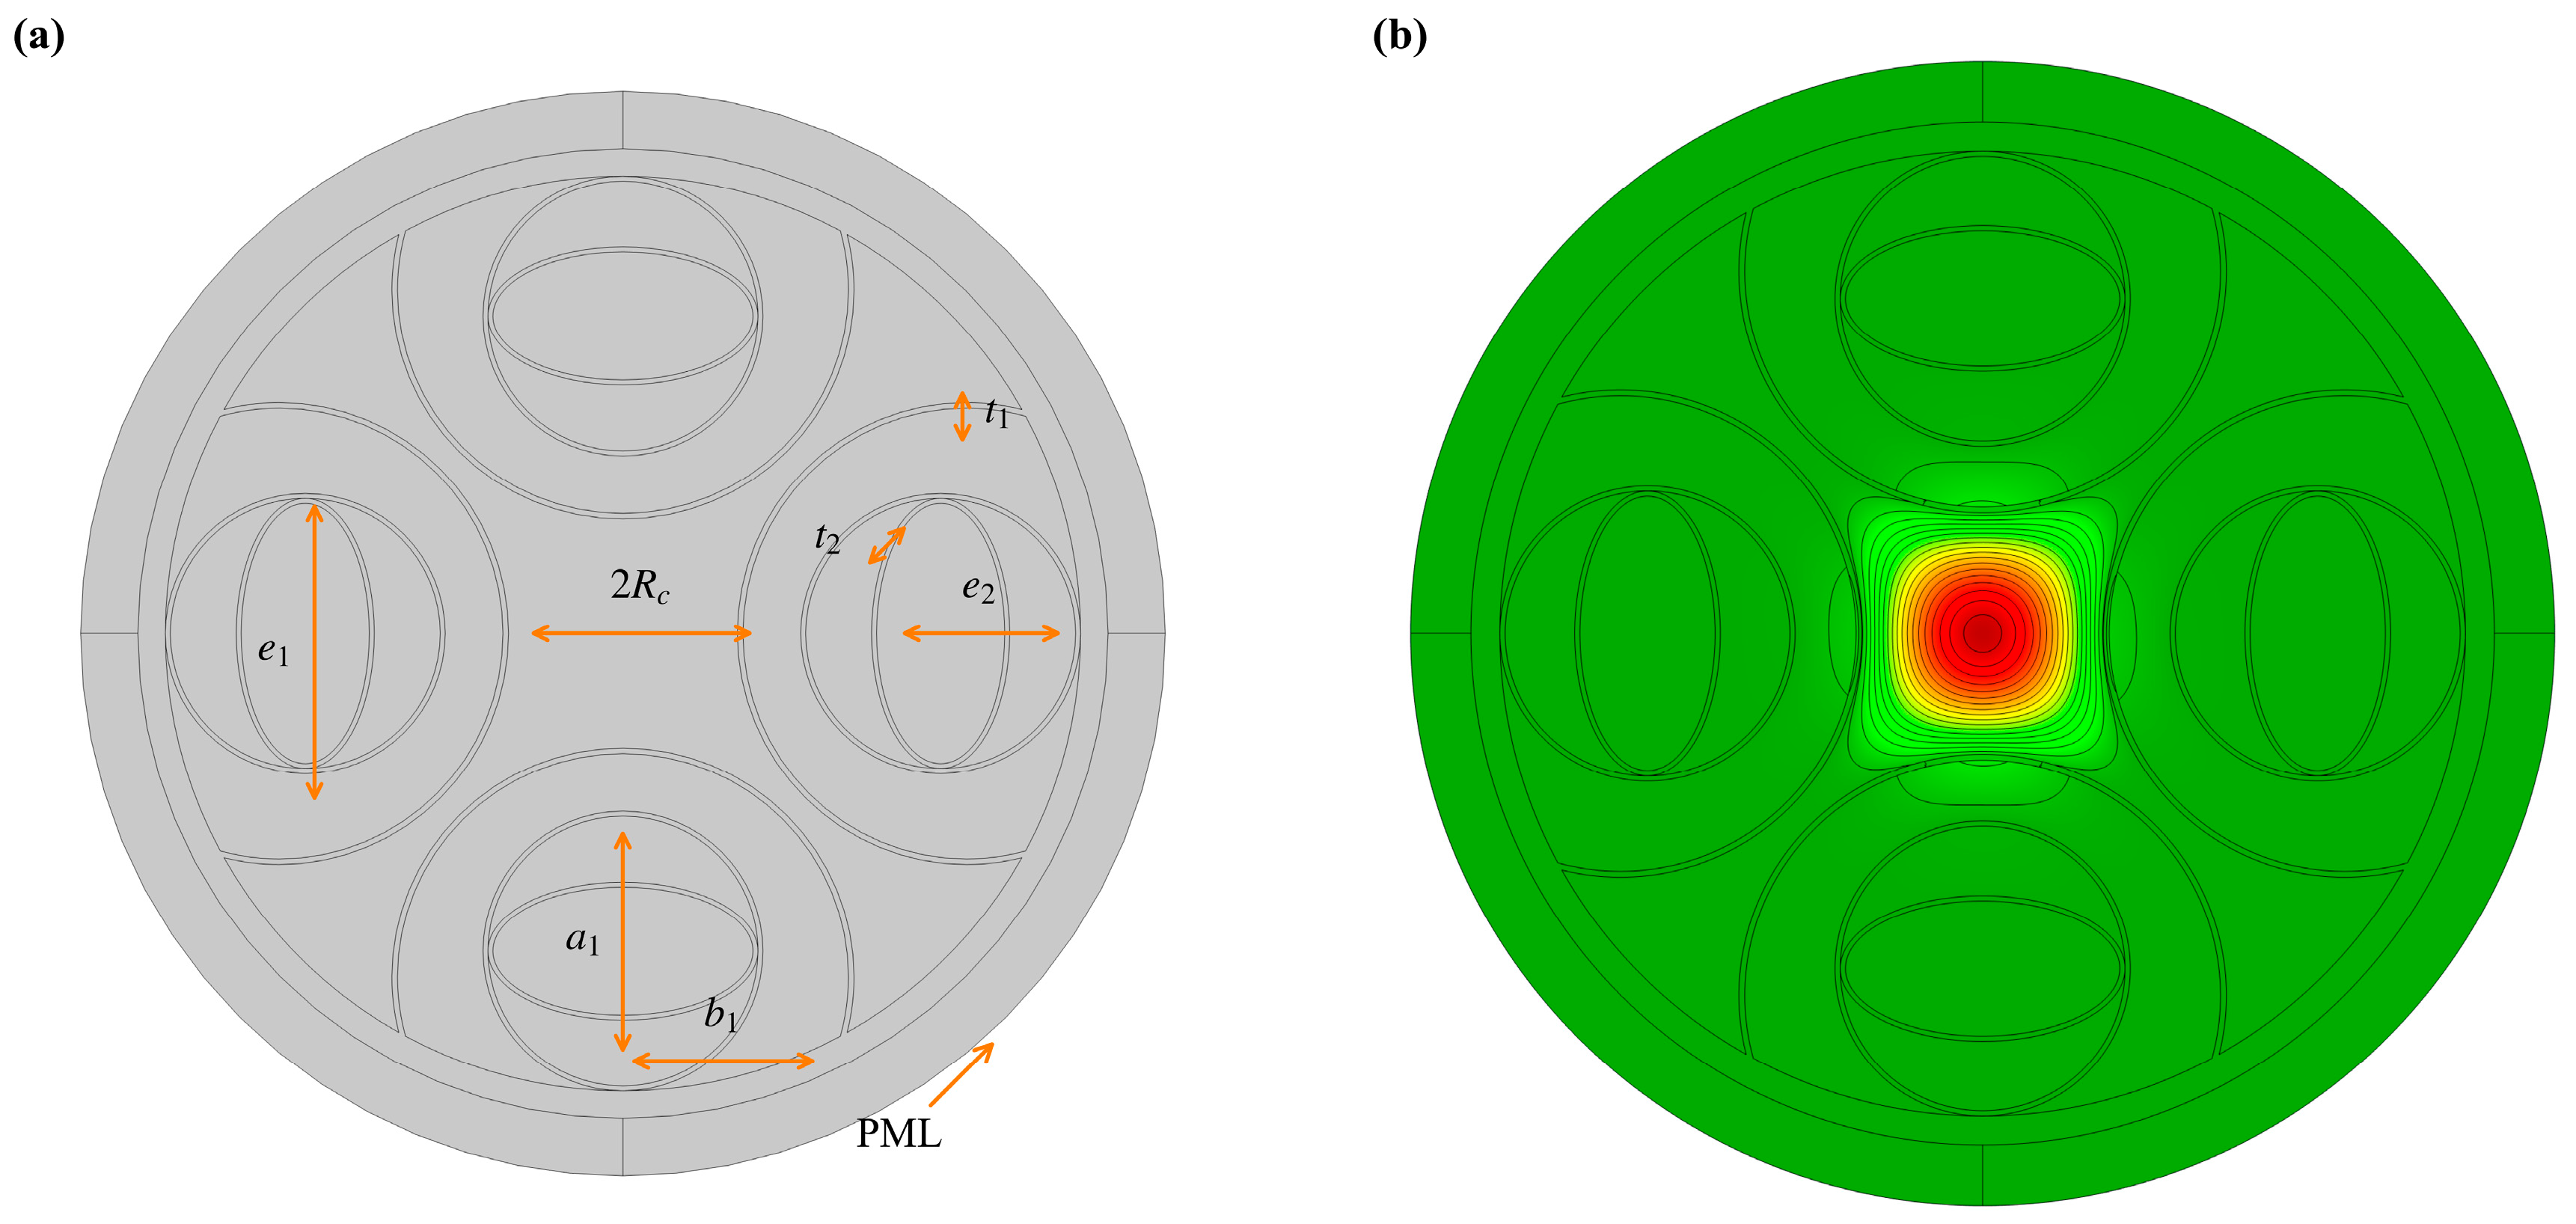
The cross section comprises four identical composite cladding units arranged around a circular air core. Each unit contains a semicircular outer element, a circular antiresonant capillary, an embedded elliptical ring, and an embedded circular ring, as shown in Figure 1. The four units possess fourfold rotational symmetry, and every outer contour is semicircular.
Figure 1.
Proposed HC-ARF at 1550 nm: (a) labeled cross section and (b) representative FM field. The field magnitude in (b) is normalized to its own maximum. The colors in (b) represent normalized field magnitude, with red indicating the highest values.
The reference geometric radius is , and denotes the characteristic circular-tube radius. The two membrane thicknesses are and . The circular-capillary radius is . The embedded elliptical ring is described by and , where is a semiaxis coefficient. The parameter controls the embedded circular ring, and and are the transverse and longitudinal scales of the composite-unit envelope. The sequential equal-scale scan uses ; and are varied independently during the final multiparameter refinement.
2.2. Finite-Element Model
A two-dimensional full-vector complex-eigenmode model is implemented with the Electromagnetic Waves, Frequency Domain interface in COMSOL Multiphysics 6.3. The refractive index of silica is calculated from the Sellmeier relation [14],
where is expressed in micrometers; the refractive index of air is set to 1. The initial membrane-thickness range is estimated from the elementary antiresonance condition
where is the antiresonance order. The two-dimensional scan identifies an initial candidate region for and . The final membrane thicknesses are selected during the subsequent multiparameter refinement.
At each wavelength, the complex propagation constant is obtained by solving the full-vector Maxwell eigenproblem for the complete cross section, and the complex effective index is defined as , where . Its imaginary part represents leakage in the open-waveguide model and is used to calculate the confinement loss in Equation (3). The eigenproblem includes the full transverse field, core–cladding coupling, and leakage at the open boundary of the combined circular, elliptical, and semicircular interfaces. The single-wall antiresonance condition estimates initial membrane thicknesses; the complex effective index of the complete cross section is determined numerically, consistent with modal analyses of nested, anisotropic, elliptical-capillary, and fourfold semi-tubular HC-ARFs [1,2,3,12]. Forty eigenmodes are searched in an effective-index region close to the air index. The FM and core-guided HOMs are identified by inspecting their transverse field distributions: the FM has a single core-centered lobe, whereas the selected HOM has a core-confined multilobed pattern with transverse nodes. Modes whose fields are predominantly distributed in the cladding are treated as cladding modes.
An external silica region of thickness 2.4 separates the fiber cladding from an annular perfectly matched layer (PML) with a radial thickness of 5 . The cylindrical PML uses polynomial coordinate stretching with a scaling factor of 1 and a curvature parameter ; its reference wavelength is provided by the Electromagnetic Waves, Frequency Domain interface. A scattering boundary condition with no incident field is imposed on the outer circular boundary of the PML.
The physical domains are discretized using a free triangular mesh, with maximum element sizes of in silica and in air. The production wavelength, bend, and tolerance calculations use a mapped PML mesh with 8 radial layers; 12 and 16 layers are used for the PML-layer convergence test.
3. Results
3.1. Numerical Convergence and Structural Optimization
The confinement loss is calculated from the magnitude of the imaginary part of the complex effective refractive index:
Here, is in meters. Values are multiplied by for reporting in dB/km. The calculated loss quantifies leakage through the modeled cladding in the ideal two-dimensional cross section. The confinement loss-based higher-order-mode extinction ratio is
where is the confinement loss of the lowest-loss identified core-guided HOM. A larger value indicates greater modal-loss discrimination within this model. Total attenuation in a fabricated fiber also includes material absorption, surface scattering, contamination, bending, and geometric nonuniformity. These contributions are outside the straight-fiber confinement loss model.
3.2. PML and Mesh Convergence
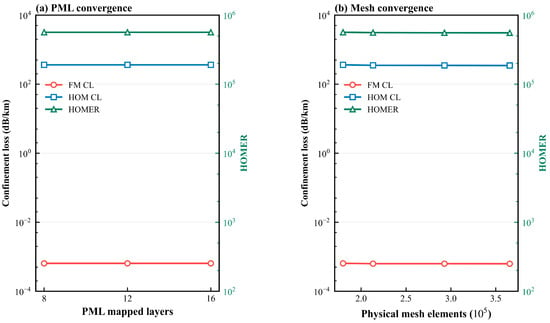
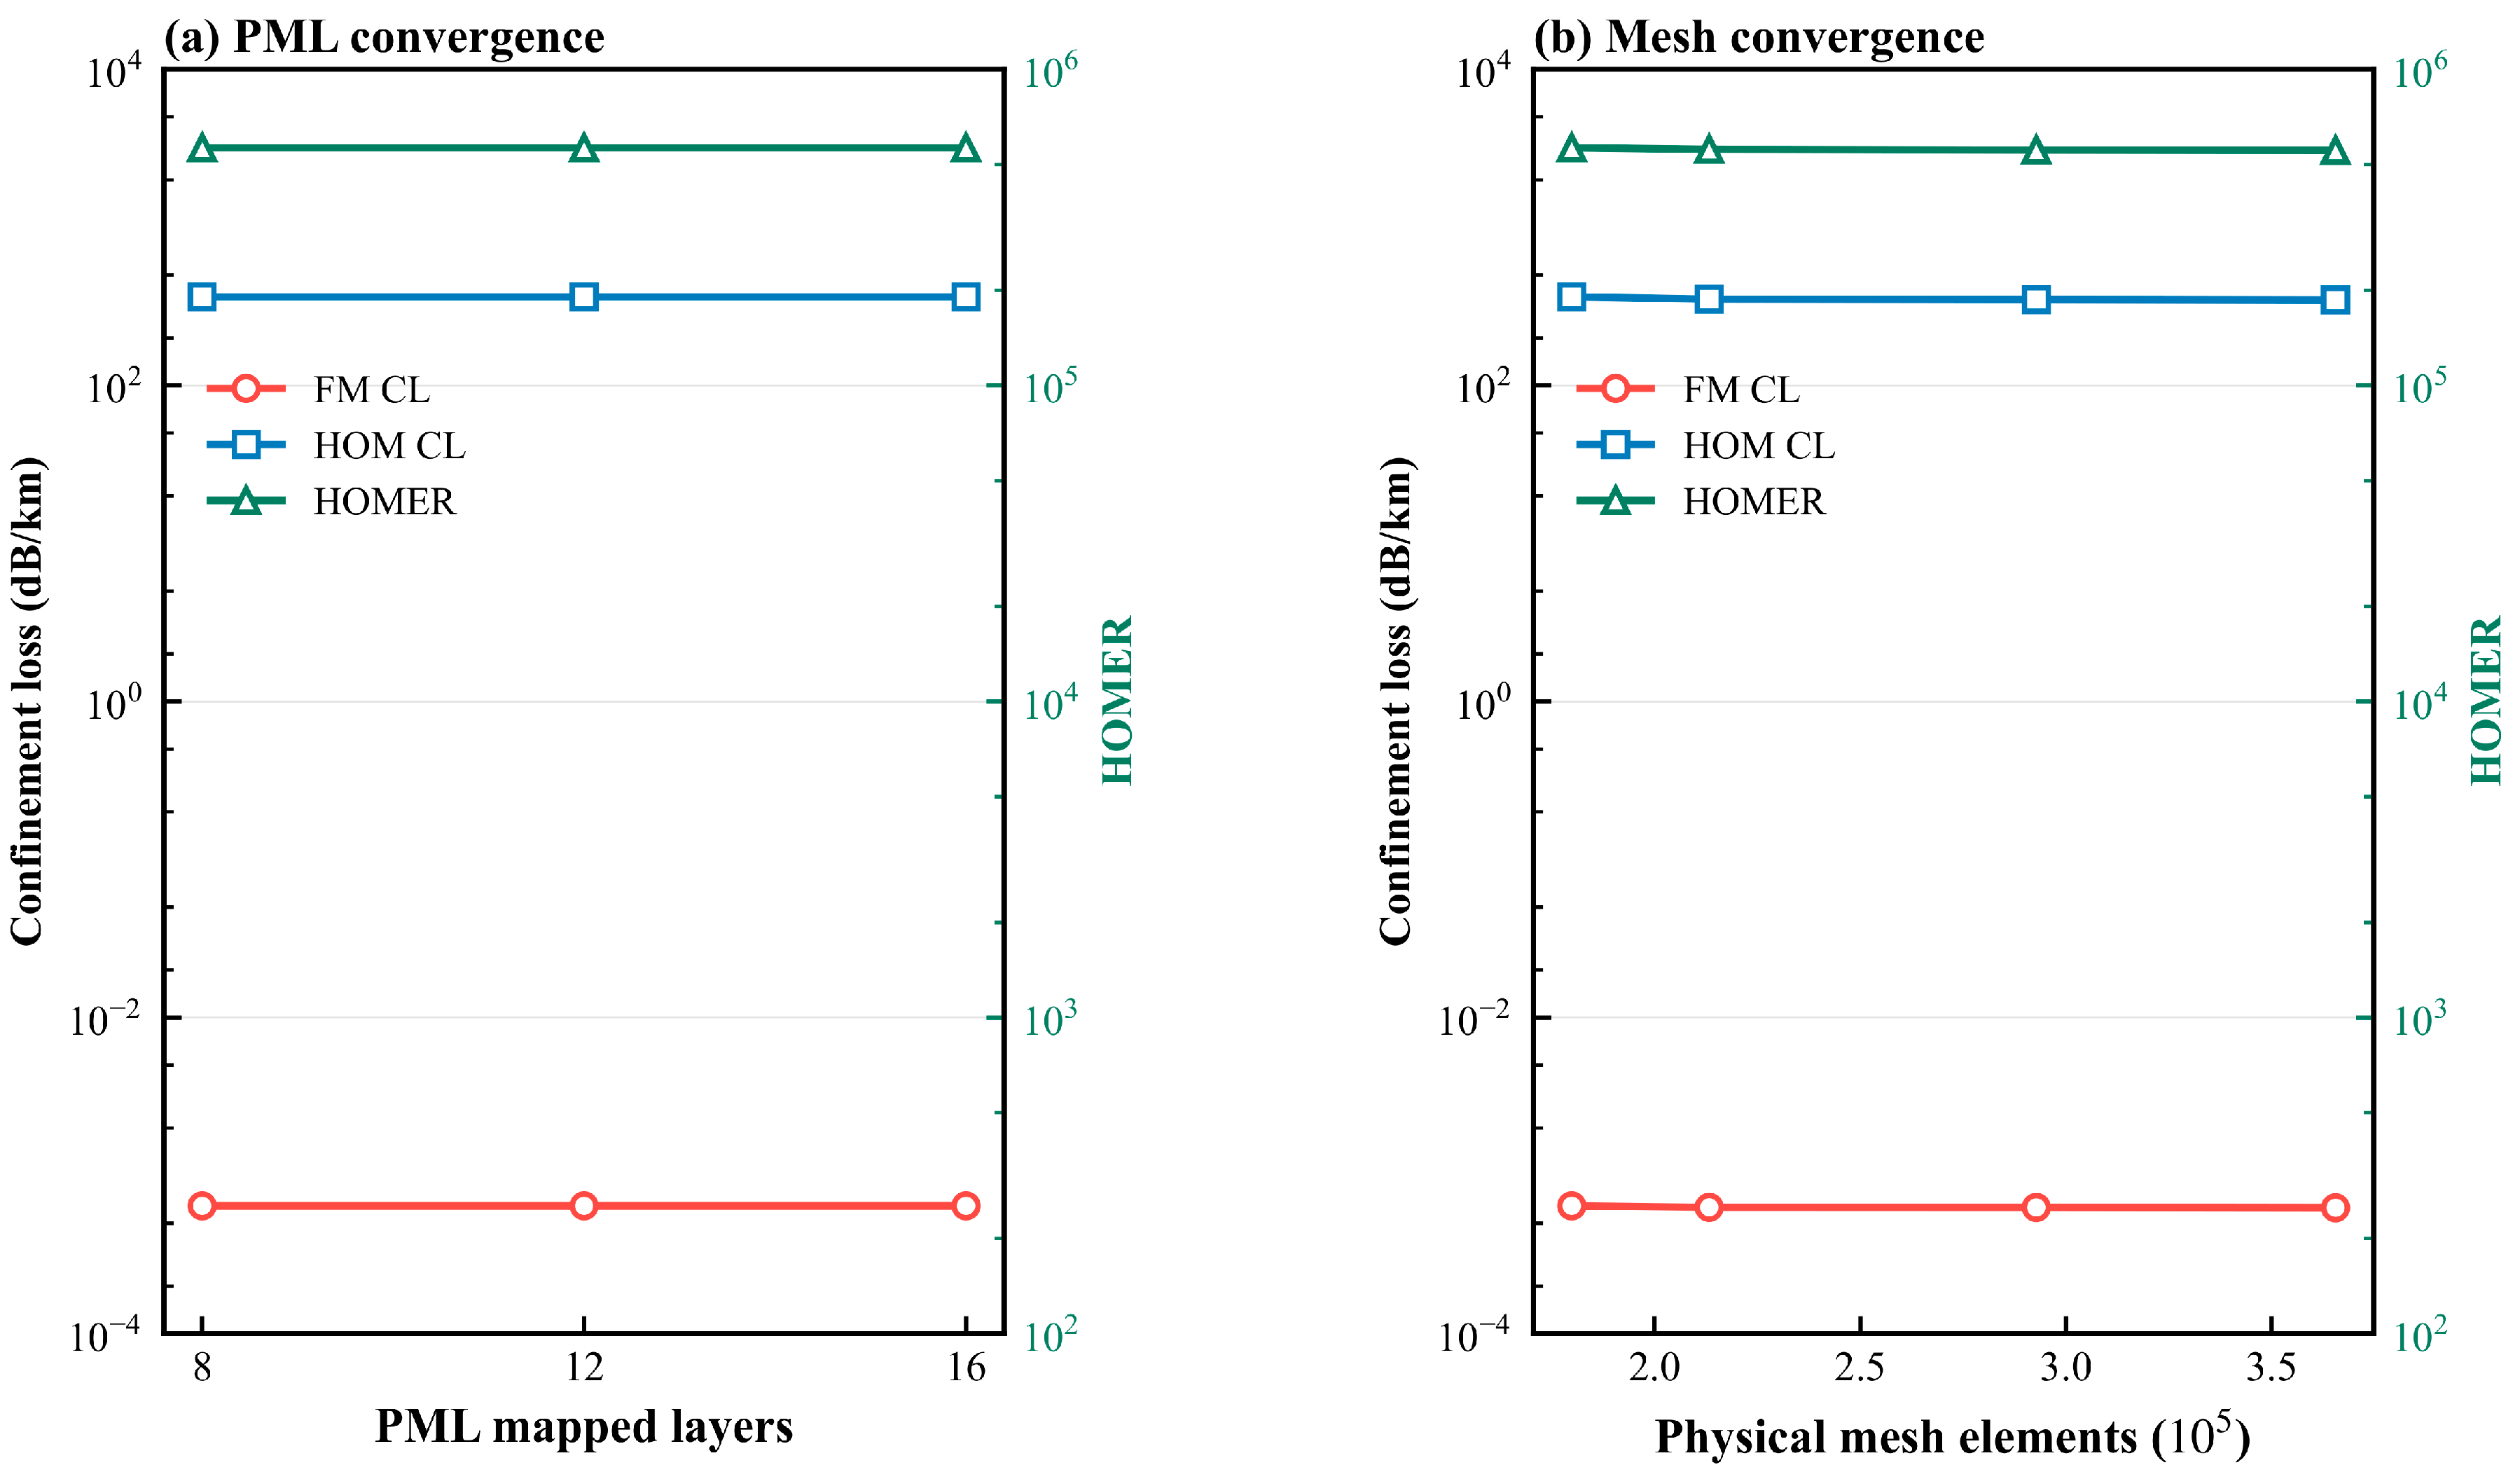
With the physical cross section fixed and the PML thickness held at 5 , the number of radial mapped-mesh layers in the PML is increased from 8 to 12 and 16. The physical-domain mesh is then refined independently from to elements. Figure 2 shows the numerical convergence of the PML and physical-domain meshes.
Figure 2.
Numerical convergence tests: (a) PML-layer convergence at a fixed physical PML thickness and (b) physical-domain mesh convergence. Each panel shows the FM and HOM confinement losses on the left axis and HOMER on the right axis. Both vertical axes are logarithmic.
For 8, 12, and 16 radial mesh layers in the PML, the FM confinement loss is approximately dB/km in all cases; the maximum relative change calculated from the unrounded values is approximately 0.01%. The physical-domain mesh settings specified in Section 2.2 give approximately elements for this reference geometry. The same maximum-element-size criteria and 8 radial mesh layers in the PML are used in the parameter, wavelength, bend, and tolerance calculations.
Across the four physical-domain meshes, the FM confinement losses are , , , and dB/km, respectively. The relative differences are 0.48% between the final two meshes and 2.75% between the finest and reference meshes.
The corresponding HOM confinement loss is 363.653–363.654 dB/km across the 8–16-layer PML test, and HOMER varies between and ; the maximum relative changes are approximately 0.00024% and 0.011%, respectively. Across the physical-domain mesh sequence, the HOM loss decreases from 363.654 to 347.141 dB/km and the HOMER decreases from to . The last two meshes change the HOM loss by approximately 0.72% and the HOMER by 0.24%. Relative to the reference physical mesh, the finest mesh changes the HOM loss and HOMER by 4.54% and 1.84%, respectively.
The optimization proceeds in stages. We first jointly scan and , then sequentially scan , , the composite-unit envelope scale , and . The scan results identify sensitive regions for a focused multiparameter refinement using both FM confinement loss and the loss of the lowest-loss identified core-guided HOM.
3.3. Joint Optimization of and
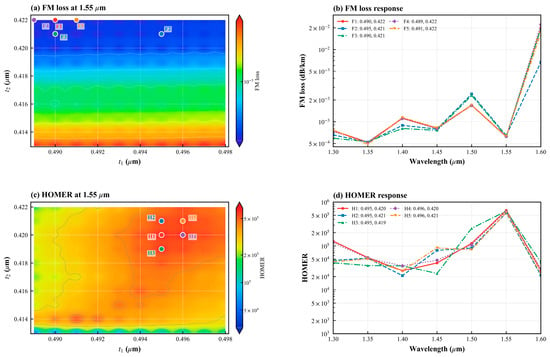
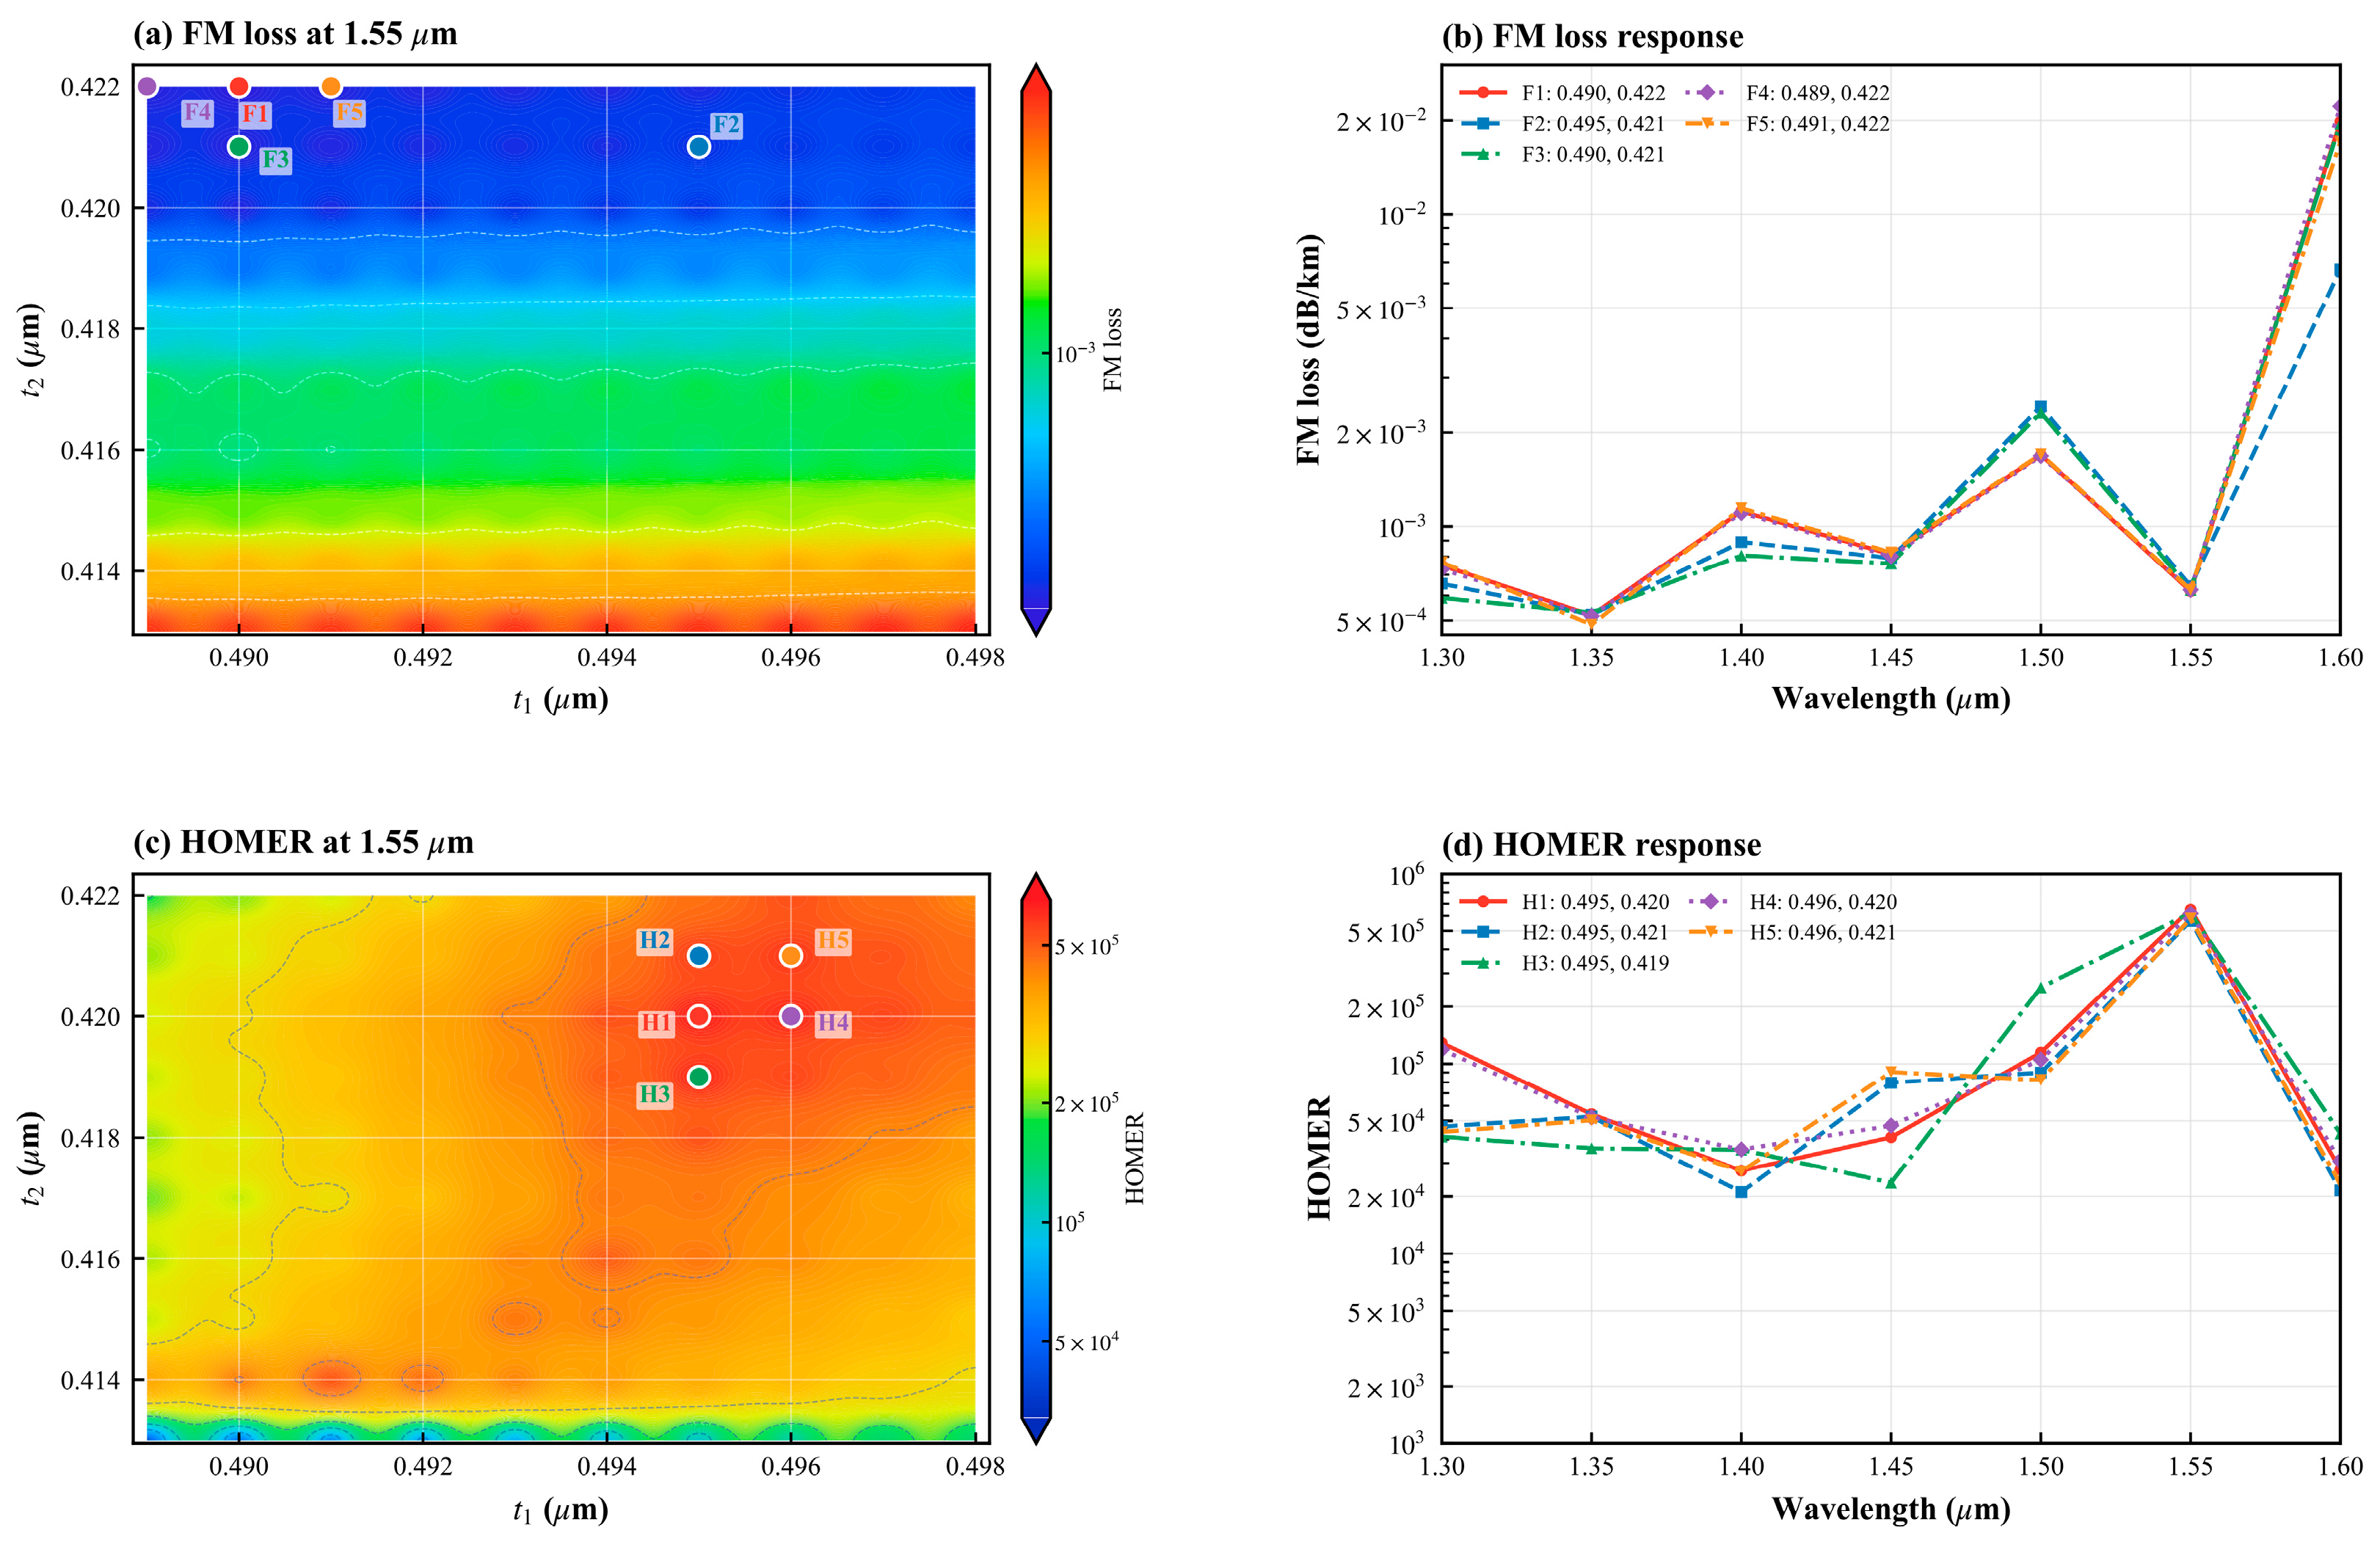
The two membrane thicknesses set the antiresonant windows and are therefore optimized first. With , , , and , a scan is performed over – and –. Figure 3 summarizes the joint scan of the two membrane thicknesses.
Figure 3.
Joint – scan: (a) FM confinement loss and (c) HOMER at 1550 nm; (b) and (d) wavelength responses of the five representative combinations marked in (a) and (c), respectively. The dashed lines, including closed dashed contours, are equal-value contours of FM confinement loss in (a) and HOMER in (c). The colored circles labeled F1–F5 and H1–H5 identify the parameter combinations plotted in (b) and (d), respectively.
The minimum FM loss occurs at F1 , where the loss is dB/km but HOMER is . The maximum HOMER, , occurs at H1 F2 and H2 correspond to the same combination, , with an FM loss of dB/km and HOMER of . This overlap between the low-FM-loss and high-HOMER regions is used as the baseline for the subsequent sequential scans.
3.4. Circular-Capillary Coefficient
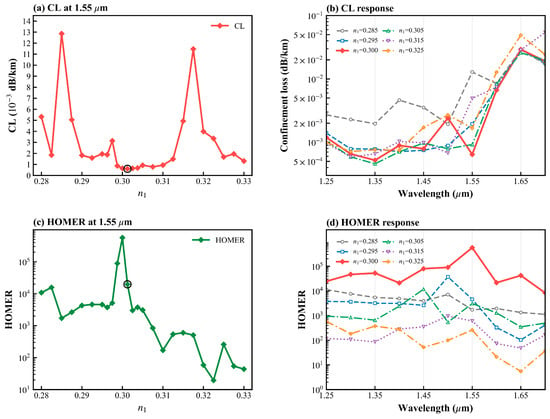
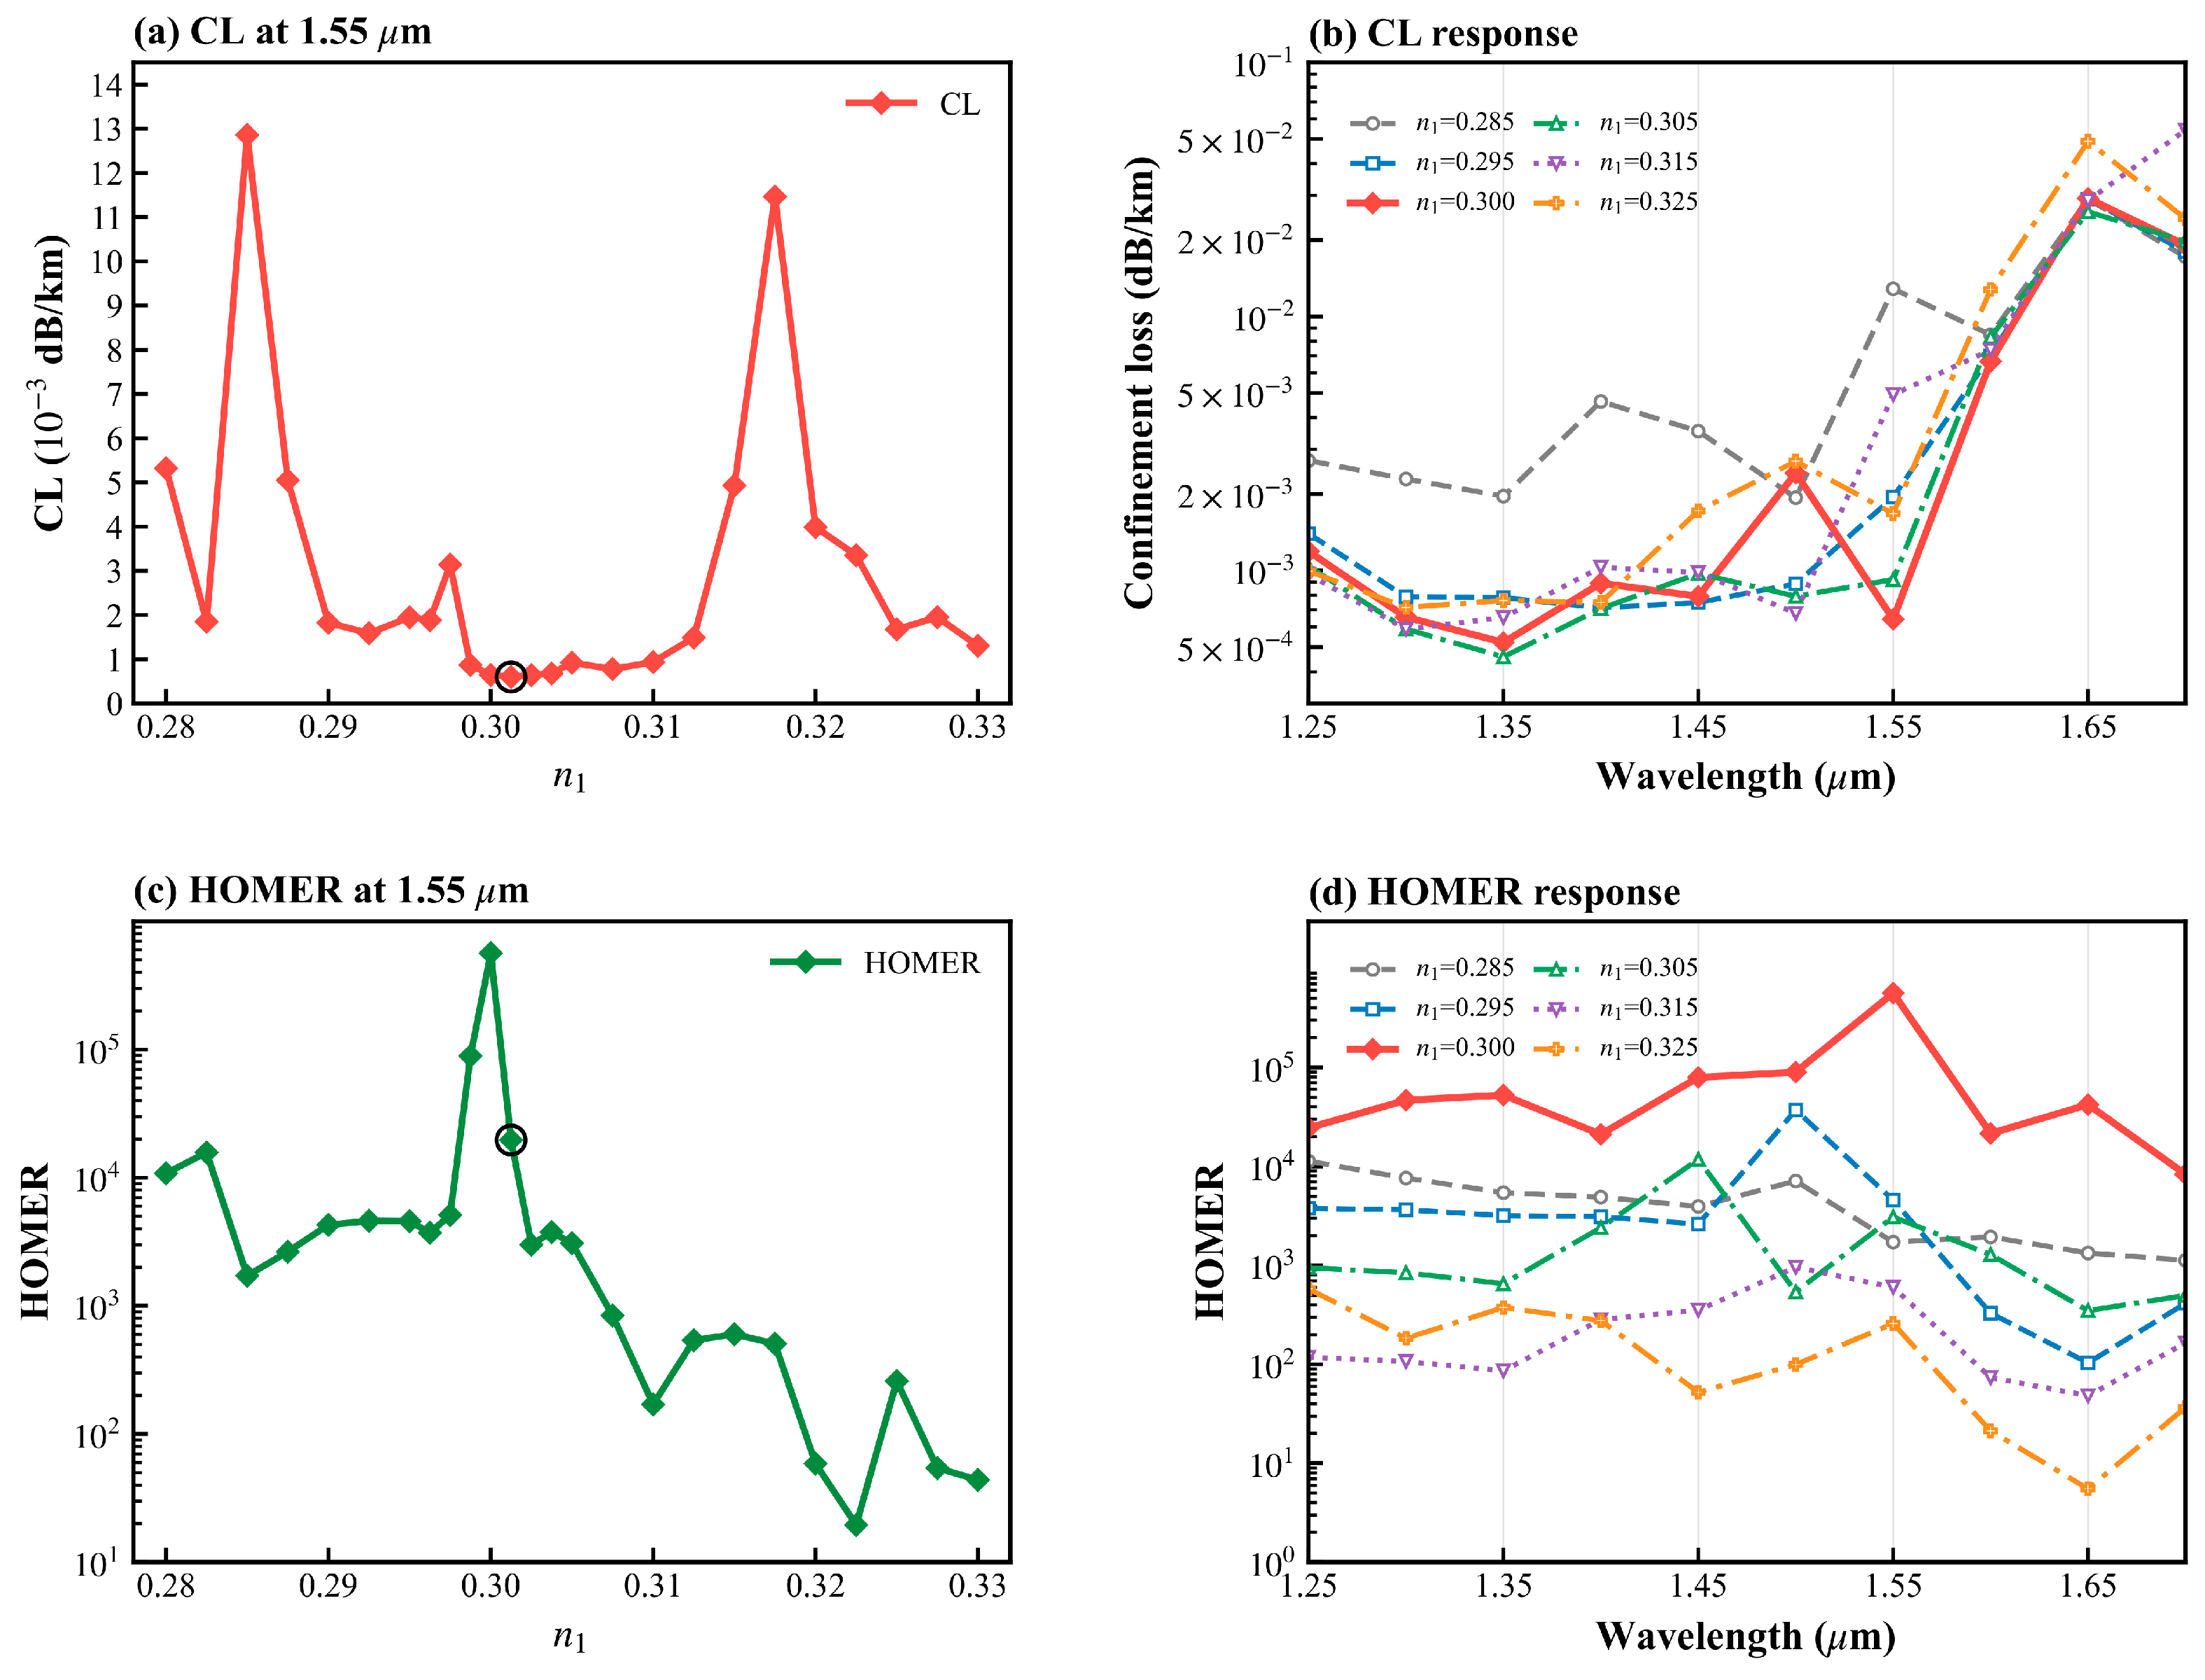
With , , , , and , is varied from 0.280 to 0.330.
Both metrics vary nonmonotonically. The lowest sampled FM loss is dB/km at , where HOMER is . At , the calculated FM and HOM confinement losses are and dB/km, giving HOMER = . Changing to 0.295 or 0.305 reduces HOMER to and , respectively. The response indicates that the lowest-loss HOM is particularly sensitive to capillary scale and local air gaps. The case also retains low FM loss over 1.25–1.60 and forms the most pronounced HOMER peak near 1550 nm. The response to the circular-capillary coefficient is shown in Figure 4.
Figure 4.
Effect of : (a) FM confinement loss and (c) HOMER at 1550 nm; (b,d) wavelength responses for representative values. The circles in (a,c) mark the lowest-FM-loss sample.
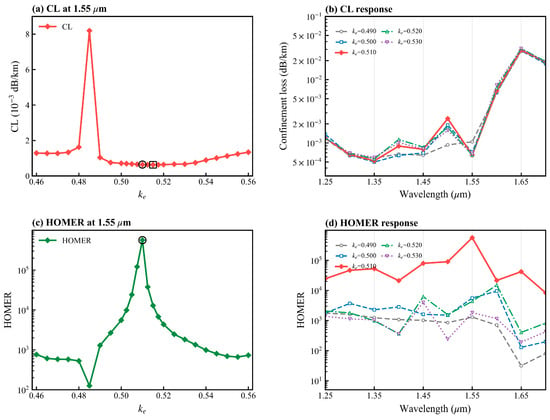
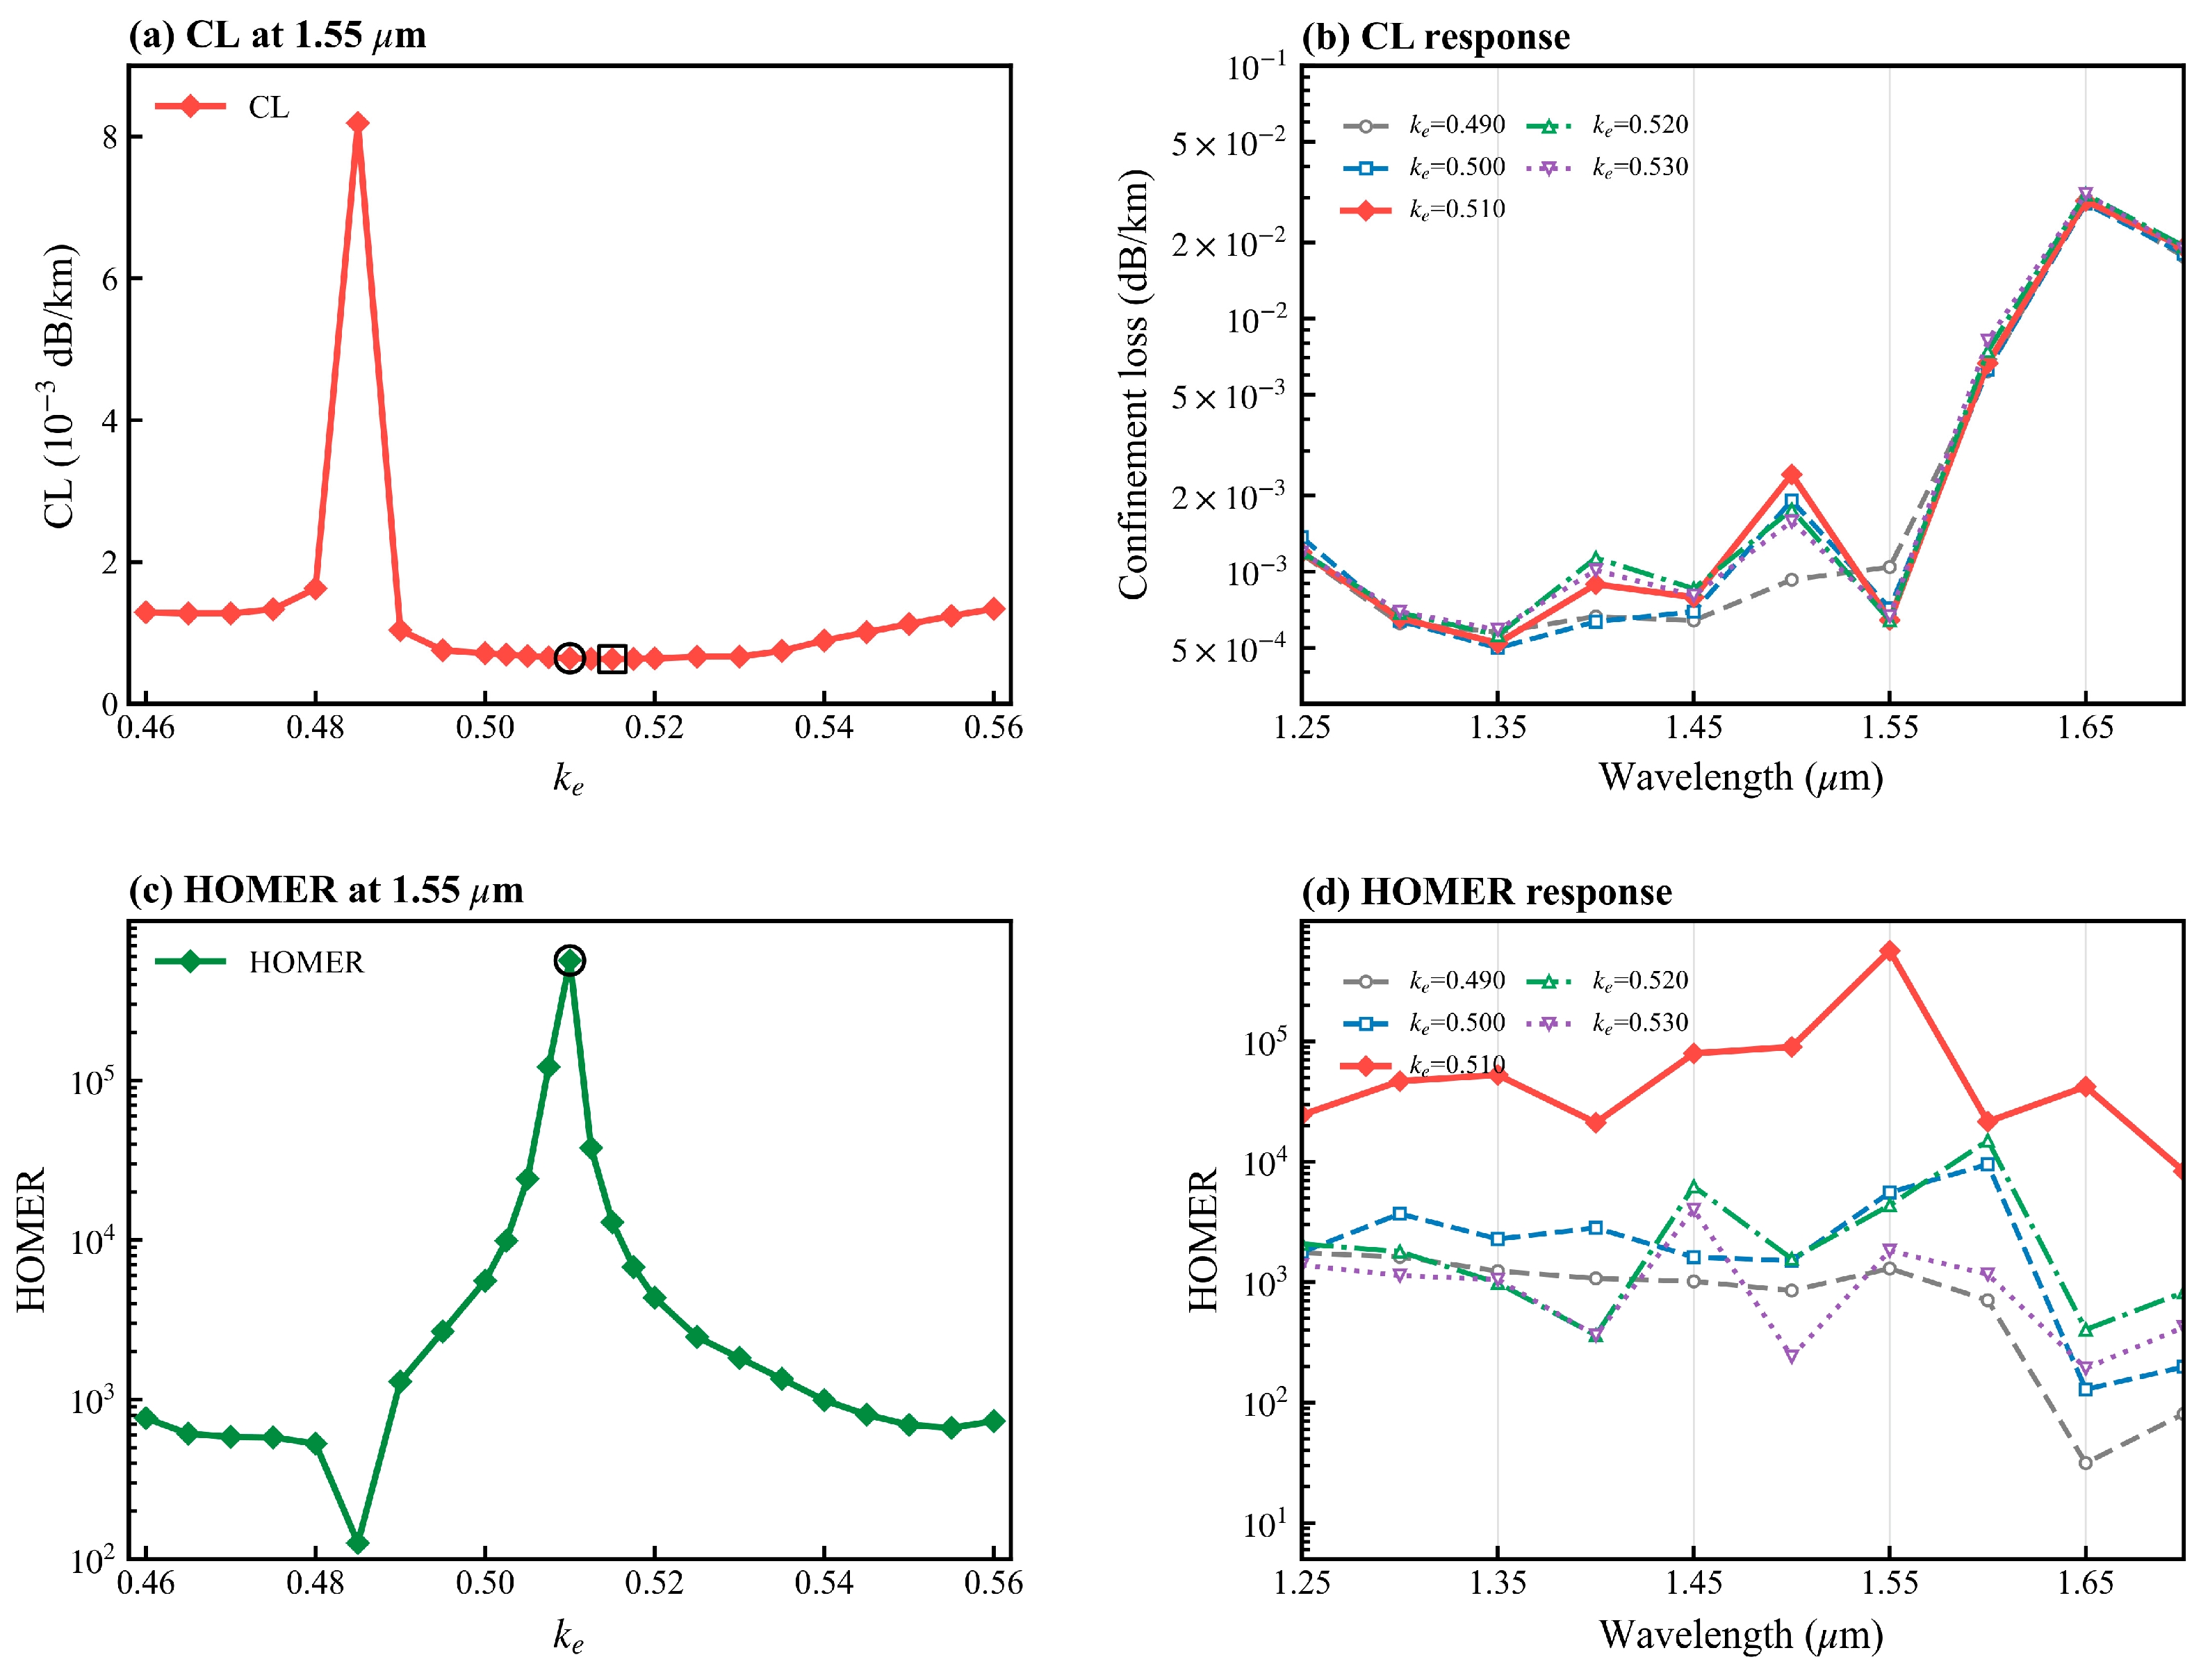
3.5. Elliptical-Ring Coefficient
The coefficient is varied from 0.460 to 0.560. It changes one semiaxis of the embedded elliptical ring and thereby modifies both its local curvature and adjacent air gaps.
The lowest sampled FM loss, dB/km, occurs at , where HOMER is . At , the FM loss is dB/km, while the HOM loss rises to dB/km and HOMER reaches . The distinct locations of the FM-loss minimum and HOMER maximum show why both metrics are required in the optimization. Figure 5 shows the effect of the elliptical-ring coefficient.
Figure 5.
Effect of : (a) FM confinement loss and (c) HOMER at 1550 nm; (b,d) wavelength responses for representative values. The circles mark the case, and the square in (a) marks the lowest-FM-loss sample.
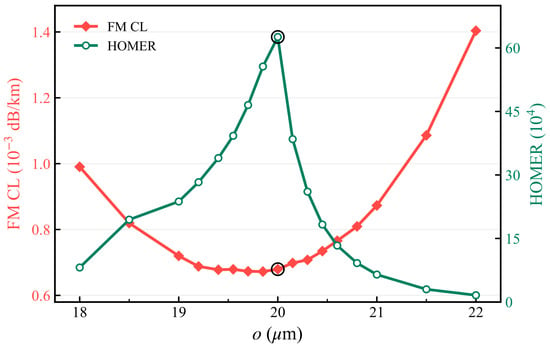
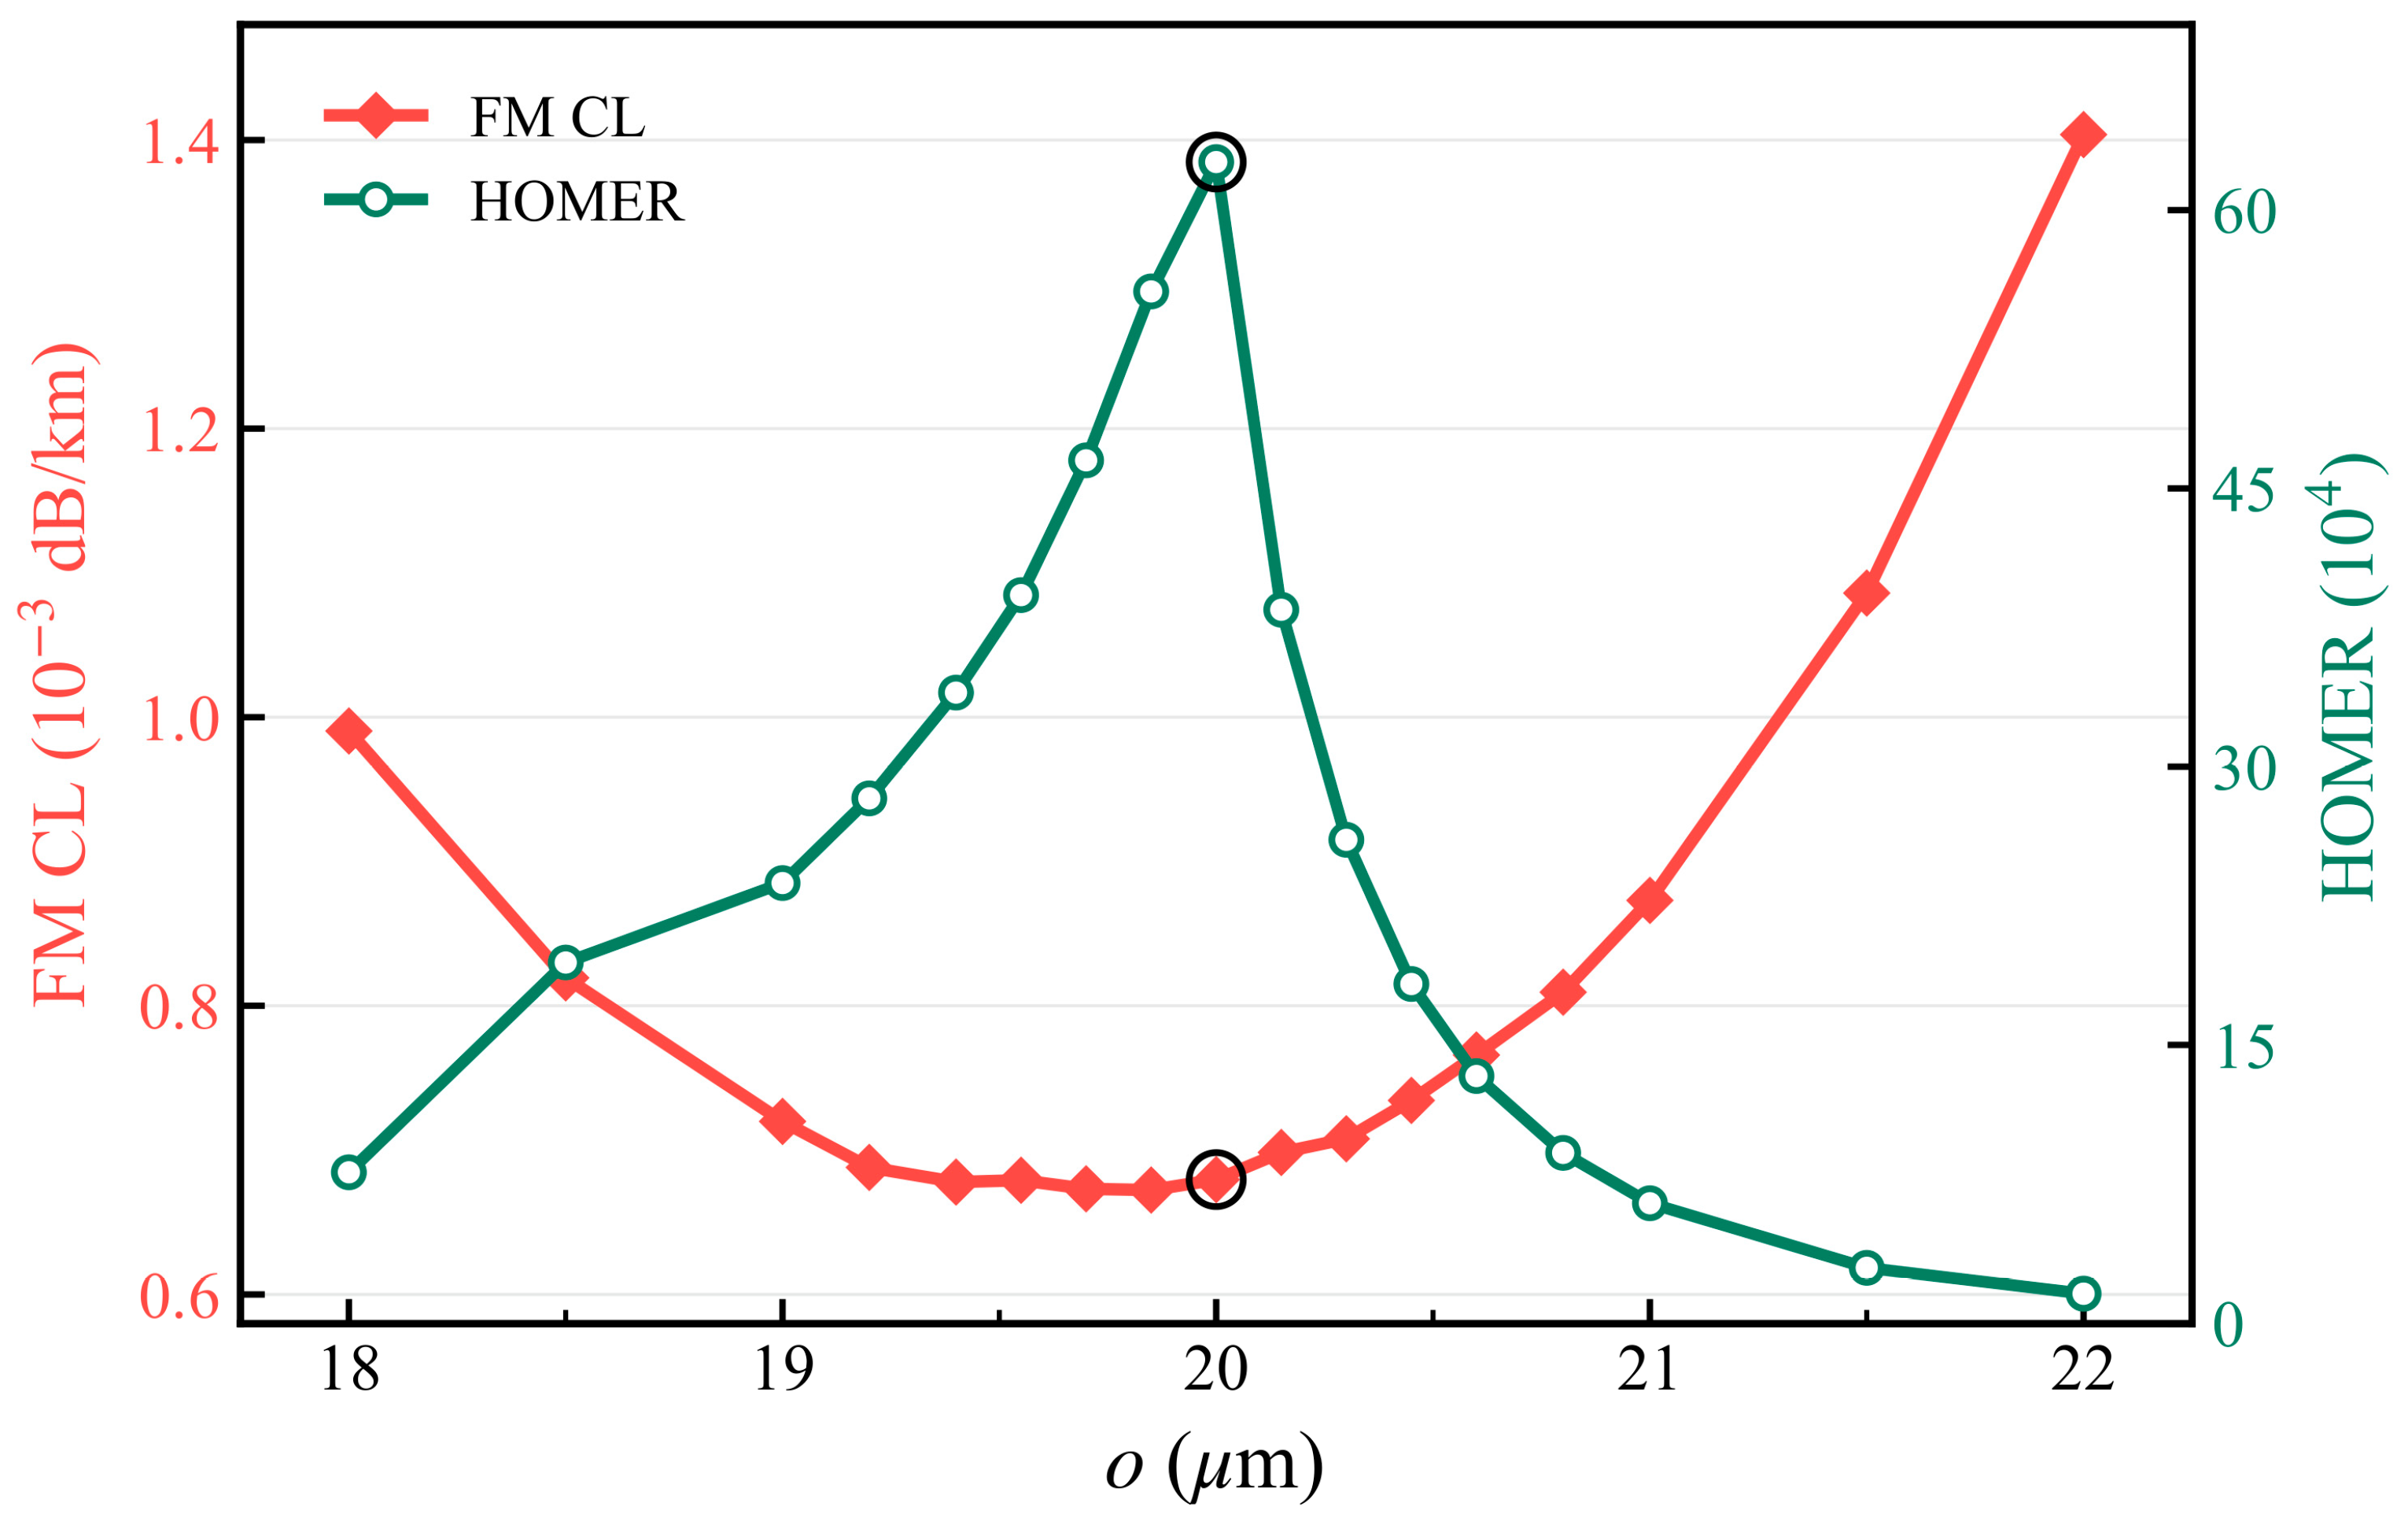
3.6. Composite-Unit Envelope
In the equal-scale scan, varies from 18 to 22 , while , , , and are fixed. The equal-scale envelope scan is shown in Figure 6.
Figure 6.
FM confinement loss and HOMER at 1550 nm as functions of the equal-scale composite-unit envelope . The black circles on the FM-loss and HOMER curves mark the selected o = 20 μm case.
The lowest sampled FM loss is dB/km at . At , the FM loss is dB/km and HOMER reaches the highest sampled value, . Further increasing rapidly reduces HOMER, reaching at . The result again demonstrates a trade-off between FM confinement and HOM attenuation.
3.7. Characteristic Circular-Tube Radius
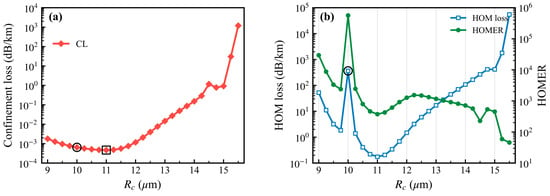
With , , , , and , is varied from 9 to 15.5 . Figure 7 shows the effect of the characteristic circular-tube radius.
Figure 7.
Effect of at 1550 nm: (a) FM confinement loss; (b) HOM confinement loss and HOMER. The black circles in (a,b) mark the selected Rc = 10 μm case; the black square in (a) marks the lowest-FM-loss sample at Rc = 11 μm.
The lowest FM loss in the scan, approximately dB/km, occurs at , but the HOM loss is only 0.17 dB/km and HOMER is approximately . At , the FM and HOM losses are and dB/km, respectively, and HOMER reaches . Above , FM leakage increases sharply, showing that this scale strongly affects the near-core boundary and local resonance conditions.
Taken together, the scan results reveal a hierarchy of geometric effects. and primarily locate the antiresonant windows; and alter the scale and relative position of the near-core circular capillary; and and modify local curvature and air gaps. Because the FM-loss minima and HOMER maxima do not generally coincide, these scans are evaluated jointly to identify the region used for final selection.
3.8. Final Parameters and Wavelength Response
A multiparameter refinement is carried out within and around the sensitive regions identified above. Candidate points are first checked for valid Boolean geometry and are then compared using both FM loss and the loss of the lowest-loss core-guided HOM. The final point is selected from the overlap between low FM leakage and strong HOM attenuation. The resulting parameters are listed in Table 1.
Table 1.
Parameters of the final composite-cladding geometry.
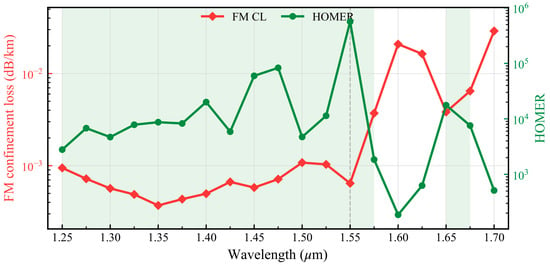
The final structure is evaluated over 1.25–1.70 . A study-specific effective window is defined by FM confinement loss dB/km and HOMER > . The second condition requires at least three orders of magnitude of confinement loss separation between the identified HOM and FM. The reported ranges are bounded by the outermost calculated wavelengths satisfying both criteria. The wavelength response of the final structure is shown in Figure 8.
Figure 8.
Wavelength response of the final structure. The red curve is the FM confinement loss, and the green curve is HOMER. Markers denote calculated values. The shaded regions span consecutive calculated wavelengths satisfying FM loss dB/km and HOMER > ; the dashed line marks 1550 nm.
The calculated wavelengths satisfying both criteria form two sampled ranges, 1.250–1.575 and 1.650–1.675 . The samples at 1.600 and 1.625 do not satisfy both criteria, reflecting rapid spectral variation between the two ranges. At 1550 nm, the calculated FM and HOM confinement losses are and dB/km, giving the highest sampled HOMER, . At 1.35 , the FM loss is dB/km and HOMER is . At 1.60 , the FM loss increases to dB/km and HOMER falls to . At 1.65 , the FM loss returns to dB/km with HOMER . Thus, the representative wavelength is chosen from the joint FM-loss and modal-discrimination response rather than from the FM-loss minimum alone.
3.9. Comparative Numerical Results for Representative Nested Structures
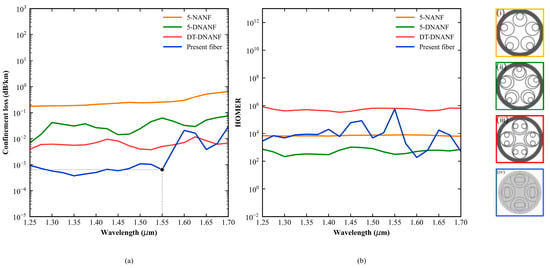
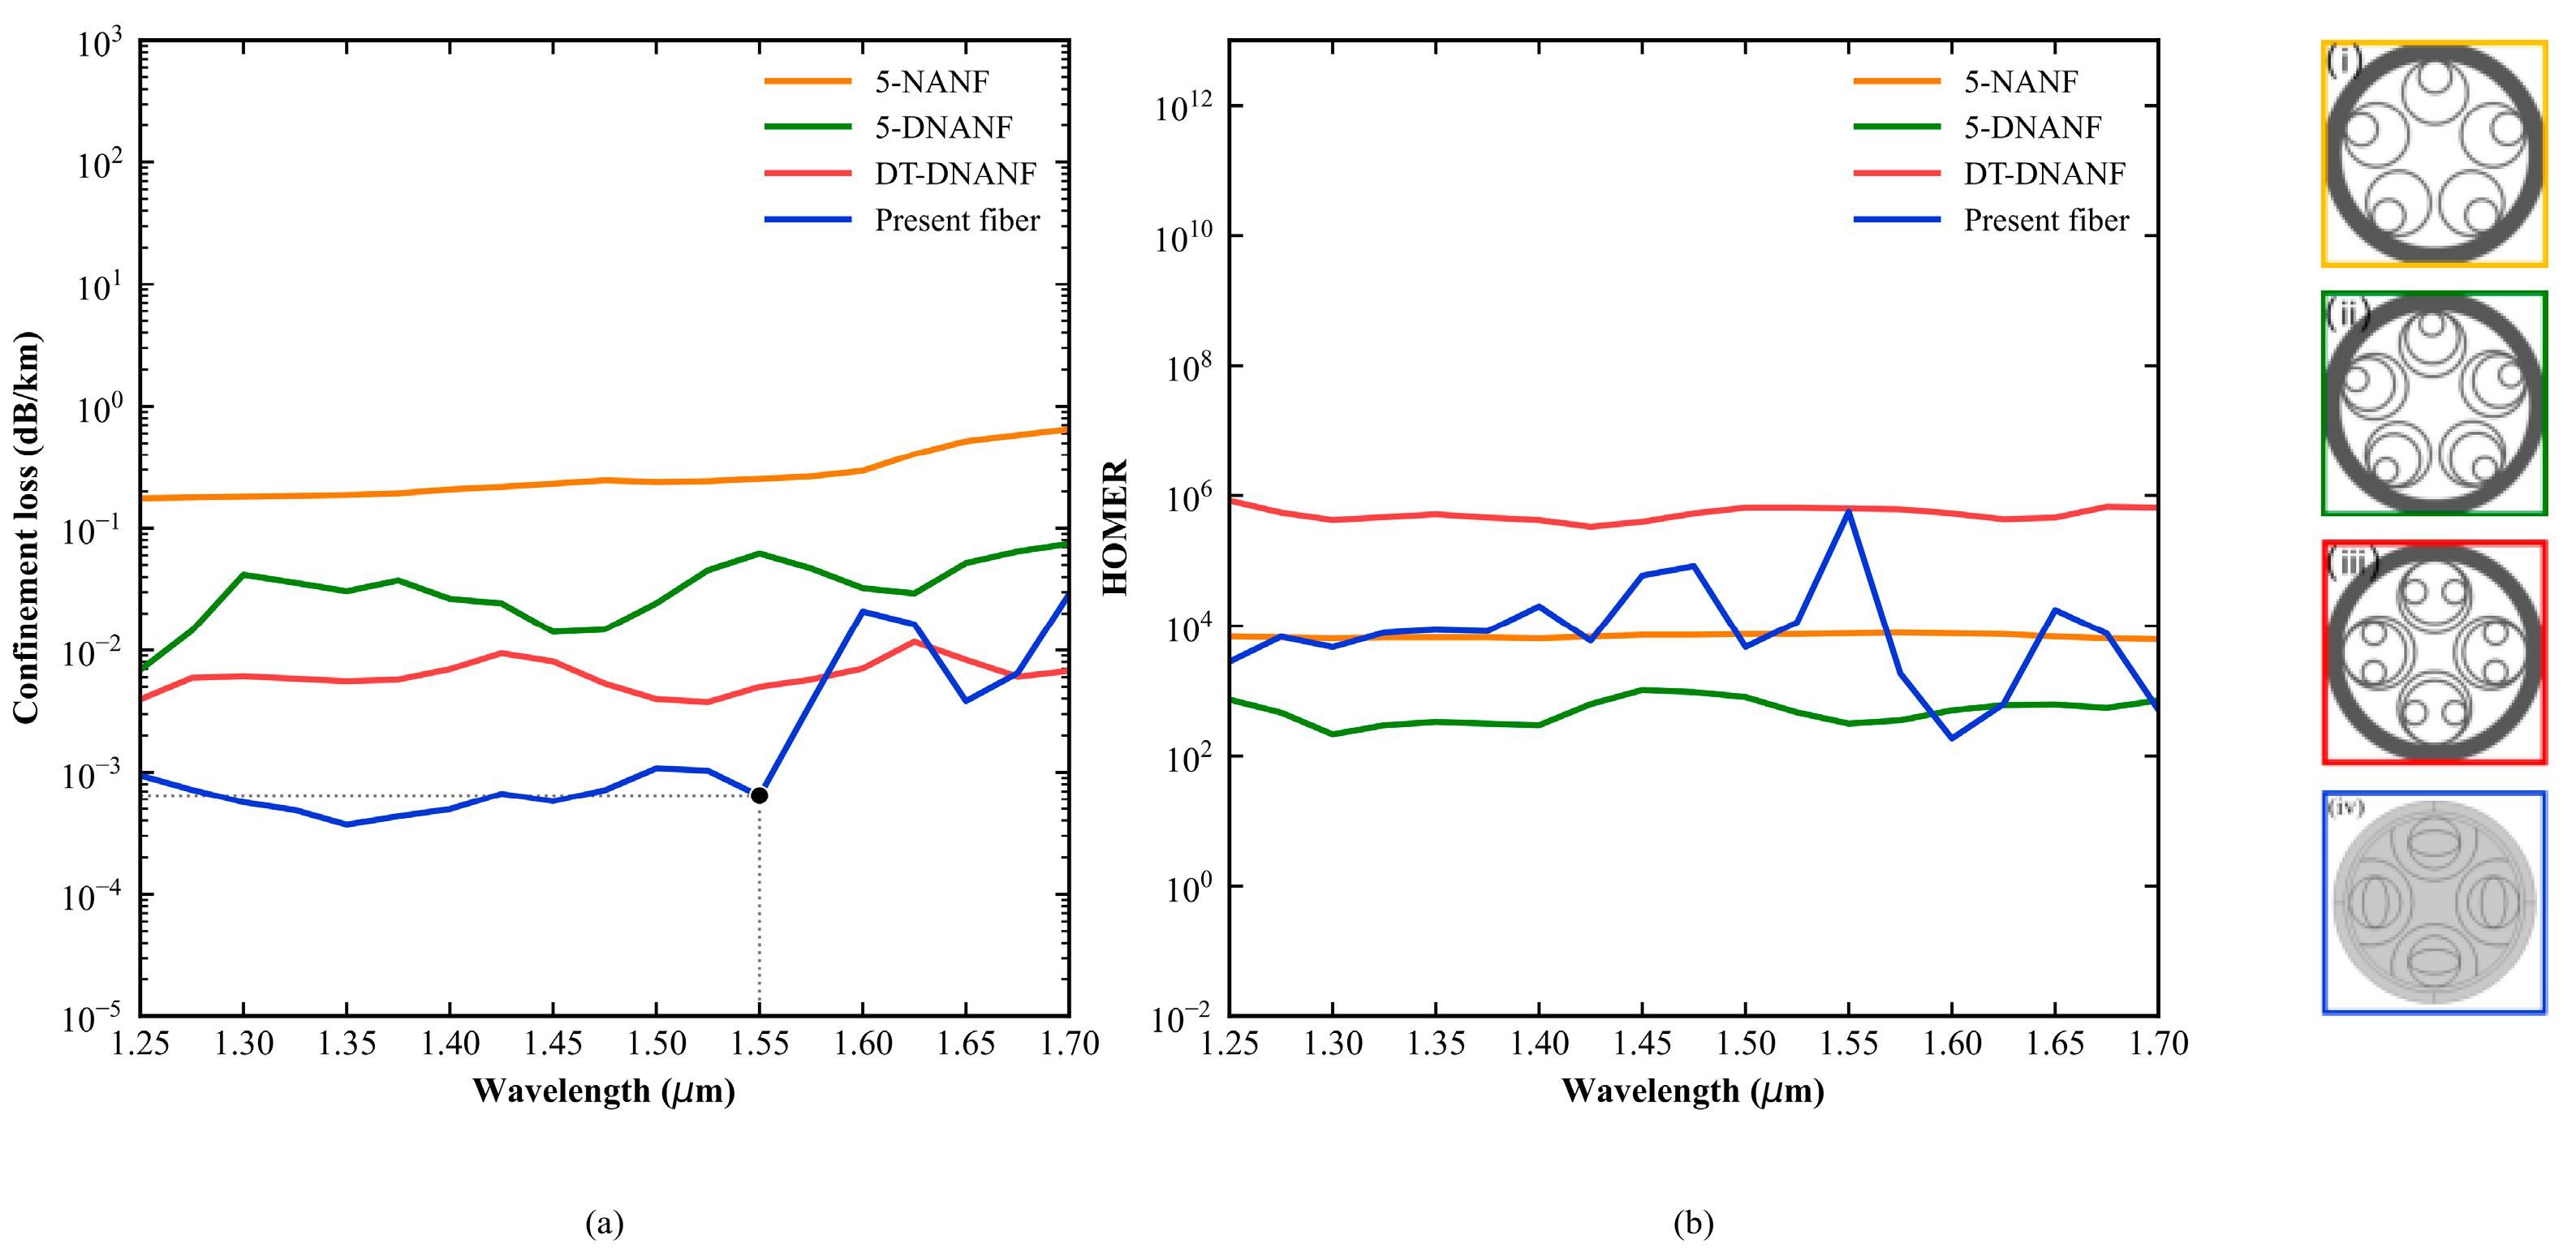
Figure 9 places the calculated response of the present geometry alongside published results for 5-NANF, 5-DNANF, and DT-DNANF over 1.25–1.70 . The three literature curves were digitized from Figure 6 of Li et al. [15], and the corresponding cross sections were redrawn from that source. The underlying optimized structures were originally reported by Habib et al. [16], Jasion et al. [17], and Wang and Chang [18]. The present curve uses the dataset shown in Figure 8. This comparison places the calculated response in context by showing spectral trends and orders of magnitude across studies with different geometries and numerical settings.
Figure 9.
Spectral comparison over a common wavelength interval: (a) FM confinement loss and (b) HOMER. Cross sections (i–iv) represent 5-NANF, 5-DNANF, DT-DNANF, and the present geometry, respectively. The first three curves and cross sections were digitized or redrawn from Figure 6 of Li et al. [15]; the present curves are calculated in this study. The black dot in (a) marks the present design at 1550 nm; the horizontal and vertical dotted lines guide the reading of its FM confinement loss and wavelength, respectively.
Table 2 summarizes the confinement loss and HOMER at the representative wavelength of 1550 nm for the present design and selected nested or fourfold-cladding structures.
Table 2.
Indicative comparison of representative HC-ARF designs at 1550 nm.
The values for 5-NANF, 5-DNANF, and DT-DNANF are approximate readings of the curves digitized from Figure 6 of Li et al. [15]; the fourfold semi-tubular values are those reported by Zhao et al. [12]; values for this work are calculated from the final-structure wavelength scan. The entries provide an indicative literature comparison across different geometries and numerical settings.
3.10. Bend Response
Weak bending along the direction is represented using the equivalent-index approximation [19],
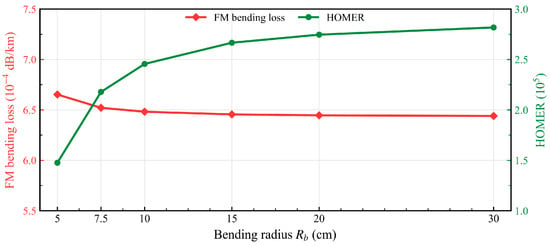
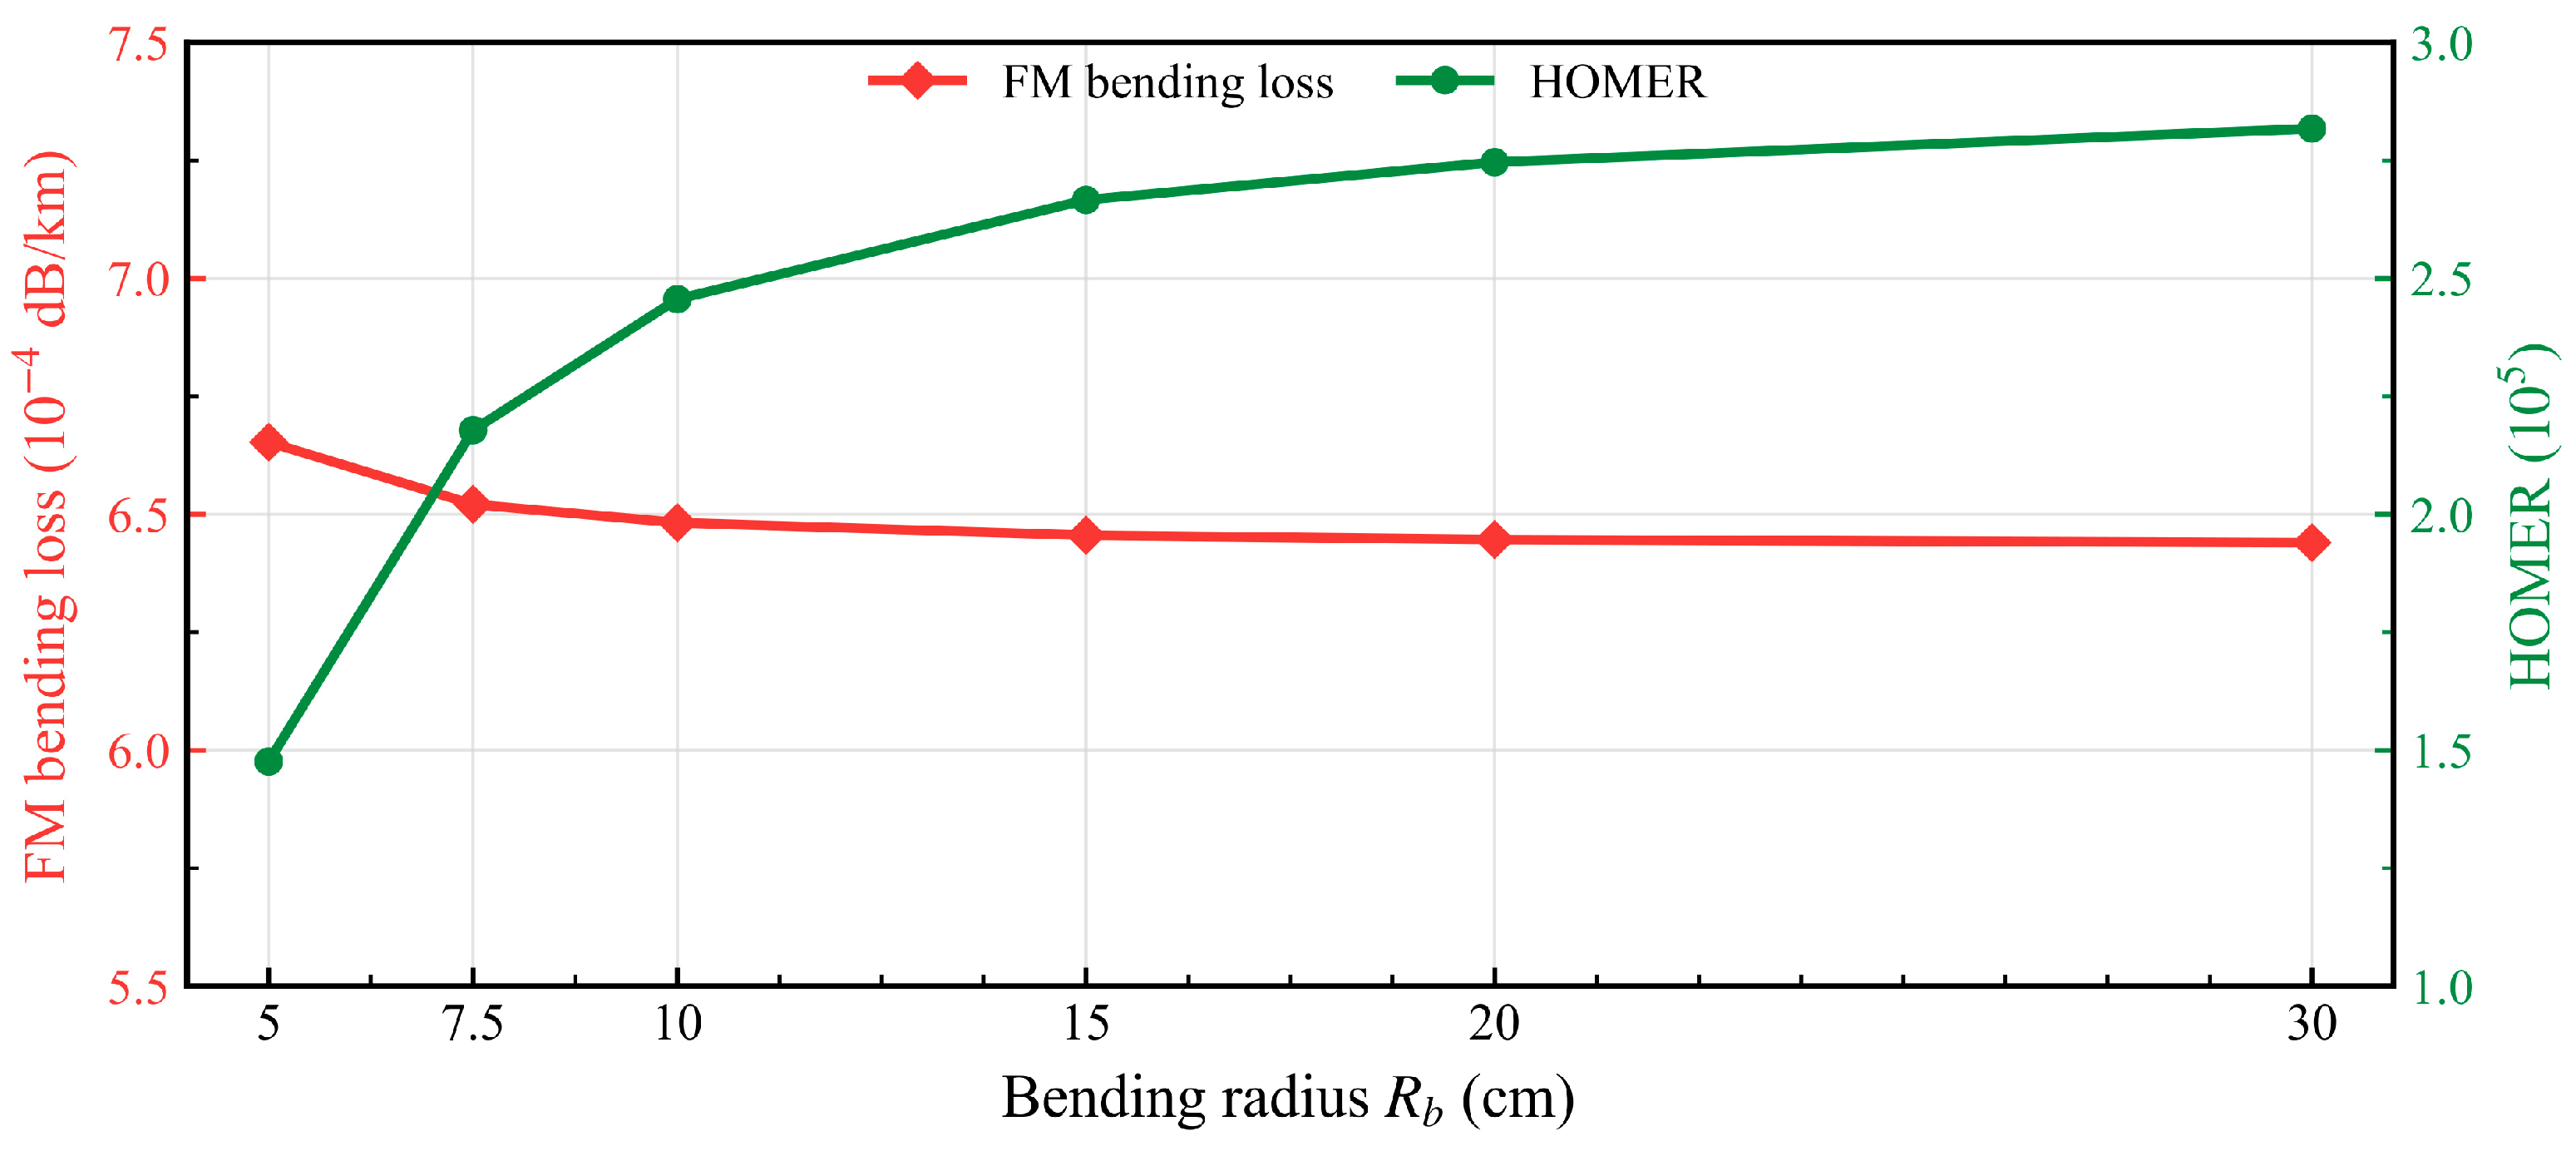
where is the bend radius and the first-order approximation requires . Figure 10 shows the calculated bend response of the final structure.
Figure 10.
FM confinement loss and HOMER of the final structure versus bend radius .
As increases from 5 to 30 cm, the calculated FM confinement loss decreases from to dB/km, while HOMER increases from to . The weaker transverse index gradient at larger radii reduces bend-induced displacement and field penetration. At 30 cm, the FM loss approaches the straight-fiber value, but HOMER remains below the straight-fiber value of . Thus, the calculated weak bends retain substantial modal-loss separation, although bending reduces the HOM-suppression margin. Bend-dependent leakage reflects the complex-eigenmode response of the composite cross section and its coupling to cladding states. The equivalent-index transformation specifies the bend perturbation, and the resulting loss is evaluated numerically for each bend radius.
3.11. Synchronous Rotation of the Embedded Elliptical Rings
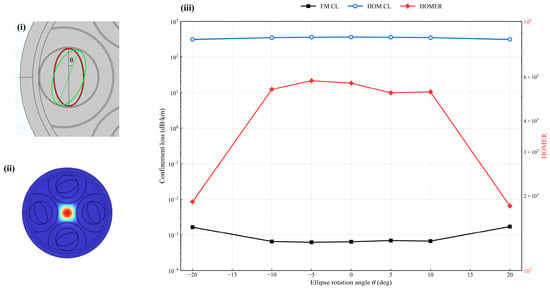
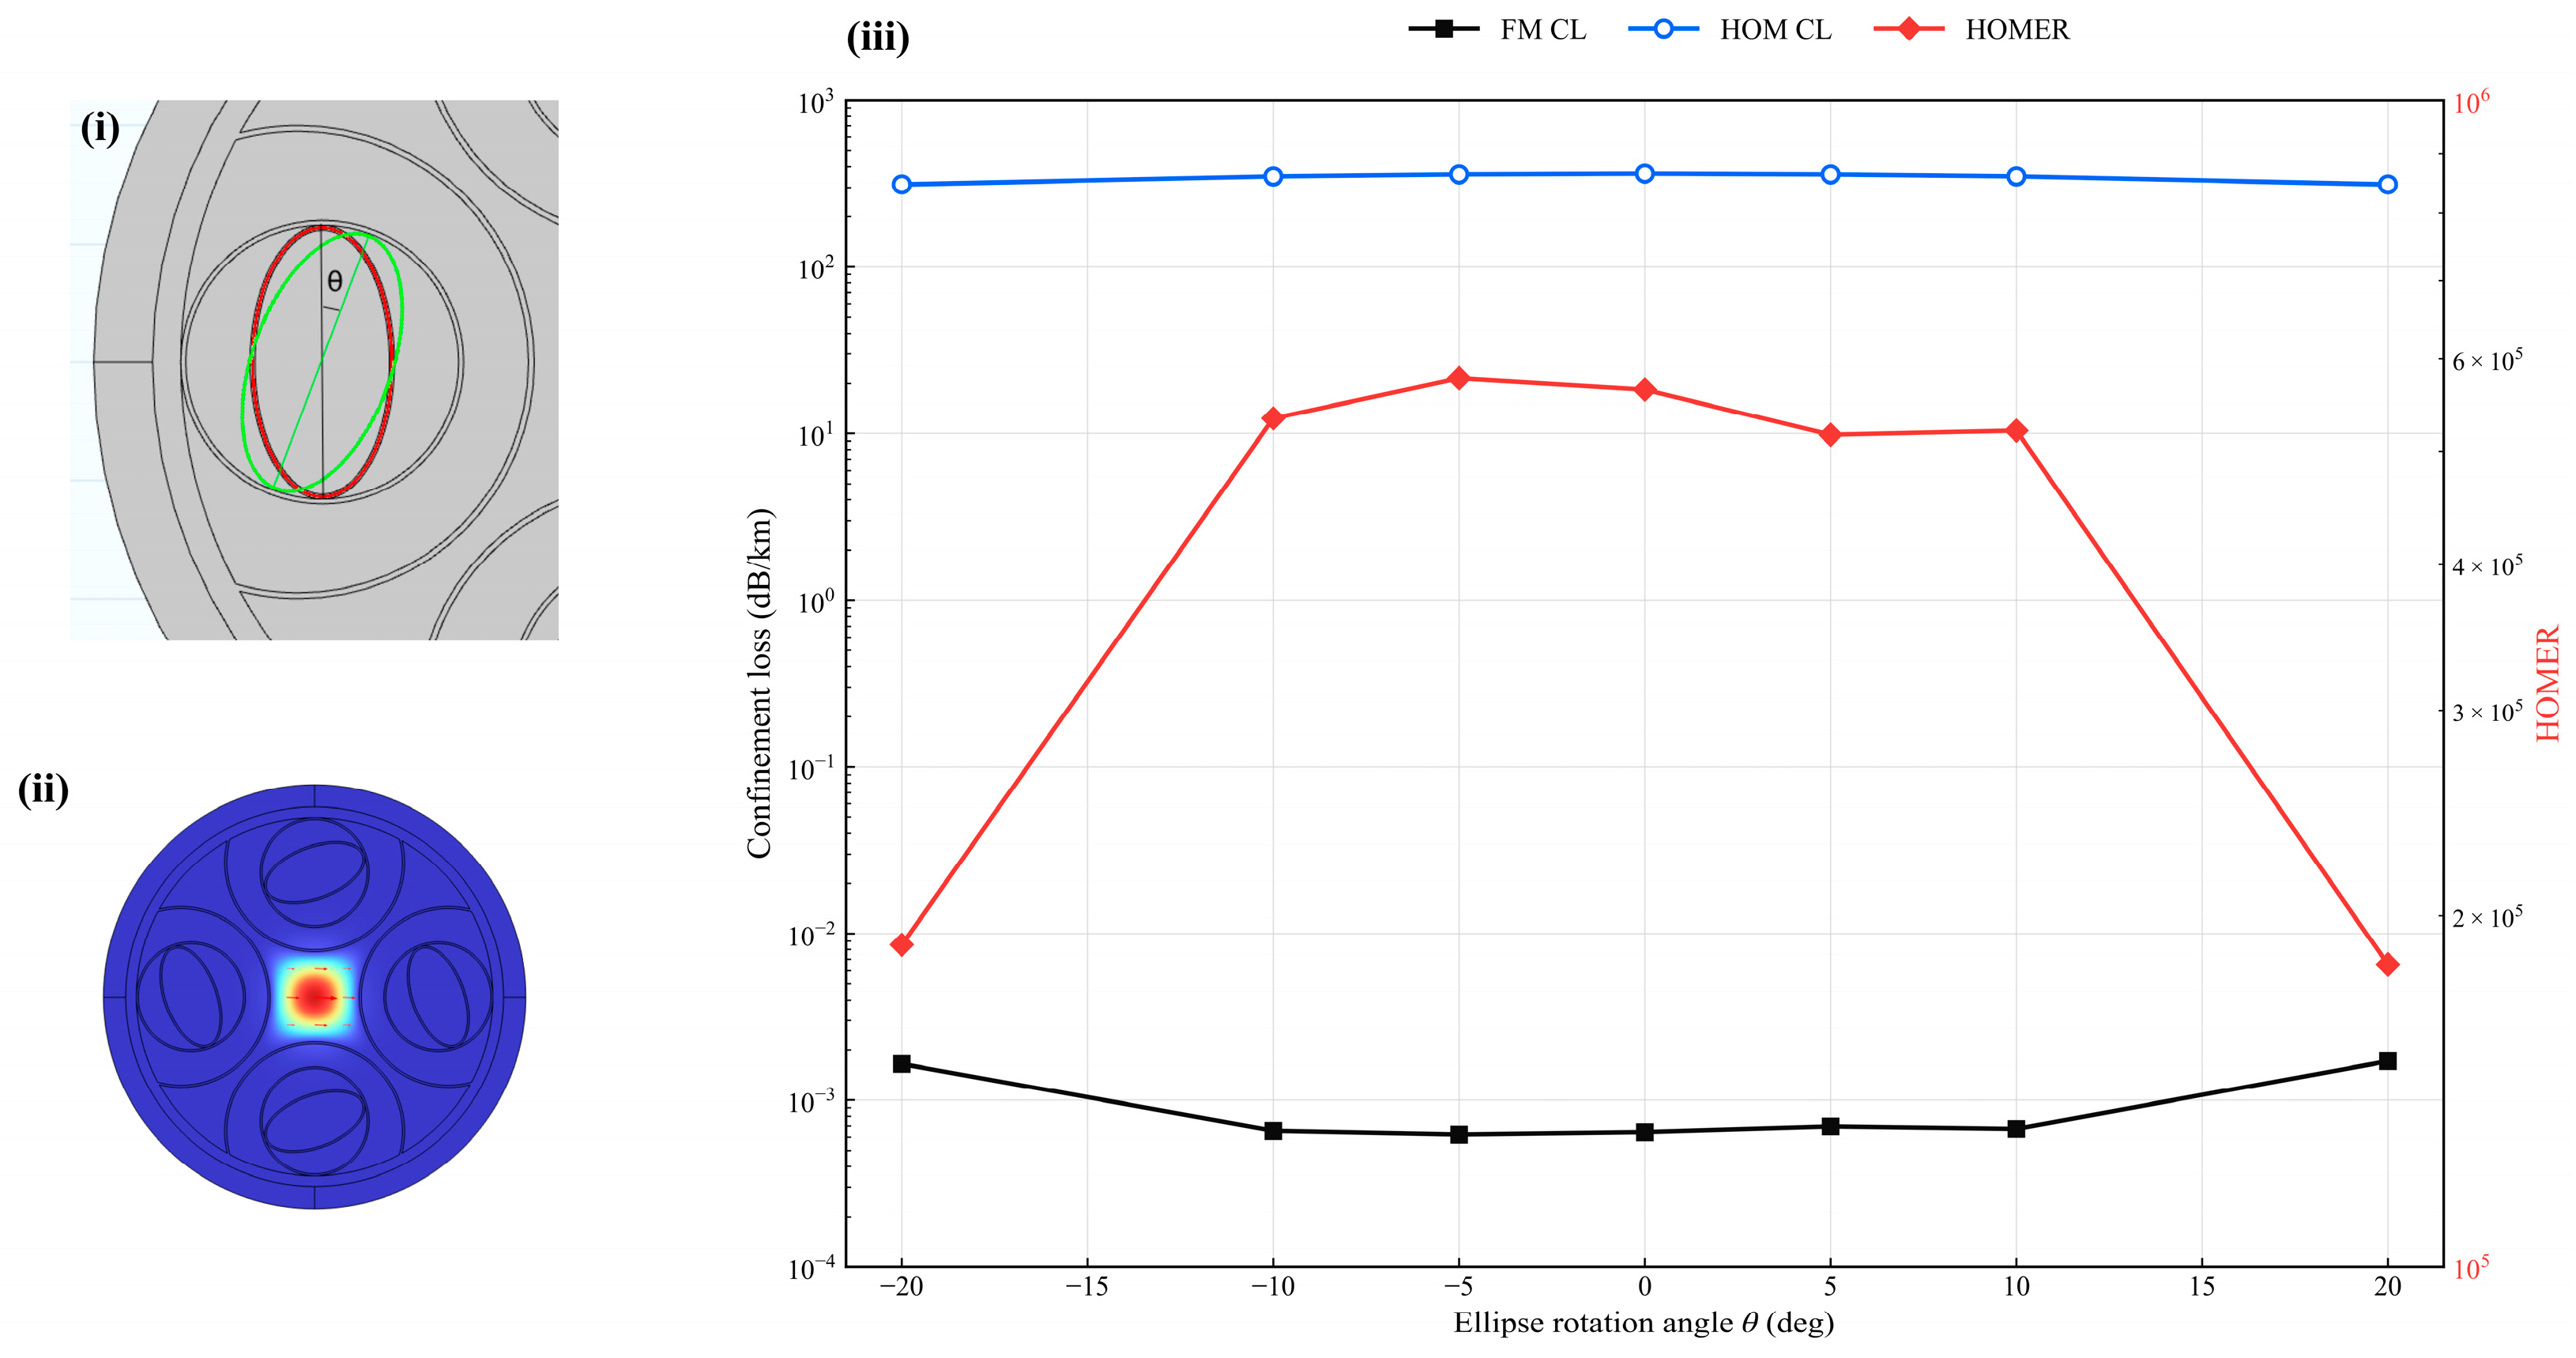
The four embedded elliptical rings are synchronously rotated from to . Figure 11 shows the response to synchronous rotation of the embedded elliptical rings.
Figure 11.
Sensitivity to synchronous rotation of the embedded elliptical rings: (i) rotation-angle definition; (ii) FM field at ; and (iii) FM confinement loss, HOM confinement loss, and HOMER. In (i), the red and green ellipses denote the unrotated and rotated ring orientations, respectively, and θ is the angle between their major axes. In (ii), red and blue denote higher and lower field magnitudes, respectively, and the red arrows indicate the transverse electric-field direction.
Changes in FM loss and HOMER remain comparatively limited for and . At , the FM loss increases and HOMER decreases. Rotation changes the gaps between each elliptical ring and its neighboring circular ring, redistributing field extension near the core boundary. The FM at retains a single central lobe, but its cladding-directed extension is stronger, consistent with the increased confinement loss.
3.12. Multidimensional Geometric Perturbations
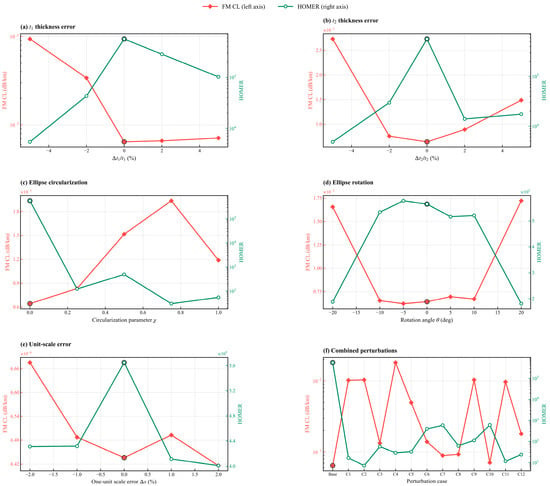
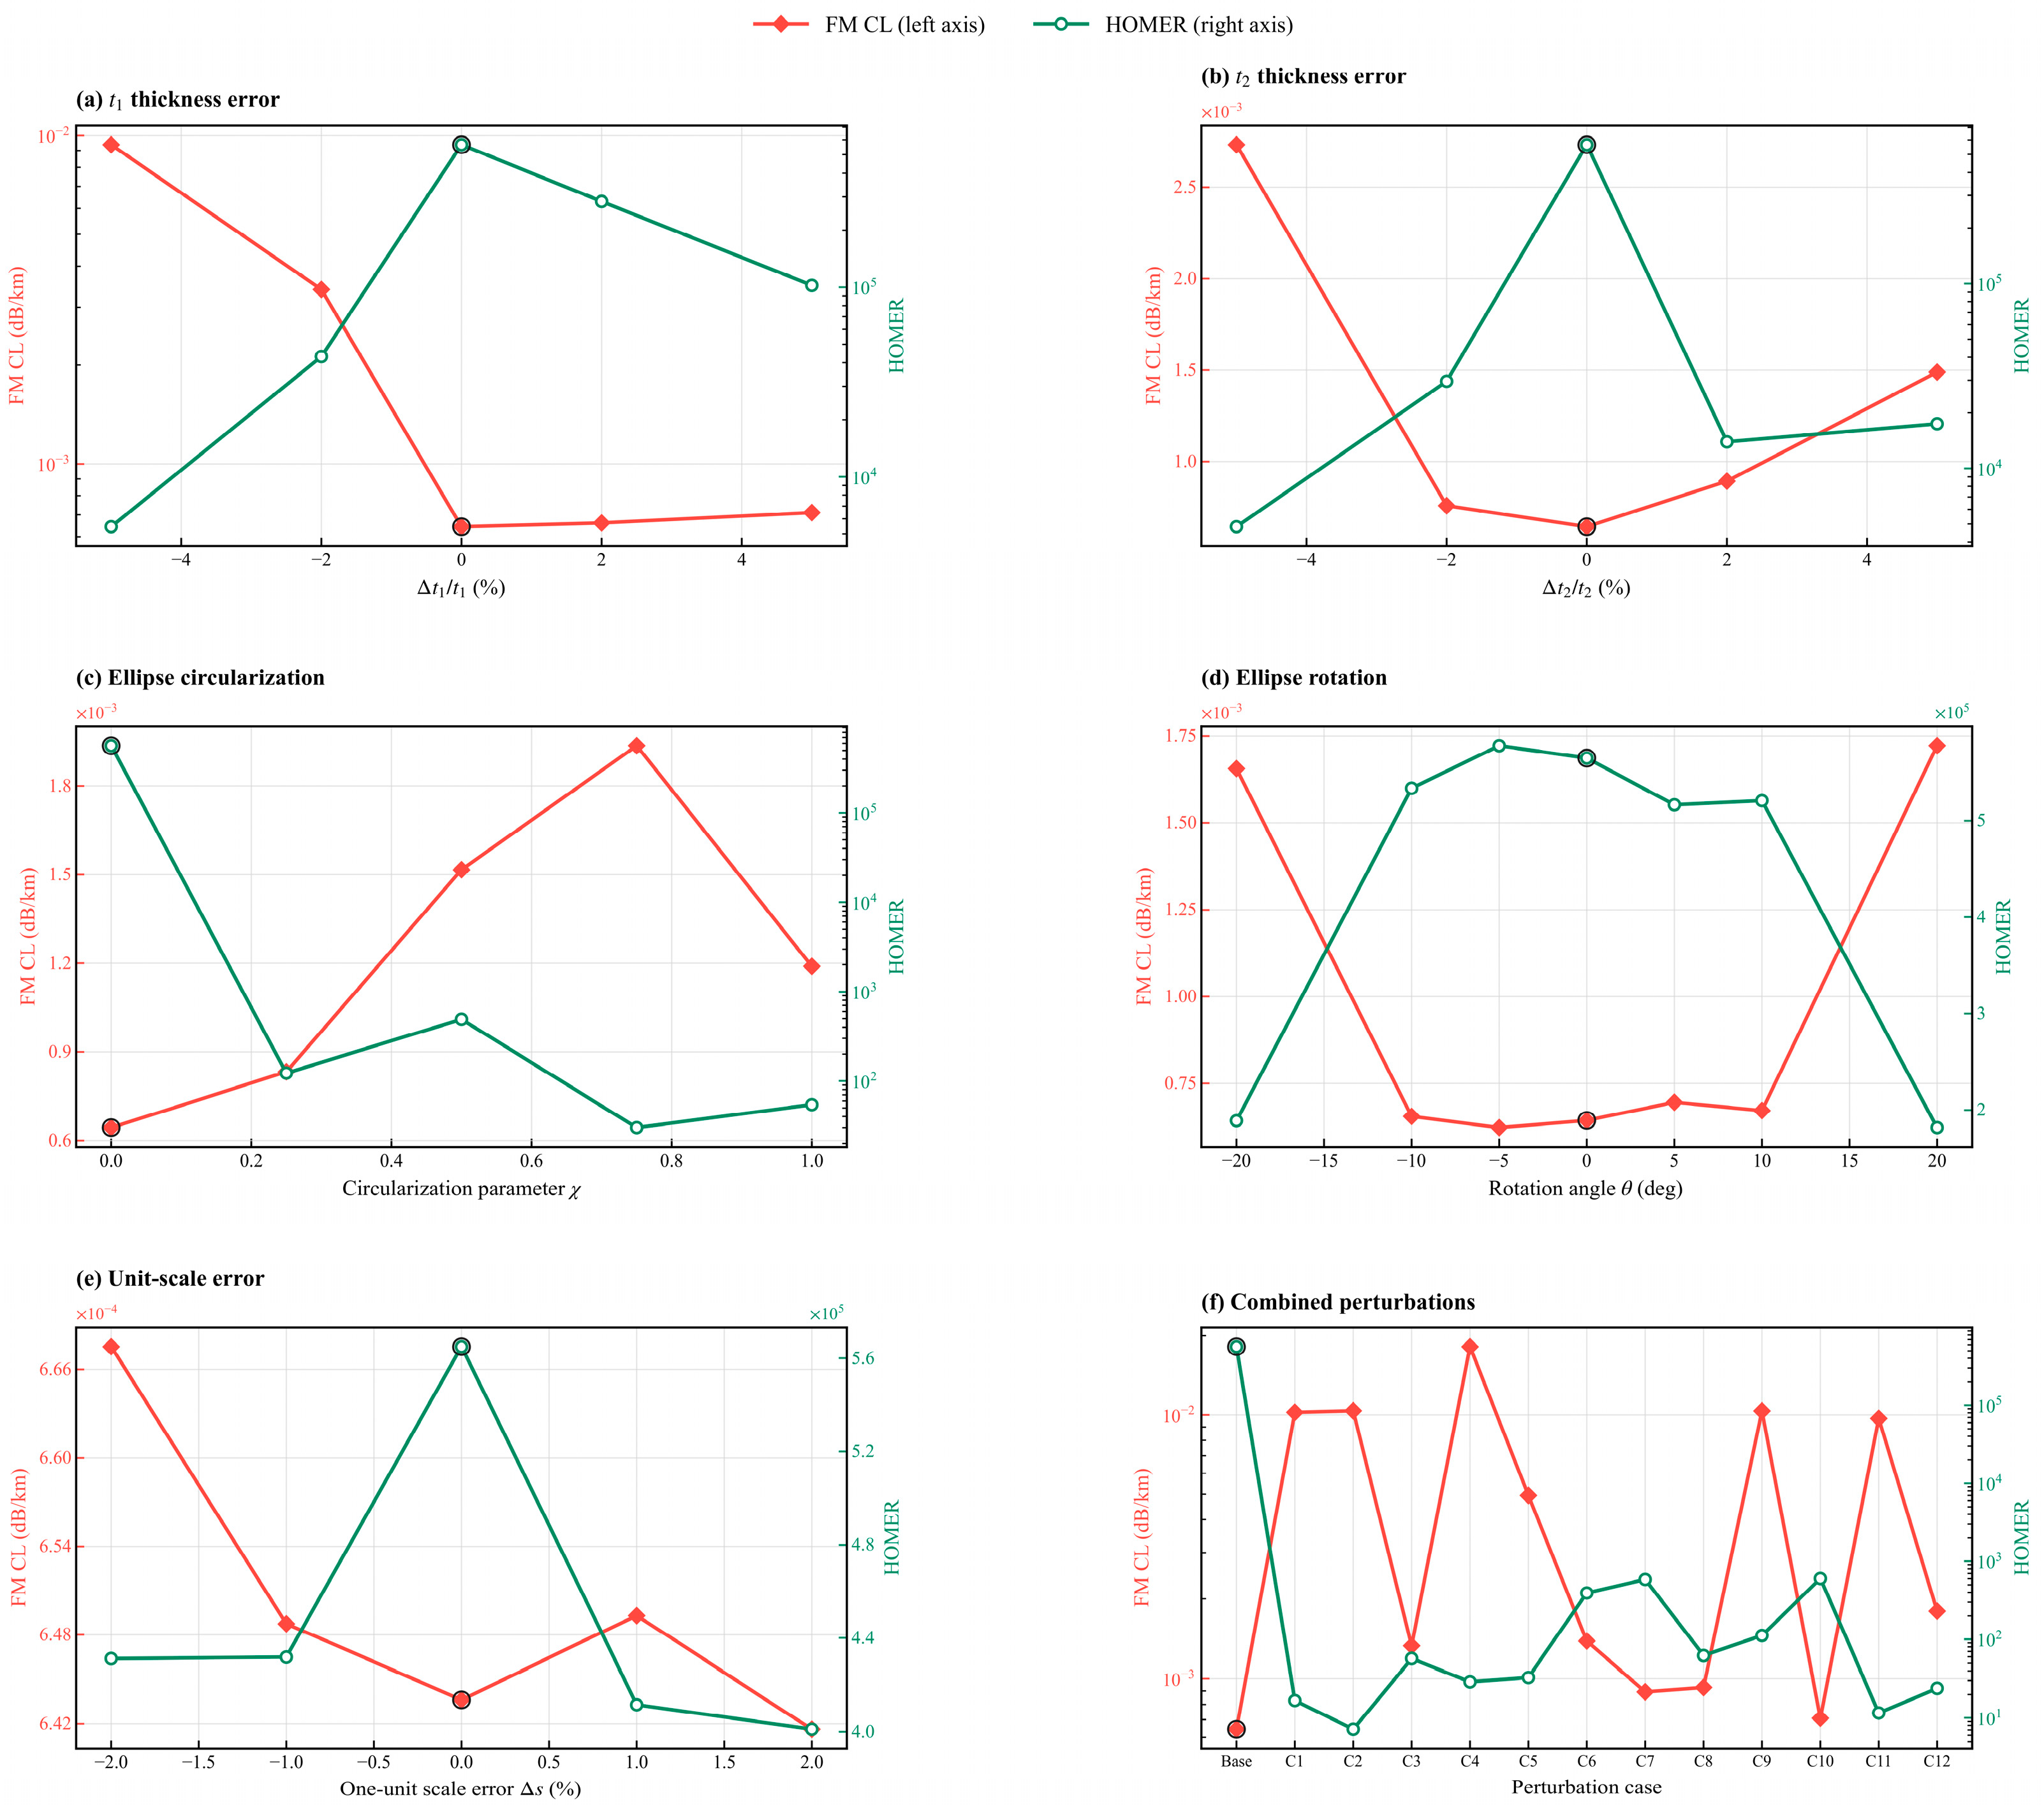
Cross-sectional evolution during drawing is governed by pressure differences, viscous stresses, and surface tension. Pressure settings and initial preform dimensions can also cause nonuniform capillary expansion or premature contact [20]. The possible cross-sectional consequences are assessed through static geometric perturbations: independent and errors in and , circularization and synchronous rotation of the elliptical rings, and uniform scaling of one composite unit, and 12 representative combined perturbations. Figure 12 summarizes the sensitivity to these geometric perturbations.
Figure 12.
Geometric sensitivity at 1550 nm: independent errors in (a) and (b) ; (c) linear circularization of the embedded elliptical rings; (d) synchronous ring rotation; (e) scaling error of one composite unit; and (f) combined perturbations. The left axis gives FM confinement loss and the right axis gives HOMER. The ring marker and “Base” denote the unperturbed cross section.
The circularization path is parameterized as
where and are the initial semiaxes; corresponds to the designed ellipse, and corresponds to a circle with the same area as the initial ellipse. The static path varies the semiaxes linearly between these endpoints; intermediate states are not constrained to preserve area. Before each eigenmode solution, the Boolean geometry is rebuilt and checked for intersecting glass walls, valid domains and boundaries, and a valid mapped PML mesh. Modes are identified from their core-field topology. The parameter combinations for the combined perturbation cases C1–C12 are listed in Table 3.
Table 3.
Combined perturbation cases C1–C12. The relative scale error of one composite unit is .
For the independent thickness errors, the calculated FM confinement loss spans – dB/km and HOMER decreases to –. The responses are asymmetric because a thickness deviation both shifts the antiresonant window and changes local curvature and air gaps.
For the nonzero circularization cases, the FM loss is between and dB/km, while HOMER falls to 30.0–. For synchronous rotations of and , HOMER remains within –. At , the FM loss reaches – dB/km and HOMER decreases to –.
Scaling one composite unit by – changes the FM loss from to dB/km and gives HOMER values of –. The combined cases C1–C12 extend the FM loss to – dB/km and reduce HOMER to 7.16–. These representative combinations quantify the effect of coexisting geometric deviations. The combined cases produce substantially larger degradation than the investigated single-unit scale errors.
Within the investigated perturbations, membrane-thickness errors and elliptical-ring circularization substantially affect modal-loss discrimination. The results identify both features as important targets for fabrication control.
4. Discussion
4.1. Interpretation and Comparison with Prior Structures
The comparison in Figure 9 and Table 2 places the present design within the range of reported HC-ARF results. The published curves were digitized from a secondary comparison and were obtained for different geometries and numerical settings; the values therefore support contextual interpretation rather than a controlled ranking. At 1550 nm, the present calculated FM confinement loss is approximately one order of magnitude below the digitized DT-DNANF value, while their HOMER values are of the same order. The present design thus combines low calculated FM leakage with strong HOM attenuation at the target wavelength, while showing a more wavelength-selective HOMER response. In contrast, DT-DNANF maintains HOMER values in the range across a broader part of the compared interval, consistent with the role of double-nested tubes in modifying core–cladding coupling [18].
The optimization results show why FM confinement loss and HOMER must be considered together: their extrema do not generally occur at the same parameter values. The selected geometry is a compromise within the sampled design space, and its two sampled wavelength ranges satisfying the stated criteria are separated by a higher-loss interval near 1.60–1.625 . The bend calculations likewise show that a small change in FM loss does not imply an unchanged modal discrimination margin: HOMER remains below its straight-fiber value at the largest bend radius examined. These results define the wavelength and bend conditions under which the modeled modal selectivity is obtained.
The geometric perturbation results connect the modal response to features that may be altered during fabrication. Within the cases examined, membrane-thickness deviations and circularization of the embedded elliptical ring cause the strongest reductions in modal-loss discrimination. This identifies them as priority geometric controls for subsequent preform and drawing studies, rather than as evidence that the proposed cross section has already been experimentally realized.
4.2. Fabrication Perspective and Scope
The outer cladding element is semicircular, and preservation of the embedded elliptical ring is a key geometric challenge. Semi-tubular HC-ARFs have been fabricated by stack and draw, providing a process reference for assembling and drawing semicircular elements [11]. An experimental fourfold truncated double-nested structure also indicates that few-element nested assemblies can retain prescribed relative positions under appropriate support and pressure conditions [13].
A candidate route would fabricate and screen capillaries with the two target wall thicknesses, prepare semicircular support tubes, and preassemble the elliptical and circular nested tubes into composite units. Four units would then be positioned symmetrically within a jacket before cane and fiber drawing. Independent or grouped pressurization of the core and capillary channels would need to be coordinated with furnace temperature, feed speed, draw speed, and tension. Existing drawing-dynamics models show that pressure difference, surface tension, glass viscosity, and initial capillary aspect ratio jointly determine thin-wall expansion, circularization, and contact [20]. Cross-sectional imaging should therefore monitor , , ellipticity, unit-to-unit dimensional spread, and the minimum gaps. Future work will investigate preform assembly and drawing conditions, with particular attention to pressure control, furnace temperature, and preservation of membrane thickness and elliptical-ring shape. Prototype fabrication and experimental characterization of cross-sectional fidelity and modal transmission will then be pursued.
The present study is a two-dimensional numerical eigenmode analysis and does not include a fabricated specimen or experimental transmission measurements. Its loss values describe confinement leakage in the ideal cross section; material absorption, surface scattering, contamination, and drawing-induced nonuniformity are not included. Accordingly, the comparison with measured attenuation in fabricated fibers is contextual, and experimental validation remains a subsequent step.
5. Conclusions
A fourfold HC-ARF with semicircular composite cladding units has been numerically investigated. Its defining design feature is the integrated cladding unit, which combines a semicircular outer element, a circular antiresonant capillary, and nested elliptical and circular rings. The contribution of this work is the numerical evaluation of this combined topology through modal-loss discrimination, wavelength response, bending, and fabrication-related geometric perturbations. The parameter scans show that the two membrane thicknesses set the antiresonant windows, whereas the capillary scale, elliptical-ring coefficient, unit envelope, and characteristic circular-tube radius control the near-core geometry and modal-loss separation.
For the selected structure at 1550 nm, the calculated FM and HOM confinement losses are and dB/km, respectively, giving HOMER = . The calculated wavelengths satisfying FM loss dB/km and HOMER > form two sampled ranges, 1.250–1.575 and 1.650–1.675 , within the simulated interval.
In the indicative 1550 nm comparison in Table 2, the present FM confinement loss is approximately one twenty-sixth of the reported fourfold semi-tubular value, while HOMER is approximately 14 times as large. Relative to the DT-DNANF comparison value, the FM confinement loss is approximately one eighth as large, with HOMER of the same order of magnitude. These literature-level comparisons highlight the joint low-FM-loss and high-HOM-loss response at the target wavelength. The design contribution is an integrated composite-cladding topology that combines membrane-thickness and nested-boundary control to achieve this modal-loss separation.
Within the investigated geometric perturbations, membrane-thickness errors and elliptical-ring circularization substantially affect modal-loss discrimination. These results identify both features as important targets for fabrication control. Together, the modal and perturbation results connect the optical design objective to the geometric features that must be preserved, providing a quantitative basis for subsequent fabrication and experimental evaluation.
Author Contributions
Y.S.: Conceptualization, Methodology, Software, and Validation; X.L.: Methodology; Y.C.: Formal analysis. All authors have read and agreed to the published version of the manuscript.
Funding
This work was supported by the Hebei Institute of Industrial Technology Proof-of-Concept Project (CYYGNYZ2025010), the National Natural Science Foundation of China (12332002), the Science and Technology Research Project of Higher Education Institutions in Hebei Province (CXY2024003), and the Hubei Provincial Science and Technology Program (2024EHA071).
Institutional Review Board Statement
Not applicable.
Informed Consent Statement
Not applicable.
Data Availability Statement
The data presented in this study are available from the corresponding author upon reasonable request.
Conflicts of Interest
The authors declare no conflicts of interest.
References
- Poletti, F. Nested antiresonant nodeless hollow core fiber. Opt. Express 2014, 22, 23807–23828. [Google Scholar] [CrossRef] [Scilit] [PubMed]
- Habib, M.S.; Bang, O.; Bache, M. Low-loss single-mode hollow-core fiber with anisotropic anti-resonant elements. Opt. Express 2016, 24, 8429–8436. [Google Scholar] [CrossRef] [Scilit] [PubMed]
- Chaudhuri, S.; Van Putten, L.D.; Poletti, F.; Sazio, P.J.A. Low loss transmission in negative curvature optical fibers with elliptical capillary tubes. J. Light. Technol. 2016, 34, 4228–4231. [Google Scholar] [CrossRef] [Scilit]
- Gao, S.F.; Wang, Y.Y.; Ding, W.; Jiang, D.L.; Gu, S.; Zhang, X.; Wang, P. Hollow-core conjoined-tube negative-curvature fibre with ultralow loss. Nat. Commun. 2018, 9, 2828. [Google Scholar] [CrossRef] [Scilit] [PubMed]
- Zhao, X.; Wang, M.; Zhang, W.; Luo, J.; Liu, C.; Liu, S.; Li, J. Ultra-Low-Loss Hollow-Core Anti-Resonant Fiber Combining Double-Tube Nesting and a Single-Layer Anti-Resonant Wall. Photonics 2025, 12, 440. [Google Scholar] [CrossRef] [Scilit]
- Ni, W.; Yang, C.; Luo, Y.; Xia, R.; Lu, P.; Hu, D.J.J.; Danto, S.; Shum, P.P.; Wei, L. Recent Advancement of Anti-Resonant Hollow-Core Fibers for Sensing Applications. Photonics 2021, 8, 128. [Google Scholar] [CrossRef] [Scilit]
- Arman, H.; Olyaee, S.; Seifouri, M. Dual Gas Sensor Based on Anti-Resonant Hollow-Core Fiber for Detection of CO2 and CH4 with Different Absorption Lines. J. Nonlinear Opt. Phys. Mater. 2025, 34, 2450001. [Google Scholar] [CrossRef] [Scilit]
- You, Y.; Liu, W.; Zhang, S.; Wu, J.; Li, Y.; Shi, H.; Yang, H. Single-Polarization Single-Mode Hollow-Core Anti-Resonant Fiber with Low Loss and Wide Bandwidth. Photonics 2025, 12, 686. [Google Scholar] [CrossRef] [Scilit]
- Xu, H.; Yang, Y.; Yuan, J.; Wu, D.; Huang, Y.; Luo, S.; Ren, Z.; Xia, C.; Liu, J.; Zhou, G.; et al. Low Loss and High Polarization-Maintaining Single-Mode Hollow-Core Anti-Resonant Fibers with S+C+L+U Communication Bands. Photonics 2025, 12, 846. [Google Scholar] [CrossRef] [Scilit]
- Gu, S.; Wang, X.; Jia, H.; Lian, Z.; Shen, X.; Mai, Y.; Lou, S. Single-ring hollow-core anti-resonant fiber with a record low loss (4.3 dB/km) for high-power laser delivery at 1 μm. Opt. Lett. 2022, 47, 5925–5928. [Google Scholar] [CrossRef] [Scilit] [PubMed]
- Hong, Y.; Jia, A.; Gao, S.; Sheng, Y.; Lu, X.; Liang, Z.; Zhang, Z.; Ding, W.; Wang, Y. Birefringent, low loss, and broadband semi-tube anti-resonant hollow-core fiber. Opt. Lett. 2023, 48, 163–166. [Google Scholar] [CrossRef] [Scilit] [PubMed]
- Zhao, X.; Li, J.; Cheng, Y.; Zhang, W.; Liu, C.; Liu, S.; Luo, J.; Wang, M. Low-loss hollow-core antiresonant fiber with fourfold semitube. Int. J. Opt. 2025, 2025, 2995420. [Google Scholar] [CrossRef] [Scilit]
- Gao, S.; Chen, H.; Sun, Y.; Xiong, Y.; Yang, Z.; Zhao, R.; Ding, W.; Wang, Y. Fourfold truncated double-nested antiresonant hollow-core fiber with ultralow loss and ultrahigh mode purity. Optica 2025, 12, 56–61. [Google Scholar] [CrossRef] [Scilit]
- Malitson, I.H. Interspecimen comparison of the refractive index of fused silica. J. Opt. Soc. Am. 1965, 55, 1205–1209. [Google Scholar] [CrossRef] [Scilit]
- Li, Z.; Wang, S.; Gao, R.; Li, L.; Zhu, L.; Zhang, Q.; Xin, X. Ultra-Low Loss Hybrid Anti-Resonant Hollow-Core Fiber with Double Semi-Circular Tubes Sandwiched Elliptic Tube. Photonics 2025, 12, 540. [Google Scholar] [CrossRef] [Scilit]
- Habib, M.S.; Markos, C.; Amezcua-Correa, R. Impact of cladding elements on the loss performance of hollow-core anti-resonant fibers. Opt. Express 2021, 29, 3359–3374. [Google Scholar] [CrossRef] [Scilit] [PubMed]
- Jasion, G.T.; Sakr, H.; Hayes, J.R.; Sandoghchi, S.R.; Hooper, L.; Numkam Fokoua, E.; Saljoghei, A.; Mulvad, H.C.; Alonso, M.; Taranta, A.; et al. 0.174 dB/km Hollow Core Double Nested Antiresonant Nodeless Fiber (DNANF). In Proceedings of the Optical Fiber Communication Conference (OFC) 2022; Optica Publishing Group: Washington, DC, USA, 2022; p. Th4C.7. [Google Scholar] [CrossRef] [Scilit]
- Wang, Y.; Chang, W. Multi-nested antiresonant hollow-core fiber with ultralow loss and single-mode guidance. Opt. Express 2023, 31, 18250–18264. [Google Scholar] [CrossRef] [Scilit] [PubMed]
- Heiblum, M.; Harris, J.H. Analysis of curved optical waveguides by conformal transformation. IEEE J. Quantum Electron. 1975, 11, 75–83. [Google Scholar] [CrossRef] [Scilit]
- Jasion, G.T.; Hayes, J.R.; Wheeler, N.V.; Chen, Y.; Bradley, T.D.; Richardson, D.J.; Poletti, F. Fabrication of tubular anti-resonant hollow core fibers: Modelling, draw dynamics and process optimization. Opt. Express 2019, 27, 20567–20582. [Google Scholar] [CrossRef] [Scilit] [PubMed]

Disclaimer/Publisher’s Note: The statements, opinions and data contained in all publications are solely those of the individual author(s) and contributor(s) and not of MDPI and/or the editor(s). MDPI and/or the editor(s) disclaim responsibility for any injury to people or property resulting from any ideas, methods, instructions or products referred to in the content. |
© 2026 by the authors. Licensee MDPI, Basel, Switzerland. This article is an open access article distributed under the terms and conditions of the Creative Commons Attribution (CC BY) license.