


Abstract
Background: Ischemic heart disease (IHD) is one of the most common and potentially fatal human diseases, caused mainly by atherosclerosis and treated by percutaneous coronary intervention with intravascular stent placement to restore blood flow to the heart. Despite advances in stent technology, restenosis (neointima) remains a critical problem after coronary intervention. Methods: A computational model of restenosis after stenting was developed, integrating 12 equations describing the dynamics of lipoproteins, cells, cytokines, statins, collagen, and smooth muscle cells. Simulations over 180 days compared various geometries: 2D vs. 3D, fixed vs. moving mesh, single-layer vs. three-layer, and straight vs. curved artery. Three values of arterial wall porosity (0.983, 0.8025, and 0.68) were investigated. Results: Mathematical modelling revealed that 2D simulations overestimate neointima growth by 30.93–31.27% compared to 3D models that resolve the actual stent geometry. Statin therapy reduced plaque growth by 4.98–5.42% over 180 days. Within the investigated porosity range, plaque growth increased as porosity decreased: maximum restenosis rose from 9.7–9.9% to 20.9–21.4% in the straight and curved artery models, respectively, because reduced free volume intensifies biochemical reactions and foam cell accumulation. Fixed and moving mesh models showed minimal differences (up to 2.6% in 3D, 6.14% in 2D), confirming that fixed meshes are preferable for up to 180-day simulations due to computational efficiency and result consistency. Conclusions: The developed model includes 12 factors involved in the pathogenesis of restenosis and neointima formation and allows localising the areas most significant for understanding the mechanisms of this process.
1. Introduction
Cardiovascular diseases of atherosclerotic genesis are the leading cause of death and disability among the population in developed countries for many decades [1]. This pathology is systemic and affects all blood vessels. Among the wide range of circulatory pathologies, ischaemic heart disease (IHD) occupies a dominant position [2,3]. The pathophysiology of the disease consists of progressive atherosclerotic lesions of the coronary arteries.
The modern strategy for treating IHD is based on minimally invasive restoration of anatomical vessel patency using percutaneous coronary intervention. The introduction of this method has revolutionised interventional cardiology, minimising the invasiveness of myocardial revascularisation. However, despite the technological transition from bare metal stents (BMS) to modern drug-eluting and bioresorbable stents, the problem of restenosis of the stented section of the coronary artery remains relevant. Experimental and modelling studies underpinning this transition include the analysis of how the stent elution rate determines drug deposition and receptor-mediated effects in the arterial wall [4]; a decade of modelling work on drug release from arterial stents [5]; the elaboration of manufacturing regimes and mechanical performance evaluation of PLA and PLLA polymeric stents [6]; and the development of additive manufacturing technologies for polymer stents together with their numerical verification [7]. Clinical data show that even with the use of latest-generation stents, the incidence of restenosis in complex anatomical sites such as bifurcations remains high, requiring repeat surgical interventions [8].
The pathogenesis of restenosis is a complex multifactorial process initiated by a combination of both mechanical and biological effects on the vascular wall. Stent implantation inevitably causes mechanical damage (denudation) to the endothelium and deep layers of the vascular wall (media and adventitia) [9]. The loss of the endothelial coating results in the cessation of secretion of antithrombogenic factors—nitric oxide (NO) and prostacyclin—which initiates a cascade of inflammatory reactions and platelet aggregation. Collagen denudation provokes thrombocyte adhesion and the release of mitogens (PDGF, TGF-β) from their α-granules, initiating a cascade of aseptic inflammation. This process is significantly exacerbated by the accumulation of oxidised low-density lipoproteins, which enhances the infiltration of the intima layer by monocytes [10,11,12]. Penetrating the subendothelium, monocytes transform into macrophages, which actively phagocytose lipids and turn into foam cells. Becoming a powerful source of pro-inflammatory cytokines, these cells support local inflammation and create a favourable environment for further pathological migration and proliferation of smooth muscle cells. In parallel, the release of cytokines and other growth factors provokes phenotypic modulation of smooth muscle cells, which transition from a contractile state to a synthetic state [13]. These cells migrate into the subintimal layer and proliferate, forming neointimal tissue, which, together with lipid deposits, determines the risk and progression of restenosis [14].
In addition to cellular responses, local hemodynamic play a decisive role in pathological remodelling. The presence of a stent in the lumen of the artery inevitably disrupts laminar blood flow, creating local areas of recirculation, flow turbulence and stagnation. These areas concentrate low and oscillating values of wall shear stress (WSS), which act as powerful biological triggers, leading to endothelial dysfunction and neointima growth [15,16]. Thus, restenosis is a result of a combination of mechanical damage and hemodynamic disturbance.
In current science, mathematical/numerical modelling methods have become an essential tool for studying the pathogenesis of restenosis, allowing for qualitative and quantitative assessment of processes that cannot be directly measured in vivo or in vitro. The use of computational fluid dynamics in combination with the finite element method provides an opportunity to study the processes described above in detail in the stented area.
In this context, several works have proposed strategies for agent-oriented models describing cellular processes [17,18,19,20]. There are also combined agent-based and hemodynamic models based on the finite element method [21,22].
Hemodynamic in patient-oriented arteries and its effect on plaque formation were studied in the studies [23,24]. The effects of WSS, TAWSS, OSI, and the new HOLMES index on plaque location were analysed [25,26,27]. It has been shown that plaques are formed as a result of increased endothelial permeability, which is associated with low WSS values. However, not all models take into account the geometry of the stent in the artery. The presence of a stent can significantly disrupt local hemodynamic.
Mechanobiological models that take into account the distribution of LDL, oxidised LDL, monocytes, macrophages, cytokines in the wall and other components have also been developed [28,29]. Combined models with hemodynamic, in which lipid concentrations depend on WSS, have been developed for three-dimensional plaque formation and progression in the carotid artery [30] and for patient-specific, location-specific analysis of carotid plaques based on the hemodynamic stimulus [16]. Models that explicitly account for foam cells and statins include multiscale patient-specific artery and atherogenesis models [28], a mathematical model of the effects of statins on necrotic-core growth [29], and a mathematical model of atherosclerotic formation and progression at arterial bifurcations with time-dependent wall porosity [31]. The transport of drugs eluted from stents into the arterial wall was modelled in [32], and the physiological transport forces that govern drug distribution in stent-based delivery were analysed in [33]. Vascular re-modelling has been addressed in an elastic-wall protocol for modelling blood flow in human arteries [34], in the comprehensive fluid–structure interaction study of intracranial aneurysms [35], in four-dimensional space–time mesh methods for domains with time-variant topology [36], in computational modelling of arterial wall growth based on computer tomography data [37], in the fast strongly coupled fluid–solid–growth interaction method [38], in mechano–chemo–biological computational models of arteries spanning tissue remodelling and drug-eluting devices [39], and in computational modelling of in-stent restenosis with pharmacokinetic and pharmacodynamic evaluation [40]. The main advantage of these models is that they allow plaque formation to be monitored in real time, compared to agent-based models [12]. It should also be noted that not all of the above models consider the 3D geometry of the stented artery segment. Most studies focus on idealised 2D models that do not take into account the geometric parameters of the stent or artery.
In recent years, fluid–structure interaction (FSI) models that allow for the dynamic deformation of the vessel during the cardiac cycle and the pulsating movement of blood have become particularly important, as they are critical for the correct calculation of WSS [41,42].
Current Multiphysics models enable the inclusion of hemodynamic, lipid transport, cell migration, and drug release from the stent surface in the computational environment, allowing for a comprehensive study of the mechanisms of restenosis development and suppression. More recent studies have further advanced the field: patient-specific multiscale modelling based on multimodal imaging has been used to predict lipid-rich plaque progression through wall shear stress signatures [3]; large-cohort fluid–structure interaction analyses have quantified the role of wall compliance in stented and aneurysmal vessels [35]; fast, strongly coupled fluid–solid–growth interaction methods have been proposed to make long-term growth simulations computationally tractable [38]; pharmacokinetic–pharmacodynamic models of in-stent restenosis have been coupled with drug release from stent coatings [40]; fluid–structure interaction models of stented multi-layered arteries have clarified the influence of boundary conditions and vessel length on stent performance [42]; and a recent computational model has coupled coronary hemodynamic with pharmacokinetics and growth mechanics to simulate in-stent restenosis [43]. Clinical and intravascular-imaging studies published in 2023–2025 continue to emphasise the decisive role of local hemodynamic and stent design in restenosis outcomes [44].
Nevertheless, the creation of highly accurate personalised models that take into account the realistic 3D geometry of a specific patient’s lesion remains one of the most challenging and sought-after tasks in bioengineering. In particular, a consistent three-dimensional continuous formulation that simultaneously resolves realistic stent geometry, the porous multi-layered arterial wall, the nonlinear endothelial permeability response to wall shear stress, and pharmacokinetics within a single coupled framework is still rare.
The aim of this study is therefore to develop a comprehensive model that integrates 3D stent geometry, arterial wall porosity, and nonlinear multiphysics—hemodynamic, twelve-species transport-reaction kinetics, and moving-boundary plaque growth—into a single continuous formulation, taking into account the interaction between significant molecular and cellular components; the mechanics of restenosis formation, pharmacokinetics and hemodynamic; and the 3D characteristics of both the artery and the stent.
The remainder of this paper is organised as follows. Section 2 presents the mathematical formulation of the coupled problem: geometry (Section 2.1), blood flow (Section 2.2), the porous-media advection–diffusion–reaction framework and the biological processes it describes (Section 2.3 and Section 2.4), initial and boundary conditions, including the nonlinear shear-dependent endothelial permeability model (Section 2.5 and Section 2.6), the moving-mesh plaque-growth formulation (Section 2.7), and the numerical implementation (Section 2.8). Section 3 reports the simulation results for the straight and curved stented arteries and compares the alternative modelling assumptions. Section 4 discusses the results in the context of clinical data and the limitations of the model, and Section 5 summarises the quantitative conclusions and directions for future work.
2. Materials and Methods
2.1. Geometries
In this study, we considered four types of stent geometry: 2D straight single-layer, 3D straight single-layer, 3D straight multi-layer, and 3D curved single-layer (Figure 1). The straight model analyses a sinusoidal stent of our own design. Since this stent cannot be drawn in a curved configuration, only the straight region is analysed. In the 2D configuration, the cross-section of this stent is analysed. In the 3D curved artery, a spiral stent of our own design is analysed because this type of stent can be drawn in a curved configuration.
Figure 1.
Geometries of the stented coronary artery segment: (a) 2D straight geometry; (b) 3D straight geometry; (c) 3D curved geometry.
The following geometric parameters of the stented artery were considered: internal artery diameter 3 mm, artery thickness 0.5 mm, straight artery length 24 mm, stent length 12 mm, curved artery length 43 mm, curved stent length 36 mm.
- Ω—two-dimensional/three-dimensional area of the artery wall with a damaged section (plaque).
- Γ1—outer wall boundary (on the side of the surrounding tissues).
- Γ2—internal boundary (from the lumen side of the artery, including the area of damage).
- —a single vector normal to the surface, directed outwards from the wall area.
- —a single vector directed deep into the wall from the lumen of the artery (specific to the damaged boundary).
2.2. Blood Flow
It is assumed that blood is stationary, incompressible, and Newtonian, since the diameter of the artery lumen is much greater than 0.5 mm [12]. The Navier–Stokes and continuity equations for laminar steady flow are as follows:
where υ is velocity vector, p is static pressure, ρ is blood density, and μ is dynamic viscosity.
2.3. Advection–Diffusion–Reaction Equations
In a porous medium, the equations are solved relative to the average volume concentration Ci. The basic mass balance law for component i is as follows:
where εp is effective porosity of the arterial wall (including the developing plaque, Ci is concentrations, uw is Darcy velocity, Ji = De,i∇Ci is total diffusion flux, Ri + Si is chemical reactions and sources, is effective diffusion coefficient, τi = εp−1/3 is tortuosity factor.
The porosity εp denotes the effective porosity of the arterial wall, including the developing plaque, defined as the volume fraction of the wall accessible to species transport. Physically, it reflects the combined effect of the extracellular matrix; the interstitial fluid phase; and the cellular content of the intima, media, and adventitia. Porosity enters the governing equations directly and determines the effective diffusion coefficient through the tortuosity closure described below. Arterial wall porosity is not measured directly in vivo; reported values are estimated from the microstructural composition of the wall, namely the volume fractions of the extracellular matrix and the interstitial fluid phase, and vary with the transmural pressure and the state of the tissue. Following [31], the values εp = 0.983, 0.8025, and 0.68 are adopted as representative of the range considered in the literature for the qualitative assessment of wall-porosity effects. The highest value characterises a wall with a large transport-accessible volume fraction, whereas the lowest value is representative of a lipid-laden, plaque-affected wall, in which lipid deposits and cellular proliferation reduce the fraction of the tissue accessible to species transport, consistent with the reduction in the effective intima porosity reported for atherosclerotic plaques [45].
For the tortuosity factor τ in the effective diffusion coefficient, the closure τi = εp−1/3 is adopted. This relation follows from Archie’s law, τ = εp1−m, with m = 4/3, which lies between the classical value m = 1.5 for isotropic porous media and values closer to unity for highly connected biological tissues. Because the arterial wall is multi-layered and anisotropic, a single isotropic tortuosity closure is an approximation: in the three-layer wall model, the layered architecture is accounted for through the layer-dependent diffusivities listed in Table 1, while within each layer the tortuosity correction is applied isotropically. The isotropic closure adopted here follows the previous models on which the present formulation is based [12,31].
Table 1.
Diffusion coefficients [46].
2.4. Biological Processes
The biological processes occurring in the arterial wall during the early formation of atherosclerotic plaques are described by Equations (3)–(14) [12,29,31]. The processes are described by interrelated equations of changes in time and space in the concentrations of the lipid–protein complex (LDL, HDL, oxidised LDL) and cellular components (macrophages, foam cells, monocytes, cytokines), etc. (Figure 2).
Figure 2.
Schematic diagram of reaction processes.
- Low-density lipoproteins (LDL):
The left side of the equation describes the change in LDL concentration over time, the diffusion component and the convective component in a porous artery. The right side describes LDL oxidation and the effect of statins on this process.
This lipid is the main transporter of cholesterol in the body. When there is an excess, it penetrates the vessel wall and accumulates. In the model, it is a source for the formation of oxidised forms and subsequent inflammation.
- 2.
- High-density lipoproteins (HDL):
The left side of the equation describes the change in HDL concentration over time, the diffusion component and the convective component in a porous artery. The right side describes the absorption of HDL by foam cells during reverse cholesterol transport (1 term) and the degradation of HDL in the porous vessel wall (2 terms).
This lipid participates in the reverse transport of cholesterol from tissues. In this model, it acts as an anti-inflammatory agent, converting foam cells back into macrophages.
- 3.
- Oxidised low-density lipoproteins (LDLox):
The left side of the equation describes the change in the concentration of oxidised LDL over time, the diffusion component and the convective component in a porous artery. The right side of the equation describes the formation of these lipids from LDL (1 term) and their uptake by macrophages (2 terms).
In this model, this lipid is recognised by macrophages and triggers the formation of foam cells.
- 4.
- Macrophages (M):
The left side of the equation describes the change in macrophage concentration over time, the diffusion component and the convective component in a porous artery. The right side of the equation describes the rate of macrophage formation through the absorption of oxidised LDL (1 term), the formation of foam cells under the action of LDL (2 terms), the death of differentiated macrophages (term 3) and, finally, the rate of increase in the number of macrophages (term 4).
In this model, they are immune cells.
- 5.
- Foam cells (F):
The left side of the equation describes the change in foam cell concentration over time. Due to their large size, foam cells do not undergo convection or diffusion. As soon as a macrophage can absorb a larger amount of oxidised LDL, it transforms into a foam cell (1st term). The reverse transformation of foam cells into macrophages under the action of HDL is described by term 2, the direct formation of foam cells from oxidised LDL is described by term 3, and finally, term 4 describes the contribution of macrophage uptake of oxidised LDL to the formation of foam cells.
These cells are macrophages overflowing with cholesterol esters. In this model, they are the main component of the lipid core of the plaque.
- 6.
- Monocytes (P):
The left side of the equation describes the change in monocyte concentration over time, the diffusion component and the convective component in a porous artery. The right side describes the formation of monocytes by macrophages through the absorption of oxidised LDL (1 term) and the breakdown of monocytes (2 terms).
In this model, it is a signalling molecule. It attracts monocytes from the blood to the site of inflammation.
- 7.
- Cytokines (Q):
The left side of the equation describes the change in cytokine concentration over time. Due to their size, cytokines are not subject to convection. In addition, they are enclosed in macrophages, so they do not diffuse. The right side describes the release of cytokines by macrophages due to the absorption of oxidised LDL (1 term) and their breakdown in the porous wall of the vessel.
Cytokines are also signalling molecules that enhance the inflammatory response.
- 8.
- Statins (S):
Statins are medicinal molecules that suppress inflammation and are administered to reduce low-density lipoprotein levels. The left side of the equation describes the change in statin concentration over time, the diffusion component and the convective component in a porous artery. The right side describes the rate of statin influx (1st term), the rate of decay (2nd term), and the rate of natural degeneration (3rd term).
Additional equations:
- 9.
- Necrotic core growth model (NC):
The necrotic core is a key structural component of atherosclerotic plaque that is directly associated with the risk of acute cardiovascular events. According to the model, the core is formed as a result of apoptosis of macrophages and foam cells. The right side of the equation describes the rate of death of macrophages and foam cells, as well as the total concentration of dead cells. The parameter r is the distance to the inner wall boundary.
- 10.
- Contractile smooth muscle cells (CSMC):
Due to their large size, the cells are not subject to convection or diffusion. At the beginning of the process, all smooth muscle cells in the arterial wall have a contractile phenotype. Then, thanks to the presence of cytokines, they undergo a phenotypic change, transforming into synthetic smooth muscle cells.
- 11.
- Synthetic smooth muscle cells (SSMC):
Due to their large size, cells are not subject to convection or diffusion. Contractile cells change their phenotype to synthetic due to the presence of cytokines in the arterial wall. They also undergo proliferation and apoptosis, which is described by the right side of the equation.
- 12.
- Collagen fibres (Cg):
Collagen fibres are not subject to convection or diffusion because they consist of many molecules. Collagen fibres undergo delamination in tissues.
All these equations form a coupled advection–diffusion–reaction system that models the interaction of key biological components of atherosclerotic plaque under the influence of HDL and LDL. The constants used are presented in Table 1 and Table 2.
Table 2.
Computational parameters [12,29,31].
2.5. Initial Conditions
In the artery wall, the initial conditions for the above equations are given below:
The initial conditions in the model were assumed to be zero, which allowed us to focus on the dynamics of the system’s deviation from its current state (plaque homeostasis).
Since the destruction of the plaque structure, compression of the lipid core, and deformation of the vessel during expansion create an impulse that exceeds the background concentrations of substances by orders of magnitude, the contribution of the initial state to the final dynamics of restenosis was considered secondary. If there is an influx of growth factors from the adventitia to the intima, we assume that it is insignificant. Thus, the model describes the process of de novo accumulation and proliferation induced exclusively by intervention, which is confirmed by the high degree of correlation of the results obtained with experimental data from the literature.
2.6. Boundary Conditions
2.6.1. Conditions for Blood Flow
Numerical modelling of blood flow in a stented artery was performed over a period of 6 months (180 days). It was assumed that blood flow was stable due to the time factor. Since such a long calculation period was considered, the velocity fluctuations associated with the pulse cycle are averaged out and do not have a significant effect on the overall flow pattern. The use of a pulsating velocity profile at the inlet is inappropriate in such conditions; therefore, a quasi-static approach was adopted in this work, as presented in the paper [43]. A constant blood flow velocity of 0.526 m/s was applied at the inlet of the artery, and a constant pressure of 0 mm Hg was applied at the outlet (Figure 3).
Figure 3.
Schematic model of a stented artery.
The quasi-static (steady-flow) assumption adopted here can be justified by the strong separation of timescales in the problem. The cardiac cycle (≈1 s) is more than seven orders of magnitude shorter than the 180-day horizon of neointimal remodelling (≈1.6 × 10⁷ s). Transport and reaction processes in the wall evolve on timescales of hours to days, so the lumen hemodynamic can be regarded, to first order, as a stationary forcing of the slower biological problem: pulse-cycle oscillations of velocity and WSS are averaged out, and only the mean flow determines convective transport and the shear-dependent endothelial permeability. A similar quasi-steady of pulsatile hemodynamic over long remodelling horizons has been used and validated in recent in-stent restenosis modelling [43].
The selection of a 6-month time interval is due to the dynamics of neointimal hyperplasia. According to data [44,47,48] and the results of large clinical experiments, it is at this time that the phase of the most active remodelling of the vascular wall ends and the hemodynamic profile in the intervention area stabilises. According to clinical data, the process of neointima (inner layer of the vessel) growth in response to stent placement peaks between 3 and 6 months [8].
2.6.2. Conditions for Substance Transfer
Zero flux. This means that substances do not penetrate through the outer boundary of the artery into the surrounding tissues:
Flux for LDL. Here, LDL penetrates from the lumen into the wall with a permeability τLDL, which depends on the LDL concentration and shear stress. In this work, we assumed a damage level of 10:
Flux for HDL. Here, HDL penetrates from the lumen into the wall with a permeability τHDL, which depends on the concentration of HDL and the shear stress. In this work, we assumed a damage level of 10:
Flux for statins. Here, statins penetrate from the lumen into the wall with permeability kS:
Flux for other substances. These substances do not penetrate directly from the lumen of the artery, but are formed inside the artery as a result of reactions:
On the outer wall (the boundary adjacent to the surrounding tissues), a zero-flux condition is imposed for all species (Equation (16)). This corresponds to the common assumption in mechanobiological restenosis models [12,32] that exchange with the vasa vasorum and perivascular drainage does not contribute significantly to the species balance over the 180-day horizon. On the inner (luminal) boundary, species-specific conditions are applied: convective mass transfer with WSS — and concentration-dependent permeability for LDL and HDL (Equations (17) and (18)), a constant permeability for statins (Equation (19)), and zero flux for the remaining species, which are produced exclusively by wall reactions (Equation (20)). The zero-flux condition on the outer boundary bounds the total lipid content of the wall from below—no lipid is lost to the surroundings and therefore promotes accumulation, whereas a draining boundary would reduce lipid retention and plaque growth. Conversely, the permeability law on the luminal boundary controls the influx of LDL and HDL and thus the lipid budget of the wall; this coupling between luminal influx and WSS is the principal mechanism linking hemodynamics to plaque growth in the model. For the parameter set of Table 1 and Table 3, reaction and degradation terms dominate over boundary losses, so the qualitative growth patterns are robust to moderate changes in the outer-wall condition, while the absolute growth magnitude is governed mainly by the luminal permeability law.
Table 3.
Mesh convergence for 2D model porosity 0.68.
2.6.3. Permeability of the Vessel Wall for LDL and HDL
It is assumed that permeability increases non-linearly with increasing concentrations. Based on a binomial expansion to account for non-linear effects, we consider a non-linear term in this work. This allows us to describe more accurately the dependence of permeability on LDL concentration and wall tangential stresses, especially when all factors interact in a complex manner. To simplify the model, it is assumed that the permeability of the wall for LDL and HDL is the same. Statins were also taken into account in the binomial expansion.
Without statins:
With statins:
In this case, permeability depends on WSS. We have adopted a threshold stress value of 1 Pa. This value indicates that at values below the threshold, permeability for lipids will increase.
The threshold value of 1 Pa adopted in Equations (21) and (22) is consistent with the physiological range of wall shear stress in coronary arteries under normal conditions and with mechanobiological models of atherosclerosis and in-stent restenosis that associate sustained WSS values below 1 Pa with endothelial dysfunction, increased endothelial permeability, and neointimal growth [15,43,46]. Lower threshold values in the range 0.4–0.6 Pa have also been proposed in studies of the natural history of coronary atherosclerosis [49,50].
The quadratic terms in Equations (21) and (22) require verification that the empirical expansion remains well-behaved when WSS approaches zero in stagnation zones. Two properties guarantee the regularity of the model. First, the dependence on WSS enters only through the bounded rational factor WSS0/(WSS0 + WSS), where WSS0 = 1 Pa is the adopted threshold; this factor is confined to the interval (0, 1], tends to unity as WSS→0, and decreases monotonically with increasing WSS, so no singular behaviour can arise from the shear-stress argument itself. Second, the permeability is a low-order polynomial with non-negative coefficients in the concentrations, and the concentrations remain bounded during the 180-day simulations because the source terms and the first-order degradation kinetics of Equations (3)–(14) confine them to finite, physically meaningful ranges. At a stagnation point (WSS ≈ 0), the shear factor attains its maximum value of unity, and the permeability therefore reduces to a finite value corresponding to the fully developed low-shear regime. Numerically, stagnation zones are additionally regularised by the no-slip condition and by the boundary-layer mesh, which resolves the near-wall velocity field smoothly down to WSS ≈ 0.
2.7. Model of Atherosclerotic Plaque Growth
The movement of the damaged boundary is set locally, depending on the concentration of foamy cells, kr—this is an adjustment parameter selected so that the growth corresponds to the experimental data.
To simulate plaque growth and evolution, we used a «moving mesh» model, i.e., the mesh moves locally according to changes in the concentration of foam cells. The Yeoh mesh moving model was used. This mesh smoothing method is based on minimising the Piola–Kirchhoff stress deformation functional P:
where tensor P is defined by the strain energy density WYeoh:
- I1 = tr(FT F)—First invariant, where F = I + ∇u is mesh deformation gradient (u = Ugrowth is nodes displacement).
- C10—Linear stiffness. In COMSOL, this parameter is set to 0.5. It is responsible for the elasticity of the mesh at small deformations.
- C20—Stiffness factor. In our case, we used a value of 20 for this coefficient. It creates a non-linear response: the more an element is stretched or compressed, the higher its fictitious stiffness becomes, which prevents the element from becoming severely distorted.
- C30—With standard settings, moving mesh is usually assumed to be 0 unless otherwise specified.
To prevent mesh entanglement and element inversion over the 180-day simulation, the moving mesh is stabilised with standard settings of the COMSOL Multiphysics Moving Mesh interface. For the deforming domains, the Yeoh mesh smoothing type is selected with a stiffening factor of 20. This factor controls the nonlinear stiffening of the artificial smoothing material, so that the elements that are stretched or compressed the most are fictitiously stiffened, and disproportionate local distortion is penalised, while the linear stiffness (artificial material parameter C10) of 0.5 keeps the response of weakly deformed elements elastic and reversible. The time step is fixed at 1 day, which bounds the incremental boundary displacement imposed at each mesh update. The mesh is refined locally near the stent struts, where the deformation gradients are largest. In addition, the Automatic Remeshing attribute is added to the time-dependent solver with the condition type mesh quality: when the minimum element quality falls below the specified threshold, the solver stops, remeshes the deformed configuration, maps the solution onto the new mesh, and continues the time integration. A negative or near-zero element quality, which would indicate inverted elements and make the frame transformation singular, is therefore intercepted before an invalid mesh can compromise the results; if the distortion cannot be relieved by remeshing, the solver stops with an error. In this way, only simulations whose meshes remain valid for the entire 180-day horizon are accepted.
2.8. Numerical Methods
Numerical modelling was performed using COMSOL Multiphysics 6.3 (COMSOL Inc., Stockholm, Sweden). The analysis consists of two sequential study steps. First, the flow problem is solved to obtain the wall shear stress field on the endothelial surface. Second, the restenosis problem is solved in transient form over 180 days, with the solution stored every 1 day; the internal step size is controlled adaptively by the time-stepping error controller. Time integration is performed with the implicit backward differentiation formula (BDF, maximum order 2). The nonlinear system at each time step is solved in a fully coupled fashion by a damped Newton method (damping factor 0.9, Anderson acceleration, at most 8 iterations), and the resulting linear systems are solved with the PARDISO direct solver, with the GMRES iterative solver and smoothed-aggregation algebraic multigrid used for the velocity–pressure block. Convergence of the time-dependent solver is controlled by a relative tolerance of 5 × 10⁻³ together with scaled absolute tolerances (global factor 0.05). The Newton iteration is terminated when the estimated relative error falls below one-half of the solver tolerance. All computations were performed on a workstation equipped with an AMD EPYC 7763 64-core processor and 256 GB of RAM. A typical 180-day 3D simulation required approximately 3 h 5 min without mesh motion and 4 h 20 min with mesh motion.
The reliability of the results was ensured by analysing the convergence of the mesh: the criterion for selecting the discretisation was a deviation of key parameters of less than 5% during sequential mesh refinement. The mesh quality varied from «Extremely coarse» to «Normal» according to the COMSOL Multiphysics classification. The main discretisation parameters and the obtained results are presented in Table 3.
For the 2D model: the mesh included 14,618 elements (a mixed mesh of triangles and quadrangles) for the lumen and 10,252 triangular elements for the wall. For the 3D model: the mesh consisted of 1,048,534 tetrahedrons, 21,797 pyramids, and 269,381 prisms for the aperture and 2,162,429 tetrahedrons for the wall.
For the 3D models, however, the automatic presets do not resolve the thin arterial wall adequately: because the wall thickness is small compared with the lumen radius, an automatically generated tetrahedral mesh may place too few elements across the wall to capture the transmural concentration gradients of the convection–diffusion–reaction problem. The mesh settings were therefore customised for each 3D model so that at least three elements were placed across the artery wall. Varying the number of wall thickness elements between three, four, and five did not lead to a significant change in the results. We conclude that at least three elements across the wall thickness are sufficient for a reliable solution of the convection–diffusion–reaction equations in a thin-walled arterial geometry, and this value can be recommended as a practical guideline for similar multiphysics models.
3. Results
3.1. Comparison of Models
As a result of solving a series of models, distributions of velocity characteristics, wall shear stresses, concentrations, and atherosclerotic plaque growth values were obtained.
Figure 4 shows the dependence of plaque growth on time at different coronary artery porosities. It can be seen that as the porosity coefficient decreases, the growth values increase. In addition, it can be concluded that the 2D model shows excessive growth values compared to the 3D model, which accurately describes the geometry of the stented area. It can also be seen that when the equation for statins is introduced, the growth decreases.
Figure 4.
Overall comparison of maximum plaque growth values at different porosities and models at time 180 days.
3.1.1. Comparison of 2D Models with Moving and Fixed Meshes: Without Statins
When comparing 2D models with moving and fixed meshes, we initially obtained distributions of velocity and wall shear stress. Figure 5 shows the velocity in the stented artery, and Figure 6 shows the wall shear stress at six affected areas of the artery located between the stent. The highest stresses are concentrated at the end of the stent and are within the range of 3.6 Pa. The lowest values are located at the initial sections of the stent in the direction of blood flow. It can be seen that each affected section has areas of stress with values below the threshold value of 1 Pa. It is these areas that are susceptible to LDL penetration through the endothelial layer into the intima and further oxidation.
Figure 5.
Velocity distribution in a straight artery 2D.
Figure 6.
Distribution of wall shear stress in a straight artery 2D.
During chemical reactions, dependencies of plaque growth in the spaces between stent elements on time and artery porosity were obtained. Calculations were performed for two types of 2D models: fixed and moving meshes.
Figure 7 shows that the difference between the models is insignificant; as the porosity of the artery decreases, the percentage difference increases from 3.18% to 6.14%, almost twice as much. In addition, it can be seen that the difference also increases over time. From this, we can conclude that a fixed mesh can be used for short calculation periods, but for longer periods of six months or more, a large difference will accumulate between the fixed mesh and the moving mesh.
Figure 7.
Comparison of 2D models with fixed and moving mesh, without considering statins: (a–c) plaque growth; (d–f) percentage difference between models.
Figure 8 and Figure 9 show the results at 180 days with a moving mesh and artery porosity of 0.68. It is at this porosity that the greatest restenosis, i.e., plaque growth, is observed. These figures show the distribution and concentration of all modelled substances. It can be seen that by 180 days, the concentrations of LDLox, M, F, P, and Q were distributed uniformly across the thickness of the artery, with their maximum concentrations focused in the middle of the stent. The concentrations of LDL and HDL lipids are mainly located on the inner surface of the artery and at small thicknesses. Lipids are unevenly distributed across the damaged areas between the stent sections. The concentrations show that the highest values are concentrated near the stent element, while the values in the middle of the damaged area are minimal (Figure 8). High LDL and HDL values are concentrated in areas with WSS below 1 Pa.
Figure 8.
Distribution of LDL, HDL, LDLox, M in the artery wall at 180 days, porosity 0.68.
Figure 9.
Distribution of F, P, Q in the artery wall at 180 days, porosity 0.68.
3.1.2. Comparison of 2D and 3D Models with a Fixed Mesh: Without Statins
In the next stage, we compared the 2D model with the 3D model, which accurately describes the geometry of the stent, not just its cross-section.
Figure 10 and Figure 11 show the velocity distributions and WSS for the 3D model. A comparison with the two-dimensional model shows that the three-dimensional model demonstrates higher values: the flow velocity reaches 0.9 m/s, and the wall shear stress reaches 7 Pa, whereas in the 2D model these values are 0.7 m/s and 3.6 Pa, respectively. The initial cells of the stent show the highest values compared to the other cells.
Figure 10.
Velocity distribution in a straight artery 3D.
Figure 11.
Distribution of wall shear stress in a straight artery 3D.
According to plaque growth graphs, there is a significant difference between the models. For all porosities, the results of the 2D model show an overestimation of growth values compared to the 3D model. Moreover, the difference is significant, ranging from 30.93% to 31.27%. At minimum artery porosity, where maximum growth is concentrated, 2D shows growth of about 0.3 mm compared to 3D, which shows growth of about 0.2 mm (Figure 12).
Figure 12.
Comparison of 2D and 3D models with a fixed mesh, without considering statins: (a–c) plaque growth; (d–f) percentage difference between models.
Figure 13, Figure 14, Figure 15, Figure 16, Figure 17, Figure 18 and Figure 19 show the concentrations of all substances under consideration (LDL, HDL, LDLox, M, F, P, Q) at 5, 30, 90, and 180 days. The concentrations of LDL and HDL lipids for 3D stabilised over time within 10 days. As with the 2D model, their concentrations are focused in areas near the stent, i.e., at the edges of the stent cells. In the middle areas of the cells, the concentrations are minimal or equal to zero. They are also located at small distances from the inner surface of the stented artery.
Figure 13.
Distribution of LDL in the arterial wall at different points in time, porosity 0.68.
Figure 14.
Distribution of HDL in the arterial wall at different points in time, porosity 0.68.
Figure 15.
Distribution of LDLox in the arterial wall at different points in time, porosity 0.68.
Figure 16.
Distribution of M in the arterial wall at different points in time, porosity 0.68.
Figure 17.
Distribution of F in the arterial wall at different points in time, porosity 0.68.
Figure 18.
Distribution of P in the arterial wall at different points in time, porosity 0.68.
Figure 19.
Distribution of Q in the arterial wall at different points in time, porosity 0.68.
The distribution of components M, F, P, and Q is observed across the full thickness of the wall, but the initial concentration is most concentrated in the area around the stent. Over time, the concentrations even out across the thickness: while on day 5 the contour of the stent is still clearly visible on the inner surface of the artery, by day 180 it has practically disappeared due to uniform redistribution. This indicates that the geometry of the stent has a significant effect on the distribution of concentrations.
Between day 5 and day 180, the foam cell concentration F evolves from a strut-shadow pattern to an almost uniform wall state. In the first days, the stent struts shield the underlying wall from the blood, and the reactions of Equations (3)–(14) proceed only in the segments exposed between the struts, so the F field reproduces the stent-cell geometry. As the reactants diffuse through the wall thickness, the reaction zones extend beneath the struts, the local peaks level out, and by day 180 the distribution becomes essentially uniform. The cumulative (non-diffusive) character of foam-cell accumulation in the single-layer model then implies that the total foam-cell content—and hence the plaque-growth rate in Equation (23)—continues to increase throughout the simulation horizon.
3.1.3. Comparison Between 3D Models of a Single-Layer Artery and a Three-Layer Artery: Without Statins
In the next step, we compared the data obtained for two models: a single-layer artery, where only the accumulation of components is considered without taking into account the diffusion of foam cells and cytokines, and a multi-layer artery, where diffusion is considered for all components (Figure 20).
Figure 20.
Comparing 3D models of a single-layer artery and a three-layer artery, without statins: (a–c) plaque growth; (d–f) percentage difference between models.
At maximum porosity, the multilayer model shows greater growth compared to the single-layer model. In addition, it can be seen that as the porosity of the artery decreases, the growth in the single-layer artery increases. The maximum difference occurs at 29.45% at a porosity of 0.68. At a porosity of 0.8025, the difference between the models is 9.06%, which is the smallest difference. At a porosity of 0.983, the difference between the models is 21.8%.
3.1.4. Compare 3D Models of a Single-Layer Artery Without Statins and with Statins
Since the plaque growth model, we developed is more physiological (it considers the accumulation of foam cells and cytokines), an additional study was conducted with the inclusion of statins. Thus, we compared the behaviour of the model in the absence and presence of drug molecules.
Figure 21 shows comparative graphs that demonstrate that the model that includes drug molecules actually reduces plaque growth, i.e., stent restenosis. Depending on the porosity of the artery, the reduction in growth over the calculated period of 180 days ranges from 4.98% to 5.42%.
Figure 21.
Comparing 3D models of a single-layer artery without statins and with statins: (a–c) plaque growth; (d–f) percentage difference between models.
3.1.5. Compare 3D Models of a Single-Layer Artery with Statins Using Fixed and Moving Mesh
Additionally, a comparison of 3D models with fixed and moving mesh was presented (Figure 22). Minimal differences between the models in plaque growth were identified. The percentage difference for porosity 0.983 is 1.6%, for porosity 0.8025 the difference is 2.6%, and for porosity 0.68 the difference is 0.8%. At the same time, the maximum growth at 180 days was less than 0.2 mm.
Figure 22.
Comparing 3D models of a single-layer artery with statins using fixed and moving mesh: (a–c) plaque growth; (d–f) absolute difference between models; (g–i) percentage difference between models.
Figure 23, Figure 24 and Figure 25 show the concentrations of foamy cells in the cross-section of the artery at different times and at different porosities. These figures also show the process of reducing the lumen of the artery at different times. On day 180, the distribution of foam cells across the cross-sectional area becomes uniform and stabilises, i.e., a homogeneous distribution with constant values is established.
Figure 23.
F distribution in the artery wall at different times, porosity 0.983.
Figure 24.
F distribution in the artery wall at different times, porosity 0.8025.
Figure 25.
F distribution in the artery wall at different times, porosity 0.68.
3.1.6. Comparison of Plaque Growth at Two Damage Levels f = 1 and f = 10
Equations (17) and (18) include the constant f, which characterises the flux intensity in the damaged area. According to [46], f = 1 corresponds to moderate endothelial damage, while f = 10 corresponds to severe damage.
Figure 26 shows a comparison of two levels of endothelial damage at different artery porosities. Based on the fact that we considered an artery with a diameter of 3 mm, the maximum radial growth cannot exceed 1.5 mm. The comparison shows that with a high damage level (f = 10), the maximum growth is achieved on day 360 for a porosity of 0.68, on day 433 for 0.8025, and on day 548 for 0.983. With an average damage level (f = 1), maximum growth is recorded on the 1308th day for a porosity of 0.68 and on the 1583rd day for a porosity of 0.8025. In the case of porosity 0.983, even over the calculated period of 5 years (1800 days), the thickness does not exceed the critical value of 1.5 mm, reaching only 1.24 mm.
Figure 26.
Comparison of plaque growth at two damage levels, f = 1 and f = 10, and different artery porosities.
3.1.7. Curved Artery: With Statins
Previous studies have presented results comparing models on a straight artery, but it is known that coronary arteries have a specific curvature. In this study, we obtained results for a curved artery with the same diameter of 3 mm as the straight artery.
The velocity distributions and WSS in a curved artery were obtained (Figure 27 and Figure 28). The velocity characteristics are similar to those of a straight artery. Since the artery is not straight, the wall shear stress is unevenly distributed in the stent cells. The maximum values are 10 Pa and are distributed throughout the curved artery, compared to the straight artery, where the maximum values of 7 Pa are localised only in the initial stent cells.
Figure 27.
Velocity distribution in a curved artery.
Figure 28.
Distribution of shear stress in a curved artery.
We obtained plaque growth distributions (Figure 29) at different artery porosities. An increase in growth with decreasing porosity is also observed. The maximum plaque growth at 180 days is 0.1664 mm at a porosity of 0.68, 0.1154 mm at a porosity of 0.8025, and 0.0750 mm at a porosity of 0.983.
Figure 29.
Comparison of plaque growth in a curved artery at different artery porosities.
Figure 30 and Figure 31 show concentration graphs for the components studied in a curved artery and a straight artery. There is a significant difference in concentration distribution between the models.
Figure 30.
Concentrations of substances in a curved artery.
Figure 31.
Concentrations of substances in the straight artery.
For example, the straight artery shows constant concentrations of HDL, LDL, and S components over time, stabilising at constant values on day 10. The situation is different with the distributions in the curved artery; depending on the porosity, there are components that show growth, for example, LDL and S at a porosity of 0.68, and HDL at porosities of 0.68 and 0.8025.
Figure 32 shows how growth changes at different points in time at a porosity of 0.68. Up to 30 days, the influence of the cellularity and curved geometry of the artery is still noticeable. The maximum values are concentrated in the centre of the artery and amount to 0.1664 mm. Moreover, a straight artery with this porosity shows a growth of 0.2 mm. There is a noticeable strong influence of both the geometry of the stent and the curvature of the artery and the stent itself.
Figure 32.
Contours of plaque growth distribution on a curved stented artery at different points in time, porosity 0.68.
The concentrations of components in the volume of the artery (Figure 33 and Figure 34) and on the inner surface of the artery (Figure 35 and Figure 36) were also presented at a porosity of 0.68 at a time of 180 days.
Figure 33.
Distribution of LDL, HDL, LDLox, M in the wall of a curved artery at time 180 days, porosity 0.68.
Figure 34.
Distribution of F, P, Q, S in the wall of a curved artery at time 180 days, porosity 0.68.
Figure 35.
Distribution of F, P, Q, S on the inner surface of a curved artery at time 180 days, porosity 0.68.
Figure 36.
Distribution of LDL, HDL, LDLox, M on the inner surface of a curved artery at 180 days, porosity 0.68.
In this model, LDL and HDL concentrations are localised in the middle areas of the stent cells, differing from the simple straight model, where they were localised in areas near the stent cells (Figure 36). They are also located at low thicknesses from the inner surface of the stented artery.
The distribution of components M, F, P, and Q is observed throughout the wall thickness, but the initial concentration is expressed in the area around the stent. This indicates that the geometry of the stent and artery has a significant effect on the distribution of concentrations.
4. Discussion
As a result, distributions of substance concentrations in the stented area of the coronary artery and plaque growth were obtained for a number of models: 2D and 3D, fixed and moving mesh, single-layer and three-layer arteries, straight and curved arteries. Comparisons were made between the models to identify the most optimal model.
As a result, the following patterns were identified:
Impact of mesh motion (2D, without statins): the difference between models with fixed and moving mesh is a maximum of 6.14% at minimum porosity, which shows the greatest growth. From this, conclusions were made about the applicability of a fixed mesh for short calculation periods (up to 6 months).
The influence of model dimensions (2D vs. 3D, without statins): a comparison of identical two-dimensional and three-dimensional models revealed a significant discrepancy. The difference reaches 31%, with the 2D model overestimating plaque growth compared to the more realistic 3D representation of the stented area.
Evaluation of three-dimensional models (with statins): comparisons of 3D models with fixed and moving mesh showed a maximum difference of 2.6% at a porosity of 0.8025. At maximum growth (porosity 0.68), the difference is minimal—only 0.8%. The data obtained once again confirms that for calculations over an interval of up to 180 days, the use of a fixed mesh is preferable due to the identical results and shorter computation times.
Accounting for structural features of the artery (single-layer vs. three-layer, without statins): comparing a single-layer artery model with a three-layer model, where the single-layer model did not take into account the diffusion of foam cells, while the three-layer model did, it was shown that as porosity decreases, the single-layer model shows more accurate plaque growth results. Namely, increased growth values due to the cumulative effect of foam cells over time. Moreover, at the highest growth rate with a porosity of 0.68, the difference is 29.45%.
Assessment of pharmacological effect (influence of statins): additional comparative analysis showed the expected inhibitory effect of therapy: inclusion of drug molecules (statins) in the model leads to a 5.42% reduction in estimated plaque growth.
In addition, significant influences of artery porosity and the level of endothelial damage in the stented area were identified. In all models, the results showed that plaque growth increases as artery porosity decreases. This is an entirely logical conclusion, since lower porosity provides more volume for reactions and accumulation of foam cells. The level of endothelial damage also influences growth. In this study, we used a maximum damage level of f = 10 to characterise the stented area.
This study presents the results of modelling blood dynamics in an artery with a stent and examines the effect of the choice of computational model (2D vs. 3D, fixed mesh vs. moving mesh, single-layer wall vs. three-layer wall) on the distribution of biologically active substances in the stenting area during restenosis development. The proposed model describes the main physicochemical processes underlying restenosis and hemodynamic. To solve the problem of multiscale phenomena in time, a quasi-steady approach was used, which ensures stable and effective homogenisation of hemodynamics and reaction parameters [43].
The main influence on restenosis, i.e., plaque growth, is exerted by WSS. In our work, we used a threshold value of 1 Pa [29]. However, there are studies that associate plaque growth with other threshold values. For example, in [49,50] the authors set this threshold at 0.4–0.6 Pa.
In the curved artery, local WSS peaks reach 10 Pa, above the normal physiological range of 1–7 Pa [51]. High WSS has two effects. Within the model, WSS-dependent endothelial permeability remains low over most of the stented surface of the curved artery, so lipid infiltration and plaque growth are confined to the low-WSS pockets behind the struts. Physiologically, shear stresses of 7 Pa and above activate platelets and unfold von Willebrand factor, and high WSS at strut surfaces is associated with delayed reendothelialization and endothelial cell injury [51,52]. In vivo, platelets activated at high-shear strut regions can be deposited in adjacent low-WSS recirculation pockets, creating a prothrombotic configuration.
A comparative analysis showed that the use of a two-dimensional model to study the stented area leads to overestimated results of neointima growth. This is due to the fact that a 2D model is unable to correctly reproduce the exact geometry of the stent and accurately describe local hemodynamics. Despite the existence of studies [12,46,53,54,55,56,57] using such a simplified approach, our direct comparison of 2D and 3D models revealed a discrepancy of almost 30% in the results, which is a critical difference.
The key advantage of our biological model of restenosis is its comprehensiveness. We consider the distribution of 12 biological components (including LDL, HDL, LDLox, M, P, F, Q, S, as well as additional factors NC, CSMC, SSMC, Cg). We considered the porosity of the artery and examined the results for three types of artery porosity. An important feature is the realistic modelling of foam cells: we take into account their cumulative effect, assuming zero diffusion in the artery [12]. In addition, we tested the model’s performance on two geometric configurations: an idealised straight and curved vessel model.
The assumption of zero diffusivity for foam cells within the arterial wall, adopted in the single-layer model, deserves explicit discussion. Foam cells are non-motile derivatives of macrophages that accumulate irreversibly in the intima, and experimental evidence of their migration is lacking; the zero-diffusion assumption therefore captures the cumulative character of foam-cell accumulation and is consistent with the models on which the formulation is based [12]. Its limitation is that foam-cell turnover occurs indirectly—through foam-cell death and the influx and differentiation of new monocytes—processes represented in the model by the macrophage and monocyte equations rather than by Fickian diffusion of F. The comparison of the single-layer (zero F-diffusion) and three-layer (finite F-diffusion) models in Section 3.1.3 quantifies the sensitivity to this assumption directly: differences in predicted plaque growth reach 29.45% at a porosity of 0.68. A mechanistically richer treatment, in which foam-cell kinetics are described by cell-population fluxes rather than a diffusion coefficient, is a direction for future refinement.
In addition, we compared our results qualitatively with clinical data and other numerical calculations (Table 4 and Figure 37). However, arterial-wall porosity is generally not reported in clinical restenosis studies, which complicates direct quantitative comparison with the literature data. The clinical and numerical results in [43,58,59] are therefore included only as a qualitative literature-based comparison, without assigning a specific porosity value to any individual study. This comparison does not constitute independent validation of the model. Independent validation would require matched datasets containing both arterial-wall characterisation and the corresponding clinical outcomes. Until such data become available, Table 4 and Figure 37 should be interpreted solely as an assessment of the plausibility of the predicted trends and ranges rather than as quantitative validation.
Table 4.
Qualitative comparison of model predictions with published clinical and numerical results.
Figure 37.
Qualitative comparison of predicted restenosis ranges with literature data. Literature and clinical data are reproduced from Ranno et al. [43], Escuer et al. [53], Nakatani et al. [58], He et al. [59], Cheng and Zhang [60], and Milewski et al. [61].
However, it should be noted that there is a significant difference between the results of numerical modelling and clinical analysis in the world literature. For example, in references [53,60,61], arterial restenosis differs significantly from our results. These differences are due to a variety of factors: different restenosis models, boundary conditions, observation duration, different stent geometries, different patient ages and genders, and other parameters. In this regard, further research will involve the introduction of an individualised approach to the creation of patient-specific models. Moreover, clinical restenosis rates are influenced by comorbidities, antithrombotic therapy, and lesion complexity, none of which are represented in an idealised in silico model; the observed discrepancies should therefore be read as differences in modelling assumptions and patient populations rather than as failures of the physical model.
The purpose of this work is to develop a comprehensive multiphysical model that combines a continuous description of vascular wall cell dynamics, pharmacokinetics (in the artery wall), hemodynamics, and restenosis processes. Although individual components of this system have been studied previously, they have been considered in isolation or within the context of two-dimensional hybrid agent-based models. The proposed approach integrates these processes for the first time into a single three-dimensional continuous formulation that takes into account both the curvature of the artery and different stent geometries. The work has high clinical potential: the model allows predicting the development of restenosis depending on the type and geometry of the stent and artery, and also opens up opportunities for personalised selection of drug coating regimens to optimise artery healing. From a translational perspective, the model can serve as an in silico testbed for personalised stent design—comparing candidate strut geometries and stent configurations for a given lesion prior to intervention—and for the optimisation of drug-eluting stent coatings, by linking the pharmacokinetic parameters of the drug (diffusivity, degradation rate, dosage) to the predicted restenosis outcome.
5. Conclusions
The results reflect the outcomes of modelling the spatial and temporal distribution of the main biological components in the blood vessel wall and the dynamics of neointimal growth (restenosis) after stent implantation over 180 days. The main quantitative findings are: (i) two-dimensional models overestimate neointima growth by 31% (30.93–31.27%) compared with three-dimensional models that resolve the stent geometry, so quantitative studies of the stented segment require a 3D formulation; (ii) statin therapy reduces predicted plaque growth by 5.42% (4.98–5.42% across the porosity range); (iii) lower arterial wall porosity accelerates plaque formation throughout the investigated range ε = 0.983–0.68; and (iv) fixed and moving meshes agree within 2.6% in 3D (0.8% at the highest-growth porosity of 0.68) and within 6.14% in 2D over 180 days.
Further development of the model to increase its predictive value involves the consideration of individual geometric parameters of the stent and the characteristics of the arteries of a specific patient. A key future direction is the integration of patient-specific imaging data—coronary CT angiography and intravascular OCT—into the modelling pipeline, so that the lumen and wall geometry can be derived from the patient’s own anatomy; this would convert the present parametric study into a clinically deployable planning tool.
The authors believe that this model is based on research into the influence of various risk factors on restenosis. It is assumed that its further improvement will contribute to the development of more effective approaches to the prevention and treatment of this pathological process, which will finally improve clinical outcomes in patients with ischaemic heart disease.
Author Contributions
Conceptualisation, A.K. and A.G.K.; methodology, A.K.; formal analysis, A.K. and A.G.K.; investigation, and A.G.K.; resources, A.G.K.; data curation, A.K.; writing—original draft preparation, A.K. and A.G.K.; writing—review and editing, A.G.K.; visualisation, A.K.; supervision, A.G.K.; project administration, A.K.; funding acquisition, A.G.K. All authors have read and agreed to the published version of the manuscript.
Funding
Alex G. Kuchumov thank the Ministry of Science and Higher Education of the Russian Federation for financial assistance within the framework of the state assignment for performing fundamental scientific research (FSNM–2025–0001).
Data Availability Statement
The raw data supporting the conclusions of this article will be made available by the authors on request.
Conflicts of Interest
The authors declare no conflicts of interest.
Abbreviations
The following abbreviations are used in this manuscript:
| IHD | Ischemic heart disease |
| NO | Nitric oxide |
| LDLox | Oxidised low-density lipoprotein |
| M | Macrophages |
| P | Monocytes |
| F | Foam cells |
| Q | Cytokines |
| S | Statins |
| NC | Necrotic core |
| CSMC | Contractile smooth muscle cells |
| SSMC | Synthetic smooth muscle cells |
| Cg | Collagen fibers |
| PDGF | Platelet-derived growth factor |
| TGF-β | Transforming growth factor bet |
| WSS | Wall shear stress |
| TAWSS | Time-averaged wall shear stress |
| OSI | Oscillatory shear index |
| HOLMES | Hemodynamic Oscillatory and Low/High Magnitude Endothelial Stress |
| FSI | Fluid–structure interaction |
| BDF | Backward differentiation formula |
| MUMPS | Multifrontal massively parallel sparse direct solver |
References
- Byrne, R.A.; Rossello, X.; Coughlan, J.J.; Barbato, E.; Berry, C.; Chieffo, A.; Claeys, M.J.; Dan, G.A.; Dweck, M.R.; Galbraith, M.; et al. 2023 ESC Guidelines for the management of acute coronary syndromes. Eur. Heart J. 2023, 44, 3720–3826. [Google Scholar] [CrossRef] [Scilit] [PubMed]
- Dangas, G.D.; Claessen, B.E.; Caixeta, A.; Sanidas, E.A.; Mintz, G.S.; Mehran, R. In-stent restenosis in the drug-eluting stent era. J. Am. Coll. Cardiol. 2010, 56, 1897–1907. [Google Scholar] [CrossRef] [Scilit] [PubMed]
- De Nisco, G.; Hartman, E.M.J.; Torta, E.; Daemen, J.; Chiastra, C.; Gallo, D.; Morbiducci, U.; Wentzel, J.J. Predicting Lipid-Rich Plaque Progression in Coronary Arteries Using Multimodal Imaging and Wall Shear Stress Signatures. Arterioscler. Thromb. Vasc. Biol. 2024, 44, 976–986. [Google Scholar] [CrossRef] [Scilit] [PubMed]
- Tzafriri, A.R.; Groothuis, A.; Price, G.S.; Edelman, E.R. Stent elution rate determines drug deposition and receptor-mediated effects. J. Control. Release 2012, 161, 918–926. [Google Scholar] [CrossRef] [Scilit] [PubMed]
- McGinty, S. A decade of modelling drug release from arterial stents. Math. Biosci. 2014, 257, 80–90. [Google Scholar] [CrossRef] [Scilit] [PubMed]
- Kuchumov, A.G.; Khairulin, A.; Sporysheva, D.; Drozdov, A.; Kilina, P.; Kachenyuk, M.; Bolshakov, P.; Akyfiev, K.; Silberschmidt, V.V. Elaboration of PLA and PLLA stents manufacturing regimes and evaluation of their mechanical performance. Int. J. Adv. Manuf. Technol. 2025, 140, 5483–5513. [Google Scholar] [CrossRef] [Scilit]
- Sporysheva, D.I.; Khairulin, A.R. Additive Manufacturing and Numerical Modeling Polymer Stents. Russ. J. Biomech. 2024, 28, 106–119. [Google Scholar] [CrossRef] [Scilit]
- Buccheri, D.; Piraino, D.; Andolina, G.; Cortese, B. Understanding and managing in-stent restenosis: A review of clinical data, from pathogenesis to treatment. J. Thorac. Dis. 2016, 8, E1150–E1162. [Google Scholar] [CrossRef] [Scilit] [PubMed]
- Gunn, J.; Arnold, N.; Chan, K.H.; Shepherd, L.; Cumberland, D.C.; Crossman, D.C. Coronary artery stretch versus deep injury in the development of in-stent neointima. Heart 2002, 88, 401–405. [Google Scholar] [CrossRef] [Scilit] [PubMed]
- Drachman, D.E.; Simon, D.I. Inflammation as a mechanism and therapeutic target for in-stent restenosis. Curr. Atheroscler. Rep. 2005, 7, 44–49. [Google Scholar] [CrossRef] [Scilit] [PubMed]
- Mitra, A.K.; Agrawal, D.K. In stent restenosis: Bane of the stent era. J. Clin. Pathol. 2006, 59, 232–239. [Google Scholar] [CrossRef] [Scilit] [PubMed]
- Hernández-López, P.; Martínez, M.A.; Peña, E.; Cilla, M. Understanding the Parameter Influence on Lesion Growth for a Mechanobiology Model of Atherosclerosis. Mathematics 2023, 11, 829. [Google Scholar] [CrossRef] [Scilit]
- Gerthoffer, W.T. Mechanisms of vascular smooth muscle cell migration. Circ. Res. 2007, 100, 607–621. [Google Scholar] [CrossRef] [Scilit] [PubMed]
- Libby, P. Inflammation during the life cycle of the atherosclerotic plaque. Cardiovasc. Res. 2021, 117, 2525–2536. [Google Scholar] [CrossRef] [Scilit] [PubMed]
- Koskinas, K.C.; Chatzizisis, Y.S.; Antoniadis, A.P.; Giannoglou, G.D. Role of endothelial shear stress in stent restenosis and thrombosis: Pathophysiologic mechanisms and implications for clinical translation. J. Am. Coll. Cardiol. 2012, 59, 1919. [Google Scholar]
- Hernández-López, P.; Cilla, M.; Martínez, M.; Peña, E. Effects of the Haemodynamic Stimulus on the Location of Carotid Plaques Based on a Patient-Specific Mechanobiological Plaque Atheroma Formation Model. Front. Bioeng. Biotechnol. 2021, 9, 690685. [Google Scholar] [CrossRef] [Scilit] [PubMed]
- Caiazzo, A.; Evans, D.; Falcone, J.L.; Hegewald, J.; Lorenz, E.; Stahl, B.; Wang, D.; Bernsdorf, J.; Chopard, B.; Gunn, J.; et al. A Complex Automata approach for in-stent restenosis: Two-dimensional multiscale modelling and simulations. J. Comput. Sci. 2011, 2, 9–17. [Google Scholar] [CrossRef] [Scilit]
- Tahir, H.; Niculescu, I.; Bona-Casas, C.; Merks, R.M.H.; Hoekstra, A.G. An in silico study on the role of smooth muscle cell migration in neointimal formation after coronary stenting. J. R. Soc. Interface 2015, 12, 20150358. [Google Scholar] [CrossRef] [Scilit] [PubMed]
- Bhui, R.; Hayenga, H.N. An agent-based model of leukocyte transendothelial migration during atherogenesis. PLoS Comput. Biol. 2017, 13, e1005523. [Google Scholar] [CrossRef] [Scilit] [PubMed]
- Corti, A.; Chiastra, C.; Colombo, M.; Garbey, M.; Migliavacca, F.; Casarin, S. A fully coupled computational fluid dynamics—Agent-based model of atherosclerotic plaque development: Multiscale modeling framework and parameter sensitivity analysis. Comput. Biol. Med. 2020, 118, 103623. [Google Scholar] [CrossRef] [Scilit] [PubMed]
- Zun, P.S.; Narracott, A.J.; Chiastra, C.; Gunn, J.; Hoekstra, A.G. Location-Specific Comparison Between a 3D In-Stent Restenosis Model and Micro-CT and Histology Data from Porcine In Vivo Experiments. Cardiovasc. Eng. Technol. 2019, 10, 568–582. [Google Scholar] [CrossRef] [Scilit] [PubMed]
- Zun, P.S.; Anikina, T.; Svitenkov, A.; Hoekstra, A.G. A comparison of fully-coupled 3D in-stent restenosis simulations to In-vivo Data. Front. Physiol. 2017, 8, 284. [Google Scholar] [CrossRef] [Scilit] [PubMed]
- Malvè, M.; Gharib, A.M.; Yazdani, S.K.; Finet, G.; Martínez, M.A.; Pettigrew, R.; Ohayon, J. Tortuosity of Coronary Bifurcation as a Potential Local Risk Factor for Atherosclerosis: CFD Steady State Study Based on In Vivo Dynamic CT Measurements. Ann. Biomed. Eng. 2015, 43, 82–93. [Google Scholar] [CrossRef] [Scilit] [PubMed]
- Kim, H.J.; Vignon-Clementel, I.E.; Coogan, J.S.; Figueroa, C.A.; Jansen, K.E.; Taylor, C.A. Patient-specific modeling of blood flow and pressure in human coronary arteries. Ann. Biomed. Eng. 2010, 38, 3195–3209. [Google Scholar] [CrossRef] [Scilit] [PubMed]
- Sáez, P.; Malvè, M.; Martínez, M.A. A theoretical model of the endothelial cell morphology due to different waveforms. J. Theor. Biol. 2015, 379, 16–23. [Google Scholar] [CrossRef] [Scilit] [PubMed]
- Alimohammadi, M.; Pichardo-Almarza, C.; Agu, O.; Díaz-Zuccarini, V. A multiscale modelling approach to understand atherosclerosis formation: A patient-specific case study in the aortic bifurcation. Proc. Inst. Mech. Eng. Part H J. Eng. Med. 2017, 231, 378–390. [Google Scholar] [CrossRef] [Scilit] [PubMed]
- Alimohammadi, M.; Pichardo-Almarza, C.; Agu, O.; Díaz-Zuccarini, V. Development of a patient-specific multi-scale model to understand atherosclerosis and calcification locations: Comparison with in vivo data in an aortic dissection. Front. Physiol. 2016, 7, 238. [Google Scholar] [CrossRef] [Scilit] [PubMed]
- Siogkas, P.; Sakellarios, A.; Exarchos, T.P.; Athanasiou, L.; Karvounis, E.; Stefanou, K.; Fotiou, E.; Fotiadis, D.I.; Naka, K.K.; Michalis, L.K.; et al. Multiscale—Patient-specific artery and atherogenesis models. IEEE Trans. Biomed. Eng. 2011, 58, 3464–3468. [Google Scholar] [CrossRef] [Scilit] [PubMed]
- Lei, W.; Hu, J.; Xie, Y.; Liu, C.; Chen, X. Mathematical modelling of the effects of statins on the growth of necrotic core in atherosclerotic plaque. Math. Model. Nat. Phenom. 2023, 18, 11. [Google Scholar] [CrossRef] [Scilit]
- Filipovic, N.; Teng, Z.; Radovic, M.; Saveljic, I.; Fotiadis, D.; Parodi, O. Computer simulation of three-dimensional plaque formation and progression in the carotid artery. Med. Biol. Eng. Comput. 2013, 51, 607–616. [Google Scholar] [CrossRef] [Scilit] [PubMed]
- Liu, Y. Mathematical modeling and simulation of atherosclerotic formation and progress at arterial bifurcations. Biomed. Signal Process. Control 2023, 80, 104266. [Google Scholar] [CrossRef] [Scilit]
- Bozsak, F.; Chomaz, J.M.; Barakat, A.I. Modeling the transport of drugs eluted from stents: Physical phenomena driving drug distribution in the arterial wall. Biomech. Model. Mechanobiol. 2014, 13, 327–347. [Google Scholar] [CrossRef] [Scilit] [PubMed]
- Hwang, C.W.; Wu, D.; Edelman, E.R. Physiological transport forces govern drug distribution for stent-based delivery. Circulation 2001, 104, 600–605. [Google Scholar] [CrossRef] [Scilit] [PubMed]
- Nowak, M.; Melka, B.; Rojczyk, M.; Gracka, M.; Nowak, A.J.; Golda, A.; Adamczyk, W.P.; Isaac, B.; Białecki, R.A.; Ostrowski, Z. The protocol for using elastic wall model in modeling blood flow within human artery. Eur. J. Mech. B/Fluids 2019, 77, 273–280. [Google Scholar] [CrossRef] [Scilit]
- Goetz, A.; Jeken-Rico, P.; Pelissier, U.; Chau, Y.; Sédat, J.; Hachem, E. AnXplore: A comprehensive fluid-structure interaction study of 101 intracranial aneurysms. Front. Bioeng. Biotechnol. 2024, 12, 1433811. [Google Scholar] [CrossRef] [Scilit] [PubMed]
- von Danwitz, M.; Antony, P.; Key, F.; Hosters, N.; Behr, M. Four-dimensional elastically deformed simplex space-time meshes for domains with time-variant topology. Int. J. Numer. Methods Fluids 2021, 93, 3490–3506. [Google Scholar] [CrossRef] [Scilit]
- Kuhl, E.; Maas, R.; Himpel, G.; Menzel, A. Computational modeling of arterial wall growth: Attempts towards patient-specific simulations based on computer tomography. Biomech. Model. Mechanobiol. 2007, 6, 321–331. [Google Scholar] [CrossRef] [Scilit] [PubMed]
- Pfaller, M.R.; Latorre, M.; Schwarz, E.L.; Gerosa, F.M.; Szafron, J.M.; Humphrey, J.D.; Marsden, A.L. FSGe: A fast and strongly-coupled 3D fluid–solid-growth interaction method. Comput. Methods Appl. Mech. Eng. 2024, 431, 117259. [Google Scholar] [CrossRef] [Scilit] [PubMed]
- Marino, M.; Vairo, G.; Wriggers, P. Mechano-chemo-biological Computational Models for Arteries in Health, Disease and Healing: From Tissue Remodelling to Drug-eluting Devices. Curr. Pharm. Des. 2020, 27, 1904–1917. [Google Scholar] [CrossRef] [Scilit] [PubMed]
- Manjunatha, K.; Schaaps, N.; Behr, M.; Vogt, F.; Reese, S. Computational modeling of in-stent restenosis: Pharmacokinetic and pharmacodynamic evaluation. Comput. Biol. Med. 2023, 167, 107686. [Google Scholar] [CrossRef] [Scilit] [PubMed]
- Shahzad, H.; Wang, X.; Ghaffari, A.; Iqbal, K.; Hafeez, M.B.; Krawczuk, M.; Wojnicz, W. Fluid structure interaction study of non-Newtonian Casson fluid in a bifurcated channel having stenosis with elastic walls. Sci. Rep. 2022, 12, 12219. [Google Scholar] [CrossRef] [Scilit] [PubMed]
- Khairulin, A.; Kuchumov, A.G.; Silberschmidt, V.V. In silico model of stent performance in multi-layered artery using 2-way fluid-structure interaction: Influence of boundary conditions and vessel length. Comput. Methods Programs Biomed. 2024, 255, 108327. [Google Scholar] [CrossRef] [Scilit] [PubMed]
- Ranno, A.; Manjunatha, K.; Koritzius, T.; Steinbrecher, I.; Hosters, N.; Nachtsheim, M.; Nilcham, P.; Schaaps, N.; Turoni-Glitz, A.; Datz, J.; et al. A computational model of coronary arteries with in-stent restenosis coupling hemodynamics and pharmacokinetics with growth mechanics. Sci. Rep. 2025, 15, 39229. [Google Scholar] [CrossRef] [Scilit] [PubMed]
- Deng, C.; Liu, Z.; Zhao, R.; Shi, B. Intravascular imaging and functional assessment for coronary in-stent restenosis: Current status and future directions. Int. J. Cardiol. 2025, 421, 132918. [Google Scholar] [CrossRef] [Scilit] [PubMed]
- Chung, S.; Vafai, K. Low-density lipoprotein transport within a multi-layered arterial wall-Effect of the atherosclerotic plaque/stenosis. J. Biomech. 2013, 46, 574–585. [Google Scholar] [CrossRef] [Scilit] [PubMed]
- Lei, W.; Qian, S.; Zhu, X.; Hu, J. Haemodynamic Effects on the Development and Stability of Atherosclerotic Plaques in Arterial Blood Vessel. Interdiscip. Sci. Comput. Life Sci. 2023, 15, 616–632. [Google Scholar] [CrossRef] [Scilit] [PubMed]
- Moses, J.W.; Leon, M.B.; Popma, J.J.; Fitzgerald, P.J.; Holmes, D.R.; O’Shaughnessy, C.; Caputo, R.P.; Kereiakes, D.J.; Williams, D.O.; Teirstein, P.S.; et al. Sirolimus-eluting stents versus standard stents in patients with stenosis in a native coronary artery. N. Engl. J. Med. 2003, 349, 1315–1323. [Google Scholar] [CrossRef] [Scilit] [PubMed]
- Kastrati, A.; Hall, D.; Schömig, A. Long-term outcome after coronary stenting. Trials 2000, 1, 48. [Google Scholar] [CrossRef] [Scilit] [PubMed]
- Chatzizisis, Y.S.; Coskun, A.U.; Jonas, M.; Edelman, E.R.; Feldman, C.L.; Stone, P.H. Role of Endothelial Shear Stress in the Natural History of Coronary Atherosclerosis and Vascular Remodeling. Molecular, Cellular, and Vascular Behavior. J. Am. Coll. Cardiol. 2007, 49, 2379–2393. [Google Scholar] [CrossRef] [Scilit] [PubMed]
- Malek, A.M.; Alper, S.L. Hemodynamic Shear Stress and Its Role in Atherosclerosis. Stress Int. J. Biol. Stress 1999, 282, 2035–2042. [Google Scholar] [CrossRef] [Scilit] [PubMed]
- Gijsen, F.; Katagiri, Y.; Barlis, P.; Bourantas, C.; Collet, C.; Coskun, U.; Daemen, J.; Dijkstra, J.; Edelman, E.; Evans, P.; et al. Expert recommendations on the assessment of wall shear stress in human coronary arteries: Existing methodologies, technical considerations, and clinical applications. Eur. Heart J. 2019, 40, 3421–3433. [Google Scholar] [CrossRef] [Scilit] [PubMed]
- Van Der Heiden, K.; Gijsen, F.J.H.; Narracott, A.; Hsiao, S.; Halliday, I.; Gunn, J.; Wentzel, J.J.; Evans, P.C. The effects of stenting on shear stress: Relevance to endothelial injury and repair. Cardiovasc. Res. 2013, 99, 269–275. [Google Scholar] [CrossRef] [Scilit] [PubMed]
- Escuer, J.; Martínez, M.A.; McGinty, S.; Peña, E. Mathematical modelling of the restenosis process after stent implantation. J. R. Soc. Interface 2019, 16, 20190313. [Google Scholar] [CrossRef] [Scilit] [PubMed]
- Friedman, A.; Hao, W. A Mathematical Model of Atherosclerosis with Reverse Cholesterol Transport and Associated Risk Factors. Bull. Math. Biol. 2015, 77, 758–781. [Google Scholar] [CrossRef] [Scilit] [PubMed]
- Calvez, V.; Houot, J.G.; Meunier, N.; Raoult, A.; Rusnakova, G. Mathematical and numerical modeling of early atherosclerotic lesions. ESAIM Proc. 2010, 30, 1–14. [Google Scholar] [CrossRef] [Scilit]
- Olgac, U.; Kurtcuoglu, V.; Poulikakos, D. Computational modeling of coupled blood-wall mass transport of LDL: Effects of local wall shear stress. Am. J. Physiol.-Heart Circ. Physiol. 2008, 294, H909–H919. [Google Scholar] [CrossRef] [Scilit] [PubMed]
- Mirzaei, N.M.; Weintraub, W.S.; Fok, P.W. An integrated approach to simulating the vulnerable atherosclerotic plaque. Am. J. Physiol.-Heart Circ. Physiol. 2020, 319, H835–H846. [Google Scholar] [CrossRef] [Scilit] [PubMed]
- Nakatani, S.; Onuma, Y.; Ishibashi, Y.; Muramatsu, T.; Iqbal, J.; Zhang, Y.J.; Van Geuns, R.J.; Ormiston, J.A.; Serruys, P.W. Early (before 6 months), late (6–12 months) and very late (after 12 months) angiographic scaffold restenosis in the ABSORB cohort B trial. EuroIntervention 2015, 10, 1288–1298. [Google Scholar] [CrossRef] [Scilit] [PubMed]
- He, S.; Liu, W.; Qu, K.; Yin, T.; Qiu, J.; Li, Y.; Yuan, K.; Zhang, H.; Wang, G. Effects of different positions of intravascular stent implantation in stenosed vessels on in-stent restenosis: An experimental and numerical simulation study. J. Biomech. 2020, 113, 110089. [Google Scholar] [CrossRef] [Scilit] [PubMed]
- Cheng, J.; Zhang, L.T. Finite Element Simulation of In-Stent Restenosis with Tissue Growth Model. J. Biomed. Sci. Eng. 2021, 14, 33–47. [Google Scholar] [CrossRef]
- Milewski, K.; Takahashi, K.; Asano, T.; Katagiri, Y.; Hochul, M.; Buszman, P.P.; Tomaniak, M.; Gorycki, B.; Zurakowski, A.; Janas, A.; et al. Neointimal hyperplasia of ultra-thin stents with microcrystalline sirolimus or durable polymer everolimus-eluting stents: 6- And 24-month results of the DESSOLVE III OCT study. EuroIntervention 2021, 16, 1187–1194. [Google Scholar] [CrossRef] [Scilit] [PubMed]
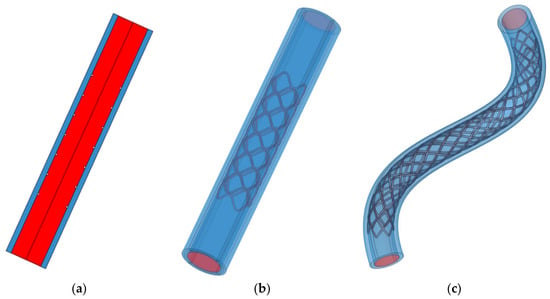
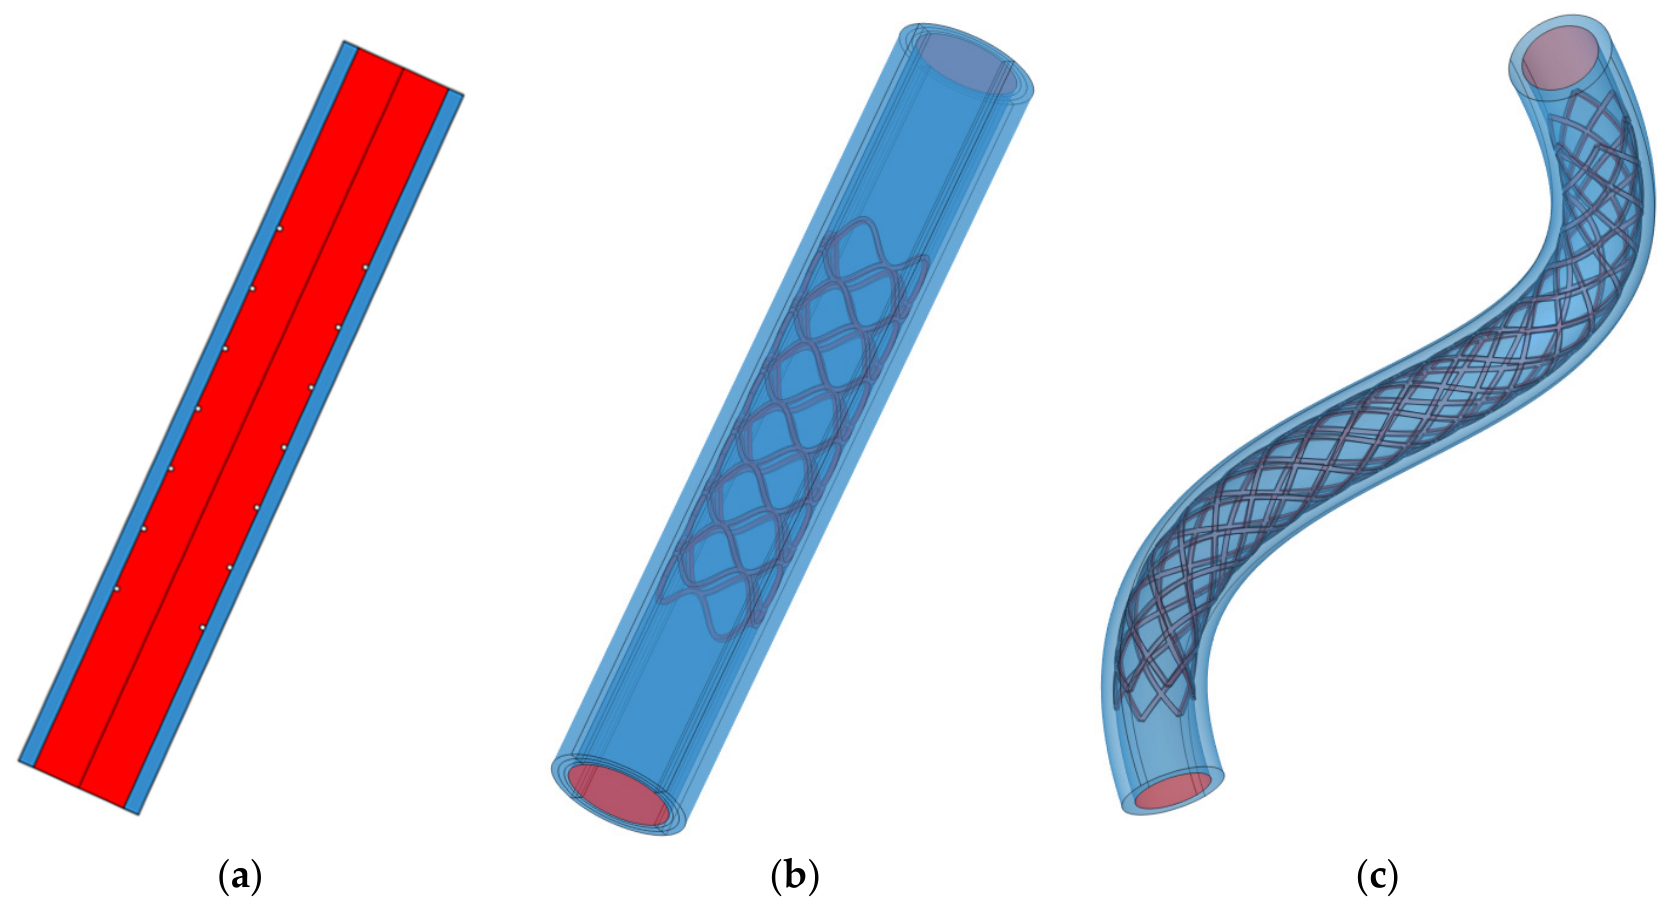
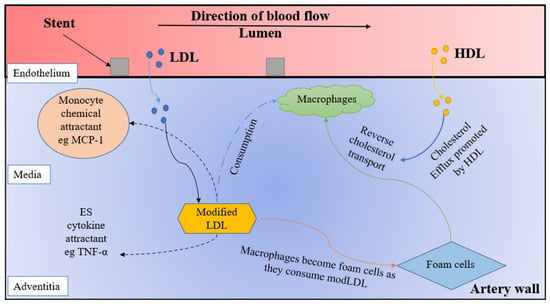
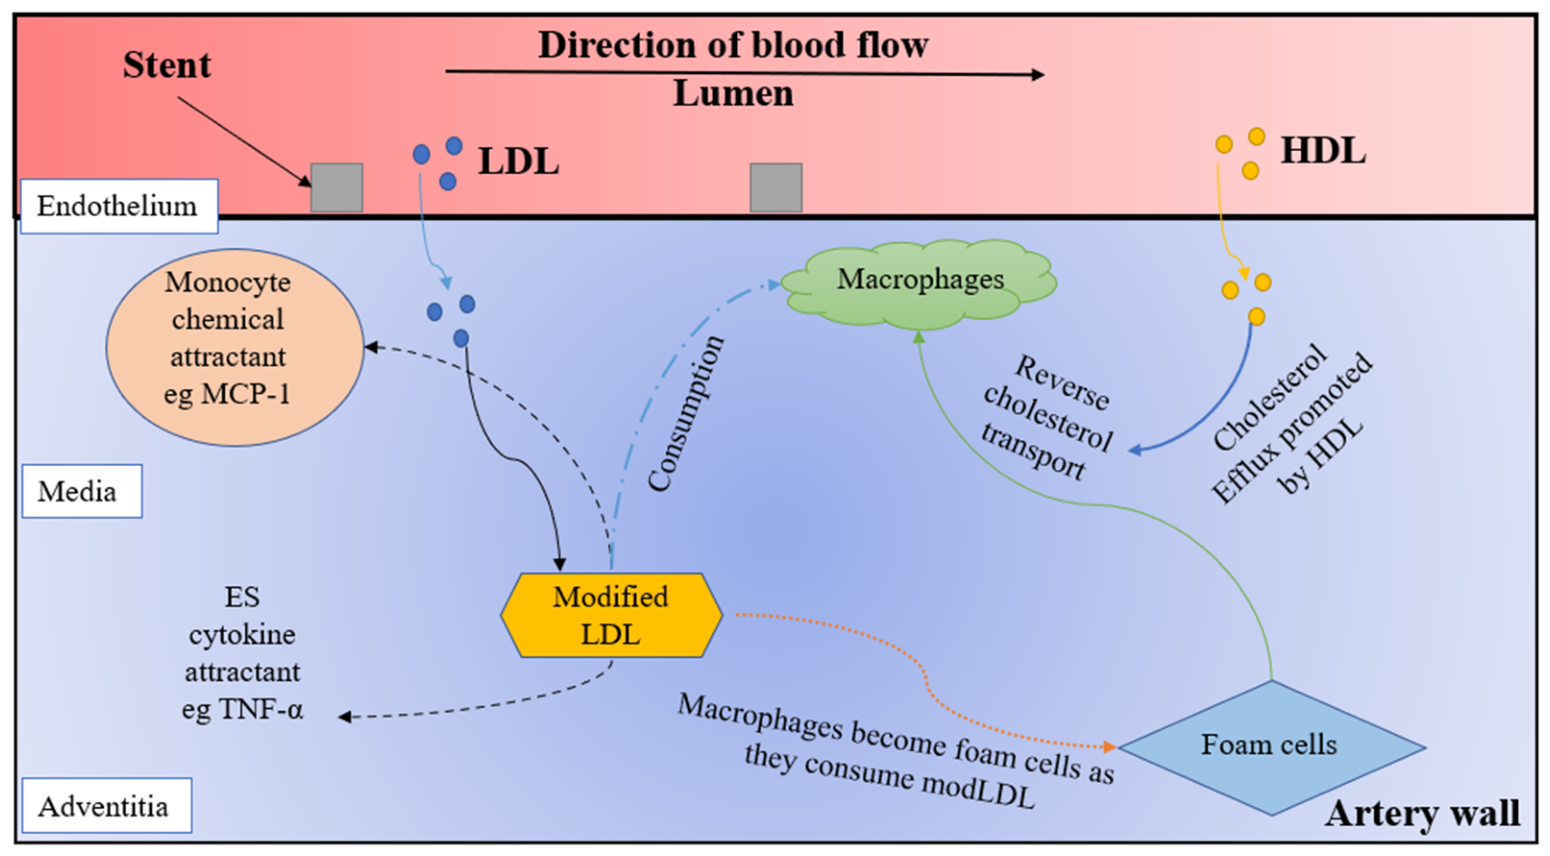
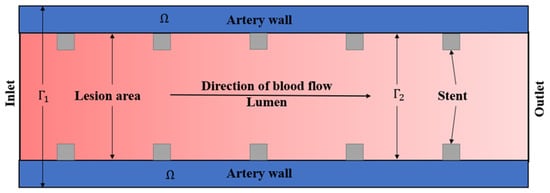
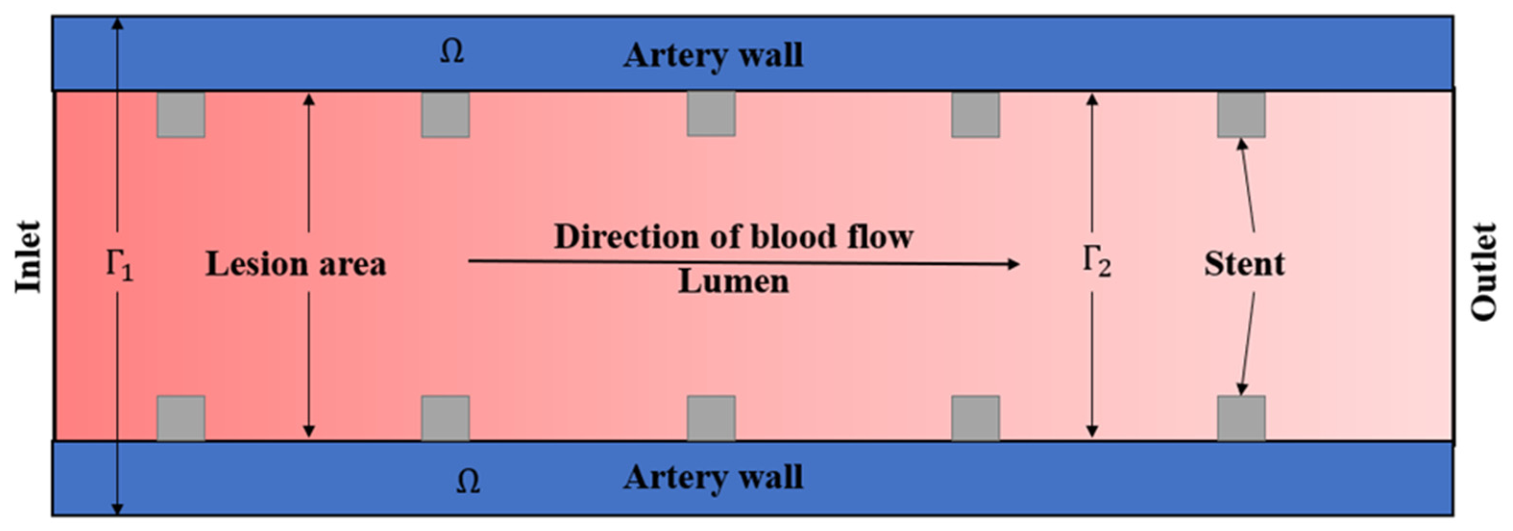
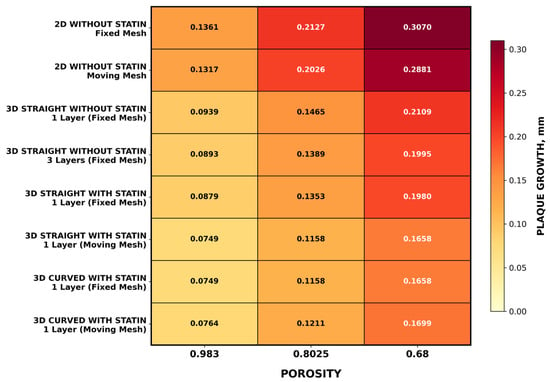
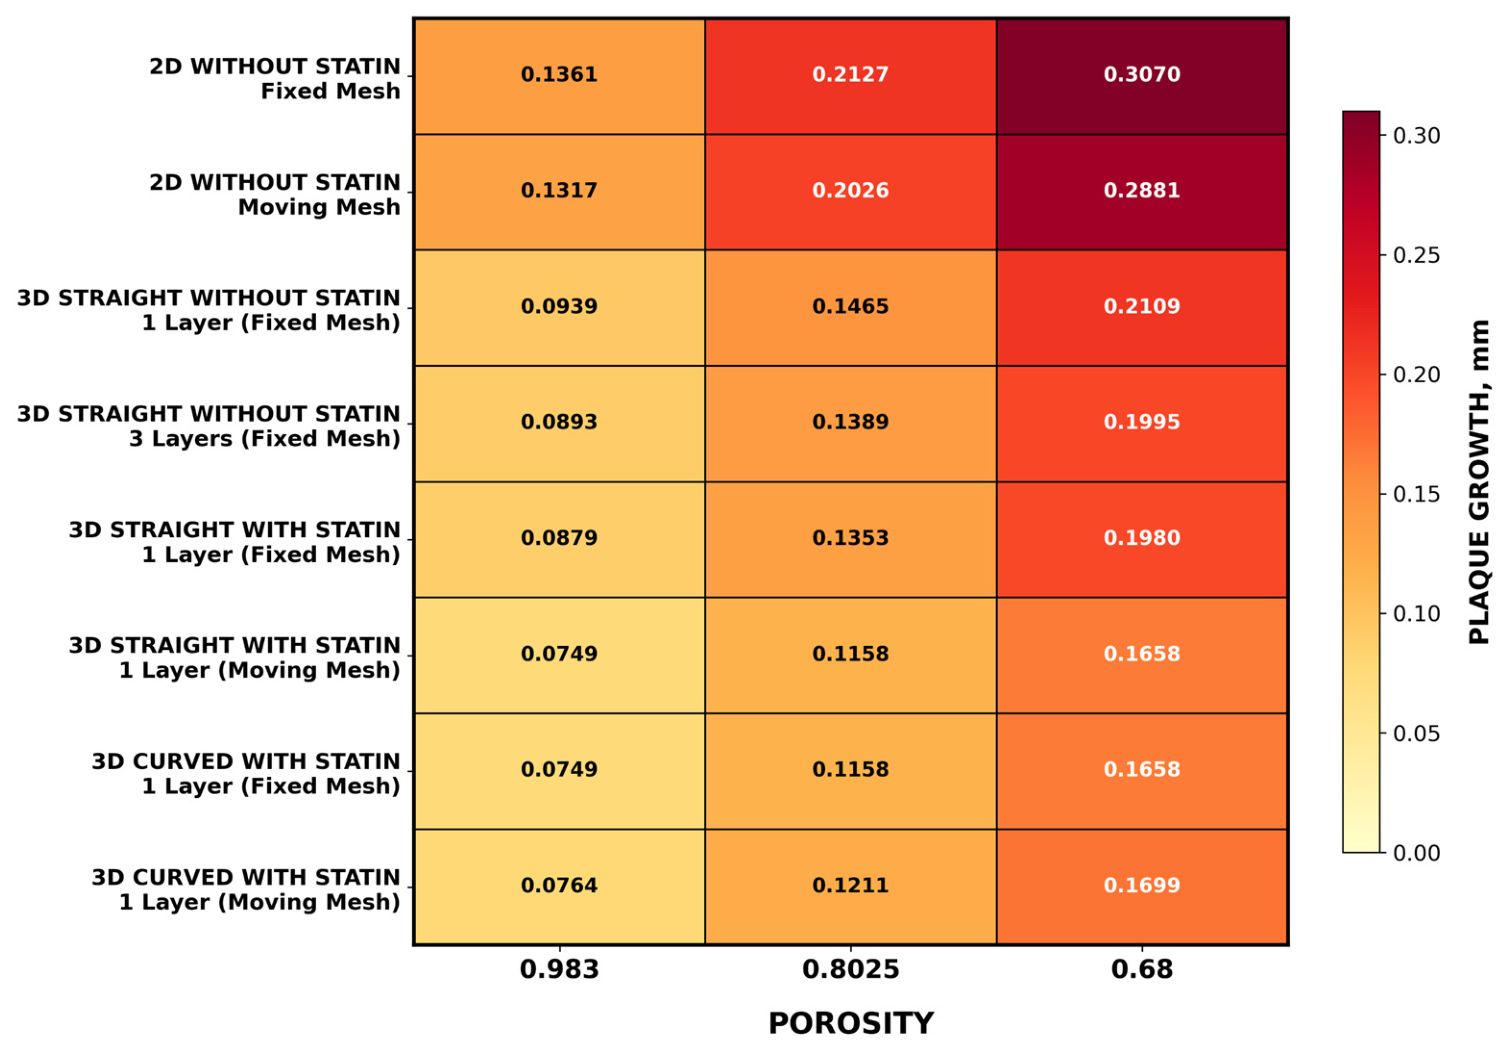
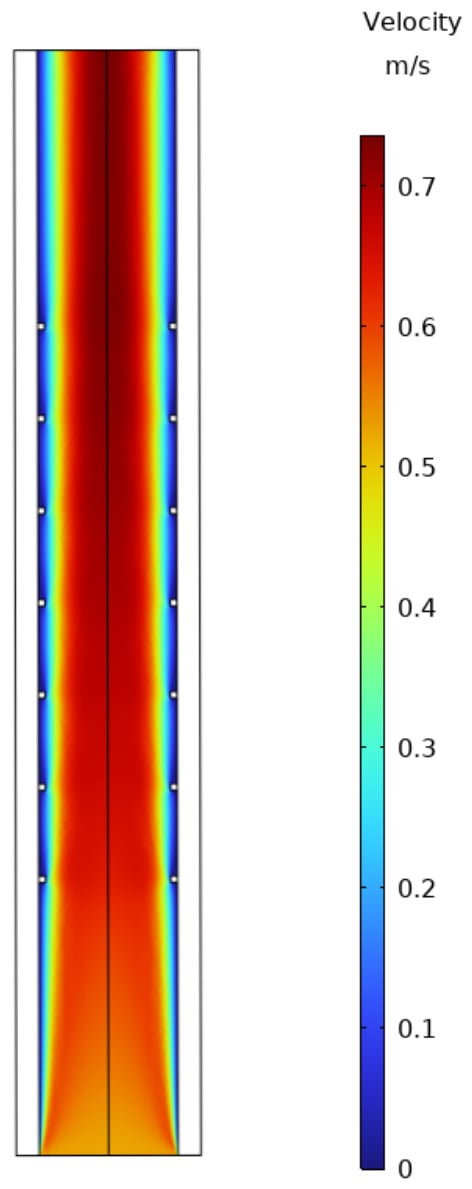
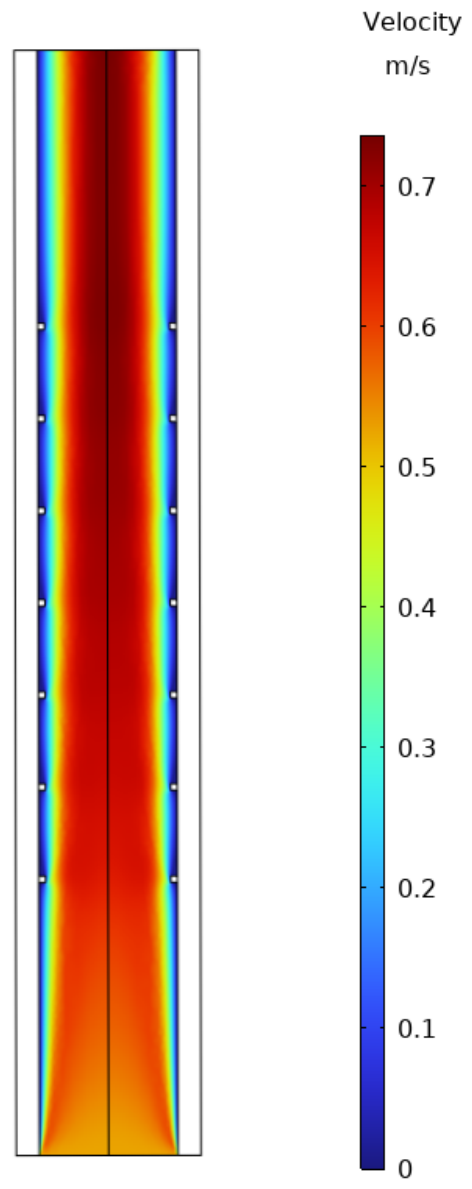
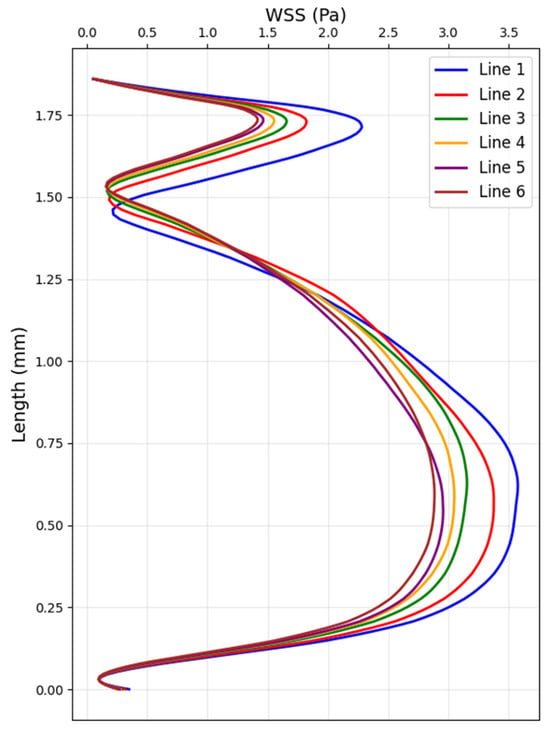
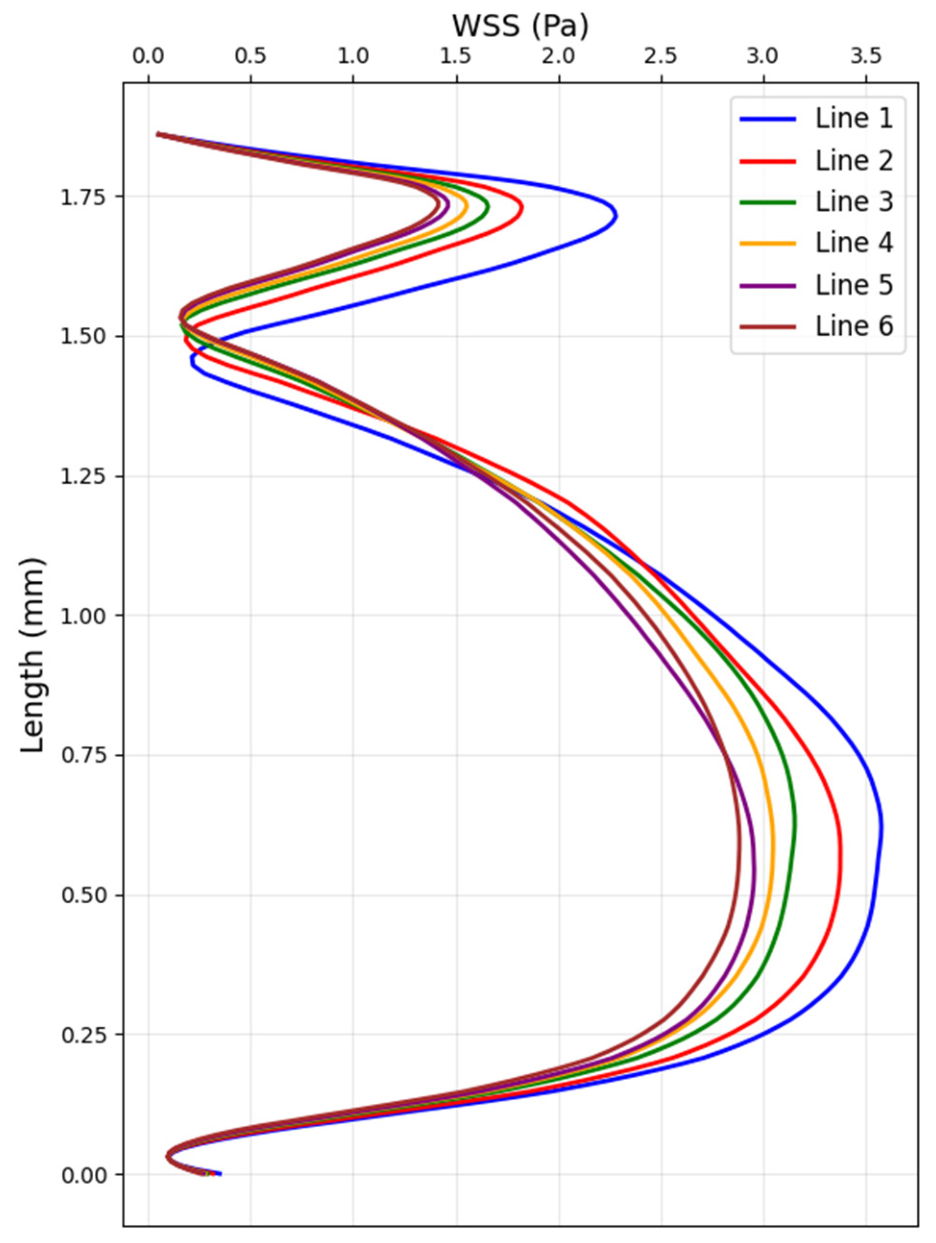
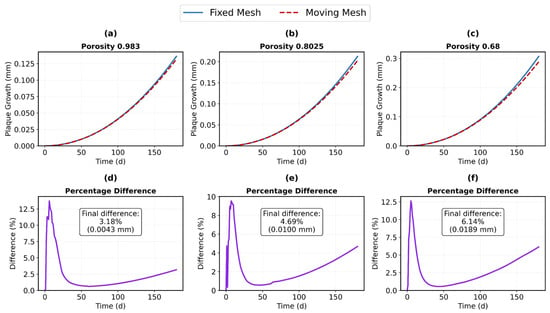
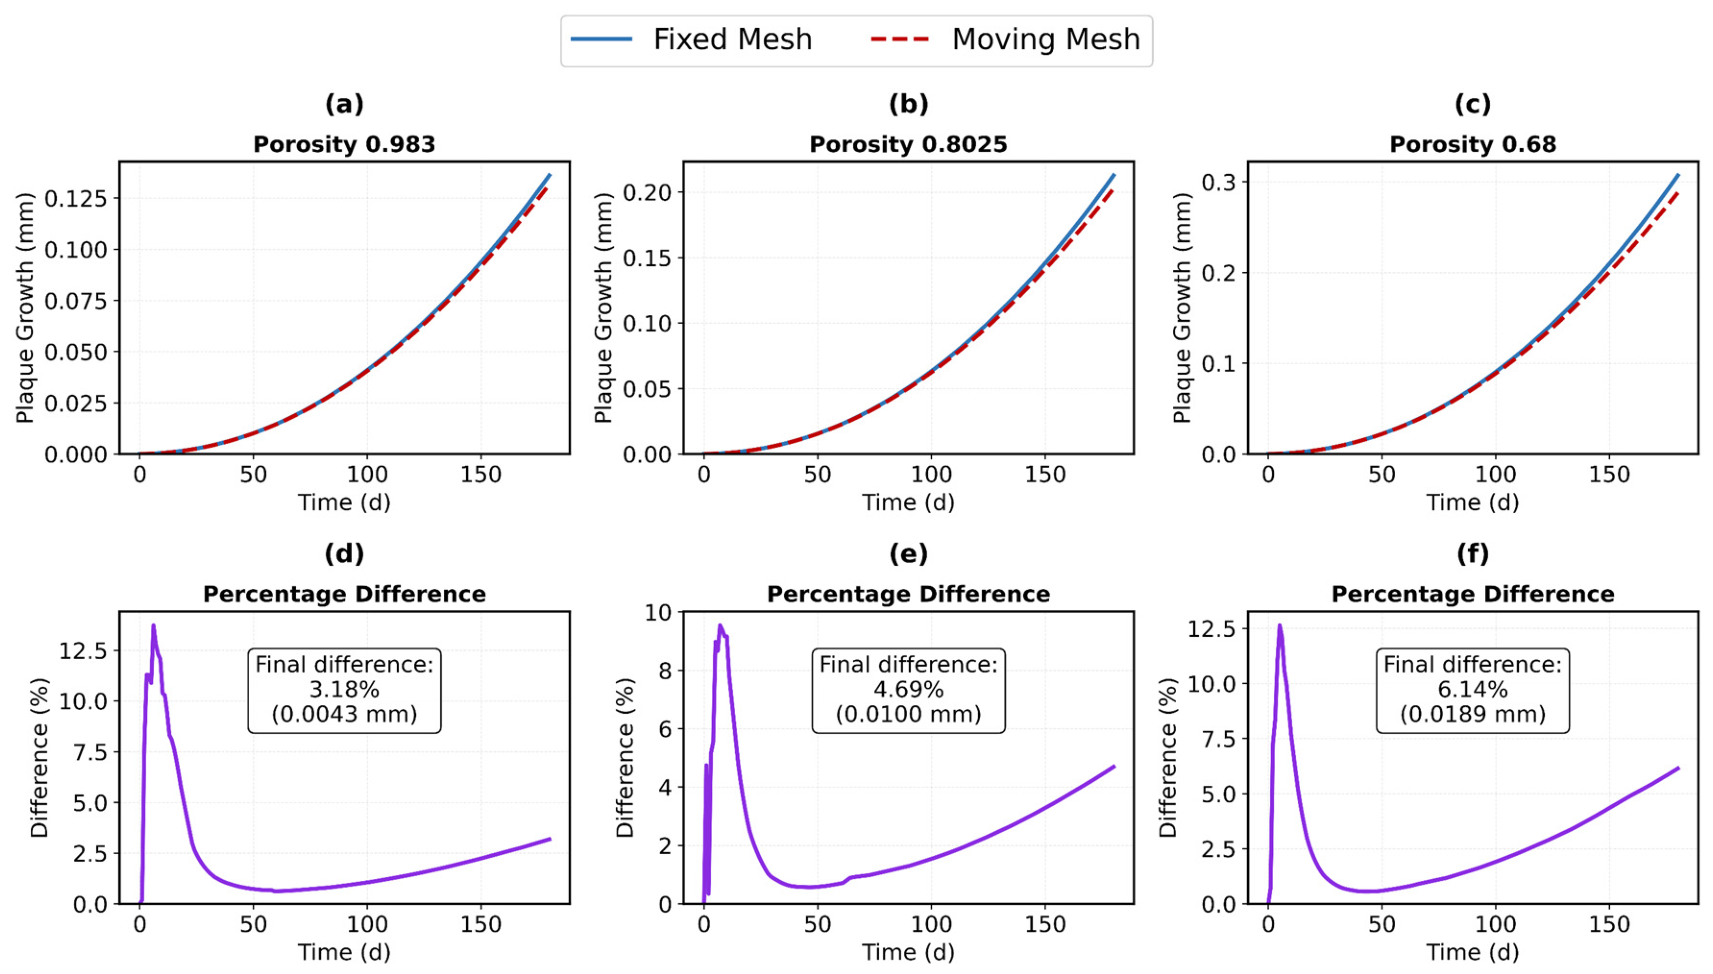
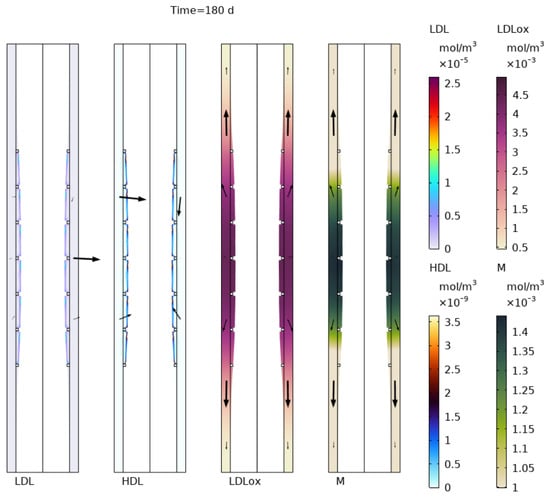
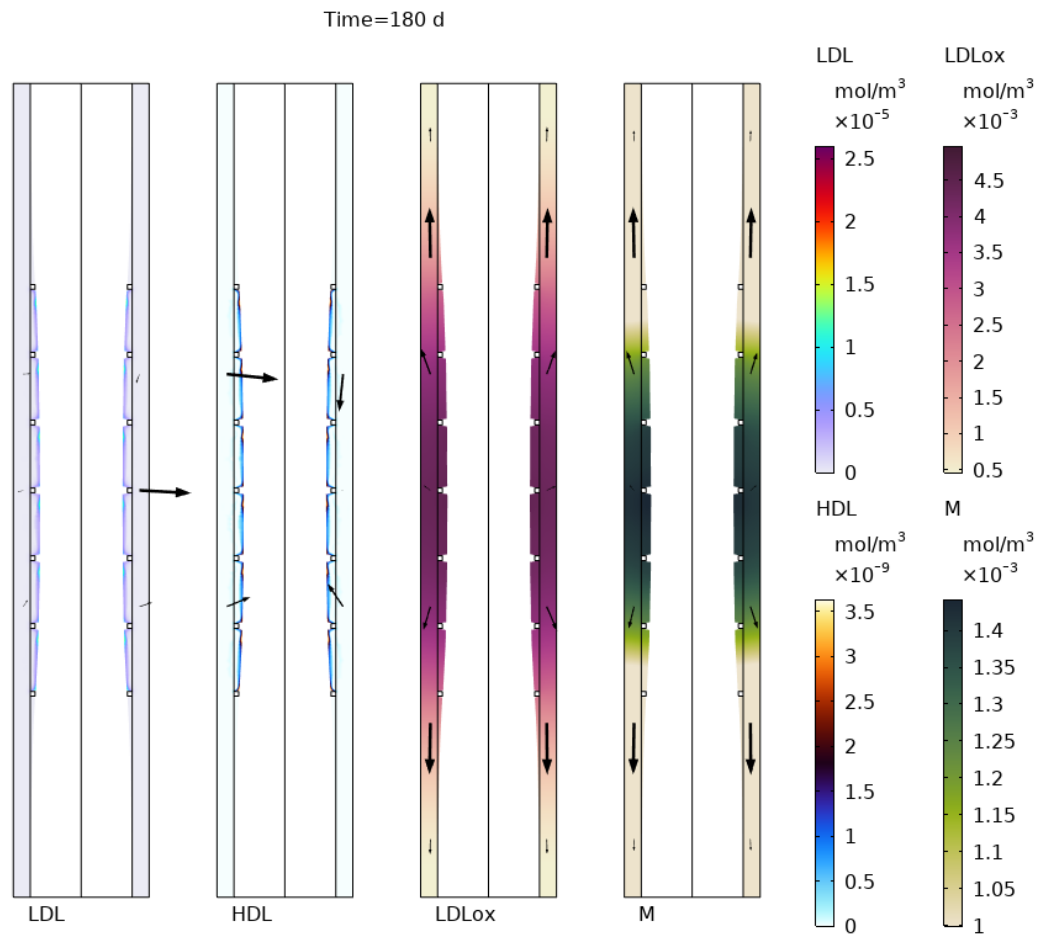
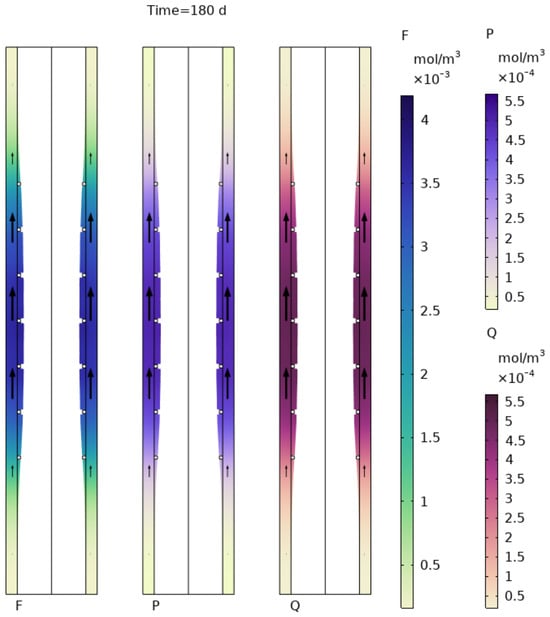
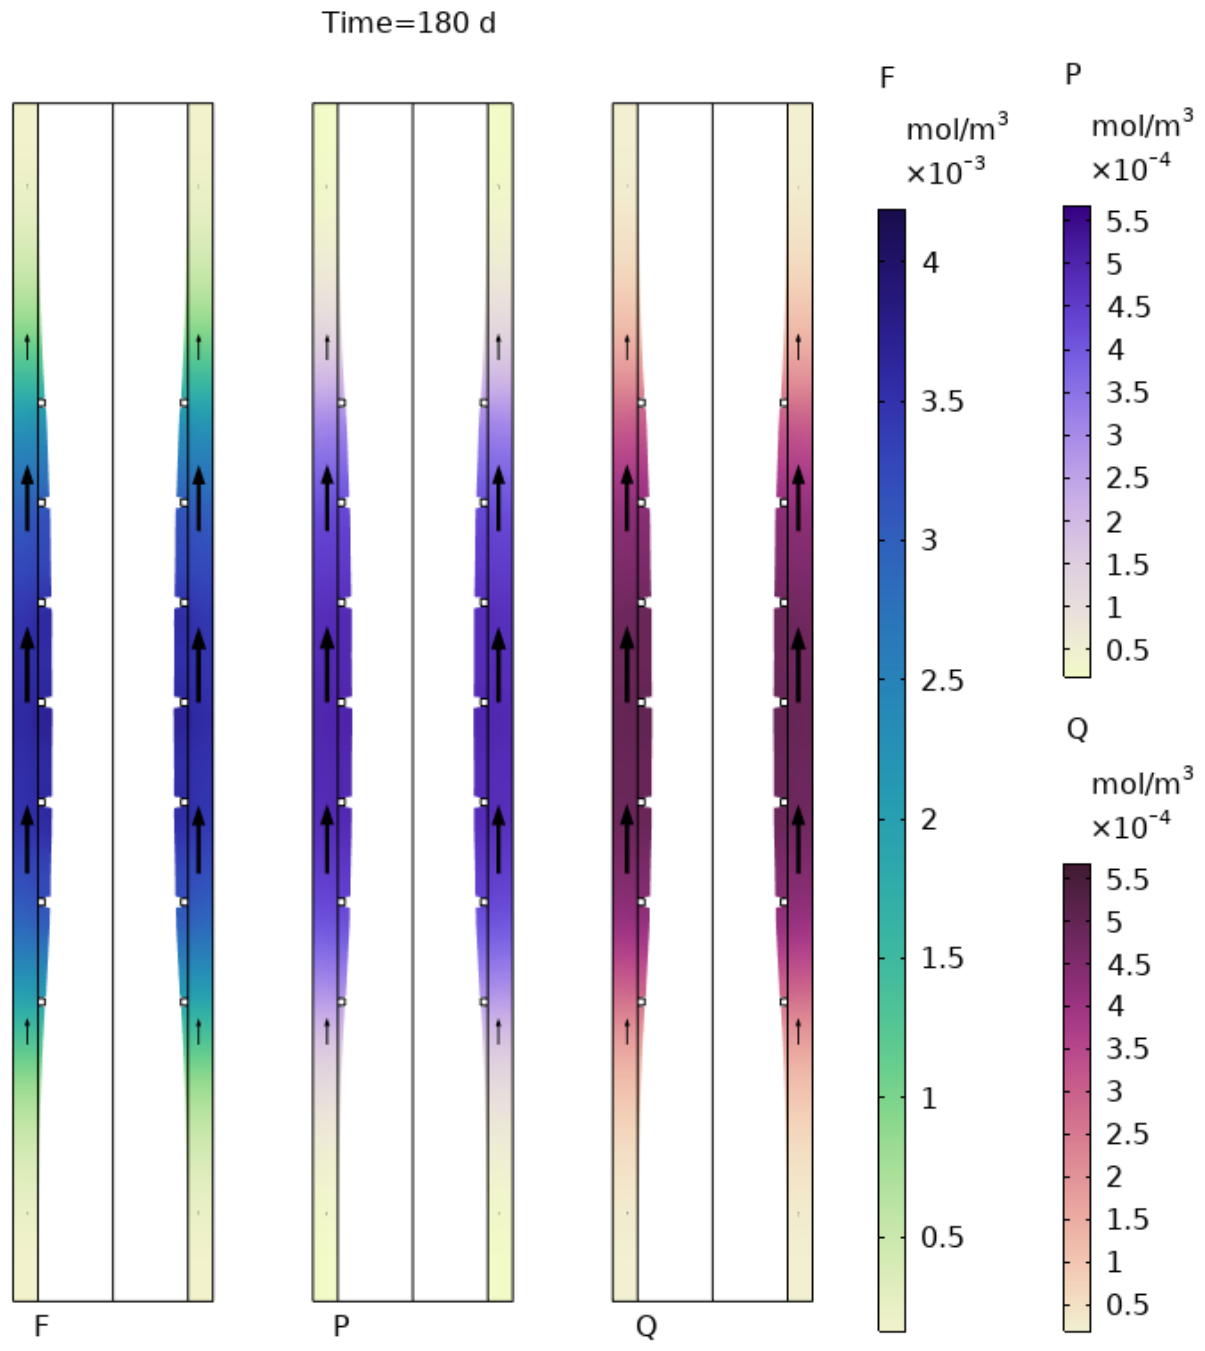
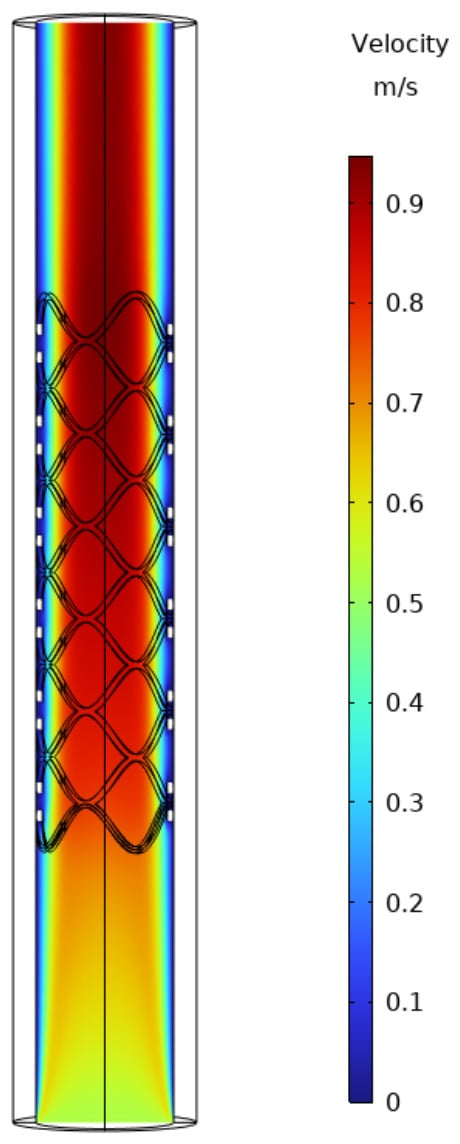
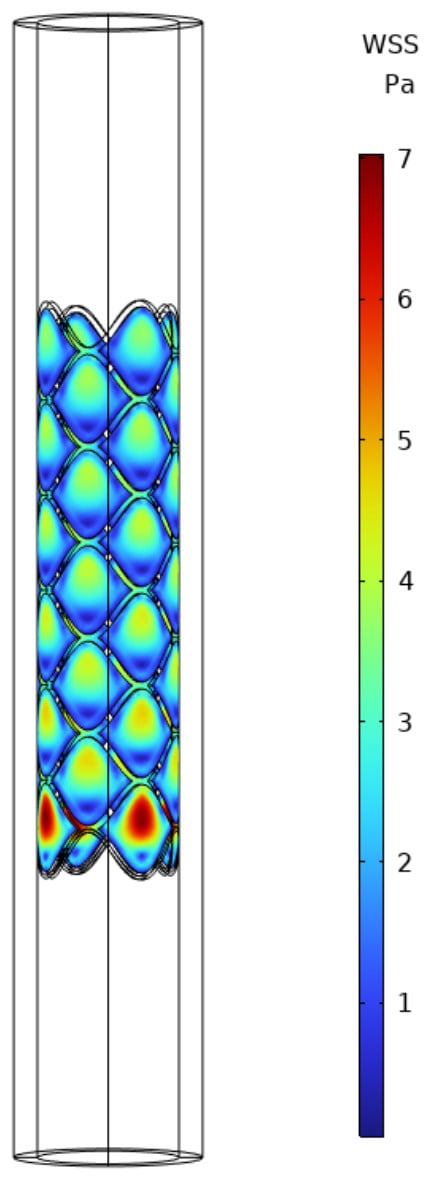
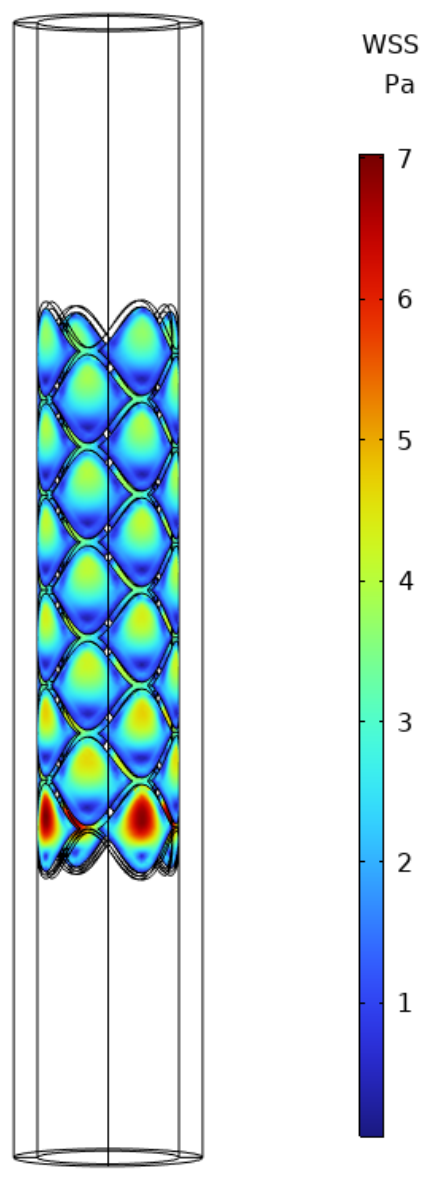
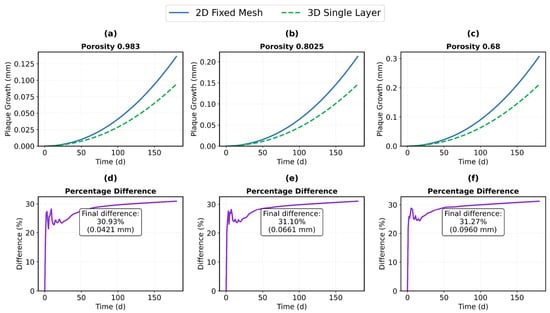
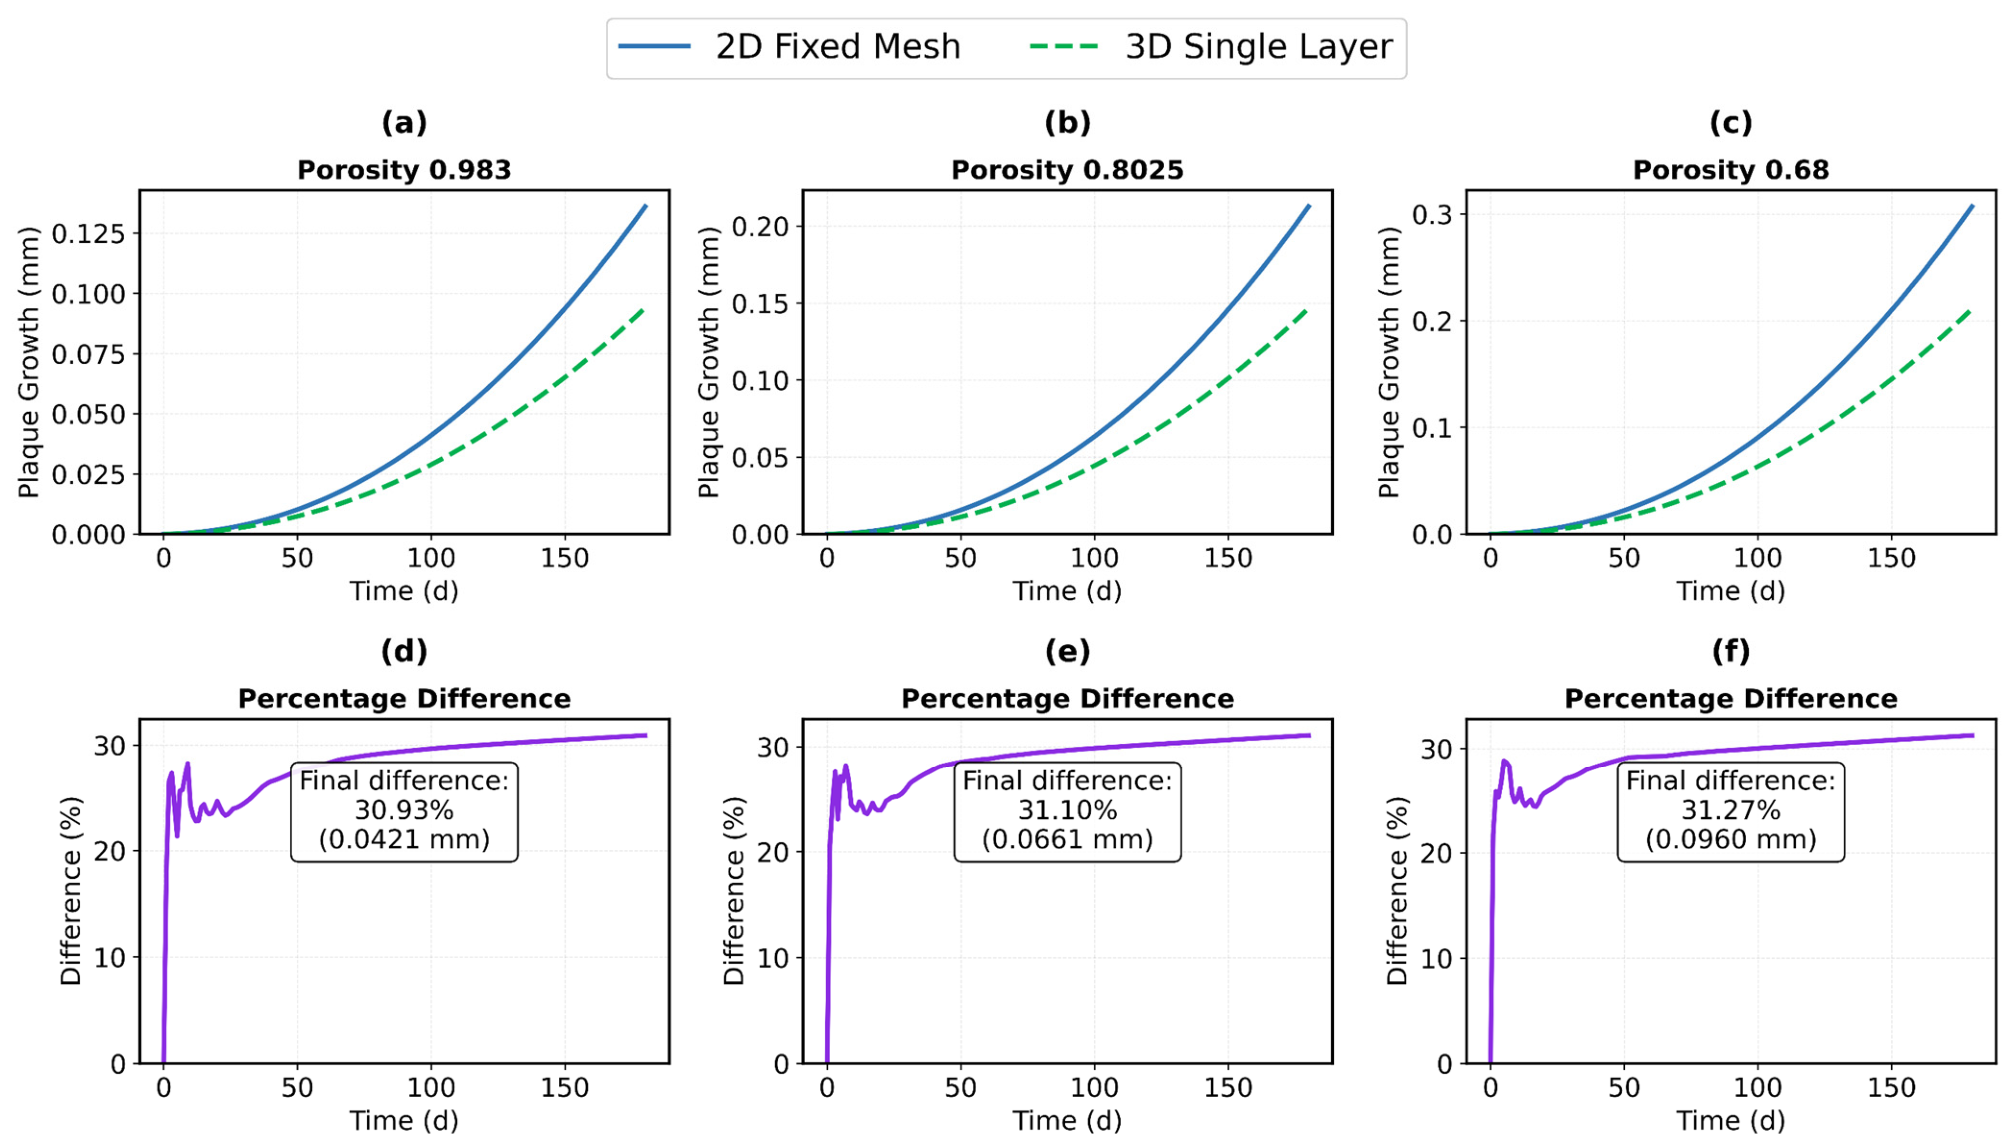
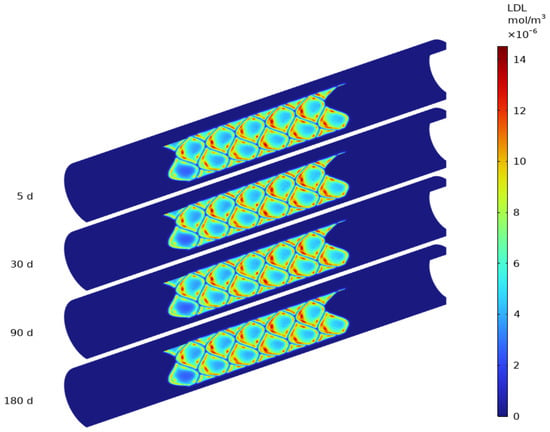
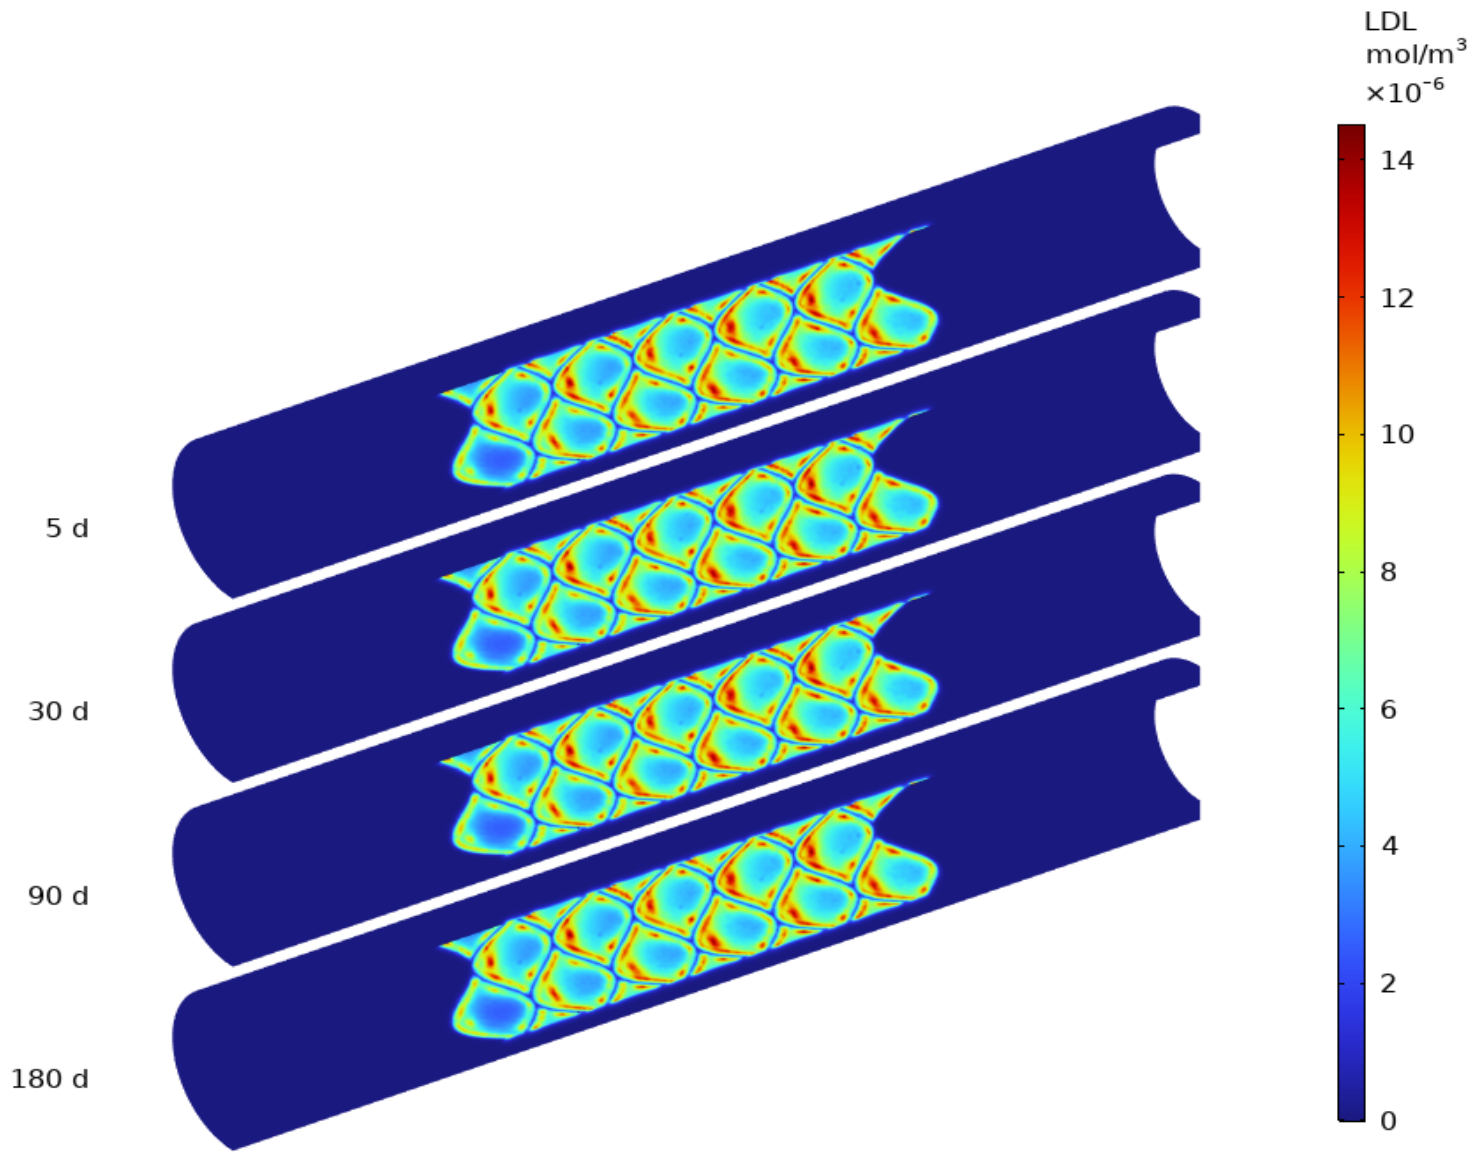
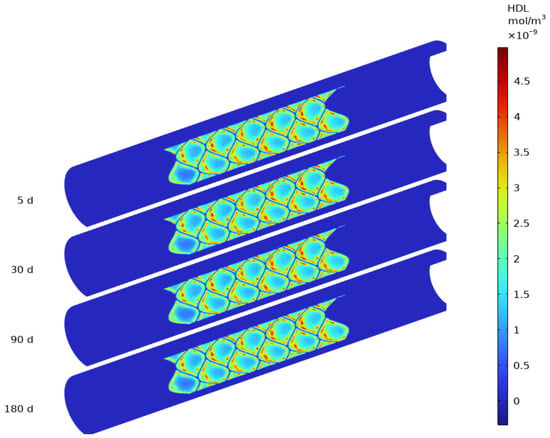
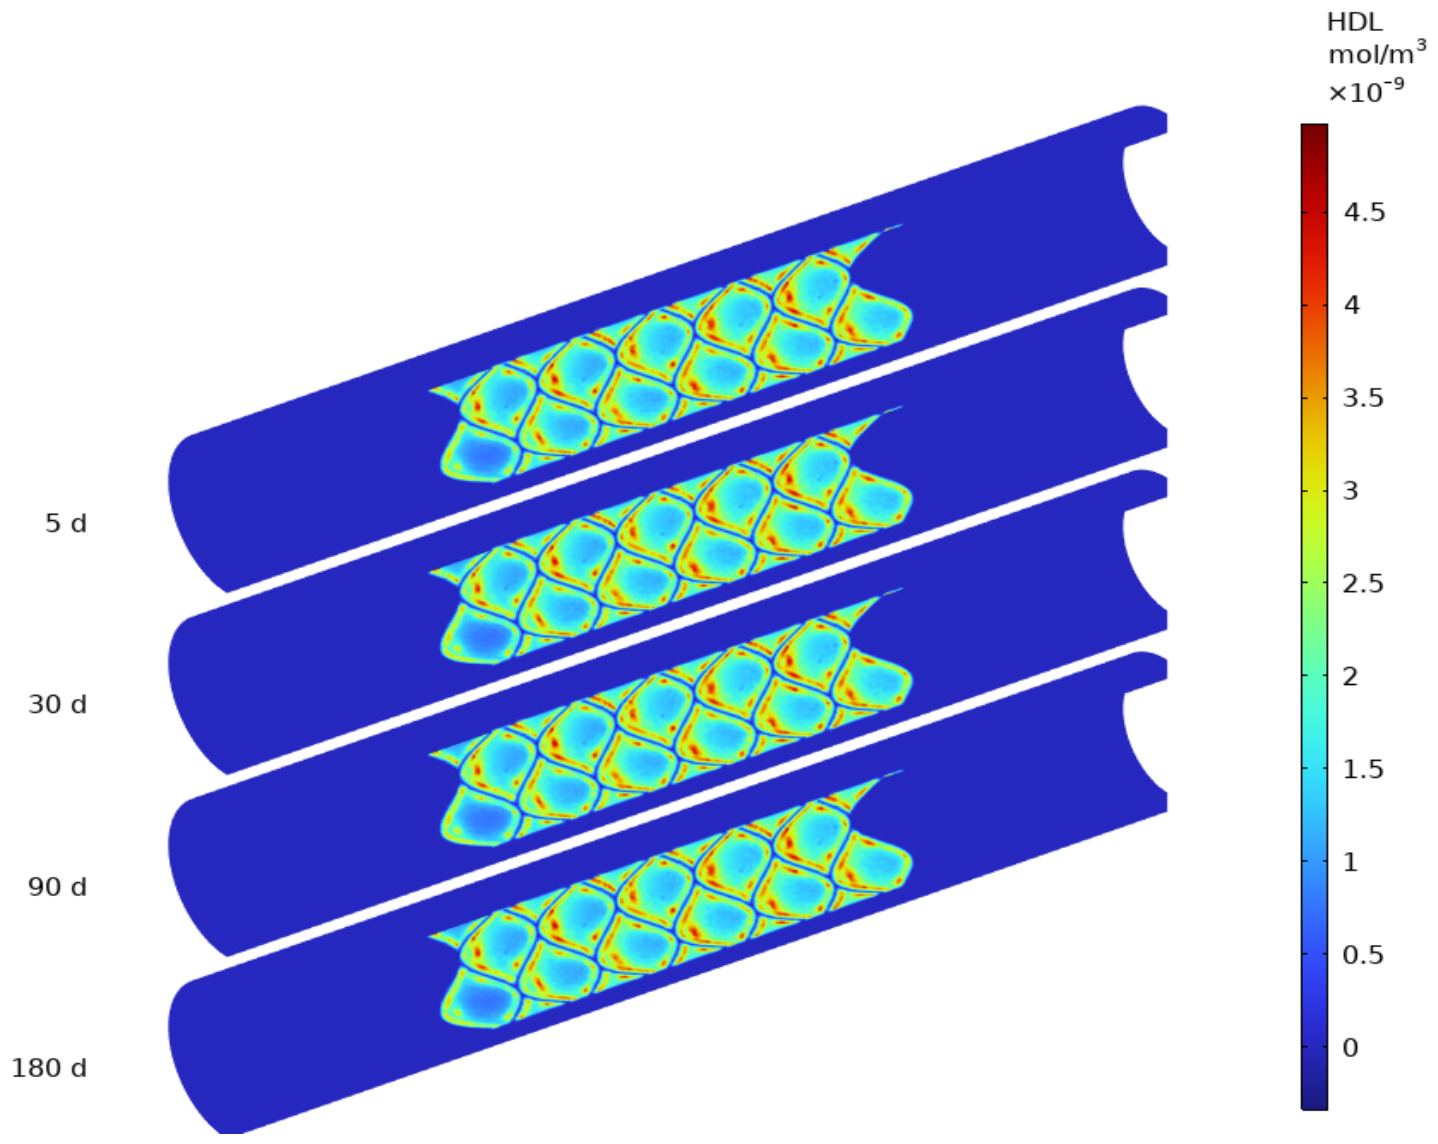
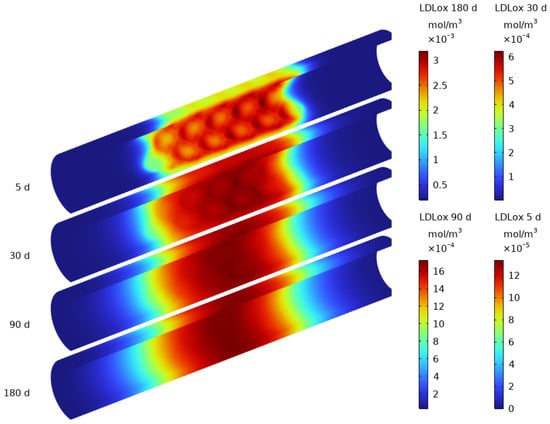
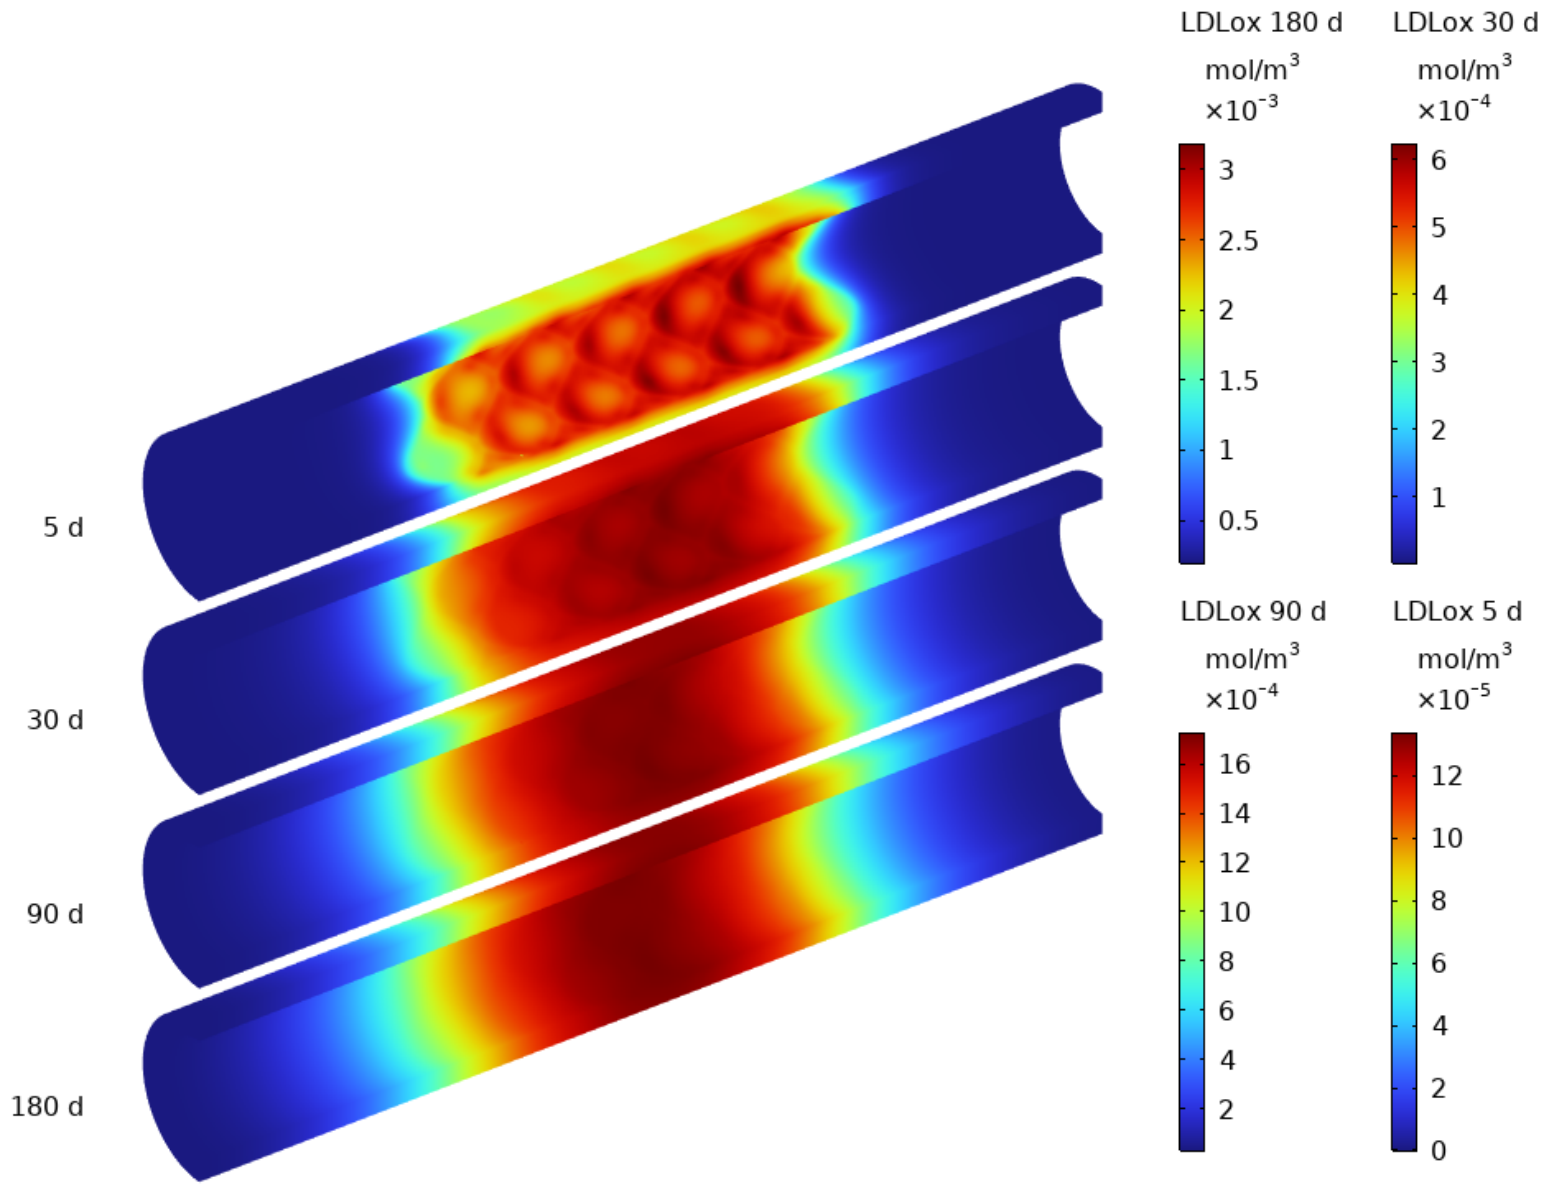
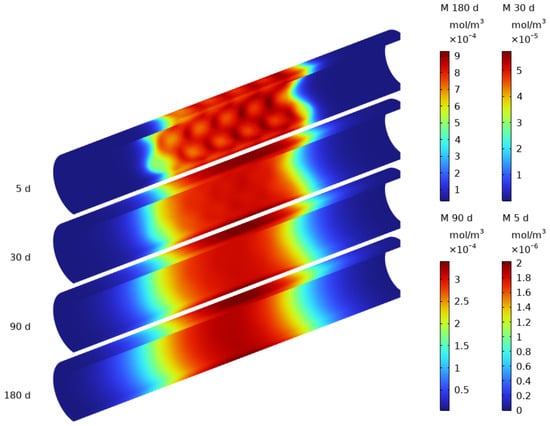
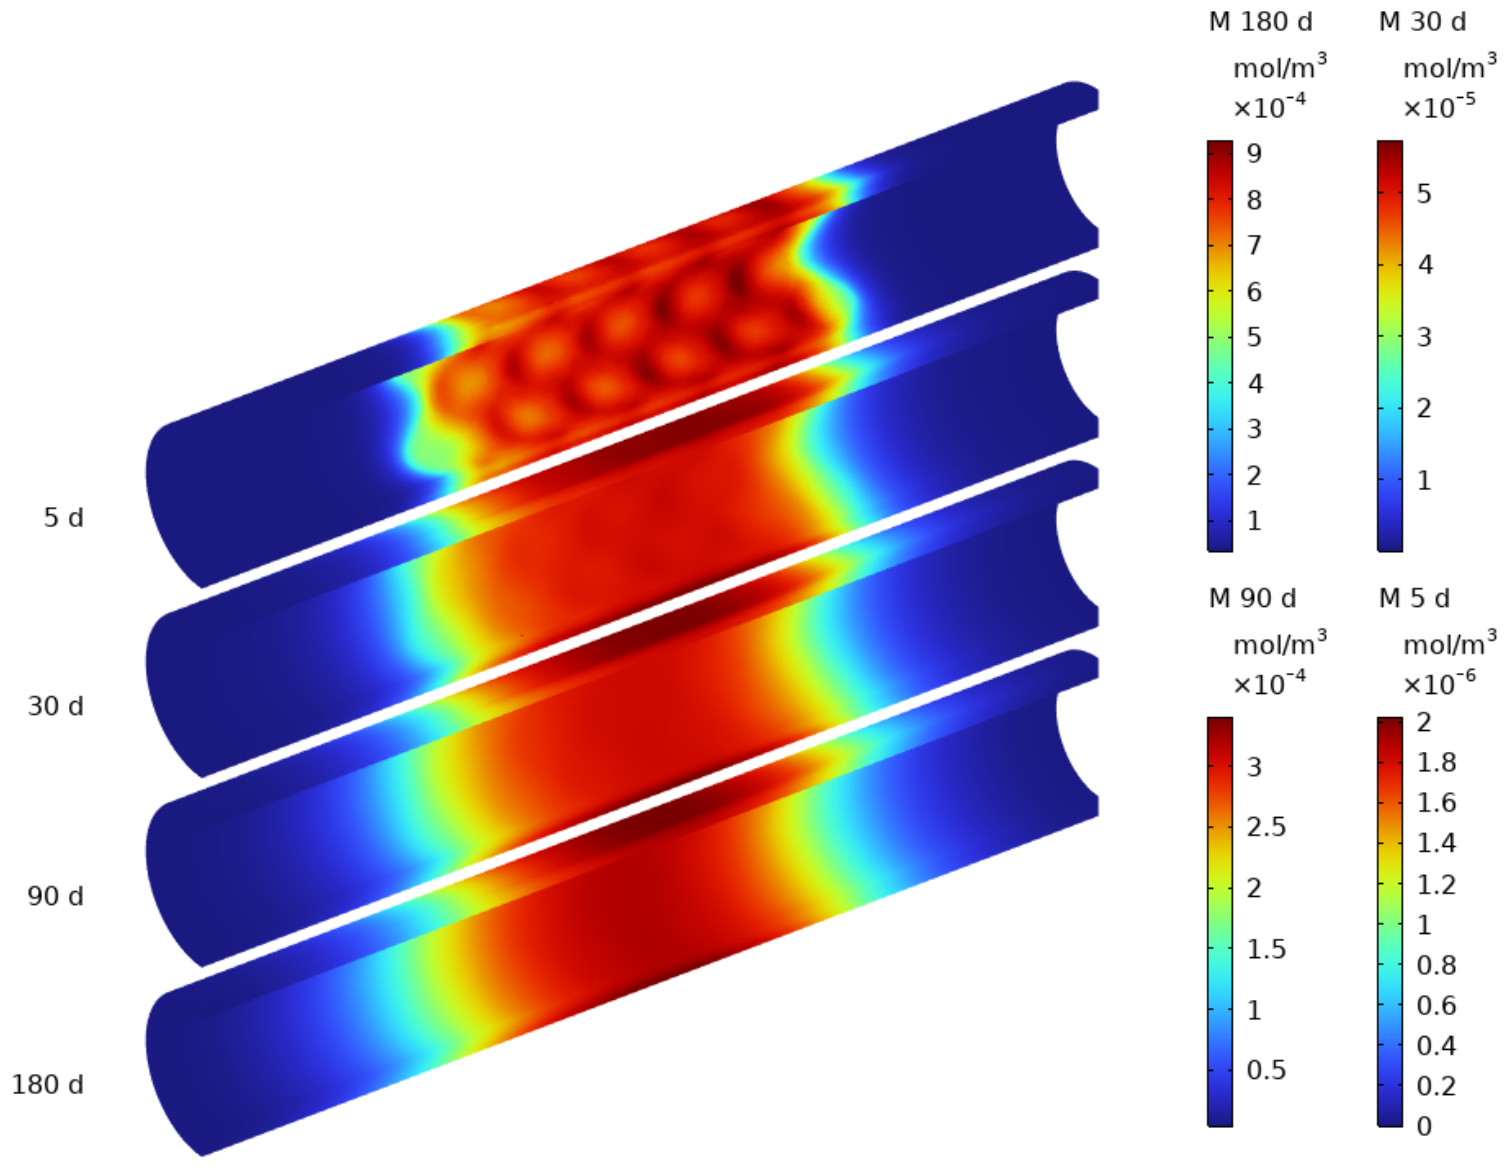
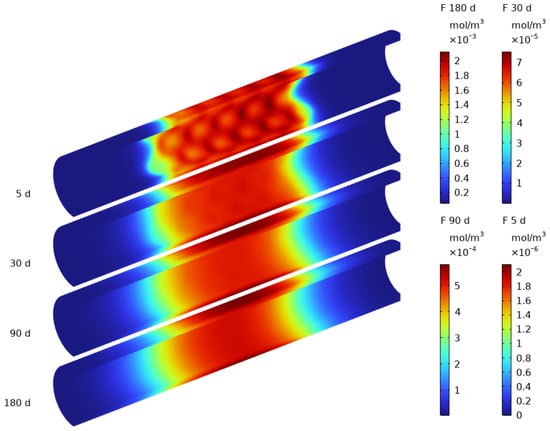
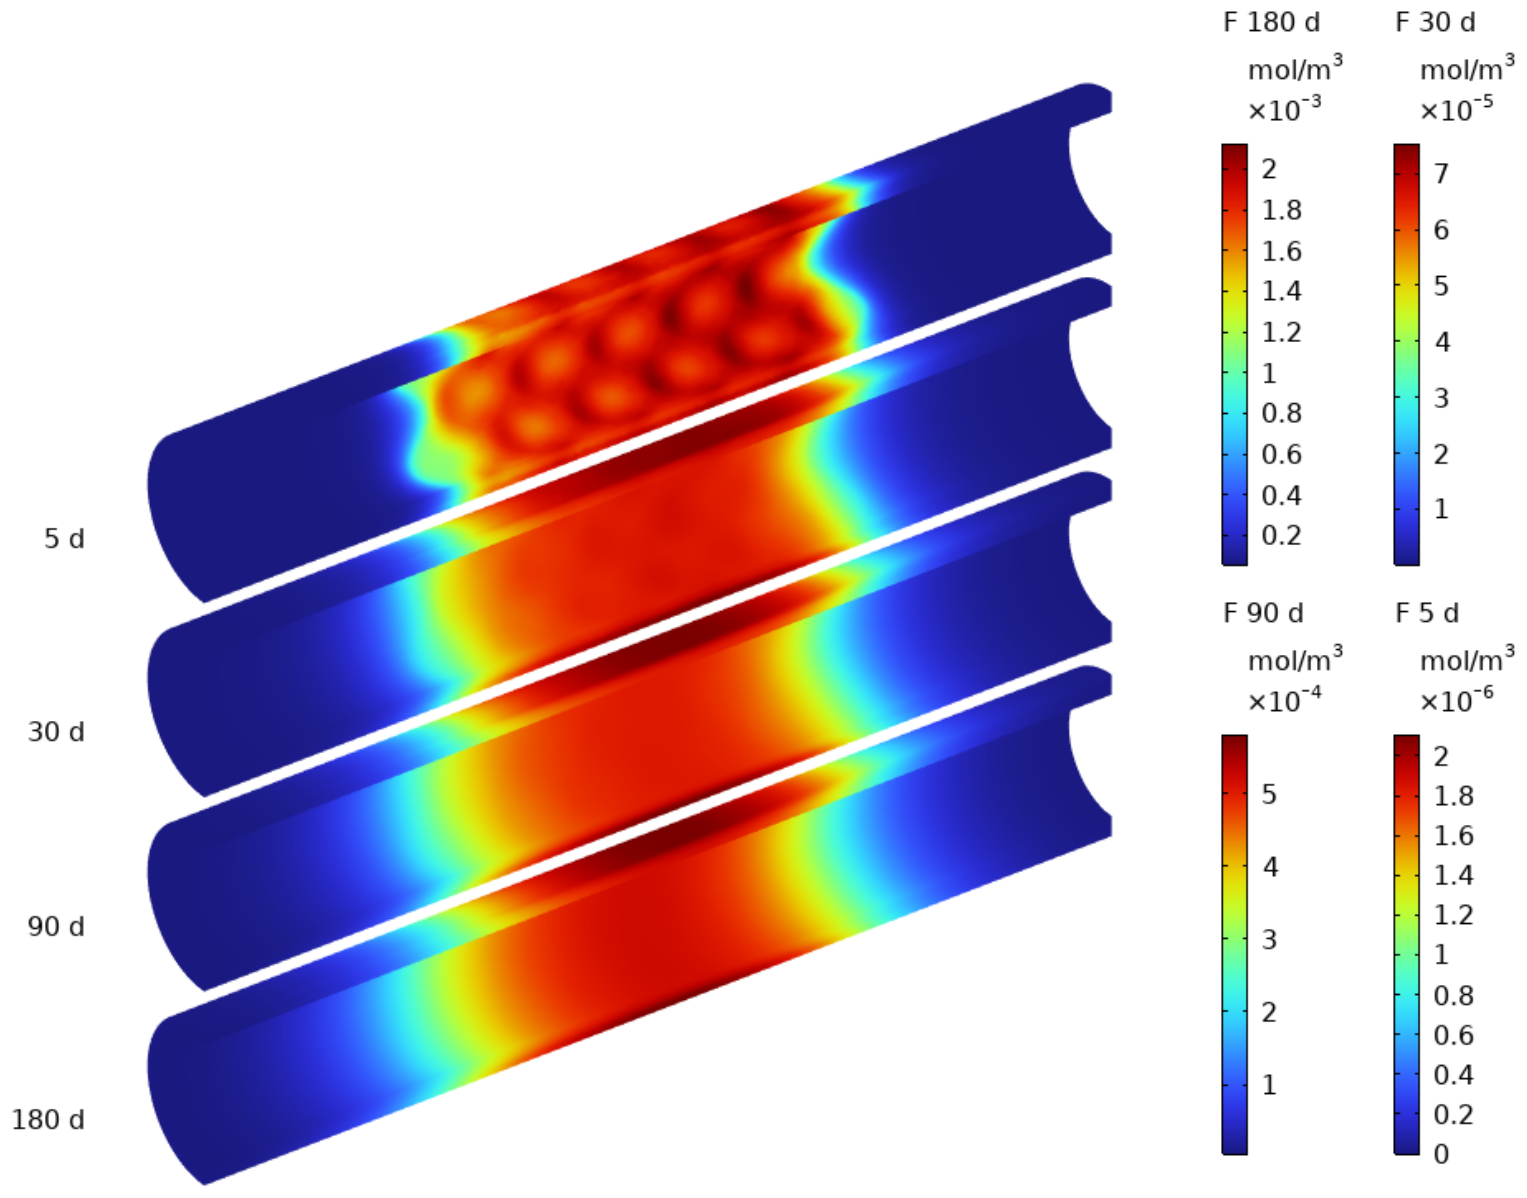
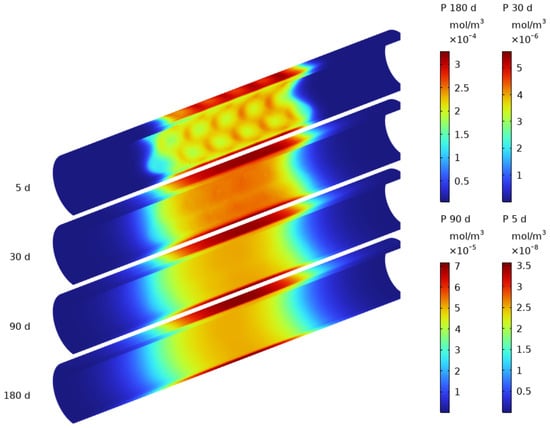
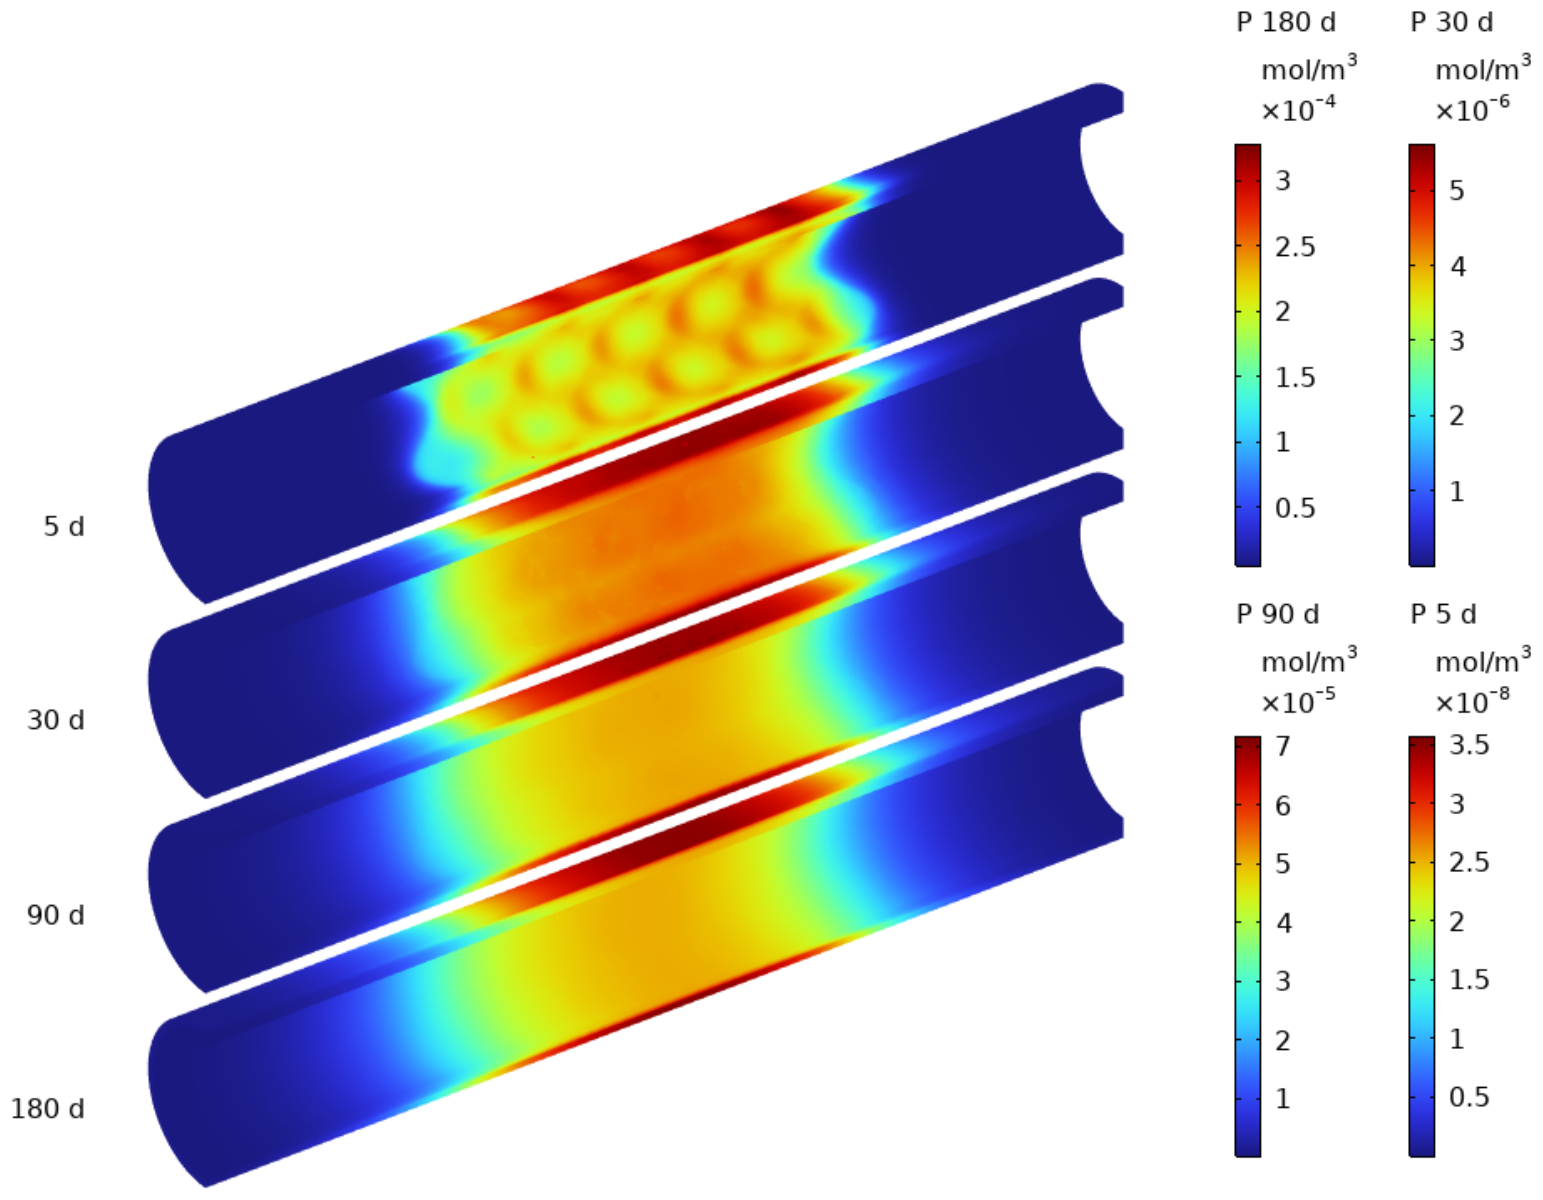
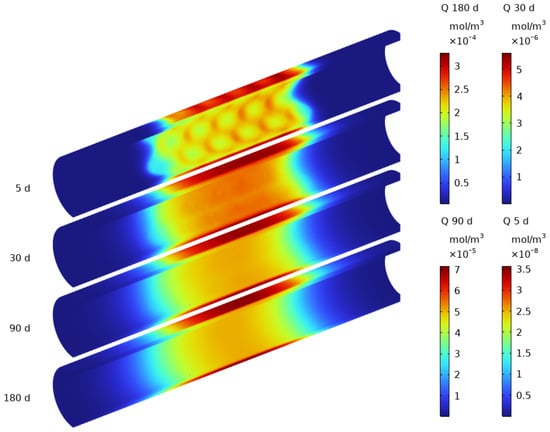
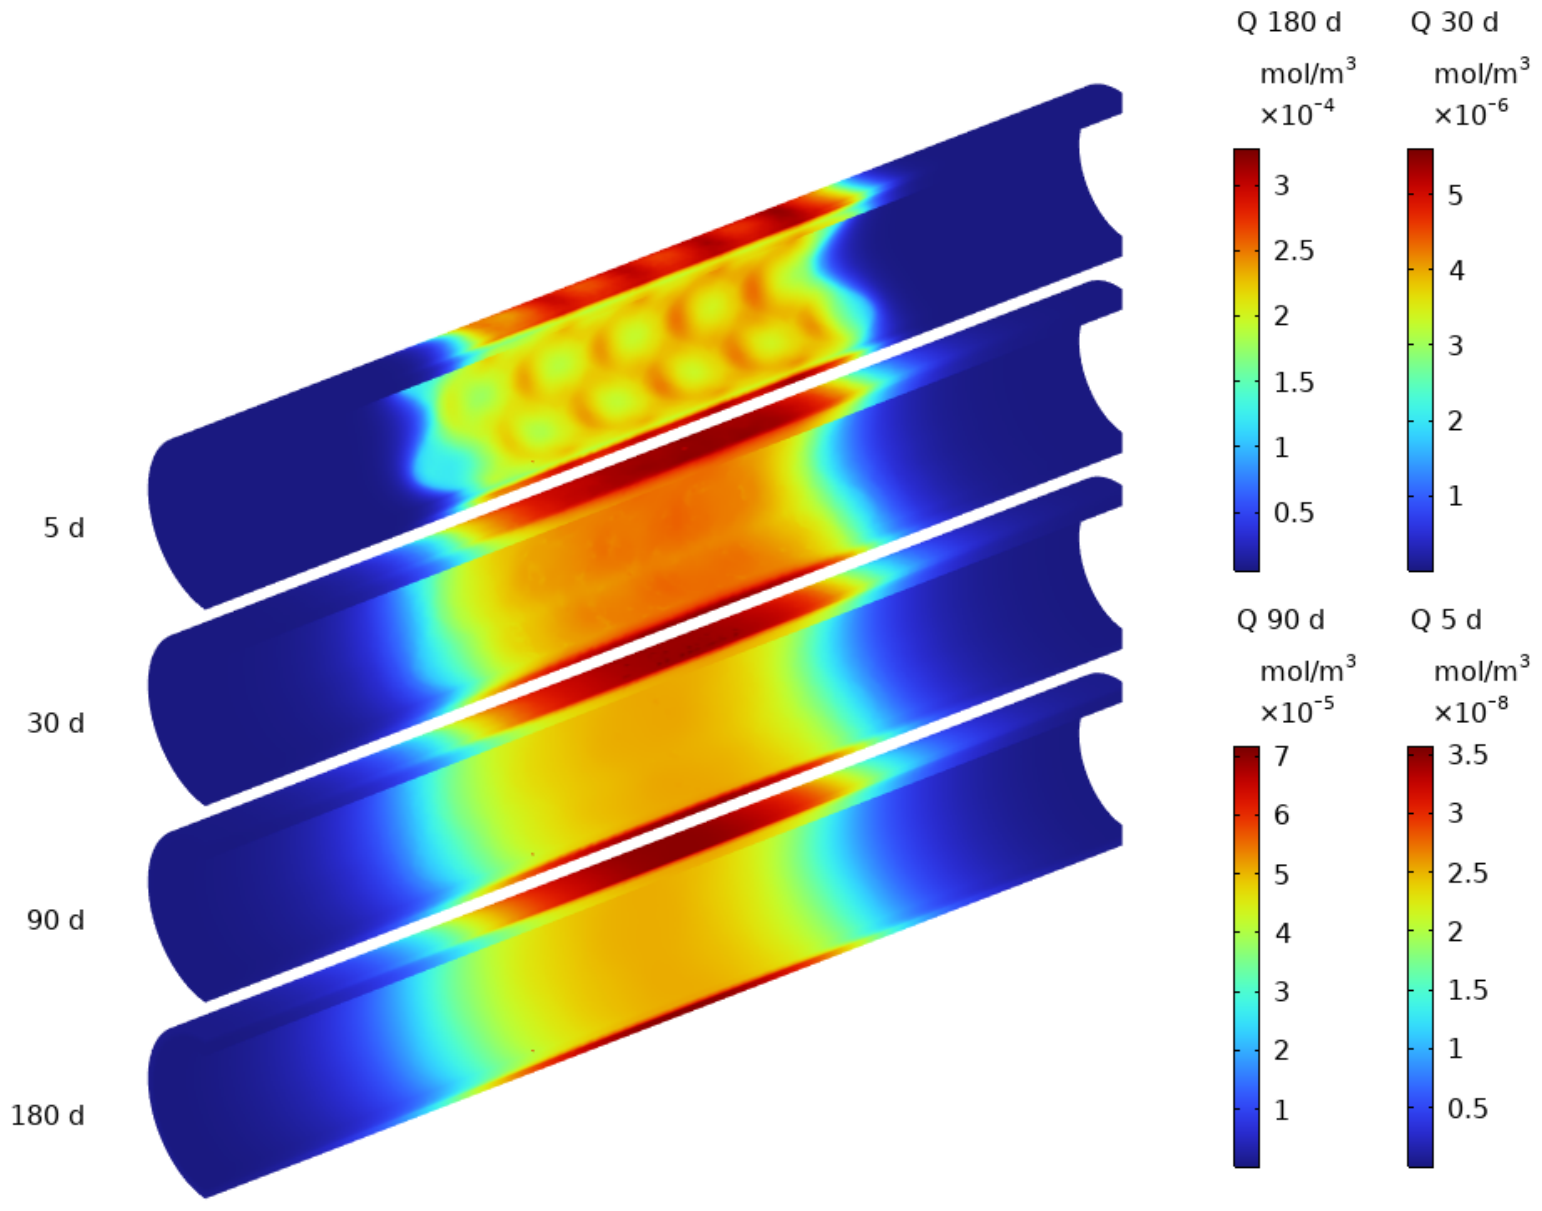
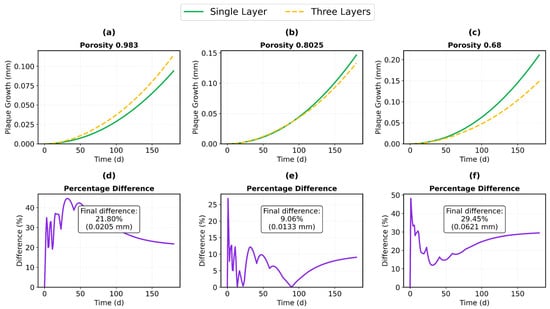
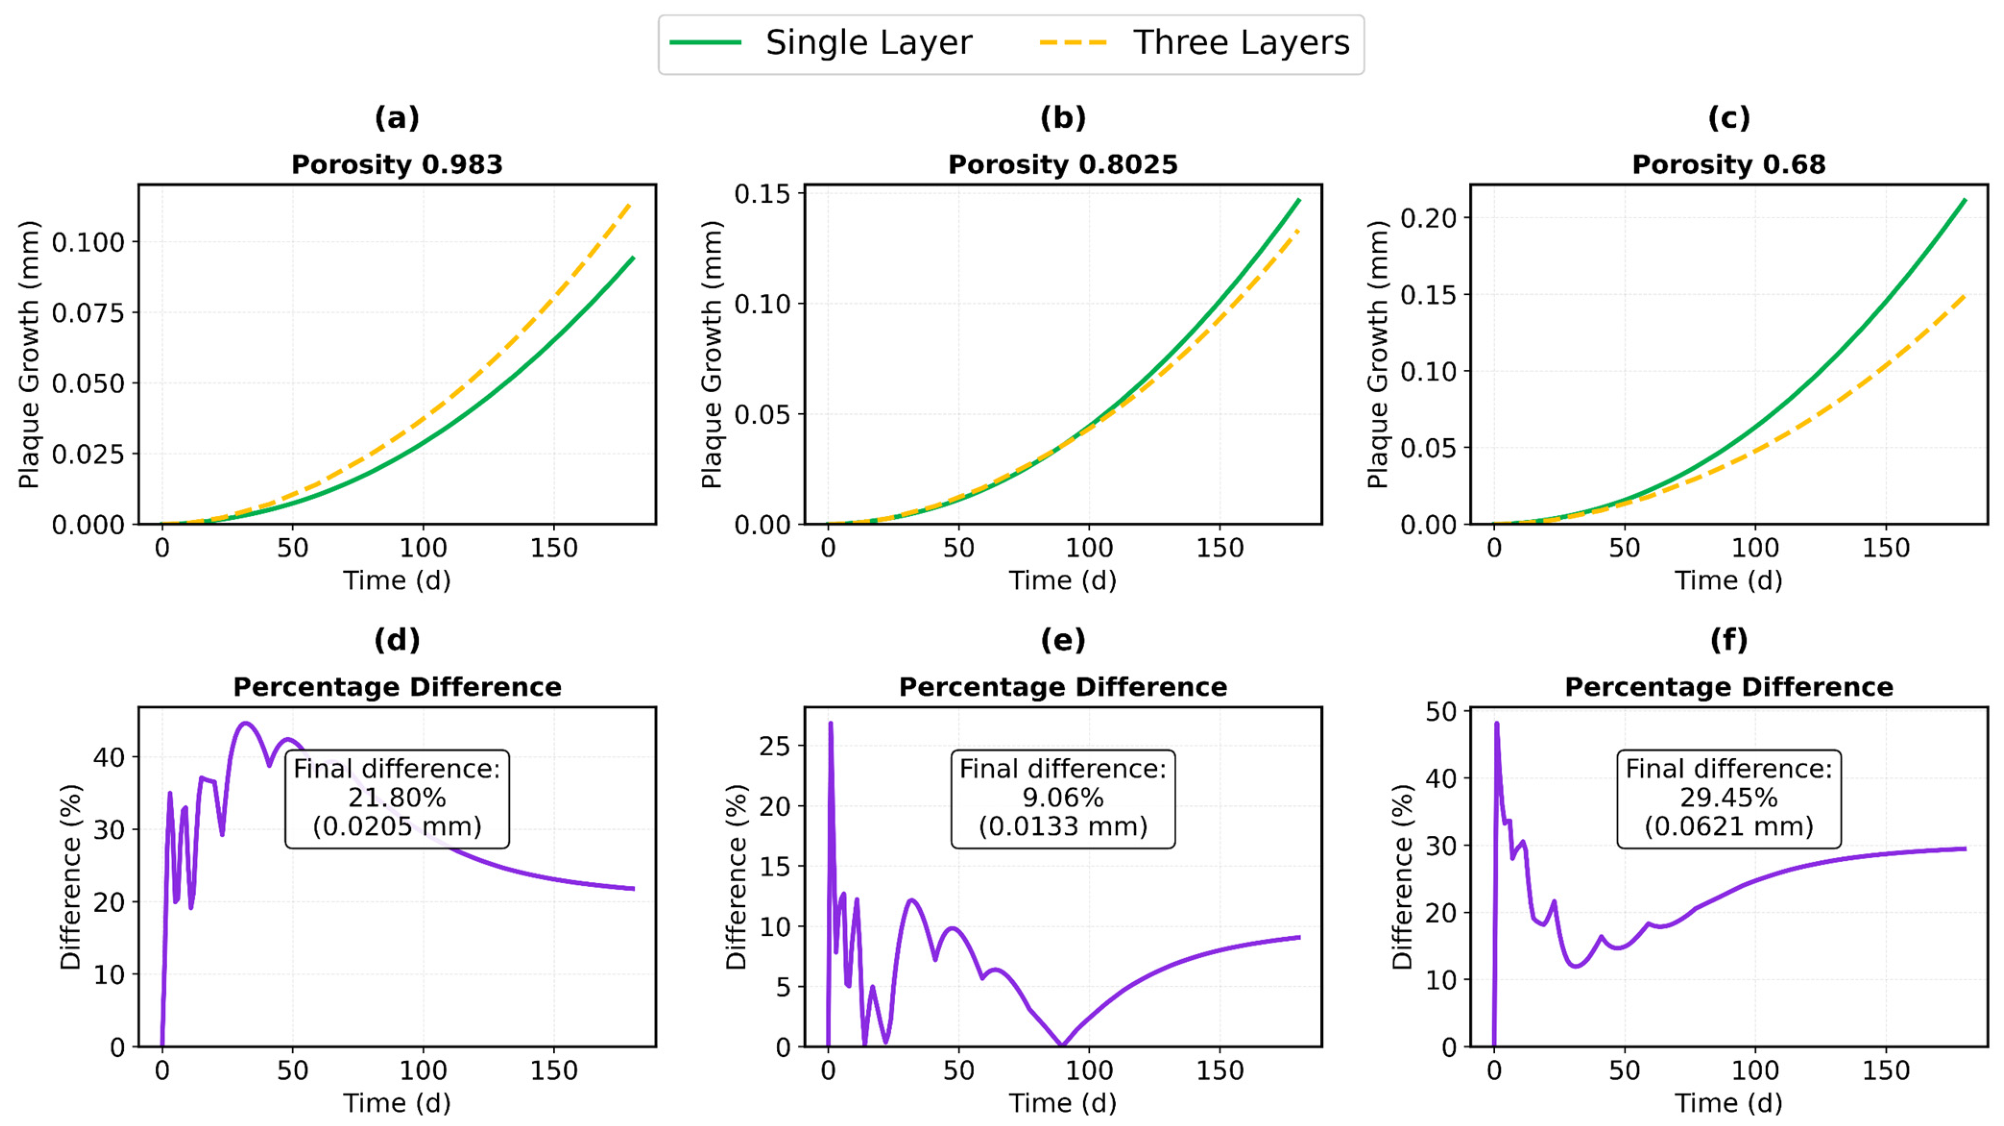
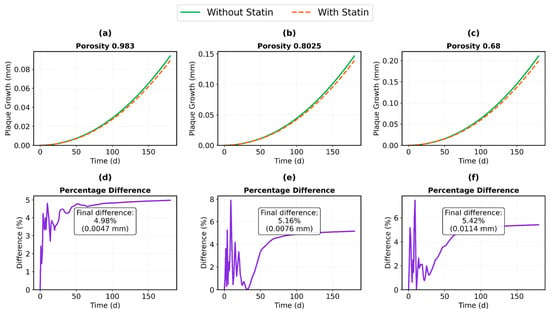
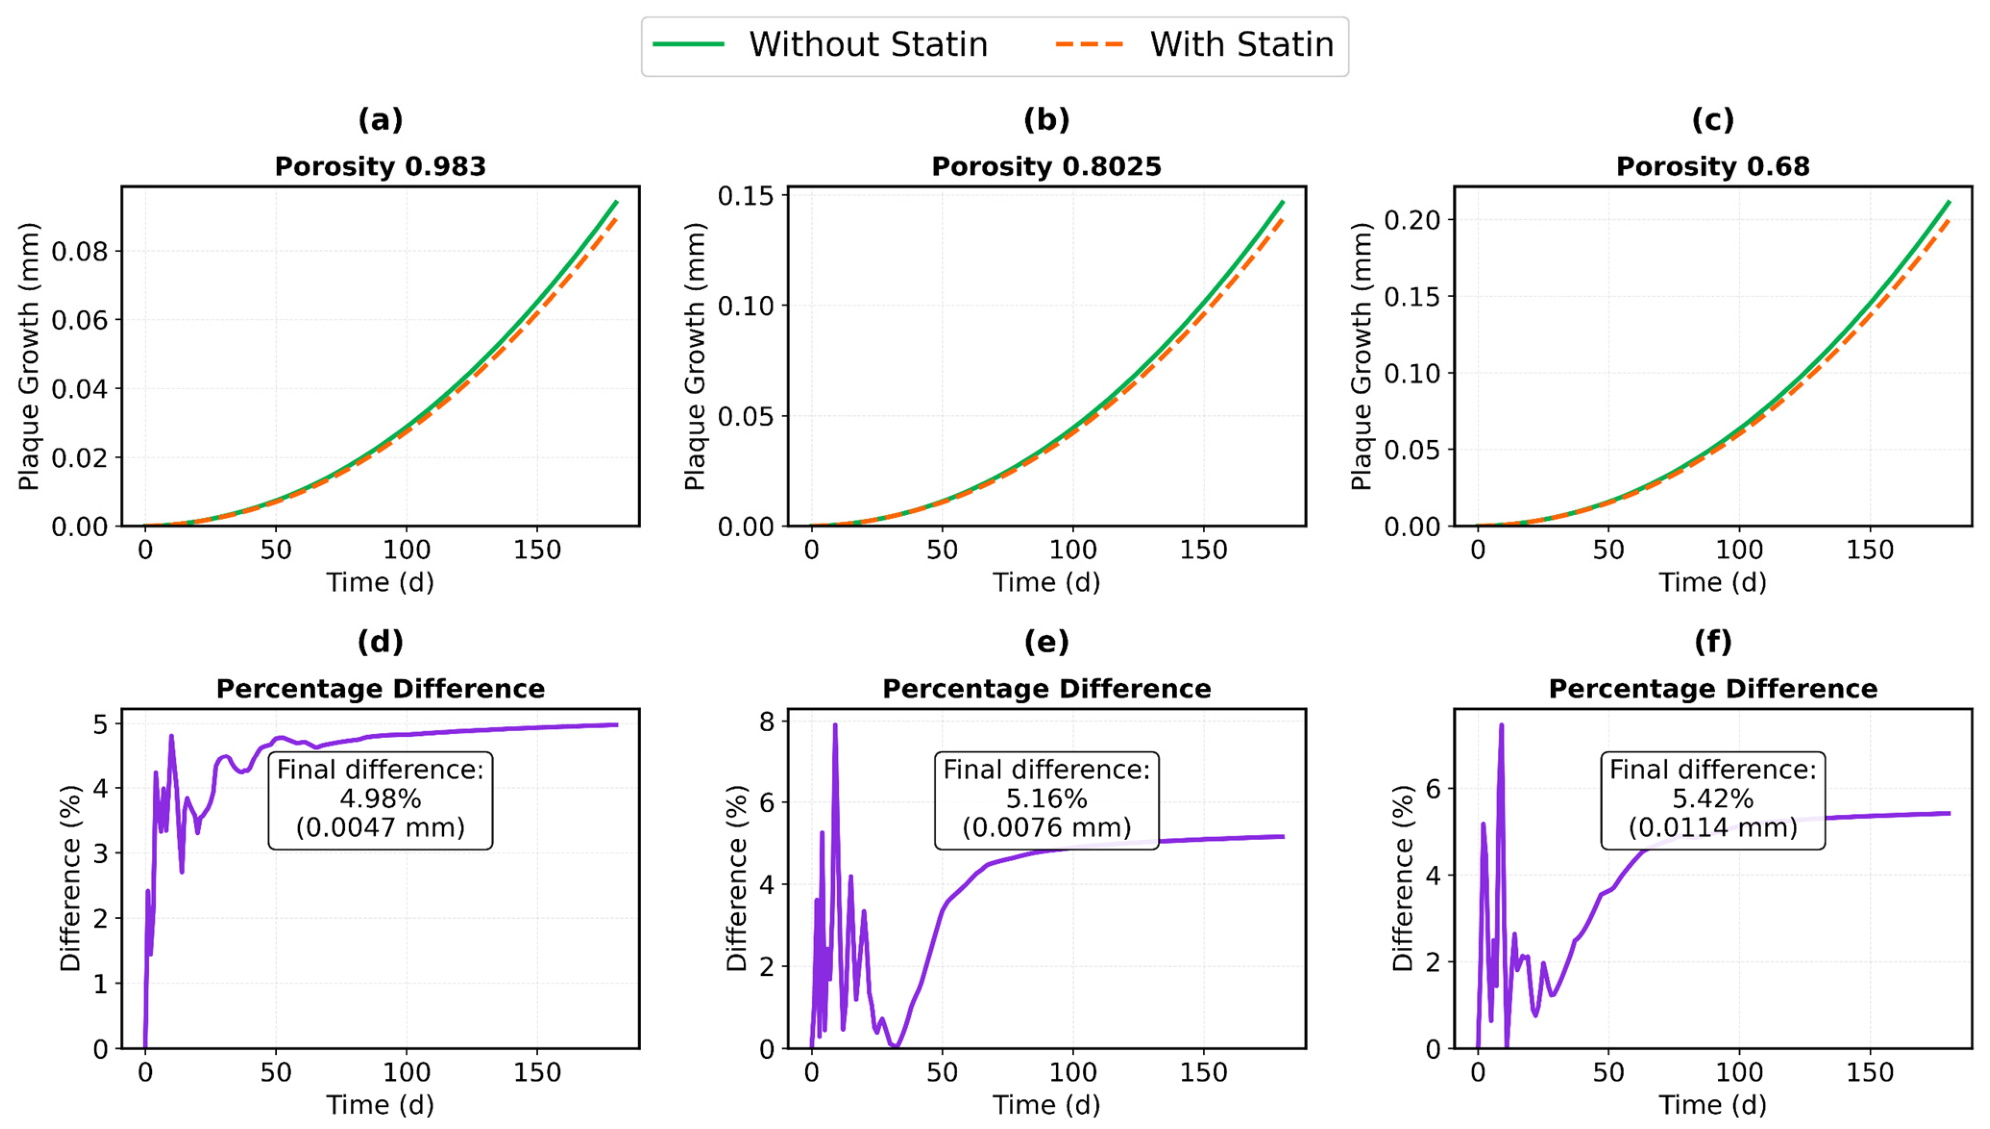
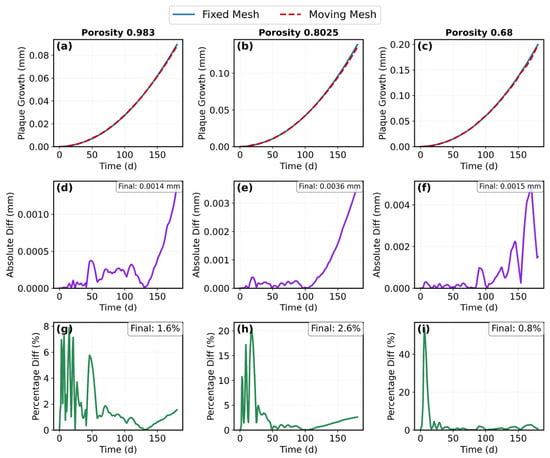
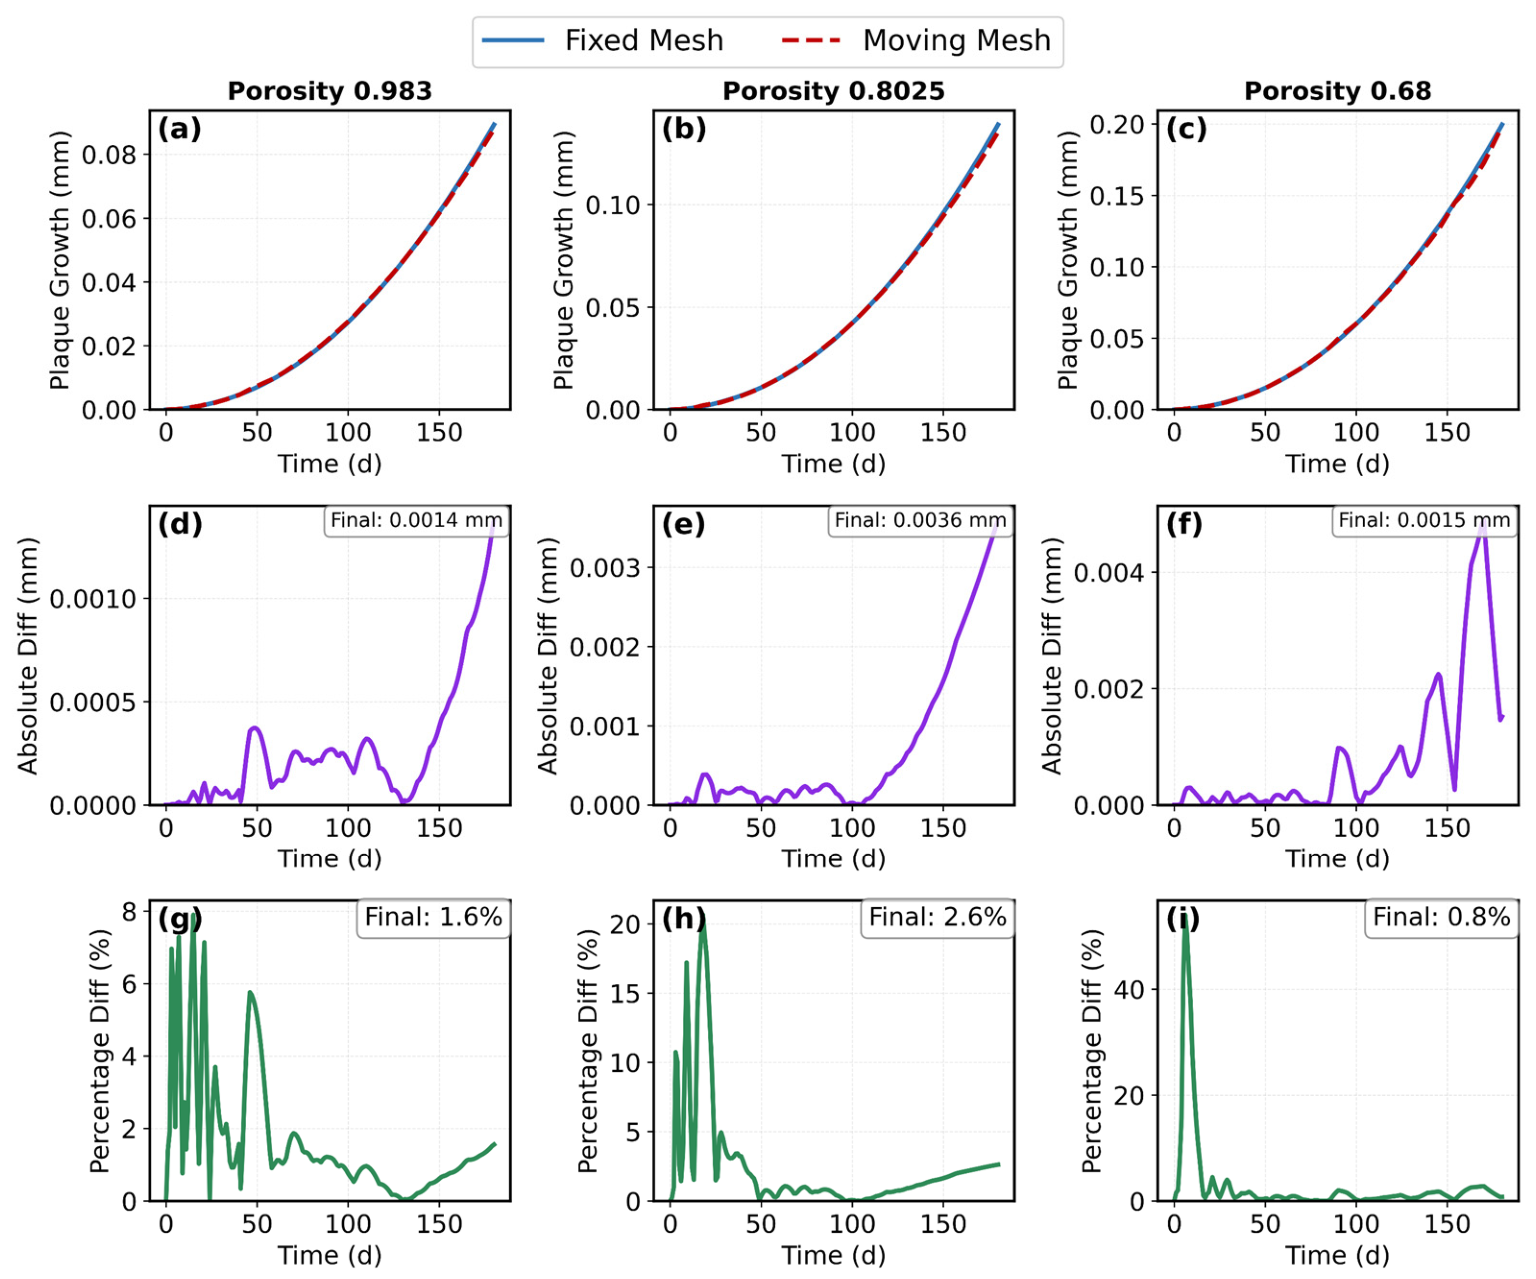
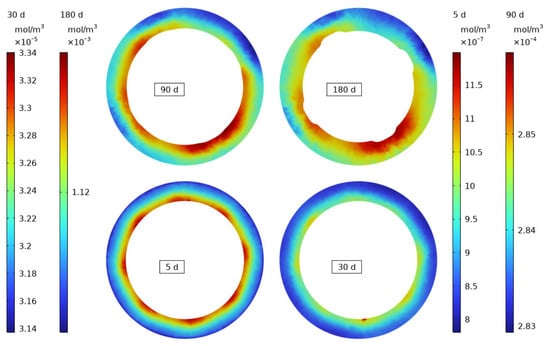
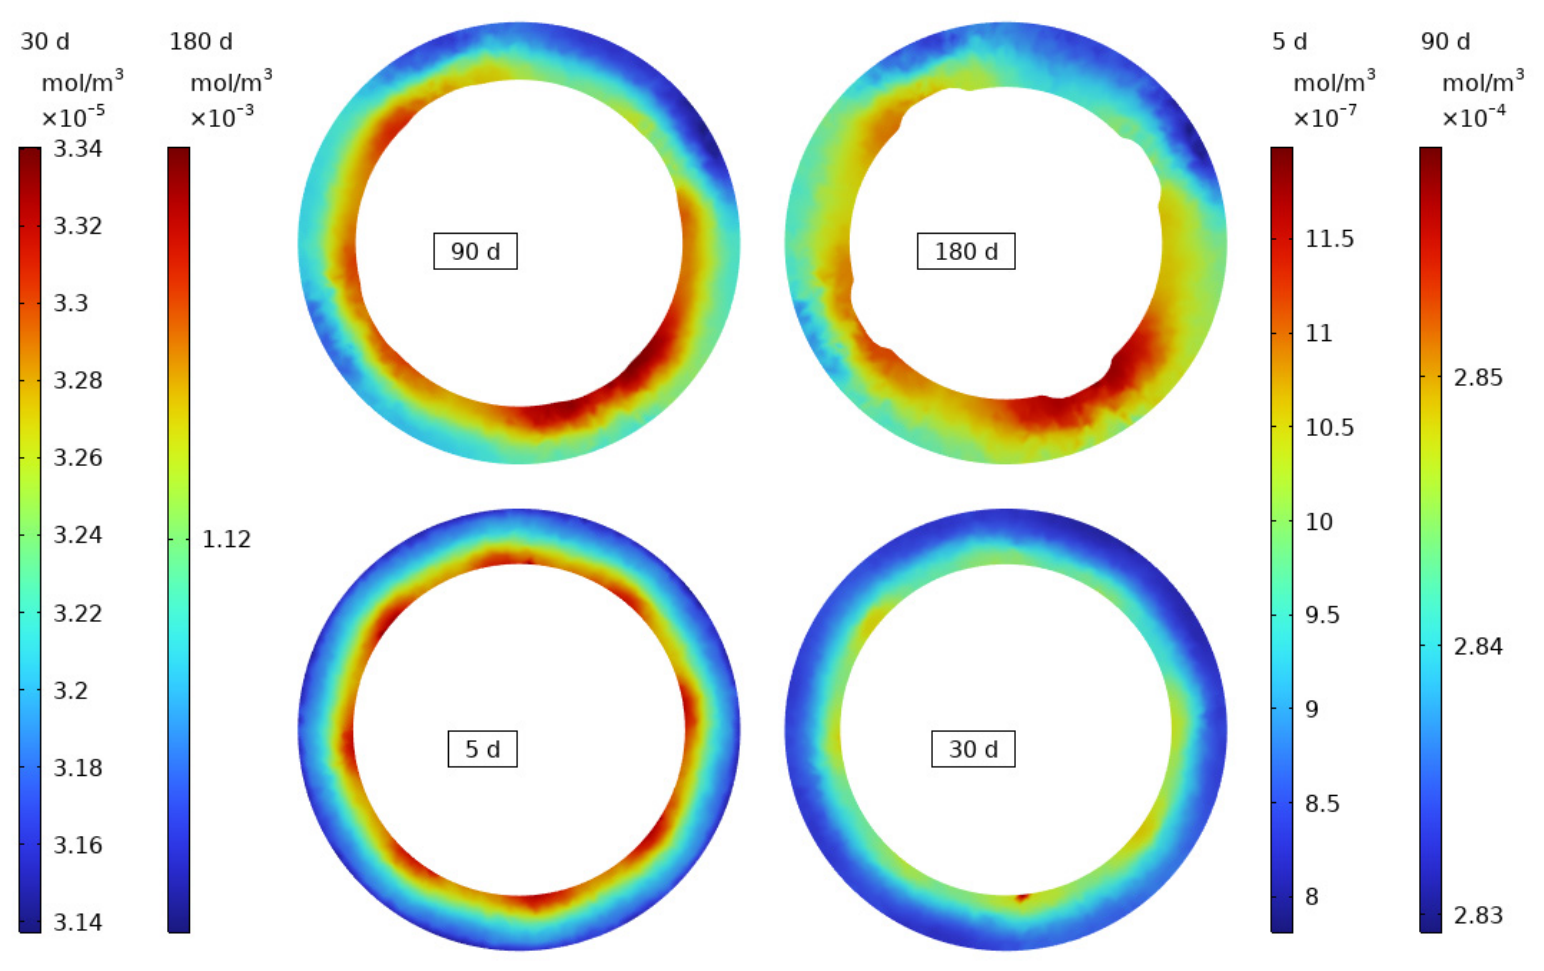
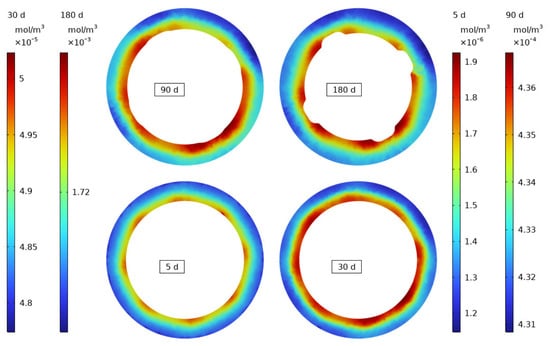
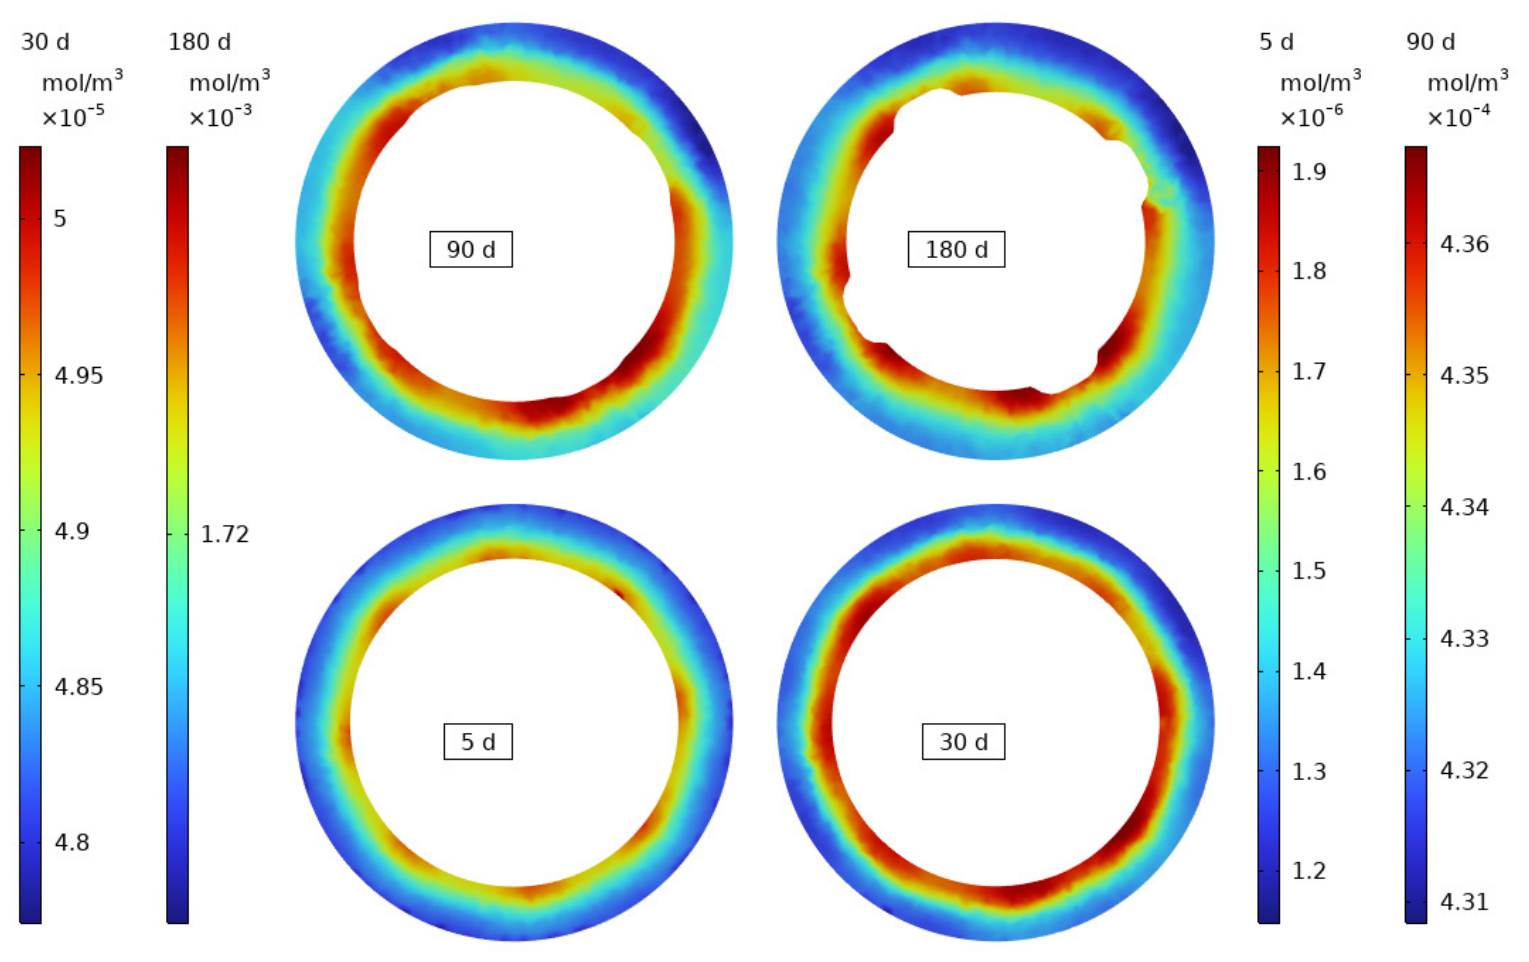
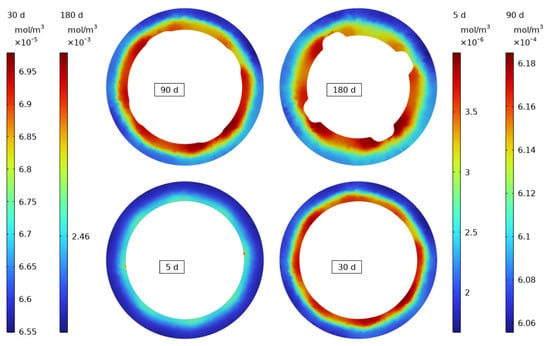
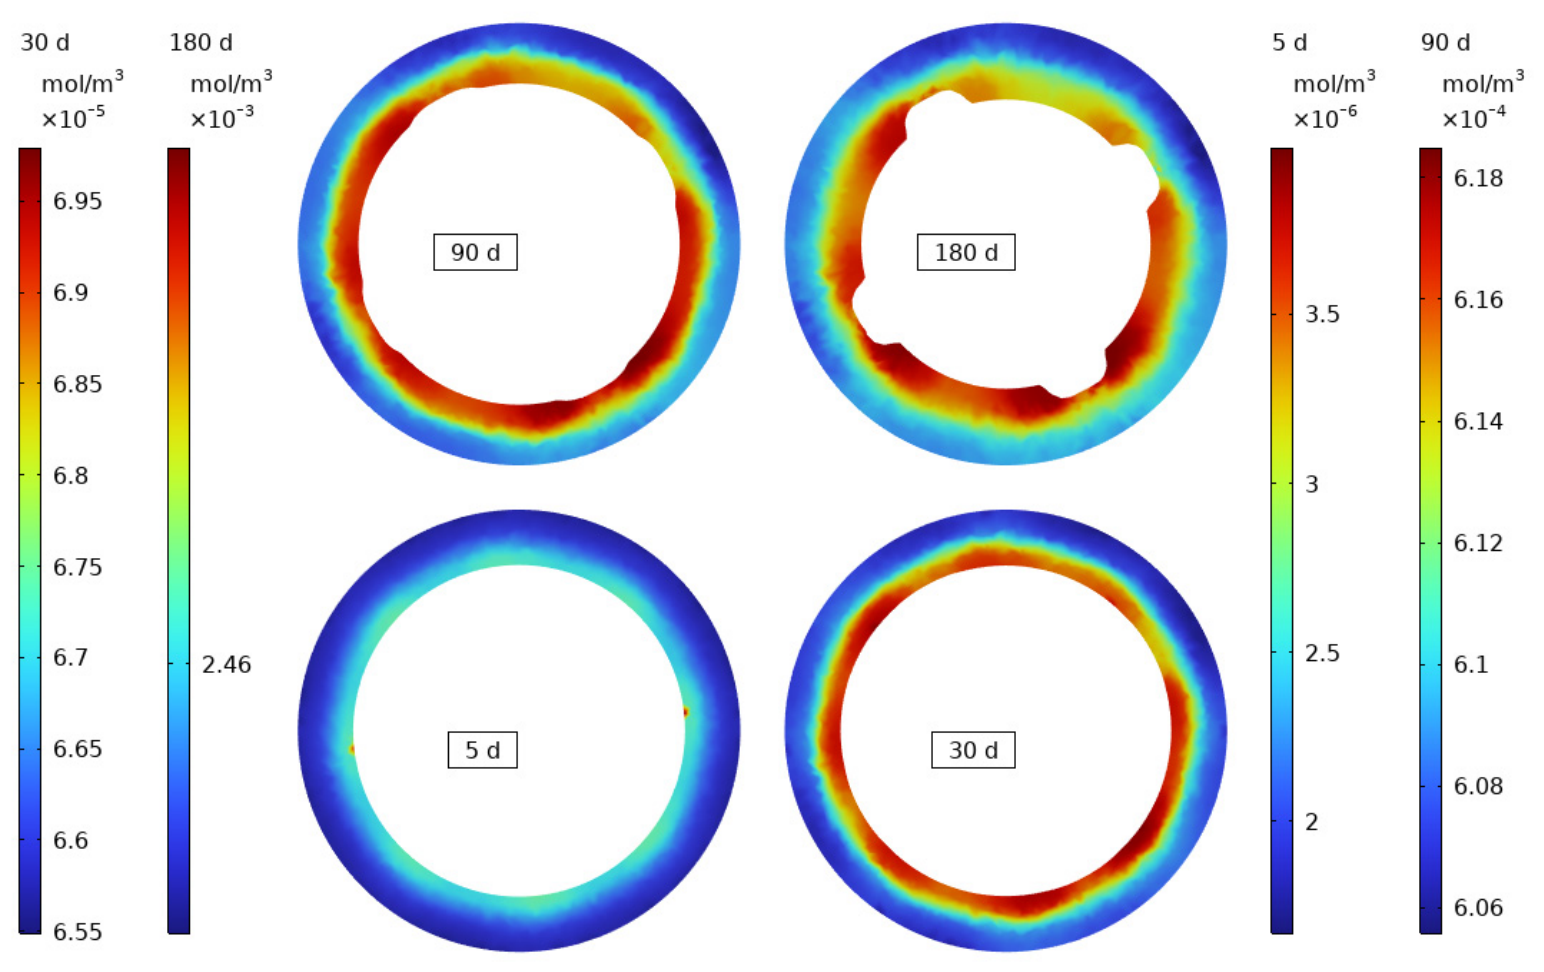
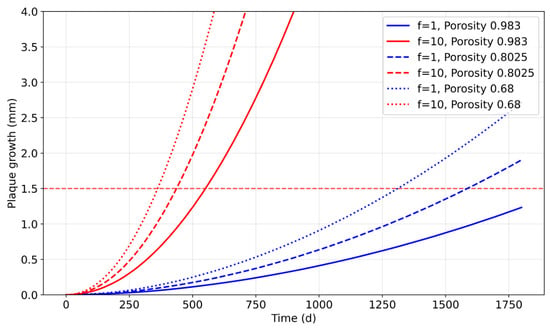
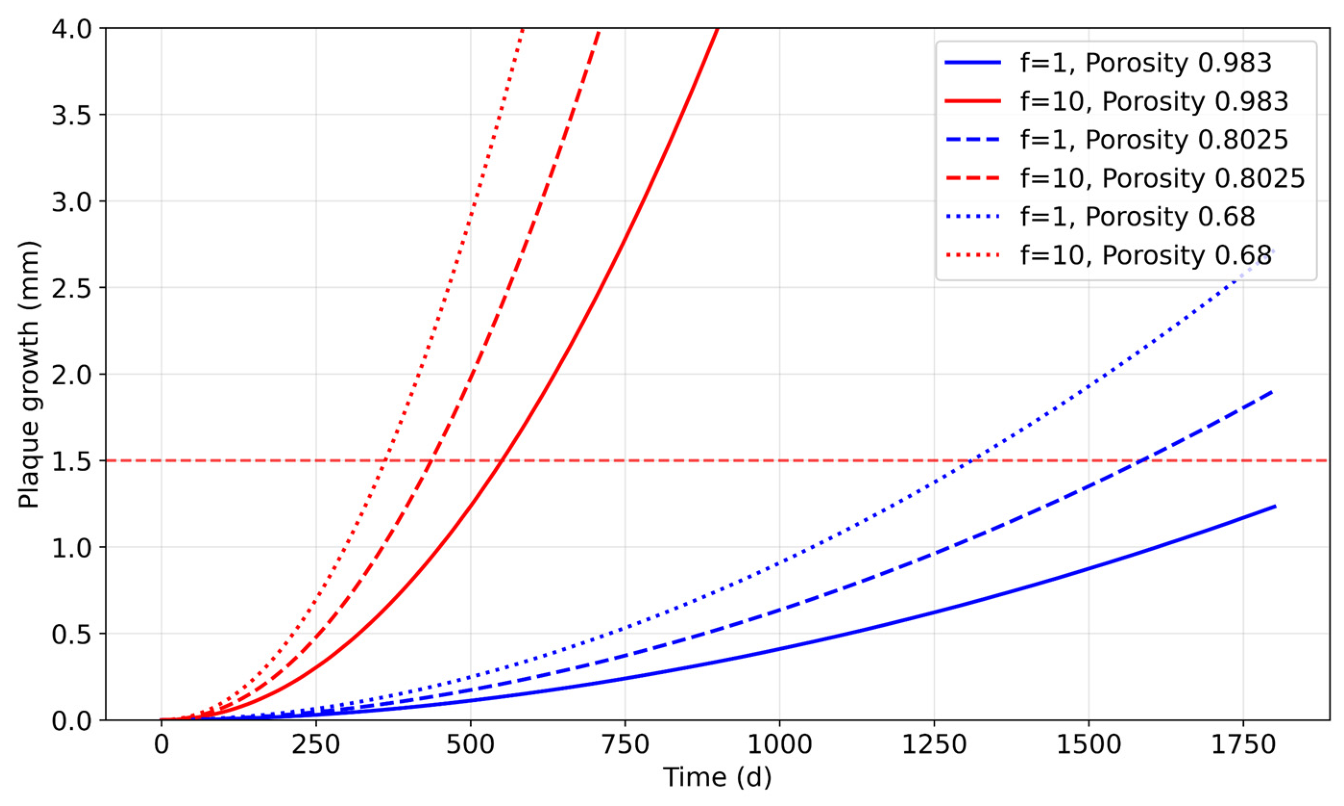
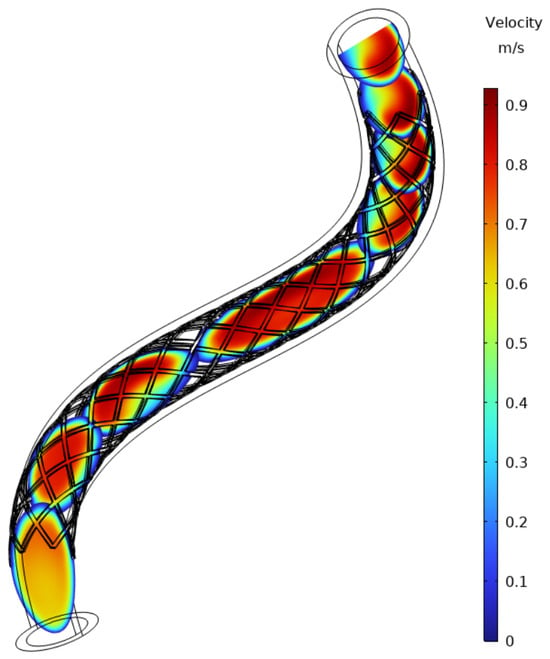
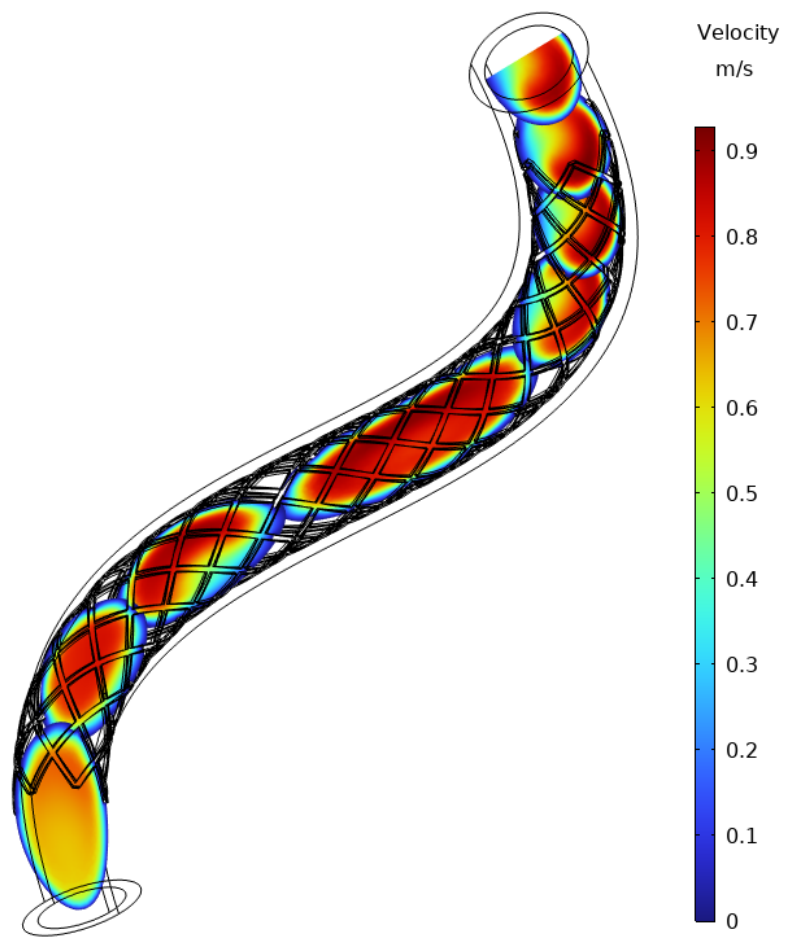
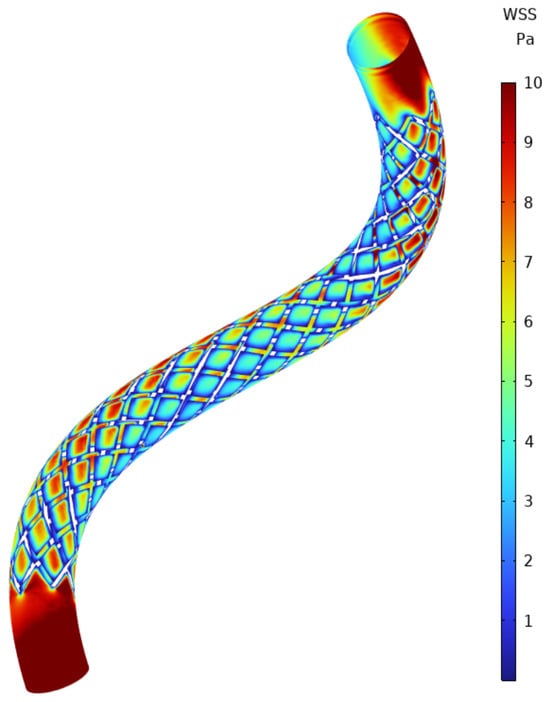
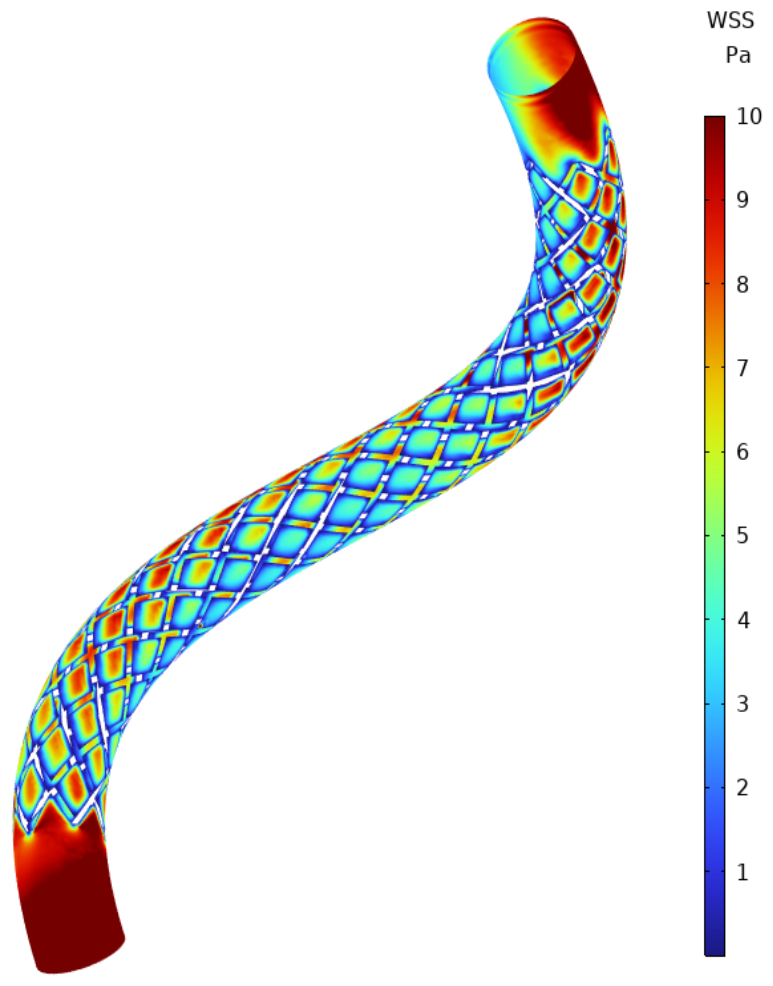
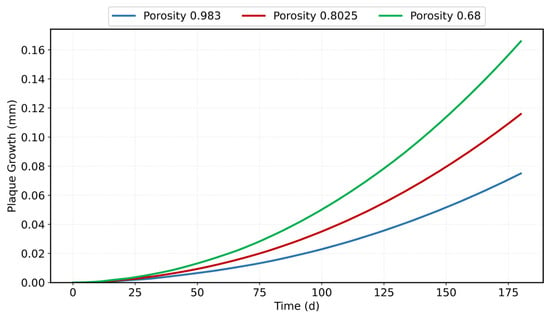
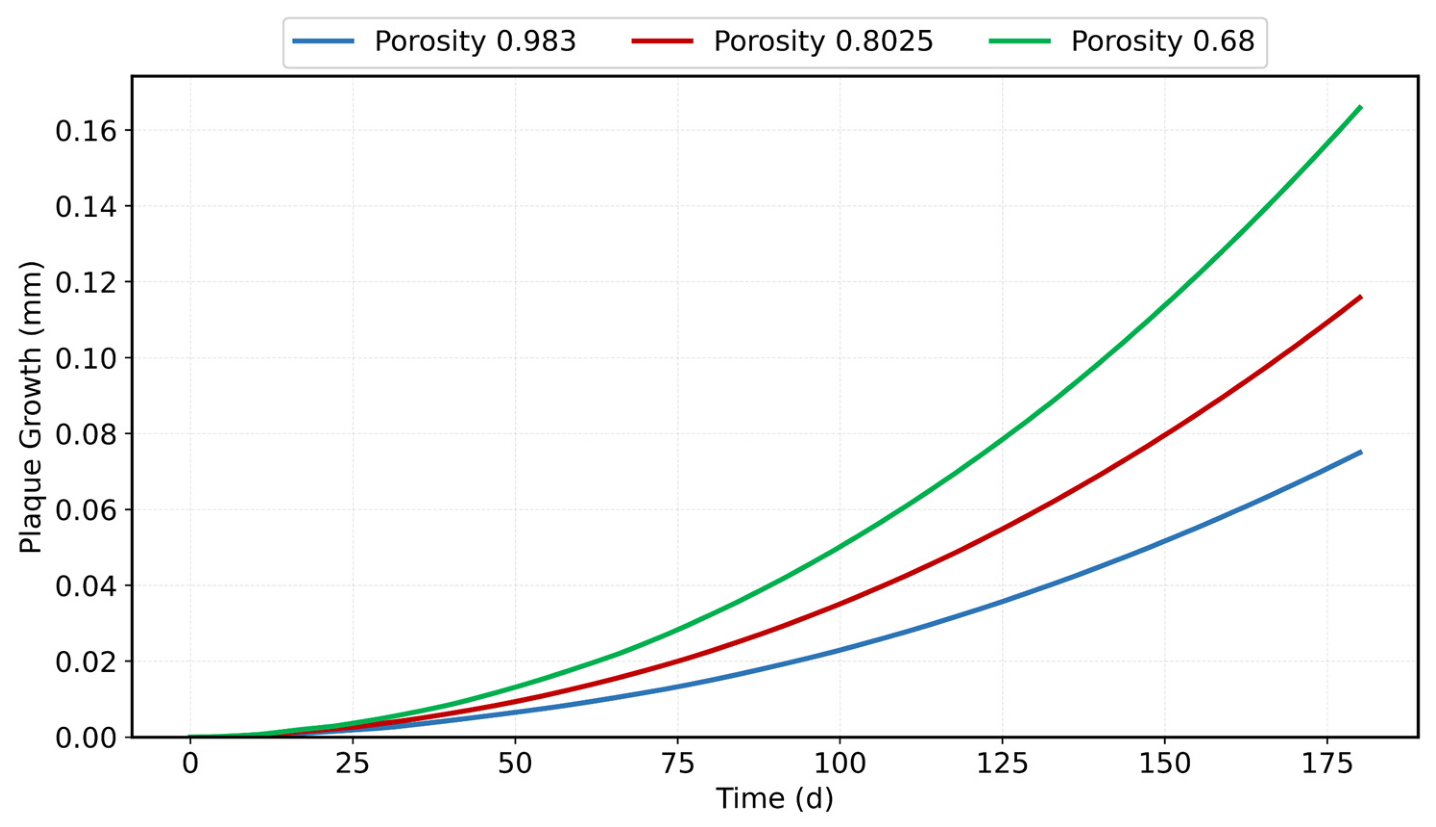
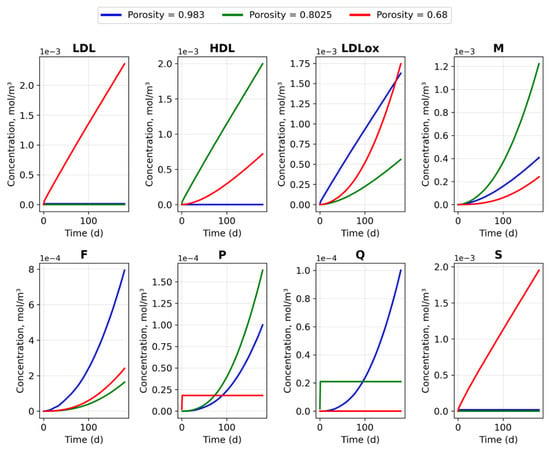
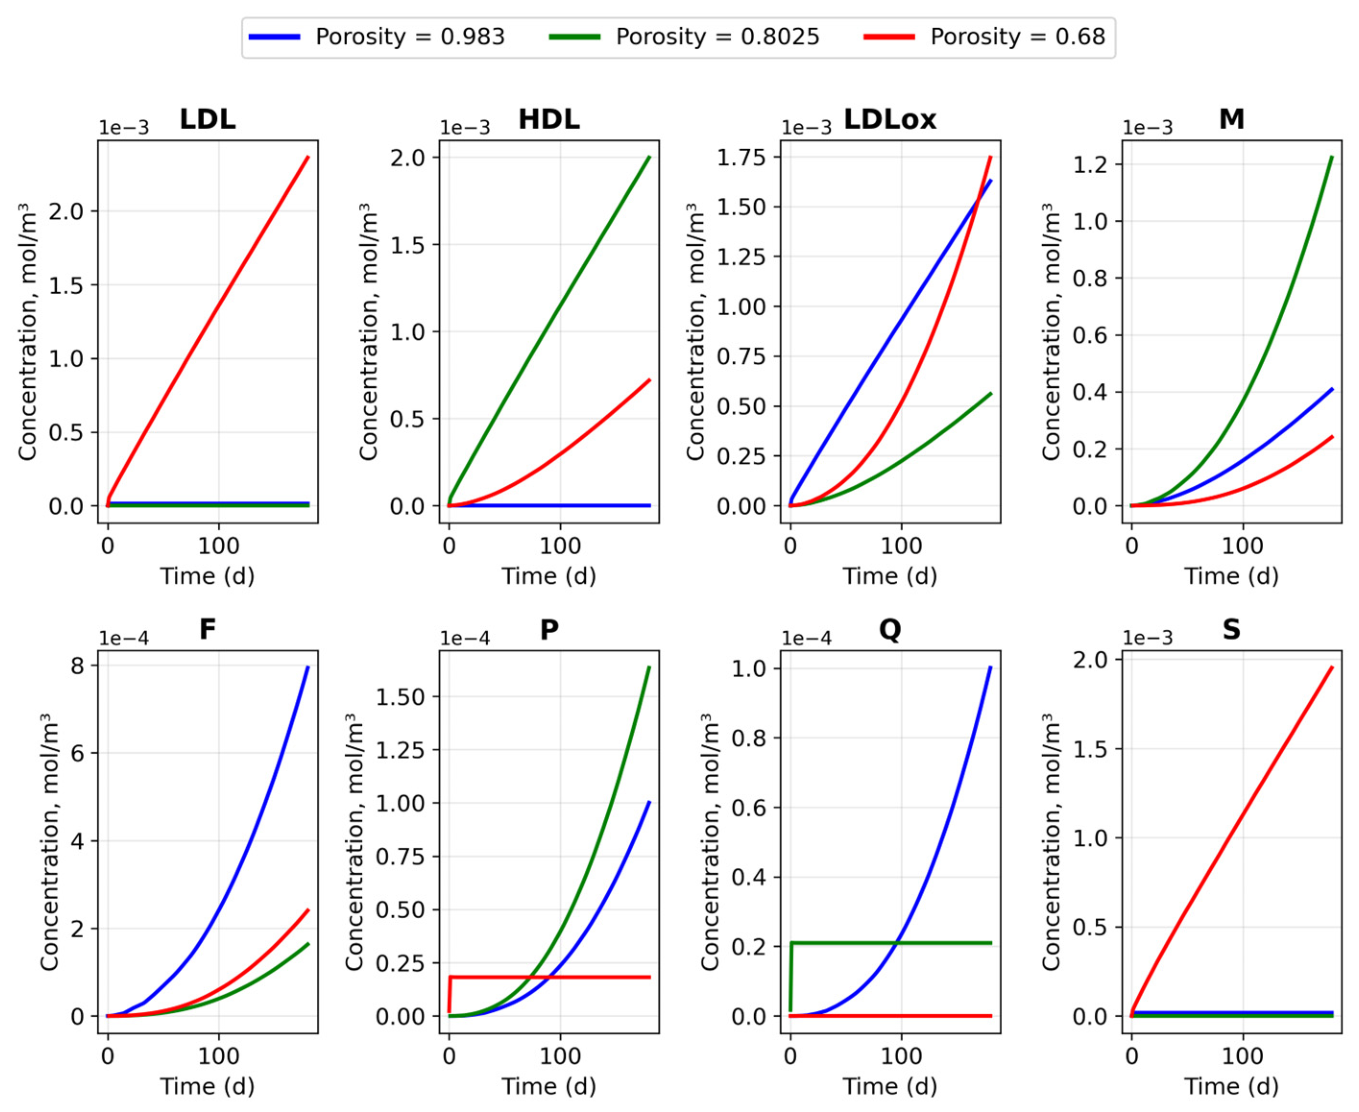
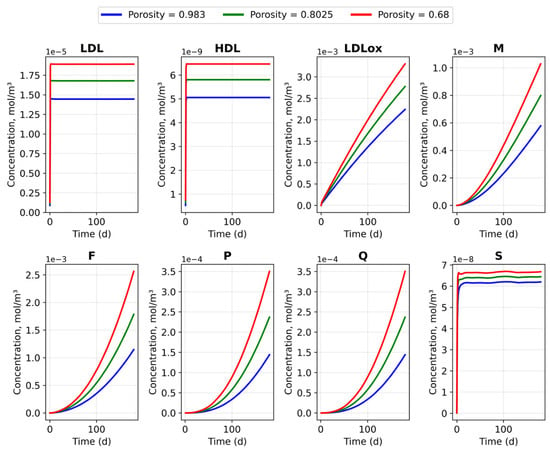
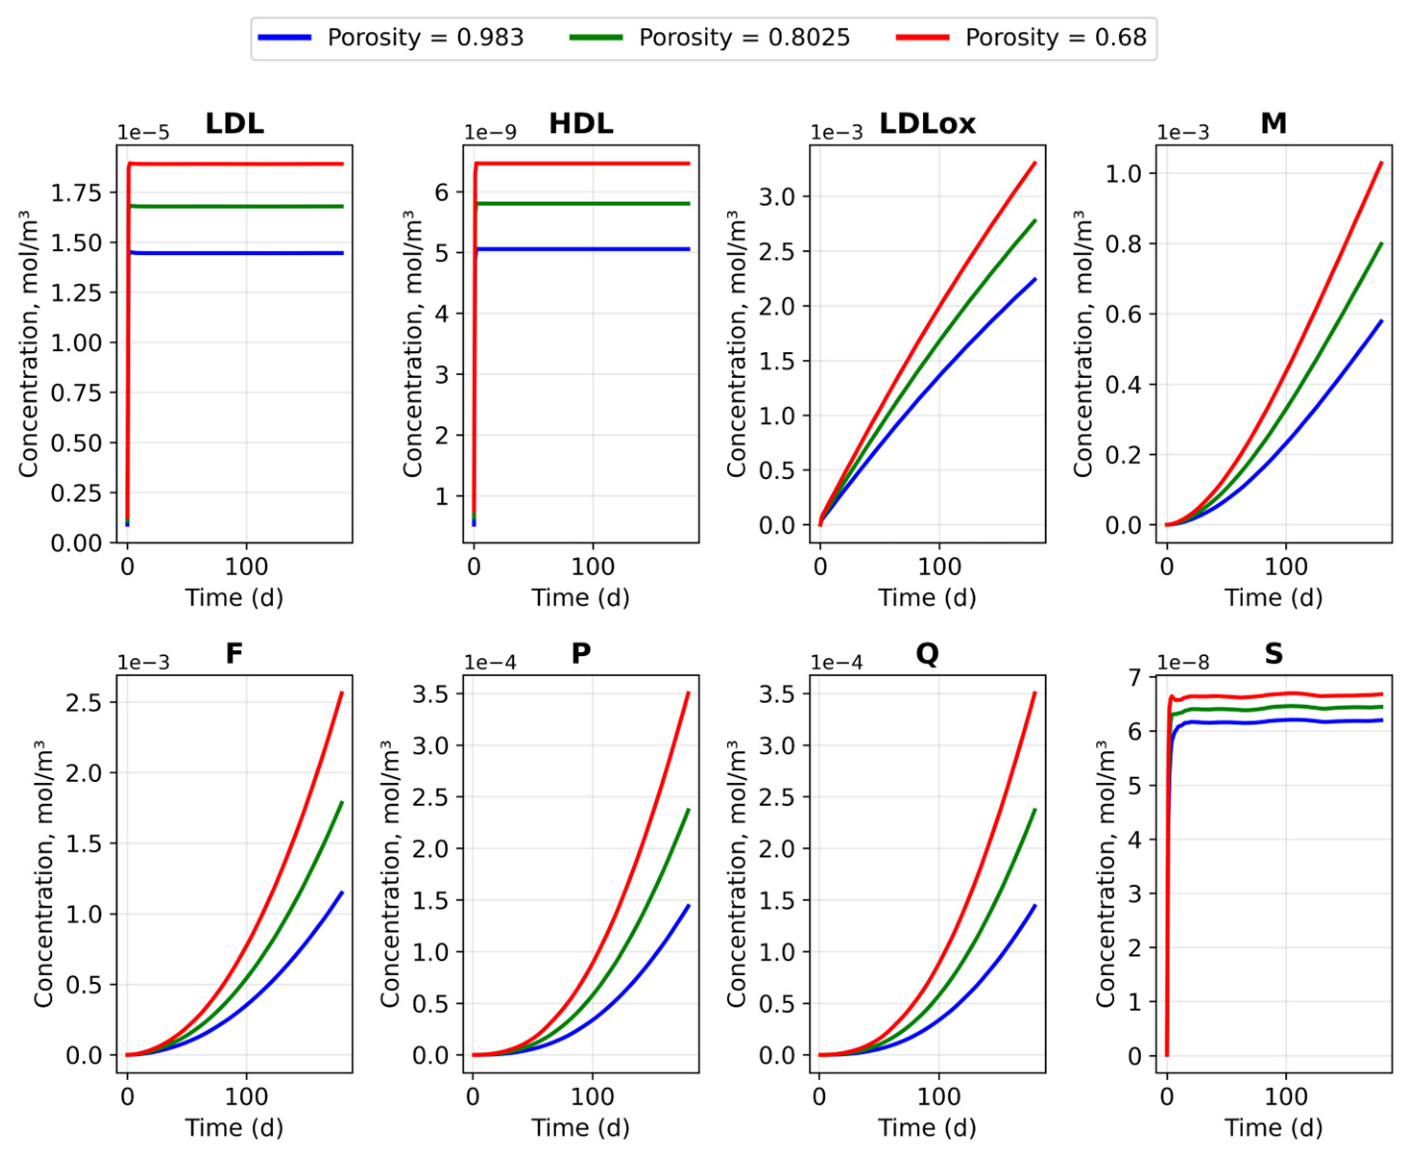
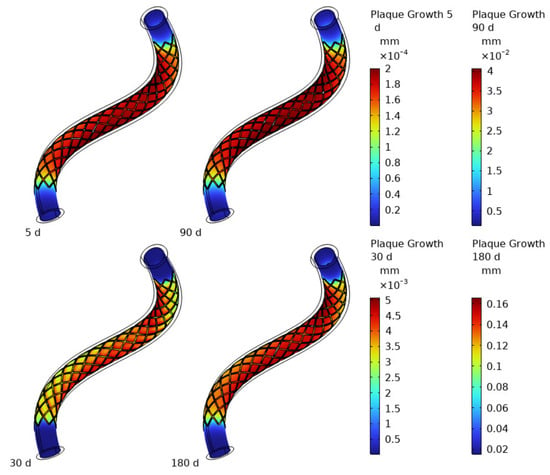
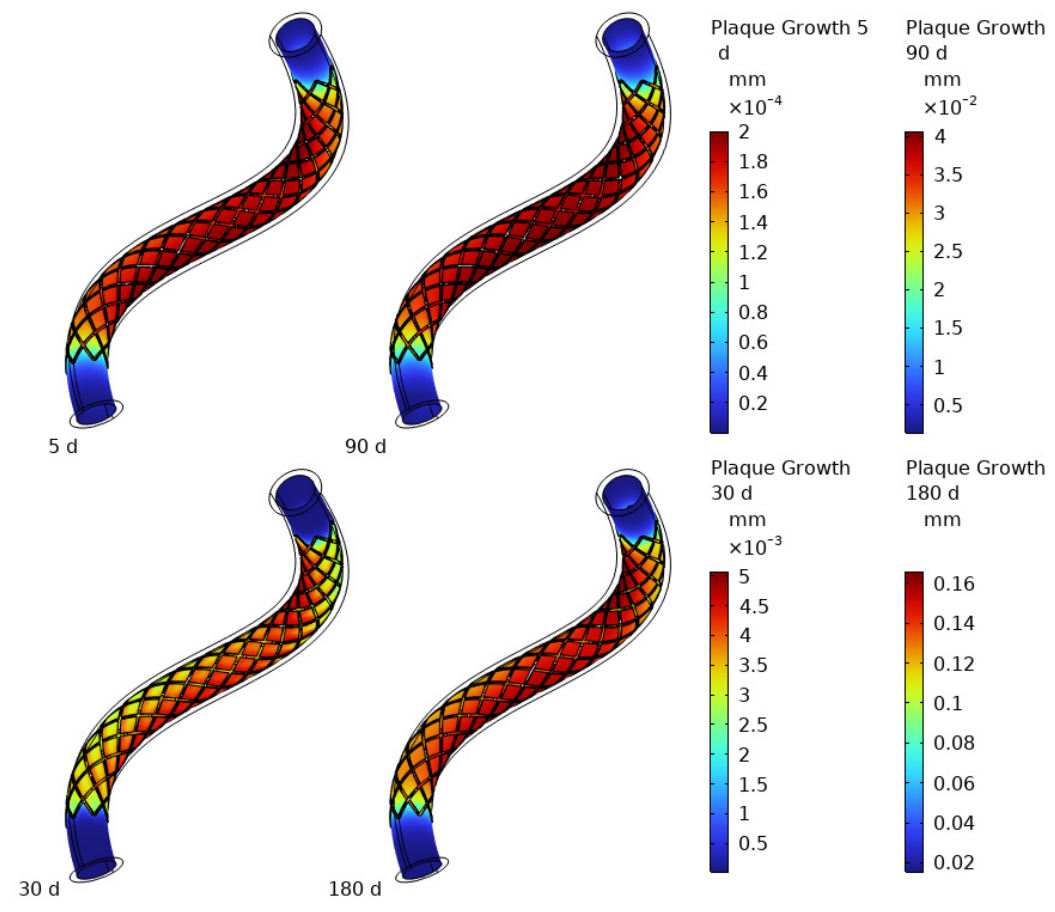
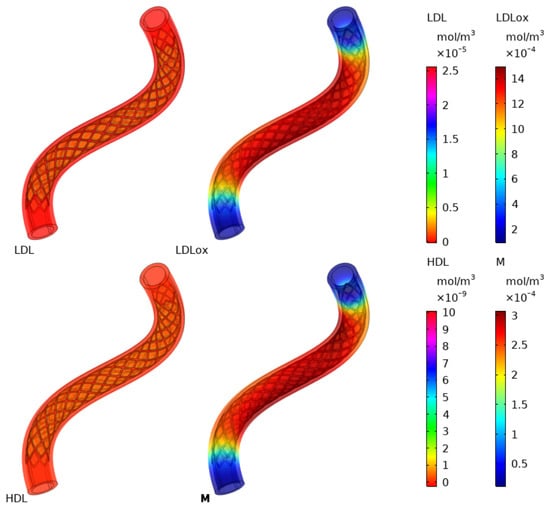
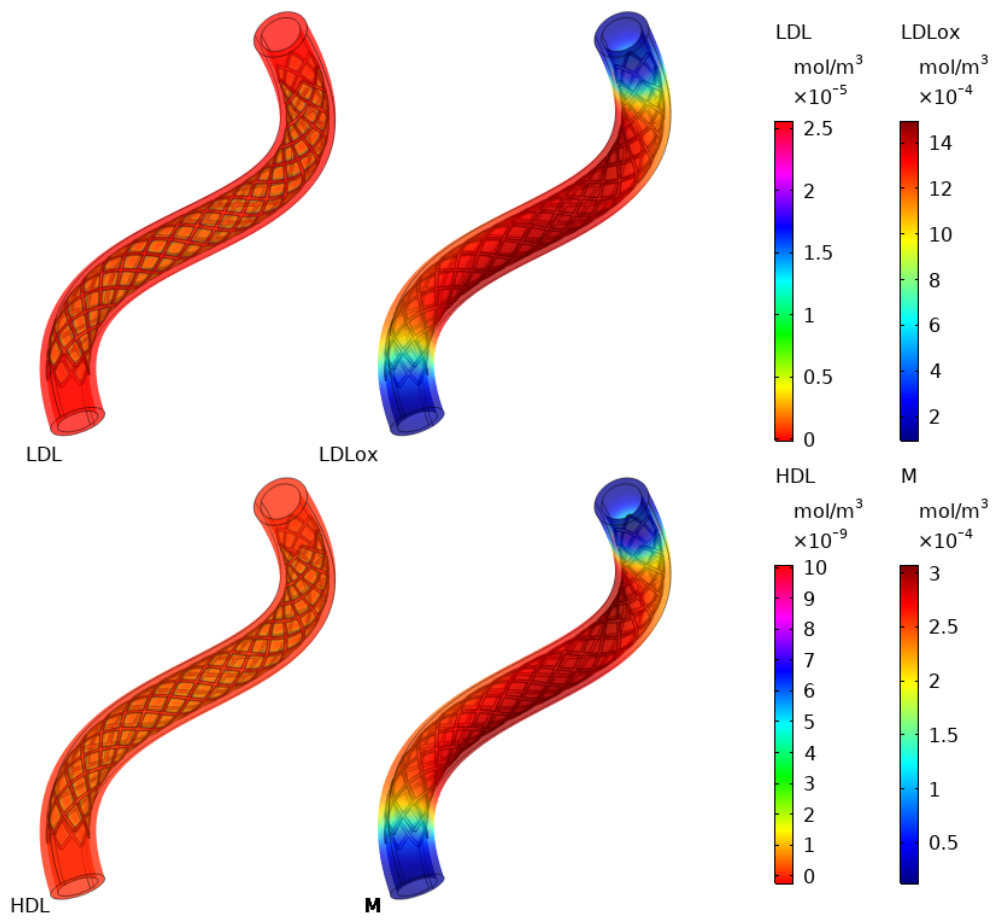
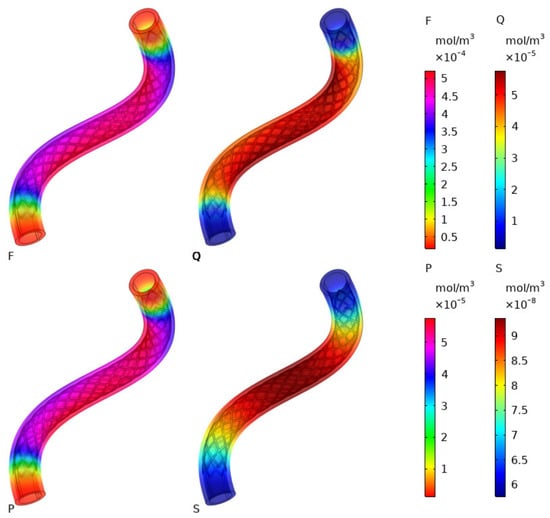
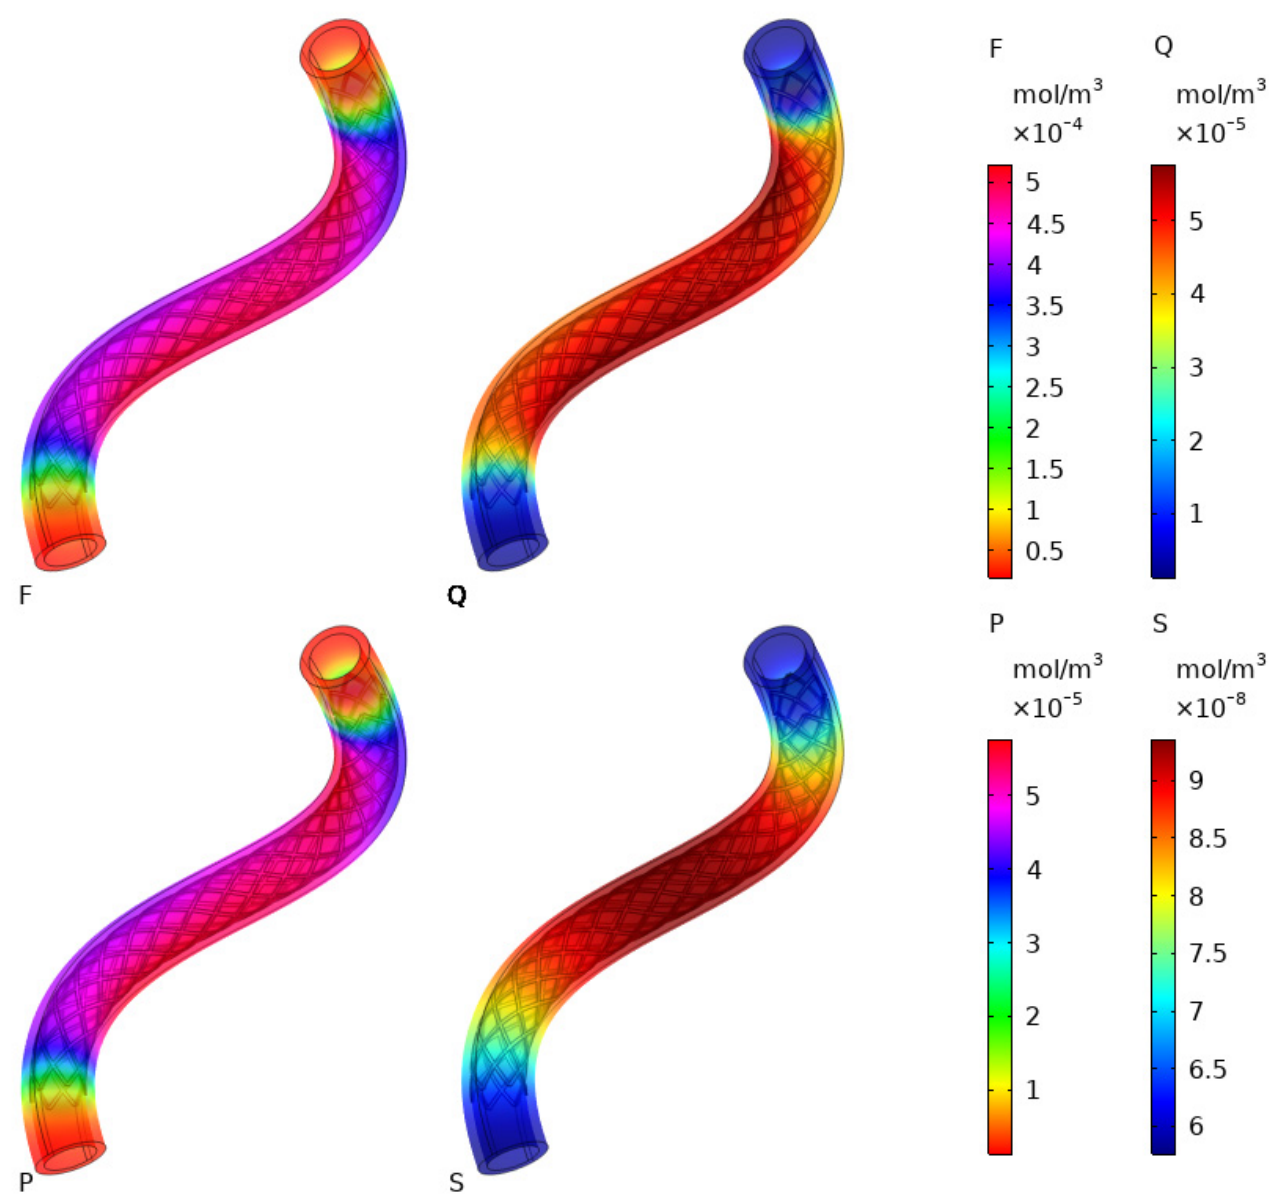
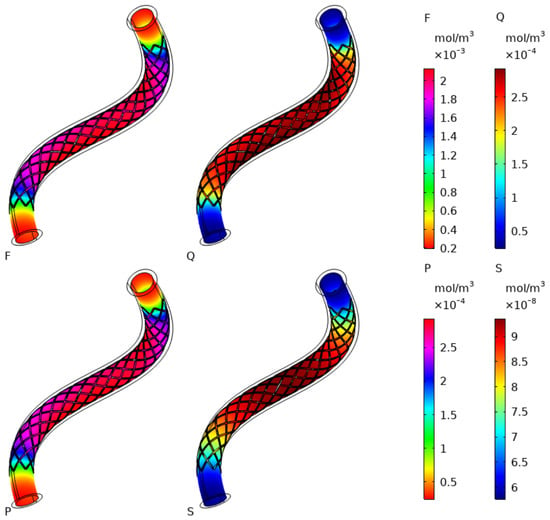
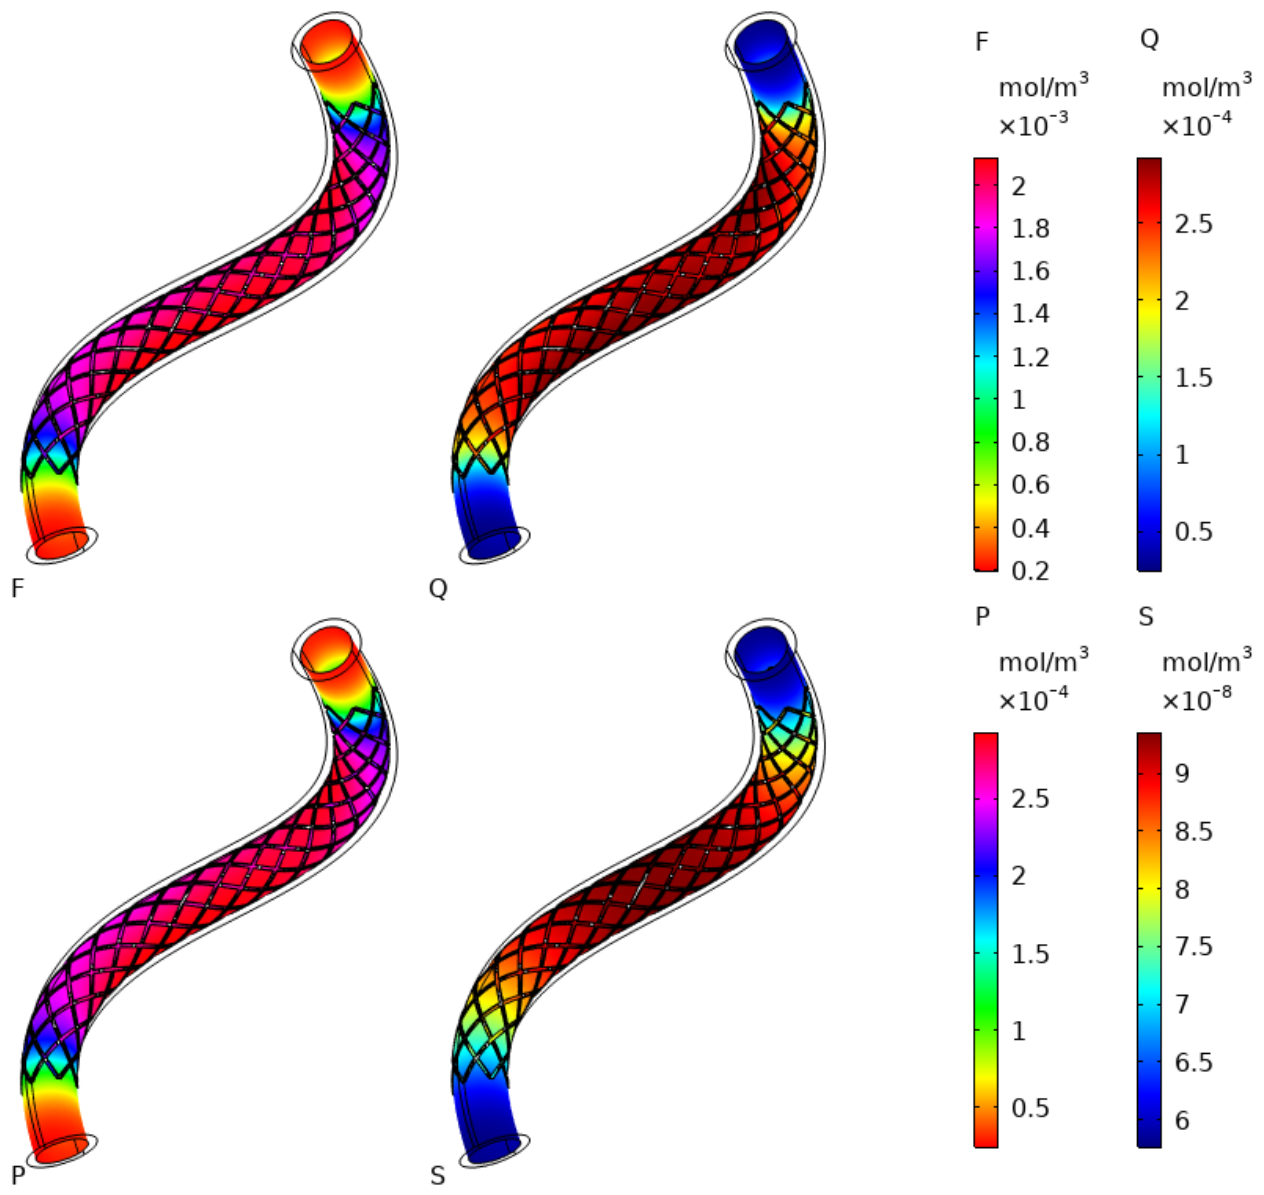
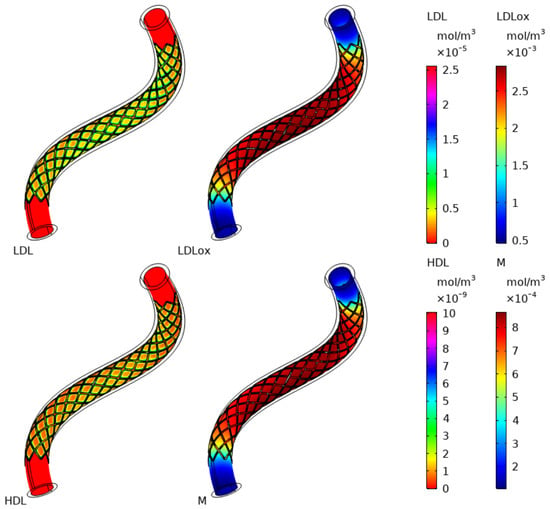
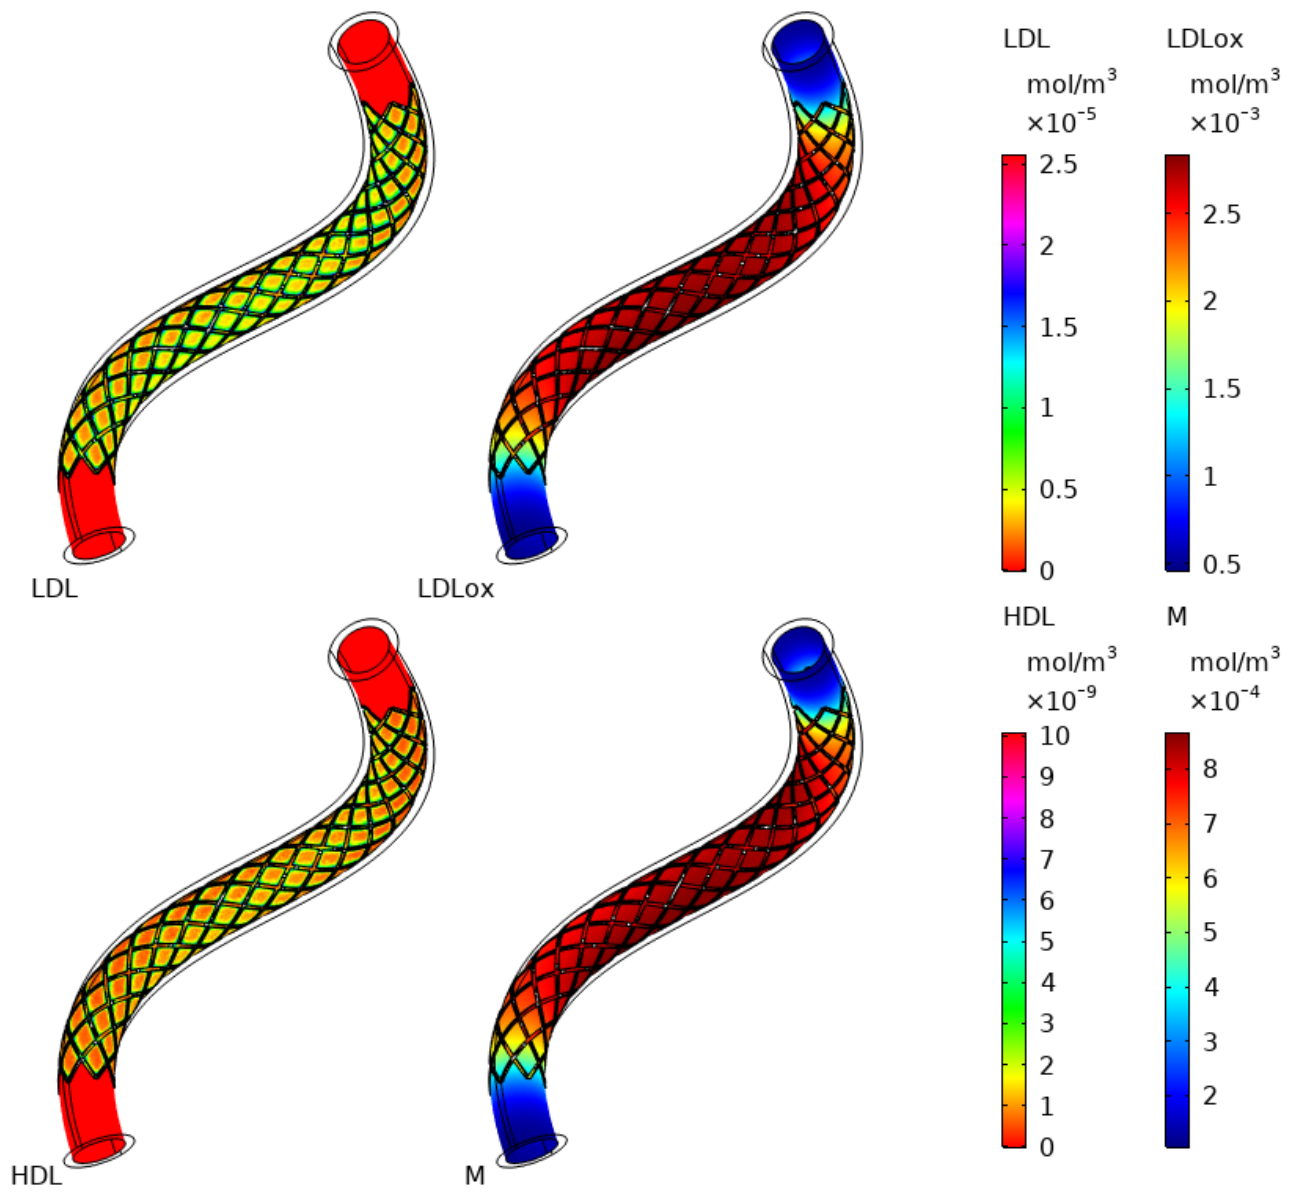
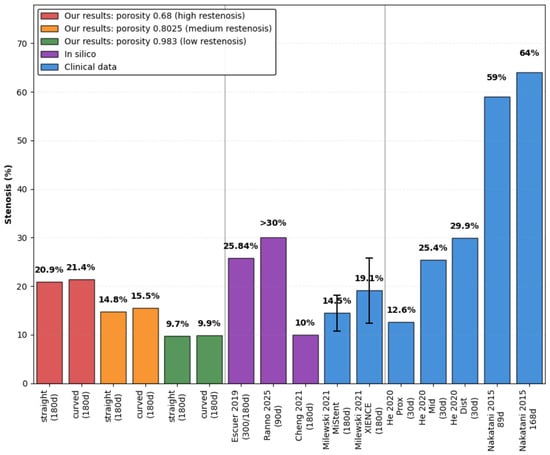
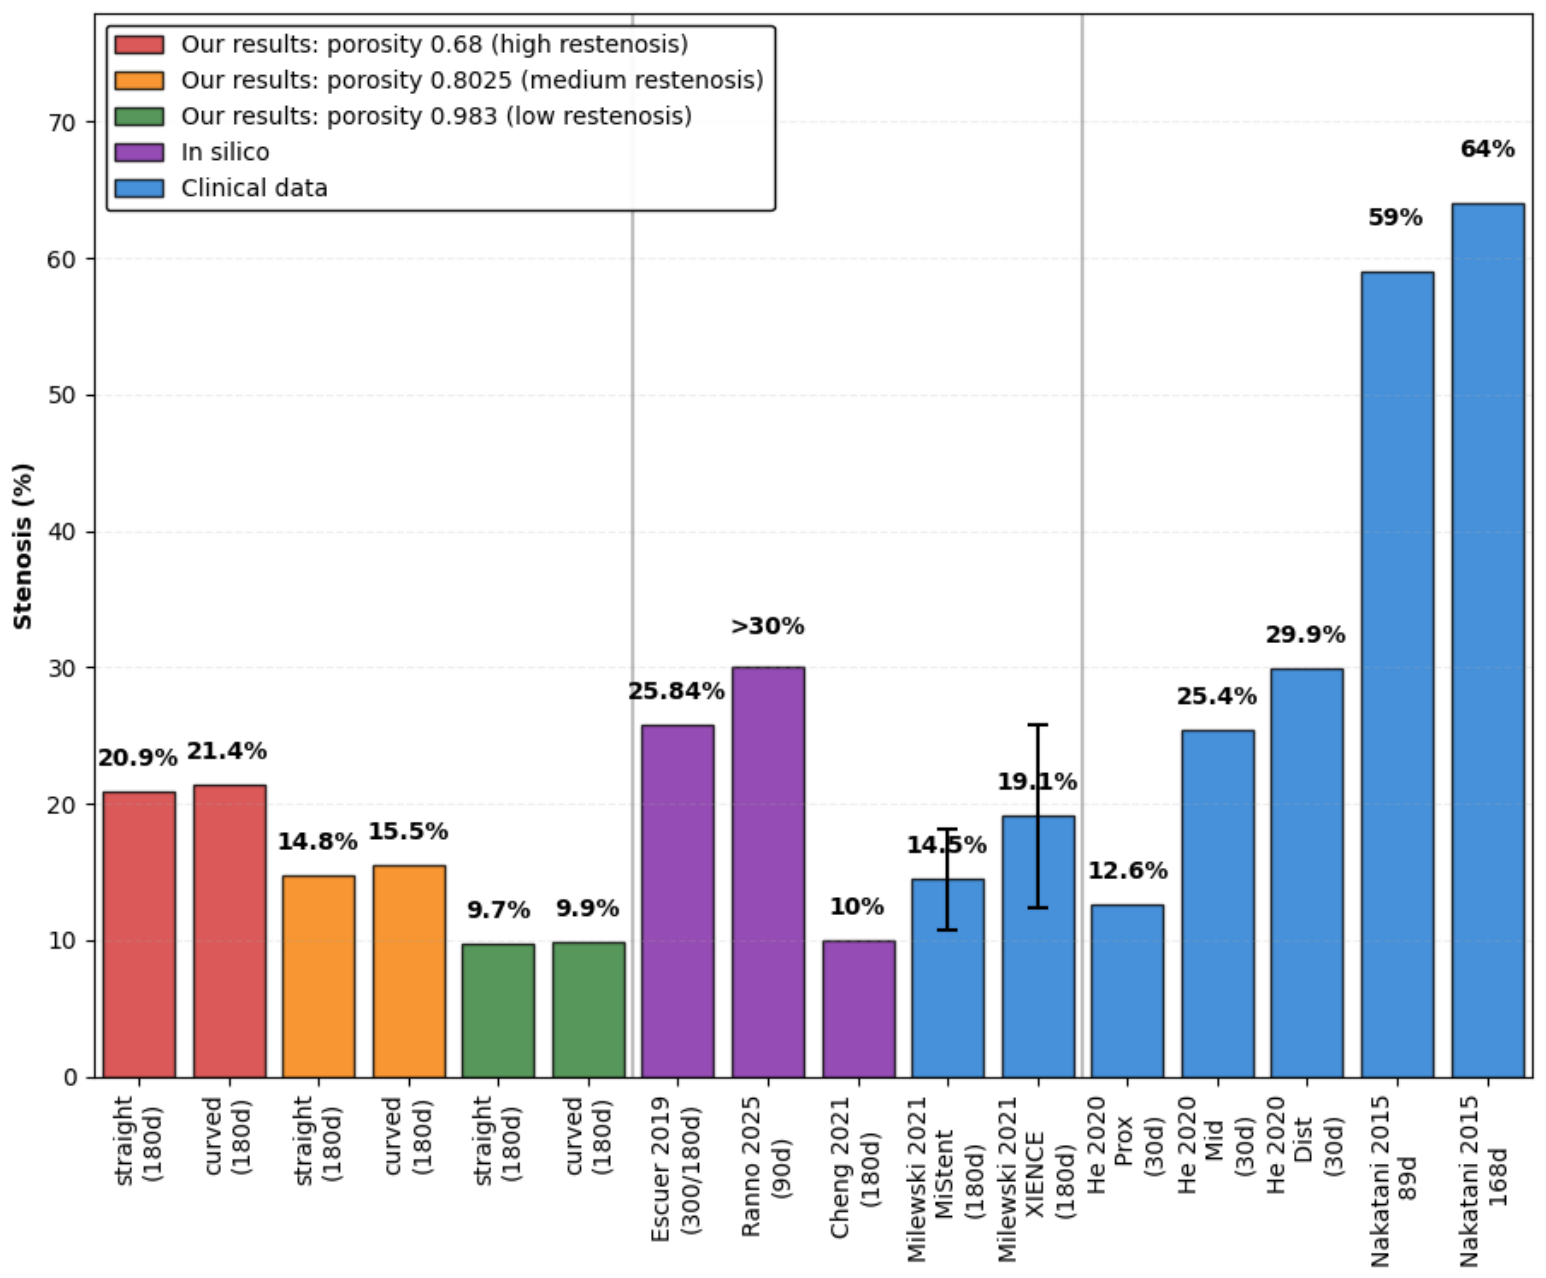

Disclaimer/Publisher’s Note: The statements, opinions and data contained in all publications are solely those of the individual author(s) and contributor(s) and not of MDPI and/or the editor(s). MDPI and/or the editor(s) disclaim responsibility for any injury to people or property resulting from any ideas, methods, instructions or products referred to in the content. |
© 2026 by the authors. Licensee MDPI, Basel, Switzerland. This article is an open access article distributed under the terms and conditions of the Creative Commons Attribution (CC BY) license.