


Abstract
Rapid and accurate quantification of residual guar gum in bauxite slurry flocculation is a critical bottleneck for closed-loop control of flocculant dosage. In this study, we systematically compared the anti-interference performance of the two UV-Vis spectrophotometer approaches, the single-wavelength absorbance method (A263) and the peak-trough difference method (ΔA), in complex slurry matrices. Our results revealed that the two methods respond differently to pH and salt concentration variations, leading to the proposal of a dual-mode synergistic detection strategy. The A263 method provides quantification under the specific conditions tested within the ranges of pH 3.0–8.0 and CaCl2 concentration below 4.5 mmol/L. Beyond these boundaries, deviations from the Beer-Lambert law occurred, attributable to conformational transitions or salting-out aggregation of the polymer chains. In contrast, the ΔA method partially mitigated background drift through differential calculation and exhibited a more stable signal trend than A263 across the tested ranges (pH 2.0–11.0, CaCl2 0–18 mmol/L), suggesting its potential utility as a semi-quantitative indicator in challenging matrices. However, its quantitative precision was constrained by small absolute signal values and systematic dependence on pH and salt conditions. Based on these findings, we propose a synergistic strategy-preferring the A263 method under routine conditions while recommending the ΔA method for high-salinity or wide-pH scenarios- and accordingly define the preliminary applicability boundaries based on signal response observations at a single concentration. Flocculation–sedimentation tests confirmed that the method successfully determined the optimum dosage (5.0 g/kg dry slurry), at which the residual concentration in the supernatant correlated negatively with the sedimentation rate (R2 > 0.95). The supernatant matrix after sedimentation (pH ≈ 7.1, low ionic strength) fell exactly within the safe window. This work provides a methodological reference for spectrophotometric quantification of trace organics in turbid, saline, and pH-variable slurry systems, and lays an analytical foundation for intelligent dosage control in bauxite slurry dewatering.
1. Introduction
The washing and beneficiation of bauxite ore generate substantial volumes of slurry with high moisture content and predominantly fine particles. These particles settle extremely slowly under natural conditions, requiring the addition of polymeric flocculants to accelerate solid–liquid separation [1,2,3,4]. However, precise dosing remains a core engineering challenge. Insufficient dosage limits particle bridging and results in poor flocculation performance; conversely, excessive dosage over-covers particle surfaces with polymer chains, restabilizing flocs, wasting chemical reagents, causing pipeline scaling [5,6], and deteriorating recirculating water quality [7,8]. The key to overcoming this bottleneck lies in obtaining real-time feedback of residual flocculant concentration in the supernatant. However, the inherently high fine-particle content, wide pH fluctuations, and complex ionic environment of bauxite slurry systems impose severe constraints on rapid quantitative detection of residual flocculants. Although existing analytical techniques—such as high-performance liquid chromatography [9], gas chromatography [10], fluorescence spectroscopy [11], nuclear magnetic resonance spectroscopy [12,13], fluorescent tagging [14], torque rheology [15], and colorimetric methods [16], all offer high sensitivity, their cumbersome procedures and poor timeliness render them ill-suited for on-site rapid assessment in beneficiation plants. Ultraviolet–visible (UV-Vis) spectrophotometry, by contrast, possesses the advantages of universal instrument availability, rapid analysis, and low cost [17]; nevertheless, systematic investigations remain lacking regarding how fine-particle scattering, conformational changes, and salting-out effects superimpose to interfere with the spectral response in such complex slurry matrices.
Guar gum, owing to its wide availability and environmental friendliness, is regarded as a promising polymeric flocculant. Its residual concentration not only directly reflects the extent of flocculant adsorption and utilization, but also correlates closely with sedimentation performance and water recovery quality [5,6,7,8]. At present, the optimum dosage is typically evaluated indirectly through macroscopic indices such as settling velocity, mudline height, and supernatant turbidity, which cannot precisely characterize the loading state of flocculants on solid surfaces or their residual behavior in the liquid phase [18]. Therefore, establishing a rapid and accurate method for determining residual guar gum concentration that is applicable to the complex bauxite slurry system is a prerequisite for achieving precise dosing and process control.
Existing UV-Vis quantitative evaluation approaches can be categorized into two types. The first is the single-wavelength absolute absorbance method (hereafter referred to as the A263 method), which establishes a calibration curve using the absorbance at the characteristic peak (263 nm) [16,17]. This approach is straightforward to implement; however, in high-turbidity systems, non-selective light scattering caused by fine particles can elevate absorbance by orders of magnitude, severely violating the Beer–Lambert law. The second is the peak-trough difference method (hereafter referred to as the ΔA method), which takes the difference between the maximum and minimum absorbance within a narrow wavelength interval, thereby automatically canceling slowly varying scattering backgrounds through differential calculation [19]. This method has demonstrated good anti-interference capability in biological macromolecules and certain polymer systems. Nevertheless, the effectiveness of the ΔA method depends critically on the stability of the spectral “peak-trough” morphology; when pH or salt concentration induces drastic conformational changes in the polymer chains, the peak-trough feature may flatten or even reverse, rendering ΔA ineffective. To date, systematic comparisons of the anti-interference performance, failure boundaries, and synergistic application modes of these two strategies in bauxite slurry systems have not been reported.
In response, this study systematically compares the response differences in the A263 and ΔA methods to pH and salt concentration interferences using bauxite slurry and guar gum sourced from Guangxi, China. The feasibility of the proposed strategy for determining the optimum dosage is validated through flocculation–sedimentation tests. The aim is to provide a theoretical basis and methodological support for precise flocculant dosing in efficient dewatering of bauxite slurry.
2. Materials and Methods
2.1. Materials
The bauxite slurry used in this study was collected from a washing plant of Guangxi Huayin Aluminum Co., Ltd., Baise, China. It appeared as a yellowish-brown mud with a pH of 7.12 and a measured solid content of 13.2%. According to the Standard for Geotechnical Testing Method (GB/T 50123-2019) [20], the slurry was vacuum-filtered and freeze-dried to obtain powdered particles, the basic physical properties of which are presented in Table 1.
Table 1.
Basic physical properties of bauxite slurry particles.
The guar gum used was a non-ionic neutral polysaccharide purchased from Beijing Gua’errun Technology Co., Ltd., Beijing, China, in white powder form, rich in hydroxyl groups (-OH) [7], with an average molecular weight of 1.0–2.0 × 10⁶ g/mol [21]. Sodium hydroxide (purity ≥ 98%), hydrochloric acid (38% mass fraction), and calcium chloride (anhydrous, purity ≥ 97%) were obtained from Aladdin Biochemical Technology Co., Ltd., Shanghai, China, for adjusting the pH and salt concentration of the slurry suspensions. Deionized water prepared by a laboratory ultrapure water system (pH 6.74) was used throughout the experiments.
2.2. Preparation of Guar Gum Solutions and Spectrophotometric Quantification
The actual slurry was centrifuged at 15,000 rpm for 30 min, and the supernatant was collected as the solvent for guar gum. Guar gum powder was accurately weighed and dissolved in either distilled water or the aforementioned supernatant to prepare standard solutions at mass concentration gradients of 100, 200, 300, 400, 500, 600, 700, and 800 mg/L. Solutions prepared with distilled water were designated as ZG solutions, and those prepared with supernatant were designated as SG solutions. All solutions were sealed with plastic film and stirred continuously on a magnetic stirrer at 450 r/min for 8 h to ensure complete dissolution.
UV-Vis absorption spectra were recorded using a spectrophotometer (Lambda 750, PerkinElmer, Waltham, MA, USA) equipped with a quartz cuvette of 1.0 cm path length. The measurements were performed over the wavelength range of 200–800 nm with a scan speed of 70 nm·min−1, a data interval of 1 nm, and a slit width set to 2 nm. All spectra were recorded at room temperature. Prior to each measurement, baseline correction was performed by automatic background subtraction using the corresponding blank solution. Specifically, distilled water was used as the blank for samples prepared in distilled water (ZG solutions), while the mineral slurry supernatant (without guar gum) was used as the blank for samples prepared in the supernatant (SG solutions). All sample solutions were diluted 2-fold (1:1, v/v) with their respective blank solvents before analysis to ensure that the absorbance values fell within the linear range of the calibration curve (0.001–1.0). Each sample was measured in triplicate using freshly prepared independent solutions.
Two quantitative modes were adopted in parallel: (1) the A263 method, using the absorbance at the peak near 263 nm to construct the calibration curve; and (2) the ΔA method, defined within the local wavelength interval of 250–267 nm as ΔA = A263 − Amin, where Amin is the minimum absorbance in the 250–260 nm interval.
2.3. Interference Factor Comparison Experiments
Given that pH and salt interferences in real slurry systems exhibit nonlinear superposition, independent effects of each factor on the two quantitative modes were first investigated under simplified conditions. Two sets of comparison experiments were designed as follows:
(1) pH effect tests: The pH of 500 mg/L SG solutions was adjusted to 2.0, 3.0, 5.0, 7.0, 8.0, 9.0, 10.0, and 11.0 using NaOH and HCl solutions. Spectra were recorded at each pH, and A263 and ΔA values were determined.
(2) Salt concentration effect tests: CaCl2 was added to 500 mg/L SG solutions to final concentrations of 0.0, 0.9, 1.8, 2.7, 3.6, 4.5, 9.0, 13.5, and 18.0 mmol/L. After thorough mixing, spectra were recorded, and A263 and ΔA values were determined.
2.4. Flocculation–Sedimentation Tests and Dual-Mode Validation
A 1% (mass fraction) guar gum stock solution was prepared using distilled water (density approximated as 1.0 g/mL). Slurry was prepared by mixing 8.0 g of slurry powder with distilled water (Table 2) to a solids concentration of 7.8%, followed by addition of the corresponding volumes of guar gum stock solution to achieve dosages of 0, 3.75, 5.0, 6.25, 7.5, 8.75, 10.0, and 11.25 g/kg. It should be noted that the actual field solids concentration of the original slurry was 13.2%; the laboratory concentration of 7.8% was adopted for the following reasons: (1) this concentration allowed for moderate initial settling velocities, facilitating accurate recording of the mudline position; and the differences in settling rates among groups were more pronounced, enabling precise determination of the optimum dosage; (2) the optimum dosage is expressed as grams per kilogram of dry slurry solids, which is normalized. On this basis, the laboratory-determined optimum dosage (5.0 g/kg) is considered to provide a reasonable reference for field application. However, it should be recognized that differences in solids concentration may still influence flocculation kinetics, polymer dispersion, floc structure, settling behavior, and residual polymer concentration in the supernatant. Therefore, while the normalized dosage offers a practical starting point for field trials, its direct engineering applicability should be validated under actual field conditions in future work. During the tests, the mudline height was recorded over time to construct settling curves and calculate initial settling rates. The dosage corresponding to the maximum initial settling rate was identified as the optimum. Supernatant was subsequently collected for absorbance measurement, and residual concentrations were calculated from the guar gum calibration curve to cross-validate the optimum dosage. The electrical conductivity of the collected supernatant was measured using a conductivity meter at room temperature (25 ± 1 °C). All measurements were performed in triplicate.
Table 2.
Guar gum dosage scheme for flocculation settling tests.
2.5. Statistical Analysis
All experimental data were obtained from three independent replicate measurements and are expressed as mean ± standard deviation (SD). The standard deviation was calculated as SD = (n = 3). Calibration curves were fitted by linear regression using the least-squares method, and the coefficient of determination (R2) was reported to evaluate the goodness of fit. For all figures, data points and curves represent the mean values of three independent replicate measurements (n = 3); error bars denote ±1 standard deviation (SD). Curves serve as visual guides.
3. Results and Discussion
3.1. Absorbance Characteristics of Guar Gum Solutions at Different Concentrations
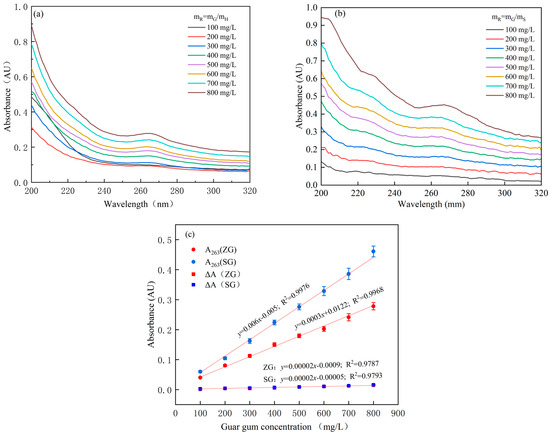
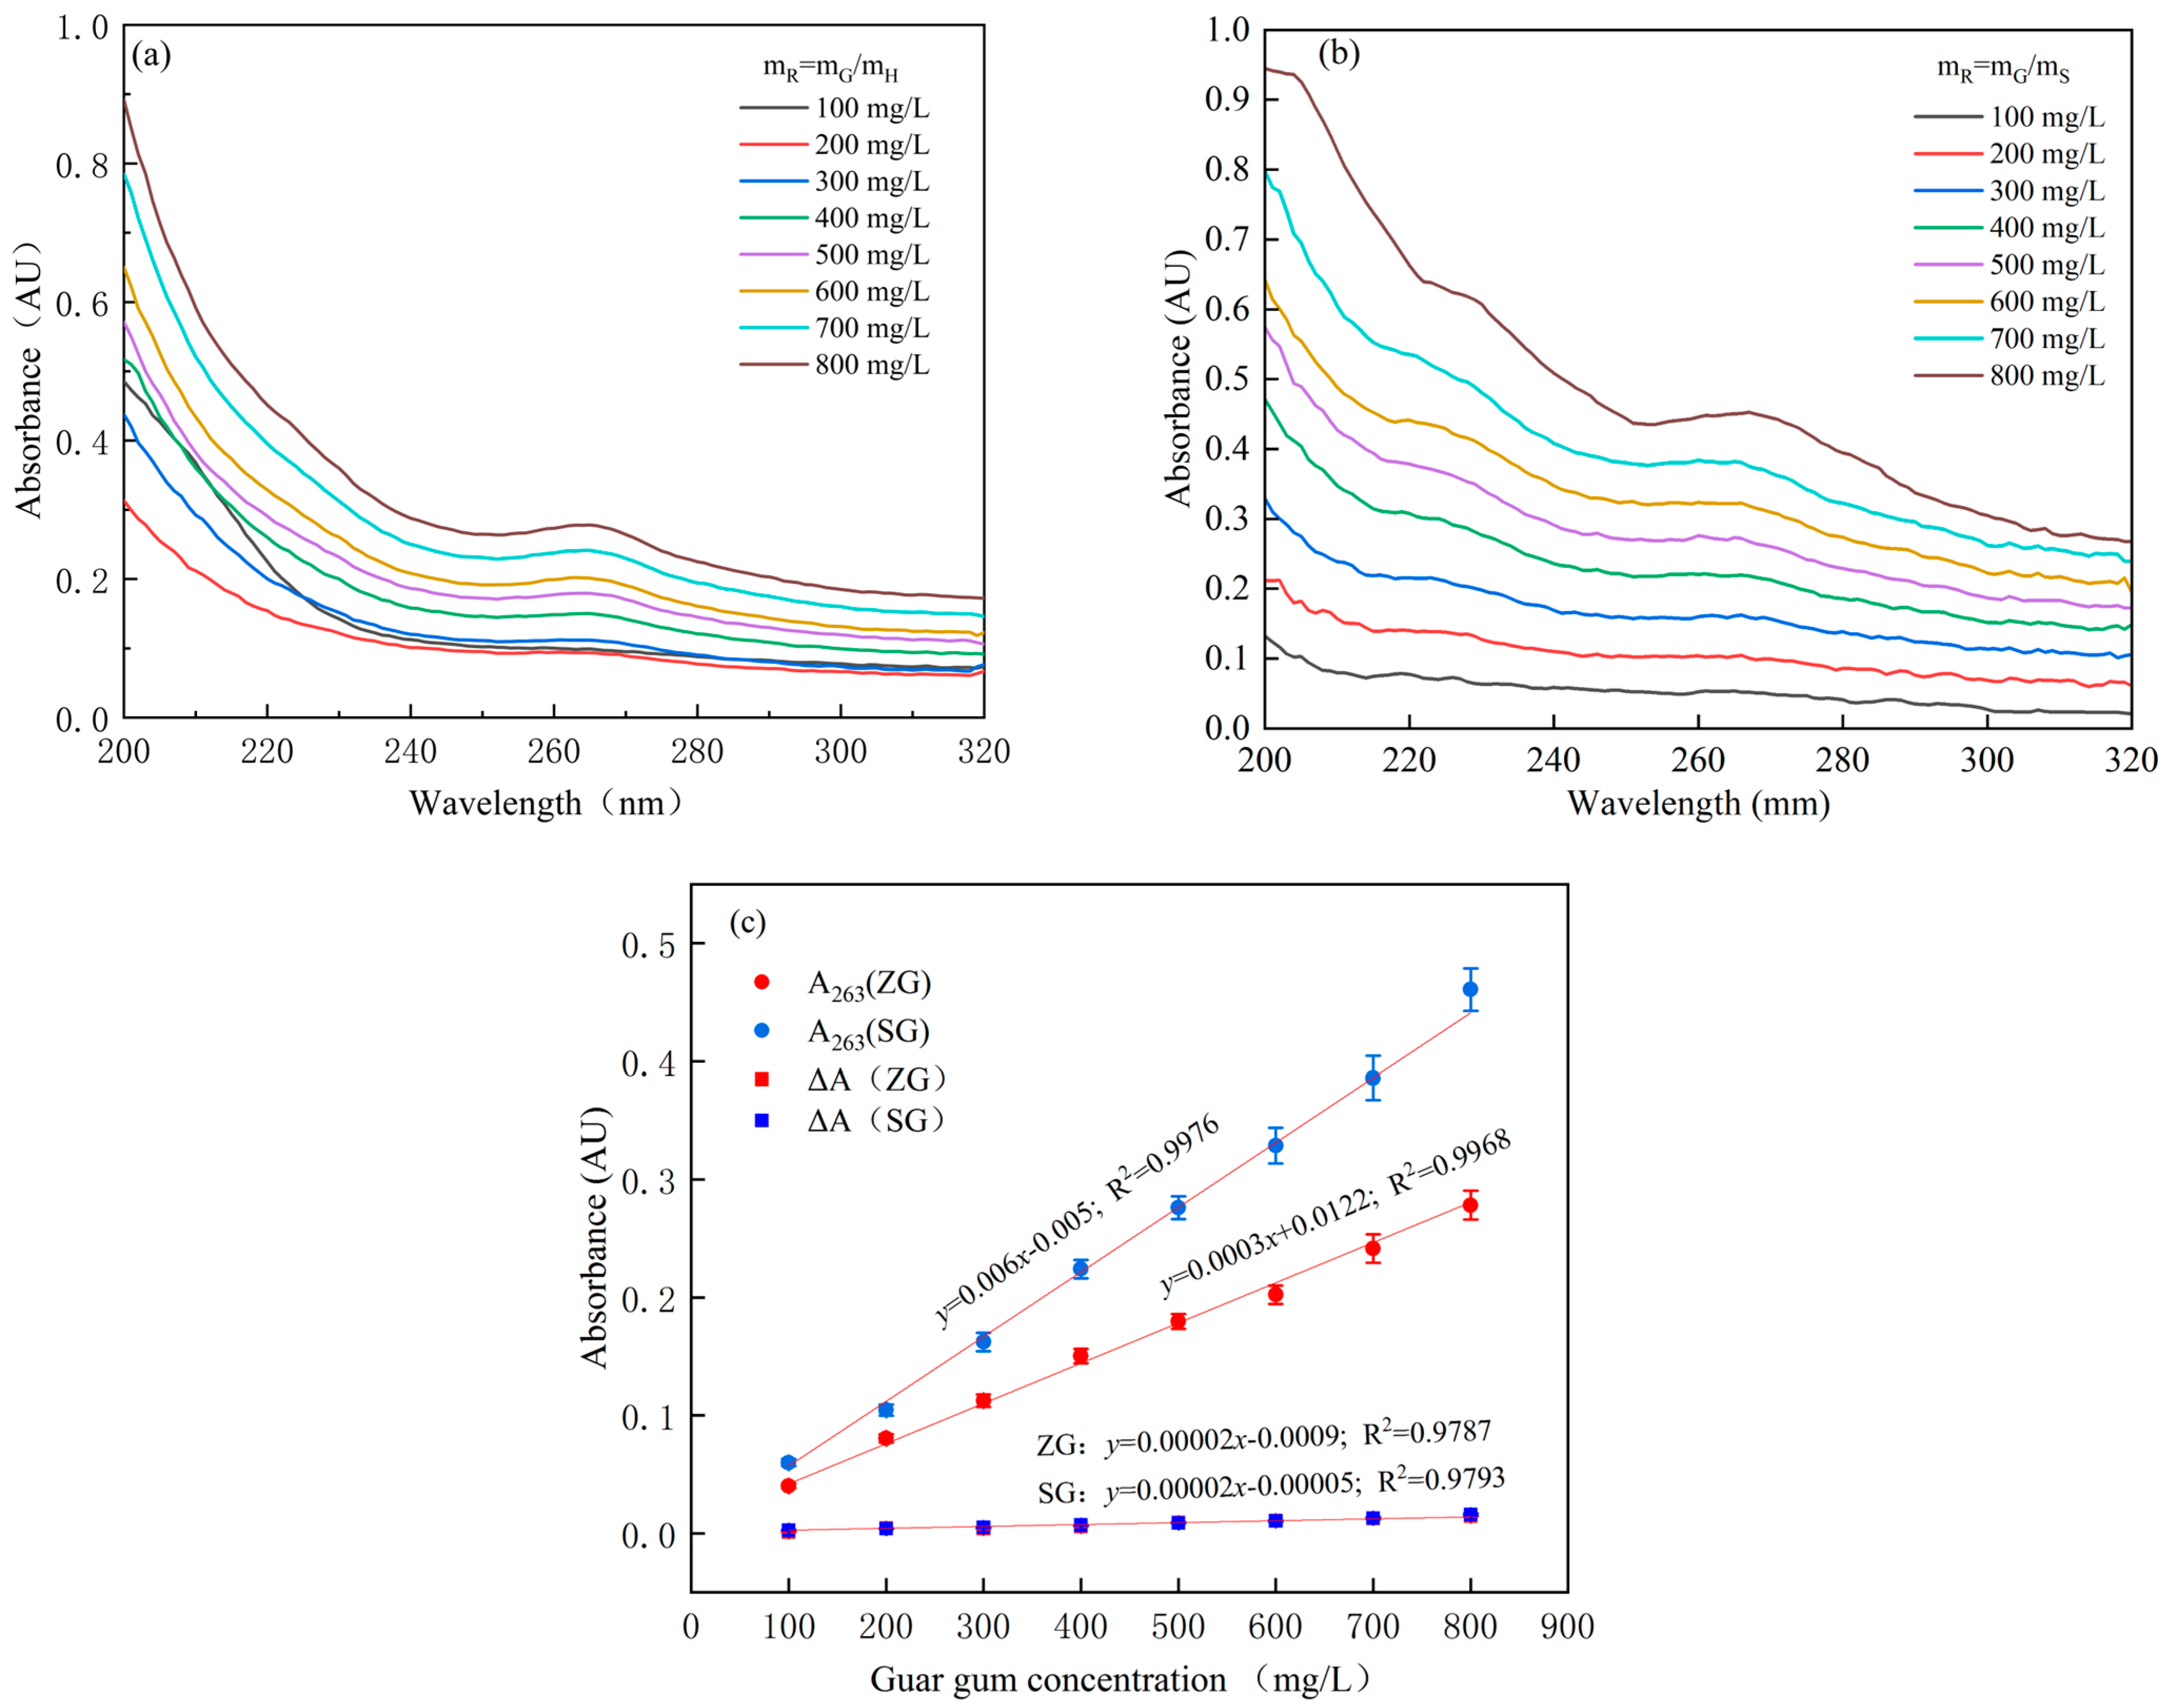
As absorbance changes became negligible beyond 320 nm, the spectral data were analyzed only within the 200–320 nm range. Figure 1a,b present the UV-Vis absorption spectra of guar gum in distilled water and supernatant, respectively. In both solvent systems, a distinct absorption peak appeared near 263 nm, with the peak position remaining constant across concentrations while the absorbance intensity increased with increasing concentration. The absorbance curves decayed monotonically with increasing wavelength, which is attributable to the electronic transitions of lone-pair electrons on the oxygen atoms of hydroxyl and glycosidic groups in the guar gum molecular chain; as the wavelength increases, the transition energy decreases, and the molecular UV absorption capacity correspondingly diminishes [16]. Notably, natural guar gum does not contain carbonyl groups or C=C double bonds in its molecular structure; however, the formation of such unsaturated groups, potentially induced by oxidative degradation or processing history, accounts for the characteristic absorption near 263 nm [22]. Therefore, this absorption peak serves as a reliable spectroscopic signature for the presence of guar gum.
Figure 1.
UV-Vis absorption spectra and calibration curves of guar gum: (a) in distilled water (ZG: in distilled water); (b) in supernatant (SG: in supernatant); (c) linear fitting of absorbance versus concentration at 263 nm.
To examine the effect of solvent matrix on the UV-Vis absorption spectra, calibration curves of absorbance versus guar gum concentration in different solvent systems were constructed using both A263 and ΔA methods (Figure 1c). Comparison of the two methods reveals that the A263 method exhibits superior applicability. Under the A263 method, absorbance in both distilled water (ZG) and supernatant (SG) systems showed a strong linear correlation with guar gum concentration (R2 > 0.99), with slightly better linearity in the ZG system. Under the ΔA method, the linearity was somewhat lower but still maintained determination coefficients (R2) above 0.97. Thus, both the A263 and ΔA methods are effective in relatively simple solutions.
3.2. Interference Factors Affecting Guar Gum Concentration Determination
3.2.1. Effect of pH
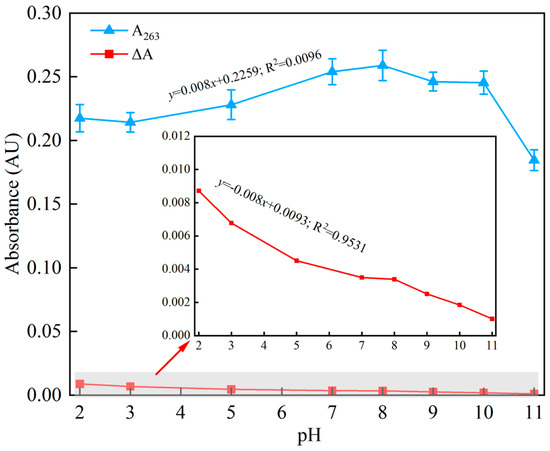
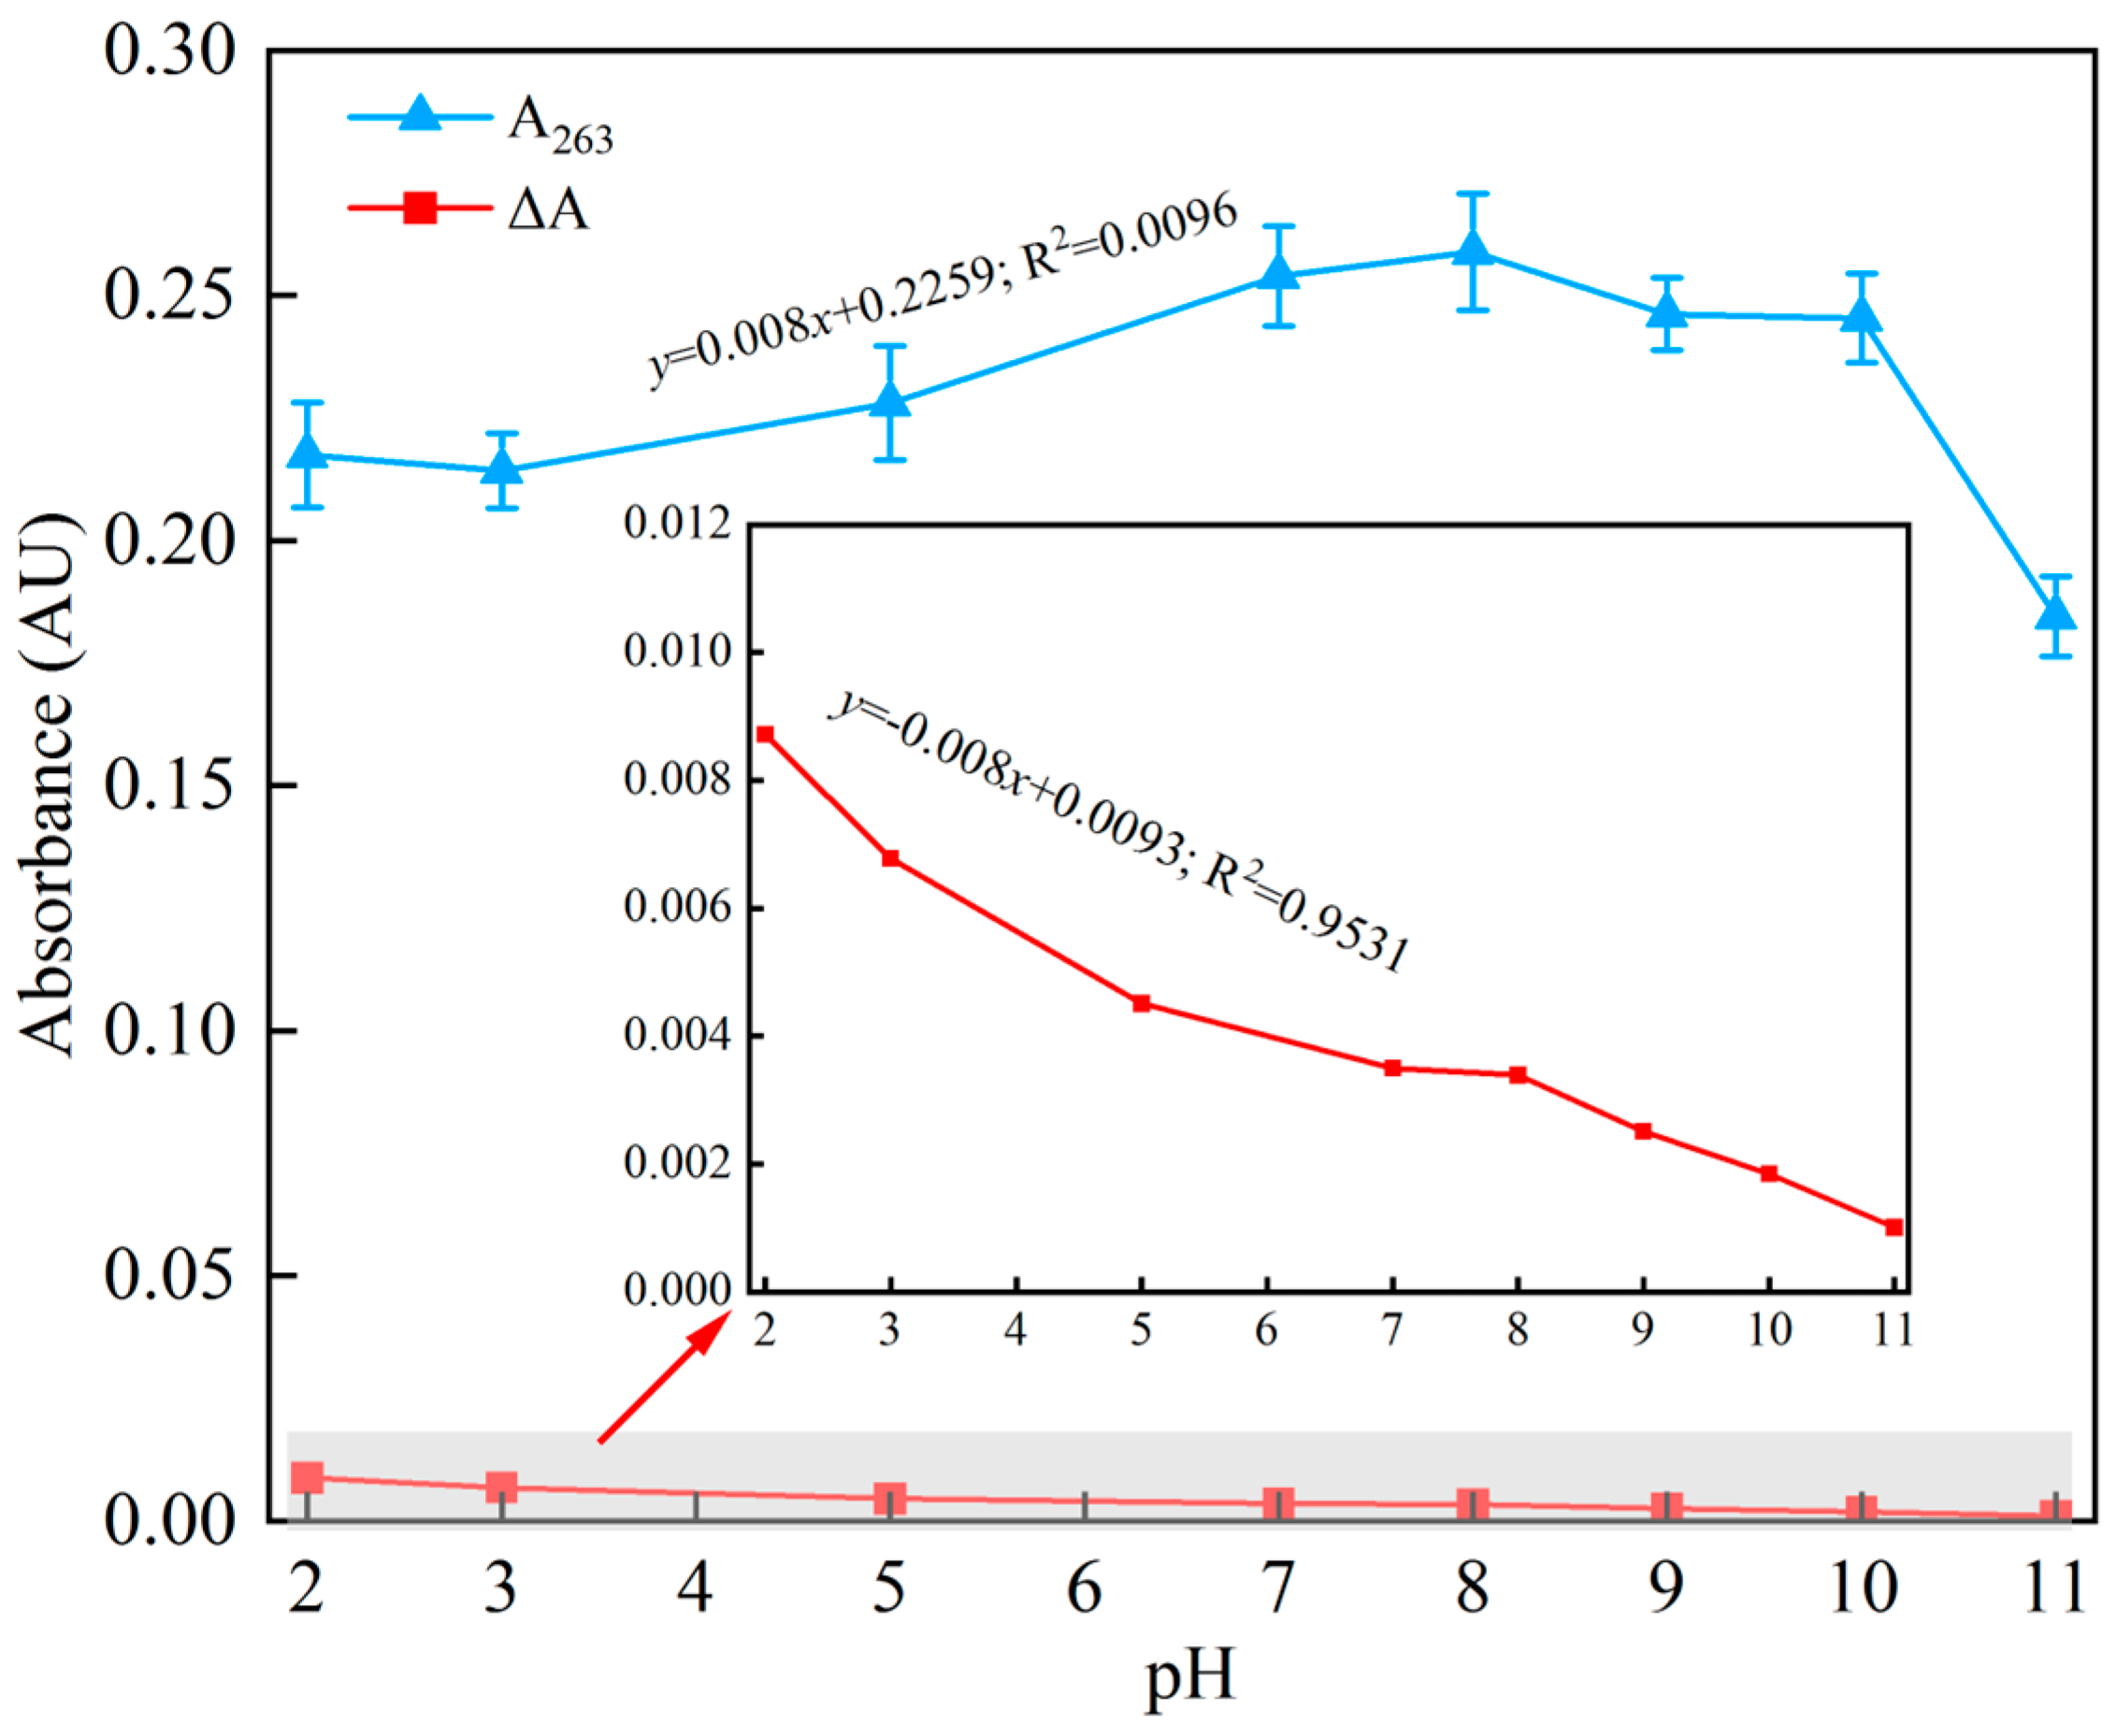
Figure 2 shows the variations in A263 and ΔA of guar gum solutions as a function of pH. The pH value exerted a pronounced influence on the absorbance of guar gum, exhibiting an overall trend of initial increase followed by decrease. When pH increased from 2.0 to 3.0, the absorbance slightly decreased from 0.2174 AU to 0.2143 AU; with further pH increase, the absorbance reached a maximum of 0.2589 AU at pH 8.0. When pH was further raised to 11.0, the absorbance slightly decreased. The maximum fluctuation of A263 over the pH range of 2.0 to 11.0 was 41.08%, indicating that the UV absorption properties of guar gum are sensitive to pH variations, with alkaline conditions exerting a significantly stronger influence than acidic conditions. The pH dependence of ΔA followed a distinctly different pattern from A263. ΔA decreased continuously from 0.0087 AU at pH 2.0 to 0.0010 AU at pH 11.0, exhibiting a strong linear correlation with pH over the entire tested range (R2 > 0.95).
Figure 2.
Effect of pH on the absorbance of guar gum solution (guar gum concentration: 500 mg/L).
These differences are attributed to the distinct response mechanisms of A263 and ΔA to conformational changes in the polymer chains. Guar gum molecules contain abundant oxygen-containing functional groups, including hydroxyl (-OH) and ether (C-O-C) linkages. According to the Flory-Huggins interaction parameter χ theory, pH variations modulate the χ value by altering the polymer-solvent interaction energy, thereby affecting the polymer chain conformation [23]. In the present data, the absorbance exhibited a monotonic increasing trend within pH 3.0–8.0, indicating that with increasing pH, hydrogen bonding gradually recovers, electrostatic repulsion intensifies, χ decreases, water becomes a good solvent, and the molecular chain transitions from a coiled aggregation state to an extended conformation [24], accompanied by increased absorbance. The absorbance remained nearly constant in the pH 2.0–3.0 range, while the increase accelerated in pH 3.0–8.0, reflecting the progressive uncoiling of the molecular chains. When pH exceeded 8.0, the absorbance started to decline, with a particularly pronounced decrease in the pH 10.0–11.0 range. This phenomenon is attributable to the fact that under strongly alkaline conditions (pH > 8), partial ionization of hydroxyl groups on the guar gum chains occurs; although this increases the segmental charge, excessively high pH may lead to excessive disruption of intra- and intermolecular hydrogen-bonding networks. Simultaneously, alkali-induced chain degradation or conformational rearrangement becomes dominant, causing χ to increase again, reducing polymer–solvent affinity and consequently attenuating absorbance [24,25].
To further quantify the driving efficiency of pH on the conformational transition of guar gum chains, we introduce a conformational response coefficient (ηpH), defined as the first derivative of absorbance with respect to pH (dA/dpH), representing the change in absorbance per unit pH variation. The calculations show that in the pH 2.0–3.0 interval, ηpH was −0.0031 AU/pH (negative values indicate absorbance attenuation due to chain coiling); in the pH 3.0–8.0 interval, ηpH steeply increased to +0.0089 AU/pH; and in the pH 8.0–11.0 interval, ηpH turned negative again (average approximately −0.02513 AU/pH), indicating that excessively strong alkalinity instead induces conformational collapse or degradation. This marked difference suggests that weakly alkaline conditions (pH ≈ 8) represent the critical point of conformational transition. According to Flory-Huggins lattice theory, the fundamental driving force for polymer solubility stems from the competition between mixing enthalpy (ΔHmix) and mixing entropy (ΔSmix). In the present system, the absorbance increased by 19.09% (0.2174 → 0.2589) in the pH 3.0–8.0 range, while it decreased by 41.08% (0.2589 → 0.1835) in the pH 8.0–11.0 range, reflecting that the χ parameter does not vary monotonically over a wide pH range but rather reverses at the alkaline end. Accordingly, the conformational response of guar gum to pH exhibits an asymmetric sensitive region characterized by “initial extension followed by contraction,” with the peak response located near pH 8.0.
3.2.2. Effect of Salt Concentration
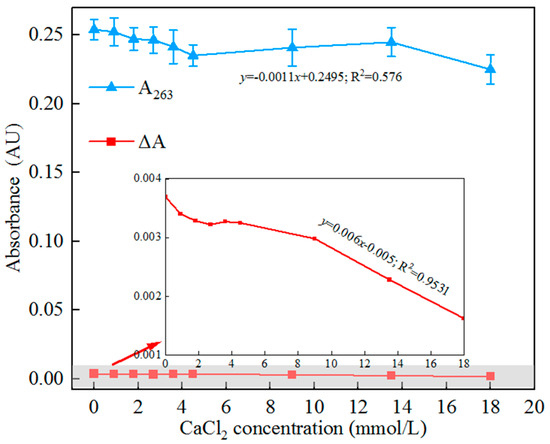
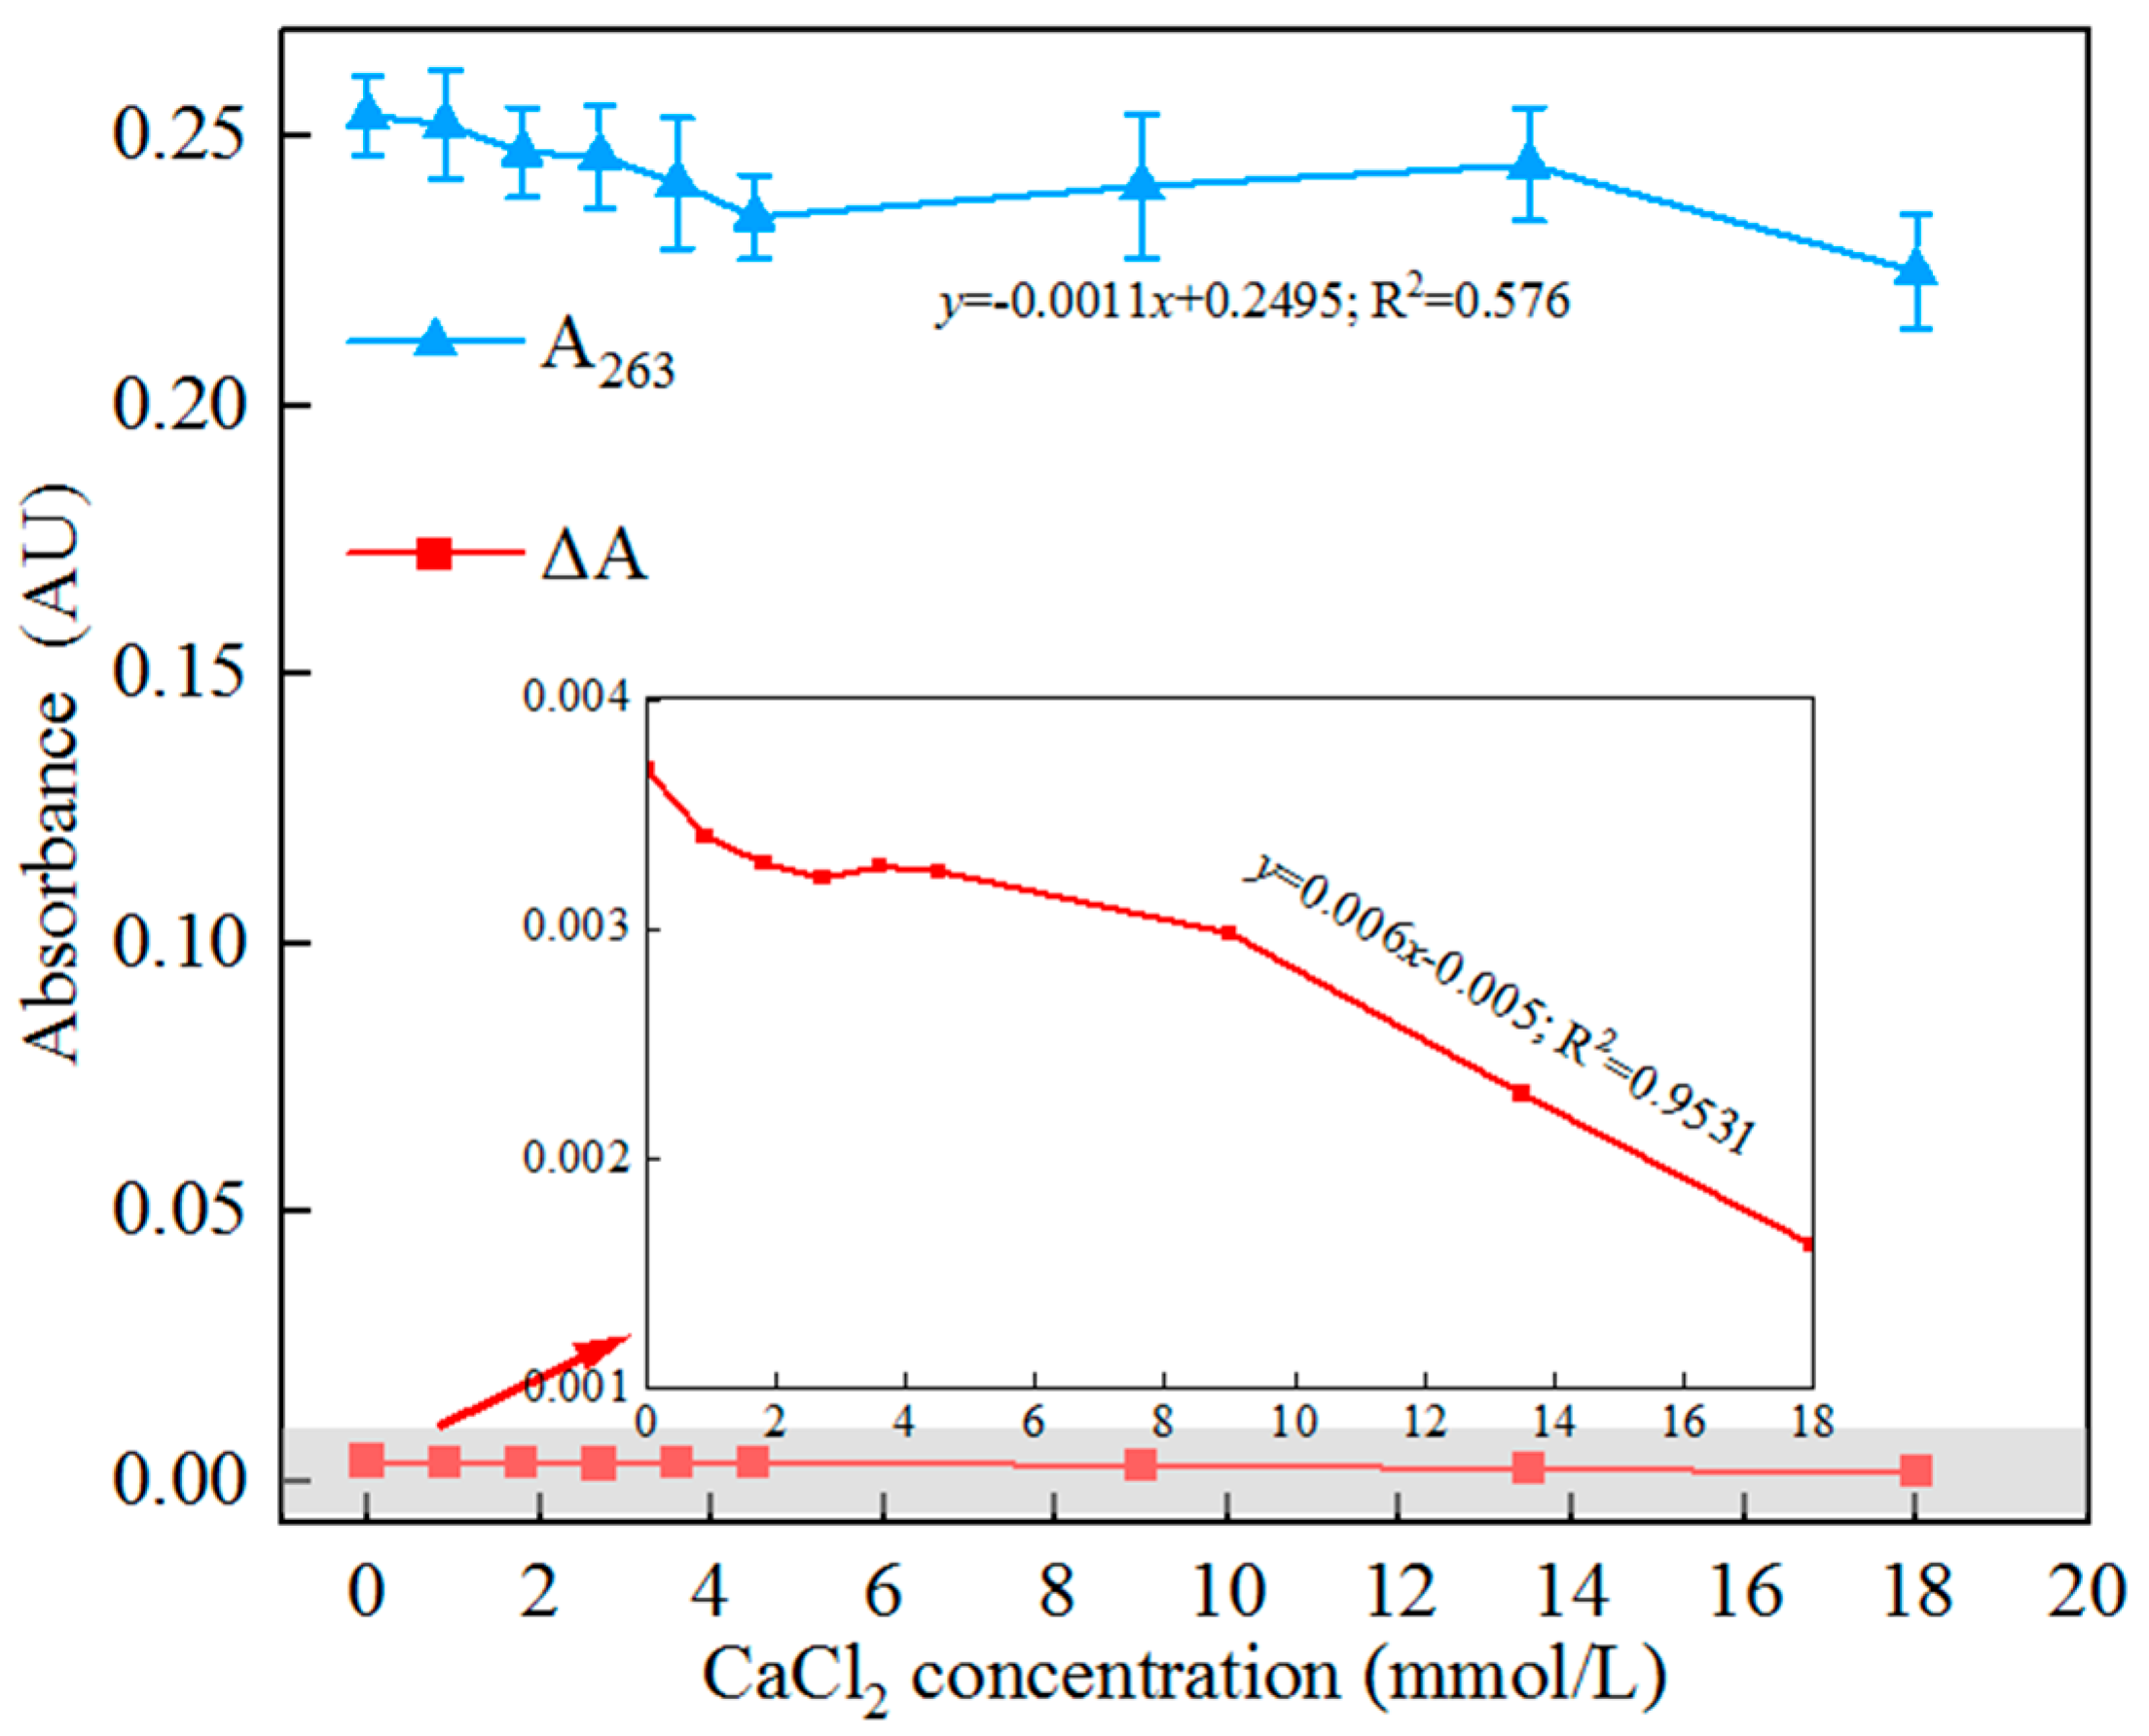
Figure 3 presents the variations in guar gum solution absorbance as a function of CaCl2 concentration. The absorbance exhibited a non-monotonic biphasic behavior with increasing CaCl2 concentration. In the low-concentration range (0.0–4.5 mmol/L), A263 slightly decreased from 0.2539 AU to 0.2350 AU; when the concentration increased to 13.5 mmol/L, A263 rose to 0.2447 AU. However, upon further increase to 18.0 mmol/L, the absorbance significantly decreased to 0.2250 AU. The response of ΔA to salt concentration differed markedly from the A263 trend. In the low-salt range of 0–18 mmol/L, ΔA remained relatively stable between 0.00369 and 0.00162 AU, showing a basically linear correlation with CaCl2 concentration (R2 > 0.94), indicating that the differential absorbance effectively cancels scattering background interference.
Figure 3.
Effect of CaCl2 concentration on the absorbance of guar gum solution (guar gum concentration: 500 mg/L).
This nonlinear behavior originates from Ca2+-induced conformational transitions and aggregation of guar gum molecules. According to the Schultze–Hardy rule, the compression efficiency of high-valence counterions (Ca2+) on the polymer hydration layer is proportional to the sixth power of their valence [26,27]. Under low-salt conditions (≤4.5 mmol/L), compression of the electrostatic double layer surrounding the polymer chains by Ca2+ promotes limited chain coiling; concurrently, Ca2+ may coordinate with the hydroxyl or ether oxygen atoms of guar gum, weakening the polymer-water hydrogen-bonding network and altering the local microenvironment of the chromophores, leading to decreased absorbance. This stage is dominated by intramolecular contraction without the formation of notable scattering centers. As the salt concentration increases (4.5–13.5 mmol/L), the strong hydration effect of Ca2+ begins to significantly deplete the hydration layer around the molecular chains, enhancing intermolecular hydrophobic interactions and gradually forming sub-microscopic aggregates. The Tyndall scattering effect of these aggregates significantly increases the absorbance; this increase no longer simply reflects the concentration of dissolved guar gum but represents a combined optical contribution from coexisting dissolved and aggregated species. When the CaCl2 concentration reaches 18 mmol/L, excessive Ca2+ exacerbates intermolecular crosslinking and aggregation, forming large precipitates that reduce the number of effective scattering particles (or induce sedimentation); simultaneously, the precipitates may adsorb some chromophores, causing a decrease in supernatant absorbance.
Given the aforementioned scattering interference, the present method has clear applicability boundaries. Segmental analysis indicates that when the CaCl2 concentration exceeds 4.5 mmol/L, A263 no longer satisfies the monotonic correspondence with the true dissolved-phase guar gum concentration required by the Beer-Lambert law; 4.5 mmol/L thus represents the turning point where scattering begins to intervene significantly. Therefore, when employing UV-Vis spectrophotometry for guar gum determination in high-salinity systems (≥4.5 mmol/L CaCl2), the results should be interpreted with caution and should not be directly used for quantitative purposes without correction.
3.2.3. Synergistic Strategy and Applicability Boundaries of the Dual-Mode Approach
The comparative analysis presented in Section 3.2.1 and Section 3.2.2 reveals distinct response patterns for the A263 and ΔA methods under pH and salt concentration variations. These differences are attributed to the distinct response mechanisms of A263 and ΔA to conformational changes. It is important to note, however, that while ΔA effectively cancels the slowly varying scattering background through differential calculation, its magnitude itself exhibits a systematic dependence on pH and CaCl2 concentration (Figure 2 and Figure 3). This dependence does not indicate that interference has been eliminated; rather, it demonstrates that ΔA responds differently from A263, but still responds systematically to changes in solution chemistry. Therefore, the ΔA method should be regarded as providing a semi-quantitative indicator that is less affected by scattering artifacts than single-wavelength absorbance, rather than as an interference-free quantitative method.
Based on the systematic comparison of the two methods under pH and salt concentration interference in Section 3.2.1 and Section 3.2.2, the observational signal responses of the two methods are summarized qualitatively in Table 3. It should be emphasized that these assessments were obtained at a single guar gum concentration (500 mg/L) and thus represent relative signal trends rather than validated quantitative boundaries. The proposed ranges reflect the conditions under which the absorbance remained monotonic and interpretable in the present experimental setup; they do not constitute validated limits of quantitative linearity, accuracy, or precision. Future work using full calibration curves at multiple concentration levels is required to validate the quantitative applicability of the two methods across these ranges.
Table 3.
Qualitative signal response of A263 and ΔA methods under varying pH and CaCl2 conditions (observational assessment).
The comparative analysis reveals that while both methods provide interpretable signals under acidic to neutral and low-salt conditions, the A263 method is recommended as the primary quantitative tool because the ΔA values are extremely small (generally < 0.005 AU) and the procedure requires precise identification of the trough absorbance, making it operationally more complex than the A263 method. For high-salinity (CaCl2 ≥ 4.5 mmol/L) or strongly alkaline (pH ≥ 8) conditions, the A263 method no longer satisfies the monotonic concentration-response relationship required by the Beer-Lambert law. In these challenging matrices, the ΔA method may serve as a semi-quantitative indicator, as its differential signal cancels slowly varying scattering backgrounds and maintains a monotonic relationship with concentration variations, although its accuracy and precision remain dependent on the specific matrix conditions. The applicability boundaries defined in Table 3 reflect observational signal responses at a single guar gum concentration (500 mg/L) and should not be interpreted as validated quantitative limits.
3.3. Relationship Between Residual Guar Gum Concentration and Sludge Flocculation–Sedimentation Characteristics
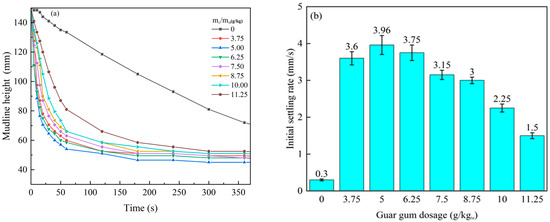
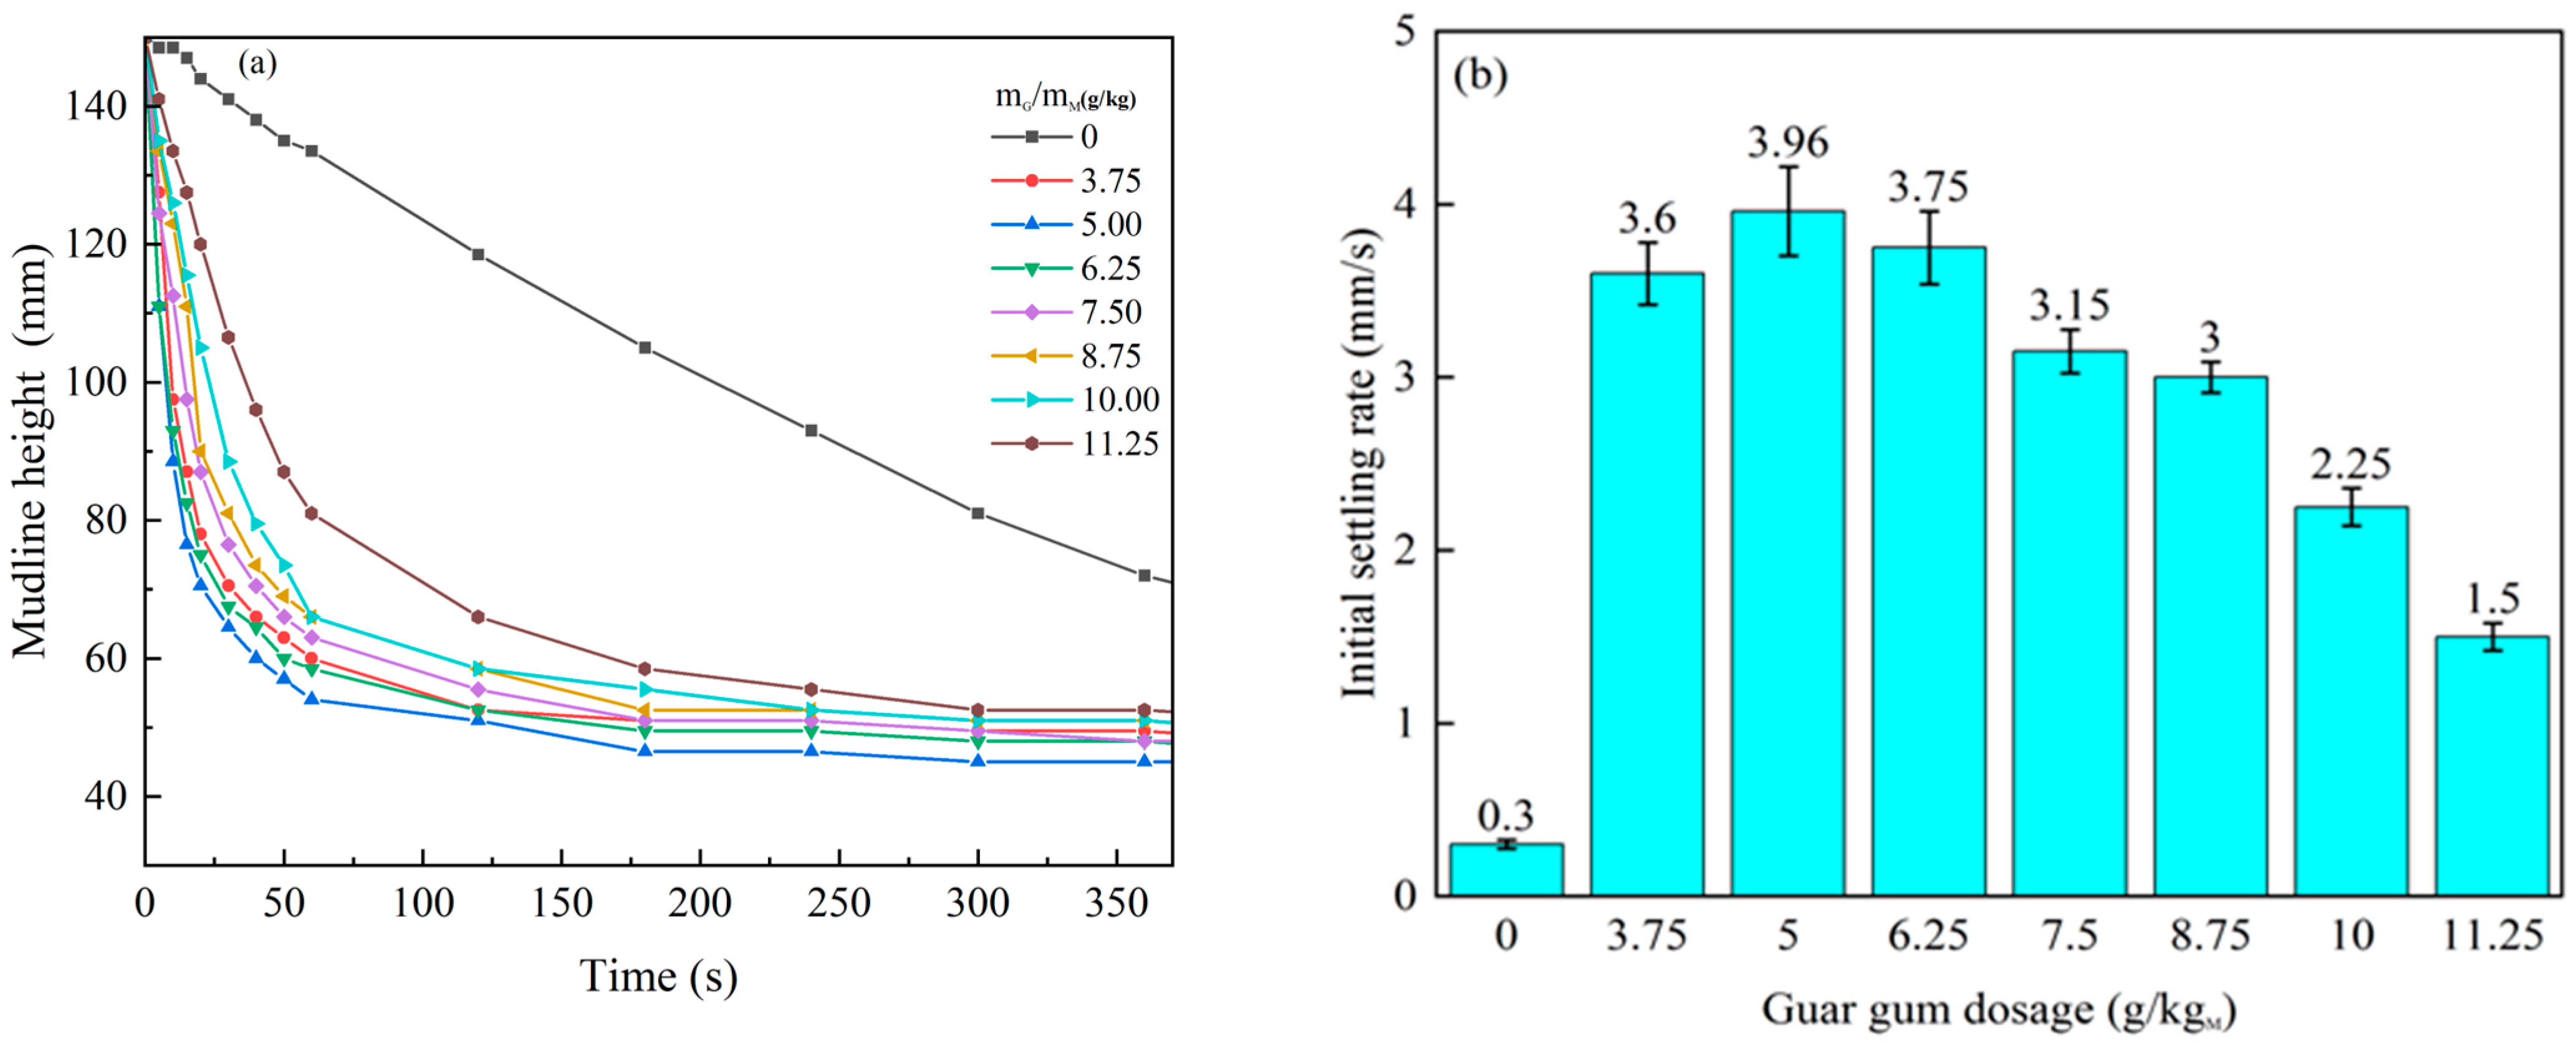
Figure 4a shows the mudline height as a function of time at different dosages, and Figure 4b presents the initial settling rate calculated from the initial linear slope in Figure 4a as a function of dosage. The results demonstrate that guar gum addition significantly promotes the flocculation–sedimentation of slurry particles. As the guar gum dosage increased from 0 to 5.0 g/kg dry slurry, the mudline descent rate continuously accelerated, and the initial settling rate increased from 0.30 mm/s to 3.96 mm/s; with further dosage increase, the initial settling rate gradually decreased, indicating that the slurry settling performance exhibited a trend of initial enhancement followed by deterioration. Based on the combined analysis of the mudline interface evolution and initial settling rate data, the optimum guar gum dosage was determined to be 5.0 g/kg dry slurry, at which the slurry exhibited the best flocculation–sedimentation performance.
Figure 4.
Flocculation settling performance of bauxite slurry at different guar gum dosages: (a) mudline height versus time; (b) initial settling rate versus dosage.
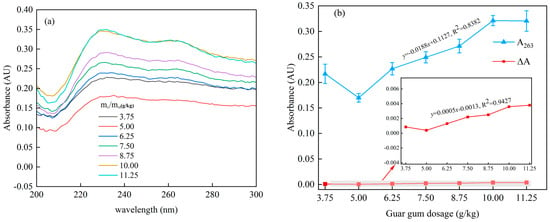
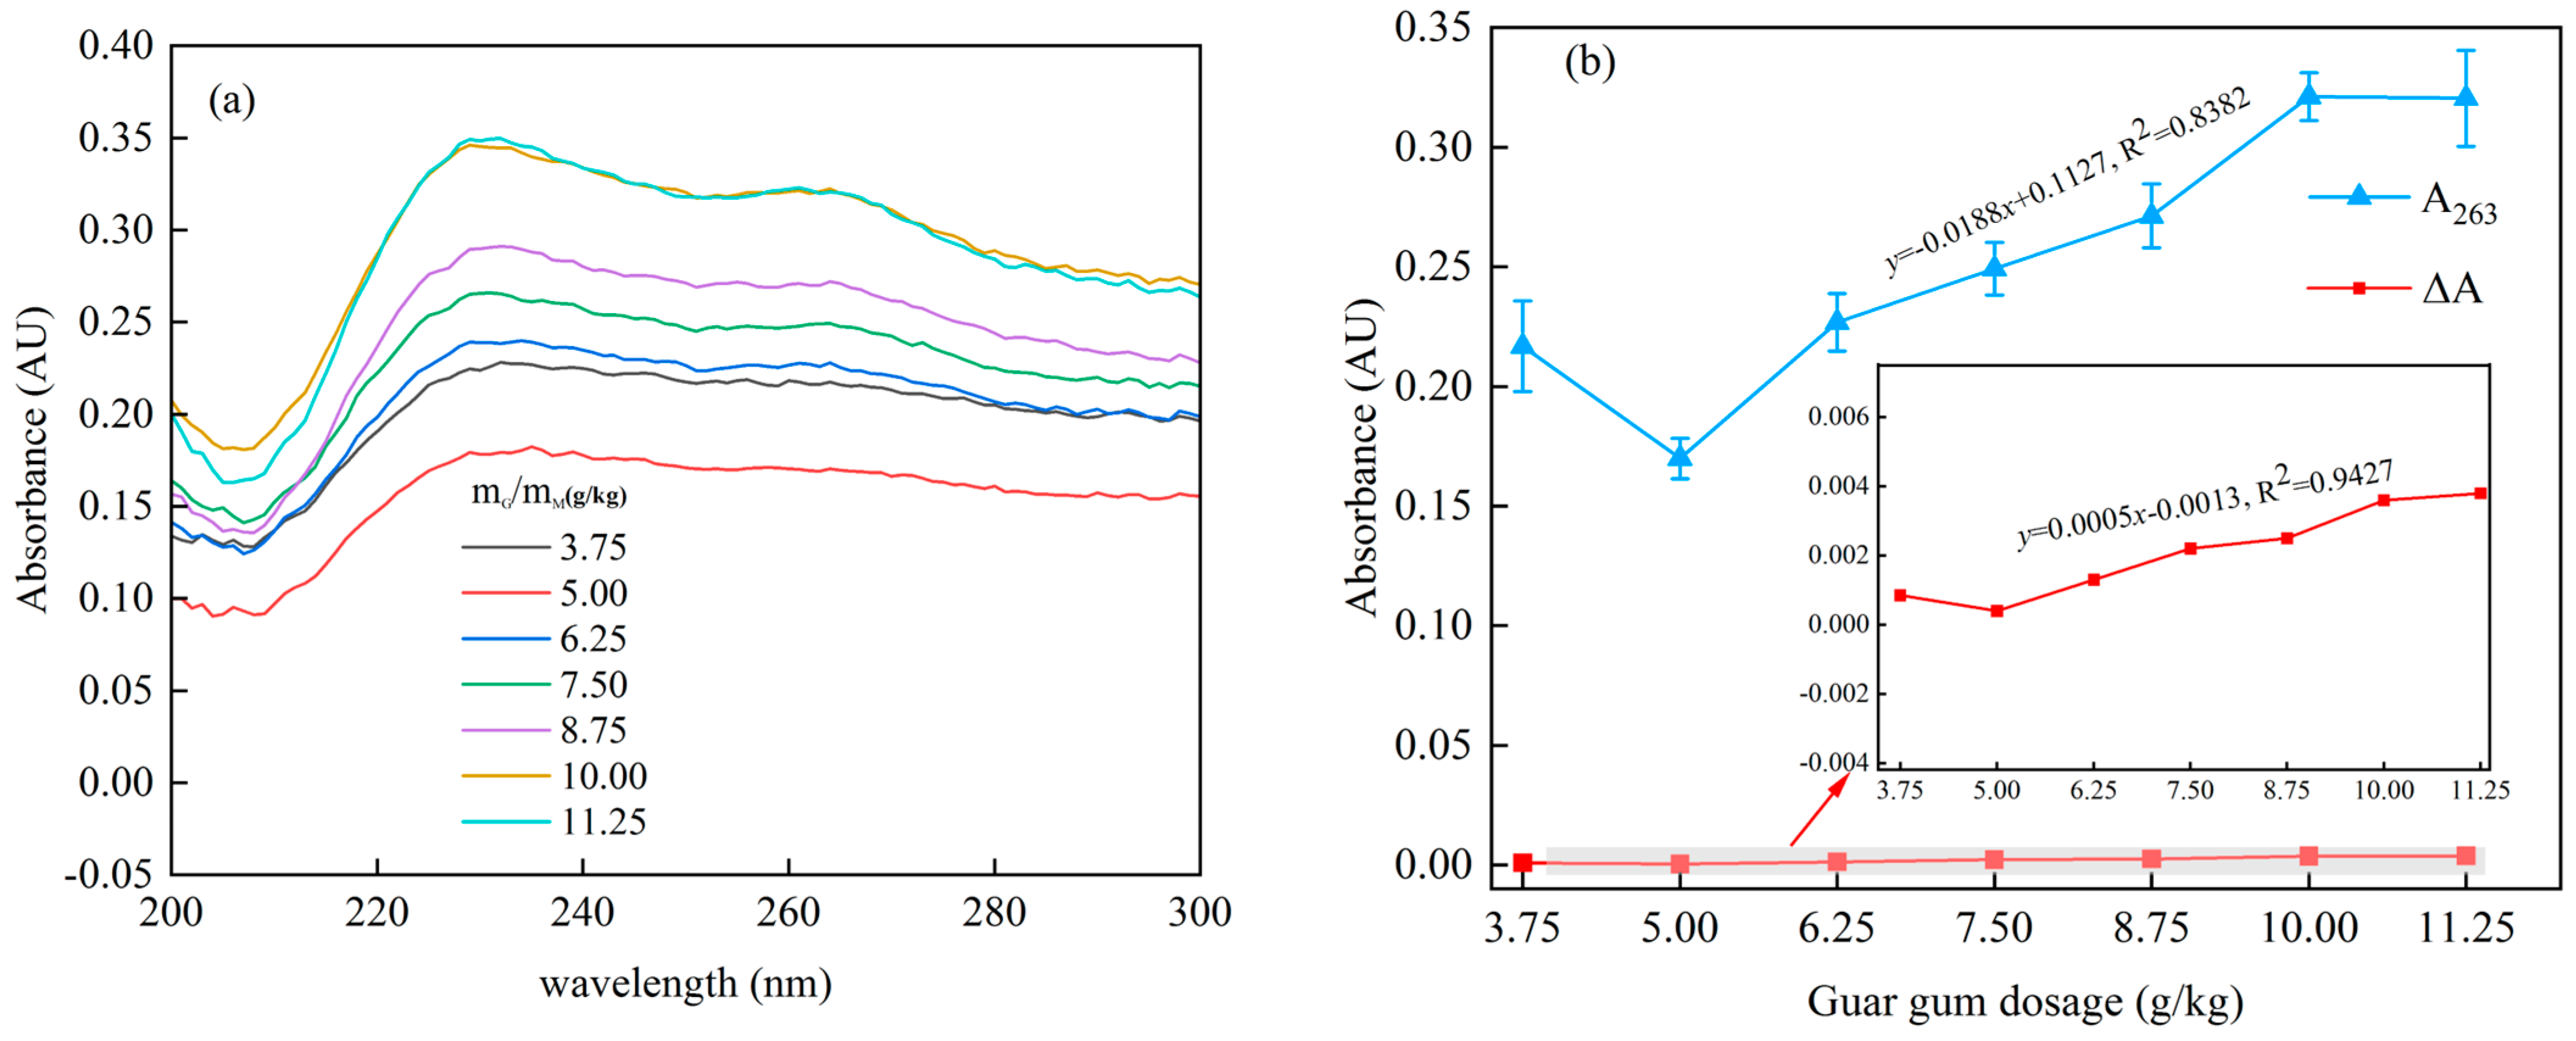
To further analyze the utilization efficiency of guar gum during flocculation, supernatant was collected after sedimentation equilibrium for absorbance measurement, and the results are shown in Figure 5. Figure 5a presents the UV-Vis absorption spectra of supernatants at different guar gum dosages; all spectra exhibit the characteristic absorption peak of guar gum near 263 nm, and the peak intensity shows a non-monotonic trend of initial decrease followed by increase with increasing dosage. Figure 5b shows the residual guar gum concentrations determined by both the A263 and ΔA methods as a function of dosage. The trends obtained by the two methods are highly consistent: as the dosage increased from 3.75 g/kg to 5.0 g/kg, the residual concentrations determined by both methods decreased to their respective minimum values, indicating the highest adsorption utilization efficiency of guar gum at this dosage; upon further increasing the dosage from 6.25 to 11.25 g/kg, the residual concentrations increased continuously. The good consistency and small relative deviations between the two methods across the entire dosage range indicate that within the applicability boundaries defined under laboratory conditions (pH ≈ 7.1, extremely low ionic strength) of the sedimentation supernatant in this study, both the A263 and ΔA methods can effectively quantify residual guar gum concentrations, and the quantitative results from the ΔA method, after background scattering correction, corroborate those from the A263 method.
Figure 5.
UV−Vis absorption spectra of supernatants at different guar gum dosages: (a) spectral curves; (b) residual concentration versus dosage determined by the two methods.
The “initial decrease followed by increase” trend of residual concentration with dosage, exhibiting a pronounced mirror-image correlation with the “initial increase followed by decrease” trend of the settling rate shown in Figure 4b (R2 > 0.95), confirms the “excessive bridging-surface saturation-tail repulsion” restabilization mechanism: excess guar gum molecules that fail to adsorb onto particle surfaces remain as free chains in the liquid phase, and their increased hydrodynamic volume elevates the liquid-phase viscosity, exerting a drag force on settling flocs and thus impeding mudline descent. Therefore, the residual concentration serves not only as a measure of flocculant consumption but also as a direct indicator of the resistance to solid–liquid separation. At the optimum dosage, the proportion of guar gum participating in particle bridging is highest, the flocculant utilization efficiency is maximized, and the flocculation performance is optimal.
Furthermore, the supernatant at the optimum dosage exhibited a pH of approximately 7.1 and a measured electrical conductivity of 0.1102–0.1152 ms/cm (25 °C, n = 3), confirming its low ionic strength and placing it within the low-salinity applicability boundaries (<4.5 mmol/L CaCl2) validated in our interference tests (Figure 2 and Figure 3, Table 3).
Despite the promising results, some limitations should be acknowledged. The proposed dual-mode strategy was validated only at a laboratory solids concentration of 7.8%, and the supernatant matrix after sedimentation exhibited pH ≈ 7.1 with low ionic strength. When the initial slurry concentration exceeds 7.8%, or the salt concentration surpasses 18 mmol/L CaCl2, the spectral interferences may become more severe, and the applicability boundaries defined here may not be directly transferable. Further studies are needed to evaluate the method’s performance under higher turbidity, higher salinity, and continuous flow conditions prior to field implementation. In addition, comprehensive analytical validation parameters—including recovery rates, limits of detection (LOD), and limits of quantification (LOQ)—were not evaluated in the present work, and we have therefore avoided overgeneralized claims of “quantification under the specific conditions tested” beyond the specific conditions tested. These validation aspects will be addressed in future studies prior to practical application.
A further limitation concerns the interpretation of the ΔA method’s interference response. Although ΔA cancels slowly varying scattering backgrounds through differential calculation, its magnitude shows a systematic dependence on pH and CaCl2 concentration, which does not indicate that interference has been eliminated but rather that it has been transformed into a systematic signal trend. Consequently, the ΔA method should be regarded as a semi-quantitative indicator under high-salinity or strongly alkaline conditions, rather than a fully interference-free quantitative method. Full concentration-dependent calibrations at representative pH and salinity conditions are required to further validate the quantitative utility of the ΔA method, and this constitutes an important direction for future research.
4. Conclusions
Based on UV-Vis spectrophotometry, this study systematically investigated the influence of guar gum on supernatant absorbance in bauxite slurry systems, established the quantitative relationship between guar gum concentration and absorbance, and analyzed the mechanisms underlying the effects of pH and salt concentration on the optical response of the system. The following conclusions are drawn:
(1) A quantitative UV-Vis method for determining residual guar gum concentration in bauxite slurry supernatant was established. The A263 method exhibited good linearity (R2 > 0.99) over the concentration range of 100–800 mg/L. The calibration curves in distilled water and supernatant solvents showed essentially consistent response characteristics, indicating that the method possesses good matrix adaptability for actual slurry supernatant.
(2) The A263 and ΔA methods exhibited complementary characteristics in their interference responses. The ΔA method provided more stable signal trends than the A263 method over a wide pH range (2.0–11.0) and high salt concentrations (up to 18 mmol/L CaCl2). However, its absolute signal magnitude systematically depended on both pH and salt concentration, indicating that the interference was not eliminated but rather transformed into a systematic bias. Therefore, the ΔA method is better characterized as a semi-quantitative indicator suitable for high-salinity or strongly alkaline matrices where the A263 method fails, rather than as a universal quantitative approach. For accurate quantification, the A263 method remains the preferred choice under conditions where the Beer-Lambert law is satisfied (pH 3.0–8.0, CaCl2 < 4.5 mmol/L). The semi-quantitative utility of the ΔA method should be further validated through full concentration-dependent calibration curves at representative pH and salinity conditions.
(3) Flocculation–sedimentation tests showed that the optimum guar gum dosage was 5.0 g/kg dry slurry, at which the initial settling rate reached 3.96 mm/s and the supernatant residual concentration was the lowest among all dosed groups. The pronounced negative correlation between residual concentration and settling rate (R2 > 0.95) confirmed the “excessive bridging-surface saturation-tail repulsion” restabilization mechanism. The supernatant after sedimentation (pH ≈ 7.1; measured electrical conductivity: 0.1102–0.1152 ms/cm, indicating low ionic strength) fell entirely within the applicability boundaries defined under laboratory conditions, further supporting the feasibility of the spectrophotometric method in practical engineering scenarios.
(4) The dual-mode detection strategy developed in this study provides a new approach for rapid quantification of residual organics in turbid, pH-variable, and saline slurry systems. It should be noted, however, that when the slurry concentration exceeds 7.8%, or the salt concentration exceeds 18 mmol/L, further investigation of the applicability of these two methods is required. Future research may explore coupling this strategy with online spectroscopic sensors to achieve real-time closed-loop control of flocculant dosing.
Author Contributions
S.L.: Conceptualization, Supervision, Project administration, Funding acquisition, Writing—review and editing. M.L.: Investigation, Writing—original draft. J.M.: Conceptualization, Methodology. L.Y.: Resources, Investigation, Conceptualization. All authors have read and agreed to the published version of the manuscript.
Funding
This study was financially supported by the National Natural Science Foundation of China (Grant No. 52268055), the Natural Science Foundation of Guangxi Zhuang Autonomous Region (2023GXNSFBA026269), Guangxi Program of Key Laboratory of Geo-mechanics and Engineering (19-Y-21-3, 21-Y-XT-02).
Data Availability Statement
The original contributions presented in this study are included in the article. Further inquiries can be directed to the corresponding author.
Acknowledgments
We gratefully thank the reviewers for their valuable time and constructive comments.
Conflicts of Interest
The authors declare that they have no known competing financial interest or personal relationships that could have appeared to influence the work reported in this paper.
References
- Peng, Y.; Ou, X.; Chen, X.; Lin, X.; Shen, X. Utilization of discarded bauxite tailings into eco-friendly foamed mixture lightweight soil. J. Clean. Prod. 2022, 333, 130167. [Google Scholar] [CrossRef] [Scilit]
- Liu, X.; Tong, B.; Zhu, H. Strength deterioration of guar gum-modified loess under freeze-thaw environments. J. Chang. River Sci. Res. Inst. 2026, 43, 103–109. [Google Scholar]
- Zhang, H.; Hu, P.; Jiang, J.; Cheng, X.; Wang, J.; Liu, J.; Xiang, P. Distribution, genetic types and current situation of exploration and development of bauxite resources. Geol. China 2021, 48, 68–81. [Google Scholar]
- Peng, Y.; Chen, Z.; Sun, X.; Zhou, Y.; Ou, X. Properties, treatment and resource utilization of bauxite tailings: A review. Sustainability 2024, 16, 6948. [Google Scholar] [CrossRef] [Scilit]
- Li, N.; Fan, Y.; Dong, X.; Ma, X.; Chen, R.; Chang, M.; Xu, G. Synthesis and characterization of a guar gum-based flocculant and its flocculation-dewatering mechanism in coal mine wastewater. Int. J. Biol. Macromol. 2025, 308, 142438. [Google Scholar] [CrossRef] [Scilit]
- Leonhartsberger, S.; Carmona, P.; Seidl, B.; Mann, K.J.; Kozich, M.; Sulaeva, I.; Stanetty, C.; Mihovilovic, M.D. Polysaccharide-based green flocculants: A systematic and comparative study of their coagulation-flocculation efficiency. Carbohydr. Polym. 2025, 358, 123527. [Google Scholar] [CrossRef] [Scilit]
- Sharahi, M.; Bahrami, S.H.; Karimi, A. A comprehensive review on guar gum and its modified biopolymers: Their potential applications in tissue engineering. Carbohydr. Polym. 2025, 347, 122739. [Google Scholar] [CrossRef] [Scilit]
- Su, C.; Rana, N.M.; Zhang, S.; Wang, B. Environmental pollution and human health risk due to tailings storage facilities in China. Sci. Total Environ. 2024, 928, 172437. [Google Scholar] [CrossRef] [Scilit]
- Rahman, T.; Meadows, D.; Zhan, K.; Kumar, H.K.S.; Smith, M.; Davis, V.A.; Beckingham, B.S.; Peng, Y.; Davis, E. Detection, identification, and quantification of polymer additives: A review of techniques, approaches, challenges, and a possible roadmap in analysis. RSC Appl. Polym. 2026, 4, 466–501. [Google Scholar] [CrossRef] [Scilit]
- Okoffo, E.D.; Rauert, C.; Thomas, K.V. Mass quantification of microplastic at wastewater treatment plants by pyrolysis-gas chromatography–mass spectrometry. Sci. Total Environ. 2023, 856, 159251. [Google Scholar] [CrossRef] [Scilit]
- Wöll, D. Fluorescence correlation spectroscopy in polymer science. RSC Adv. 2014, 4, 2447–2465. [Google Scholar] [CrossRef] [Scilit]
- Sainju, D.; Lucas, R.; Le Gresley, A. Evaluation of nuclear magnetic resonance spectroscopy for characterisation and quantitation of water-soluble polymers in river water. Water Res. 2023, 245, 120650. [Google Scholar] [CrossRef] [Scilit]
- Lotfy, S.; Basfar, A.; Moftah, B.; Al-Moussa, A. Comparative study of nuclear magnetic resonance and UV–visible spectroscopy dose-response of polymer gel based on N-(isobutoxymethyl) acrylamide. Nucl. Instrum. Methods Phys. Res. Sect. B Beam Interact. Mater. At. 2017, 413, 42–50. [Google Scholar] [CrossRef] [Scilit]
- Becker, N.; Bennett, D.; Bolto, B.; Dixon, D.; Eldridge, R.; Le, N.; Rye, C. Detection of polyelectrolytes at trace levels in water by fluorescent tagging. React. Funct. Polym. 2004, 60, 183–193. [Google Scholar] [CrossRef] [Scilit]
- Salam, A.M.; Örmeci, B.; Simms, P.H. Determination of optimum polymer dosage for dewatering of oil sands tailings using torque rheology. J. Pet. Sci. Eng. 2021, 197, 107986. [Google Scholar] [CrossRef] [Scilit]
- Gibbons, M.K.; Örmeci, B. Quantification of polymer concentration in water using UV-Vis spectroscopy. J. Water Supply Res. Technol.—AQUA 2013, 62, 205–213. [Google Scholar] [CrossRef] [Scilit]
- Salam, A.M.; Örmeci, B.; Simms, P.H. Determination of the optimum polymer dose for dewatering of oil sands tailings using UV–vis spectrophotometry. J. Pet. Sci. Eng. 2016, 147, 68–76. [Google Scholar] [CrossRef] [Scilit]
- Wang, C.; Harbottle, D.; Liu, Q.; Xu, Z. Current state of fine mineral tailings treatment: A critical review on theory and practice. Chin. J. Geotech. Eng. 2014, 36, 113–131. [Google Scholar] [CrossRef] [Scilit]
- Cerda, V.; Phansi, P.; Ferreira, S. From mono- to multicomponent methods in UV-VIS spectrophotometric and fluorimetric quantitative analysis—A review. Trends Anal. Chem. 2022, 157, 116772. [Google Scholar] [CrossRef] [Scilit]
- Ministry of Housing and Urban-Rural Development of the People’s Republic of China. GB/T 50123–2019 Standard for Geotechnical Testing Method; China Planning Press: Beijing, China, 2019. [Google Scholar]
- Dwari, R.K.; Mishra, B.K. Evaluation of flocculation characteristics of kaolinite dispersion system using guar gum: A green flocculant. Int. J. Min. Sci. Technol. 2019, 29, 745–755. [Google Scholar] [CrossRef] [Scilit]
- Hussein, H.A.S. Study of Chemical and Physical Properties of Irradiated Guar Gum; Sudan Academy of Sciences: Khartoum, Sudan, 2012. [Google Scholar]
- Safronov, A.P.; Adamova, L.V.; Kurlyandskaya, G.V. Flory–Huggins parameters of guar gum, xanthan gum, agarose, and gellan gum in aqueous solutions. Polym. Sci. Ser. A 2019, 61, 29–38. [Google Scholar] [CrossRef] [Scilit]
- Li, J.S.; Huang, H.L.; Lin, J.Z.; Li, C.F.; Chen, Z.H.; Li, S. Application status of polysaccharide biopolymers in oilfields. Appl. Chem. Ind. 2023, 52, 1823–1829, 1835. [Google Scholar]
- Wang, S.; Tang, H.; Guo, J.; Wang, K. Effect of pH on the rheological properties of borate crosslinked hydroxypropyl guar gum hydrogel and hydroxypropyl guar gum. Carbohydr. Polym. 2016, 147, 455–463. [Google Scholar] [CrossRef] [Scilit]
- Chu, Y.; Chen, J.; Haso, F.; Gao, Y.; Szymanowski, J.E.S.; Burns, P.C.; Liu, T. Expanding the Schulze-Hardy Rule and the Hofmeister Series to Nanometer-Scaled Hydrophilic Macroions. Chem.-Eur. J. 2018, 24, 5479–5483. [Google Scholar] [CrossRef] [Scilit]
- Lyklema, J. Coagulation by Multivalent Counterions and the Schulze-Hardy Rule. J. Colloid Interface Sci. 2013, 392, 102–104. [Google Scholar] [CrossRef] [Scilit]

Disclaimer/Publisher’s Note: The statements, opinions and data contained in all publications are solely those of the individual author(s) and contributor(s) and not of MDPI and/or the editor(s). MDPI and/or the editor(s) disclaim responsibility for any injury to people or property resulting from any ideas, methods, instructions or products referred to in the content. |
© 2026 by the authors. Licensee MDPI, Basel, Switzerland. This article is an open access article distributed under the terms and conditions of the Creative Commons Attribution (CC BY) license.